inco: international scientific cooperation projects (1998...
TRANSCRIPT
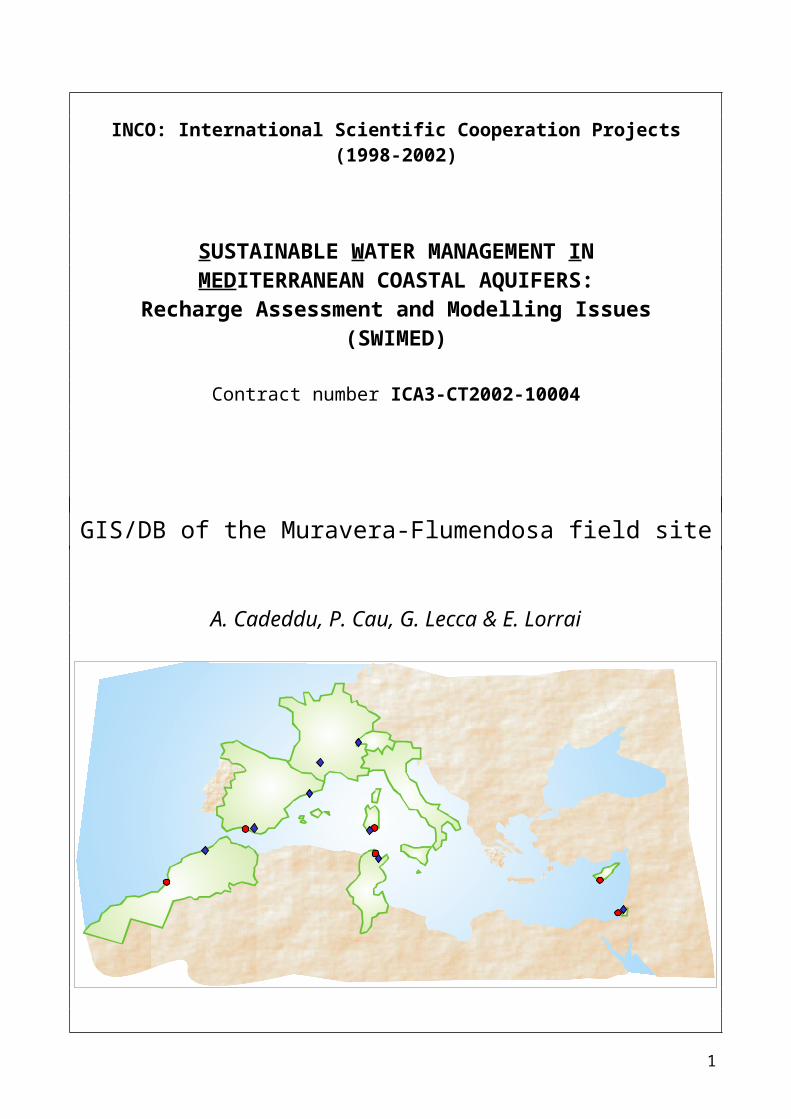
INCO: International Scientific Cooperation Projects (1998-2002)
SUSTAINABLE WATER MANAGEMENT INMEDITERRANEAN COASTAL AQUIFERS:
Recharge Assessment and Modelling Issues(SWIMED)
Contract number ICA3-CT2002-10004
GIS/DB of the Muravera-Flumendosa field site
A. Cadeddu, P. Cau, G. Lecca & E. Lorrai
July 2004
1
Table of contents
GIS/DB of the Muravera-Flumendosa field site________________________________1Table of contents______________________________________________________________2Introduction__________________________________________________________________3Database design and implementation_____________________________________________6
File system structure_________________________________________________________________6
GIS description______________________________________________________________12The General view___________________________________________________________________13The Model view____________________________________________________________________16The modeling area__________________________________________________________________27
The WEB-GIS demonstrative application_________________________________________29UMN Mapserver characteristics________________________________________________________29Cartographic Output_________________________________________________________________30Layers and data displayed____________________________________________________________30System modules and functionalities_____________________________________________________31
References__________________________________________________________________33
2
List of figuresFigure 1. Sketch of the file system structure.............................................................................7Figure 2. Time evolution of the piezometric levels (m a.s.l.) in wells 1 (blue) and 14 (pink)...........8Figure 3. Time evolution of electrical conductivity (S/cm) in wells 1 (blue) and 14 (pink).............8Figure 4. Mask showing information about well owners.............................................................9Figure 5. Mask showing the information contained in the database “Analysis_ESAF_well.mdb” .10Figure 6. Query to select the geological layers at a given depth: form to input the depth value
(above) and corresponding results (below).......................................................................11Figure 7. Mask showing the cartographic positioning of the wells using cadastral information.....11Figure 8. Location of the study area and digital elevation model (DEM) of the basin of the
Flumendosa River. The enlarged red box shows the coastal plain at the delta of the river with its 3 main centres: Muravera, San Vito e Villaputzu (13,000 inhabitants).............................12
Figure 9. General view of the catchment basin of the Flumendosa River...................................14Figure 10. Avarage rainfall [mm/year] map of the Flumendosa basin. The location of the rain
gages (blue point) is also shown.....................................................................................15Figure 11. Potential evapotranspiration of the Flumendosa basin calculated using the Heergraves
method with the SWAT model [Neitsch et al., 2001]......................................................15Figure 12. Real evapotranspiration of the Flumendosa basin calculated with the SWAT model
[Neitsch et al., 2001]......................................................................................................16Figure 13. The Model View of the Muravera coastal plain with the related hydrogeological themes.
....................................................................................................................................17Figure 14. Digital elevation model (DEM) of the Muravera coastal plain. The limit of the modelling
area (black line), the rivers (blue line) and the lagoons are also shown...............................17Figure 15. Main topographic features the Muravera coastal plain. The three main centres in the
zone are Muravera, Villaputzu and San Vito that together count about 13,000 inhabitants....18Figure 16. Soil map of the Muravera plain..............................................................................19Figure 17. CORINE land cover map of the Muravera plain......................................................20Figure 18. Hydro-geological map of the Muravera plain. Paleozoic outcrops corresponding to
northern and southern boundaries of the model domain are assumed impervious...............21Figure 19. Location of boreholes and depths of the aquifer bedrock.........................................22Figure 20. Contour lines of the depth of the aquifer bedrock on the basis of various geophysical
data (gravimetry, vertical electrical soundings, seismic profiles, and boreholes) [Balia et al., 2003]............................................................................................................................22
Figure 21. Reconstruction of the phreatic aquifer thickness on the modelling domain................23Figure 22. Reconstruction of the confining layer thickness on the modelling domain..................23Figure 23. Reconstruction of the deep aquifer thickness on the modelling domain...........24Figure 24. Piezometric contour lines (May, 1999) of the phreatic aquifer [Barrocu et al., 1999]. The
spline interpolation method is used..................................................................................25Figure 25. Piezometric contour lines (May, 1999) of the deep aquifer [Barrocu et al., 1999]. The
spline interpolation method is used..................................................................................25Figure 26. Electric conductivity contour lines (May, 1999) of the phreatic aquifer [Barrocu et al.,
1999]. The spline interpolation method is used.................................................................26Figure 27. Electric conductivity contour lines (May, 1999) of the confined aquifer [Barrocu et al.,
1999]. The spline interpolation method is used.................................................................27Figure 28. The triangulation of the modelling domain incorporating main territorial features.
Denser grid zones corresponds to well fields....................................................................28Figure 29. Server-side WEB-GIS architecture including the GIS/Database and the relational
database management system (RDBMS) modules...........................................................29Figure 30. UMN Mapserver web interface showing a zoom on the south eastern coast of the
Sardinia island near the mouth of the Flumendosa river. The three main cities (Muravera,
3
Villaputzu and San Vito), the well locations and the Flumendosa river network are also shown.....................................................................................................................................32
4
IntroductionGIS/DB of the Muravera-Flumendosa field site is a technical report of the project Sustainable Water Management In Mediterranean Coastal Aquifers: Recharge Assessment and Modelling Issues (SWIMED) in the framework of the INCO II (1998-2002) initiative of the European Commission. This initiative was meant in order to promote collaborative research of Mediterranean partner countries in the context of transboundary economic, environmental and socio-political problems.
Modern management of groundwater resources relies on advanced software tools like numerical models, geographical information systems, and georeferenced databases representing the characteristics and the dynamics of the natural groundwater system. A groundwater system is basically defined by hydrogeological data (aquifer physical parameters, geological layers and boundaries) and observations of the historical behaviour of the groundwater (groundwater levels, concentrations of solutes, etc.). In regional groundwater management problems this information has also to be related with land use, surface water, soil characteristics and environmental issues. The effort to perform comprehensive analysis of management scenarios will be substantially reduced by an easily accessible database, a convenient interface between the database and groundwater models, visualisation and analysis utilities for model inputs and results. Geographical information systems (GIS) can provide some of these tools. The integration between the groundwater model CODESA 3D [Lecca, 2000] and a GIS system has been achieved defining in the GIS environment initial and boundary conditions, the hydrological parameterization, as well as storing and visualizing the model outputs [Cau & Lecca, 2002, Cau & Manca, 2002]. The GIS potentiality grants to overlay simulated pressure or concentration fields with other geographical features, in a way to infer new information from measured and simulated data, and to compare alternative simulated scenarios.
Much recent attention has focused on developing GIS functionality in the Internet, Worldwide Web, and private intranets, which is termed WebGIS.WebGIS holds the potential to make distributed geographic information (DGI) available to a very large worldwide audience. Internet users will be able to access GIS applications from their browsers without purchasing proprietary GIS software. The challenge of WebGIS lies in creating software systems that are platform independent and run on open TCP/IP-based networks, that is on any computer capable of connecting to the Internet (or any TCP/IP-based network) and running a Web browser. The capability of WebGIS renders it very attractive to build applications that share basic information, file formats, and numerical models within the SWIMED project community, strengthening partner collaboration and facilitating continuous exchanges.
This report is intended to present the design and implementation issues of the database (DB) and the geographical information system (GIS) of the Muravera-Flumendosa field site. The WebGIS demonstrative application will also described [Cadeddu, 2003]. The alphanumeric DB along with the associated GIS will form the knowledge basis for the development of the saltwater intrusion modeling study in the selected area, in the framework of a sustainable water resources management in coastal aquifers.
5
Database design and implementationVarious data [Barrocu et al., 1999] concerning the Muravera-Flumendosa field site and produced by different subjects have been provided to CRS4 by the local agency for water resources management (Ente Autonomo del Flumendosa, EAF1) and analyzed, elaborated and catalogued in order to build an organized file system and thematic databases, described in the following paragraphs.
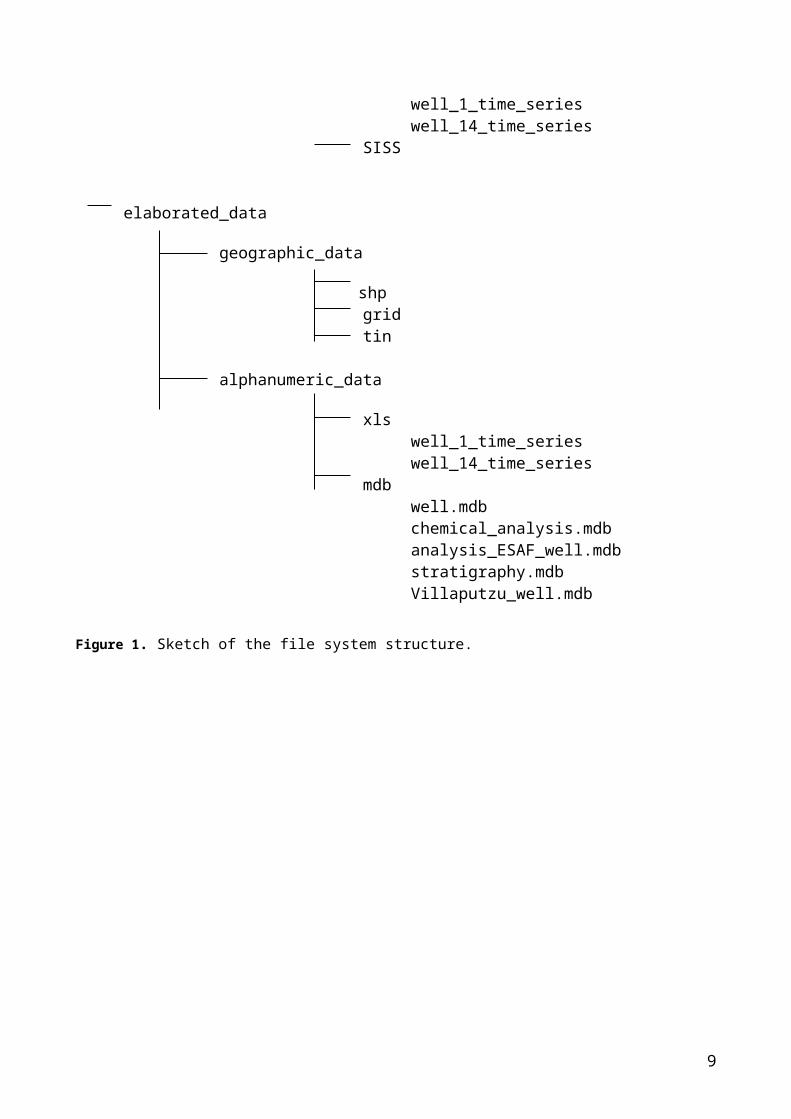
File system structureThe file system structure (Figure 1) is organized in two main directories: “original_data” and “elaborated_data”. In turn, these directories are organized in two subdirectories: “geographic_data” and “alphanumeric_data”. A description of their contents is given below:
1. Original_data directory contains data in their original format. Geographic_data subdirectory contains maps of the zone at different scales
(1:10000, 1:2000) and the location of the monitoring wells. This data are classified according to the map format (dxf, dwg) in two subdirectories. This information is used to derive other GIS layers and the three-dimensional delineation of the zone to be modeled. All the further elaborations are stored under the “elaborated_data/geographic_data” subdirectory.
Alphanumeric_data subdirectory contains a rather heterogeneous set of information of well survey and monitoring. Among them there are data about 123 wells monitored by the Department of Territorial Engineering (DIT) of the University of Cagliari collected in separated Excel files; chemical analysis of four wells (12, 15, 2030, 2032) and piezometric level time series of two wells (1, 14) reported in Word files; and the SISS database (Studio dell’Idrologia Superficiale della Sardegna, EAF, 1996) comprising hydrometeorological data time series (thermometry, pluviometry, river flow rates, etc.) during the 1922-1992 time period.
2. Elaborated_data directory contains the results of the processing of original data. Geographic_data subdirectory is going to be filled during the entire life cycle of
the project. It contains a basic set of geographic layers, such as cadastral map, river network etc., to be used either as input for further processing such as TIN (Triangulated Irregular Network) or DEM (Digital Elevetion Model) layers or as a backdrop for the visualization of well hydrochemical data.
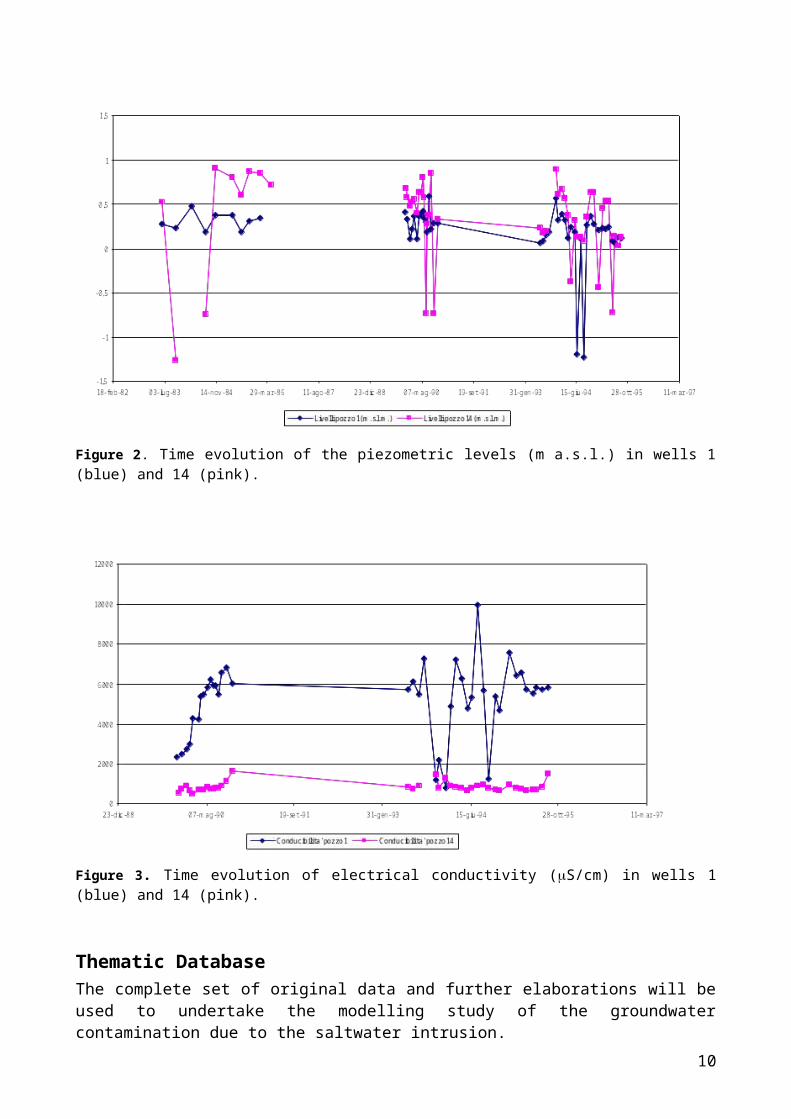
Alphanumeric_data contains tabular data. Xls subdirectory is characterized by Excel files. At the moment it contains just two files (for the wells number 1 and 14) converted from the original Word format. Figure 2 and 3 show the time evolution (1983-1995) of piezometric levels and electric conductivity values in these two wells. The next paragraph describes the databases contained in the mdb subdirectory.
1 Formerly a project partner but not included in the final partnership due to administrative problems.
6
working directory
original_data
geographic_data
dxf10000_map
dwg2000_mapmonitoring_well_location
alphanumeric_data
xlswell files
docwell_12_chemical_analysiswell_15_chemical_analysiswell_2030_chemical_analysiswell_2032_chemical_analysiswell_1_time_serieswell_14_time_series
SISS
elaborated_data
geographic_data
shpgridtin
alphanumeric_data
xlswell_1_time_serieswell_14_time_series
mdbwell.mdbchemical_analysis.mdbanalysis_ESAF_well.mdbstratigraphy.mdbVillaputzu_well.mdb
Figure 1. Sketch of the file system structure.
7
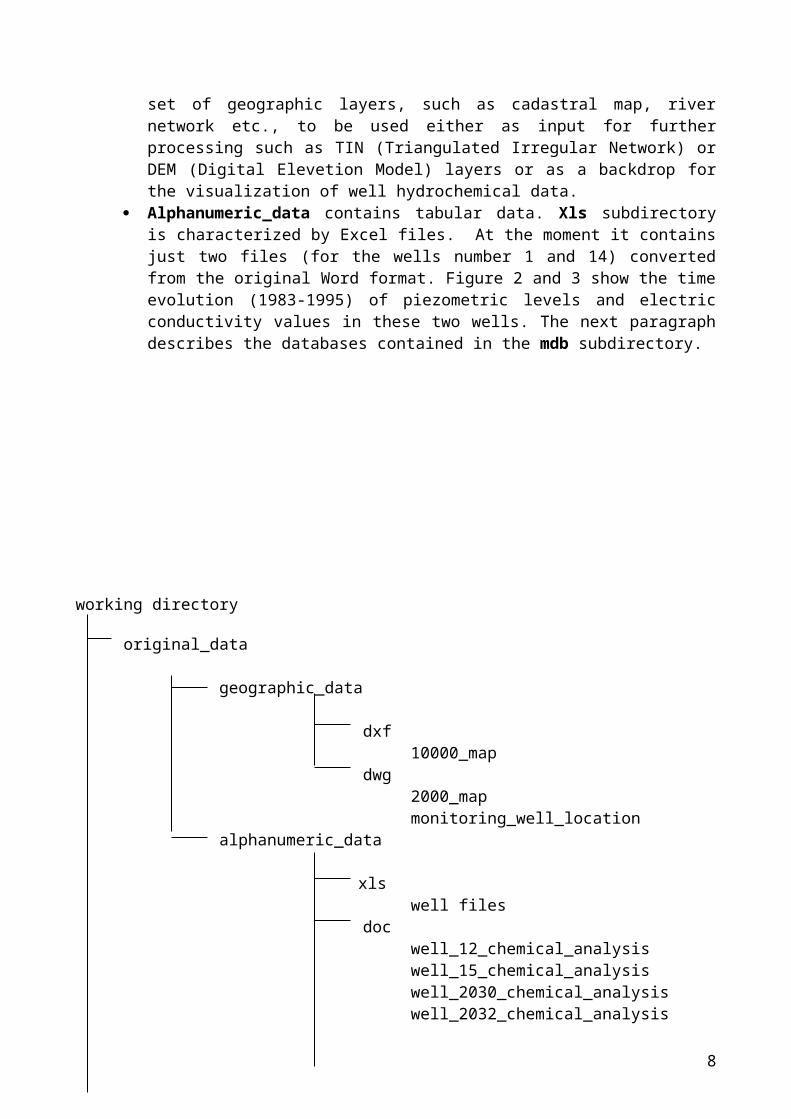
Figure 2. Time evolution of the piezometric levels (m a.s.l.) in wells 1 (blue) and 14 (pink).
Figure 3. Time evolution of electrical conductivity (S/cm) in wells 1 (blue) and 14 (pink).
Thematic DatabaseThe complete set of original data and further elaborations will be used to undertake the modelling study of the groundwater contamination due to the saltwater intrusion.
The database construction has three main objectives: to implement and to apply a hydrogeological model of saltwater intrusion to the
Muravera-Flumendosa field site, to validate the modelling procedure using control data and, more generally,
8
to use the GIS and the modeling procedure as an integrated tool to study saltwater intrusion in coastal aquifers and to support the definition of optimal strategies for managing water resources.
Prior to building the databases, the work undertaken has consisted in an integrated evaluation of diverse types of data in order to assess the quality and quantity of their information.The alphanumeric databases, created with Microsoft Access, are implemented according to relational principles. The database is subdivided into 5 files, namely: well.mdb, chemical_analysis.mdb, analysis_ESAF_well.mdb, stratigraphy.mdb and Villaputzu_well.mdb. These files are described below.
Well.mdbIt has been derived by the union of 123 separated Excel files (well files, in the file system scheme), after having checked possible compiling mistakes and validated all the values of the different fields.The database has been created maintaining separated in different tables the “static” and the “dynamic” information. The list of available field is given below:
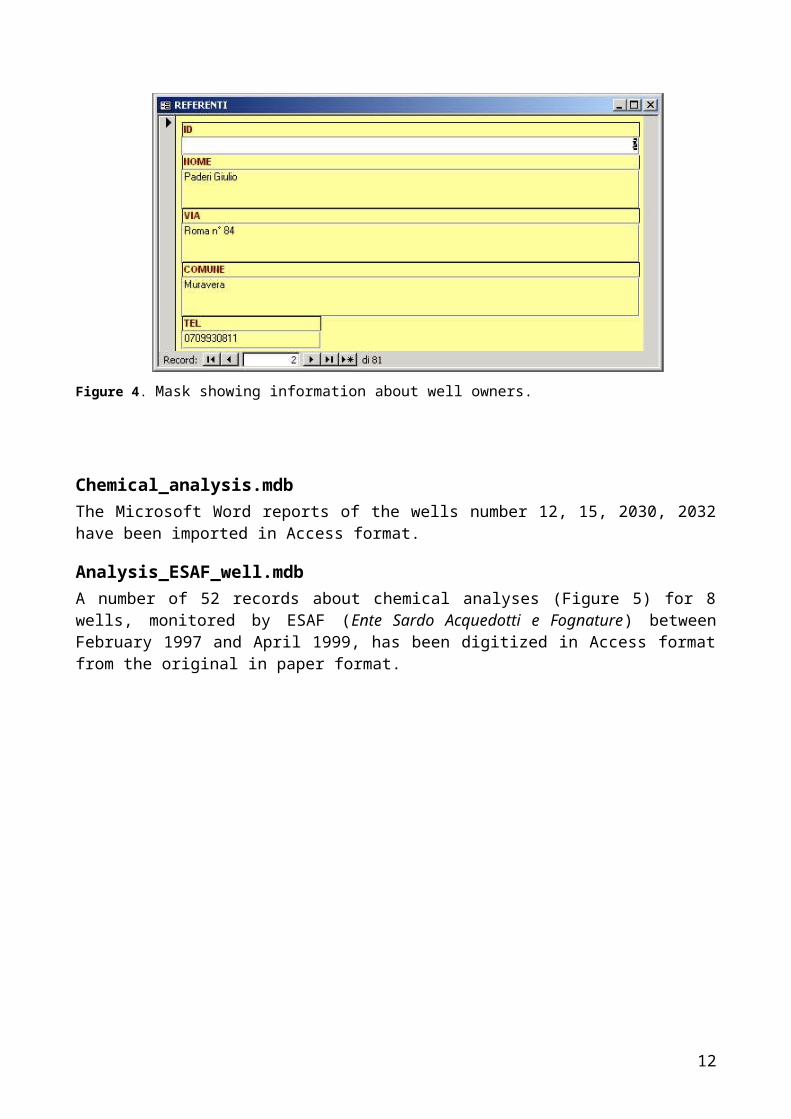
NOTES: notes about the measures; USE_TYPE: list of the different possible uses of the wells; WELL_OWNER: link between wells and their owners or users (Figure 4); WELL: “static” data about the wells, such as localization coordinates,
year of construction, administrative boundary, drilling methods, relative aquifer; PUMPING_TEST: data about the pumping test characteristics; MEASURES: “dynamic” data (piezometric levels and chemical analysis
varying in time); USE: usages of the well during different periods of time.
Figure 4. Mask showing information about well owners.
Chemical_analysis.mdb
9
The Microsoft Word reports of the wells number 12, 15, 2030, 2032 have been imported in Access format.
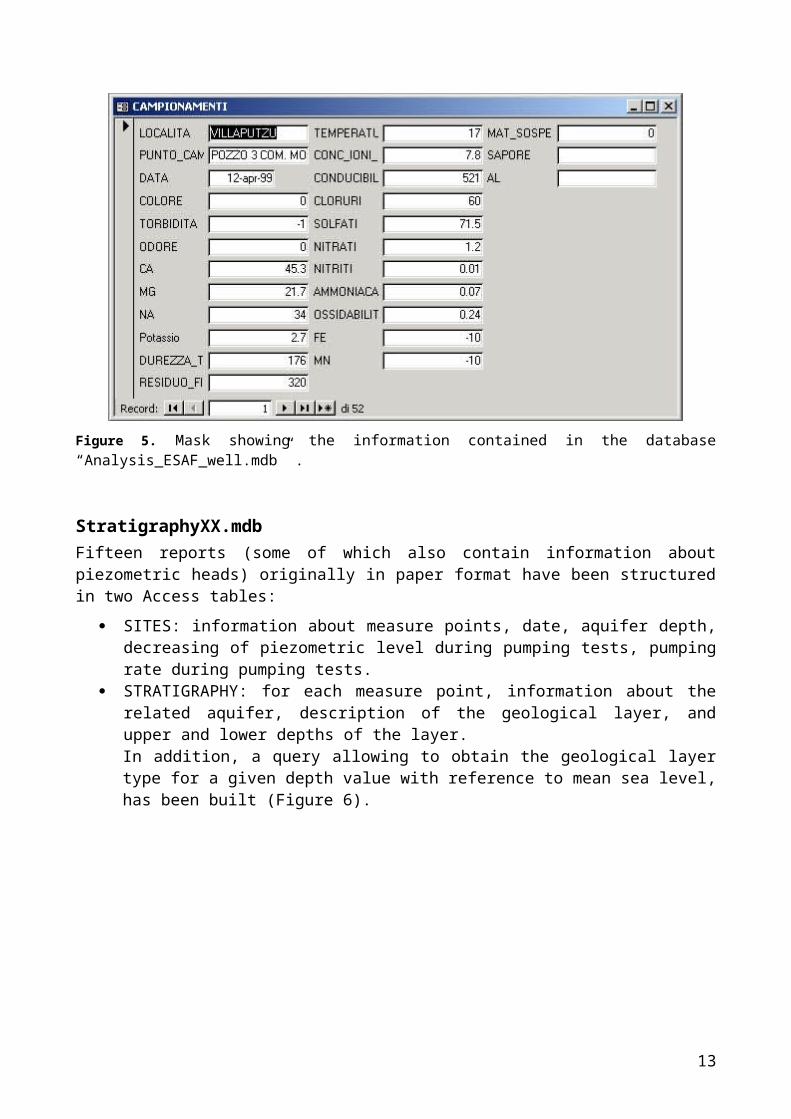
Analysis_ESAF_well.mdbA number of 52 records about chemical analyses (Figure 5) for 8 wells, monitored by ESAF (Ente Sardo Acquedotti e Fognature) between February 1997 and April 1999, has been digitized in Access format from the original in paper format.
Figure 5. Mask showing the information contained in the database “Analysis_ESAF_well.mdb” .
StratigraphyXX.mdbFifteen reports (some of which also contain information about piezometric heads) originally in paper format have been structured in two Access tables:
SITES: information about measure points, date, aquifer depth, decreasing of piezometric level during pumping tests, pumping rate during pumping tests.
STRATIGRAPHY: for each measure point, information about the related aquifer, description of the geological layer, and upper and lower depths of the layer.In addition, a query allowing to obtain the geological layer type for a given depth value with reference to mean sea level, has been built (Figure 6).
10
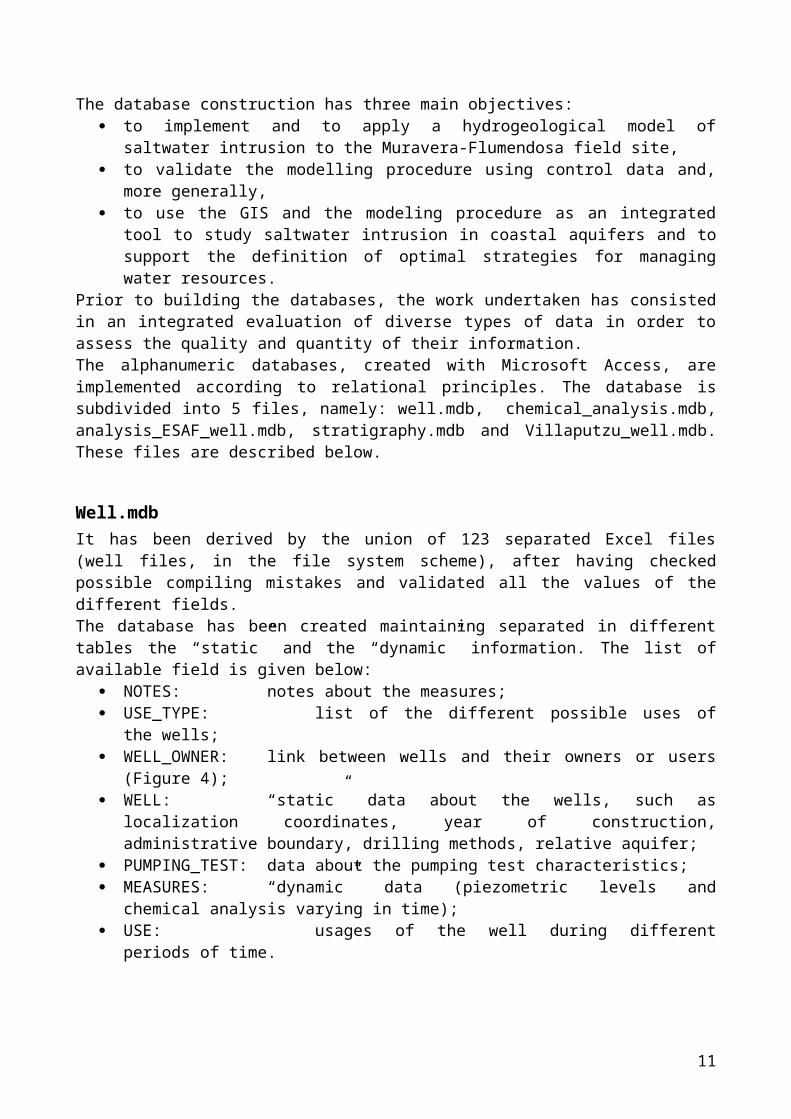
Figure 6. Query to select the geological layers at a given depth: form to input the depth value (above) and corresponding results (below).
Villaputzu_well.mdbThis file contains well information (well owners, location and usage) derived from a census archive (in paper format) and collected by the local government for administrative purposes. Of the three districts covering the Muravera plain, Villaputzu has been chosen in order to evaluate the actual content of the archive. While the well files provide an exhaustive list of the owners, the extraction of other information (such as piezometric levels, pumping rates or type of usage) from this source needs to be addressed with extreme caution. Another substantial problem with the well census files is the lack of accurate positioning information on the wells in terms of geographic coordinates (Figure 7).
Figure 7. Mask showing the cartographic positioning of the wells using cadastral information.
11
GIS descriptionThe GIS software used for the Muravera-Flumendosa study site (Figure 8) are ArcView GIS 3.1 and ArcInfo. The former has been utilized to visualize, explore, query and analyze data geographically. The latter has been used mainly to build and correct, when necessary, the topology of the geographical data. The spatial analyst, 3D analyst and geo-processing modules have been also used to build derived maps and overlay and intersect themes.
Figure 8. Location of the study area and digital elevation model (DEM) of the basin of the Flumendosa River. The enlarged red box shows the coastal plain at the delta of the river with its 3 main centres: Muravera, San Vito e Villaputzu (13,000 inhabitants).
A large part of the work was devoted to collect different data from different sources and to correct the formats to be GIS standard compliant. Information, sometimes incomplete or with errors, needed work to be implemented within the GIS environment. Each information has been checked to evaluate the correspondence of the database contents to the field measures they represent. The GIS application has been designed to be directly linked to the set up of the groundwater model of the Muravera-Flumendosa site.
The project has been organized in two views: General view and Model view. The general view contains the themes of the catchment basin of the Flumendosa River of general interest (Figure 9). In addition it contains those themes necessary to set up the boundary conditions of the modelling area, i.e. the coastal plain of the Flumendosa River nearby the touristic centre of Muravera. The model view contains the territorial themes related directly to the groundwater model.
12
###
## #
###
#
##
#
#
#
#
# #
##
##
#
#
#
##
#
#
#
#
##
#
#
#
#
# ##
#
#
#
#
#
##
#
#
###
#
#
##
###
#
###
#
###
# ##
#
# ##
#
#
#
#
#
#
#
##
#
#
#
##
#
#
#
#
#
## #
#
#
##
##
#
#
#
#
#
#
#
#
#
#
#
##
#
##
#
#
##
#
0 4 Kilometers
N
Muravera
San Vito
Villaputzu
The geographical information that have been collected are:
Digital Elevation Model, DEM (Figure 8);
Location of rain gages;
Location of climatic gages;
Topography information (Carta Tecnica Regionale, CTR);
Superficial hydrography (rivers, lakes, lagoons, etc.);
Location of monitoring wells of the phreatic aquifer;
Location of monitoring wells of the confined aquifer;
Location of drillings;
Soil map;
Land cover map;
Hydrogeological map;
Piezometric contour map of the deep aquifer;
Piezometric contour map of the phreatic aquifer;
2D mesh of the modelling area.
The General view
The Flumendosa basinThe Flumendosa basin lies on the south-eastern part of the Sardinia island (Italy), and is one of the largest basin of the island (1876 km2). The main river is the Flumendosa, being the second largest river of Sardinia (Figure 8). Nowadays the stream flow is totally controlled by three dams, constructed in the upper mountain basins: the Bau Muggerru, the Medio Flumendosa, and the Mulargia lakes. Therefore the natural regime of the river has been altered. This artificial regime of constant discharge has a great impact on the lateral recharge of the groundwater basin in the coastal part of the plain.
13
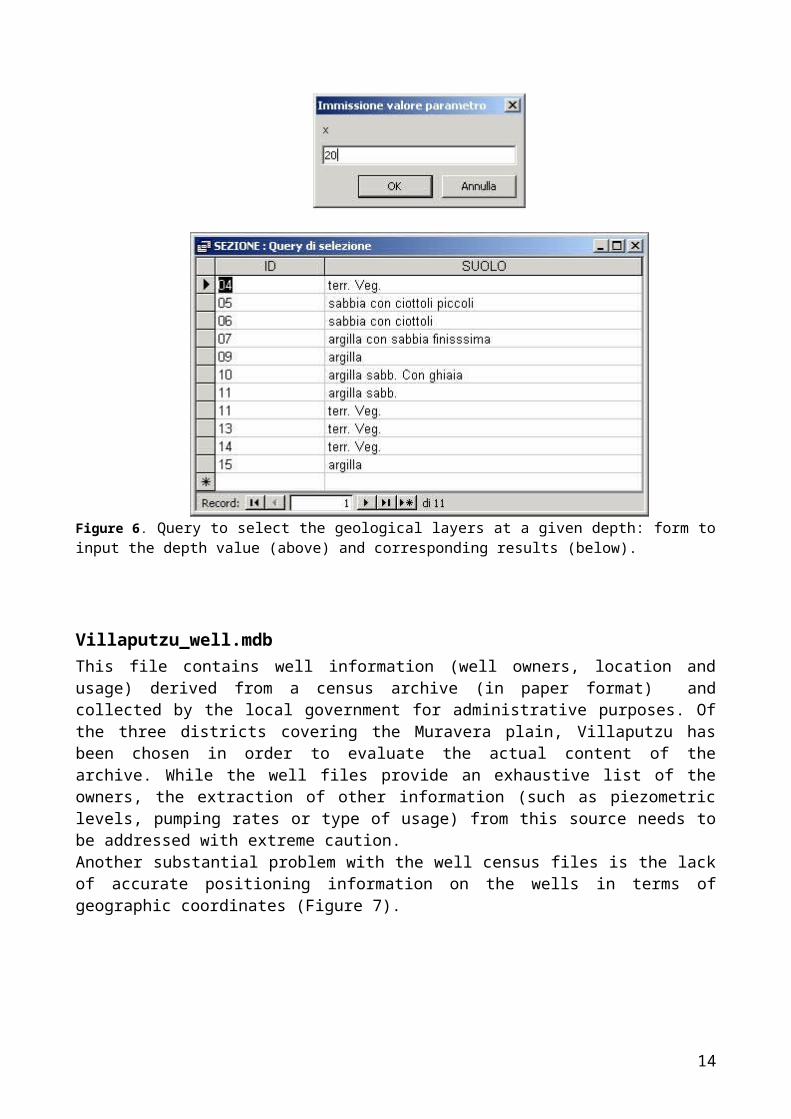
Figure 9. General view of the catchment basin of the Flumendosa River.
Hydrological regimeLying in the Tyrrhenian Sea the Muravera plain is characterized by long hot dry breezy summers and short mild rainy winters, except at high altitudes. Average annual temperatures range from 18 °C along the coastal belt to 14 °C inland. Precipitations (Figure 10) are largely confined to the winter months and distribution is somewhat irregular, with as much as 1165 mm/year in the highest areas and 618 mm/year along the coast [EAF, 1996]. The rainfall regime is characterized by a peak rainfall in December, and a minimum in July, with an average value of about 860 mm/year. The prevailing wind is north-westerly.
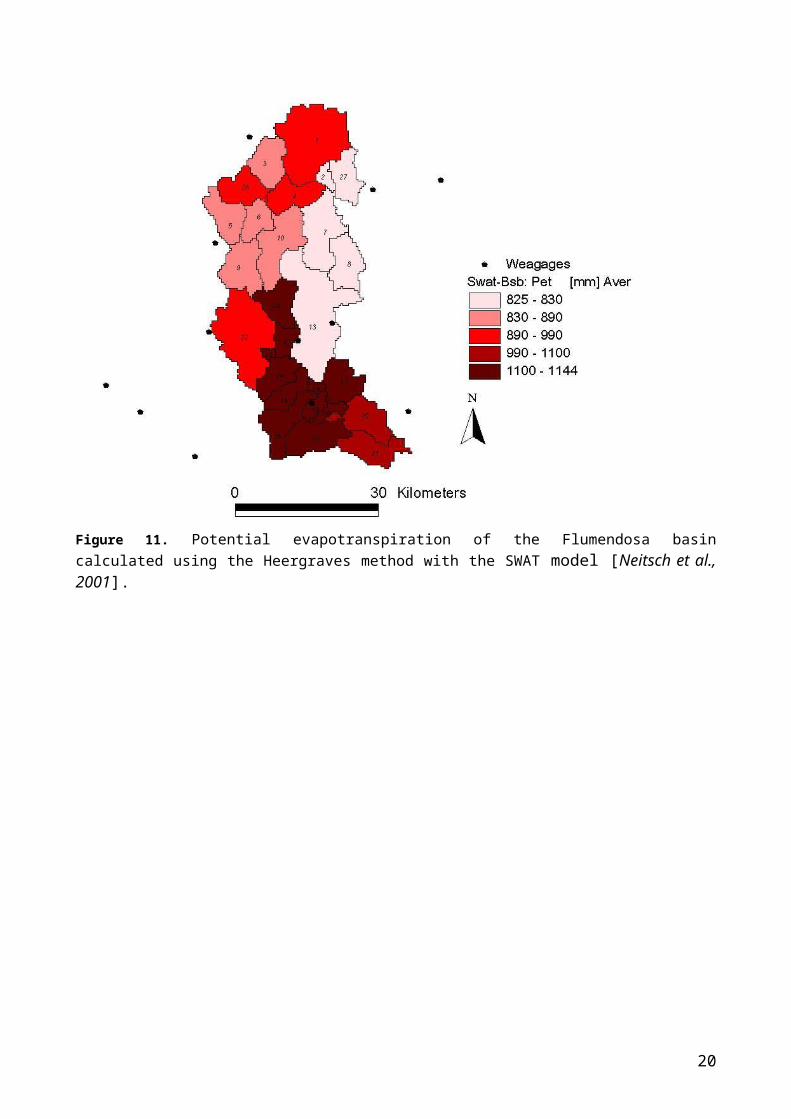
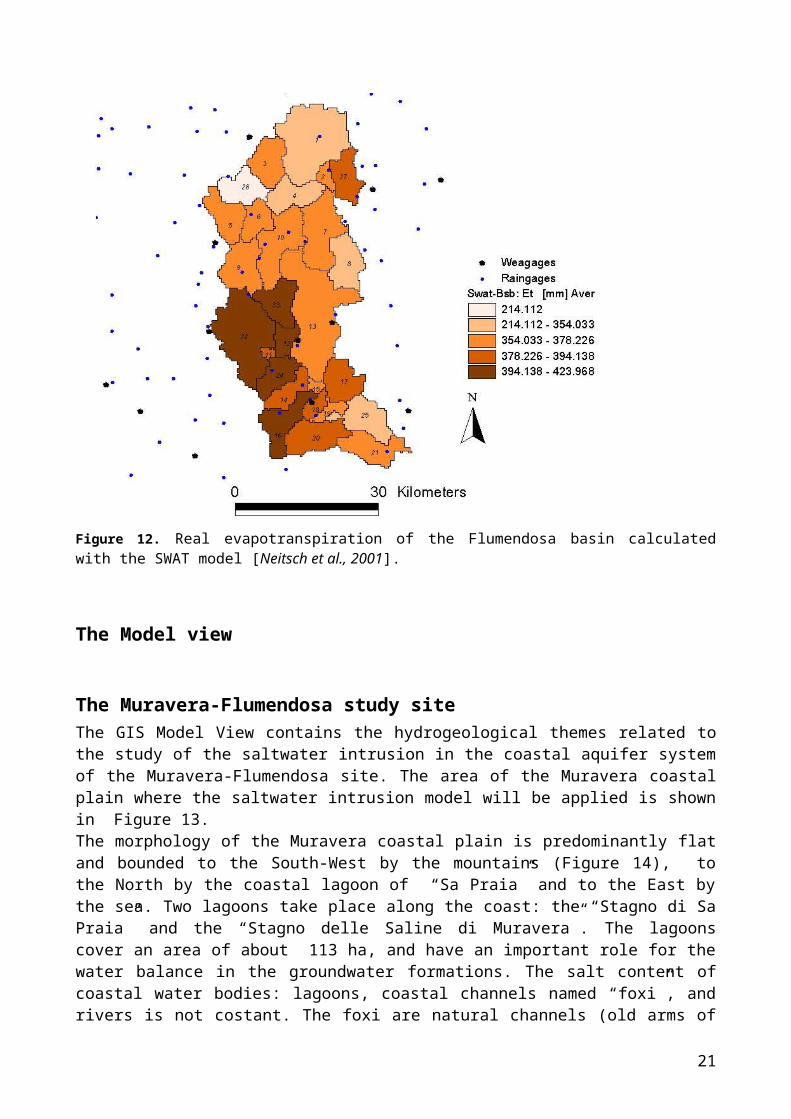
The evapotranspiration is the combination of two physical processes: the evaporation and the transpiration. In condition of infinite water availability, the evapotranspiration (ET) equals the potential evapotranspiration (PET), being a function of the available energy only. Usually the water availability is not infinite and the actual evapotranspiration is a fraction of the potential one but depends on the water availability. Alternative formulas (Penman-Monteith, Priestly-Taylor,Hargreaves, etc.) exist which depend on temperature, relative humidity, solar radiation, and wind speed to estimate the potential evapotranspiration. The Hargreaves method (Figures 11 and 12) was used here [Cau et al., 2003].
14
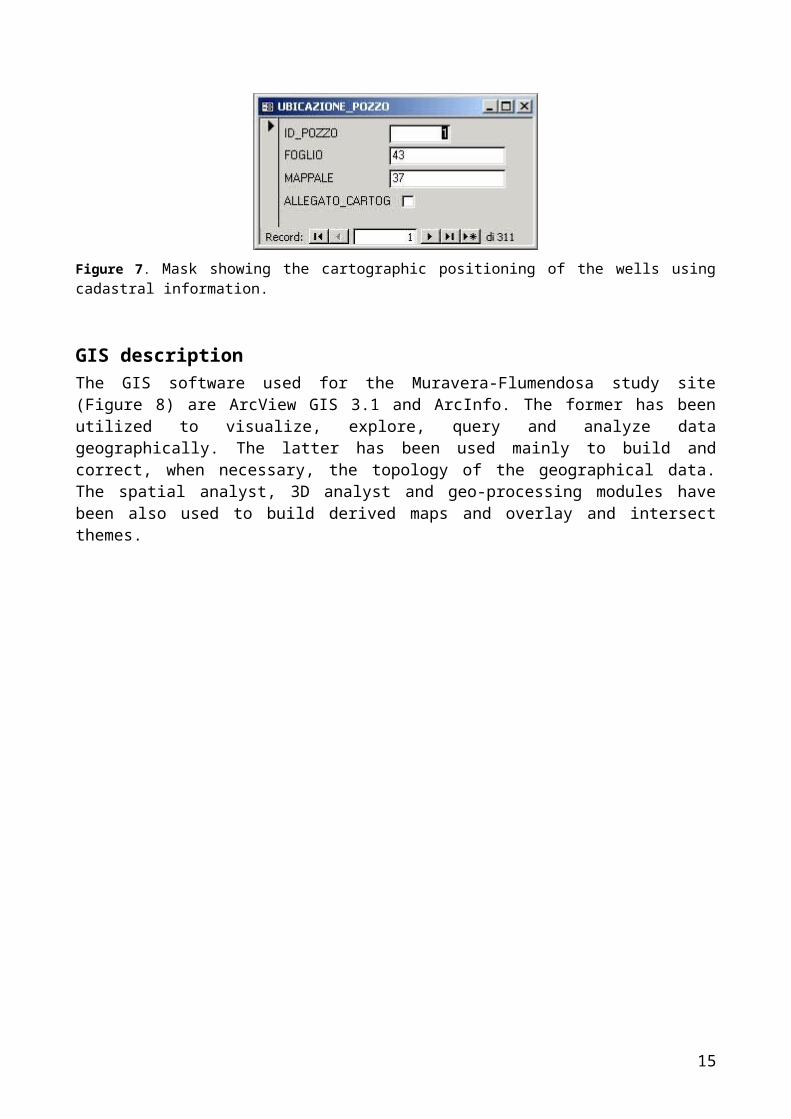
Figure 10. Avarage rainfall [mm/year] map of the Flumendosa basin. The location of the rain gages (blue point) is also shown.
Figure 11. Potential evapotranspiration of the Flumendosa basin calculated using the Heergraves method with the SWAT model [Neitsch et al., 2001].
15
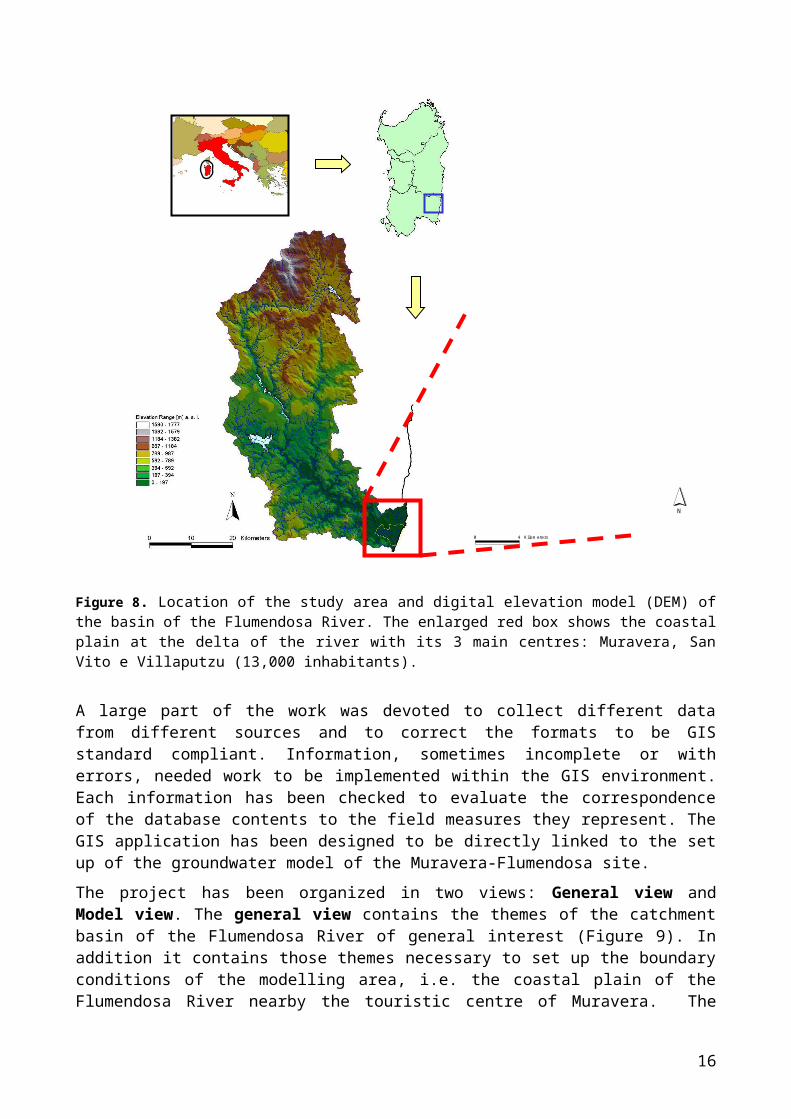
Figure 12. Real evapotranspiration of the Flumendosa basin calculated with the SWAT model [Neitsch et al., 2001].
The Model view
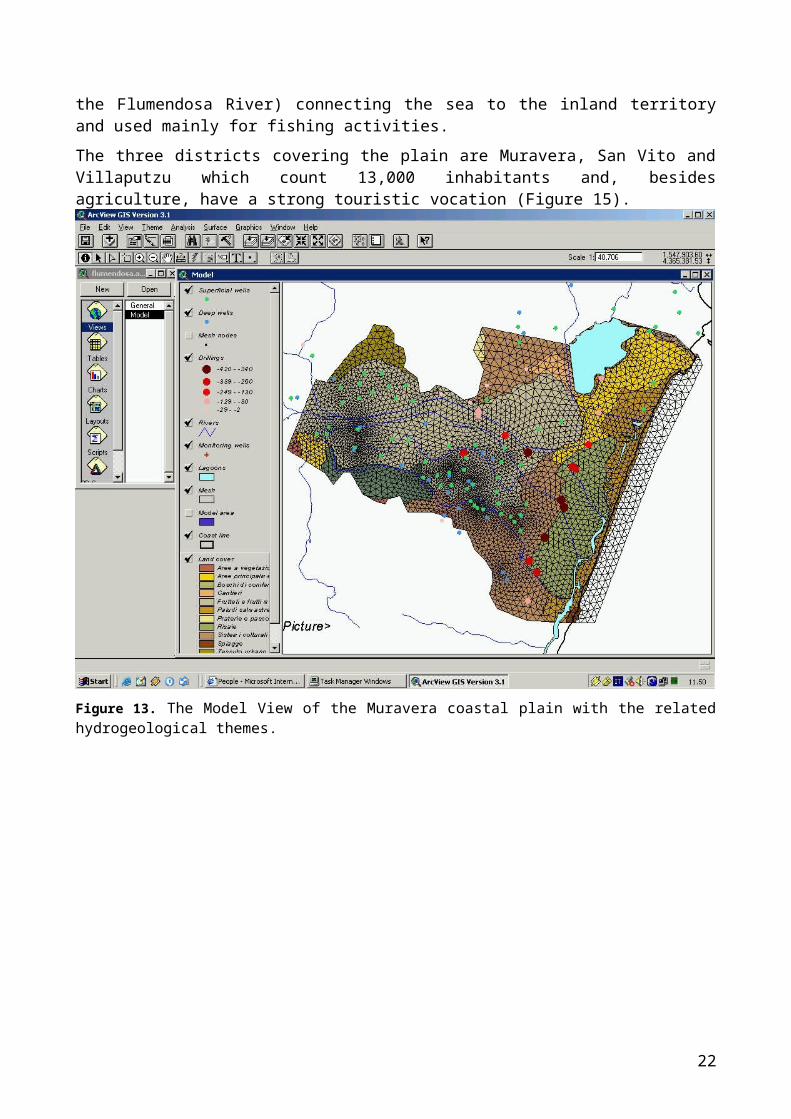
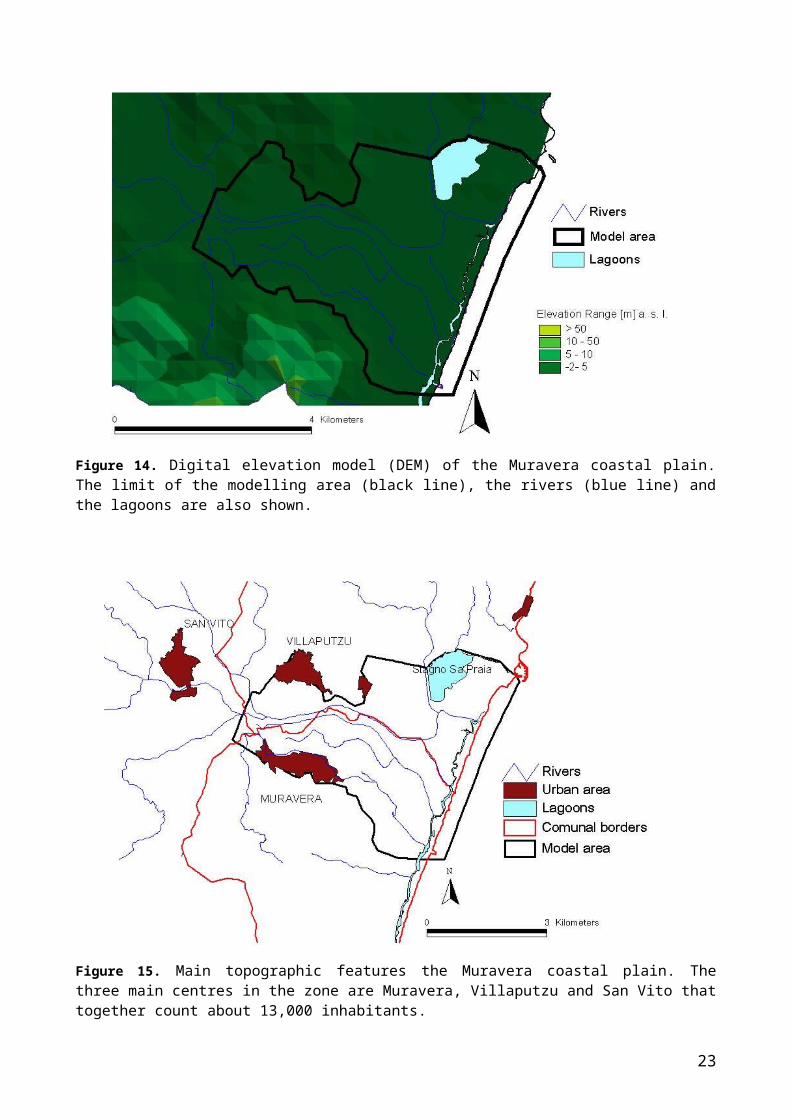
The Muravera-Flumendosa study siteThe GIS Model View contains the hydrogeological themes related to the study of the saltwater intrusion in the coastal aquifer system of the Muravera-Flumendosa site. The area of the Muravera coastal plain where the saltwater intrusion model will be applied is shown in Figure 13.The morphology of the Muravera coastal plain is predominantly flat and bounded to the South-West by the mountains (Figure 14), to the North by the coastal lagoon of “Sa Praia” and to the East by the sea. Two lagoons take place along the coast: the “Stagno di Sa Praia” and the “Stagno delle Saline di Muravera”. The lagoons cover an area of about 113 ha, and have an important role for the water balance in the groundwater formations. The salt content of coastal water bodies: lagoons, coastal channels named “foxi”, and rivers is not costant. The foxi are natural channels (old arms of the Flumendosa River) connecting the sea to the inland territory and used mainly for fishing activities.
The three districts covering the plain are Muravera, San Vito and Villaputzu which count 13,000 inhabitants and, besides agriculture, have a strong touristic vocation (Figure 15).
16
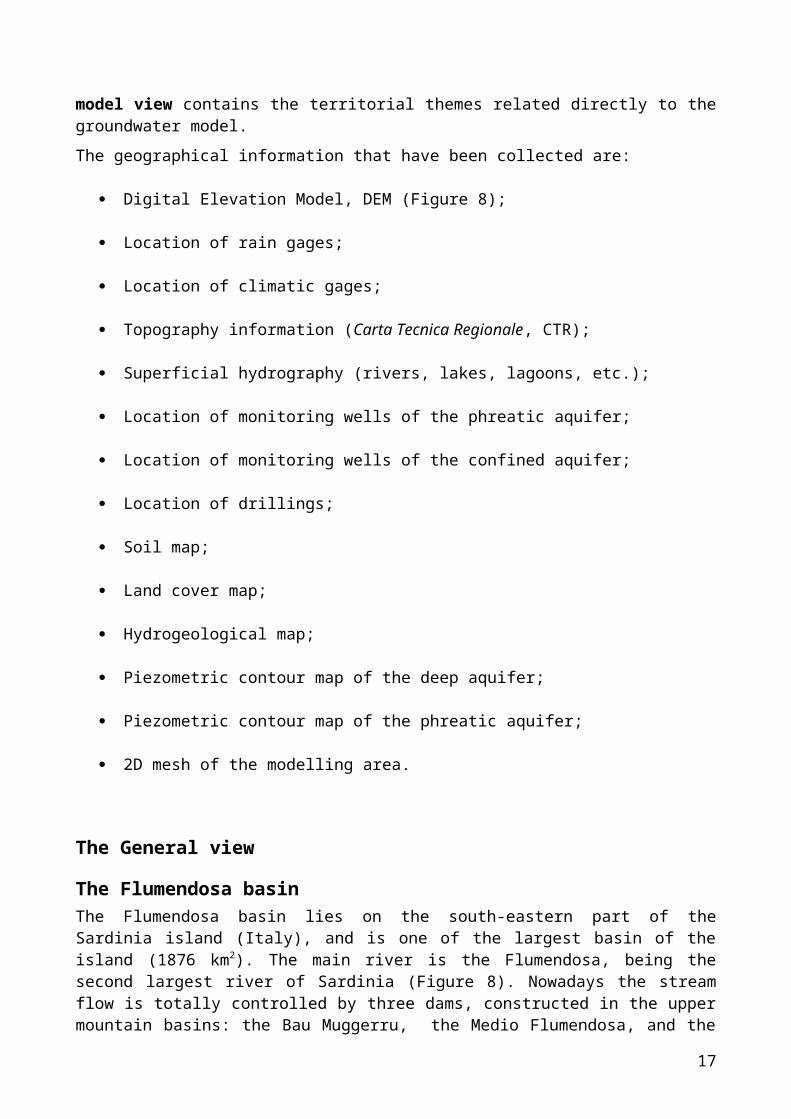
Figure 13. The Model View of the Muravera coastal plain with the related hydrogeological themes.
Figure 14. Digital elevation model (DEM) of the Muravera coastal plain. The limit of the modelling area (black line), the rivers (blue line) and the lagoons are also shown.
17
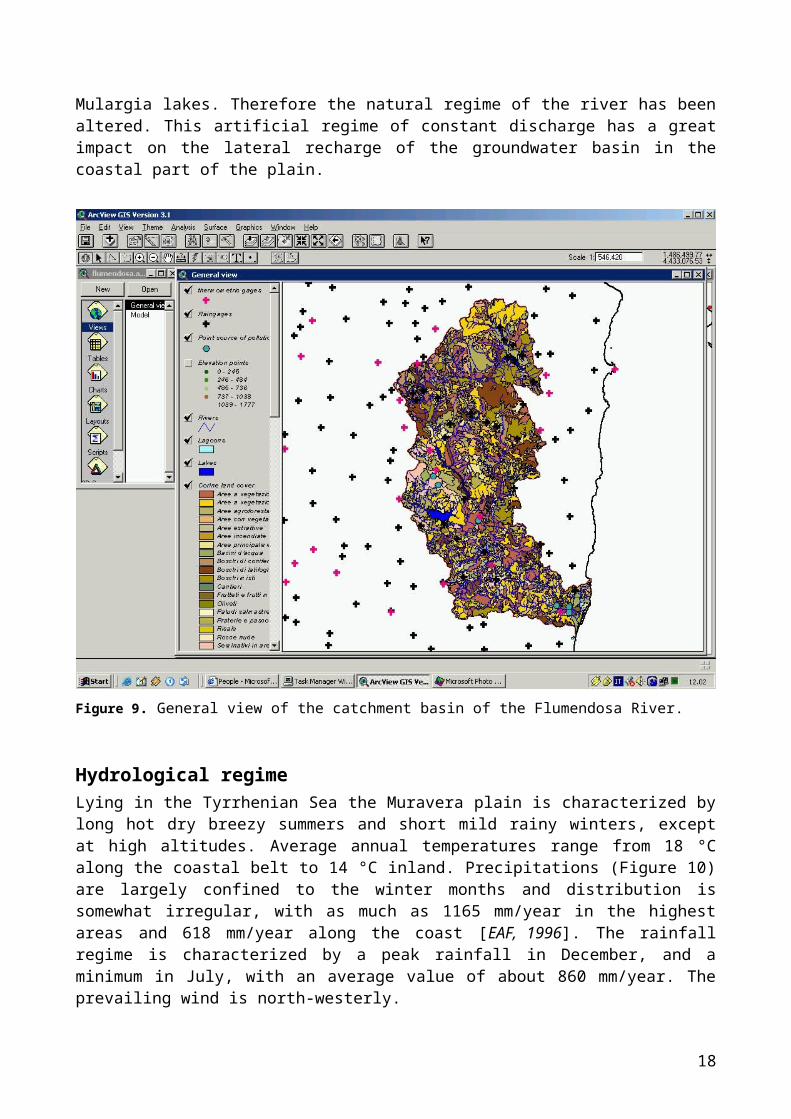
Figure 15. Main topographic features the Muravera coastal plain. The three main centres in the zone are Muravera, Villaputzu and San Vito that together count about 13,000 inhabitants.
18

Soil mapHydrological behavior of soil is related to a number of soil properties, being the physical characteristic essential to describe how rainfall is transformed in the different components of the water cycle (run off, percolation, etc.). To obtain information about the soil properties of the Muravera plain a 1:250 000 soil vector map was used (Figure 16). Each cartographic unit of the map is associated with one or two delineations corresponding to subgroups of USDA soil taxonomy [USDA & NRCS Soil Survey Division, 1994]. For the characterization of the geo-pedologic facies we referred also to the Soil Map of Sardinia [Aru et al., 1991] and to the Land Classification for Irrigation of Sardinia [Arangino et al., 1986]. Each cartographic unit of the soil vector map has been therefore described and classified according to the USDA and FAO guidelines. The modeling area is characterized by the following formations: schist rock and conglomeratic, eolic and palustric alluvia.
Figure 16. Soil map of the Muravera plain.
Land cover mapLand use can significantly affect the water cycle. As rain falls, canopy interception reduces the erosive energy of droplets and traps a portion of the rainfall within the canopy. The influence the land use exerts on these processes is a function of the density of plant cover and the morphology of the plant species. In this study we used the CORINE Land Cover 1:100.000 vector map (www.centrointerregionale.it). The CORINE Land Cover consists of a geographical database describing vegetation and land use in 44 classes, grouped in a three nomenclature levels. It covers the entire spectrum of Europe and gives information on the status and the changes of the environment.
19
The Muravera plain used to be given over to market gardening, fruit growing, and rice fields (Figure 17), but in recent decades extensive tracts of the coastal plain have been abandoned by farmers because of increasing groundwater and soil salinization.
Figure 17. CORINE land cover map of the Muravera plain.
20
Hydrogeology mapThis map is a 1:250000 vector map which contains information on the hydro-geological formation of the groundwater basin. The geology of the Muravera plain and surrounding region is characterized, from button to top, by a Paleozoic complex outcropping at the edges of the plain, and Pleistocene and Holocene alluvia up to a few hundreds of meters thick, overlying the Paleozoic bedrock in the plain. Apart from the water contained in the fractured Paleozoic rocks from which a few small ephemeral springs emerge during the cooler months, groundwater aquifers occur primarily in the alluvial deposits. Figure 18 shows the hydro-geological map of the Muravera-Flumendosa coastal plain and the limits of the modeling domain. According to the conceptual model, the Paleozoic outcrops corresponding to northern and southern boundaries of the model domain are assumed impervious.
Figure 18. Hydro-geological map of the Muravera plain. Paleozoic outcrops corresponding to northern and southern boundaries of the model domain are assumed impervious.
The aquifer systemTwo aquifers have been identified in the plain: a shallow phreatic aquifer and a deeper confined/semi-confined aquifer, separated from the former by a clayey layer, which ranges from a few meters to several tens of meters thickness [Ardau et al., 2000]. These two productive units are embedded in the quaternary alluvia formations released by the main rivers (Figure 18). The shallow phreatic aquifer (few tenths of meters) is separated from the confined/semi-confined aquifer (few hundreds of meters) by a presumably continuous clayey aquitard whose presence has been found in many of the stratigraphic sequences analysed.
GeometryThe elevation maps of the different hydro-geological strata have been interpolated using the kriging interpolation method on the basis of various geophysical data, gravimetry, vertical electrical soundings, seismic profiles, and boreholes. The locations of the
21
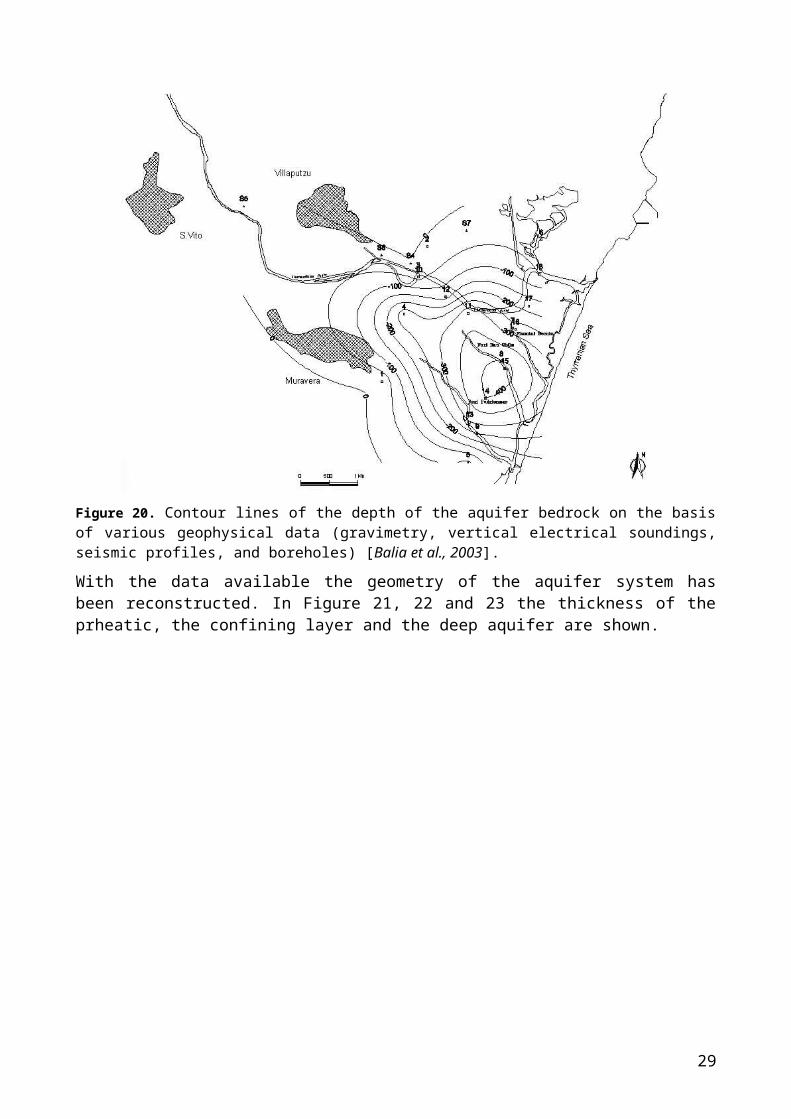
boreholes, the depth of the confined aquifer, are shown in Figure 19. In Figure 20 the interpolated map of the depth of the aquifer bedrock [Balia et al., 2003] is represented. In the centre of the plain, near the coast, the sedimentary basin has a depth greater than 400 m.
Figure 19. Location of boreholes and depths of the aquifer bedrock.
Figure 20. Contour lines of the depth of the aquifer bedrock on the basis of various geophysical data (gravimetry, vertical electrical soundings, seismic profiles, and boreholes) [Balia et al., 2003].
22
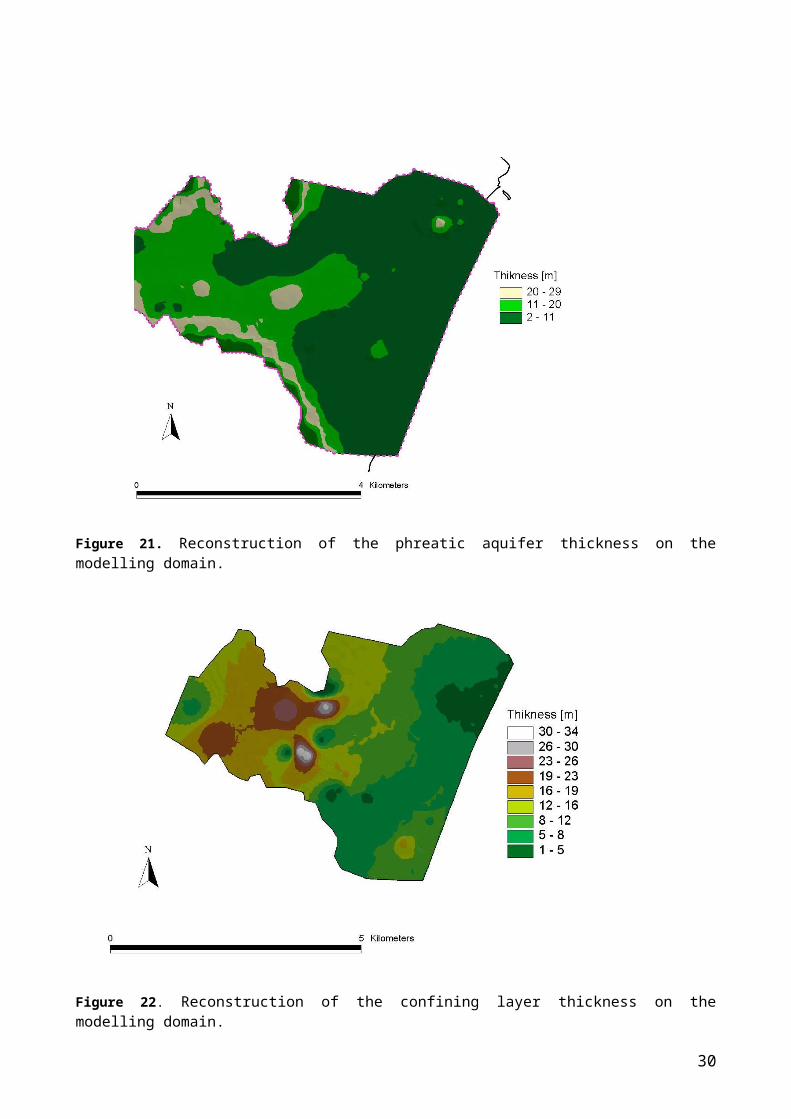
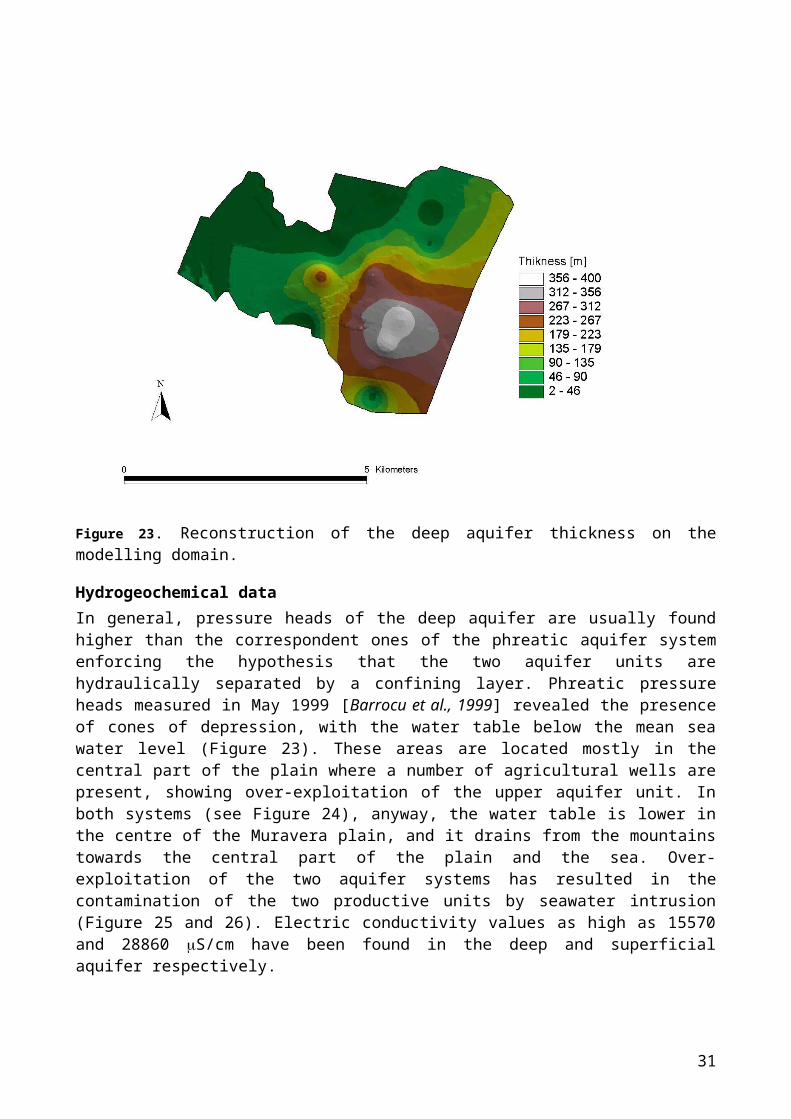
With the data available the geometry of the aquifer system has been reconstructed. In Figure 21, 22 and 23 the thickness of the prheatic, the confining layer and the deep aquifer are shown.
Figure 21. Reconstruction of the phreatic aquifer thickness on the modelling domain.
Figure 22. Reconstruction of the confining layer thickness on the modelling domain.
23

Figure 23. Reconstruction of the deep aquifer thickness on the modelling domain.
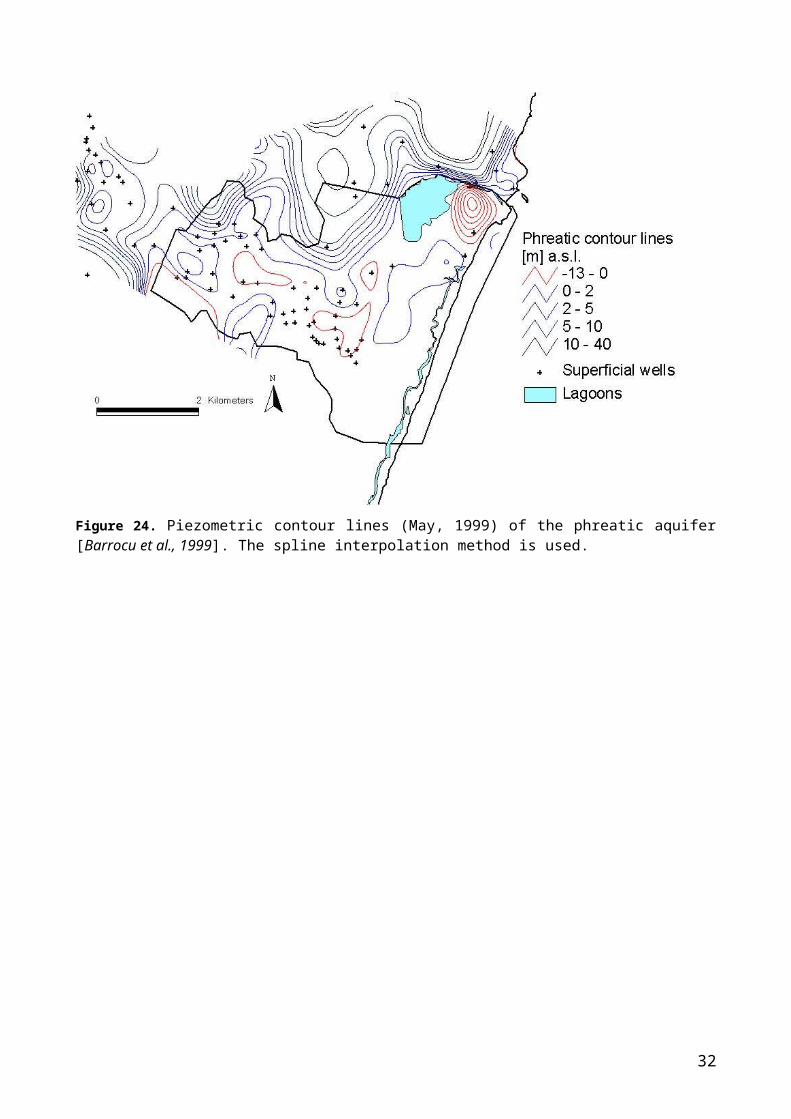
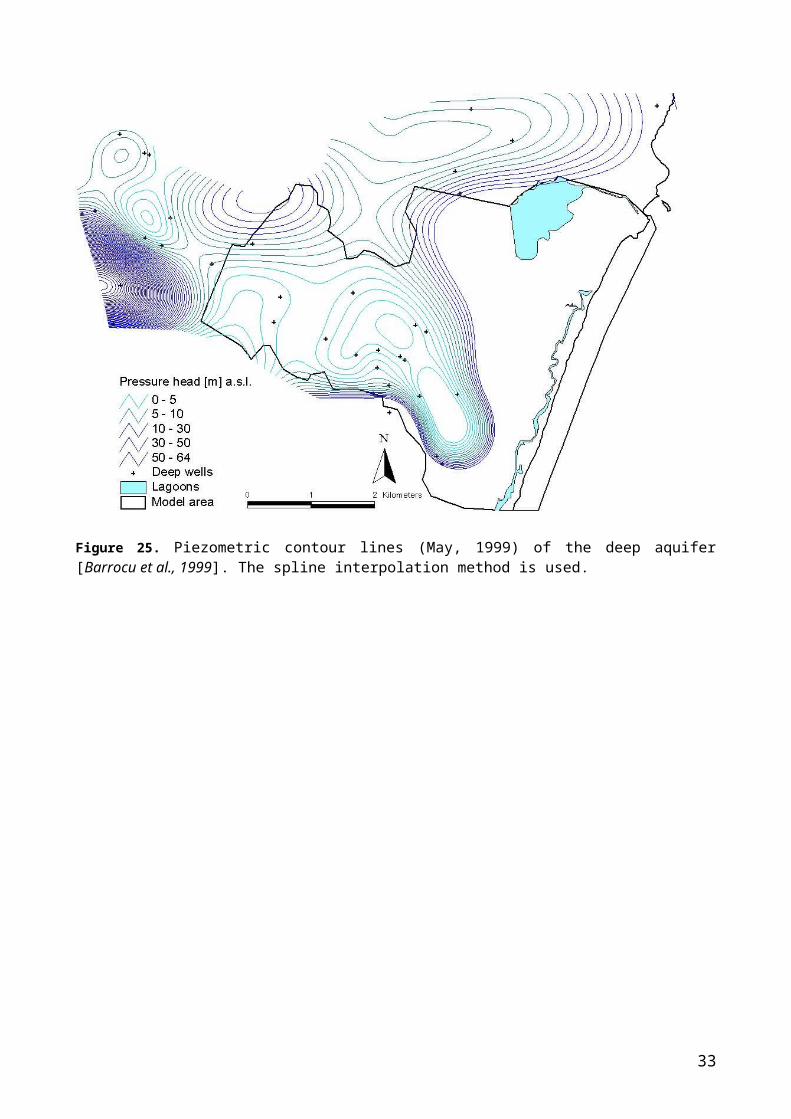
Hydrogeochemical dataIn general, pressure heads of the deep aquifer are usually found higher than the correspondent ones of the phreatic aquifer system enforcing the hypothesis that the two aquifer units are hydraulically separated by a confining layer. Phreatic pressure heads measured in May 1999 [Barrocu et al., 1999] revealed the presence of cones of depression, with the water table below the mean sea water level (Figure 23). These areas are located mostly in the central part of the plain where a number of agricultural wells are present, showing over-exploitation of the upper aquifer unit. In both systems (see Figure 24), anyway, the water table is lower in the centre of the Muravera plain, and it drains from the mountains towards the central part of the plain and the sea. Over-exploitation of the two aquifer systems has resulted in the contamination of the two productive units by seawater intrusion (Figure 25 and 26). Electric conductivity values as high as 15570 and 28860 S/cm have been found in the deep and superficial aquifer respectively.
24
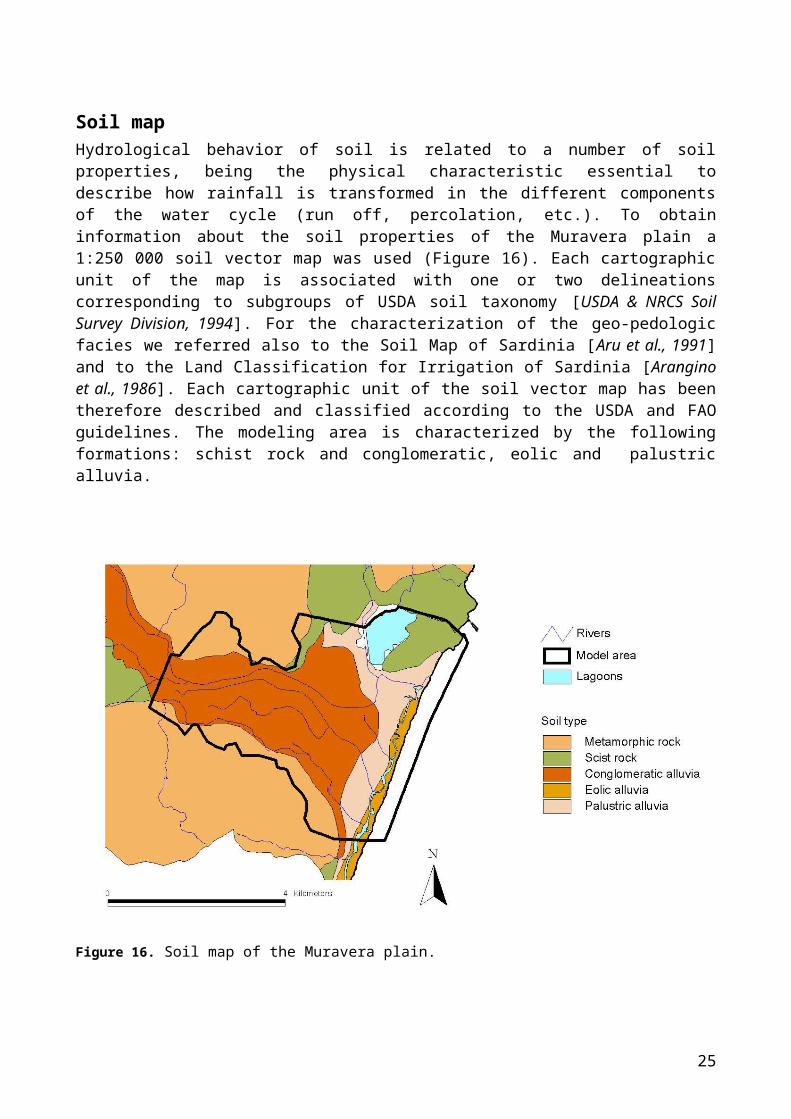
Figure 24. Piezometric contour lines (May, 1999) of the phreatic aquifer [Barrocu et al., 1999]. The spline interpolation method is used.
Figure 25. Piezometric contour lines (May, 1999) of the deep aquifer [Barrocu et al., 1999]. The spline interpolation method is used.
25
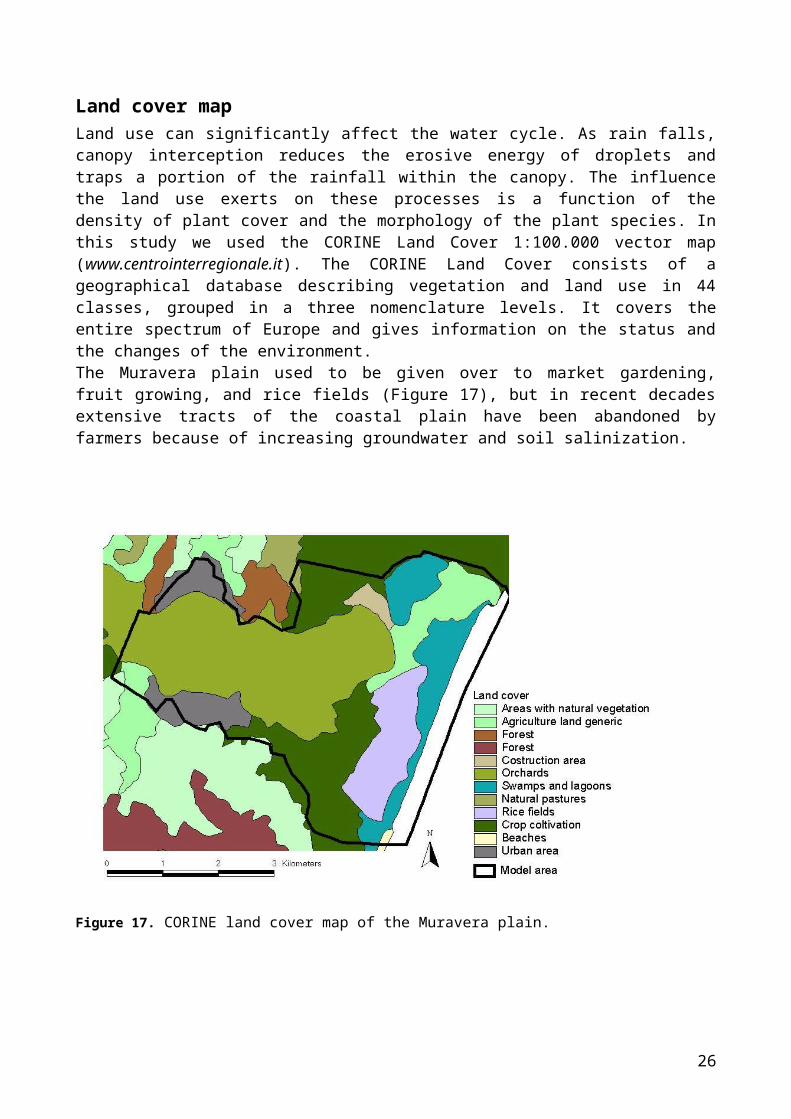
Figure 26. Electric conductivity contour lines (May, 1999) of the phreatic aquifer [Barrocu et al., 1999]. The spline interpolation method is used.
26
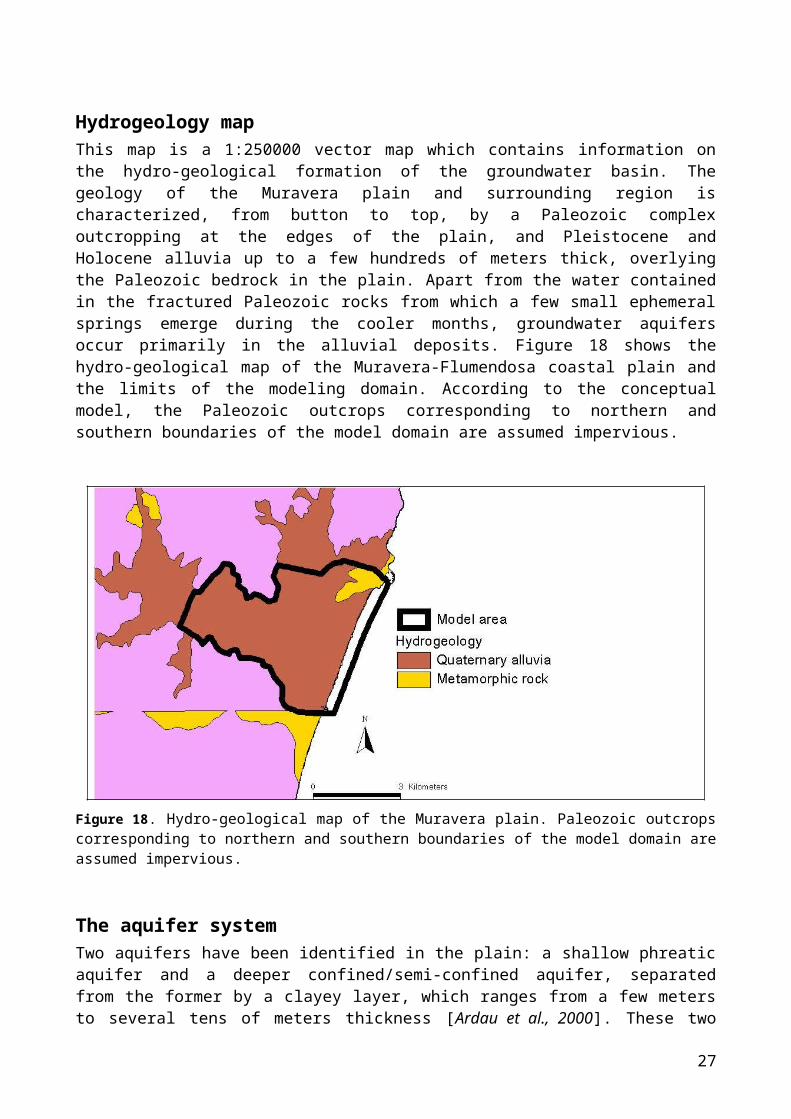
Figure 27. Electric conductivity contour lines (May, 1999) of the confined aquifer [Barrocu et al., 1999]. The spline interpolation method is used.
The modeling domainThe modeling domain covers an area of 21,39 km2. Its limits are on the North and the South the hydrogeological boundaries of the quaternary alluvia, on the East the sea and on the West an imaginary line parallel to the coast. The domain has been discretized into a 2D surface grid containing 7766 triangles and 3999 nodes. This non uniform grid has been generated to have the smallest triangles (215 m2 as compared to 11604 m2 for the largest) along the coast and around zones of heavy pumping.The 2D mesh has been obtained with the Argus ONE [Argus ONE 4.0, 1997] software, and then transformed in a GIS format with the ArcView extension “datacrossing” [Cau & Manca, 2002]. The 2D mesh has been triangulated taking into account territorial features relevant to the groundwater model such as the spatial location of the monitoring wells and the hydrography (rivers, lagoons, and channels) and incorporating them as grid points or lines.
27
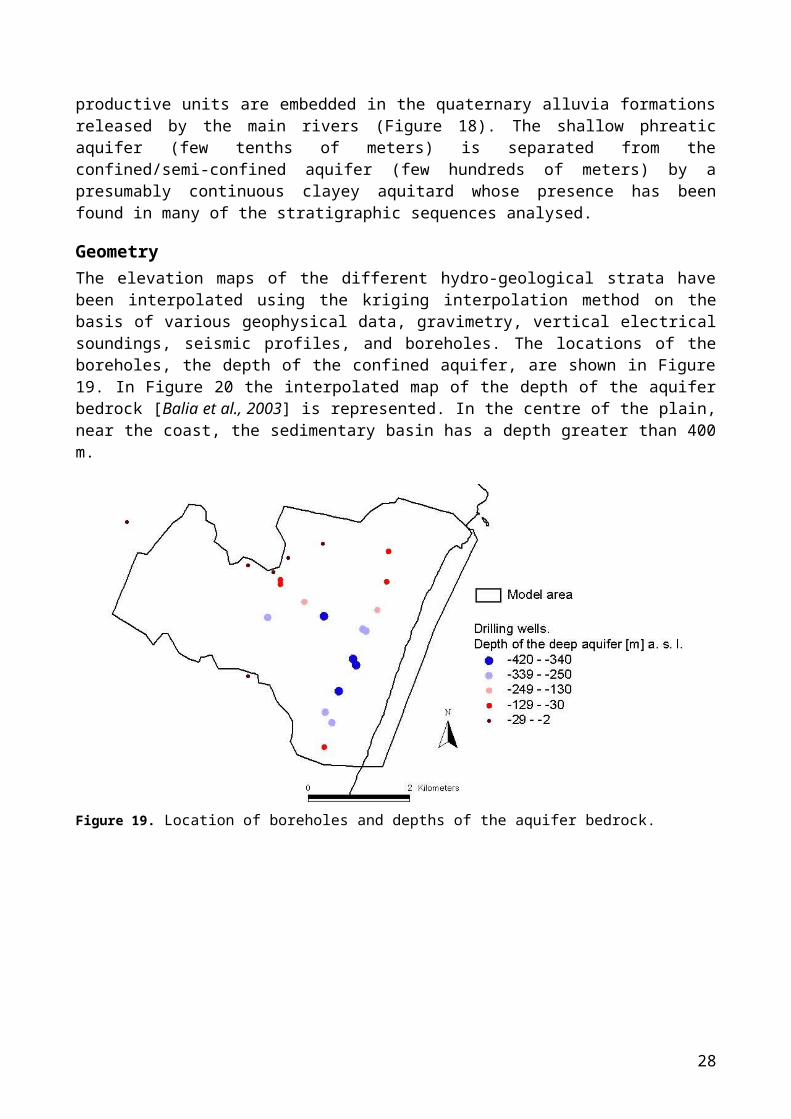
Figure 28. The triangulation of the modelling domain incorporating main territorial features. Denser grid zones corresponds to well fields.
28
The WEB-GIS demonstrative applicationThis Internet GIS system has been implemented to allow SWIMED partners to visualize and interact with selected sets of geographic and alphanumeric data of the Muravera-Flumendosa site using Internet resources. The final goal of this application was to make easier to partners sharing cataloguing criteria and formats of data and methodologies to analyze them.The application has been published in the project WEB page (http://www.crs4.it/EIS/SWIMED/menu/index.html) under the area restricted to project members.
Figure 29. Server-side WEB-GIS architecture including the GIS/Database and the relational database management system (RDBMS) modules.
UMN Mapserver characteristicsTargeted to the specific needs of the community of SWIMED partners, we decided to adopt a server side solution to develop our web-GIS project (Figure 29). To this end we choose the package called MapServer [http://mapserver.gis.umn.edu/], originally developed by the University of Minnesota (USA) in the framework of a NASA grant, and then improved to its core functionality by the DM Solutions Group.MapServer is an open source development environment for building Web mapping applications. This CGI-based application delivers on-line, interactive GIS and image processing information quickly and reliably.It contains a rich feature set for developing Web mapping applications. This is demonstrated by the wide variety of applications that have been developed with the technology. MapServer has been proven to be as efficient, if not more efficient than industry standard commercial software. Several comparisons have been done with ESRI ArcIMS demonstrating comparable if not faster map rendering speeds.This software can seamlessly integrate into almost any GIS, web server and operating system environments. GIS environments that MapServer work with include all ESRI, MapInfo, Intergraph, PCI and many others. It runs on all industry standard server
29
environments including Windows, Mac OS X, Wintel, and most versions of Unix/Linux. MapServer also operates seamlessly with most common Web servers such as Apache, Microsoft IIS and Netscape. Supported input vector formats are the most common like, ESRI ShapeFiles, optionally MapInfo TAB, DGN or data stored in Oracle SDO, ESRI ArcSDE or PostgreSQL databases. Raster supported formats are TIFF, GEOTIFF, JPEG, GIF, PNG, ERDAS Image, ESRI GRID. MapServer provides, intelligent labelling, thematic map building, spatial and attribute queries, on-the-fly configuration, on-the-fly cartographic projection of input data in different co-ordinate systems.The applications can be highly customized through the use of several programming environments. The most popular among these is the Open Source PHP development environment. Other development environments include Perl, Java, TCL and Python. Among the many benefits of these development environments is the ability to easily integrate data from existing non-geographic databases into mapping applications.
Cartographic OutputMapServer has been developed in order to allow for high quality presentation of maps. A sample of cartographic elements that can be easily integrated into an application include:
Scalebars; Legends; Reference maps; Collection of symbols for generating maps; Scale dependent layer visibility; Sophisticated rule-based labelling system; Static or on-the-fly map classification.
Layers and data displayedWith regards to the Muravera-Flumendosa site and more in general to the Sardinia island, the data available at this stage may be classified in four distinct groups: (1) base cartography, (2) hydrometeorological data, (3) well survey and monitoring records, and (4) well information deriving from an administrative census archive.
The cartographic data are grouped in five distinct thematic classes:
1. General or Basic layers The web-GIS interface allows the user to select some base layers to display. These are the base layers available in this application: Coastline; Urban areas; Administrative boundaries; Cadastral boundaries.
2. Thematic layers CORINE Land Use. The CORINE Land Cover geo-database consists of a
geographical database describing vegetation and land use in 44 classes, grouped in a three level nomenclature in order to cover the entire land cover spectrum of Europe. The minimum mapping element is 25 hectares. The scale of the land cover database is 1:100.000. This theme gives information on the status and the changes of the environment.
3. Hydrological layers
30
Flumendosa watershed; Subbasins; Wetlands; River network.Additional topographic information may be easily extracted from these layers using spatial analysis tools such as watershed extension, min, max and mean elevation values, stream length and so on.
4. Weather or climatic layers Pluviometric stations; Average rainfall (Thiessen Polygon method).The point theme (Pluviometric stations) gives information about average monthly and annual rainfall data provided by the local agency for water reasources management (Ente Autonomo del Flumendosa, EAF) for the 1922-1992 time period [Studio dell’Idrologia Superficiale della Sardegna,SISS, 1996]A deterministic method (Thiessen polygons) has been used to interpolate climatic data, to produce continuous information about weather variables, and to derive homogeneous climatic zones over the entire catchment basin of the Flumendosa river. The Thiessen polygon coverage will be calculated using raw data provided by SISS database.
5. Survey and monitoring layers Geological drilling; Near-surface wells; Deep wells;The well survey and monitoring data actually includes a rather heterogeneous set of information. The core of the data set is represented by a survey performed in the summer of 1999 for 123 wells. The GIS-web map displays the distribution of electric conductivity in the 123 observation wells, distinguishing between the deep (reaching the confined aquifer) from the near-surface ones. The conductivity values have been partitioned in five classes of suitability for irrigation, according to Wilcox (1955). The classes range from values below 250 S/cm (suitable for any type of soil and cultivation) to over 3000 S/cm (completely unsuitable for irrigation purposes).
System modules and functionalities
The implemented system provides SWIMED partners with basic web-GIS functionalities such as:
Display geographic data on the web; Navigate within the map using commands like zoom-in zoom-out and pan; Performs spatial query on geographic data and display the results on the
map on in tabular format; Feature labelling; Scale dependent feature drawing and labelling; get color, symbol, and scaling values from attribute table values or user
supplied look-up tables; feature based access to attribute data; automatic legend creation; user configurable reference map;
31
returns HTML, IMAGE, or URL data; support for "on-the-fly" projection of data.
An example of the Mapserver interface is showed in Figure 30.
Figure 30. UMN Mapserver web interface showing a zoom on the south eastern coast of the Sardinia island near the mouth of the Flumendosa river. The three main cities (Muravera, Villaputzu and San Vito), the well locations and the Flumendosa river network are also shown.
32
References1. Arangino, F., A. Aru, P. Baldaccini, & S. Vacca. I suoli delle aree irrigabili della Sardegna
(Piano Generale delle Acque, Regione Autonoma della Sardegna), Cagliari, 1986.2. Ardau F. and G. Barbieri, Aquifer configuration and possible causes of salination in the
Muravera plain (SE Sardinia, Italy). Proceedings SWIM 16, p. 11-18, 80, 2000. 3. Argus ONE 4.0, 1997. Argus Open Numerical Environment- A GIS Modeling System, Argus
Interware, Inc. USA.4. Aru, A., P. Baldacchini and A. Vacca. Nota illustrativa alla carta dei suoli della Sardegna, con
carta illustrata 1:250.000. Regione Autonoma della Sardegna, 1991.5. Balia, R., E. Gavaudò, F. Ardau and G. Ghiglieri, Case History. Geophysical approach to the
environmental study of a coastal plain. Geophysics, 68 (5), p. 1446-1459, 2003.6. Barrocu G. et al. Realizzazione e controllo di una rete di monitoraggio della falda costiera del
Flumendosa per la determinazione del fenomeno dell’intrusione marina. Convenzione EAF-DIT, Cagliari, Italy, 1999.
7. Cadeddu, A. and G. Lecca. Sistema Informativo dei Suoli della Sardegna da interfacciare al modello idrologico SWAT. Technical Report 09/03. CRS4, Center for Advanced Studies, Research and Development in Sardinia. Cagliari, Italy, 2003.
8. Cadeddu, A. A WEB-GIS Demonstrative Application for the Muravera Site. CRS4 Technical Report 03/81. CRS4, Center for Advanced Studies, Research and Development in Sardinia. Cagliari, Italy, 2003.
9. Cau, P. and G. Lecca. Fase III del Progetto PSTS MURST. Interfacciamento GIS-Modello, CRS4-TECH-REP-02/32, Cagliari, Italia, 2002.
10. Cau, P. and S. Manca. Una metodologia multivariabile per la calibrazione di alcuni parametri idrogeologici Portoscuso (Sardegna). Atti della Conferenza ASITA, Perugia, Ottobre 2002.
11. Cau, P., A. Cadeddu, C. Gallo, G. Lecca and M. Marrocu. Estimating available water resource of the Sardinian island using the SWAT model. Proceedings of 2nd International SWAT Conference, IRSA-CNR Bari, Italy, 2003.
12. Ente Autonomo del Flumendosa (EAF), Cao Pinna, C., A. Petruso, R. Silvano, A. Fadda, F. Buffa and N. Orrù (eds.), Studio dell’Idrologia Superficiale della Sardegna (SISS), Cagliari, Italy, 1996.
13. Giacomelli A. and E. Lorrai. Analisi dei dati per il sito della piana di Muravera e note sul sito Falcos. Technical Report 01/97. CRS4, Center for Advanced Studies, Research and Development in Sardinia. Cagliari, Italy, 2001.
14. Lecca, G. Implementation and testing of the CODESA-3D model for density-dependent flow and transport problems in porous media. CRS4-TECH-REP-00/40, Cagliari, Italy, 2000.
15. Lorrai, E, M. R. Lai, G. Lecca, A. Cadeddu, N. Crobu, and A. Giacomelli. Saltwater intrusion in the Muravera plain. In D. Ouazar and A. DH. Cheng, editors, First International Conference on Saltwater Intrusion and Coastal Aquifer, Monotoring, Modeling and Management (SWICA M³) - Cyber Proceedings (CD ROM), 2001.
16. Neitsch, S. L., J. G. Arnold, J. R. Kiniry & J. R. Williams. Soil and Water Assessment Tool (SWAT) – Theoretical Documentation (version 2000), USDA Agricultural Research Service, Temple, Texas, 2001.
17. USDA & NRCS Soil Survey Division. State Soil Geographic (STATSG0) Data Base - Data use information. Miscellaneous Publication Number 1492, 1994.
33