income survey guidelines - west virginia · income survey guidelines ... fulfill one of three...
TRANSCRIPT
INCOME SURVEY GUIDELINES
Community Development Block Grant
Small Cities Block Grant Program
West Virginia Development Office
Community Development Division
20
15

1
Overview
The Community Development Block Grant (CDBG-Small Cities) is a program of the U.S. Department of Housing and Urban Development. The primary objective of Title 1 of the Housing and Community Development Act of 1974, as amended, is to develop viable communities by providing decent housing, a suitable living environment, and expanded economic opportunities, principally for persons of low- to moderate-income. All projects funded through this program must fulfill one of three national objectives. Therefore, all projects must:
Benefit low- to moderate-income persons; or
Aid in the elimination of slums or blight; or
Meet an urgent need due to a serious and immediate threat to the health and welfare of a community. The area-wide benefit category is the most commonly used National Objective for activities that benefit a residential neighborhood, meaning the activity benefits all residents in a particular area, where at least 51 percent of the residents are LMI persons. For this purpose, LMI determination is based upon the income of a family, household, or individual living in a CDBG - Small Cities project area whose household income does not exceed 80 percent of the median income for the area, as determined by HUD, with adjustments for smaller and larger households or families (HUD generated LMI data). In order to demonstrate that proposed projects meet the National Objective of benefitting low- to moderate-income (LMI) individuals, the West Virginia Development Office will continue to evaluate household incomes documented through:
1. Census blocks/areas that align closely with the service area that have a 51% or greater LMI population according to HUD generated census data (Low and Moderate – Income Summary Data/LMISD). To check census based eligibility visit www.hud.gov/offices/cpd/systems/census/wv/index.cfm#lowmod and if the beneficiary area is a census tract(s), locate it in the Excel document by clicking on ALL BLOCK GROUPS, if the beneficiary area is a town or county then locate it in the Excel document by clicking on NON-ENTITLED LOCAL GOVERNMENT SUMMARIES. Visit www.hud.gov/offices/cpd/systems/census/lowmod/dictionary.cfm for help with terminology.
2. Certified income surveys of the project service area which document 51% or greater LMI population. To qualify a 2015 project through an income survey: Use the current HUD Income Limits for income surveys, which are available at www.huduser.org/portal/datasets/il/il14/index.html. The 2014 income limits are effective as of December 18, 2013. Choose West Virginia and then identify the proper County or Metropolitan Statistical Area.
When an Income Survey is Needed
CDBG –Small Cities activity area boundaries must be clearly defined in writing and mapping to accurately determine the percentage of LMI population. If a methodologically sound income survey is to be conducted in accordance with 24 CFR 570.483(b)(1)(I) and the State‘s guidelines for conducting income surveys, you must make a determination that either:
(a) The census boundaries do not coincide sufficiently well with the service area of the activity to use census data, (or)
(b) The applicant believes the HUD LMISD does not reflect current relative income levels in an area (Not 51% LMI).
Previously completed income surveys should be no more than 3 years old. Applicants with 4 year old surveys may request a waiver for case by case consideration. Please be sure that income surveys are conducted using true random sampling as discussed in this guide. Contact the WVDO if you need further assistance in proper income survey procedure or have questions about how to best determine LMI status for your project area. The following Income Survey Guide is a general discussion about how to ensure your income survey makes an accurate determination of LMI population.

2
Information on U.S. Census/ American Community Survey
Due to changes in the income related questions in the 2010 Decennial Census long forms, 2013 marked a transition of the primary source used by HUD to determine income levels on a household basis. The American Community Survey (ACS), which involves smaller sample sizes but is completed on an annual basis and asks generally the same questions as the old long form of the census, will now be the HUD utilized source for Census information. For 2015 West Virginia CDBG-Small Cities Block Grant applications, please utilize the American Community Survey 5-Year Estimates (2008-2012) which were released in December 2013. The 5-Year Estimates encompass all population levels of geography. Therefore, data for the smallest county, place or block group can be retrieved on an annual basis. The main utilization of this raw data for Applicants is in completing the Section 3 – Fair Housing/Equal Opportunity page (9) on Applicant population information and the Beneficiary Analysis page for demographic information. The ACS can be accessed by visiting the U.S. Census Bureau main page (www.census.gov) and or by opening the U.S. Census Bureau‘s American FactFinder (factfinder2.census.gov). For assistance in using American FactFinder or accessing ACS data, please contact your local West Virginia State Data Center affiliate.
This Income Survey Guide has been prepared by the West Virginia Development Office, Community Development
Division, for your use in preparing an application for CDBG – Small Cities Block Grant Program funding.
This Income Survey Guide replaces the previous Technical Assistance Guide 12, as of January 10, 2014.
If you have any questions or require any assistance, please feel free to contact our office by one of the methods listed
below:
Email: [email protected]
Phone: 304.558.2234
Fax: 304.558.3248
U.S. Mail: West Virginia Development Office
Community Development Division-Project Development
Building 6, Room 553
1900 Kanawha Boulevard, East
Charleston, West Virginia 25305

3
This Income Survey Guide is prepared to assist units of local government in the application for funding through the CDBG
- Small Cities program. Specifically, this Guide will assist in the development of income surveys for the purpose of
determining whether the service area of a proposed activity meets the LMI Area Benefit National Objectives criteria. It
provides local CDBG - Small Cities administrators and applicants who have no substantial survey research background
with the basic survey research techniques to make a determination of the income status of residents of the service area of
a CDBG - Small Cities-funded activity. The methods discussed in this guide are basic techniques for conducting a survey
that will yield acceptable levels of accuracy.
The procedures described in this guide are comprehensive approaches to conducting the least costly surveys possible
and attempts are made to render them as simple as possible. The procedures are purposely designed to be used for the
determination of income levels in the service area of a CDBG - Small Cities-funded activity; therefore, computations of
parameters such as standard deviation, variance, standard error, standardized scores, etc., that are routinely undertaken
in marketing research and other opinion surveys, are not applicable herein. The CDBG - Small Cities regulations at 24
CFR 570.483(b)(1)(i) requires that the survey be methodologically sound.
Confidentiality
If you choose to conduct a survey, you must emphasize to respondents that their answers will be kept confidential. People
are more likely to provide honest answers if their answers are to remain anonymous. You should do your very best to
maintain this confidentiality. It is recommended that the respondent‘s name, address, and telephone number appear only
on the cover sheet of the questionnaire. After the survey is completed, the cover sheet may be numbered and separated
from the actual interview sheet. If the cover sheets and the questionnaires are both numbered, they can be matched if
necessary. It is suggested that the grantee make reasonable efforts to protect the privacy of those surveyed and follow
applicable State and local laws regarding privacy and obligations of confidentiality.
Lifespan of a Survey
As required by the West Virginia Development Office (WVDO), Community Development Division, income surveys should
be updated every three years. There are some instances in which an older survey may be considered acceptable;
therefore, applicants may request a waiver from WVDO. These requests will be considered on a case by case basis.
Criteria to be met for gaining a waiver include factors such as family size income limits that have remained nearly the
same from year to year, and factually based statements from the applicant that economic and sociological conditions in
the area have remained steady or declined over the previous 4 years since the survey was completed.
Changes including factory openings or closings, layoffs by a major employer in the service area, or the occurrence of
major disasters (such as floods, fires, etc.) can affect the validity of survey results from year to year. Grantees may also
want to conduct income surveys for defined service areas in the development of new Consolidated Plans. Note that even
if a survey is current, it cannot be used for a different activity in a different service area; however, it might be usable for
another activity in the same service area. Plan ahead accordingly so that applications are not rejected due to lateness
from starting a new survey too close to the application deadline or because of ineligibility based on old survey data. If you
need assistance or have questions about using an existing survey, contact your regional community development
specialist at WVDO.
Survey Documentation
All applicants must document that their survey meets the above guidelines. In this regard, the Chief Elected Official
representing the applicant must certify that the survey was conducted properly. The applicant must submit a description of
the survey methodology indicating the date of the survey and certifying its accuracy, along with a copy of the survey form,
and the low and moderate income worksheet as part of the application for funding.
Introduction

4
As part of this Guide, WVDO has developed definitions related to Income Survey methodology as allowed under 24 CFR 570.481(a) (provided that they are explicit, reasonable, and not plainly inconsistent with the Housing and Community Development (HCD) Act of 1974).
CDBG - Small Cities Terminology
Low – Mod Area Benefit - The area benefit category is the most commonly used national objective for activities that benefit a residential neighborhood. An area benefit activity is one that benefits all residents in a particular area, where at least 51 percent of the residents are LMI persons. WVDO will require applicants to identify the census tract/block that most closely matches the area of benefit for every project, even those that met LMI percentage through income survey. Household - Household means all persons occupying a housing unit. The occupants may be a family, as defined in 24 CFR 5.403; two or more families living together; or any other group of related or unrelated persons who share living arrangements, regardless of actual or perceived, sexual orientation, gender identity, or marital status. Each family in a household should be represented on a single income survey sheet. Households do not always correspond with the defined number of customers in a project, as there may be one utility service to a duplex of two households, or a single tap to a trailer park which is comprised of fifty trailers which are each households. Customer - An individual water tap or sewer hookup. Please provide this as the total possible customers in occupied housing units for a project and not only the expected sign ups (80%). Customers have to be separated between residential and non-residential (business/church/seasonal) for CDBG - Small Cities projects as non-residences can report no income and are not beneficiaries. Temporary Residence – A housing unit which is considered seasonal, meaning the household resides there less than 6 months out of average year. Though possibly a customer, this is not a beneficiary household and must not be included in income surveys. Existing Customers – The total customers on the utility system who had the same utility service from the city, town, or PSD provider prior to the proposed project construction. New Customers - Those who had no previous utility service of the type being installed in the proposed project, and will potentially be served after project completion. Total Project Customers - The total number of new taps or hookups in an extension project and/or any existing customers who will benefit from upgrades or replacement lines/facilities in proposed project areas. Person - A member of a household, regardless of age or marital/familial relationship. The number of persons in a household determines the applicable income limits to determine LMI. The total persons in a project are all members of all beneficiary project area households. Beneficiary - Any person living in a determined project area of benefit or a residential neighborhood who will benefit from a CDBG - Small Cities project activity. Infrastructure projects have area-wide beneficiaries, typically the CDBG - Small Cities projects funded through WVDO do not have any direct beneficiaries unless they have applied individually for an income qualified service or financial assistance. LMI Percentage - The number of persons living in LMI households in a project area divided by the total number of persons residing in the beneficiary project area households. To meet CDBG - Small Cities requirements the LMI percentage of beneficiary persons must meet or exceed 51%. LMI persons/beneficiaries - A family, household, or individual living in a CDBG - Small Cities project area whose household income does not exceed 80 percent of the median income for the area, as determined by HUD, with adjustments for smaller and larger households or families (HUD generated LMI data). For beneficiary areas qualified by HUD Census data, this number can be arrived at by taking the total number of project beneficiaries and multiplying by the LMI% determined. For survey based LMI qualifying areas, the survey worksheet will give this number on line 15.
Income - grantees may select any one of the following three definitions of income to apply consistently in survey work:
1. Definitions

5
i. Annual income as defined at 24 CFR 5.609 (except that if the CDBG - Small Cities assistance being provided is
homeowner rehabilitation under 24 CFR 570.202, the value of the homeowner‘s primary residence may be excluded
from any calculation of net family assets);
ii. Annual income as reported under the Census/ACS for the most recent available ACS questionnaire; or
iii. Adjusted gross income as defined for the purpose of reporting under Internal Revenue Service (IRS) Form 1040 for
individual Federal annual income tax purposes. (most common)
General Terms Used in Survey Research
1. Unit of analysis refers to what is being measured and for the purpose of this guidance; the unit of analysis is family
income. Whether one is counting households or families, what actually matters is the total family income, not the
income of any one individual.
2. Respondent refers to the person who is responding to the questionnaire or interview.
3. Rate of response is expressed as a percent; it refers to the number of households participating in a survey divided by
the number of households in the sample.
4. Population refers to the group whose characteristics you seek to estimate.
5. Parameter is the summary description of a given variable in a population.
6. Sample refers to a portion of the population under study. Samples are used to draw inferences about the population.
7. Sampling is the process of selecting a sample from the population.
8. Simple random sampling is a type of probability selection process in which the units composing a population are
assigned numbers and a set of random numbers is then generated, and the units having those numbers are selected
to make up the sample.
9. Representativeness refers to the quality of a sample having the same distribution of characteristics as the population
from which it is selected.
Visit www.hud.gov/offices/cpd/systems/census/lowmod/dictionary.cfm for help with HUD LMISD terminology.

6
This is the area to be served by the CDBG - Small Cities funded activity. One of the crucial aspects of qualifying an
activity as principally benefiting LMI persons on an area basis is the proper identification of the service area. The service
area must be defined first before deciding which data to use to determine the percentage of LMI persons and not vice
versa. The principal responsibility for determining the area served by the activity rests with each CDBG - Small Cities
grantee/applicant.
HUD will generally accept the determination of the service area by the state and its grant recipients unless the nature of the activity or its location raises serious doubt about the area claimed by the state and its grant recipients. The area to be served by a CDBG - Small Cities funded activity need not be coterminous with census tracts or other officially recognized boundaries; it is critical that the service area be the entire area served by the activity (see 24CFR 570.483(b)(1)(i)). The service area boundaries of CDBG - Small Cities-funded activities may or may not coincide with census or other geographic boundaries, especially in smaller communities and rural areas where block groups or census tracts with low population densities cover large areas. One census tract may cover an entire city or there may be only two or three census tracts in an entire county. Scenarios which states and state grant recipients commonly face include the following: 1. The service area comprises only a small portion of the unit of general local government, or of a census tract. In such
situations, information on the unit of government or the census tract is not useful because the residents of the service area make up only a small fraction of the total, and their characteristics may not mirror those of the larger area. A survey of the residents of the service area may be the most appropriate way to determine whether the service area qualifies under the LMI criterion. Examples of activities in which this may be encountered include: extending water lines to serve rural settlements in a county; construction of a public facility serving one subdivision/neighborhood in a city where the entire city is one census tract.
2. The service area includes all or part of several units of general local government and may contain both incorporated
and unincorporated areas. Data from HUD may be usable for a portion of the service area; therefore, the State and its grant recipients may need supplementary survey data for the other portions of the service area. It may be necessary to survey a large area to determine the percentage of service area residents who are LMI. Examples of activities include: (1) construction of a rural water system which serves more than one incorporated or unincorporated community or a large Public Service District area in surrounding unincorporated areas of two counties; (2) construction of a new sewage plant in a city where the municipal wastewater department provides, through contract, treatment service for two adjoining Public Service District owned sewage collection systems.
For the CDBG - Small Cities program, the service area may be a sparsely populated rural area. For such an area, a census of the entire population may be undertaken; however, the following conditions are applicable:
The grantee must show how the percentage of LMI persons was calculated. The percentage of LMI persons must be calculated from the entire population of the service area, and not from the proportion of participants who responded to the survey. If for example, a town in rural America with a population of 640 conducts a census of the entire population to determine the percentage of LMI persons, and gets an 80 percent response rate. Fifty-one percent of 640 is 326, and 80 percent of 640 is 512. Of the 512 respondents, 326 of them should be LMI persons. It is inaccurate to use 51 percent of 512 which is 261.
It is possible that some families in the service area may vehemently refuse to participate in the census, or cannot be reached (after several attempts) for several reasons (for example, families on lengthy vacations). In such cases, it is suggested that the total number of persons in the families that participated in the census be used in calculating the percentage of LMI persons. However, the number of refusals or absentees must be relatively small (for example, two or three families out of, say, 50) so as to have a negligible effect on the validity of the results of the census. Regardless of the type of method used, compare the percentage of LMI persons obtained from the survey or census with the percentage of LMI persons provided in the most recent LMISD and give an explanation if the two percentages differ widely.
Performing LMI Qualification
Once the boundaries of the service area of the CDBG - Small Cities-funded activity have been defined, the next step is to determine the required percentage of residents that are LMI persons. To determine the percentage of LMI persons in the service area, grant recipients may utilize HUD‘s Low and Moderate Income Summary Data (LMISD). HUD‘s LMISD is based on the most recent US decennial census data (transitioned to ACS data), which
2. Service Area

7
a) may not reflect current income levels in the service area and/or (b) the census tract/block boundaries may not
coincide sufficiently with the service area. This leads to the option of conducting a survey to determine the percentage of LMI persons in the service area.
For the CDBG - Small Cities program, regulations at 24 CFR 570.483(b)(1)(i) require that grantees conduct surveys that are methodologically sound to determine the percentage of LMI persons in the service area of a CDBG - Small Cities-funded activity. A statistically reliable survey entails the following: 1. The grantee must clearly state the survey method used: mail questionnaire, face-to-face or telephone interviews, etc.
(Each method has advantages and disadvantages.)
2. Participants for the survey must be selected through a random sampling process, and replacements for non-respondents must also be selected through the same random sampling process.
Temporary residents (for example, residents of seasonal cabins) may not participate in an income survey if their benefit of a service or an activity is incidental. For example, the use of a library or senior center by temporary residents would be considered an incidental benefit. Temporary residents may participate in income surveys for CDBG - Small Cities-funded activities such as installation of sewer lines and sewage treatment plants, etc.

8
When HUD‘s LMISD data are not used in documenting LMI benefit on an area basis, CDBG - Small Cities grantees must comply with the standards for conducting surveys located at 24 CFR 570.483(b)(1)(i) for the CDBG - Small Cities program. Experienced researchers employ survey methods that are easy to complete, generate consistent and accurate data, and produce results that answer specific questions. Anybody who has not conducted a survey can still do so by following a systematic approach. This guide describes procedures that may be used to determine whether the requisite percentage of the residents of a service area (51% or the exception percentage, as applicable) of a CDBG - Small Cities-funded activity are LMI persons. This guide does not restrict the CDBG - Small Cities grantee to any one type of survey methodology. The steps in conducting surveys are as follows:
Step 1: Select the Type of Survey:
Decide which survey method to use (telephone, door-to-door, or mail questionnaire) and base your decision on available staff, size of the sample you need, and the means you have available for identifying samples for the survey. The bibliography at the end of this Notice contains a list of books on how to conduct other types of surveys.
Step 2: Develop the Questionnaire:
If you choose to conduct a mail questionnaire, use standard 12-point print and do not congest too many questions on one sheet of paper. Generally, follow these guidelines:
The questions in the questionnaire should be short, simple and efficient. Keep the language as simple as possible. Avoid bias. Do not encourage particular answers. Include other questions, if you like, but make sure that the survey does not take too long.
Use the correct income limits (correct amount, correct year, and correct service area) for the survey instrument. Contact WVDO when in doubt.
Avoid loaded questions—i.e., questions with no correct answers. Loaded questions increase respondent burden.
Step 3: Select the Sample:
Define your service area: What are the boundaries of the service area? What is the size of the population for which you are calculating the percentage of persons who are LMI?
Identify the Sample: Select a procedure for identifying the sample in the service area and identify a procedure for randomly selecting the sample. Obtain a complete list of residents, addresses, and telephone numbers in the service area. Work with the project engineer to produce or obtain a project area map which shows homes as determined from aerial survey or driving/walking the project layout or service area.
Determine the sample size: Determine the sample size needed in order to achieve an acceptable level of accuracy.
Randomly select the sample: Make sure you add families to replace refusals and that the entire service area is covered—that is, be certain that you have not excluded certain areas or groups of people. Commercial (retail and industrial) sites, churches, schools, vacant lots and abandoned and vacant homes should be excluded from the sample because they do not have any effect on the outcome of the survey. Use an acceptable random selection method and decide the number of attempts and replacement procedures to be used. Ascertain that the selection of subjects to be included in the sample and replacement procedures are structured to avoid bias; for example, daytime or weekday attempts may skew response rates in favor of unemployed, retired, or single income families.
Step 4: Conduct the Survey:
If you choose to conduct an interview survey, select and train your interviewers. One of the most important aspects of any interview survey is the training of the interviewers. The quality of the results of the survey depends on how well the survey is conducted. Even in small studies involving a single researcher-interviewer, it is important to organize in detail the interviewing process before beginning the formal process. Make sure the interviewers are very comfortable with the questions. The training process includes the following major topics:
Describing the entire survey
3. Summary of Steps in Conducting LMI Surveys
9
Identifying the sponsor of the survey
Providing the interviewer with a working knowledge of survey research
Explaining the survey sampling logic and process
Explaining interview bias
‗Walking through‘ the interview process
Explaining respondent selection process
Explaining scheduling and supervision
Explaining follow-up for non-response Make contact with the residents of the service area and definitely work with the project sponsor and volunteers to let people know in advance that you are coming. This could be in the form of a newspaper notice or article or including a slip with the previous billing cycles mailed bills, if the project involves existing customers. You can also mail flyers or call ahead. If prior notification can‘t be arranged, just knock on doors, if this is the procedure you select. Try again (and again) to establish contact and reschedule another interview if initial contact has not resulted in an interview. Replace families you have written off as ―unreachable.‖
Step 5: Analyze the Results:
Complete the WVDO provided LMI Worksheet correctly. Record your calculated percentage of LMI persons.
Step 6: Document and Save Your Results:
Save the completed questionnaires—preferably in a form that does not reveal the identity of the respondents. Use code numbers to conceal the identity of respondents
Save the list of respondents—preferably in a form that does not identify their responses
Save the description of the service area, the list of your sampling procedures (original sample, interview sheets or completed questionnaires, tabulations and a list or memo describing how other survey elements were handled, including replacements and replacement methods). Save your data.
10
Step 1: Selecting the Survey Type
The most commonly used surveys for this application are: (a) mail survey (or self-administered questionnaire), (b) face-to-face (or door-to-door) interviews, and (c) telephone interviews (see Table A). For telephone and door-to-door surveys, it might be useful for the survey team to notify people by mail in advance, to let them know that they will be contacted for a survey. This can overcome resistance due to ‗telemarketing fatigue.‘
(a) Mail (or Self-Administered) Questionnaires
This is a basic method for collecting data through the mail: a questionnaire is a set of questions sent by mail accompanied by a letter of explanation and self-addressed stamped envelope for returning the questionnaire. The respondent is expected to complete the questionnaire, put it in the envelope and return it. A common reason for not returning a questionnaire is that some people may feel it‘s too burdensome. To overcome this problem, researchers often send a self-mailing questionnaire that can be folded in a certain way so that the return address appears on the outside. In this manner, the respondent does not risk losing the envelope.
Advantages of Mail Questionnaires
Covers large geographic area
Provides an opportunity for honest answers to very personal questions
No travel required
Enables researcher to target a particular segment of the population
Allows respondents to complete the questionnaire at their convenience Disadvantages of Mail Questionnaires
May have possible coverage errors; for example, address lists might be inaccurate or out of date (duplicate address, incomplete or wrong addresses)
Not appropriate for requesting detailed written responses
May have a low return rate if too lengthy, poorly worded, or seems too personal
May not have anyone available to assist the respondent with questions, especially if the questions are in English but the respondent‘s primary language is not English. Provisions must be made to provide non-English-speaking residents with a questionnaire in their own language, as appropriate
Easiest for people to disregard, postpone, misplace or forget about it
Needs to allow longer time to collect responses
Costly—must pay for return postage to get a decent response rate; also you have paid for postage even for those that aren‘t returned
It‘s all or nothing—people will either do it all or not at all; with phone or in-person surveys, one might at least get some answers
Lack of control over who fills out the questionnaire (for example, a child) HUD does not recommend mail surveys unless at least one follow-up letter or telephone call is made to obtain an adequate response rate. Combining a mail survey with a follow-up letter or telephone call may improve the rate of response. For example, if in a door-to-door survey you find that someone is not at home, you can leave a note for the head of the family (or responsible adult) to telephone the interviewer. You can also use the phone to schedule a time when to conduct an interview or mail a letter to residents of the service area and let them know in advance when an interviewer will call or visit.
4. Survey Types and Methods

11
(b) Face-to-Face (Door-to-Door) Interviews
This is a data collection technique in which one person (an interviewer) asks questions of another (the respondent) in a face-to-face encounter. It involves more work since the interviewer must go and knock on doors in order to obtain interviews. However, in small areas this type of survey may be the easiest because one can define the service area by its geographic boundaries and develop procedures for sampling within those boundaries so that a list of families living in the area is not required. Interviewers have to be well trained to ensure that procedures are consistently followed and that responses are not influenced by facial expressions.
Advantages of Face-to-Face Interviews
Is a very reliable method of data-collection
Researcher has full range and depth of information
Interview may be scheduled to suit respondent‘s daily agenda
Respondent has the option to ask for clarifications
Target population may be easily located and defined
People may be willing to talk longer, face-to-face, particularly with in-home interviews that have been arranged in advance
Disadvantages of Face-to-Face Interviews
Responses may be less candid and less thoughtful
Interviewer‘s presence and characteristics may bias responses
Interviewer is required to go to the respondent‘s location
Respondents who prefer anonymity may be influenced negatively
May reach a smaller sample
Time consuming and lengthy responses must be sorted and coded
Costs more per interview than other survey methods; particularly true of in-home interviews in rural areas where travel time is a major factor
May not be able to gain access to the house (e.g., locked gates, guard dogs, ―no trespassing signs,‖ etc.)
Translators may be needed when dealing with non-English speakers
(c) Telephone Interviews
A telephone interview is a data collection technique in which one person (an interviewer) asks questions of another (the respondent) via telephone. Telephone numbers of potential participants must be selected randomly. The interviewer must ensure that the respondent is someone competent and knowledgeable enough to answer questions about the family income status. In a telephone survey, you must devise a method for contacting those families without telephones or those with unlisted numbers. Hence it may be preferable to conduct door-to-door interviews in small service areas, especially in rural areas.
Advantages of Telephone Interviews
Relatively easy to conduct
Saves money and time
Appearance and demeanor of interviewer do not influence the respondent
Respondents may be more honest in giving socially disapproved or sensitive answers due to greater anonymity for respondent
Interviewer may use an alias rather than his/her real name for privacy or to conceal ethnicity if relevant to the study

12
Allows interviewer to ask follow up questions
No fear for personal safety
Disadvantages of Telephone Interviews
Respondents may be hostile to interviews because of experience with previous telemarketing sales calls disguised as surveys
Respondents may terminate the interview abruptly
The interviewer may have problems reaching potential respondents by telephone because of the prevalence of answering machines that screen telephone calls
May not be able to reach households with unlisted numbers, no telephone at all, or families that use only cell phones
Some people often do not like the intrusion of a telephone call to their homes
Difficulty of reaching people due to reasons such as conflicting schedules
It may be easier to be less candid to someone on the phone than in person
Difficult to get accurate answers from non-English speakers
Table A – Summary Comparison of the Three Survey Methods
Dimension of Comparison Mailed
Questionnaire Face-to-Face
Interviews Telephone Interviews
Cost Moderate High Low
Data Quality: Response rate Respondent motivation Interview bias
Low Low
None
High High
Moderate
Moderate to High
High Low
Sample quality Low High Moderate
Interview length Short
Very Long (depends on size of service area)
Long
Ability to probe and clarify None High High
Speed Low Low High
Interviewer supervision None Low High
Anonymity High Low Low
Ability to use computer assistance during process
May be possible but
too expensive Possible High
Dependent on respondent’s reading and writing abilities
High None None
Control of context and question order
High High High
Step 2: Developing a Questionnaire
Constructing a questionnaire is a skill, which requires decisions concerning the content, wording, format, and placement
of questions—all of which have important consequences on the results of what you intend to measure. There are basically
four areas involved in constructing a questionnaire:
Determine the question content, scope, and purpose.

13
Choose the response format to be used in collecting information from the respondent.
Word the questions so as to get at the issue of interest.
Determine how best (i.e., the order) to place the question(s) of interest among other questions in the questionnaire.
It is important that all respondents be asked the same questions, in the same order, and their responses recorded exactly,
without additions or deletions. To ensure this, the questions must be written properly and the exact response of each
respondent recorded as it is presented.
It is recommended that interviewers carry two cards for each family. One card will contain figures for each low- and
moderate-income level and its corresponding family size (see Table B).
If racial data are to be collected, the other card will contain the following racial categories: White, Black/African American,
Asian, American Indian/Alaskan Native, and Native Hawaiian/Other Pacific Islander, American Indian/Alaskan Native &
White, Asian & White, Black/African American & White, American Indian/ Alaskan Native & Black/African American, Other
Multi-racial; and the following ethnic categories: Hispanic, Latino, or not Hispanic or Latino.
TABLE B - Illustration of Income Cards
Card Number Number of Persons in Family Low/Mod Income Level
(SAMPLE)
1
2
3
4
5
6
7
8
9+
1
2
3
4
5
6
7
8
9+
$19,800
$22, 650
$25,450
$28,300
$30,050
$31,850
$33,600
$35,400
$37,200+

14
Information about the racial and ethnic composition of the service area may be obtained directly from Census data.
However, HUD does not object to collecting information about racial and ethnic composition of the service area from the
survey. CDBG - Small Cities regulations at 24 CFR 570.491 for the State program require submission of data on the
racial, ethnic and gender characteristics of persons who are applicants for, participants in or beneficiaries of their CDBG -
Small Cities programs. This information must be reported for each activity and should indicate the number persons
benefiting by race, ethnicity, and gender.
Ethnic Categories* Select One
Hispanic or Latino
Not-Hispanic or Latino
Racial Categories* Select All that Apply
American Indian or Alaska Native
Asian
Black or African American
Native Hawaiian or Other Pacific Islander
White
Other
*Definitions of these categories should be included
Include a statement such as the following if you ask for racial/ethnic information: There is no penalty for persons who
do not complete this information (demographics).
Have the following explanations available on a card to share with or read to respondents.
1. The two ethnic categories you should choose from are defined below. You should check one of the two categories.
Hispanic or Latino A person of Cuban, Mexican, Puerto Rican, South or Central American, or other Spanish culture or origin, regardless of race. The term ―Spanish origin‖ can be used in addition to ―Hispanic‖ or ―Latino.‖
Not Hispanic or Latino A person not of Cuban, Mexican, Puerto Rican, South or Central American, or other Spanish culture or origin, regardless of race.

15
2. The five racial categories to choose from are defined below: You should check as many as apply to you.
American Indian or Alaska Native A person having origins in any of the original peoples of North and South America (including Central America), and who maintains tribal affiliation or community attachment.
Asian A person having origins in any of the original peoples of the Far East, Southeast Asia, or the Indian subcontinent including, for example, Cambodia, China, India, Japan, Korea, Malaysia, Pakistan, the Philippine Islands, Thailand, and Vietnam
Black or African American A person having origins in any of the black racial groups of Africa. Terms such as ―Haitian‖ or ―Negro‖ can be used in addition to ―Black‖ or ―African American.‖
Native Hawaiian or Other Pacific Islander A person having origins in any of the original peoples of Hawaii, Guam, Samoa, or other Pacific Islands.
White
A person having origins in any of the original peoples of Europe, the Middle East or North Africa.

16
SAMPLE SURVEY QUESTIONS
Question 1
How many families currently reside at this address? __________________ (If more than one family, each family must
complete a separate questionnaire).
Question 2
How many persons are there in your family including yourself? __________________ (If you are single with no
dependents, write 1).
If more than one family resides at the address, complete the following:
Family #1: family size (i.e., number of persons in family) __________________
Family #2: family size (i.e., number of persons in family) __________________
Family #3: family size (i.e., number of persons in family) __________________
Question 3
Is the current, combined income of all family members residing at this address (including any related, dependent persons
over 65 or working dependent children over 18) above or below the figure quoted on this card? ___ Yes, ___ No
(Present the card showing family sizes and income levels from Table A).
Question 4
Please, check the ethnic group to which you belong:
Hispanic or Latino _____ Not Hispanic or Latino _____
Please, check the racial group to which you belong:
White _____
Black/African American _____
Asian _____
American Indian/Alaskan Native _____
Native Hawaiian/Other Pacific Islander _____
American Indian/Alaskan Native & White _____
Asian & White _____
Black/African American & White _____
American Indian/ Alaskan Native & Black/African American _____
Other Multi-racial _____
(Present the card showing various categories)

17
INCOME SURVEY FORM CDBG – Small Cities Program
February 15, 2015 The Town/City of _________/_________County proposes to submit an application for Community Development Block Grant funding for a project in your area. In order to determine if this activity qualifies, we need your assistance in filling in the following questionnaire: 1. What is the total number of persons living in this family? ___________ 2. Please checkmark below whether your total family income for Calendar Year _____ (Insert Appropriate Year)
was above or below the income figure given for your family size:
___ 1 Person --->Total Income is Above ___ Below ___ $__________
___ 2 Persons--->Total Income is Above ___ Below ___ $__________
___ 3 Persons--->Total Income is Above ___ Below ___ $__________
___ 4 Persons--->Total Income is Above ___ Below ___ $__________
___ 5 Persons--->Total Income is Above ___ Below ___ $__________
___ 6 Persons--->Total Income is Above ___ Below ___ $__________
___ 7 Persons--->Total Income is Above ___ Below ___ $__________
___ 8 Persons--->Total Income is Above ___ Below ___ $__________
Sample of Most Basic Form – Use Income Limits for the Project Area

18
Making Contact
Initially, the interviewer should make contact with the head of the family or someone who is qualified to speak for the
family and has knowledge about the family income. After making contact, the interviewer should introduce him/herself,
state the purpose of the survey and solicit the participation of the respondent. If the interview is being conducted face-to-
face, the interviewer should find the card for the family size of the respondent, hand it to the respondent, and then ask the
questions and record the answers. If the interview is being conducted by telephone, a card cannot be used; therefore, the
interviewer should make reference to the income level that is the threshold for a family of the size of that of the
respondent. For example, if there are three persons in the respondent‘s family you might ask, ―is the current combined
income for your family during the past twelve months, less than or more than $25,450?‖
While the necessary questions are brief and simple, there are some additional factors to take into account when designing
the questionnaire. First, the questions used in the survey cannot be ―loaded‖ or biased. For example, the interviewer may
not imply that the neighborhood will benefit or receive Federal funding if respondents say that they have low incomes. The
questions must be designed to determine truthfully and accurately whether respondents are LMI persons. It is permissible
to state that the reason for the survey is to gather information essential to support an application for funding under the
CDBG - Small Cities program or to undertake a CDBG - Small Cities-funded activity in the area.
Second, bear in mind that questions about income are rather personal. Some people may be suspicious or reluctant to
answer questions about their incomes—especially if they do not see the reason for the question. A good way to handle
this problem is usually to put questions about income at the end of a somewhat longer questionnaire on other community
development matters. In this instance, a local agency can use this questionnaire to gather some information on what the
neighborhood sees as important needs or to gather feedback on a proposed policy or project. At the end of such a
questionnaire, it is usually possible to ask questions on income more discretely. If this option is chosen, however, the
interviewer should be cautioned that a lengthy questionnaire might cause respondents to lose interest before completing
the survey. The ideal length here would probably be less than ten minutes, although certainly you could develop an even
longer or shorter questionnaire as necessary.
Step 3: Selecting the sample
The selection of a sample of families to interview involves a series of steps. You must begin by defining the population
whose characteristics you are trying to estimate. Then you must determine how many families in that group must be
sampled in order to estimate the overall characteristics accurately. Next you must make some allowances for families
who, for whatever reason, you will not be able to interview. And finally you must actually select the families from which
you will try to obtain interviews. This section discusses each of these steps.
Defining the Population
If you are trying to determine the proportion of families in a neighborhood with low- and moderate-incomes, that
neighborhood is the population. However, instead of a neighborhood, the population may be a town, it may be as large as
a county, or it may be defined by some other boundary. Normally for infrastructure projects, it is the possible or existing
customers of the proposed activity/improvements.
Before you can obtain a sample, you must clearly define what area you want the sample to represent. Let us assume here
that the population is a project area that contains about 400 families. You will sample from the 400 families and make
estimates about the income levels of all of the persons in the sample.
Once you have defined your population, you next need a method of identifying the families in that area so that you can
interview them. Ideally, for a given project area, you would have a list of every family living in the neighborhood and
perhaps his or her telephone number or an address. Then you would devise a procedure to randomly select the families
you want to interview. In reality, you probably will not have a list of all of the families in the neighborhood, so you will have
to improvise. One way would be to go to the neighborhood and randomly select which homes to go to for an interview—
the advantage of this method is that the houses are there, so you can go right to them instead of using a list. After
collecting information on the various families, you can then make some estimates about the number of people in the
neighborhood and their incomes.

19
City indexes (if available and up-to-date) usually provide the best source of household information suitable for sampling.
Telephone books may be adequate, but keep in mind that you will miss people without telephones or with unlisted
numbers or only cell phones. Also, telephone directories usually will have far more people listed than those who are in the
service area, so you will need to eliminate those outside of your service area. Tax rolls are a source of identifying
addresses in an area; however, they identify only property owners whereas you are interested in residents. Also, tax rolls
generally identify building addresses, whereas in the case of apartment buildings you are interested in the individual
apartments. You can use tax rolls to identify addresses to go to, in order to get an interview, but you cannot use them as
the basis of a mail or telephone survey (unless you have access to a telephone directory that identifies telephone
numbers by property address).
A great resource for sampling and tracking responses is a map, produced by your project engineer, which shows
topographical features, roads, and the outlines of buildings in the project area. The survey team should number each
known structure that is a residence and a possible customer/beneficiary of the proposed activity. That total of those
residences becomes your survey universe/population, and the identifying numbers are then used as a pool of possible
respondents narrowed down by the random number selection, and those numbers selected are the homes on the map
that are surveyed. You can also do a variable selection by following the map and surveying every 3rd
or 4th home along
the route chosen for each surveyor until you hit your required sample size. This is further discussed below in the ―Drawing
Samples‖ section.
Sample Size
After you have defined your population and selected a method for identifying individual families in the service area, you
must next determine how many families to survey—that is, the sample size. A sample is representative of the population
from which it is selected if its aggregate characteristics closely approximate those same aggregate characteristics in the
population. The larger the sample, the more likely it is that its aggregate characteristics truly reflect those of the
population. However, sample size is not dependent on the size of the population, for large populations. This means that a
random sample of 500 people is equally useful in examining the characteristics of a state of 6,000,000 as it would a city of
100,000 or 50,000. For this reason, the size of the population is irrelevant when it is large or unknown; however, it
becomes relevant when dealing with sparsely populated areas.
Sample Size Calculator (SSC) is a website (www.surveysystem.com/sscalc.htm) developed by Creative Research
Systems to enable survey researchers to calculate sample sizes from various population sizes. To use the SSC you need
both the confidence interval and the confidence level. The confidence interval is the range of values within which a
population parameter is estimated to lie. Confidence interval is sometimes referred to as margin of error (+ or –).
The Sample Size Confidence Level Table is provided as Table C on the following page.
After determining your sample size, you may use the Research Randomizer form (www.randomizer.org/form.htm) to
obtain a truly random sample for your survey.
20
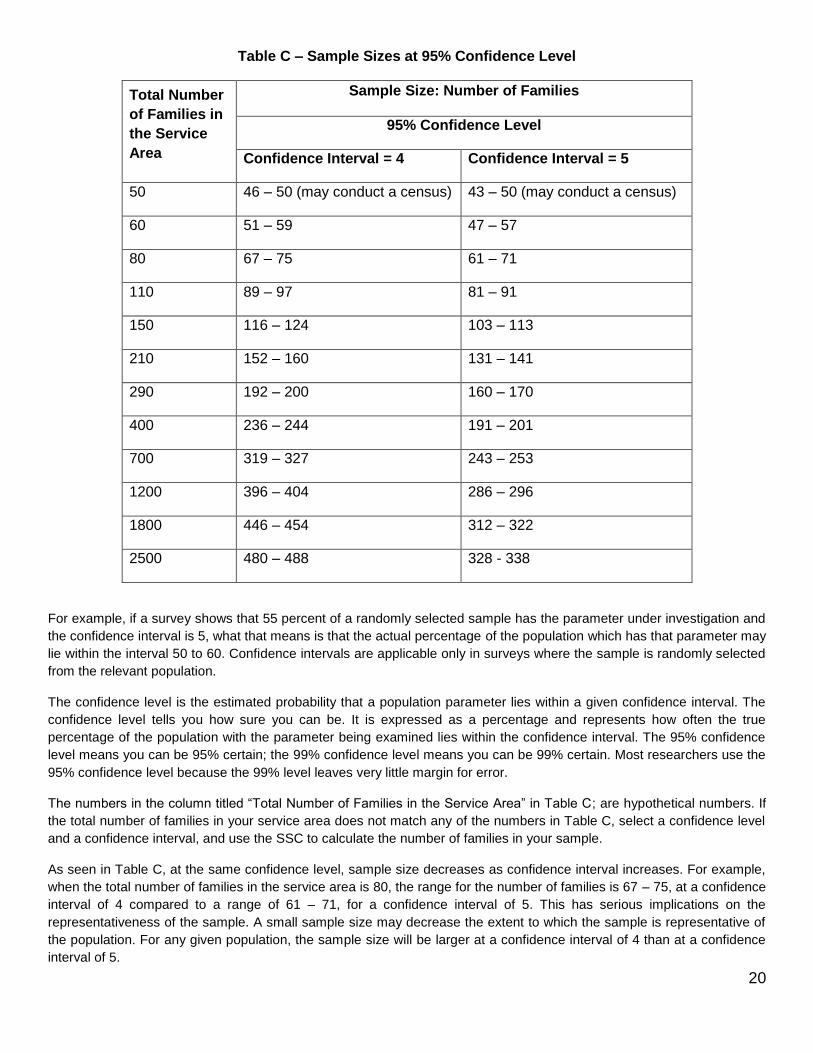
Table C – Sample Sizes at 95% Confidence Level
Total Number
of Families in
the Service
Area
Sample Size: Number of Families
95% Confidence Level
Confidence Interval = 4 Confidence Interval = 5
50 46 – 50 (may conduct a census) 43 – 50 (may conduct a census)
60 51 – 59 47 – 57
80 67 – 75 61 – 71
110 89 – 97 81 – 91
150 116 – 124 103 – 113
210 152 – 160 131 – 141
290 192 – 200 160 – 170
400 236 – 244 191 – 201
700 319 – 327 243 – 253
1200 396 – 404 286 – 296
1800 446 – 454 312 – 322
2500 480 – 488 328 - 338
For example, if a survey shows that 55 percent of a randomly selected sample has the parameter under investigation and
the confidence interval is 5, what that means is that the actual percentage of the population which has that parameter may
lie within the interval 50 to 60. Confidence intervals are applicable only in surveys where the sample is randomly selected
from the relevant population.
The confidence level is the estimated probability that a population parameter lies within a given confidence interval. The
confidence level tells you how sure you can be. It is expressed as a percentage and represents how often the true
percentage of the population with the parameter being examined lies within the confidence interval. The 95% confidence
level means you can be 95% certain; the 99% confidence level means you can be 99% certain. Most researchers use the
95% confidence level because the 99% level leaves very little margin for error.
The numbers in the column titled ―Total Number of Families in the Service Area‖ in Table C; are hypothetical numbers. If
the total number of families in your service area does not match any of the numbers in Table C, select a confidence level
and a confidence interval, and use the SSC to calculate the number of families in your sample.
As seen in Table C, at the same confidence level, sample size decreases as confidence interval increases. For example,
when the total number of families in the service area is 80, the range for the number of families is 67 – 75, at a confidence
interval of 4 compared to a range of 61 – 71, for a confidence interval of 5. This has serious implications on the
representativeness of the sample. A small sample size may decrease the extent to which the sample is representative of
the population. For any given population, the sample size will be larger at a confidence interval of 4 than at a confidence
interval of 5.

21
Unreachables and Other Nonresponses
The standard requirements for conducting surveys include not only the notion that systematic, representative sampling
methods be used, but also that high response rates be obtained and statistical weighting procedures be imposed to
maximize representativeness. No matter what you do, some families will not be home during the time you are
interviewing, some probably will refuse to be interviewed, some will terminate the interview before you finish, and some
will complete the interview but fail to provide an answer to the key question on income level. If you choose to get
responses from replacements, they must be selected through a random sampling process. The decision to get responses
from replacements may become inevitable if the proportion of non-responses is high enough to affect the validity of the
results of the survey. Non-response rates greater than 20 percent may affect the validity of the survey; for example, a
non-response rate can become a serious problem when a census is conducted instead of a survey (as may the case in
sparsely populated areas). If the non-response rate is too high, there is the risk of not having enough LMI respondents to
make the required percent of the total population of the service area.
Drawing Samples
In sampling, you are looking at a portion of everyone in a group and making inference about the whole group from the
portion you are observing. For those inferences to be most accurate, everyone who is in the group should have an equal
chance of being included in the sample. For example, if you are sampling from a list, using a random numbers table will
provide you with a random sample—see instruction at Appendix A and numbers at the Table in Appendix B. In using a
random-numbers table, you take a list of your population and draw from it according to the table. If, for example, the first
three random numbers were 087, 384, and 102, then you would go through your population list or numbered project area
map and target the 87th, 384
th, and 102
nd families for an interview.
If your sample size is less than 384, you should skip ‗384‘ and go to the next number in the Table. Continue until you have
achieved the desired sample size. If you encounter unreachables, you should replace them with the next family in the list,
in the order they were selected. For example, if you draw a list of 300 families in an effort to obtain 250 interviews, the first
family you write off as unreachable should be replaced with the 251st
family.
If you do not have a list of all the families in a service area you are trying to measure, but you know the geographic
boundaries of the area, you might randomly select a point at which to start and proceed systematically from there. In the
hypothetical 400-family service area, in trying for 250 interviews, you would need to interview every 1.6th
family (400
divided by 250) in order to cover the entire neighborhood. In whole numbers, this works out to about 2 of every 3 families.
Therefore, you could start at one end of the neighborhood and proceed systematically through the entire neighborhood
trying two doors and then skipping one. A family that is skipped may be used as replacement for any family selected but
for which an interview is not possible. If the sample size allows for systematic selection of one out of every six families for
interview, begin by randomly selecting any number from one to six; use that family as the starting point for the interview
and from there select the every sixth family for interviewing. If the sixth family is unreachable, you could use the third
family within the count as replacement.
You will achieve more accuracy if you are not too quick to write off a family as unreachable. You are more likely to
achieve randomness if you obtain interviews from the families you selected first. Thus, if you are doing a door-to-door
survey, you probably should make two or more passes through the area (preferably at different times) to try to catch a
family at home. Frequently they will be busy, but may say that they can do the interview later—you should make an
appointment and return. Only after at least two tries or an outright refusal should a sampled family be replaced. With a
telephone survey, at least three or four calls should be made before replacing a family.

22
Step 4: Conducting the survey
To carry out the survey, you have to reproduce a sufficient number of questionnaires, recruit and train interviewers,
schedule the interviewing, and develop procedures for editing, tabulating, and analyzing the results.
Publicity
To promote citizen participation it may be worthwhile to arrange advance notice. A notice in a local newspaper or
announcements at churches or civic organizations can let people know that you will be conducting a survey to determine
the income levels of the area. Moreover, if you let people know in advance how, why, and when you will be contacting
them, usually they may be more likely to cooperate.
As with all aspects of the survey and questionnaire, any publicity must be worded so that it does not bias the results. For
example, it is better to say that the community is applying for a CDBG - Small Cities Grant and that, as part of the
application, the community has to provide current estimates of the incomes of the residents of the service area. It is not
appropriate to say that, in order for the community to receive the desired funding, a survey must be conducted to show
that most of the residents of the service area have low and moderate incomes.
Interviewers
It may not be necessary to hire professional interviewers. Volunteers from local community groups and civic organizations
serve well. Also, schools or colleges doing courses on civics, public policy, or survey research may be persuaded to assist
in the effort as a means of providing students with practical experience.
It is best if interviewers are chosen that make the respondents feel comfortable. When interviewers are of the same race
and social class as the respondent, the survey usually generates a better response rate and more accurate results. It is
important that the interviewer commands the attention of the respondent, reads the questions as they are written, and
writes down the responses as given. Community volunteers from the project area have an incentive to be sure the survey
is completed, however these groups are perhaps the most important to emphasize that bias or leading questions are not
appropriate and can prejudice the survey results.
It is important that interviewers have all of the materials they need to complete the interview. Usually, you will want to
assemble an interviewer kit that can be easily carried and includes all of the important materials such as:
• A 3-ring notebook (this may even have the logo of the organization conducting the survey)
• Map of the service area
• Sufficient copies of the survey instrument
• Official identification (preferably a picture ID)
• A cover letter from the sponsor of the survey
• A phone number the respondent can call to verify the interviewer‘s authenticity.
Contact and Follow-Up
Interviewers should plan to contact respondents at a time when they are most likely to get a high rate of response.
Telephone interviews are usually conducted early in the evening when most people are home. Door-to-door interviews
also may be conducted early in the evening (especially before dark) or on weekends. You should try again, at a different
time to reach anyone in the initial sample who is missed by the initial effort.
In general, you should know the best times residents of your community can be reached—avoid selecting interview times,
which risk yielding biased results. For example, interviewing only during the day, from Monday to Friday, will probably
miss families where both the husband and wife work. Since these families may have higher incomes than families with

23
only one employed member, your timing may lead to the biased result of finding a high proportion of low-and moderate-
income households.
In making contact with a member of the family, the interviewer first has to determine that the person being interviewed is
of sufficient knowledge and competence to answer the questions being asked. The interviewer thus should ask to speak
to the head of the family. If it is absolutely necessary to obtain an interview at the sample residence, the interviewer may
conduct an interview with other resident adults or children of at least high school age only after determining that they are
mature and competent enough to provide accurate information.
As part of your questionnaire, develop an introduction to the actual interview. This should be a standard introduction in
which the interviewers introduce themselves, identify the purpose of the survey, and request the participation of the
respondents. Usually, it is also a good idea to note the expected duration of the interview—in this case, to let respondents
know that the burden to them will be minimal.
Interviewers also should follow the set procedures for replacing ―unreachables‖ (discussed in step 3). If they must write off
an interview, they should not say, ―I was refused an interview here, so I‘ll go over there where I think I can get an
interview.‖ This replacement procedure is not random and thus will affect the validity of your survey results.
The Interview
Every interview includes some common components. There is the introduction where the interviewer is invited into the
home and establishes a rapport that facilitates the process of asking questions. Perhaps the most important factor is your
initial appearance. The interviewer needs to dress professionally and in a manner that will be comfortable to the
respondent. The way the interviewer appears initially to the respondent sends simple messages—that you are
trustworthy, honest, and non-threatening.
You are standing at the doorstep and someone has opened the door, even if only halfway. You need to smile and be brief.
State why you are there and suggest what you would like the respondent to do. Don‘t ask—suggest what you want. For
example, instead of saying ―May I come in to do an interview?‖ you might try a more imperative approach like ―I‘d like to
take a few minutes of your time to interview you for a very important study.‖
Without waiting for the respondent to ask questions, introduce yourself. Memorize this part of the process so you can
deliver the essential information in 20-30 seconds at most. State your name and the name of the organization you
represent. Show your identification badge and the letter that introduces you. If you have a three-ring binder or clipboard
with the logo of your organization or sponsor, you should have it out and visible.
If the respondent indicates that the interview should go ahead immediately, offer an opening sentence that describes the
study. Keep it short and simple and avoid long, complicated descriptions. Use the questionnaire carefully but informally.
Interviewers should read the questions exactly as they are written. If the respondent does not understand the question or
gives an unresponsive answer, it usually is best for the interviewer to just repeat the question. Do not attempt to guide the
respondent to give particular responses. Questions should be read in the order in which they are written. The
respondents‘ answers should be recorded neatly, accurately, and immediately as they are provided. At the end of the
interview, and before proceeding to the next interview, the interviewer should always do a quick edit of the questionnaire
to be sure that they have completed every answer correctly. This simple check helps to avoid the frustrating mistake of
having taken the time and expense of conducting the interview, but without getting the information sought.
If you elect to include other questions and if you place the questions on income at the end, it is possible that a willing
respondent will end the interview before you get to the critical question. If it appears to the interviewer that the
respondent is about to terminate the interview, it is recommended that you immediately try to get an answer to
the critical income question(s).

24
Editing
Interviewers should turn their completed surveys over to the person who will tabulate and analyze the data. That person
should review each survey to ensure that it is complete and that each question is answered only once and in a way that is
clear and unambiguous. Questions or errors that are found should be referred to the interviewer for clarification. It also
may be desirable to call the respondent, if necessary, to clarify incomplete or ambiguous responses. If a question or an
error cannot be resolved, a replacement should be added and the new respondent contacted. Note that editing is an
ongoing process because even after you have started to tabulate or analyze the data, you may come across errors that
need correction.
Step 5: Determining the Results
After the data is collected and edited, add the numbers. It is useful to think of this in two parts:
(1) Tabulating the responses from the questionnaires and calculating an estimated proportion of low-and moderate-
income persons; and
(2) Determining how accurate that estimate is. The first part can be taken care of by completing the Low-and Moderate-
Income Worksheet included with this guide.
Tabulation
Computer programs such as Excel, Access, Minitab, SAS, and SPSS are easy to use for tabulating data. The computer
also makes it relatively easy to check for accuracy and consistency in the data. However, you can perform the
calculations by hand or with a calculator. Also, you can process the data by putting it on a code sheet, by entering it on a
manual spreadsheet, or just by flipping through the completed surveys. Regardless of how you process and tabulate the
data, when you are finished you should be able to complete the.
The Low-and Moderate Income Worksheet is provided as Table D on the following page.

25
Table D - Low- and Moderate-Income Worksheet
LOW AND MODERATE INCOME WORKSHEET
PART A. INFORMATION CONTAINED IN YOUR SURVEY RESPONSES
1.
Total number of families in the activity service area
1. 5
2. Total number of families contacted. (include not reachable, refused to answer,
incomplete interview/questionnaire) 2. 5
3. Total number of families responding to this survey 3. 5
4. Percent response rate (Item divided by Item 1). 4. 100.00%
5. Total number of low- and moderate-income families. 5. 4
6. Total number of persons living in the low- and moderate-income families 6. 8
7. Total number of families in which the income was above the low-and moderate-income level.
7. 1
8. Total number of persons living in the families in which the income was above the low-and moderate-income level. 8. 2
PART B. CALCULATIONS BASED ON DATA CONTAINED IN SURVEY RESPONSES
9. Average size of the low-mod families.
Divide line 6 by line 5 9. 2.00
10. Average size of non-low-mod families. Divide Line 8 by Line 7 10. 2.00
11. Proportion of families that have low- and moderate-incomes. Divide Line 5 by Line 3 11. 80.00%
12. Proportion of families that do not have low-moderate incomes. Divide Line 7 by Line 3 12. 20.00%
13. Estimate of total low-mod families in activity service area. Multiply Line 1 by Line 11 13. 4.00
14. Estimate of total non-low-mod families in activity service area. Multiply Line 1 by Line 12 14. 1.00
15 Estimate of total number low-mod persons in activity service area. Multiply Line 9 by Line 13 15. 8.00
16 Estimate of total number non-low-mod persons in activity service area. Multiply Line 10 by Line 14. 16. 2.00
17. Estimate of the total number of persons in activity area. Add Line 15 and Line 16 17. 10.00
18. This is the estimated percentage of persons in your activity service area who have low- and moderate-incomes. Divide Line 15 by Line 17, multiply results by 100
18. 80.00%
Dates the Survey was Performed

26
Analysis
If you have done everything correct, including random selection of the required number of families, and your estimate
shows that less than 51 percent of the residents of the service area have low- and moderate-incomes, you cannot
undertake LMI area benefit activities in that area.
If the entry at Line 17 is at least 51 percent, you can perform additional analyses to determine the extent to which your
estimate of the low- and moderate-income residents is correct. First, compare the average size of low- and moderate-
income families with non-LMI families. The closer these figures are to each other, the more confident you can be in your
estimate. Thus, if you estimate that 53 percent of the residents have low- and moderate-incomes and you find in your
sample that both low- and moderate-income families and above low- and moderate-income-families have an average of
3.4 people, you can be pretty sure that your results are reliable.
Table E – Comparing the Distribution of Family Size by Family Income
Number of
Persons in
Family
Families With Low-Mod Incomes Families Above Low-Mod Incomes
Number Percent Number Percent
One
Two
Three
Four
Five
Six
Seven
Eight
Nine or more
Total 100% 100%
A second simple calculation is to arrange your data into a table such as that shown in Table E. This table enables you to
compare the distribution of family sizes of families of low- and moderate-incomes with those that are above low- and
moderate-incomes. In completing Table E, you would count the number of low- and moderate-income families in your
survey that have just one person and enter the figure under ―number‖ across from ―one.‖ You would proceed to enter the
number of low- and moderate-income families with two persons, with three persons, and so forth through the ―nine or
more‖ category. Adding up all the entries in this column, you enter the sum across from ―total‖ which will be the total
number of low- and moderate-income families from which you obtained interviews. Then considering families that are
above low- and moderate-income levels, you follow the same procedures to complete the ―number‖ column for them. For
each income group, divide the number of one person families by the total number of families in that income group and
multiply it by 100, to yield the percent of that group that are in one-person families. Fill in the ―percent‖ columns, using this
procedure. Each of the percent columns should total to 100 or so allowing for rounding errors.
Upon completion of Table E, compare the percentages of LMI respondents with the percentages of the above LMI
respondents for each family size. The more similar the two distributions are, the greater the degree of confidence you can

27
have in your estimate of the proportion of persons with low- and moderate-incomes. For example, if among your low and
moderate-income group, 10 percent have one person, 40 percent have two persons, and 50 percent have three persons,
and among your above low- and moderate-income group 12 percent have one person, 41 percent have two persons, and
47 percent have three persons, you would have a great deal of confidence in your estimate.
Compare your survey results to the most recent LMISD (www.hud.gov/offices/cpd/systems/census/wv/) for the census
geography that most closely matches the service area. If there is a big difference (e.g., LMISD = 29%, survey = 55%),
then there may be other known factors to explain the difference. For example, there may have been a major economic
downturn in the service area since the last ACS/census or the service area may be only a small part of a large census
tract. Also, compare the block-group level data to ascertain that there were no anomalies in one part of town versus
another; review the map of respondents versus block groups to make sure the responses were not skewed toward one
side of town. Carefully analyze each scenario and make efforts to document the basis for any discrepancy.
Consider the scenario where you estimate that 51 percent of the residents have low- and moderate-incomes. You
examine the distribution of the family sizes according to Table D and find that in your sample 100 percent of your low- and
moderate-income group has just one person per family and 100 percent of your ‗above low- and moderate-income‘ group
has nine or more persons (this would be an exceptional neighborhood).
Third, after completing data collection, non-respondents should be analyzed to determine that they were reasonably
random. For example, you may want to tabulate the rate of response by street or block in the service area to see whether
there are notable gaps in the coverage of your survey. You may want to examine the racial or ethnic background of your
respondents (if your survey collected such information) and compare them with what you supposed the distribution to be.
If you do not detect any major gaps in the coverage of your sample or any anomalies in the characteristics of your non-
respondents, you can be more certain of the accuracy of your estimates.
Step 6: Documenting Your Results
It is important that the results of the survey be documented, since those who audit or evaluate your program may want to
review the procedures and data used to determine that the service area qualifies under the CDBG - Small Cities program
regulations. You should therefore maintain careful documentation of the survey. The contents of that documentation are
as follows:
1. Keep the completed surveys. This will show that you actually did the survey and that you asked the proper questions.
It is best if each survey has a cover sheet containing information that identifies the respondent, such as name,
address, and telephone number. Then, when the survey is complete, the cover sheets can be separated from the
questionnaires. You can save the questionnaires as documentation of your work, but you maintain the privacy of your
respondents.
2. Saving the cover sheets separately provides a record of who was contacted. If anyone wanted subsequently to verify
that you have not made up that data, they could contact some of the respondents noted on the cover sheet and ask
them whether, in fact, they have been contacted on such-and-such a date by such-and-such a person to discuss
matters related to community development. The privacy of their original responses still is protected by this procedure.
3. Keep a list of the actual families sampled. This might be one list with the sampled families checked once if they were
sampled, and checked twice if they were interviewed. Replacement families should be noted. There should be written
documentation about the method you used to select families from the list for interviewing. Note that this is different
from keeping just the cover sheets, since it documents not just who was interviewed, but also who was not
interviewed and how interviewees were selected. If a door-to-door sample was conducted without starting from a
universe, document the procedures used to select the sample, including instructions to interviewers for replacing
sampled families who were not interviewed.
4. Survey data should be retained in accordance with record-keeping requirements of the CDBG – Small Cities program
at 24 CFR 570.490. Keep a backup disk of your data. If you do your tabulations on spreadsheets, retain the

28
spreadsheets. If you just read through the questionnaires and count up responses and enter them into a table as you
go, keep the tables with the raw data counts.
Appendix A – Using Random Numbers Table
This appendix shows four examples of how numbers can be randomly drawn from a table. Numbers can be drawn
vertically, horizontally or diagonally using any column or combination of columns. Examples 1 – 4 show how random
numbers can be drawn from the table in Appendix B. The numbers on the first column of the Table in Appendix B denote
row numbers, 1 to 19, they are labels only. (The numbers used in Examples 1 to 4 are for illustration only).
Example 1 – Drawing a Sample of 5 of 10
Assume that you have a listing of 10 families and you want to draw a random sample of 5 families. Find the number ―53‖
in the upper left-hand corner—column 2, row 1. Start with the first digit of the first five numbers in column 2 and you will
have the following numbers: ―5,‖ ―6,‖ ‖9,‖ ‖1,‖ and ―3.‖ So from the list of 10 families, the sample of five would include the
fifth, sixth, ninth, first, and third family.
Example 2 – Drawing a Sample of 5 of 100
Start at ―31‖ in the lower left-hand corner of the table (column 2, row 19) and work across the bottom row; the numbers
are ―31,‖ ‖6,‖ ‖46,‖ ‖39,‖ and ―27.‖ From the list of 100 families, our sample would include the 31st, 6
th, 46
th, 39
th, and 27
th
families on the list.
Example 3 – Drawing a Sample of 5 of 30
Start at the upper left-hand corner and begin with the ―53‖ (column 2, row 1) and work across. The numbers in order are
―53,‖ ―95,‖ ―67,‖ ―80,‖ ‖79,‖ ‖93,‖ ‖28,‖ ‖69,‖ and ―25.‖ The problem here is that you are sampling from a population of 30 so
any number above 30 must be skipped. Except for 28 and 25, the rest of the numbers are greater than 30. Keep skipping
until you find a number in your range. Here you would sample the 28th
and 25th
family on your list and continue until you
find three more (which would be the 13th, 24
th, and the 21
st).
Example 4 – Drawing a Sample of 5 of 300
Start again with ―53‖ (column 2, row 1) in the upper left-hand corner. Disregard the first digit (i.e.,‘5‘) and take the second
digit (‗3‘); combine this with the number in column 3, row 1 (‗95‘); this will make it ―3 95.‖ Since we need a three-digit
number to cover the size of our service area, we can use these three (or any three columns—each number is random).
Reading from the ―3 95,‖ we see ―3 95,‖ ―2 12,‖ ―0 16,‖ and ―0 59.‖ From the list of 300 families, then, you would take the
212th, 16
th, and the 59
th families (as well as how many more you need—the next two would be the 217
th and the 60
th).

29

30
Bibliography
Babbie, Earl R. 1990. Survey Research Methods (Sociology), 2nd
Edition. Belmont, CA: Wadsworth Publishing Company.
Floyd, J. and Fowler Jr. 1995. Improving Survey Questions: Design and Evaluation (Applied Social Research Methods). Thousand Oaks, London, New Delhi: SAGE Publications.
Floyd, J. and Fowler Jr. 2001. Survey Research Methods (Applied Social Research
Methods), 3rd
Edition. Thousand Oaks, London, New Delhi: SAGE Publications.
Miller, Delbert C. and Salkind, Neil J. 2002. Handbook of Research Design: Social Research
Measurement, 6th
Edition. Thousand Oaks, London, New Delhi: SAGE Publications.
Nardi, Peter M. 2002. Doing Survey Research: A Guide to Quantitative Research
Methods, 1st
Edition. Boston, MA: Allyn & Bacon.
Rea, Louis M. and Richard A. Parker. 1997. Designing and Conducting Survey
Research: A Comprehensive Guide, 2nd
Edition, (Jossey Bass Public Administration Series). San Francisco, CA: Jossey-Bass Publishers.
Singleton Jr., Royce A.; Straits, Bruce C. and Straits, Margaret Miller. 1993. Approaches to
Social Research, 2nd
Edition. New York, NY: Oxford University Press.

31
SAMPLE
CERTIFICATION OF AREA INCOME ELGIBILITY
(To be used by applicants submitting an income survey as the basis for demonstrating low/mod benefit)
I certify that a family income survey was performed for the activity service area on date(s) of survey
to determine the percentage of low and moderate - income residents, based on the YEAR HUD income limits.
A description of the survey methodology (sample size and survey collection method, etc.), a copy of the survey
form used, and the low and moderate – income worksheet are attached.
The survey was carried out in conformance with the fiscal year ______ state income survey guidelines
and to the best of my knowledge, the results of the income survey are true and correct, and are an accurate
reflection of current economic conditions in the activity service area.
__________________________________________________ Signature of Authorized Official - Date
Please submit on Applicant Letterhead