independent and stochastic action of dna...
TRANSCRIPT
Article
Independent and Stochastic Action of DNA
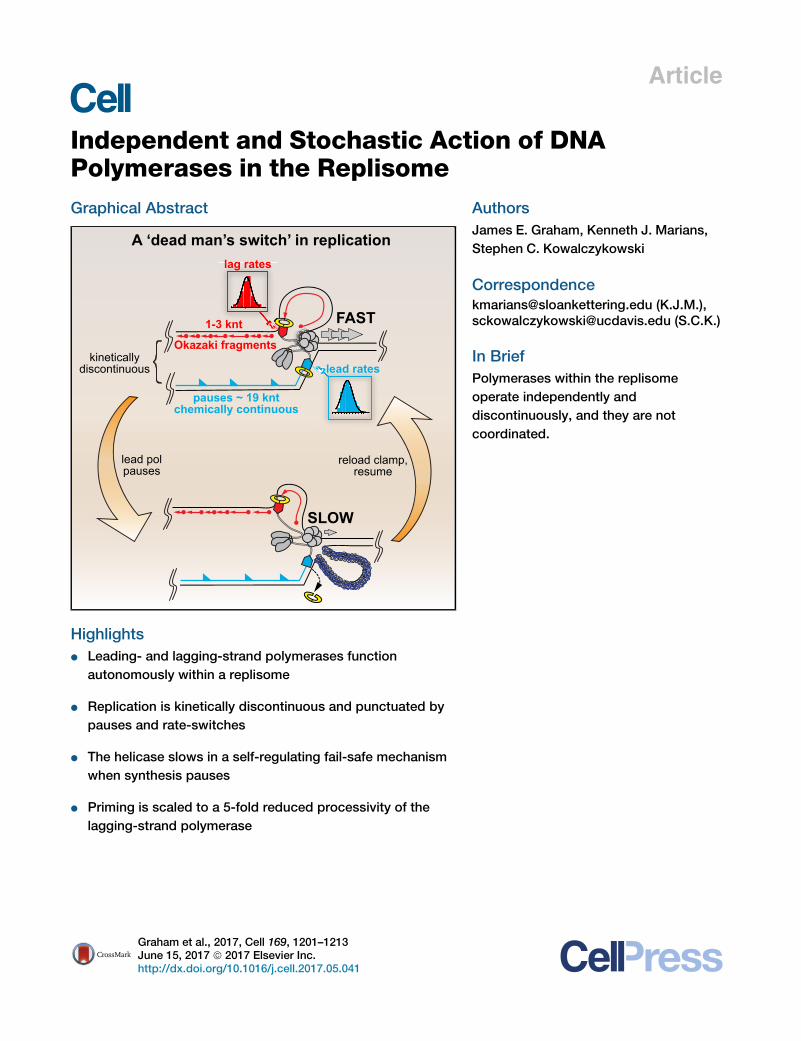
Polymerases in the ReplisomeGraphical Abstract
pauses ~ 19 kntchemically continuous
lag rates
lead rates
Okazaki fragments
1-3 knt
kineticallydiscontinuous
lead polpauses
{
reload clamp,resume
A ‘dead man’s switch’ in replication
SLOW
FAST
Highlights
d Leading- and lagging-strand polymerases function
autonomously within a replisome
d Replication is kinetically discontinuous and punctuated by
pauses and rate-switches
d The helicase slows in a self-regulating fail-safe mechanism
when synthesis pauses
d Priming is scaled to a 5-fold reduced processivity of the
lagging-strand polymerase
Graham et al., 2017, Cell 169, 1201–1213June 15, 2017 ª 2017 Elsevier Inc.http://dx.doi.org/10.1016/j.cell.2017.05.041
Authors
James E. Graham, Kenneth J. Marians,
Stephen C. Kowalczykowski
[email protected] (K.J.M.),[email protected] (S.C.K.)
In Brief
Polymerases within the replisome
operate independently and
discontinuously, and they are not
coordinated.

Article
Independent and Stochastic Actionof DNA Polymerases in the ReplisomeJames E. Graham,1,3 Kenneth J. Marians,2,* and Stephen C. Kowalczykowski1,4,*1Department ofMicrobiology andMolecular Genetics andDepartment ofMolecular andCellular Biology, University of California, Davis, Davis,
CA 95616, USA2Molecular Biology Program, Memorial Sloan Kettering Cancer Center, 1275 York Avenue, New York, NY 10065, USA3Present address: Oxford Nanopore Technologies, Edmund Cartwright House, 4 Robert Robinson Avenue, Oxford Science Park,
Oxford OX4 4GA, United Kingdom4Lead Contact
*Correspondence: [email protected] (K.J.M.), [email protected] (S.C.K.)http://dx.doi.org/10.1016/j.cell.2017.05.041
SUMMARY
It has been assumed that DNA synthesis by theleading- and lagging-strand polymerases in thereplisome must be coordinated to avoid the forma-tion of significant gaps in the nascent strands. Usingreal-time single-molecule analysis, we establishthat leading- and lagging-strand DNA polymerasesfunction independently within a single replisome.Although average rates of DNA synthesis on leadingand lagging strands are similar, individual trajec-tories of both DNA polymerases display stochas-tically switchable rates of synthesis interspersedwith distinct pauses. DNA unwinding by the replica-tive helicase may continue during such pauses, buta self-governing mechanism, where helicase speedis reduced by �80%, permits recoupling of poly-merase to helicase. These features imply a more dy-namic, kinetically discontinuous replication process,wherein contactswithin the replisome are continuallybroken and reformed. We conclude that the stochas-tic behavior of replisome components ensures com-plete DNA duplication without requiring coordinationof leading- and lagging-strand synthesis.
INTRODUCTION
The Escherichia coli genome is replicated at�650 bp,s�1 in vivo
(Pham et al., 2013) by a replisome comprising at least 13 distinct
polypeptides. The hexameric helicase DnaB, which translocates
50/30 on the lagging-strand template, unwinds DNA at the repli-
cation fork. DNA synthesis is catalyzed by two core polymerases
(Dohrmann et al., 2016), whose activities are inferred to be coor-
dinated. Core polymerase (aεq) is poorly active and requires the
b-clamp (‘‘b’’; a dimer of DnaN), topologically linked aroundDNA,
for processive synthesis. The clamp-loader complex (t2gddʹcc)places b on the 30 terminus of primer-template junctions. The
t subunit of the clamp loader organizes the helicase, core poly-
merases, and clamp-loader into a single complex, permitting the
rapid and concomitant replication of both parental strands.
DNA must be replicated completely and faithfully so that large
ssDNAgaps are not left thatmight destabilize the genome. Lead-
ing- and lagging-strand synthesis proceed in overall opposite
net directions. ‘‘Okazaki fragments’’ (OFs), 1–3 kb fragments
synthesized discontinuously on the lagging strand, are extended
and ligated behind the replisome to yield a continuous duplex
(Okazaki et al., 1967). Each OF is initiated by the synthesis of a
short RNA primer by primase (DnaG) that is extended by core
polymerase complexed with b; b is used stoichiometrically for
the synthesis of each OF. Primase thus governs the periodicity
of lagging-strand synthesis, with OF length inversely correlated
with primase concentration (Wu et al., 1992a). This model
suggests that one polymerase replicates each strand exclu-
sively, requiring the lagging-strand polymerase to cycle from
one primer to the next upon OF completion. For lagging-strand
synthesis to proceed without leaving large gaps, the distance
between priming events must therefore be less than the mean
polymerase processivity.
One would expect two biochemically identical core polymer-
ases to extend DNA at similar rates. However, it has been pro-
posed that lagging-strand synthesis should be faster overall to
accommodate binding of primase to DnaB, synthesis of a primer
and dissociation of primase, loading b, binding of b by core po-
lymerase, and primer extension to complete the OF (Georgescu
et al., 2014; Pandey et al., 2009; Selick et al., 1987; Wu et al.,
1992a). If not, then such slow steps would require a delay of
the leading-strand polymerase to accommodate lagging-strand
synthesis. Any model of replication must therefore rationalize
how the leading-strand polymerase does not advance so far
ahead of the lagging-strand polymerase that synthesis by the
two polymerases becomes discoordinated (what has been
termed ‘‘uncoupled’’) (Yeeles and Marians, 2013). Two indepen-
dent proposals are that either (1) lagging-strand synthesis or
primase itself, directly as a ‘‘molecular brake,’’ slows replication
(Lee et al., 2006; Yao et al., 2009) or (2) that the rate of helicase
unwinding is regulated by the polymerase itself (Stano et al.,
2005) should the two become physically separated or function-
ally ‘‘uncoupled.’’
A commonly held view is that leading-strand synthesis is both
continuous and highly processive. However, some evidence
suggests a more dynamic scenario (Duderstadt et al., 2016;
Geertsema et al., 2014; Langston et al., 2009; Yeeles and
Cell 169, 1201–1213, June 15, 2017 ª 2017 Elsevier Inc. 1201
Marians, 2011). The leading-strand polymerase can stall at a
lesion, but DNA unwinding continues, and primase re-primes
the leading strand downstream of the lesion (Yeeles and Mar-
ians, 2011). This mechanism permits rapid lesion bypass without
fork disassembly and restart.
The relationship between leading- and lagging-strand syn-
thesis has been determined in bulk by labeling and separating
the two daughter strands by alkaline gel electrophoresis, which
revealed the roles of proteins and nucleotide concentrations on
lagging-strand synthesis (Wu et al., 1992a; 1992b). However,
ensemble experiments are limited: (1) long product lengths
cannot accurately be measured; (2) without nucleotide bias,
leading- and lagging-strand synthesis at limiting primase con-
centration cannot unequivocally be distinguished; and (3) the
ensemble obscures the activity of single molecules, and tran-
sient events (e.g., stochastic pauses) cannot be observed.
Here, we observe the behavior of single replisomes actively
engaged in DNA replication in real time, using total internal
reflected fluorescence (TIRF) microscopy. We show that single
replisomes containing two core polymerases in the presence
of excess b, single-stranded DNA-binding protein (SSB), and
primase are sufficient to fully duplicate up to �250 kb of DNA.
Synthesis by the core polymerases is unexpectedly dynamic,
with synthesis interspersed with pauses. Though rates of the
leading- and lagging-strand polymerases are similar, the rates
of individual polymerases can vary 10-fold and are changeable.
Leading-strand synthesis by a single replisome proceeds for
�70 kb on average, whereas lagging-strand synthesis is limited
to �14 kb; curiously, leading-strand synthesis is punctuated by
pauses every �19 kb, perhaps reflecting an intrinsic lifetime of
components within the complex that is manifest similarly in
lagging-strand processivity and leading-strand pausing. Overall
processivity of the replication fork is unaffected by the con-
centration and activity of primase, showing that leading- and
lagging-strand polymerases can function autonomously, and
establishing that primase does not regulate polymerization.
Furthermore, helicase speed is regulated in a self-governing
manner to prevent runaway DNA unwinding: upon polymerase
pausing, the helicase reduces its speed by about 80%, but
upon resumptionof synthesis, unwindingand replicationcontinue
at the normal coupled speeds.Wepresent amodel inwhich either
of the polymerases within the replisome acts autonomously in
time and in a stochastic manner.
RESULTS
Establishment of a Rolling-Circle Replication AssayCapable of Distinguishing between Leading- andLagging-Strand SynthesisTo determine rates of leading- and lagging-strand synthesis,
priming, and DNA unwinding during replication, we devised a
rolling-circle assay that is capable of visualizing replication of
both strands, and we observed the products by single-molecule
TIRF microscopy (Figures 1A–1C). The rolling-circle assay
permits continuous monitoring of DNA replication, so proces-
sivity measurements are not limited by template length (Alberts
et al., 1983; Pomerantz et al., 2008; Tanner et al., 2009;
Yao et al., 2009). We used an 8.6 kb template that could be
1202 Cell 169, 1201–1213, June 15, 2017
resolved from the long, duplex tail of the product based on
its size and brightness. A reaction comprising all replisome com-
ponents is shown (Figures 1D–1F). The template, bearing a
50 biotin tail, was adsorbed onto a coverglass via biotin-strepta-
vidin interaction (Figures 1B and 1C). DnaB, DnaC810, Pol III*
[(aεq)2t2gddʹcc], b, three of the four dNTPs, and all four rNTPs
were added to the flow-cell, forming an idling, ‘‘pre-initiation’’
complex (Figure 1C) in which only the leading-strand polymerase
is engaged with b. DnaC810 is a gain-of-function mutant that
bypasses the requirement of PriA for loading DnaB (Xu and
Marians, 2000) and was used to load DnaB on the template.
Excess DnaB, DnaC810, and Pol III* were washed out, and repli-
cation was initiated by introducing primase, b, and SSB in the
presence of all four dNTPs and rNTPs. The replication reactions
were therefore single-turnover with respect to replisomes. On
average, �18% of the template molecules initiated replication
during live observations (N [replicates] = 3; n [molecules] =
650), although the amount varied from 12%–26%. Replication
products were visualized in real time by extension under flow
in the presence of SYTOX Orange, which detects dsDNA, but
not ssDNA,SSB. Figure 1D and Movie S1 show a representative
field in which many circular template molecules—small foci at
the start of reaction—are replicated to yield long products. The
template, at the head of the fork, tracks from left to right in the
direction of flow. All products in this field consisted almost
entirely of duplex DNA, confirming coordinated leading- and lag-
ging-strand synthesis. Three actively extending molecules are
identified in Figure 1D. Frames from videos of each molecule
and kymographs (Figures 1E and 1F) show that the average
rate of fork movement was largely monotonic, although the fine
structure in the trajectories will be addressed below. By tracking
the position of the circle with respect to its anchor position, we
determined the length of the replication product as a function
of time (Figure 1F, magenta, cyan, and green traces). DNA prod-
ucts could be �250 kb in length (Table 1); linear fits to the full
trajectories (n = 84) yielded a Gaussian distribution of rates
with a mean of 470 ± 180 bp,s�1 (± SD) (Figures 1F and 1G).
Primase Is the Only Replication Protein Specific toLagging-Strand SynthesisWenext consideredwhich proteins are specific to lagging-strand
synthesis.We initially analyzed the end products of replication by
performing the reactions as above, omitting key replication pro-
teins in turn without laser illumination under low flow (Figures
S1A–S1D) to reduce the force on the replisome yet replenish pro-
teins and nucleotides. Reactions were quenched after 10 min,
and products were extended for length measurement under
high flow and laser illumination (Table 1 and STAR Methods).
When all proteins were present, the median product length
was 68 kb after 10 min, and virtually all product was duplex (Fig-
ure 2A). However, for some protein dropouts, replication prod-
ucts were short, and when imaged under flow, they appeared
as small foci that were nearly indistinguishable from unreacted
template (e.g., primase omitted, Figure 2A, vi). We used a flow-
cycling method to determine where the products were anchored
(Figure S2 and STARMethods); anchor positions are shown via a
composite image showing the same fields with flow turned off in
cyan and flow-extended molecules in magenta (Figure 2A, ii, iii,

A
C
B
GE
D F
Figure 1. Visualizing Leading- and Lagging-
Strand Synthesis Using a Rolling-Circle Sin-
gle-Molecule Assay
(A) Schematic of TIRF microscope and flow-
channel.
(B) Side-on view, showing surface-attached DNA
replication products.
(C) Cartoon showing assembly and live visualization
of replication. dsDNA is visualized with SYTOX
Orange fluorescent stain.
(D) Micrograph showing products live, �180 s from
start; three extending molecules identified. Scale
bar, 10 mm, equal to 37.0 kb dsDNA at 2,500 ml/hr
(Figure S1).
(E) Time-lapse of three replicating molecules from
(D), showing synthesis with time.
(F) Kymographs of molecules from (D), showing
linear fits to trajectories yielding average rates
of replication fork progression. Arrowheads: non-
replicating substrates.
(G) Histogram of replication rates; mean rate, 470 ±
180 bp,s�1 (molecules, n = 84) from Gaussian fit.
iv, and vi). The lengths of replication products confirmed the
canonical roles for each protein (Wu et al., 1992a) (Table 1).
DNA synthesis was dependent on both DNA unwinding by
DnaB (Figure 2A, ii) and synthesis by Pol III* (Figure 2A, iii).
The three proteins that act distributively—b, SSB, and pri-
mase—affected synthesis in different ways (Figure 2A, iv–vi).
Omission of b did not affect the nascent lagging strand specif-
ically, yielding duplex products; however, products were short,
showing b’s essential role in increasing the processivity of
synthesis by core polymerase on both strands, and the length
of extended products was reduced by 79% to 14 kb (Figure 2A,
iv; Table 1). Omitting SSB reduced the median product length to
�29 kb, suggesting that SSB stimulates DNA synthesis on both
leading and lagging strands, as has been suggested previously
(Georgescu et al., 2014) (Figure 2A, v; Table 1).
Only primase affected lagging-strand synthesis specif-
ically (Figure 2A, vi), as expected from ensemble experiments
(Mok and Marians, 1987; Wu et al.,
1992a). Products generated without pri-
mase consisted of a template anchored
via long tails of ssDNA,SSB to the surface
(Figure 2B). We determined the lengths of
the SSB-ssDNA products produced by
replication of only the leading strand, using
the calibrations in Figures S1E–S1H and
the method of Figure S2. Omitting primase
did not significantly affect the median
product length (�77 knt), although the
product was fully ssDNA (Table 1). Thus,
leading-strand synthesis occurs indepen-
dently of lagging-strand synthesis.
We expected that, because product
lengths were similar in the presence and
absence of primase, the rate of leading-
strand replication would also be indepen-
dent of primase. We therefore monitored
replication in real time under extension (Figure 2B). In these reac-
tions, only leading-strand ssDNA,SSB is produced, so SYTOX
Orange stains only the rolling-circle template, which moves
across the field in the direction of flow. Figures 2C and 2D and
Movie S2 show a composite of video frames at 50 s intervals;
three representative molecules are identified. By tracking the
position of each template molecule, we determined product
lengths as a function of time. Figure 2E shows kymographs
derived from the three molecules identified in Figure 2C and
linear fits to the data to yield rates of leading-strand synthesis.
Overall rates of extension were approximately linear, as per the
reaction containing primase, but were interspersed with occa-
sional pauses and termination events (Figure 2E). The mean
rate of fork progression, from initiation to termination, including
pauses, was 390 ± 130 nt,s�1. Notably, this rate is not signifi-
cantly different from the replication speed in the presence of pri-
mase, 470 ± 180 nt,s�1 (Figure 2F), and the transient pauses are
Cell 169, 1201–1213, June 15, 2017 1203

Table 1. Size Distribution of Products fromComplete Replication
Reaction and when Protein Components Omitted
protein(s)
omitted
OBSERVED PRODUCT LENGTH
SUBSTRATE
UTILIZATION
median total length of molecule
[interquartile range, maximum] n
extended
product (%) n
none 68 kb
[35-110, 246]
1,047 28 427
DnaB,
DnaC810
0a 62a 0 440
Pol III* 0a 28a 0 128
b 14 kb
[10-17, 43.6]
66 4 574
SSB 28.8 kb
[17.9-49.5, 121]
116 7 285
primase 77 knt
[50.1-118, 238]
138 44 159
Median product lengths (total length of leading strand, measured
from anchor to template) ± interquartile range; n, number of molecules
observed.a, no extended products observed.
independent of primase. Thus, we find no evidence for the E. coli
replisome that primase acts as a molecular brake to regulate
synthesis of the leading-strand DNA polymerase, in agreement
with an alternative analysis of the T7 replication system (Pandey
et al., 2009).
We measured the processivities of replisomes from the real-
time imaging experiments of Figures 1D and 2C, judged by the
final lengths of all molecules in a given field after�5min reaction.
There was no significant difference between the processivity dis-
tributions with or without primase included in the flow (median
[interquartile range (IQR)]): 97 [62–110] kb, n = 69; and 88 [62–
118] knt, n = 49; Figure 2G). Processivity was markedly reduced
by the absence of b in the flow (median [IQR]: 21 [7–50] kb,
n = 62), but there was again no significant difference whether
primase was also present in the flow (without primase, median
37 [16–60] knt, n = 53) (Figure 2G). Thus, we find no evidence
that priming the lagging strand affects the speed or the proces-
sivity of the replisome; however, curiously, the continued pres-
ence of b is required to maintain leading-strand synthesis.
The Leading-Strand Polymerase Pauses Stochastically,yet the Helicase Continues Unwinding DNA, albeit MoreSlowlyThe observation of pauses in overall fork progression (Figure 1F)
and leading-strand replication (Figure 2E) led us to further inves-
tigate their mechanism. We focused first on leading-strand repli-
cation only because deconvolution of the data was straight-
forward and, as shown in Figure 2 and below, leading-strand
synthesis was independent of primase. However, as described
below, similar pausing behavior was observed for the lagging-
strand polymerase.
Leading-strand polymerases were seen to stochastically
pause once, several times, or not at all (Figure 3A). By fitting
the trajectories to multi-segment lines, we determined the pause
duration, the amount of DNA synthesized during each burst, and
1204 Cell 169, 1201–1213, June 15, 2017
the ‘‘burst’’ rates for synthesis between pauses. Fits for three
representative molecules (molecules a, b, and c, Figures 2C
and 3A, i), with kymographs derived from the rawdata (Figure 3A,
ii) are shown together with an expanded movie of the same three
molecules (Movie S3). The trajectories show that an individual
DNA polymerase pauses randomly and then resumes synthesis,
although at a different rate; detailed analysis follows.
Next, we considered whether DnaB continues to unwind the
dsDNA ahead of the polymerase during a pause. Unwinding
without synthesis would reduce the fluorescent signal; if synthe-
sis did not restart, DnaB would run off the end of the template,
and replication would terminate (Figure S3A). To reveal unwind-
ing events, we measured the intensity of the template over time,
at the position of the pause, and normalized the maximum inten-
sity observed to intact template (�8.6 kb) to estimate the duplex
content of the template during replication. The intensity traces
exhibited a characteristic sawtooth pattern: a slow monotonic
decrease in fluorescence, often followed by a fast increase
back to the full template intensity (Figure 3A). Overlaying the
unwinding and synthesis trajectories revealed that the unwinding
portion of these patterns initiated upon pausing of leading-
strand synthesis in 90% of cases (62 events). Terminal unwind-
ing events were also observed as leading-strand synthesis
ceased, which we interpret as DnaB runoff (Figure 3A; Movie
S3, molecules a and c). Remarkably, the recovery of fluores-
cence following the slow decrease occurred in 65% of unwind-
ing events during elongation (40/62 events; 67 molecules), e.g.,
Figure 3, molecule b at �320 s. We interpret this as resumption
of fast, leading-strand synthesis following a pause. Pausing was
unaffected by increasing SSB concentration or flow (Figures S3B
and S3C). Thus, the helicase and leading-strand polymerase can
become transiently unsynchronized: unwinding can continue
without synthesis, albeit at a reduced rate. Nevertheless, as we
discuss below, this observation does not necessarily imply that
the two become physically disengaged.
We hypothesized that pauses in leading-strand synthesis
might be caused by polymerase dissociation either from DNA
or b or from stalling. Pauses might be intrinsic to polymerization,
or they might be caused by DNA damage or difficult-to-replicate
secondary structure. If the polymerase were to dissociate from
DNAor b during a pause, resumption of synthesis would presum-
ably require reloading of b at the 30 terminus of the leading strand.
We therefore compared the trajectories of leading-strand-only
replication in the presence and absence of b in the flow (Figures
3B–3E and S3D and Movie S4). We discovered that omission
of b changed the burst rates (the rates of elongation between
detectable pauses) of leading-strand synthesis. Figure 3B shows
the rate distribution for bursts of leading-strand synthesis. With b
present, the distribution is well described by a single Gaussian,
with amean of 510± 190 nt,s�1 (±SD;median, 520 nt,s�1); how-
ever, with b absent from flow, we observed an additional, slower
population of molecules with a mean of 270 ± 90 nt,s�1, in addi-
tion to the fast population of 560 ± 120 nt,s�1 (overall median,
450 nt,s�1). Note that for both distributions, the width of each
Gaussian is much larger than the precision of an individual rate
measurement (e.g., in Figure 3A, the SD for defining an individual
trajectory ranges from ± 3 to ± 29 nt,s�1), revealing intrinsic het-
erogeneity in the synthesis behavior of individual polymerases.
A
B
C
E
D G
F
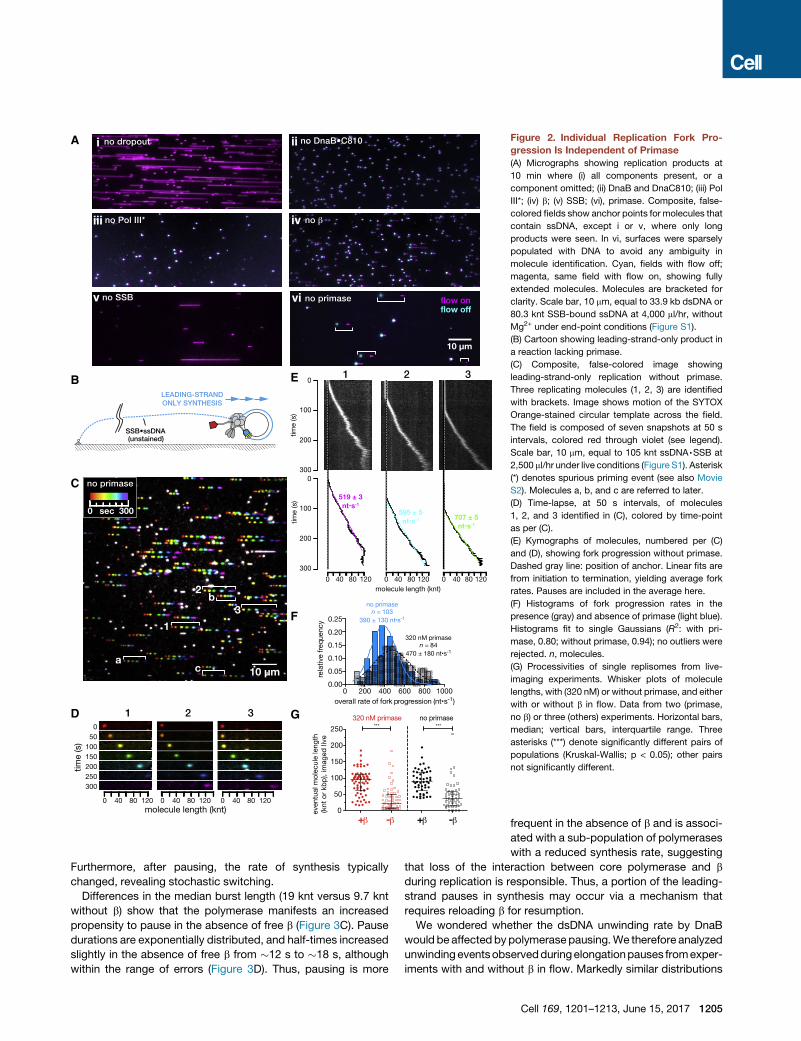
Figure 2. Individual Replication Fork Pro-
gression Is Independent of Primase
(A) Micrographs showing replication products at
10 min where (i) all components present, or a
component omitted; (ii) DnaB and DnaC810; (iii) Pol
III*; (iv) b; (v) SSB; (vi), primase. Composite, false-
colored fields show anchor points for molecules that
contain ssDNA, except i or v, where only long
products were seen. In vi, surfaces were sparsely
populated with DNA to avoid any ambiguity in
molecule identification. Cyan, fields with flow off;
magenta, same field with flow on, showing fully
extended molecules. Molecules are bracketed for
clarity. Scale bar, 10 mm, equal to 33.9 kb dsDNA or
80.3 knt SSB-bound ssDNA at 4,000 ml/hr, without
Mg2+ under end-point conditions (Figure S1).
(B) Cartoon showing leading-strand-only product in
a reaction lacking primase.
(C) Composite, false-colored image showing
leading-strand-only replication without primase.
Three replicating molecules (1, 2, 3) are identified
with brackets. Image shows motion of the SYTOX
Orange-stained circular template across the field.
The field is composed of seven snapshots at 50 s
intervals, colored red through violet (see legend).
Scale bar, 10 mm, equal to 105 knt ssDNA,SSB at
2,500 ml/hr under live conditions (Figure S1). Asterisk
(*) denotes spurious priming event (see also Movie
S2). Molecules a, b, and c are referred to later.
(D) Time-lapse, at 50 s intervals, of molecules
1, 2, and 3 identified in (C), colored by time-point
as per (C).
(E) Kymographs of molecules, numbered per (C)
and (D), showing fork progression without primase.
Dashed gray line: position of anchor. Linear fits are
from initiation to termination, yielding average fork
rates. Pauses are included in the average here.
(F) Histograms of fork progression rates in the
presence (gray) and absence of primase (light blue).
Histograms fit to single Gaussians (R2: with pri-
mase, 0.80; without primase, 0.94); no outliers were
rejected. n, molecules.
(G) Processivities of single replisomes from live-
imaging experiments. Whisker plots of molecule
lengths, with (320 nM) or without primase, and either
with or without b in flow. Data from two (primase,
no b) or three (others) experiments. Horizontal bars,
median; vertical bars, interquartile range. Three
asterisks (***) denote significantly different pairs of
populations (Kruskal-Wallis; p < 0.05); other pairs
not significantly different.
Furthermore, after pausing, the rate of synthesis typically
changed, revealing stochastic switching.
Differences in the median burst length (19 knt versus 9.7 knt
without b) show that the polymerase manifests an increased
propensity to pause in the absence of free b (Figure 3C). Pause
durations are exponentially distributed, and half-times increased
slightly in the absence of free b from �12 s to �18 s, although
within the range of errors (Figure 3D). Thus, pausing is more
frequent in the absence of b and is associ-
ated with a sub-population of polymerases
with a reduced synthesis rate, suggesting
that loss of the interaction between core polymerase and b
during replication is responsible. Thus, a portion of the leading-
strand pauses in synthesis may occur via a mechanism that
requires reloading b for resumption.
We wondered whether the dsDNA unwinding rate by DnaB
would be affected by polymerasepausing.We therefore analyzed
unwindingeventsobservedduringelongationpauses fromexper-
iments with and without b in flow. Markedly similar distributions
Cell 169, 1201–1213, June 15, 2017 1205
A
B C
D E
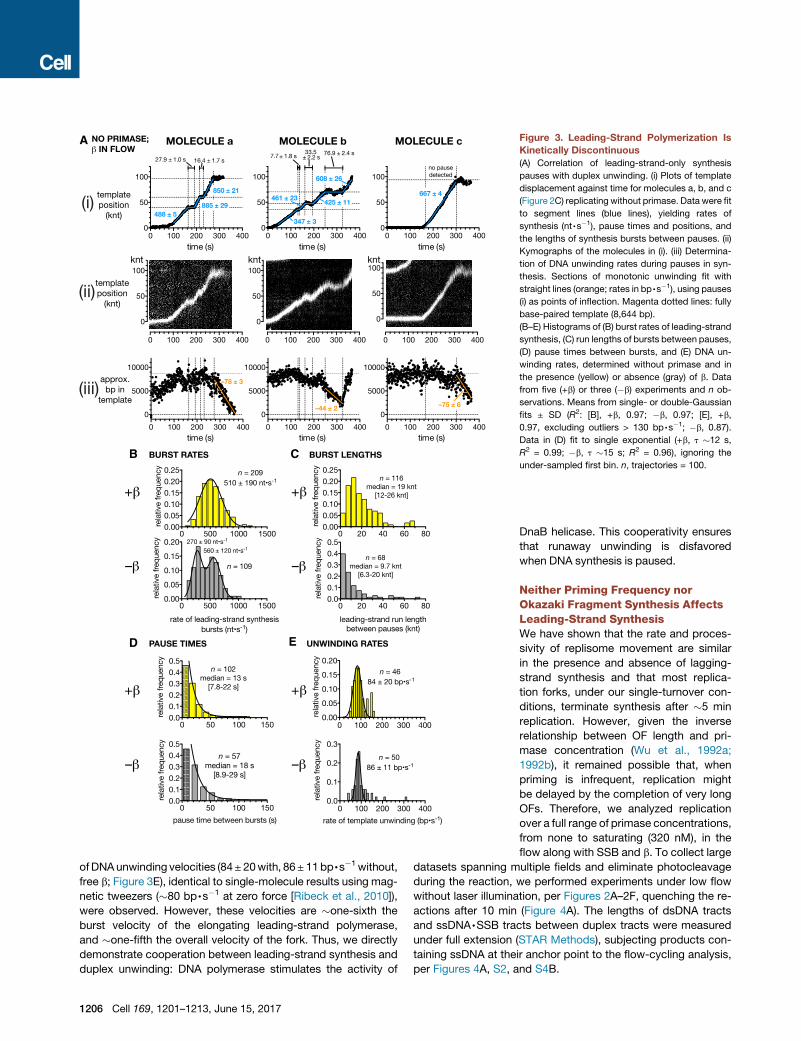
Figure 3. Leading-Strand Polymerization Is
Kinetically Discontinuous
(A) Correlation of leading-strand-only synthesis
pauses with duplex unwinding. (i) Plots of template
displacement against time for molecules a, b, and c
(Figure 2C) replicating without primase. Data were fit
to segment lines (blue lines), yielding rates of
synthesis (nt,s�1), pause times and positions, and
the lengths of synthesis bursts between pauses. (ii)
Kymographs of the molecules in (i). (iii) Determina-
tion of DNA unwinding rates during pauses in syn-
thesis. Sections of monotonic unwinding fit with
straight lines (orange; rates in bp,s�1), using pauses
(i) as points of inflection. Magenta dotted lines: fully
base-paired template (8,644 bp).
(B–E) Histograms of (B) burst rates of leading-strand
synthesis, (C) run lengths of bursts between pauses,
(D) pause times between bursts, and (E) DNA un-
winding rates, determined without primase and in
the presence (yellow) or absence (gray) of b. Data
from five (+b) or three (�b) experiments and n ob-
servations. Means from single- or double-Gaussian
fits ± SD (R2: [B], +b, 0.97; �b, 0.97; [E], +b,
0.97, excluding outliers > 130 bp,s�1; �b, 0.87).
Data in (D) fit to single exponential (+b, t �12 s,
R2 = 0.99; �b, t �15 s; R2 = 0.96), ignoring the
under-sampled first bin. n, trajectories = 100.
ofDNAunwinding velocities (84± 20with, 86± 11bp,s�1without,
free b; Figure 3E), identical to single-molecule results using mag-
netic tweezers (�80 bp,s�1 at zero force [Ribeck et al., 2010]),
were observed. However, these velocities are �one-sixth the
burst velocity of the elongating leading-strand polymerase,
and �one-fifth the overall velocity of the fork. Thus, we directly
demonstrate cooperation between leading-strand synthesis and
duplex unwinding: DNA polymerase stimulates the activity of
1206 Cell 169, 1201–1213, June 15, 2017
DnaB helicase. This cooperativity ensures
that runaway unwinding is disfavored
when DNA synthesis is paused.
Neither Priming Frequency norOkazaki Fragment Synthesis AffectsLeading-Strand SynthesisWe have shown that the rate and proces-
sivity of replisome movement are similar
in the presence and absence of lagging-
strand synthesis and that most replica-
tion forks, under our single-turnover con-
ditions, terminate synthesis after �5 min
replication. However, given the inverse
relationship between OF length and pri-
mase concentration (Wu et al., 1992a;
1992b), it remained possible that, when
priming is infrequent, replication might
be delayed by the completion of very long
OFs. Therefore, we analyzed replication
over a full range of primase concentrations,
from none to saturating (320 nM), in the
flow along with SSB and b. To collect large
datasets spanning multiple fields and eliminate photocleavage
during the reaction, we performed experiments under low flow
without laser illumination, per Figures 2A–2F, quenching the re-
actions after 10 min (Figure 4A). The lengths of dsDNA tracts
and ssDNA,SSB tracts between duplex tracts were measured
under full extension (STAR Methods), subjecting products con-
taining ssDNA at their anchor point to the flow-cycling analysis,
per Figures 4A, S2, and S4B.

A
B
C D E
F G H
Figure 4. Leading- and Lagging-Strand Poly-
merases Function Autonomously
(A) Reaction schematic, with experiments per-
formed under low flow and products examined un-
der high flow at a defined end point.
(B) Micrographs of flow-extended products:
dsDNA stained by SYTOX Orange; black gaps
are ssDNA,SSB. Micrographs are false-colored
magenta or cyan to indicate whether flow was
pulsed on or off (no primase and 2 nM primase),
respectively; molecules are bracketed for clarity.
Cartoons (white) show interpretations of dsDNA
and ssDNA,SSB tracts for one molecule per
panel.
(C and D) Plots of median (horizontal bars) and in-
terquartile range (vertical bars) of (C) total dsDNA
and (D) total ssDNA,SSB per molecule for range of
primase concentrations (R 3 replicates). n, total
number of molecules.
(E) Plot of fraction of total lagging-strand syn-
thesis per total leading-strand synthesis versus
primase concentration; insert shows zoom (repli-
cates, N R 3). Data fit to a rectangular hyperbola:
K1/2 = 9.3 ± 0.9 nM (SE).
(F and G) Plots of median (horizontal bars)
and interquartile range (vertical bars) of (F) indi-
vidual dsDNA tract lengths and (G) individual
ssDNA,SSB lengths from N R 3 replicates, for
range of primase concentrations. n, number of
molecules observed per condition. Asterisk (*)
denotes rare spurious priming events observed at
0 nM primase (n = 8).
(H) Plot of dsDNA and ssDNA,SSB tract
lengths versus primase concentration, expressed
as the mean of population means (replicates,
N R 3, ± SEM).
As primase concentration was reduced from 320 nM to zero,
the duplex content of replication products decreased, but
ssDNA,SSB tract length correspondingly increased (Figures
4B–4D), with half-saturation occurring at 9.3 ± 1.0 nM (± SE)
primase (Figure 4E). We also observed an inverse relation-
ship between the mean lengths of individual dsDNA and
ssDNA,SSB tracts (Figures 4F–4H), which we treat in detail
below. Nevertheless, both the mean total leading-strand length
(the sum of dsDNA and ssDNA,SSB in each product) and
length distributions both remained virtually unchanged with
respect to primase concentration (Figures S4C and S4D).
Thus, the progression of replication forks was unaffected by
the amount of priming and lagging-strand synthesis. To deter-
mine whether primase itself might affect replication in the
absence of priming, catalytic site mutants
(at 320 nM in flow) were tested: D269A,
retaining �3% activity, showed infre-
quent priming; and D269Q, which showed
negligible priming activity (Corn et al.,
2005; Rymer, 2012). However, again, the
mean leading-strand length remained
unchanged (Figure S4E). Thus, combined
with our measurements of fork progres-
sion in the presence and absence of
primase (Figure 2F), we find no evidence that lagging-strand
synthesis slows replication.
Direct Labeling of Okazaki Fragments Reveals PrimingFrequencyIn the above experiments, one dsDNA tract might consist of
several OFs with unresolvable gaps between. We thus deter-
mined the locations and size distributions of Okazaki fragments
in replication end-products (Figure 5A). We pulse-labeled 30
OF termini after 10 min of replication with digoxigenin-dUTP,
imaging the 30 termini with fluorescent a-digoxigenin (STAR
Methods and Table S1). We define priming distance (PD)
as the distance between successive primers (i.e., between
50 ends of successive OFs). Composite, false-colored fields
Cell 169, 1201–1213, June 15, 2017 1207

A
C D E
B
Figure 5. Visualization of Okazaki Fragment
Termini Shows a Direct Relationship between
Primase Concentration and Priming Fre-
quency
(A) Cartoon (top) showing method used to label 30
ends of OFs ends (red wavy lines; middle). Cartoon
(bottom) shows expected product when stained
with SYTOX Orange and labeled with anti-digox-
igenin (Figure S5): magenta, dsDNA tracts; green,
OF 30 termini; blue, anchor points; OF, Okazaki
fragment length; PD, priming distance, which is
defined in the text.
(B) Representative false-colored micrographs
with 4–320 nM primase in flow. dsDNA (magenta),
OF ends (green), and merged images are shown
for each field. Molecules are bracketed for clarity.
One molecule in each field is highlighted and
expanded in (C).
(C) Five magnified molecules from (B), labeled a–e.
(D) Semi-log plot of Okazaki fragment length
against primase concentration. Population means ±
95%confidence intervals (bars); replicates, N = 1 for
R 2 nM primase); N = 2 for 1 nM primase.
(E) Primer utilization (reciprocal of priming distance)
plotted against primase concentration. Data fit
to rectangular hyperbola: KM,app = 17 ± 3 nM (SE).
Error bars: reciprocal of interquartile range of
priming distance.
showing the patterns of dsDNA and 30 OF terminus staining
are shown (Figures 5B and S5; expanded view of five mole-
cules shown in Figure 5C). In these fields, OFs are closely
spaced at high primase concentration but become sparser
as primase concentration is reduced; gaps between OFs
can still be resolved at limiting and intermediate primase
concentration.
Figure 5D shows that OF length varied between 3.0 kb
(range: 1.0–8.1 kb) at 320 nM primase and �19 kb (range:
1.8–80 kb) at 1–2 nM primase. The upper plateau value thus re-
flects the processivity of lagging-strand synthesis. We repre-
sent the activity of primase in terms of primer utilization: the
frequency of primer synthesis (the reciprocal of PD), normal-
ized to unit length. A plot of primer utilization against primase
concentration was hyperbolic (Figure 5E); a Michaelis-Menten
fit returns a KM of 17 ± 3 nM (SE) with no evidence for cooper-
ativity. Assuming the number of primers utilized is proportional
to the number synthesized, this value directly reports the affin-
ity of primase for the replisome. Our KM value is considerably
lower than the previously reported Kd of �1–3 mM between
DnaB and DnaG in isolation (Oakley et al., 2005); our figure
may reflect the stabilizing effect of additional protein-protein
and protein-DNA contacts present in an actively elongating
replisome.
1208 Cell 169, 1201–1213, June 15, 2017
The Median Processivity of Lagging-Strand Synthesis Is ~14 kbThe labeling experiments also revealed
that each tract consists of, on average,
one OF at 1–2 nM primase (Figures 6A
and 6B), whereas > 50% of tracts con-
tained two ormore OFs atR 4 nMprimase.
If each tract contained only one OF, then we can assume that
lagging-strand synthesis terminated owing to the inherent proc-
essivity of the polymerase, rather than any other event such as
either collision with or sensing of the downstream primer. We
therefore pooled all dsDNA tract lengths from end-point experi-
ments conducted at 1–2 nM primase (from Figure 4), rejecting
OFs abutting the anchor point. The median length was 13.6 kb
(n = 422; Figure 6C). We also report the median OF length from
the OF labeling experiments above at 1–2 nM primase (Fig-
ure S6A), which are in close agreement, at 17.8 kb (n = 62). These
figures are remarkably similar to the burst distances between
pauses on the leading strand measured from the live-imaging
experiments lacking primase (Figure 3C; median, 19 knt). Thus,
we speculate that leading- and lagging-strand polymerases are
biochemically equivalent, although the different interactions
with components of the replisome confer distinct phenomeno-
logical differences on each polymerase.
Real-Time Observation of Okazaki Fragment SynthesisReveals that Leading- and Lagging-Strand PolymerasesHave Similar Biochemical PropertiesThe identification of long OFs led us to investigate replication
in real time at limiting primase concentration. Figures 6D–6G
and Movie S5 show rolling-circle replication with 1 nM primase,
A B C
D E
F G
H
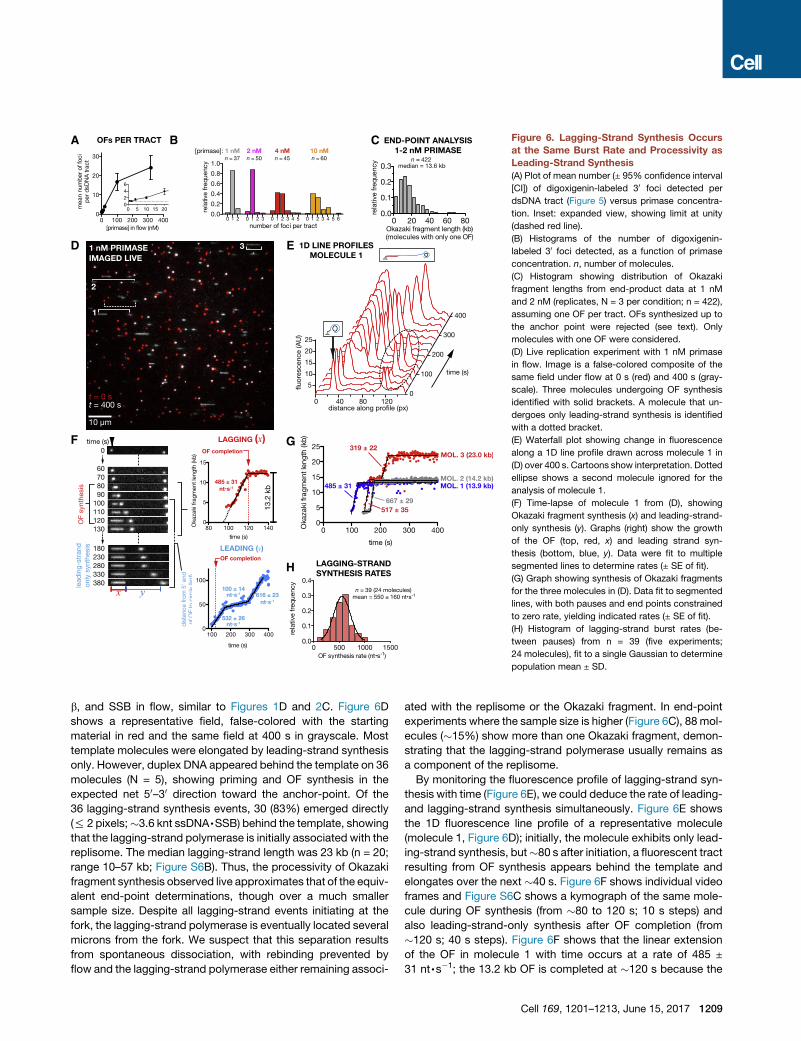
Figure 6. Lagging-Strand Synthesis Occurs
at the Same Burst Rate and Processivity as
Leading-Strand Synthesis
(A) Plot of mean number (± 95% confidence interval
[CI]) of digoxigenin-labeled 30 foci detected per
dsDNA tract (Figure 5) versus primase concentra-
tion. Inset: expanded view, showing limit at unity
(dashed red line).
(B) Histograms of the number of digoxigenin-
labeled 30 foci detected, as a function of primase
concentration. n, number of molecules.
(C) Histogram showing distribution of Okazaki
fragment lengths from end-product data at 1 nM
and 2 nM (replicates, N = 3 per condition; n = 422),
assuming one OF per tract. OFs synthesized up to
the anchor point were rejected (see text). Only
molecules with one OF were considered.
(D) Live replication experiment with 1 nM primase
in flow. Image is a false-colored composite of the
same field under flow at 0 s (red) and 400 s (gray-
scale). Three molecules undergoing OF synthesis
identified with solid brackets. A molecule that un-
dergoes only leading-strand synthesis is identified
with a dotted bracket.
(E) Waterfall plot showing change in fluorescence
along a 1D line profile drawn across molecule 1 in
(D) over 400 s. Cartoons show interpretation. Dotted
ellipse shows a second molecule ignored for the
analysis of molecule 1.
(F) Time-lapse of molecule 1 from (D), showing
Okazaki fragment synthesis (x) and leading-strand-
only synthesis (y). Graphs (right) show the growth
of the OF (top, red, x) and leading strand syn-
thesis (bottom, blue, y). Data were fit to multiple
segmented lines to determine rates (± SE of fit).
(G) Graph showing synthesis of Okazaki fragments
for the three molecules in (D). Data fit to segmented
lines, with both pauses and end points constrained
to zero rate, yielding indicated rates (± SE of fit).
(H) Histogram of lagging-strand burst rates (be-
tween pauses) from n = 39 (five experiments;
24 molecules), fit to a single Gaussian to determine
population mean ± SD.
b, and SSB in flow, similar to Figures 1D and 2C. Figure 6D
shows a representative field, false-colored with the starting
material in red and the same field at 400 s in grayscale. Most
template molecules were elongated by leading-strand synthesis
only. However, duplex DNA appeared behind the template on 36
molecules (N = 5), showing priming and OF synthesis in the
expected net 50–30 direction toward the anchor-point. Of the
36 lagging-strand synthesis events, 30 (83%) emerged directly
(% 2 pixels;�3.6 knt ssDNA,SSB) behind the template, showing
that the lagging-strand polymerase is initially associated with the
replisome. The median lagging-strand length was 23 kb (n = 20;
range 10–57 kb; Figure S6B). Thus, the processivity of Okazaki
fragment synthesis observed live approximates that of the equiv-
alent end-point determinations, though over a much smaller
sample size. Despite all lagging-strand events initiating at the
fork, the lagging-strand polymerase is eventually located several
microns from the fork. We suspect that this separation results
from spontaneous dissociation, with rebinding prevented by
flow and the lagging-strand polymerase either remaining associ-
ated with the replisome or the Okazaki fragment. In end-point
experiments where the sample size is higher (Figure 6C), 88 mol-
ecules (�15%) show more than one Okazaki fragment, demon-
strating that the lagging-strand polymerase usually remains as
a component of the replisome.
By monitoring the fluorescence profile of lagging-strand syn-
thesis with time (Figure 6E), we could deduce the rate of leading-
and lagging-strand synthesis simultaneously. Figure 6E shows
the 1D fluorescence line profile of a representative molecule
(molecule 1, Figure 6D); initially, the molecule exhibits only lead-
ing-strand synthesis, but�80 s after initiation, a fluorescent tract
resulting from OF synthesis appears behind the template and
elongates over the next �40 s. Figure 6F shows individual video
frames and Figure S6C shows a kymograph of the same mole-
cule during OF synthesis (from �80 to 120 s; 10 s steps) and
also leading-strand-only synthesis after OF completion (from
�120 s; 40 s steps). Figure 6F shows that the linear extension
of the OF in molecule 1 with time occurs at a rate of 485 ±
31 nt,s�1; the 13.2 kb OF is completed at �120 s because the
Cell 169, 1201–1213, June 15, 2017 1209

lagging-strand polymerase runs into the anchor (Figure S6D,
i); leading-strand synthesis continues simultaneously during
this period at 532 ± 26 nt,s�1 (Figure 6F, lower right). Thus, we
observe similar rates of synthesis on both the leading and lag-
ging strands by the same replisome.
Replication also displayed some of the characteristics deter-
mined above for leading-strand synthesis where leading-strand
polymerases paused, and template molecules occasionally un-
wound during leading-strand pausing (Figure S6D, iii). Figure 6G
shows the trajectories of Okazaki fragment synthesis for the
three molecules identified in Figure 6D. OFs were extended
linearly with time, but interspersed with pauses, as observed
for leading-strand only synthesis (Figure 3A). The burst rates
of extension followed a Gaussian distribution (Figure 6H) with
a mean of 550 ± 160 nt,s�1, similar to the 510 ± 190 nt,s�1
observed for leading-strand-only synthesis (Figure 3B, top).
Thus, the burst rate of polymerization is the same on both
the leading and lagging strands; the polymerases function
autonomously.
DISCUSSION
By observing replisome action on single molecules of DNA under
conditions in which excess polymerases were removed, we have
shown that the leading- and lagging-strand polymerases func-
tion autonomously. Surprisingly, leading-strand synthesis oc-
curs in irregular bursts with spontaneous pauses independent
of priming. During such pauses, helicase speed is reduced by
about 80%, but when the leading-strand polymerase catches
up with the helicase, the helicase resumes at full speed. Our
data also show that the median processivity of lagging-strand
synthesis at limiting primase is�14 knt and confirms that the fre-
quency of lagging-strand priming directly relates to primase con-
centration. Finally, we have shown that rates of replication on the
leading and lagging strands are similar and that they are neither
regulated by nor responsive to DNA priming nor primase.
Leading- and Lagging-Strand Polymerases FunctionAutonomously within a Single ComplexThe classical view of DNA replication is uninterrupted leading-
strand synthesis, with virtually infinite processivity, whereas a
series of slower, rate-limiting steps is required to yield an OF. It
has been assumed that lagging-strand synthesis must be faster
to accommodate these slower steps. Our data suggest an alter-
native view in which polymerases within the replisome function
autonomously. We find that replisome processivity changes little
over a wide range of primase concentrations and that the lead-
ing-strand polymerase can function in the complete absence
of primase. The polymerases share biochemical identity, and
our data show that the single-turnover activity of leading- and
lagging-strand polymerases is remarkably similar: burst rates
and lengths on the leading and lagging strands are very closely
matched. Lagging-strand processivity, revealed only at limiting
primase concentration, is surprisingly high—much higher than
physiological OF lengths—with a median of�14 knt. In contrast,
although leading-strand processivity is much higher, with a me-
dian of�70 kb, the leading-strand polymerase displays an inter-
esting propensity to pause every �19 knt, which is curiously
1210 Cell 169, 1201–1213, June 15, 2017
close to the processivity of the lagging-strand polymerase.
Given that the burst rates are similar, this observation suggests
that a rate-determining lifetime of the leading- and lagging-
strand polymerase within the replisome is similar (Figures 3
and 6). This observation lends credence to the view that the
two polymerases are autonomous.
Leading-Strand Replication Is Kinetically Discontinuousand Punctuated by Pauses and Rate SwitchingOur data show that the leading-strand polymerase synthesizes
DNA in kinetically discontinuous bursts, with pauses in between.
However, the nascent 30 terminus is localized near the helicase
and available for elongation, so the resulting strand is chemically
continuous. Priming the leading strand thus seems unnecessary
for the short-term operation of the replisome, at least for the
processivities we observe of tens to hundreds of kilobases.
But for genomic DNA, however, a chemically discontinuous
leading strand would be created at a lesion by priming down-
stream in the ssDNA between the polymerase and uncoupled
helicase; in cells, the gaps could be filled and ligated later.
Two independent sources of evidence support our view: (1) Oka-
zaki’s original work suggested that all the pulse label was in short
fragments (Okazaki et al., 1967), and (2) leading-strand priming is
required for the bypass of leading-strand lesions (Yeeles and
Marians, 2011). In our rolling-circle assay, a single leading-
strand discontinuity would terminate replication, as DnaB would
unwind and run off the circular template. The single most likely
cause of replication termination in our experiments is thus any
long-lived pause or dissociation of the leading-strand polymer-
ase lasting > 110 s (if unwinding of an 8.6 kb template occurs
at�80 bp,s�1) or a chemical discontinuity on the leading-strand.
Under most circumstances, disengagement or microscopic
dissociation from the nascent 30 terminus does not lead to termi-
nation because the polymerase is tethered to the helicase via t,
preventing macroscopic dissociation.
We note that previous single-molecule replication work was
unable to deconvolve leading- and lagging-strand synthesis in
reactions where the DNA was directly imaged: either no replica-
tion products were observed in the absence of primase (Tanner
et al., 2011) or product detection required removal of SSB and
hybridization of oligonucleotides to the leading strand to visu-
alize molecule lengths at an end point (Georgescu et al., 2014;
Yao et al., 2009). Moreover, the use of a minicircle template pre-
cluded the detection of pauses <�1.3 s. Our larger rolling-circle
substrate (�8.6 kb) permitted measurement of both the position
and intensity of the template in real time, enabling us to both
assess the role of primase in replication and correlate leading-
strand synthesis pausing with template unwinding.
How do leading-strand pauses arise? The two most likely ex-
planations are that the polymerase stalls at difficult-to-replicate
DNA, which would be manifest as uncoupling of unwinding
and replication, and that the helicase itself pauses at diffi-
cult-to-unwind secondary structure, which would manifest as a
pause with no associated unwinding. However, a third possibility
is that the polymerase randomly dissociates from either b or from
DNA, as outlined above, either of which would require the re-
loading of b for continued synthesis. All these behaviors are
observed in our data. We could identify no pattern to pausing,

as mapping the pause positions yielded no strong pause sites.
Our data suggest that the leading-strand polymerase pauses
every �19 knt. However, the time resolution of our pause detec-
tion is �3–4 s, and furthermore, any futile cycles of polymeriza-
tion and unwinding without significant fork movement would
not be detected. The pause durations (median = 13 s) were expo-
nentially distributed—short pauses are under-represented—so
our figure of �19 knt for the kinetic burst size is likely to be
an overestimate, and the average pause time is likely to be
an overestimate. Taken together, our data show that leading-
strand synthesis is unexpectedly dynamic, with kinetic pauses
every few seconds. Below, we discuss the implication of these
pauses for the interplay between unwinding and leading-strand
synthesis.
The Replicative Helicase Incorporates a Fail-SafeMechanism thatOperates if Leading-StrandSynthesis IsPausedWe have shown that the speed of DnaB helicase unwinding is
adjusted to match whether the leading-strand polymerase is
actively elongating (high speed) or not (low speed). This finding
concurs with our estimates of reduced helicase speed when
interaction with the polymerase is disrupted (Kim et al., 1996).
Our observations rationalize a long-observed disparity between
the E. coliDnaB unwinding rate in isolation compared with that in
the replisome (Kim et al., 1996; Ribeck et al., 2010; Yeeles and
Marians, 2013) and support ensemble data obtained with the
T7 replisome (Stano et al., 2005). Data from magnetic tweezer
experiments revealed that the geometry and force imposed on
DnaB may affect its speed (Ribeck et al., 2010), so perhaps the
leading-strand polymerase, or its connection to the helicase
via t, may impose such a geometry or force. EM and crystallo-
graphic data imply that the N-terminal collar domain of DnaB
adopts several conformational states, including ‘‘constricted’’
and ‘‘dilated,’’ and it has been proposed that DnaC, primase,
and tmay each effect the transitions between these states (Stry-
charska et al., 2013). Modulation of helicase speed, independent
of primase, raises the possibility that helicase pausing results
from slippage of the bipartite interaction between DnaB and
the C-terminal domain of t (Dallmann et al., 2000; Tougu et al.,
1994), which binds core polymerase.
During a pause by DNA polymerase, where DnaB continues to
unwind, the helicase does not necessarily physically disengage
from the polymerase. The linkage connecting t with core poly-
merase via DnaB is long and proline rich; with condensation of
intervening ssDNA between helicase and polymerase by SSB
(Bell et al., 2015), very long loops—up to several kilobases
long—could be extruded between the two. This observation
may partly explain why a deficiency in the SSB-c interaction af-
fects leading-strand polymerase stability (Marceau et al., 2011).
Indeed, only 35% of polymerases (22 out of 62) did not find their
way back to the helicase following a leading-strand pause. Our
data suggest that leading-strand pauses of several minutes
can be tolerated by the replisome and is entirely consistent
with our previous observation of the spontaneous bypass of
leading-strand lesions by replisomes (Yeeles and Marians,
2011). Under normal circumstances, priming would be biased
toward the lagging-strand template based on the relative
amounts of ssDNA present. Nevertheless, we can speculate
that the leading-strand template might also be primed whenever
the helicase moves sufficiently ahead of the polymerase, for
instance, when a lesion is encountered on the leading-strand
template (Yeeles and Marians, 2013).
In addition to pausing by the DNA polymerase while the
helicase continues, we also observe pausing of the replication
fork wherein DnaB stalls. The initiation of DnaB loading and
movement is well regulated, but it would now appear that so,
too, is its continued translocation during genome duplication.
The most likely rationale for this plasticity is to reduce the rate
of uncoupled unwinding of dsDNA, which would otherwise
produce long tracts of SSB,ssDNA. DNA unwinding during repli-
cation therefore incorporates a fail-safe mechanism, akin to a
‘‘dead-man’s switch,’’ that prevents the production of long tracts
of ssDNA should the leading-strand polymerase disengage or
encounter a lesion.
Priming Frequency of the Lagging Strand Is Tuned to theProcessivity of the Lagging-Strand PolymeraseOur data show that the frequency of lagging-strand priming far
exceeds the inherent processivity of the polymerase. Priming
more frequently than required may thus ensure that no large
gaps are left in the genome. One outstanding question is there-
fore how such frequent OF synthesis can be accommodated
without significantly slowing down the replication fork. It seems,
from our data, that at maximal primase concentration, wherein
OFs are synthesized every�3 knt on average, the lagging-strand
polymerase must dissociate from DNA and cycle to the next
primer every �6 s. Our data imply that the steps beginning
from primer synthesis to the binding of core polymerase at a
b-loaded 30 primer terminus do not significantly slow repli-
some progression or otherwise occur on a timescale faster
than the mean OF lifetime. Our observation here that both
the leading- and lagging-stand polymerases can pause DNA
synthesis every �19 kb, in a primase- and priming-independent
manner, offers a rate-limiting mechanism for matching the
speeds of both polymerases.
One aspect not directly addressed by our data is the precise
mechanism by which the polymerase cycles to the next OF. It
is now generally accepted that most OFs are not replicated to
a nick and that the lagging-strand polymerase dissociates pre-
maturely, leaving behind a gap of tens of nucleotides. This phe-
nomenon is often termed ‘‘signal release’’ (Wu et al., 1992b),
and it has been suggested that the free 30 primer terminus, not
primase, acts as the trigger (Yuan and McHenry, 2014). Our
data are most consistent with such a model.
A Stochastic View of Replisome BehaviorA central question in understanding replisome action is the
mechanism by which the rates of leading- and lagging-strand
synthesis are coordinated to ensure that unreplicated regions
are not produced. Various solutions to this problem have been
proposed. Many posit that for the additional enzymatic steps
necessary for lagging-strand synthesis to be accommodated,
the lagging-strand polymerase must synthesize DNA at a signif-
icantly faster rate than the leading-strand polymerase (Geor-
gescu et al., 2014; Pandey et al., 2009; Selick et al., 1987). In
Cell 169, 1201–1213, June 15, 2017 1211

this manner, one would not expect the generation of significant
gaps in the nascent lagging strand.
Our data indicate that such a deterministic model is unneces-
sary. The assumption that the rates of both polymerases are
constant and are defined by their mean rates is flawed. We
have shown that, whereas the mean rates of the leading- and
lagging-strand polymerases are the same within error (510 ±
190 nt,s�1 versus 550 ± 160 nt,s�1, Figures 3B and 6H), the
rate profiles of individual polymerases are neither constant nor
identical; they can randomly change to a new velocity within
the Gaussian distribution. This intrinsic variability of rates, which
reflects a molecular and switchable heterogeneity, had been
demonstrated to be a manifestation of ergodic behavior in
translocation rates of RecBCD enzyme (Liu et al., 2013). Our
data, collected from fully assembled active replisomes, show
that the rate of any polymerase can vary by 10-fold within the
ensemble. This implies that, at any given time, the leading-
strand polymerase can be synthesizing DNA at a rate faster
than the lagging-strand polymerase, and vice versa. The
sampling of wide distributions of rates and stochastic poly-
merase pausing obviates the need to impose differential rates
for ‘‘coordinated’’ replication. This fluctuation in rates solves
the coordination problem, with the leading-strand polymerase
switching rates potentially every 15–20 kb after it pauses and
the lagging-strand polymerase switching rates likely after each
time that it initiates the synthesis of a new Okazaki fragment.
Whereas transient gaps may form on any DNA template, they
will be filled in over a short time range as the rates of synthesis
vary. Such a statistical view of polymerase synthesis predicts a
heterogeneous distribution of Okazaki fragment length on any
particular DNA template, as we have observed here and as
was observed using the bacteriophage T4 replication system
(Chastain et al., 2000). Thus, we propose that the replisome sol-
ves the coordination paradox not by a deterministic regulated
mechanism, but rather by stochastically sampling from a distri-
bution of rates, a view that is consistent with existing data
without invoking coordination.
STAR+METHODS
Detailed methods are provided in the online version of this paper
and include the following:
d KEY RESOURCES TABLE
d CONTACT FOR REAGENT AND RESOURCE SHARING
d EXPERIMENTAL MODEL AND SUBJECT DETAILS
121
B Source organism
d METHOD DETAILS
B Microscopy
B Coverslip preparation
B Flow-cell assembly
B Replication template
B Recombinant proteins
B Preparation of flow-cells for imaging
B Rolling-circle replication reactions
B End-point replication reactions
B Live replication reactions
B Okazaki fragment end-labeling and imaging
2 Cell 169, 1201–1213, June 15, 2017
B Preparation of l DNA with an ssDNA gap
B Length versus flow-rate for dsDNA and ssDNA,SSBd QUANTIFICATION AND STATISTICAL ANALYSIS
B Experimental resolution
B Live imaging of leading-strand-only synthesis
B Live imaging with primase
B Lengths of replication end-products
B Determination of Okazaki fragment terminus
d DATA AND SOFTWARE AVAILABILITY
SUPPLEMENTAL INFORMATION
Supplemental Information includes six figures, one table, and five movies and
can be found with this article online at http://dx.doi.org/10.1016/j.cell.2017.
05.041.
An audio PaperClip is available at http://dx.doi.org/10.1016/j.cell.2017.05.
041#mmc7.
AUTHOR CONTRIBUTIONS
Conceptualization, Methodology, Writing – Review and Editing, Resources,
Formal Analysis, J.E.G., K.J.M., and S.C.K.; Investigation, Software, Writing –
Original Draft, Visualization, J.E.G.; Funding Acquisition, K.J.M., and S.C.K.;
Project Administration, K.J.M. and S.C.K.
ACKNOWLEDGMENTS
We thank Soon Bahng (MSKCC) for purified proteins, Jody Plank for the tem-
plate preparation protocols used in this work, James Berger (Johns Hopkins)
for expression plasmids for mutant DnaG, and Michael Kohl (Oxford) for the
basis of the edge-detection code used in this study. We thank all members
of the S.C.K. group, especially Neville Gilhooly and Pham Minh Tuan, as well
as David Sherratt (Oxford) and Joseph Yeeles (LMB, Cambridge), for their
insightful comments on the work. These studies were supported by NIH grants
GM34557 to K.J.M., GM064745 to S.C.K., and Cancer Center Core Support
Grants NCI P30CA008748 to MSKCC and NCI P30CA093373 to UCD.
Received: November 9, 2016
Revised: March 29, 2017
Accepted: May 26, 2017
Published: June 15, 2017
REFERENCES
Alberts, B.M., Barry, J., Bedinger, P., Formosa, T., Jongeneel, C.V., and
Kreuzer, K.N. (1983). Studies on DNA replication in the bacteriophage T4
in vitro system. Cold Spring Harb. Symp. Quant. Biol. 47, 655–668.
Amitani, I., Liu, B., Dombrowski, C.C., Baskin, R.J., and Kowalczykowski, S.C.
(2010). Watching individual proteins acting on single molecules of DNA.
Methods Enzymol. 472, 261–291.
Bell, J.C., Plank, J.L., Dombrowski, C.C., and Kowalczykowski, S.C. (2012).
Direct imaging of RecA nucleation and growth on single molecules of SSB-
coated ssDNA. Nature 491, 274–278.
Bell, J.C., Liu, B., and Kowalczykowski, S.C. (2015). Imaging and energetics of
single SSB-ssDNA molecules reveal intramolecular condensation and insight
into RecOR function. eLife 4, e08646.
Chastain, P.D., 2nd, Makhov, A.M., Nossal, N.G., and Griffith, J.D. (2000).
Analysis of the Okazaki fragment distributions along single long DNAs repli-
cated by the bacteriophage T4 proteins. Mol. Cell 6, 803–814.
Corn, J.E., Pease, P.J., Hura, G.L., and Berger, J.M. (2005). Crosstalk between
primase subunits can act to regulate primer synthesis in trans. Mol. Cell 20,
391–401.
Dallmann, H.G., Kim, S., Pritchard, A.E., Marians, K.J., and McHenry, C.S.
(2000). Characterization of the unique C terminus of the Escherichia coli tau
DnaX protein. Monomeric C-tau binds alpha AND DnaB and can partially
replace tau in reconstituted replication forks. J. Biol. Chem. 275,
15512–15519.
Dohrmann, P.R., Correa, R., Frisch, R.L., Rosenberg, S.M., andMcHenry, C.S.
(2016). The DNA polymerase III holoenzyme contains g and is not a trimeric
polymerase. Nucleic Acids Res. 44, 1285–1297.
Duderstadt, K.E., Geertsema, H.J., Stratmann, S.A., Punter, C.M., Kulczyk,
A.W., Richardson, C.C., and van Oijen, A.M. (2016). Simultaneous Real-Time
Imaging of Leading and Lagging Strand Synthesis Reveals the Coordination
Dynamics of Single Replisomes. Mol. Cell 64, 1035–1047.
Forget, A.L., Dombrowski, C.C., Amitani, I., and Kowalczykowski, S.C. (2013).
Exploring protein-DNA interactions in 3D using in situ construction, manipu-
lation and visualization of individual DNA dumbbells with optical traps, micro-
fluidics and fluorescence microscopy. Nat. Protoc. 8, 525–538.
Geertsema, H.J., Kulczyk, A.W., Richardson, C.C., and van Oijen, A.M. (2014).
Single-molecule studies of polymerase dynamics and stoichiometry at the
bacteriophage T7 replication machinery. Proc. Natl. Acad. Sci. USA 111,
4073–4078.
Georgescu, R.E., Yao, N., Indiani, C., Yurieva, O., and O’Donnell, M.E. (2014).
Replisomemechanics: lagging strand events that influence speed and proces-
sivity. Nucleic Acids Res. 42, 6497–6510.
Hiasa, H., and Marians, K.J. (1996). Two distinct modes of strand unlinking
during theta-type DNA replication. J. Biol. Chem. 271, 21529–21535.
Kim, S., Dallmann, H.G., McHenry, C.S., and Marians, K.J. (1996). Coupling of
a replicative polymerase and helicase: a tau-DnaB interaction mediates rapid
replication fork movement. Cell 84, 643–650.
Langston, L.D., Indiani, C., and O’Donnell, M. (2009). Whither the replisome:
emerging perspectives on the dynamic nature of the DNA replication machin-
ery. Cell Cycle 8, 2686–2691.
Lee, J.B., Hite, R.K., Hamdan, S.M., Xie, X.S., Richardson, C.C., and van Oijen,
A.M. (2006). DNA primase acts as amolecular brake in DNA replication. Nature
439, 621–624.
Liu, B., Baskin, R.J., and Kowalczykowski, S.C. (2013). DNA unwinding hetero-
geneity by RecBCD results from static molecules able to equilibrate. Nature
500, 482–485.
Marceau, A.H., Bahng, S., Massoni, S.C., George, N.P., Sandler, S.J., Mar-
ians, K.J., and Keck, J.L. (2011). Structure of the SSB-DNA polymerase III
interface and its role in DNA replication. EMBO J. 30, 4236–4247.
Marians, K.J. (1995). Phi X174-type primosomal proteins: purification and
assay. Methods Enzymol. 262, 507–521.
Mok, M., and Marians, K.J. (1987). The Escherichia coli preprimosome and
DNA B helicase can form replication forks that move at the same rate.
J. Biol. Chem. 262, 16644–16654.
Oakley, A.J., Loscha, K.V., Schaeffer, P.M., Liepinsh, E., Pintacuda, G., Wilce,
M.C., Otting, G., and Dixon, N.E. (2005). Crystal and solution structures of the
helicase-binding domain of Escherichia coli primase. J. Biol. Chem. 280,
11495–11504.
Okazaki, R., Okazaki, T., Sakabe, K., and Sugimoto, K. (1967). Mechanism of
DNA replication possible discontinuity of DNA chain growth. Jpn. J. Med. Sci.
Biol. 20, 255–260.
Pandey, M., Syed, S., Donmez, I., Patel, G., Ha, T., and Patel, S.S. (2009).
Coordinating DNA replication bymeans of priming loop and differential synthe-
sis rate. Nature 462, 940–943.
Pham, T.M., Tan, K.W., Sakumura, Y., Okumura, K., Maki, H., and Akiyama,
M.T. (2013). A single-molecule approach to DNA replication in Escherichia
coli cells demonstrated that DNA polymerase III is a major determinant of
fork speed. Mol. Microbiol. 90, 584–596.
Pomerantz, A.K., Moerner, W.E., and Kool, E.T. (2008). Visualization of long
human telomere mimics by single-molecule fluorescence imaging. J. Phys.
Chem. B 112, 13184–13187.
Ribeck, N., Kaplan, D.L., Bruck, I., and Saleh, O.A. (2010). DnaB helicase ac-
tivity is modulated by DNA geometry and force. Biophys. J. 99, 2170–2179.
Rymer, R.U. (2012). Studies on the Substrate Interactions of the Bacterial Pri-
mase. In Molecular & Cell Biology (University of California, Berkeley). http://
escholarship.org/uc/item/3wr7f65j#page-1.
Schindelin, J., Arganda-Carreras, I., Frise, E., Kaynig, V., Longair, M., Pietzsch,
T., Preibisch, S., Rueden, C., Saalfeld, S., Schmid, B., et al. (2012). Fiji: an
open-source platform for biological-image analysis. Nat. Methods 9, 676–682.
Selick, H.E., Barry, J., Cha, T.A., Munn, M., Nakanishi, M., Wong, M.L., and
Alberts, B.M. (1987). Studies on the T4 bacteriophage DNA replication system.
In Mechanisms of DNA Replication and Recombination, T. Kelly and R.
McMacken, eds. (New York: Alan R. Liss), pp. 183–214.
Stano, N.M., Jeong, Y.J., Donmez, I., Tummalapalli, P., Levin, M.K., and Patel,
S.S. (2005). DNA synthesis provides the driving force to accelerate DNA
unwinding by a helicase. Nature 435, 370–373.
Strycharska, M.S., Arias-Palomo, E., Lyubimov, A.Y., Erzberger, J.P., O’Shea,
V.L., Bustamante, C.J., and Berger, J.M. (2013). Nucleotide and partner-pro-
tein control of bacterial replicative helicase structure and function. Mol. Cell
52, 844–854.
Tanner, N.A., and van Oijen, A.M. (2009). Single-molecule observation of pro-
karyotic DNA replication. Methods Mol. Biol. 521, 397–410.
Tanner, N.A., Loparo, J.J., Hamdan, S.M., Jergic, S., Dixon, N.E., and van
Oijen, A.M. (2009). Real-time single-molecule observation of rolling-circle
DNA replication. Nucleic Acids Res. 37, e27.
Tanner, N.A., Tolun, G., Loparo, J.J., Jergic, S., Griffith, J.D., Dixon, N.E., and
van Oijen, A.M. (2011). E. coli DNA replication in the absence of free b clamps.
EMBO J. 30, 1830–1840.
Thorpe, H.M., and Smith, M.C. (1998). In vitro site-specific integration of
bacteriophage DNA catalyzed by a recombinase of the resolvase/invertase
family. Proc. Natl. Acad. Sci. USA 95, 5505–5510.
Tinevez, J.Y., Perry, N., Schindelin, J., Hoopes, G.M., Reynolds, G.D., Laplan-
tine, E., Bednarek, S.Y., Shorte, S.L., and Eliceiri, K.W. (2017). TrackMate: An
open and extensible platform for single-particle tracking. Methods 115, 80–90.
Tougu, K., Peng, H., and Marians, K.J. (1994). Identification of a domain of
Escherichia coli primase required for functional interaction with the DnaB
helicase at the replication fork. J. Biol. Chem. 269, 4675–4682.
Wu, C.A., Zechner, E.L., and Marians, K.J. (1992a). Coordinated leading- and
lagging-strand synthesis at the Escherichia coli DNA replication fork. I. Mul-
tiple effectors act to modulate Okazaki fragment size. J. Biol. Chem. 267,
4030–4044.
Wu, C.A., Zechner, E.L., Reems, J.A., McHenry, C.S., and Marians, K.J.
(1992b). Coordinated leading- and lagging-strand synthesis at the Escherichia
coli DNA replication fork. V. Primase action regulates the cycle of Okazaki frag-
ment synthesis. J. Biol. Chem. 267, 4074–4083.
Xu, L., and Marians, K.J. (2000). Purification and characterization of DnaC810,
a primosomal protein capable of bypassing PriA function. J. Biol. Chem. 275,
8196–8205.
Yao, N.Y., Georgescu, R.E., Finkelstein, J., and O’Donnell, M.E. (2009). Single-
molecule analysis reveals that the lagging strand increases replisome proces-
sivity but slows replication fork progression. Proc. Natl. Acad. Sci. USA 106,
13236–13241.
Yeeles, J.T., and Marians, K.J. (2011). The Escherichia coli replisome is inher-
ently DNA damage tolerant. Science 334, 235–238.
Yeeles, J.T., and Marians, K.J. (2013). Dynamics of leading-strand lesion skip-
ping by the replisome. Mol. Cell 52, 855–865.
Yuan, Q., and McHenry, C.S. (2014). Cycling of the E. coli lagging strand
polymerase is triggered exclusively by the availability of a new primer at the
replication fork. Nucleic Acids Res. 42, 1747–1756.
Cell 169, 1201–1213, June 15, 2017 1213

STAR+METHODS
KEY RESOURCES TABLE
REAGENT or RESOURCE SOURCE IDENTIFIER
Antibodies
Sheep anti-digoxigenin polyclonal F(ab) fragments Roche Cat# 11214667001, RRID: AB_514494
Bacterial and Virus Strains
Escherichia coli BL21(DE3) Novagen Cat# 69450
Escherichia coli DH5a Yale CGSC Cat# 12384
Escherichia coli LE392 Promega Cat# K9981
Escherichia coli XL2-Blue MRF0 Agilent Technologies Cat# 200151
Chemicals, Peptides, and Recombinant Proteins
Digoxigenin-11-dUTP, alkali-stable Roche Cat# 11558706910
Streptavidin Promega Cat# Z704A
Roche Blocking Reagent Roche Cat# 11096176001
Bovine Serum Albumin, fatty-acid free Sigma Cat# A8806
Acetone, CMOS-grade JT Baker Cat# JTP-9005-05
Methanol, CMOS-grade JT Baker Cat# JTP-9073-05
(3-aminopropyl)triethoxysilane (3-APTES) Sigma Cat# A3648
Biotin-PEG-NHS, MW 5000 Nanocs Cat# PG2-BNNS-5k
mPEG-NHS, MW 5000 Nanocs Cat# PG1-SC-5k
Hellmanex III Sigma Cat# Z805939
SYTOX Orange nucleic acid stain Thermo Fisher Cat# S11368
dNTPs (dATP, dGTP, dCTP, dTTP) Jena Biosciences Cat# NU-1009
NTPs (ATP, GTP, CTP, UTP) Jena Biosciences Cat# NU-1014
AMP-PNP Jena Biosciences Cat# NU-407
Alexa Fluor 488 NHS ester Thermo Fisher Cat# A20000
T7 DNA polymerase, unmodified NEB Cat# M0274
T4 DNA ligase NEB Cat# M0202
DNA Polymerase I (Escherichia coli) NEB Cat# M0209
Escherichia coli DNA ligase NEB Cat# M0205
DnaB Marians, 1995 N/A
DnaC810 Xu and Marians, 2000 N/A
Pol III* Marceau et al., 2011 N/A
DnaN (beta-clamp) Hiasa and Marians, 1996 N/A
DnaG (primase; wild-type) Marians, 1995 N/A
SSB Bell et al., 2012 N/A
DnaG D269A This study N/A
DnaG D269Q This study N/A
Oligonucleotides
Preparation of rolling-circle template: 80-mer,
50 biotin-TEG- TTTTTTTTTTTTTTTTTTTTTTT
TTTTTTTTTTTTTTTTTTTTTTTTTTTAATTCGT
AATCATGGTCATAGCTGTTTCCT
This study N/A
Preparation of lGap: 20-mer PCR primer,
AGG ATC CAC AGG ACG GGT GT
Bell et al., 2012 N/A
Preparation of lGap: 20-mer PCR primer,
ACT TTC ACC AGC GTT TCT GGG TG
Bell et al., 2012 N/A
(Continued on next page)
e1 Cell 169, 1201–1213.e1–e8, June 15, 2017
Continued
REAGENT or RESOURCE SOURCE IDENTIFIER
Mutagenesis of dnaG: D269A FW: 31-mer,
CGAAGGCTATATGGCAGTGGTGGCGCTGGCG
This study N/A
Mutagenesis of dnaG: D269A REV: 31-mer,
CGCCAGCGCCACCACTGCCATATAGCCTTCG
This study N/A
Mutagenesis of dnaG: D269Q FW: 31-mer,
CGAAGGCTATATGCAGGTGGTGGCGCTGGCG
This study N/A
Mutagenesis of dnaG: D269Q REV: 31-mer,
CGCCAGCGCCACCACCTGCATATAGCCTTCG
This study N/A
Preparation of dsDNA calibration standard:
12-mer GGGCGGCGACCT
This study N/A
Recombinant DNA
M13Ophrys Bell et al., 2012 N/A
lKytos Bell et al., 2012 N/A
pET28b(+)-dnaG (full-length; wild-type;
TEV-cleavable His6-tag)
James Berger (Johns Hopkins
School of Medicine)
N/A
Software and Algorithms
Adobe Illustrator (for laser cutter, Craft Robocutter
patterns, preparation of figures)
Adobe Systems Versions CS5, CS6
GraphPad Prism GraphPad Version 5.0b (Mac OS X)
Igor Pro WaveMetrics Version 6.x
Anaconda Python 2.7 distribution Continuum Analytics Python 2.7
Fiji ImageJ distribution Schindelin et al., 2012 2015 December 22 build
Igor Pro code for end-product analysis (End-product
and tract analyzer.ipf)
This study https://github.com/jegra83/Cell_2017
Python code for extraction of data from TrackMate
XML file (TrackMate XML to txt.py)
This study https://github.com/jegra83/Cell_2017
Igor Pro code for measurement of product lengths
from live imaging (Primase live imaging analyzer.ipf)
This study https://github.com/jegra83/Cell_2017
ImageJ macro for extraction of template intensity
from live leading-strand-only imaging (Intensity analyzer.ijm)
This study https://github.com/jegra83/Cell_2017
Other
PEEK tubing Upchurch Scientific Cat# 1532
PharMed tubing Bio-Rad Cat# 7318208
Double-sided tape 3M Cat# 9437
Microscope slides, 75 3 25 mm Fisher Scientific Cat# 12-550-A3
Coverslip, FisherFinest #1, 22 mm square Fisher Scientific Cat# 12-548B
CO2 laser cutter Epilog Mini 18
Epoxy Instant Mix 5 Minute Loctite Cat# 1365868
CONTACT FOR REAGENT AND RESOURCE SHARING
Further information and requests for resources and reagents, including custom analysis scripts, should be directed to and will be
fulfilled by the Lead Contact, Stephen C. Kowalczykowski ([email protected]).
EXPERIMENTAL MODEL AND SUBJECT DETAILS
Source organismAll proteins used herein were purified from Escherichia coli K-12 strains (BL21(DE3) and DH5a) as described below. The replication
template, M13Ophrys, was purified from E. coli XL2-MRFʹ as described below. The ssDNA calibration standard, lGap, was gener-
ated from lKytos (Bell et al., 2012), which was purified from E. coli LE392.
Cell 169, 1201–1213.e1–e8, June 15, 2017 e2
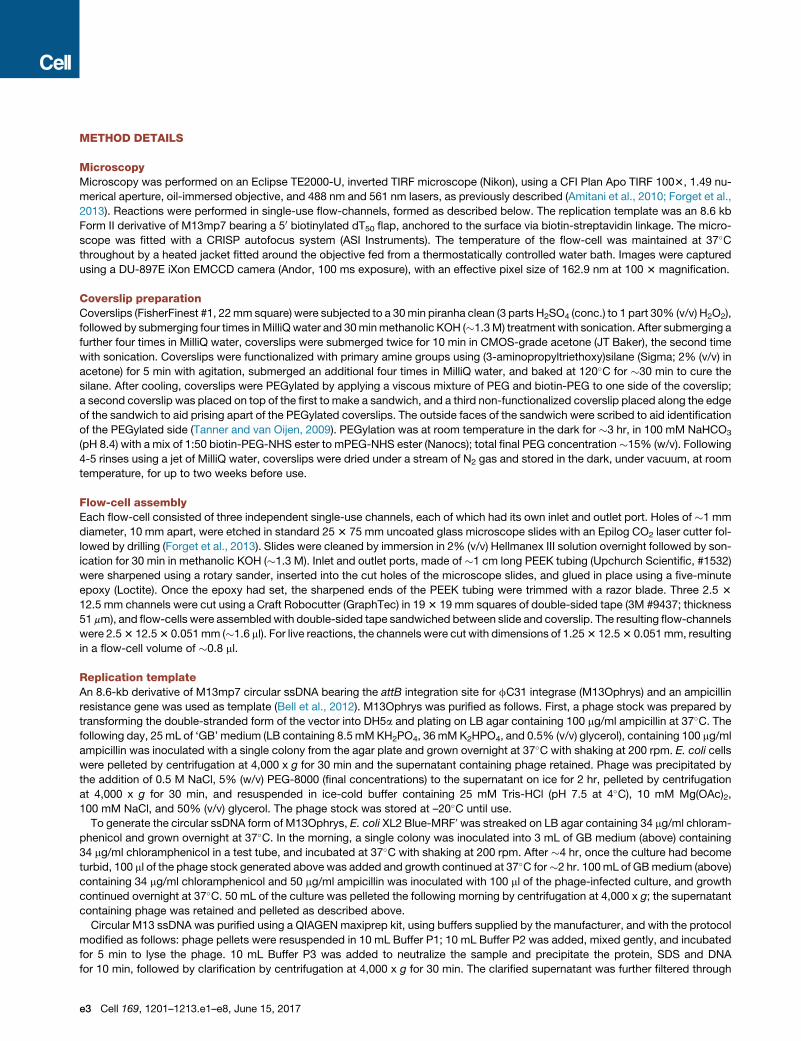
METHOD DETAILS
MicroscopyMicroscopy was performed on an Eclipse TE2000-U, inverted TIRF microscope (Nikon), using a CFI Plan Apo TIRF 1003, 1.49 nu-
merical aperture, oil-immersed objective, and 488 nm and 561 nm lasers, as previously described (Amitani et al., 2010; Forget et al.,
2013). Reactions were performed in single-use flow-channels, formed as described below. The replication template was an 8.6 kb
Form II derivative of M13mp7 bearing a 50 biotinylated dT50 flap, anchored to the surface via biotin-streptavidin linkage. The micro-
scope was fitted with a CRISP autofocus system (ASI Instruments). The temperature of the flow-cell was maintained at 37�Cthroughout by a heated jacket fitted around the objective fed from a thermostatically controlled water bath. Images were captured
using a DU-897E iXon EMCCD camera (Andor, 100 ms exposure), with an effective pixel size of 162.9 nm at 100 3 magnification.
Coverslip preparationCoverslips (FisherFinest #1, 22mm square) were subjected to a 30min piranha clean (3 parts H2SO4 (conc.) to 1 part 30% (v/v) H2O2),
followed by submerging four times inMilliQ water and 30minmethanolic KOH (�1.3M) treatment with sonication. After submerging a
further four times in MilliQ water, coverslips were submerged twice for 10 min in CMOS-grade acetone (JT Baker), the second time
with sonication. Coverslips were functionalized with primary amine groups using (3-aminopropyltriethoxy)silane (Sigma; 2% (v/v) in
acetone) for 5 min with agitation, submerged an additional four times in MilliQ water, and baked at 120�C for �30 min to cure the
silane. After cooling, coverslips were PEGylated by applying a viscous mixture of PEG and biotin-PEG to one side of the coverslip;
a second coverslip was placed on top of the first to make a sandwich, and a third non-functionalized coverslip placed along the edge
of the sandwich to aid prising apart of the PEGylated coverslips. The outside faces of the sandwich were scribed to aid identification
of the PEGylated side (Tanner and van Oijen, 2009). PEGylation was at room temperature in the dark for �3 hr, in 100 mM NaHCO3
(pH 8.4) with a mix of 1:50 biotin-PEG-NHS ester to mPEG-NHS ester (Nanocs); total final PEG concentration�15% (w/v). Following
4-5 rinses using a jet of MilliQ water, coverslips were dried under a stream of N2 gas and stored in the dark, under vacuum, at room
temperature, for up to two weeks before use.
Flow-cell assemblyEach flow-cell consisted of three independent single-use channels, each of which had its own inlet and outlet port. Holes of �1 mm
diameter, 10 mm apart, were etched in standard 253 75 mm uncoated glass microscope slides with an Epilog CO2 laser cutter fol-
lowed by drilling (Forget et al., 2013). Slides were cleaned by immersion in 2% (v/v) Hellmanex III solution overnight followed by son-
ication for 30 min in methanolic KOH (�1.3 M). Inlet and outlet ports, made of �1 cm long PEEK tubing (Upchurch Scientific, #1532)
were sharpened using a rotary sander, inserted into the cut holes of the microscope slides, and glued in place using a five-minute
epoxy (Loctite). Once the epoxy had set, the sharpened ends of the PEEK tubing were trimmed with a razor blade. Three 2.5 3
12.5 mm channels were cut using a Craft Robocutter (GraphTec) in 193 19 mm squares of double-sided tape (3M #9437; thickness
51 mm), and flow-cells were assembledwith double-sided tape sandwiched between slide and coverslip. The resulting flow-channels
were 2.53 12.53 0.051mm (�1.6 ml). For live reactions, the channels were cut with dimensions of 1.253 12.53 0.051mm, resulting
in a flow-cell volume of �0.8 ml.
Replication templateAn 8.6-kb derivative of M13mp7 circular ssDNA bearing the attB integration site for fC31 integrase (M13Ophrys) and an ampicillin
resistance gene was used as template (Bell et al., 2012). M13Ophrys was purified as follows. First, a phage stock was prepared by
transforming the double-stranded form of the vector into DH5a and plating on LB agar containing 100 mg/ml ampicillin at 37�C. Thefollowing day, 25 mL of ‘GB’ medium (LB containing 8.5 mMKH2PO4, 36mMK2HPO4, and 0.5% (v/v) glycerol), containing 100 mg/ml
ampicillin was inoculated with a single colony from the agar plate and grown overnight at 37�C with shaking at 200 rpm. E. coli cells
were pelleted by centrifugation at 4,000 x g for 30 min and the supernatant containing phage retained. Phage was precipitated by
the addition of 0.5 M NaCl, 5% (w/v) PEG-8000 (final concentrations) to the supernatant on ice for 2 hr, pelleted by centrifugation
at 4,000 x g for 30 min, and resuspended in ice-cold buffer containing 25 mM Tris-HCl (pH 7.5 at 4�C), 10 mM Mg(OAc)2,
100 mM NaCl, and 50% (v/v) glycerol. The phage stock was stored at –20�C until use.
To generate the circular ssDNA form of M13Ophrys, E. coli XL2 Blue-MRFʹwas streaked on LB agar containing 34 mg/ml chloram-
phenicol and grown overnight at 37�C. In the morning, a single colony was inoculated into 3 mL of GB medium (above) containing
34 mg/ml chloramphenicol in a test tube, and incubated at 37�C with shaking at 200 rpm. After �4 hr, once the culture had become
turbid, 100 ml of the phage stock generated above was added and growth continued at 37�C for�2 hr. 100mL of GBmedium (above)
containing 34 mg/ml chloramphenicol and 50 mg/ml ampicillin was inoculated with 100 ml of the phage-infected culture, and growth
continued overnight at 37�C. 50 mL of the culture was pelleted the following morning by centrifugation at 4,000 x g; the supernatant
containing phage was retained and pelleted as described above.
Circular M13 ssDNA was purified using a QIAGENmaxiprep kit, using buffers supplied by the manufacturer, and with the protocol
modified as follows: phage pellets were resuspended in 10 mL Buffer P1; 10 mL Buffer P2 was added, mixed gently, and incubated
for 5 min to lyse the phage. 10 mL Buffer P3 was added to neutralize the sample and precipitate the protein, SDS and DNA
for 10 min, followed by clarification by centrifugation at 4,000 x g for 30 min. The clarified supernatant was further filtered through
e3 Cell 169, 1201–1213.e1–e8, June 15, 2017
a Kimwipe using a 50 mL plastic syringe. A single QIAGEN tip-500 column was equilibrated with 15 mL Buffer QBT. The clarified
lysate was added to the column and allowed to enter the resin bed. The column was washed with 5 mL of ssDNA wash buffer
(50 mMMOPS (pH 7.0), 900 mM NaCl, 15% (v/v) isopropanol), then twice further, each time with 30 mL ssDNA wash buffer. Circular
DNA was eluted with 20 mL of 50 mMMOPS (pH 7.0), 1 M NaCl, 4 M deionized urea, 15% isopropanol; precipitated with the addition
of 14 mL of isopropanol; and pelleted by centrifugation at 4,000 x g for 60 min. The DNA pellet was washed twice with 10 mL of room
temperature 70% (v/v) EtOH, and dissolved overnight at 4�C in 100 ml TE buffer (10mMTris-Cl (pH 8.0 at 4�C), 1mMEDTA). The purity
and integrity of the substrate was verified by 0.8% alkaline and neutral agarose gel electrophoresis.
To generate the rolling-circle template, oligonucleotide oJEG38 (50-TTTTTTTTTTTTTTTTTTTTTTTTTTTTTTTTTTTTTTTTTTTTTTTTTT AATTCGTAATCATGGTCATAGCTGTTTCCT-30), bearing a 50 biotin-triethylene glycol moiety and 50-nt flap, was synthesized
(Integrated DNA Technologies) and purified by urea-PAGE and avidin-agarose. The oligo was annealed to M13Ophrys via 30 nt of
complementarity and extended using T7 DNA polymerase (NEB) in the presence of 200 mM dNTPs to create a biotin-tailed Form
II template. Extension of the primer to generate a nicked circle was monitored by 0.8% alkaline and neutral agarose gel electropho-
resis of the products. Products were purified by two rounds of phenol-chloroform extraction followed by ethanol precipitation.
Recombinant proteinsUntagged E. coli DnaB, DnaC810, wild-type primase (DnaG), b (DnaN), SSB and Pol III* were purified as described (Hiasa and Mar-
ians, 1996; Marceau et al., 2011; Marians, 1995; Xu and Marians, 2000). Mutant E. coli primases (D269A, D269Q) bearing N-terminal
TEV-cleavable His6-tags, were purified as follows. Primase was overexpressed in E. coli BL21(DE3) by adding 1 mM IPTG to the cul-
ture at OD600�0.8 for 4 hr at 37�C. Cells were lysed by passage twice through a French press (12,000 psi) in 50 mM Tris-Cl (pH 7.5 at
4�C), 10% (v/v) glycerol, 150mMNaCl, 20mMEDTA, 1mMDTT, 1mMPMSF, and 20mMspermidine, and debris removed by centri-
fugation at 44,0003 g for 20 min. The pH of the lysate was adjusted to 8.0 using solid Tris base. Following lysis, genomic DNA was
precipitated and removed by dropwise addition of a 10% (v/v) solution of Polymin P (pH 8.0) to 0.04% (v/v) and centrifugation at
30,0003 g for 20 min. Protein in the resulting supernatant was precipitated with 50% saturated ammonium sulfate and centrifuged
as above. The pellet was dissolved in �50 mL of 50 mM Tris-Cl (pH 7.5 at 4�C), 10% (v/v) glycerol, 500 mM NaCl, 10 mM imidazole
and dialyzed for 2 hr against the same buffer in a volume of 4 L. The dialysate was applied to a 5 mL HisTrap column (GE) and protein
eluted in a gradient of 0-500 mM imidazole over ten column volumes. Pooled fractions (�30 mg) were diluted to 50 mL by 50 mM
Tris-Cl (pH 7.5 at 4�C), 10% (v/v) glycerol, 10 mM NaCl; 1.4 mg His-tagged TEV protease was added for cleavage overnight at
4�C. The cleaved protein was reapplied to the HisTrap column as above, and untagged primase collected in the flow-through.
Cleaved mutant primase was dialyzed �2 hr against 50 mM Tris-Cl (pH 7.5 at 4�C), 10% (v/v) glycerol, 10 mM NaCl, 1 mM EDTA,
5 mM DTT (Buffer A) and diluted �3-fold for application to a 5 mL HiTrap heparin column equilibrated with the same buffer. The
flow-through was reapplied twice to the column. Protein was eluted in a 10-600 mM NaCl gradient over ten column volumes;
DnaG eluted at �125 mM NaCl. Approximately 9 mg total protein was obtained. The protein was dialyzed against Buffer A, applied
to aMonoQ (10/10) column equilibrated with Buffer A, and elutedwith a 10-500mMNaCl gradient over ten column volumes. The pure
fractions (6.6 mg protein) were dialyzed against 50 mM Tris-Cl (pH 7.5 at 4�C), 50 mM NaCl, 1 mM EDTA, 5 mM DTT, 38% (v/v) glyc-
erol, and snap-frozen in liquid nitrogen for storage at –80�C. The mutant primase preparations contained no detectable ssDNA or
dsDNA nuclease activity.
Preparation of flow-cells for imagingSingle-molecule imaging buffer (SMB) contained: 50 mM HEPES-KOH (pH 8.0), 10 mM magnesium acetate, 25 mM KCl, 15% (w/v)
sucrose. DTT (50 mM) was added in powdered form fresh to the buffer on the day of use; the buffer was passed through a 0.22-mm
syringe-driven filter and degassed for �4 hr. Each flow-channel was prepared immediately before use by pipetting in the following
sequence: 100 mL SMB; 100 mL SMB containing 0.1mg/ml streptavidin (Promega;�21�C, 2min); 100 mL SMB. The flow-cell was then
connected to the injection systemusing�5mmpieces of PharMed tubing (Bio-Rad) to connect the PEEK tubing to the inlet and outlet
ports. All surfaces, including connecting tubing, were blocked against nonspecific binding by flowing 1 mL of SMB containing 1%
(w/v) blocking reagent (Roche; cat. 11096176001) through the flow-cell at 10 ml,h-1. Blocking reagent was removed by flowing
another 1 mL of SMB through the system at 10 ml,h-1. The replication template was adsorbed to the surface by introducing SMB
containing�10 pM (molecules) replication template and 75 nMSYTOXOrange into the flow-cell. The density of DNAmolecules could
be adjusted by a 10-fold concentration of template (from 10 to �100 pM) and time (from 1 to �10 min) without buffer flow; for end-
point reactions, a lower density of molecules was preferred so that molecules would not overlap when elongated by replication.
Rolling-circle replication reactionsThe overall experimental scheme was to first attach an 8.6 kb template via a 50 biotinylated tail to the surface (‘anchor’). Next, idling
replisomes were formed by introducing DnaB, DnaC810, Pol III*, b, three out of the four dNTPs, and all rNTPs. Following a wash to
remove unbound proteins, replication was initiated by adding dTTP and flow-stretching the DNA. SSB, b and primase were present
in flow.
Specifically, following adsorption of DNA to the surface and the removal of excess DNA once the desired density of template had
been achieved, the syringe, lines and flow-cell were equilibrated with wash buffer (‘WB’; SMB (as above) plus 1 mM ATP, 200 mM
each CTP, GTP and UTP, 40 mM each dATP, dCTP and dGTP [no dTTP], and 75 nM SYTOX Orange). On the day of use, replication
Cell 169, 1201–1213.e1–e8, June 15, 2017 e4
proteins were diluted to fifteen times the required concentration from stock in a buffer containing 50mMTris-Cl (pH 7.5), 10mMbeta-
mercaptoethanol, 1 mM EDTA, 100 mM NaCl, 500 mg/ml BSA, and 20% (v/v) glycerol (protein diluent, ‘PD’). Reactions were per-
formed in two stages: a pre-incubation ‘‘bind’’ mix (50 ml) contained 60 nM DnaB (as hexamer), 380 nM DnaC810, 20 nM Pol III*,
30 nM DnaN (b, as dimer), and 10 mg/ml BSA in WB (with additionally one-fifth equivalent of PD). Primase was not added to the
pre-incubation mix. Flow-cells were washed with 25 mL WB (�90 s, 1,000 ml,h-1), after which reactions were initiated with a ‘‘start’’
mix (60 mL for end-point reactions; 150 mL for live reactions), containing 320 nMprimase, 250 nMSSB (as tetramer), 30 nMDnaN (b, as
dimer), 40 mMdTTP (in addition to the other three dNTPs), and 10 mg/ml BSA in WB (with additionally one-fifth equivalent of PD). Pre-
incubation, wash, and start mixwere injected in-line into the flow-cell using a system of injection loops driven by a syringe pump. Flow
was maintained at 1,000 ml,h-1 during the pre-incubation and wash stages, and was altered as appropriate during the reaction
(below). The volume required to initiate the reaction was determined empirically by injecting fluorescent dye into the flow-cell. For
dropout and titration experiments, the concentration of protein was varied as appropriate (see main text).
End-point replication reactionsFor end-point reactions, flow was reduced to 100 ml,h-1 without constant laser illumination; reactions were only periodically illumi-
nated with the 561 nm laser to check the progress of the reaction. At 10 min, reactions were quenched by injection of 50 mL SMB
containing 75 nM SYTOX Orange, 1 mM AMP-PNP, 40 mM each dATP, dCTP and dGTP and ddTTP, at 4,000 ml,h-1. The flow-cell
and lines were washed and equilibrated with SMB lacking magnesium acetate, plus 15 nM SYTOX Orange (‘‘end-point imaging
buffer’’). The removal of Mg2+ ion (i) prevented further DNA synthesis; (ii) improved the signal-to-noise ratio of fluorescence intensity
detection, as the affinity of SYTOXOrange stain for dsDNA is higher in the absence of divalent cation; and (iii) relieved the compaction
of ssDNA,SSB, improving the resolution of regions of any possible gaps on the lagging strand (Figure S1F). Where necessary (main
text), the flow was shut off for R 20 s and the molecules allowed to recoil. Between 20 and 50 frames at 100 ms exposure were re-
corded. All end-products were extended at a flow-rate of 4,000 ml,h-1 for visualization, and an additional 20-50 frames recorded. Be-
tween 40 and 200 fields were recorded for each flow-channel by imaging in a serpentine path to avoid field duplication. For each
dataset, a ‘flat’ image was recorded by defocusing 1-2 mm from the surface into bulk solution and taking an average of 8-10 points
in the flow-channel. Each image for that dataset was then normalized by dividing the intensity values by the ‘flat’ image values.
Live replication reactionsReactions were performed as described above, except in a flow-cell of half the width (�0.8 mL volume) to permit double the linear
flow-rate for a given volumetric flow-rate. Upon starting the reaction with a defined volume of the ‘start’ mix, the flow-rate was
adjusted to 1,250 ml,h-1, the equivalent of 2,500 ml,h-1 in the end-point reactions above. Movies were recorded at a low level of laser
exposure, determined empirically not to cause appreciable photocleavage to l DNA, at a frame rate of 7.4 Hz.
Okazaki fragment end-labeling and imagingReactions were performed exactly as for the end-point experiments above, except that at 10 min, 50 mL of SMB containing 1 M NaCl
was injected into the flow-cell to remove bound proteins and SYTOX Orange. The high-salt buffer was immediately followed by
400 mLWB at 4,000 ml,h-1 without stopping the flow. Replication products were pulse-labeled by injecting 50 mL of a mix comprising:
30 mM Tris-Cl (pH 8.0 at 25�C), 10 mM magnesium acetate, 10 mg/ml BSA, 40 mM each of dATP, dCTP and dGTP, 20 mM digoxy-
genin-11-dUTP (alkali-stable, Roche), 26 mMNAD+, 3.3 U DNA Pol I (wild-type, full-length, NEB), 3.3 U E. coli DNA ligase (NEB), and
250 nM SSB (as tetramer), at a flow-rate of 500 ml,h-1 for 5 min. At 5 min, a further 50 mL SMB + 1 M NaCl was introduced to remove
bound Pol I and ligase, immediately followed by a further wash of 400 mL WB at 4,000 ml,h-1, again without stopping flow. Sheep
polyclonal anti-digoxigenin F(ab) fragments (Roche), labeled with Alexa Fluor 488 NHS ester (ThermoFisher Scientific) with an
average of 3.6 dyes per molecule, were injected into the flow-cell in end-point imaging buffer, at �300 nM molecules; 250 nM
SSB (tetramer) was also included to replenish any removed during the high-salt wash. Excess F(ab) fragments and SSBwere washed
out of the flow-cell and products imaged using the same buffer. There was no appreciable nonspecific binding of labeled F(ab) frag-
ments to the surface. Alexa Fluor 488 and SYTOXOrange signals were imaged on two halves of the EMCCD using a Dual-View appa-
ratus (Optical Insights) and bandpass filters specific to each dye (Chroma), illuminating the sample alternately with the 488 nm and
561 nm lasers. DNA was imaged under a flow-rate of 8,000 ml,h-1.The 50 and 30 locations of each OF were inferred from the patterns of 30 terminus labeling and the positions of gaps (see Figure 5A).
To estimate the labeling efficiency, we determined the proportion of resolvable ssDNA,SSB gaps which had a detectable focus at
their right-hand edge, i.e., the 30 terminus of the right-hand OF (Figure 5A), which acted as an internal control (Table S1).
Preparation of l DNA with an ssDNA gapBacteriophage M13mp7 ssDNA containing the attB recognition site was used to generate a 500 bp dsDNA fragment containing the
fC31 attB at its center by PCR using the Phusion High Fidelity PCR Master Mix from NEB. The dsDNA product was heat denatured,
and then annealed to the M13mp7 ssDNA derivative. The gapped l DNA was generated by site-specific recombination between
lKytos dsDNA and the annealed M13mp7 ssDNA containing the attB recognition site (M13Ophrys), using fC31 integrase. The
fC31 integrase was purified from plasmid pHS62 (Thorpe and Smith, 1998).
e5 Cell 169, 1201–1213.e1–e8, June 15, 2017

Length versus flow-rate for dsDNA and ssDNA,SSBTo prepare dsDNA as a calibration standard, a 30-biotinylated oligonucleotide (50-GGGCGGCGACCT-30) was ligated to l DNA (N6-
methyladenine-free; NEB) using T4 DNA ligase. For the ssDNA,SSB length calibrations, lKytos DNA bearing an internal 8,155 nt gap
(‘‘lGap’’) was prepared as described (Bell et al., 2012) and the same biotinylated oligonucleotide ligated. DNA was introduced into a
flow-cell as described above and imaged in SMB containing 75 nM SYTOX Orange, 1 mM ATP, 200 mM each CTP, GTP and UTP,
40 mM dNTPs and 250 nM SSB (as tetramer, for the gapped substrate only); then the buffer in the flow-cell was exchanged into SMB
containing 15 nMSYTOXOrange, but lackingmagnesium acetate and lacking SSB. The first conditionmimics the replication reaction
conditions, and the second the end-point imaging conditions. The calibrations were performed sequentially tomimic the experiments
described above. DNA was imaged at flow-rates between 100 and 9,000 ml,h-1, and twenty frames recorded and averaged.
Molecules were analyzed as described below. The central gap in lGap could not be resolved below a flow-rate of 2,000 ml,h-1 inthe Mg2+-free buffer, and 2,500 ml,h-1 in the Mg2+-containing buffer. Data were binned and fitted to single Gaussians to determine
the mean length (±standard deviation; Figure S1).
QUANTIFICATION AND STATISTICAL ANALYSIS
Statistical details of individual experiments, including numbers of observations and replicates, dispersion and precision measures,
are as described in the manuscript text, figure legends, and the figures themselves. Specific treatments of data are as described in
detail below.
Experimental resolutionGiven the maximumwavelength of fluorescence emission for SYTOX Orange is�570 nm, our experiments have a nominal resolution
of �285 nm (given the calibrations above and in Figure S1, �0.9 kb dsDNA, or 2.4 knt ssDNA,SSB under end-point imaging condi-
tions;�1.0 kb dsDNA and 3.2 kb ssDNA,SSB under live imaging conditions). All molecule lengths were converted from a pixel length
to base-pairs (for dsDNA tracts) or nucleotides (for ssDNA,SSB tracts) based on the calibrations described above. The time reso-
lution of the experiments is also outlined below.
Live imaging of leading-strand-only synthesisFor live reactions, imageswere averaged using a slidingwindow average of five frames, and the stack size reduced 5-fold, resulting in
a time resolution of �680 ms. A rolling-ball filter of 50 pixels was used to subtract background from the image stacks. For reactions
lacking primase, template positions were tracked automatically using the Fiji TrackMate plugin for ImageJ (Schindelin et al., 2012;
Tinevez et al., 2017). The code locates the centers of spots within individual frames of an image stack, then solves a linear assignment
problem to link the positions of spots from successive frames together. Spot centers were located using a Laplacian of Gaussian
(LoG) detector, with an estimated blob diameter of 8 pixels, applying amedian filter and threshold to reduce false positives. Typically,
�200-300 spots were found per frame. Because the particles track left to right under flow, a large y-direction penalty was applied
during frame-to-frame linking. Track segment gap closing was permitted with a typical maximum distance of 10 pixels and gap of
3 frames, to account for frames in which spots were not detected owing to fluctuations in flow.
This process typically generated up to a thousand tracks, most of which were exceedingly short (several pixels long), resulting
either from template that does not move (i.e., did not have a loaded replisome), or which moved only a short distance. Therefore,
a further filter was applied to remove low-quality tracks that had < 50 spots (with a frame interval of �0.7 s), and moved 5 pixels
(�9 knt). This process reduced the number of tracks to�100-150, of which only�50were uninterrupted by another molecule. Tracks
were also manually inspected to ensure that the linking algorithm did not aberrantly link the trajectories of two adjacent spots
together. All data were manually inspected for mistracking artifacts such as the proximity of a non-moving or paused template mole-
cule, by using both the overlay of the spot positions on the data and the shape of the resultant tracks.
Track displacements were determined using a Python script to extract the track coordinates and calculate the template displace-
ments from the XML output of TrackMate. The displacement in pixels was converted to a nucleotide displacement value using the
calibrations determined above. Pause positions and burst velocities were determined by fitting the traces piecewise to three-
segment lines by a non-linear least-squares method (GraphPad Prism), constraining the velocity of the middle segment to zero.
Template intensities were determined using a custom-written ImageJ macro, using a circle of radius 5 pixels drawn at the fitted
template position in each frame. Background intensities were subtracted from the data using a circle of 5-pixel radius drawn above
or below the midpoint of the template track. The intensity in each track was normalized, assuming the maximum intensity would
correspond to the template size (�8.6 kb). Unwinding velocities were determined by linear fits to the normalized intensity data, using
the pause points determined above to define the periods of unwinding. Only unwinding rates from active replisomes were deter-
mined, although data were pooled from terminal unwinding events and unwinding events that occurred midway through synthesis.
Processivity values were determined independently of the TrackMate method by projecting the maximum intensity per frame over
the image stack to generate a composite image showing the tracking of the template over time. The length of the track at the reaction
end-point could thus be measured using the end-point procedure described below.
Replication fork rateswere determined from a single-segment linear fit, using the initiation and termination points of the fork as start
and end points of the line.
Cell 169, 1201–1213.e1–e8, June 15, 2017 e6
Live imaging with primaseFrames were averaged using a seven-frame sliding window, resulting in a time resolution of �1 s. The LoG tracking method above
could not sufficiently distinguish between template and the tail of duplex DNA behind the replication fork.We therefore used an edge-
detection method using a custom-written routine in Igor Pro (Wavemetrics). The intensity values of a 1D line profile (of constant co-
ordinates across the image stack) were taken across the molecule of interest, incorporating a �10-20 pixel flanking region on each
side of the molecule for calculation of an internal signal-to-noise standard. A low-pass frequency filter was applied to reduce noise
and the first-order differential of the data calculated to locate the intensity change-points. The background signal was then used to
calculate a detection threshold, using the background plus an arbitrary number of standard deviations above the mean (between 3
and 6, depending on the inherent signal-to-noise of the data). Positive (dsDNA tract start) and negative (dsDNA tract end) peaks in
the first-order differential exceeding the threshold were located using Igor Pro’s level-detection function. This method resulted in the
occasional detection of spurious edges, which could be eliminated by changing the number of standard deviations used for the
thresholding (at the expense of sensitivity), and by using a sliding-window algorithm to eliminate outliers. Replication fork rates
were thus determined by a linear fit to the data from initiation to termination, ignoring any pauses during the elongation phase. All
pixel values were converted to a leading-strand length value, taking into account the ssDNA,SSB or dsDNA content of the product
at a particular time-point. The same edge detection method was used for the special case of limiting primase (1 nM in flow) as per
Figures 6 andS6 andMovie S5. Growth of theOkazaki fragment, aswell as progression of the fork, was isolated andmonitored, fitting
the OF data piecewise to three-segment lines as necessary, as described above. Molecules whose paths coincided with stationary
template were rejected.
Lengths of replication end-productsEnd-point images, acquired in the absence of Mg2+ ion as described above in End-point replication reactions, consisted of stacks
of�20-50 images of each field with the flow on or off, as necessary (‘flow-on’ or ‘no-flow’, respectively). The signal-to-noise of these
images was inherently higher than for the live imaging data owing to the absence of Mg2+, so further denoising was unnecessary.
Image stacks (with or without flow) were median-averaged, then normalized by dividing by the ‘flat’ image, also described above.
For molecules where ‘no-flow’ data were acquired, a composite image of the ‘flow-on’ and ‘no-flow’ background-corrected images
was created by false-coloring the grayscale data, with the images overlaid but treated as separate channels (Figure S2). Molecules
were analyzed by using a custom-written routine in Igor Pro (Wavemetrics). The routine entails drawing a 1D line profile manually
across the molecule of interest; the start- and end-points of dsDNA tracts are then located by taking the first-order differential of
the 1D profile, and finding the crossing-points above a threshold, which was defined as at least three standard deviations above
the mean of an equivalent background 1D profile. For molecules that were subjected to the flow-cycling analysis to locate anchor
points, the anchor was assigned as the peak of the fluorescence along the same 1D profile in the ‘no-flow’ channel of the composite
image. The uncertainty introduced by this method is outlined with a dsDNA control in Figure S2C. We define ‘tracts’ as any contig-
uous pieces of SYTOX Orange-stained dsDNA without a resolvable gap (> 1.2 knt), but a ‘tract’ at higher primase concentrations
might consist of multiple OFs (Figure 4A).
Determination of Okazaki fragment terminusBackground-corrected images (using a ‘flat’ image; see End-point replication reactions above) from Alexa Fluor 488-labeled 30 endsand SYTOX Orange-stained dsDNAwere registered and overlaid to make a composite image, using at least ten fiducial markers pre-
sent in both channels across a number of fields. The ‘‘Landmark Correspondences’’ plugin of Fiji was used for registration (Schindelin
et al., 2012); rigid body rotation and translation of the SYTOXOrange imagewas allowed. The intensity profile of amolecule of interest
was taken from a line profile in the SYTOX Orange channel (dsDNA); dsDNA tract and gap positions were determined as above. The
same line coordinates were used to generate the Alexa Fluor 488 intensity profile as the SYTOX Orange channel; Okazaki fragment
30 termini were located on the line by fitting an arbitrary number of peaks to the intensity profile using Igor Pro’s multi-peak fitting
package, with a constant linear baseline. The mean and standard deviation of the background were determined from a line drawn
outside any molecules of interest; only peaks that were at least three standard deviations above the background mean were consid-
ered. Our method also labels the circular template, which is ignored in this analysis (Figure 5A).
To determine the precise locations of 30 termini in replication products, a 1D line profile was taken across each molecule based on
its SYTOXOrange fluorescence intensity. The 1D line profile of Alexa Fluor 488 intensity was then fitted to a series of Gaussian peaks;
Figure S5 shows fits for data at 320 nM (A), 10 nM (B) and 1 nM (C) primase; the flow-cycling method above was only necessary at
2 nM primase and below. We then used the positions of the foci to calculate mean OF lengths and priming distances as a function of
primase concentration.
DATA AND SOFTWARE AVAILABILITY
Four custom scripts used in this study have been made available at: https://github.com/jegra83/Cell_2017.
End-product flow and tract analyzer.ipf is an Igor Pro (WaveMetrics) macro both for measuring the lengths of replication end-prod-
ucts and finding the positions and lengths of dsDNA tracts from SYTOX Orange fluorescence micrographs, as defined in Figure 4A.
The macro detects the edges of tracts by taking the first derivative of a 1-dimensional (1D) line profile drawn across a molecule of
e7 Cell 169, 1201–1213.e1–e8, June 15, 2017

interest. Anchor points are determined, where appropriate, from images where the flowwas turned off. The user positions cursors on
an image flanking the molecule of interest; tract positions are shown interactively on a 1D fluorescent line profile, so false positives
can be identified. Positions of the starts and ends of ssDNA,SSB and dsDNA tracts recorded within a text file for subsequent cal-
culations, using the calibrations of Figure S1; the total length of a particular molecule is then merely the sum of the individual ssDNA
and dsDNA tract lengths for that molecule.
TrackMate XML to txt.py is a Python 2.7 script that converts the XML output of TrackMate into CSV format. TrackMate was used to
track the position of the rolling-circle template for live imaging without primase. The script outputs the frame number, x and y posi-
tions of the template, and the calculated displacement of the template, relative to the first frame in which the template was detected,
using the ssDNA,SSB extension versus flow calibrations of Figure S1.
Primase live imaging analyzer.ipf is an Igor Pro macro that automates the location of ssDNA,SSB and dsDNA tracts in time-series
data. It is functionally similar to End-product flow and tract analyzer.ipf described above. Like the macro described above, a 1D line
profile is taken across a molecule of interest, except that given the lower signal-to-noise in time-series data compared to static im-
ages, the profiles at each time-point were filtered using a low-pass filter, and smoothed using a boxcar function. Thismacro was used
for live imaging in the presence of primase both in Figure 1D–1G (320 nM primase) and Figure 6D–6H (1 nM primase).
Intensity analyzer.ijm is an ImageJ macro used for determining the intensity with respect to time of the rolling-circle template from
live imaging data in the absence of primase. It takes the xy coordinates of each molecule from time-series data (the output of
TrackMate XML to txt.py described above) and returns a time-series of the integrated intensity of a circle of radius 5 pixels drawn
at the exact location of the template. Background fluorescence was determined separately by integrating the intensity of another
circle of 5-pixel radius, in a fixed location in the same field, close to the trajectory of the molecule of interest, but across which
the template did not move during the imaging.
Cell 169, 1201–1213.e1–e8, June 15, 2017 e8
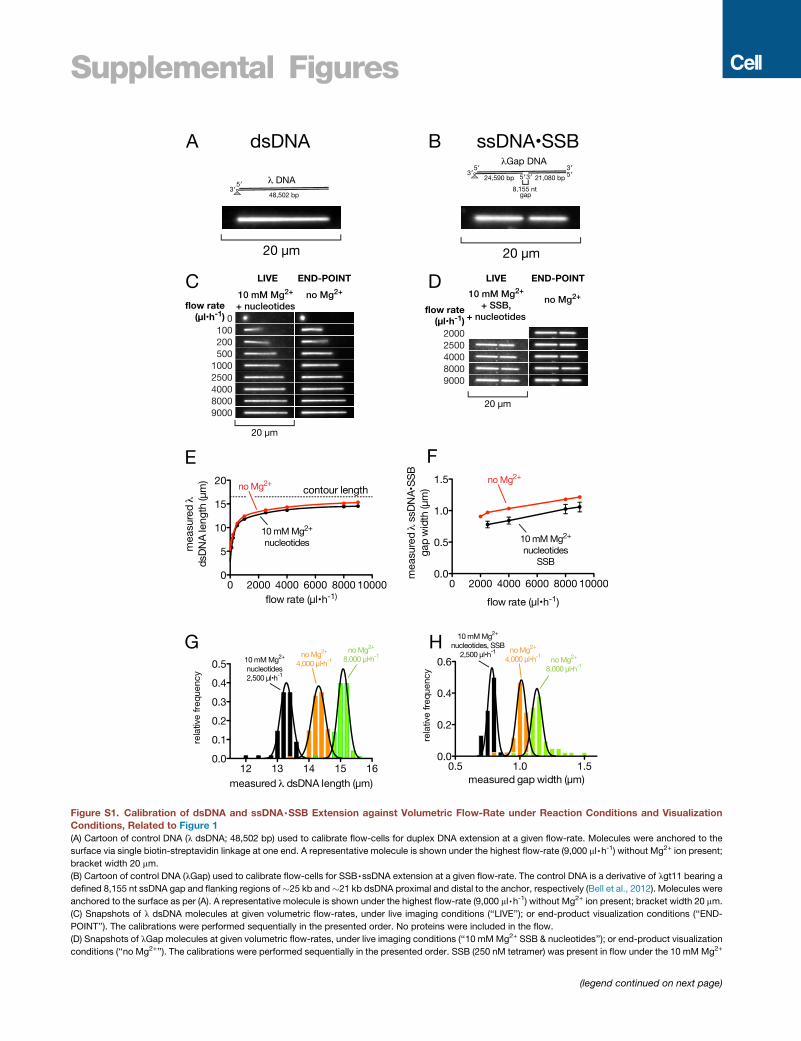
Supplemental Figures
Figure S1. Calibration of dsDNA and ssDNA,SSB Extension against Volumetric Flow-Rate under Reaction Conditions and VisualizationConditions, Related to Figure 1
(A) Cartoon of control DNA (l dsDNA; 48,502 bp) used to calibrate flow-cells for duplex DNA extension at a given flow-rate. Molecules were anchored to the
surface via single biotin-streptavidin linkage at one end. A representative molecule is shown under the highest flow-rate (9,000 ml,h-1) without Mg2+ ion present;
bracket width 20 mm.
(B) Cartoon of control DNA (lGap) used to calibrate flow-cells for SSB,ssDNA extension at a given flow-rate. The control DNA is a derivative of lgt11 bearing a
defined 8,155 nt ssDNA gap and flanking regions of�25 kb and �21 kb dsDNA proximal and distal to the anchor, respectively (Bell et al., 2012). Molecules were
anchored to the surface as per (A). A representative molecule is shown under the highest flow-rate (9,000 ml,h-1) without Mg2+ ion present; bracket width 20 mm.
(C) Snapshots of l dsDNA molecules at given volumetric flow-rates, under live imaging conditions (‘‘LIVE’’); or end-product visualization conditions (‘‘END-
POINT’’). The calibrations were performed sequentially in the presented order. No proteins were included in the flow.
(D) Snapshots of lGap molecules at given volumetric flow-rates, under live imaging conditions (‘‘10 mMMg2+ SSB & nucleotides’’); or end-product visualization
conditions (‘‘no Mg2+’’). The calibrations were performed sequentially in the presented order. SSB (250 nM tetramer) was present in flow under the 10 mMMg2+
(legend continued on next page)
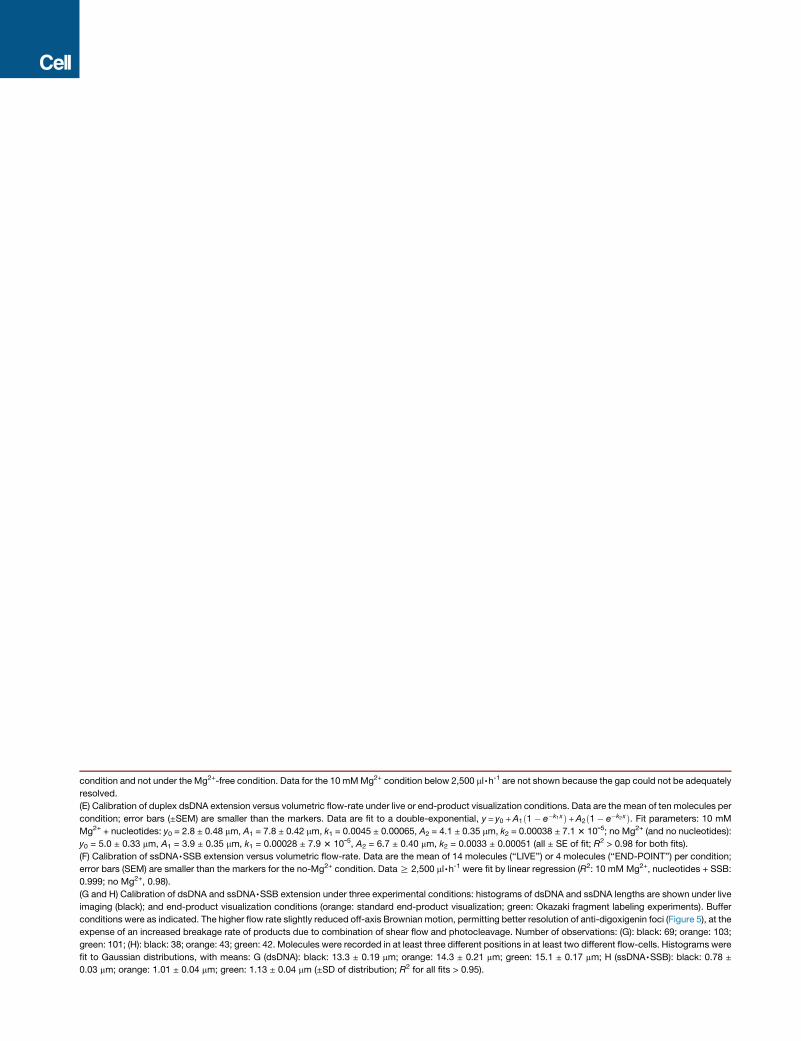
condition and not under the Mg2+-free condition. Data for the 10 mMMg2+ condition below 2,500 ml,h-1 are not shown because the gap could not be adequately
resolved.
(E) Calibration of duplex dsDNA extension versus volumetric flow-rate under live or end-product visualization conditions. Data are the mean of ten molecules per
condition; error bars (±SEM) are smaller than the markers. Data are fit to a double-exponential, y = y0 +A1ð1� e�k1xÞ+A2ð1� e�k2xÞ. Fit parameters: 10 mM
Mg2+ + nucleotides: y0 = 2.8 ± 0.48 mm, A1 = 7.8 ± 0.42 mm, k1 = 0.0045 ± 0.00065, A2 = 4.1 ± 0.35 mm, k2 = 0.00038 ± 7.13 10ˉ5; no Mg2+ (and no nucleotides):
y0 = 5.0 ± 0.33 mm, A1 = 3.9 ± 0.35 mm, k1 = 0.00028 ± 7.9 3 10ˉ5, A2 = 6.7 ± 0.40 mm, k2 = 0.0033 ± 0.00051 (all ± SE of fit; R2 > 0.98 for both fits).
(F) Calibration of ssDNA,SSB extension versus volumetric flow-rate. Data are the mean of 14 molecules (‘‘LIVE’’) or 4 molecules (‘‘END-POINT’’) per condition;
error bars (SEM) are smaller than the markers for the no-Mg2+ condition. DataR 2,500 ml,h-1 were fit by linear regression (R2: 10 mM Mg2+, nucleotides + SSB:
0.999; no Mg2+, 0.98).
(G and H) Calibration of dsDNA and ssDNA,SSB extension under three experimental conditions: histograms of dsDNA and ssDNA lengths are shown under live
imaging (black); and end-product visualization conditions (orange: standard end-product visualization; green: Okazaki fragment labeling experiments). Buffer
conditions were as indicated. The higher flow rate slightly reduced off-axis Brownian motion, permitting better resolution of anti-digoxigenin foci (Figure 5), at the
expense of an increased breakage rate of products due to combination of shear flow and photocleavage. Number of observations: (G): black: 69; orange: 103;
green: 101; (H): black: 38; orange: 43; green: 42. Molecules were recorded in at least three different positions in at least two different flow-cells. Histograms were
fit to Gaussian distributions, with means: G (dsDNA): black: 13.3 ± 0.19 mm; orange: 14.3 ± 0.21 mm; green: 15.1 ± 0.17 mm; H (ssDNA,SSB): black: 0.78 ±
0.03 mm; orange: 1.01 ± 0.04 mm; green: 1.13 ± 0.04 mm (±SD of distribution; R2 for all fits > 0.95).

Figure S2. Determination of the Anchor-Point of Leading-Strand Replication Products, Related to Figure 2
(A) Validation of the method used to determine anchor points of replication products using a l dsDNA control. Cartoon showing flow-cycling method used to
determine anchor points of l dsDNA, with coiled molecules in cyan and flow-extended molecules in magenta, as per Figure 2B-2G.
(B) False-colored, representative molecule showing SYTOXOrange-stained l dsDNA. The positioning error of the anchor-point is determined from the difference
in position between the half-maximum of the intensity of the l dsDNA at the anchored end (gray dashed line) and the anchor point as determined by shutting off
the flow (cyan dashed line).
(C) Positional accuracy of the anchor points determined by the flow-cyclingmethod, calculated from 53 l dsDNAmolecules that were subjected to the analysis of
(B). The root-mean-squared variation of the determined compared with the actual anchor point was ± 410 bp, �0.5% the mean length of a replication product
from a 10 min reaction.
(D) Cartoon showing flow-cycling method used to determine anchor points in reactions that are expected to produce only ssDNA, as per (A).
(E) False-colored, representative molecule showing SYTOX Orange-stained replication product in a reaction lacking primase. Anchor point was determined by
taking the mean position of the coiled molecule by recording the average of multiple frames with the flow turned off, and the product length determined by the
distance from anchor to the half-maximum intensity of the circular template of the product when extended. Plot below shows fluorescence intensity profile of a
line drawn across the axis of extension of the molecule.

(legend on next page)
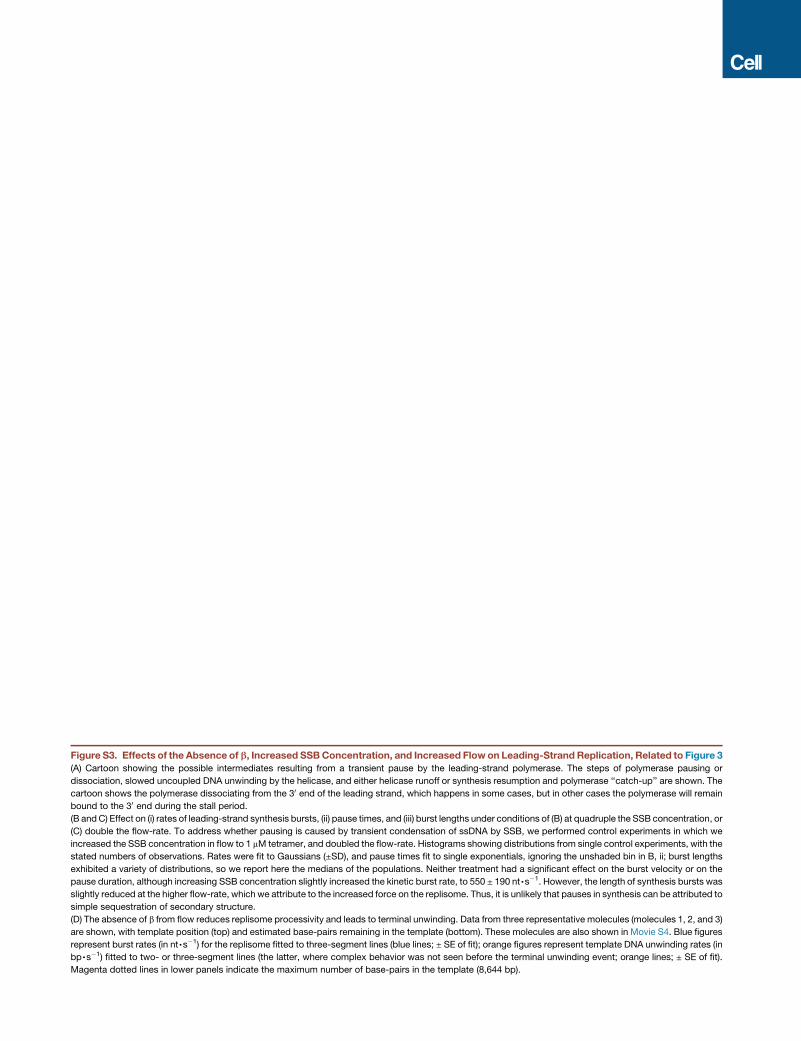
Figure S3. Effects of the Absence of b, Increased SSBConcentration, and Increased Flow on Leading-Strand Replication, Related to Figure 3
(A) Cartoon showing the possible intermediates resulting from a transient pause by the leading-strand polymerase. The steps of polymerase pausing or
dissociation, slowed uncoupled DNA unwinding by the helicase, and either helicase runoff or synthesis resumption and polymerase ‘‘catch-up’’ are shown. The
cartoon shows the polymerase dissociating from the 30 end of the leading strand, which happens in some cases, but in other cases the polymerase will remain
bound to the 30 end during the stall period.
(B andC) Effect on (i) rates of leading-strand synthesis bursts, (ii) pause times, and (iii) burst lengths under conditions of (B) at quadruple the SSB concentration, or
(C) double the flow-rate. To address whether pausing is caused by transient condensation of ssDNA by SSB, we performed control experiments in which we
increased the SSB concentration in flow to 1 mM tetramer, and doubled the flow-rate. Histograms showing distributions from single control experiments, with the
stated numbers of observations. Rates were fit to Gaussians (±SD), and pause times fit to single exponentials, ignoring the unshaded bin in B, ii; burst lengths
exhibited a variety of distributions, so we report here the medians of the populations. Neither treatment had a significant effect on the burst velocity or on the
pause duration, although increasing SSB concentration slightly increased the kinetic burst rate, to 550 ± 190 nt,s�1. However, the length of synthesis bursts was
slightly reduced at the higher flow-rate, which we attribute to the increased force on the replisome. Thus, it is unlikely that pauses in synthesis can be attributed to
simple sequestration of secondary structure.
(D) The absence of b from flow reduces replisome processivity and leads to terminal unwinding. Data from three representative molecules (molecules 1, 2, and 3)
are shown, with template position (top) and estimated base-pairs remaining in the template (bottom). These molecules are also shown in Movie S4. Blue figures
represent burst rates (in nt,s�1) for the replisome fitted to three-segment lines (blue lines; ± SE of fit); orange figures represent template DNA unwinding rates (in
bp,s�1) fitted to two- or three-segment lines (the latter, where complex behavior was not seen before the terminal unwinding event; orange lines; ± SE of fit).
Magenta dotted lines in lower panels indicate the maximum number of base-pairs in the template (8,644 bp).

Figure S4. The Length of the Leading Strand in Replication Products Is Independent of Primase Concentration, Related to Figure 4
(A) Cartoon showing the method used to determine anchor points of replication products at low primase concentration: flow was turned off, and replication
products allowed to extend from their anchors (cyan); products were also imaged with the flow on (magenta).
(B) Representative product at 2 nM primase with the intensity profile of a 1D line drawn through the molecule shown underneath. Scale bars show lengths of
SSB,ssDNA (red) and dsDNA (black), for these flow conditions.
(C) Graph showing total molecule (leading-strand, SSB,ssDNA plus dsDNA) length as a function of primase. Data are the means of means (±SEM) from at least
three experiments. Blue line is a linear fit to the data, with blue shading indicating 95% confidence bands of fit.
(D) Histograms showing total product lengths as primase is increased from 0 to 320 nM. Data pooled from at least three experiments, with the number of ob-
servations and the population median stated on the histograms.
(legend continued on next page)

(E) Total dsDNA (black), total ssDNA (red), and total product length (blue) for replication products, with reactions performed in the presence of 320 nMof wild-type
primase (solid bars), or two catalytic mutants (D269A; shaded bars, D269Q; open bars). Data shown are the means (±SEM) from three replicates. Median dsDNA
content, 7.4 kb (IQR, 2.0-16.0 kb) and none detected for D269A and D269Q, respectively; median total lengths: D269A, 70 knt; D269Q, 72 knt (IQR, 42-100 knt
and 43-101 knt, respectively). Replicates, N = 3; molecules: D269A, n = 195; D269Q, n = 173.
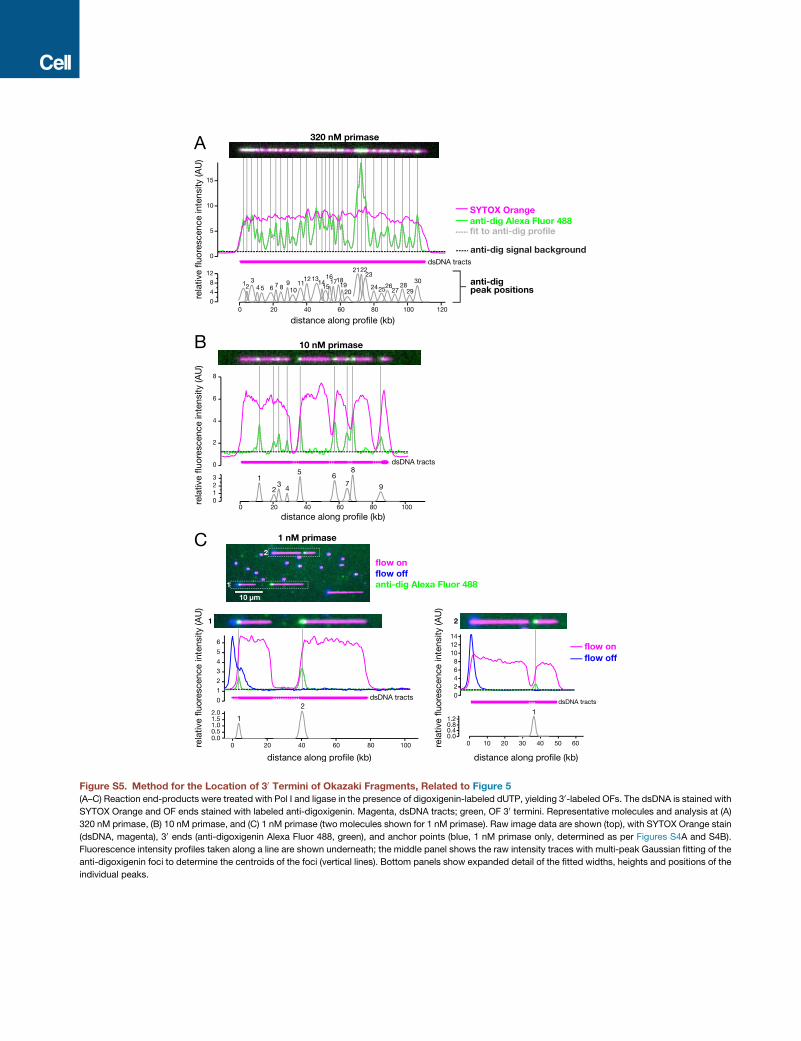
Figure S5. Method for the Location of 30 Termini of Okazaki Fragments, Related to Figure 5(A–C) Reaction end-products were treated with Pol I and ligase in the presence of digoxigenin-labeled dUTP, yielding 30-labeled OFs. The dsDNA is stained with
SYTOX Orange and OF ends stained with labeled anti-digoxigenin. Magenta, dsDNA tracts; green, OF 30 termini. Representative molecules and analysis at (A)
320 nM primase, (B) 10 nM primase, and (C) 1 nM primase (two molecules shown for 1 nM primase). Raw image data are shown (top), with SYTOX Orange stain
(dsDNA, magenta), 30 ends (anti-digoxigenin Alexa Fluor 488, green), and anchor points (blue, 1 nM primase only, determined as per Figures S4A and S4B).
Fluorescence intensity profiles taken along a line are shown underneath; the middle panel shows the raw intensity traces with multi-peak Gaussian fitting of the
anti-digoxigenin foci to determine the centroids of the foci (vertical lines). Bottom panels show expanded detail of the fitted widths, heights and positions of the
individual peaks.

Figure S6. Okazaki Fragment Synthesis Rates and Lengths, Determined from End-Point and Live Imaging Experiments, Related to Figure 6
(A) Histogram showing distribution of Okazaki fragment lengths determined directly from 30 end-labeling experiments (Figures 5 and S5). Data (N = 3) pooled from
experiments at 1 nM (N = 2) and 2 nM primase (N = 1), with 62 observations.
(B) OF lengths determined from live imaging experiments, where products were continuously held under flow; N = 5.
(C) Representative kymograph of molecule 1 (as identified in Figure 6D-G) undergoing periods of leading- and lagging-strand synthesis in the presence of 1 nM
primase and SYTOX Orange dsDNA stain. Cartoon shows an interpretation of fluorescent signal at 400 s.
(D) Example traces for the threemolecules identified in Figure 6D (i, ii and iii), showing detection of edges of Okazaki fragments (red) and the circular template (dark
blue), and thereby the definition of Okazaki fragment length (red, x), leading-strand length (blue, y) and the anchor point (dotted black line). Molecule 3 exhibits two
phases of template unwinding at approx. 225 and 350 s, the latter of which is terminal.
(E) (i) Plot of the absolute length of molecule 1 as a function of time, as judged by the distance from the anchor-point to the nearest edge of the template. (ii) Plot of
the length of molecule 1 converted to base-pairs, taking into account the relative compaction of dsDNA versus ssDNA,SSB.