independent retailer restocking choices in urban goods
TRANSCRIPT

Vol.:(0123456789)
https://doi.org/10.1007/s11067-021-09555-4
1 3
Independent Retailer Restocking Choices in Urban Goods Movement and Interaction Effects with Traditional Markets
Taufiq Suryo Nugroho1 · Chandra Balijepalli1 · Anthony Whiteing1
Accepted: 20 June 2021 © The Author(s) 2021
AbstractTraditional markets play a key role in local supply chains in many countries, often influencing retailer decisions due to their inherent attractiveness. In contrast to restocking choices for retailers as part of large chains, choices of independent retailers driven by local traditional markets have not been widely researched and are not well understood. This paper analyses the factors influencing independent retailer restocking choices and investigates the interplay between the presence of tra-ditional markets and retailer choices. Bandung city in Indonesia is chosen for the study where independent retailers are prevalent, and where a number of traditional markets are thriving. A retrospective questionnaire was used to capture independent retailer restocking behaviour and generation models were calibrated to arrive at the trip propensity. Discrete choice models were estimated to explain the retailer prefer-ences for supplier location and transport service choice. Results indicate that trips generated by independent retailers are explained by the presence of traditional mar-kets and retailers’ vehicle ownership, in addition to the standard variables such as number of persons employed, weekly goods demand and average shipment weight. As for restocking location choice, retailers are more likely to choose suppliers within a traditional market where the number of wholesaler units is larger. Furthermore, the choice of traditional markets has a positive influence on whether retailers choose to use their own vehicle to restock their shops.
Keywords Urban goods movement · Traditional markets · Independent retailers · Chain retailers · Restocking activities
* Taufiq Suryo Nugroho [email protected]; [email protected]
1 Institute for Transport Studies, University of Leeds, Leeds LS2 9JT, England
Published online: 30 October 2021
Networks and Spatial Economics (2021) 21:933–969
/

1 3
1 Introduction
Urban economic development requires effective urban goods movement (UGM). UGM refers to all activities concerning the movement of goods within an urban area and its operation is primarily determined by private sector businesses who aim to find the most effective and efficient way of procuring and supplying goods that they deal with. Such activities may include shopping, retailing, food markets, parcel transport, home deliveries, and service activities such as garbage collec-tion, building maintenance etc. Despite the importance of UGM in keeping the city sustainable, UGM also incurs negative externalities such as congestion and pollution, as well as affecting road safety. Local governments around the world have become increasingly aware of these issues and aim to solve the problems in their respective urban areas by introducing city logistics measures (Dablanc 2007). Their objective is usually to find an optimal solution for all stakeholders involved, including local citizens and their personal movements, as well as busi-nesses and their freight requirements (Ogden 1992).
Despite many forms of UGM, retailing is still one of the main sources account-ing for 30–40% deliveries across cities (Dablanc 2009). Therefore, a key pre-requisite to developing an efficient city logistics policy is to understand retailer restocking activities. Retailing activities can vary widely between cities and coun-tries. The diversity of retailing activities between cities around the globe results in variations in how local authorities approach this problem (Dablanc 2007; Visser and van Binsbergen 1999). For instance, in many cities, particularly in the devel-oped world, the development of an urban distribution centre is appealing since it is viewed as a way to consolidating the goods and improving the efficiency of deliv-ery operations (Morganti and Gonzalez-Feliu 2015; Paddeu 2017). Other cities may implement measures such as off-peak hour delivery, weight and size restric-tions, and environment protected zones (Taniguchi et al. 2003; Holguín-Veras et al. 2008).
Nevertheless, there is a clear gap in our understanding of the situation in cit-ies where the predominant retail actors are independent businesses, as opposed to chain retailers. Independent retailers are typically small sized businesses in which individual owners take on the logistic decisions by themselves. They tend to be less consolidated than the chain retailers. Although mostly prevalent in develop-ing countries, independent retailers can also play important supply chain roles in an urban context even in more developed countries. For example, Alho and e Silva (2015) suggest that most retailers in the Portuguese capital of Lisbon are independent retailers.
Independent retailer restocking activities can be handled on own account, i.e. the transport is done by retailers using their own employee and fleet, or by a third party operator i.e. a professional carrier is paid to undertake the transport (Russo and Comi 2010). The split between these varies significantly. In typical north American and European cities, the shares between using own account and third party logistics may be around half each (Dell’Olio et al. 2017), but in develop-ing countries, own account is more dominant. For instance, a study carried out in
934 T. S. Nugroho et al.
1 3
2004 in Medan, Indonesia, reveals that 90% of the businesses surveyed used their own account vehicles to restock (Kato and Sato 2006).
Traditional markets are prevalent in cities where supply chain plays a key role in providing cities with goods (Nielsen 2015). Traditional markets act as a hub in linking the suppliers from outside of a city with the retailers in the city. The role of traditional markets in shaping the supply chain within a city is well noted in the literature (Cadilhon et al. 2006; Rahadi 2012), but the impact of the presence of tra-ditional markets on retailer restocking activities is still unknown.
Given the unique way in which independent retailers shape overall urban activities, it is important to understand the impacts of independent retailer restocking activities on traffic congestion, particularly in a city where independent retailers dominate. As urbanization grows rapidly, whilst the development of more established chain retail-ers remains relatively slow, independent retailers will continue to play a major role in providing the population with goods they need ( Herzog 2009). Independent retailers are also important to the economy because they provide jobs for younger generations. Yet the problems incurred by these activities in terms of congestion and pollution are still relatively unknown. Local authorities need to understand the nature of restock-ing activities undertaken by independent retailers to be able to develop effective city logistics policies. The lack of knowledge on how restocking activities are conducted by retailers can result in inefficient policy-making that not only hinders the economy but also worsens congestion and pollution (Quak and de Koster 2006).
The aim of this paper is to analyse independent retailer restocking activities in the presence of traditional markets. The paper builds a demand model to explain the fac-tors influencing independent retailer decisions regarding restocking activities. The paper also estimates supplier location choice and transport service choice involved in restocking by retailers. The main contributions of the paper are two-fold—(i) it develops new insights into independent retailer restocking activities particularly in the developing countries context through an establishment survey conducted in the study area; and (ii) it investigates and quantifies the factors influencing restocking activity by building appropriate demand/choice models. In particular, this paper addresses the importance of traditional markets in retailer decision making. To the authors’ knowledge, this is the first paper to shed light on how independent retailers restocking activities are undertaken and how their decisions are influenced by tradi-tional markets.
Research towards developing an understanding of different types of retailing activities in cities around the world is inherently demanding since such studies are highly data driven and involve collection of data from a number of private establish-ments. This research has carried out an establishment survey and built models to understand the nature of restocking activities undertaken by independent retailers. These models have strong practical implication towards developing better city logis-tics measures in cities where independent retailers are prevalent.
This paper is divided into six sections including the introductory section. Section 2 reviews independent retailer decision making by contrasting how independent retail-ers have different decision-making processes compared to chain retailers. Section 3 describes the role of traditional markets specifically in the study area to provide context for the research. Data collection and survey design are explained in Sect. 4. Section 5
935Independent Retailer Restocking Choices in Urban Goods Movement…

1 3
analyses the survey data, explains the model building process and interprets the results. Section 6 discusses policy implications of the model before concluding the paper.
2 An Overview of Independent Retailer Restocking Activities
Retailer restocking as an important generator of UGM has attracted researchers to study the activity and its impact on urban environment. The size of the prob-lem relating to retailer restocking activities varies considerably between different cities and has been studied extensively in developed cities. The studies include extensive survey methods related to retailer activities (Alho and e Silva 2015; Toilier et al. 2016); modelling and forecasting of demand (Wisetjindawat et al. 2007; Russo and Comi 2011; Nuzzolo and Comi 2014) and reviews of policies and their implementation (Cherrett et al. 2012; Visser and van Binsbergen 1999), as well as the spatial problem of urban logistics facilities (Sakai et al. 2015; Heitz et al. 2018). However, it is notable that most of these studies were conducted in the context of cities in which the predominant retailers are chain retailers.
Cities in developed countries tend to have many larger retailers who are chain retailers while in developing cities, smaller independent retailers are more prev-alent (De Magalhães 2010). Previous studies suggest that independent retailers will act differently from chain retailers in terms of operating their shops (Shaw and Gibbs 1999). Particularly, they differ in selecting supplier channels and in the factors that determine how and when the restocking is undertaken (Comi and Nuzzolo 2014). Chain retailers comprise large retailers whose restocking activities are managed centrally through distribution centres (Fernie et al. 2010) or through professional supply chain managers (Golhar and Banerjee 2013). In this sense, each outlet of a chain retailer does not decide its restocking activi-ties, rather decisions are taken centrally. In contrast, an independent retailer is a business usually owned by a single person or a family, and thus decisions are almost always made by the owners. These retailers usually face multiple supplier channel options to procure their stocks, such as going to wholesalers in tradi-tional markets or buying directly from local producers (see Fig. 1). Typically, an independent retailer chooses a supplier channel to procure some types of goods but uses other channels to procure other types of goods. The decision typically depends on the type of good itself and the supplier channel characteristics such as the trading relationship between the retailers and the suppliers (Praharsi et al. 2014).
An independent retailer also decides on how and when the goods are transported to the shop. In that sense, the restocking activity by an independent retailer may be seen as quite similar to shopping activity done by an end-use consumer. Two types of macro behaviour related to shopping activities are described in the literature: pull and push behaviour (Comi et al. 2014). Pull type of behaviour resembles gen-eral shopping activities, in that the retailer travels to the purchase location and then brings back the goods. Usually, the retailer uses their own vehicle to perform such trips. Push type behaviour refers to deliveries of goods after a retailer has purchased them from a supplier. The purchasing process can be done at the supplier location
936 T. S. Nugroho et al.

1 3
or at other locations. In this case, the retailers do not decide on the ways the goods are transported. The supplier can deliver the goods themselves or use the services of carriers. These two macro behaviours describe how decisions made by independ-ent retailers can generate various transport demands. For instance, push behaviour involves transport by suppliers or carriers who may aim to generate tours/chain trips in order to deliver goods to various retailers to benefit from consolidation and econ-omy of scale effects. Meanwhile, retailers using their own vehicle to undertake pull type behaviour will typically generate a round trip, i.e. the retailer travels in their own vehicle to restock from one supplier and then travels back to the shop.
Previous studies have suggested that the manner in which goods are transported to independent retailers depends on the context. In Japan, retailer data in Metropoli-tan Tokyo was used to build a simulation model of goods procurement across the city (Wisetjindawat et al. 2007). The model is based on the assumption that each retailer procures goods according to push movements in which goods are delivered by the suppliers. In this case, the carrier and vehicle choices are explicitly modelled as the supplier’s decision. Meanwhile, Russo and Comi (2010) and Nuzzolo and Comi (2014) build models for independent retailers in cities in the Italian setting. They categorize the restocking movements into pull and push movements, which means that retailers in the respective study have an option to restock their shop using their own vehicles. Hence, in these models, the type of movement; the amount of
Fig. 1 Independent retailer sup-ply chain options
937Independent Retailer Restocking Choices in Urban Goods Movement…

1 3
quantity acquired per trip; and the possible number of stops per trip are included in the decision models.
To summarise, the main decisions made by independent retailers can be divided into two categories: decisions on the choice of supplier location, and decisions on the man-ner in which the goods are transported. Once a decision to use the retailer’s own vehicle is made, additional choices may involve the mode choice (Wang and Hu 2012) and the shipment choice (Holguín-Veras 2002), and the decisions and attributes affecting such decisions will depend on the study area. It is notable that there is a paucity of studies into the decisions of independent retailer restocking activities in which traditional markets play an influencing role in supply chains. Thus, by performing an establishment survey in the study area of Bandung, the current study attempts to fill the identified gaps.
3 Independent Retailers and Traditional Markets in Bandung
Metropolitan Bandung is the capital of West Java Province, Indonesia. Bandung has the fifth highest population in the country with 2.5 million inhabitants in 2015 and possesses the third largest economy on Java Island. Bandung city, like many other cit-ies in Indonesia, houses many independent retailers. There were estimated to be more than 26,000 independent retailers across the city in 2014, compared to less than 700 chain retailer outlets (BPS 2015). Though the growth rate in chain retailers is higher than that for independent outlets, there remains remarkable growth in independent retailers, at over 18% during the five-year period between 2009 and 2014 (Fig. 2).
In Indonesia, traditional markets play a key role in supply chains, with trade accounting for more than 80% of the total trade volume (Dyck et al. 2012). In
Fig. 2 Total number of chain retailer outlets vs independent retailer shops ( Source: BPS Indonesia; PODES survey)
938 T. S. Nugroho et al.

1 3
Bandung, a total of 37 traditional markets exist typically serving distinct parts of the city (see Fig. 3 for a spread of traditional markets in Bandung). The attractive-ness of traditional markets to consumers is well known, reasons mentioned in the literature include cheaper products, high quality of the produce, and high levels of service provided by traders (Rahadi 2012).
This study covers independent retailers in Bandung city centre (BCC) – identified by grey colour in Fig. 3. BCC is the home to a sizeable number of independent retail-ers and major traditional markets. BCC has a mixed land use of commercial (trade and service) and residential areas (see Fig. 4). Government offices are located mainly in the centre of BCC, whilst many business establishments are located in the North-West in which Pasar Baru, the biggest traditional market in Bandung, is located. In contrast, the south-east area of BCC is mainly residential. The land use pattern makes the BCC area very crowded, and trip demand by both passenger and goods vehicles is very high.
4 Data Collection Process: Survey Design and Sampling
In order to study the factors influencing independent retailer restocking activities, an establishment survey questionnaire was designed. Establishment surveys are a com-mon instrument in UGM studies. They can be used to gather most of the information typically needed such as economic characteristics, supply chains, number of vehicle
Fig. 3 The location of major traditional markets at Bandung
939Independent Retailer Restocking Choices in Urban Goods Movement…

1 3
deliveries and vehicle trip purpose among other details (Alho and e Silva 2015). Despite the usefulness of establishment surveys, there are no standards regarding their content and structure, sampling methods, or survey technique, and these will vary according to the purpose/nature of the specific study and the influence of local context.
In this study, a specially designed questionnaire is used to determine the retro-spective choices made by independent retailers in terms of supplier location deci-sions as well as the method of transporting the goods procured. The questionnaire utilises open questions to ask the supplier location and name; travel time between retailer location and supplier location, direct transport cost, and frequency of restock-ing activities. Multiple choice options are used to obtain the data such as type of goods that are sold in the shop, the demand for goods per week, and parking/loading bay availability. The questionnaire comprises five sections (See Online Appendix for English version of the questionnaire, though the actual form used for the survey was translated to Bahasa). Section A contains compulsory questions to gather basic inde-pendent retailer information such as the address of the independent retailer, number of persons employed, total floor area of the shop, and vehicle ownership. Section B collects data about the goods that are sold by the retailers. This section also collects the characteristics of suppliers, including their locations. Section C asks how often and when restocking activities are undertaken by independent retailers. Data on trans-port costs for each restocking activity are also gathered in this section. Section D col-lects data about parking and loading/ unloading activities, and Section E is optional about the identity of the owner or the employee responding to the questionnaire. In
Fig. 4 Bandung city centre land use
940 T. S. Nugroho et al.

1 3
Sections A and B we collect the address of the retailers and the location of suppli-ers to estimate crow-fly distances using a GIS map application. These distances were then used to estimate the average distance between retailers and suppliers in each traf-fic zone for the subsequent demand modelling stage.
The survey was conducted in BCC area on typical working days spread over a four-week period in Nov-Dec 2016. In brief, BCC consists of 11 sub-districts and samples of independent retailers in each sub-district were loosely apportioned rela-tive to the number of establishments. The initial approach was to spread the sam-ple, exactly, in proportion of the number of establishments. However, this resulted in very small samples in certain zones e.g. Ciateul, Cikawao and Paledang. Hence, the samples were adjusted upward with an arbitrary minimum of 10 per sub-district though keeping the total intact. Establishments in some zones were found challeng-ing to locate due to the low density of their geo-spatial spread (e.g. Balong Gede and Pungkur). Moreover, there were many refusals to share the information in some sub-districts including Nyengseret and Kebon Pisang. Thus, in the end, the sample obtained looks somewhat different to that originally planned (See Table 1).
Given the complex nature of the questionnaire, this study opted to use a face-to-face technique to gather the data. The face-to-face technique was chosen because it gives a better response rate than an online or self-completion survey. It also gives better data validity and avoids incomplete questionnaires (Allen et al. 2012). The survey was undertaken by enumerators specially recruited for the study, who were provided with questionnaire forms and maps of the sub-district they were assigned to. In total, we recruited six people to undertake the survey. We divided the enu-merators into three groups (i.e. two persons per group) and assigned each group to a specific location in Bandung city centre.
The enumerators were trained before they were allowed to interview and we also conducted a pilot survey to help the process further. The aim of the pilot survey was
Table 1 Survey sample: planned vs actual
*Percentage of planned sample
Sub-district Population Planned sample 1st Phase 2nd phase Total actual sample (%*)
Balong Gede (BG) 162 15 4 4 8 (53%)Braga (BR) 812 25 15 14 29 (116%)Ciateul (CA) 19 10 6 3 9 (90%)Cibadak (CB) 4788 55 32 22 54 (98%)Cikawao (CK) 25 10 4 3 7 (70%)Karang Anyar (KA) 260 20 15 17 32 (160%)Kebon Jeruk (KJ) 819 25 10 10 20 (80%)Kebon Pisang (KP) 1432 40 13 20 33 (83%)Nyengseret (NY) 1548 40 5 17 22 (55%)Paledang (PA) 16 10 4 4 8 (80%)Pungkur (PU) 28 15 9 4 13 (87%)Total 9909 265 117 118 235 (89%)
941Independent Retailer Restocking Choices in Urban Goods Movement…

1 3
to familiarise the enumerators with the task and also the phrasing of questions on the survey form was checked.
The main survey was divided into two phases. In the first phase, we targeted to obtain at least 50% of the planned samples in each sub-district. From the pilot sur-vey, we learnt that some sub-districts had fewer independent retailers than antici-pated due to the high density of residential property development in these areas. Therefore, in the first phase, we focused on those sub-districts which had fewer retailers so that if we could not meet the target in the first phase, we would then be able to review the numbers and push forward to reach the targeted numbers in the second phase. No prior contact with the independent retailers was possible due to the lack of contact information. Thus, the enumerators interviewed the independ-ent retailer they first met, and after obtaining their consent conducted the survey as per the questionnaire before moving on to the next, and so on. On an average it took 14 min to complete each interview.
5 Statistical Analysis of Survey Data and Model Building
5.1 Descriptive Analysis
A total of 265 questionnaires were distributed, and of these, 235 questionnaires were successfully completed during the survey. The overall response rate was 89%, and the lowest response rate across all sub-districts was 53%. The response rate was higher than the average response rate mentioned in the literature (Alho and e Silva 2015). Reasons for the relatively high response rate might include the fact that many independent retailers in Bandung are very small businesses in which the owner usu-ally also works personally and is knowledgeable about restocking activities. Moreo-ver, the interviewers were specially trained for the survey. Conducting the interview in the local language also promoted a high response rate. After a preliminary quality check, 224 questionnaires were deemed to be suitable for detailed analysis.
Providing overall characteristics of independent retailers allows for a better under-standing of the case of Bandung, and also facilitates comparison with other studies. The majority of the retailers are small businesses and occupy 23.24 m2 on average. 38% of the independent retailers hire one employee, and 29% hire two employees. Only 17% of them hire more than two employees, and 16% of them operate the store by themselves. Regarding vehicle ownership, most retailers have at least one vehi-cle, either a two-wheeler or a delivery van (87%). Among those who have their own vehicle, 19% have a delivery van, 73% have a two wheeler, and 8% have both. The others operate their shops without owning any vehicle (13%), indicating that they operate by requesting the goods to be delivered by their suppliers (push mode).
Independent retailers in Bandung typically sell essential everyday goods to end-use consumers, ranging from instant food to home appliances (see Fig. 5). Each independent retailer usually has a specific supplier for each line of goods. Hence, it is often necessary to receive multiple deliveries or to make multiple trips to procure
942 T. S. Nugroho et al.

1 3
the full range of products sold. Because of the large numbers of possible suppliers, the buying price of each product usually varies from one supplier to another as can be seen from the coefficient of variation of the buying price (see Fig. 6). The buying price varies further if the goods have different brands and/or packaging types. If the goods have more generic packaging and measurements, e.g. rice, sugar, flour, and gas cylinders, price variations tend to be lower.
In terms of supplier location choice, the survey revealed that more than half of restocking decisions (224 out of 412) preferred suppliers inside BCC (Fig. 7). The proportion increases to 73% (303 decisions out of 412), if we also include supplier location zones adjacent to BCC, namely Ancol, Ciroyom, and Situsaeur. Interestingly, 125 out of 303 decisions (41%) chose the traditional markets high-lighting the importance of such markets for the supply chains concerned. The supplier zones in residential areas, e.g. Paledang, Ciateul and Cikawao, are less attractive to the retailers as the number of establishments is significantly less than that in more commercial areas.
Fig. 5 Percentage of independ-ent retailers selling each type of goods
3%
3%
4%
11%
12%
16%
29%
37%
37%
38%
40%
53%
56%
58%
69%
74%
86%
88%
89%
0% 50% 100%
Home Appliances
Fruit and Vegetable
Kitchen Utensils
Gas Tube
Electronics
Rice
Sta onaries
Eggs
Salt
Baby Product
Flour
Sugar
Vegetable oil
Dairy Product
Drugs and Pharmacy
Household
Canned Drink
Tobacco
Instant Food
% independent retailer
943Independent Retailer Restocking Choices in Urban Goods Movement…

1 3
Supplier location attractiveness tends to be affected by the total number of establishments in the area. The presence of a traditional market boosts the total number of establishments in BCC area as shown by Fig. 8a, b. The major tra-ditional markets inside BCC viz., Pasar Baru and Kosambi are home to a large number of establishments and thus increase the total number of establishments in the area. Meanwhile, adjacent zones to BCC viz., Ancol, Ciroyom, and Situsaer also have a major traditional market each and thus also have large numbers of establishments.
The survey reveals that on an average more than half the commodities acquired by independent retailers come from traditional markets (54%), hence it is evident that the traditional markets are successfully attracting retailers from the local area to restock. Most types of goods (76%) acquired in this way are non-perishables, whereas perishables such as dairy products, eggs and fruit/vegetables tend to be
Fig. 6 Coefficient of variation of buying price
0.300.33
0.660.13
1.570.11
0.700.12
0.501.30
0.270.200.26
0.631.04
0.520.47
0.160.45
0.00 1.00 2.00
Home AppliancesFruit and Vegetable
Kitchen UtensilsGas Tube
ElectronicsRice
Sta�onariesEggsSalt
Baby ProductFlourSugar
Vegetable oilDairy Product
Drugs and PharmacyHousehold
Canned DrinkTobacco
Instant Food
Cov Of buying price
944 T. S. Nugroho et al.

1 3
procured from elsewhere. The survey also reveals that the average prices for both non-perishable and perishable goods in establishments inside traditional markets tend to be lower than those offered in non-traditional establishments (see Fig. 9).
Regarding transport service choice, as might be expected from the high vehicle ownership the majority of restocking trips are made using the retailers’ own vehicles in a pull mode (79%). Only 21% of trips are made by delivery services (push mode). Interestingly, the survey reveals that relatively few deliveries are charged, implying that independent retailers using the push mode are paying prices inclusive of deliv-ery. However, most independent retailers prefer to procure goods using their own vehicles because this offers a greater flexibility in terms of inventory management, though many factors are believed to affect the decisions to choose a particular trans-port service (Comi and Nuzzolo 2014; Russo and Comi 2010).
We now turn our attention to the availability of parking for loading/unloading activities. Currently, the local authority does not apply any parking restrictions on most streets in BCC. Thus, carriageways commonly become parking places for road users, as well as becoming unloading bays for retailers. The survey shows that many retailers perceive the roadsides as their parking space and loading/unloading area. More than 50% of the retailers claim that they have a dedicated parking area and a dedicated loading bay at the front of the shop (see Fig. 10). However, the majority of retailers actually load/unload their goods on public roads (see Fig. 11). The lack of dedicated loading bays at the back or to the side of shop premises should be noted. Interestingly, delivery vehicles are found to use unloading bays at shop premises more than own vehicles. This could be because the delivery vehicles are unloading more goods, so the shop owner provides a dedicated unloading bay for them, which is also in line with another finding that delivery vehicles tend to need more time to unload the goods. The majority of retailers’ own vehicles spend less than 30 min unloading, whereas, delivery vehicles typically spend between 30–45 min unloading goods.
0% 5% 10% 15% 20% 25% 30% 35%
CiateulCikawaoPaledang
Karang AnyarSitusaeur
BragaBalong Gede
PungkurAncol
Kebon PisangKebon JerukNyengseret
CiroyomCibadak
Fig. 7 Supplier location choice based on the survey
945Independent Retailer Restocking Choices in Urban Goods Movement…

1 3
Fig. 8 a Number of establishments in traditional markets in BCC and around; b Total number of estab-lishments in BCC and adjacent sub-districts
946 T. S. Nugroho et al.

1 3
5.2 The Demand Model for Restocking Activities: Specification and Estimation
The descriptive analysis presented in the previous section suggests that the restock-ing trip performed by independent retailers depends on many factors. In particular, the presence of traditional markets and the ownership of a vehicle appear to have major influences on retailer restocking activities.
Therefore, in this section a demand model is proposed to complement the explor-atory analysis and to give a quantitative explanation of the factors affecting the retailers’ decisions. The modelling work aims to address the following questions:
Fig. 9 Average goods prices at traditional markets vs non-traditional markets
Fig. 10 Parking and loading bay availability
947Independent Retailer Restocking Choices in Urban Goods Movement…

1 3
(i) The effect of two wheeler ownership and the presence of traditional markets on the generation of trips;
(ii) Whether the presence of traditional market in a supplier location zone improves its attractiveness to retailers; and
(iii) The influence of vehicle ownership on retailers’ decisions when choosing a supplier location and transport service.
The demand models comprise a generation model and a restocking choice model within which supplier location choice and transport service choices are embedded. The data sets utilised in this study are outlined below.
5.2.1 The Data Sets
The retailer characteristics and restocking data was collected through the survey described earlier. The restocking activities are measured at a commodity level. We transform the data into trip decisions by grouping the commodity data according to the respective suppliers and modes. In other words, it is possible for an independent retailer to make more than one restocking trip based on the supplier location and the mode employed. The data for the restocking choice models are arranged by trip, because the independent retailers make restocking choice decisions at the trip level. In total, 224 retailers were interviewed who had made 412 restocking decisions,
Fig. 11 Places for unloading activities
948 T. S. Nugroho et al.

1 3
producing 303 restocking trips. These 303 trips were made inside the study area and are therefore included in the model.
The possible attributes for each model are specified by hypothesis and/or litera-ture reviewed. All possible attribute data for this model are gathered either through the survey and/or from official data from the Indonesian Statistics Bureau (BPS). Crow-fly distance data between each zone pair is calculated using GIS. Travel time data from the survey is the revealed/perceived travel time by independent retailers. No information regarding travel time to an alternative Origin–Destination (O-D) pair is provided though. To address this requirement, we relied on the SATURN model of Bandung from Farda and Balijepalli (2018) to provide travel time informa-tion between each O-D pair.
Table 2 summarises the possible attributes and source of data for each model.
5.2.2 Model Specification
Literature suggests many different ways to model UGM activities. Ogden (1992) groups them by reference unit (commodity based or truck based). Anand et al. (2015) groups the modelling effort into UGM activities based on the aims of the model and the approach methodology. Following Russo and Comi (2010), Nuzzolo and Comi (2014), we use a modelling framework based on trips from traffic zones and use a discrete choice model to depict retailer behaviour as described further.
Traffic Zoning System To represent the independent retailer trip demands, we pro-pose an urban area traffic model in which the sub-districts of BCC act as traffic anal-ysis zones (TAZ). Each TAZ consists of two different nodes: suppliers (s) and retail-ers (r). Retailer and supplier nodes can be located in the same sub-district, and each node represents different entities. The retailer node represents the goods demanded in the sub-district, i.e. the quantity of goods attracted by all the retailers within the sub-district. Meanwhile, the supplier node represents all suppliers located within the sub-district. Goods flows always move from supplier nodes to retailer nodes. How-ever, a vehicle trip can be generated from both nodes. Trips generated from a sup-plier node represent delivery trips made by suppliers, whereas trips generated from a retailer node represent restocking activities by the retailers’ own vehicles. There are also external nodes (TAZ 12, 13,14) which represent suppliers outside the BCC area (see Fig. 12).
Trip Generation Model Specification The trip generation model is an ordinary least squares (OLS) linear regression model based on independent retailer characteristics. The trip generation model is specified as follows:
where Gr is the number of trips generated by retailer activities in zone r; x1 … xn are possible attributes related to independent retailer characteristics in each retailer node (r); �1 … �n are coefficients to be estimated, � is the model intercept, and � is
(1)Gr = �1x1 +…+ �nxn + � + �
949Independent Retailer Restocking Choices in Urban Goods Movement…

1 3
Tabl
e 2
Dat
a se
ts a
nd p
ossi
ble
attri
bute
s for
eac
h m
odel
Mod
elA
ltern
ativ
eD
ata
set
Poss
ible
Attr
ibut
esRe
fere
nce
Sour
ce
(Num
ber o
f obs
erva
tions
)Tr
ip G
ener
atio
n M
odel
NA
Reta
iler d
ata
set
Num
ber o
f per
sons
em
ploy
ed(P
ani e
t al.
2018
)(B
astid
a an
d H
olgu
ín-V
eras
200
9)Su
rvey
(224
)W
eekl
y go
ods d
eman
d (to
nnes
)Su
rvey
Ave
rage
ship
men
t wei
ght (
tonn
es)
Surv
eyC
row
fly
dist
ance
bet
wee
n re
taile
rs
and
the
near
est t
radi
tiona
l mar
ket
(km
)
Surv
ey
Two-
whe
eler
ow
ners
hip
Surv
eyPr
esen
ce o
f tra
ditio
nal m
arke
tSu
rvey
Resto
ckin
g ch
oice
: Sup
plie
r Loc
atio
nA
ll tra
ffic
anal
ysis
zo
nes
(TA
Z)
Trip
dat
a se
t (30
3)Tr
avel
tim
e be
twee
n O
-D p
airs
(hou
r)(W
iset
jinda
wat
et a
l. 20
06)
SATU
RN
Num
ber o
f est
ablis
hmen
ts in
supp
lier
zone
Offi
cial
dat
a
Trad
ition
al m
arke
ts in
supp
lier z
one
Offi
cial
dat
aVe
hicl
e ow
ners
hip
Resto
ckin
g ch
oice
: Tra
nspo
rt Se
rvic
eD
eliv
ery
serv
ice
(ds)
or o
wn
vehi
cle
(ov)
Trip
dat
a se
t (30
3)Re
veal
ed tr
avel
tim
e (h
our)
(Rus
so a
nd C
omi 2
010)
Surv
eyA
vera
ge sh
ipm
ent w
eigh
t (to
nnes
)Su
rvey
Pres
ence
of t
radi
tiona
l mar
ket
Surv
eyVe
hicl
e ow
ners
hip
950 T. S. Nugroho et al.

1 3
the error term. The error term is random, since we apply the simple OLS regression. Further, to ensure the regression analysis produces robust estimators, we ensure the data meet the following assumptions before fitting the regression model:
• The relationship between independent variables and dependent variable is lin-ear and that the outliers are removed;
• The data should meet the homoscedasticity condition, meaning the probability distribution of all independent variables should have the same variance;
• All independent variables in the regression model should be normally distrib-uted;
• In the case of a multiple linear regression, the independent variables should not be related to each other.
We carried out a number of tests before starting the modelling activity but to keep the paper to a suitable length we are not including all details here. However, we have included the significant results such as the test of multicollinearity and the test of het-eroscedasticity in Sect. 5.2.3.
Fig. 12 Traffic zones in Bandung city centre and around
951Independent Retailer Restocking Choices in Urban Goods Movement…

1 3
The trip generation model is similar to a household regression model which is com-monly used to study passenger trip generation (de Ortuzar and Willumsen 2011). The model aims to investigate the factors affecting the total number of restocking trips based on independent retailer characteristics. Trip generation can occur from a supplier zone to a retailer zone (attraction trips i.e. delivery trips from supplier to retailer) or from a retailer zone to a supplier zone (production trips i.e. retailer trips using own vehicles).
As the trip generation model is based on a retailer-level regression, each retailer’s characteristics are taken as input data. The zonal level values then can be quantified simply by replacing the attribute values in the equation with the average zonal value multiplied by the number of independent retailers in each zone. As a result, trip genera-tions from each zone account for the characteristics of independent retailers in respec-tive zones.
Restocking Choice Model Specification The restocking choices – supplier location and transport service, are modelled as discrete choices based on random utility the-ory. Each retailer is assumed to be a rational decision maker who maximises utility relative to their choice (Ben-Akiva and Lerman, 1985). In this case, the decision makers consider a choice set C . Then, the decision maker assesses each alternative c from choice set C and selects the alternative that maximises his/her utility ( Uc ). The utility function for alternative c(Uc) can be formulated as
The utility function comprises measurable characteristics (attributes). acn are the attributes related to the alternative c and bn are attributes related to the decision maker. The utility assigned by the decision makers is not known with certainty by the analyst due to a number of factors and therefore represented by the random component of util-ity function, �c.
A multinomial logit model is used to estimate the choice models viz., supplier loca-tion choice model and transport service choice model. The random term ( �c) in the util-ity of Multinomial Logit (MNL) model is an extreme valued (Gumbel) independently and identically distributed across all alternatives (satisfying the IIA property). The MNL allows the models to have a closed form as formulated in Eq. (3) and can be read-ily estimated by using the maximum log likelihood method.
where, P(c) is the probability of the choice to be selected, and UC is the utility func-tion of choice c. � is a scaling parameter and in the case of MNL, � = 1.
5.2.3 Supplier Location Choice Model
For the restocking activity, the main independent retailer decision is to choose the supplier location. The model aims to distribute trips generated by each retailer zone and link them to respective supplier zones. The alternative locations are all possible
(2)UC = �nacn + �cnbn+ ∈c
(3)P(c) =exp �
�
Uc
�
∑
c∈C exp ��
Uc
�
952 T. S. Nugroho et al.

1 3
supplier zones within the study area. Location impedance and location attractive-ness parameters are the major attributes influencing the decisions of such independ-ent retailers (Wisetjindawat et al. 2006; Russo and Comi 2010; Nuzzolo and Comi 2014). Crow-fly distance, travel time and travel cost between retailers and suppliers are related to impedance parameters influencing independent retailer decisions (Mei 2013). Meanwhile, the attractiveness parameters give a particular supplier location benefit compared to alternative locations. The number of suppliers in the destination location, floor area of the suppliers, number of employees working at the supplier location, and the total parking area are a few attributes related to zonal attractive-ness found in the literature. Nevertheless, since the traditional markets are the focus of the current study, a dummy variable for the presence of traditional market in the supplier zone is included in the model as one of the attraction factors (see Table 2).
5.2.4 Transport Service Choice Model
The transport service choice model determines how the goods are transported. From a modelling point of view, the transport service model indicates vehicle movement direc-tion. The model includes two options: delivery service or own vehicle. Delivery service (ds) means the trips will be arising from supplier nodes to retailer nodes, whereas own vehicle (ov) transport service means the trips will be originating from retailer nodes to supplier nodes. The literature suggests the number of deliveries per week, quantity acquired per trip (shipment size), type of goods carried (food/beverage or otherwise) and vehicle ownership, as important factors influencing whether an independent retailer decides to use their own vehicle or not (Nuzzolo and Comi 2014; Russo and Comi 2010). Following the literature, we include similar attributes in our models too as can be seen in Table 2, though we note that it is not always possible to include every pos-sible variable. In the ensuing, we describe a method to deal with the weakness arising due to omitting a variable.
The instrumental variable technique which uses a control function can help in addressing the endogeneity problem (Holguín-Veras et al. 2011). This method involves choosing a variable as an instrument that does not itself belong to the explanatory equation, but is correlated with the endogenous explanatory variables, conditionally on the value of other explanatory variables.
The control function method consists of constructing an auxiliary variable which, when added to the systematic utility, the remaining error of the model will no longer be correlated with observed variables (Guevara 2010). In order to define the method, consider the behavioural model described in Eq. (4) where a group of n decision makers choose choice i among I in the choice set Cn:
where, the retailer i chooses the choice yin in which the choice is determined by the perceived utility function. The utility function consists of variables pin which are
(4)
Uin = �ppin + �xxin + �in = �ppin + �xxin + �in + ein
pin = �zzin + �in
yin =[
Uin
]
= maxI∈Cn
{
Ujn
}
953Independent Retailer Restocking Choices in Urban Goods Movement…

1 3
considered endogenous, and variables xin which are considered exogenous. Note that the endogenous attributes can be written as a linear function of zin . The utility func-tion has an error term �in which can be decomposed into two parts: �in and ein . Both of them have a mean value of zero.
Variable xin and zin are considered exogenous within the model, meaning, they are uncorrelated with all error terms �in , ein and �in . Variable zin is considered as an instrumental variable for variable pin since it is correlated with endogenous vari-ables, yet, does not appear in the utility function. Endogeneity problems arise when �in is correlated with �in , meaning the variable pin is correlated with �in and the stand-ard estimation method will produce inconsistent estimators.
To construct the auxiliary variable, note that it is always possible to write �in as the sum of its conditional expectation, given �in and an error term vin . Then, the error term vin is orthogonal to �in , and therefore uncorrelated with it. Assuming that the �in and vin are normally distributed, we can write,
The endogeneity problem can be solved, if the decomposed error in Eq. (5) can be accommodated in the utility function. Consider, Eq. (6) below:
Note that by assuming �in is observable, the remaining error of vin and ein are not correlated, and thus, we solve the endogeneity problem. The practical problem of solving the unobserved �in can be addressed by conducting an OLS regression between pin and zin . The consistency of estimators for model parameters would be guaranteed by Slutsky’s theorem (Ben-Akiva and Lerman 1985).
The control function described above is termed two-stage control function method (2SCF method). Mathematically, the 2SCF method can be written as:
– Stage 1: estimates �in by performing ordinary least square (OLS) regression
– Stage 2: estimates the choice modelling using �in as an additional variable
We describe the results of the model estimation in the next section.
5.2.5 Estimation Results
Generation Model We investigated all possible attributes in the data set for the parameter estimation process when developing the trip generation model. Before
(5)�in = ���in + vin
(6)
Uin = �ppin + �xxin + �in = �ppin + �xxin + ���in + vin + ein
pin = �zzin + �in
yin =[
Uin
]
= maxI∈Cn
{
Ujn
}
pin = �zzin + �inOLS→ �̂z ⇒ �in = pin − p̂in = pin − �zzin
Uin = �ppin + �xxin + �in = �ppin + �xxin+���in + vin + ein
954 T. S. Nugroho et al.
1 3
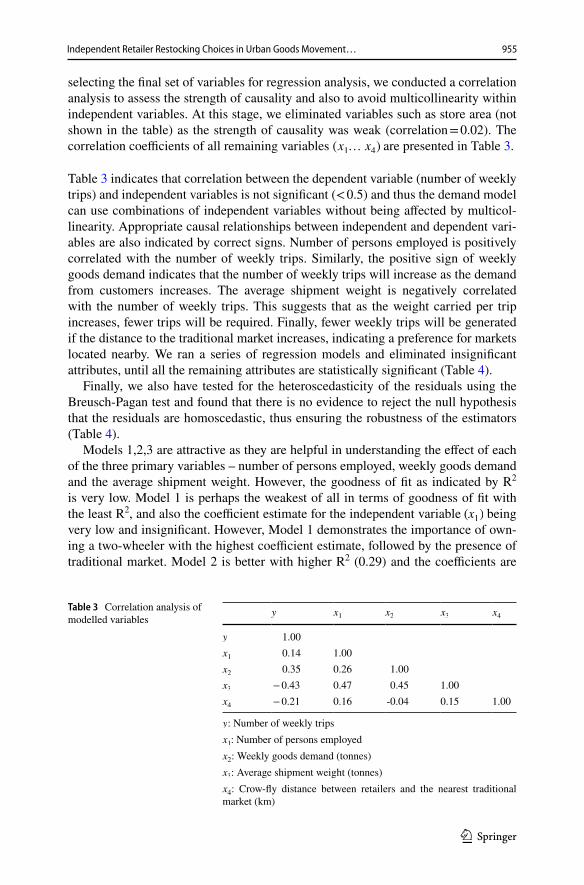
selecting the final set of variables for regression analysis, we conducted a correlation analysis to assess the strength of causality and also to avoid multicollinearity within independent variables. At this stage, we eliminated variables such as store area (not shown in the table) as the strength of causality was weak (correlation = 0.02). The correlation coefficients of all remaining variables ( x1 … x4) are presented in Table 3.
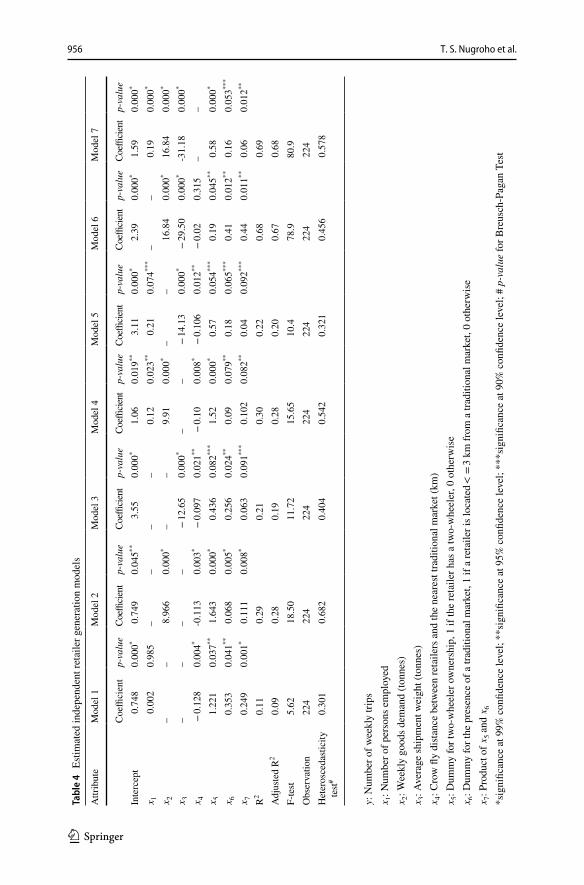
Table 3 indicates that correlation between the dependent variable (number of weekly trips) and independent variables is not significant (< 0.5) and thus the demand model can use combinations of independent variables without being affected by multicol-linearity. Appropriate causal relationships between independent and dependent vari-ables are also indicated by correct signs. Number of persons employed is positively correlated with the number of weekly trips. Similarly, the positive sign of weekly goods demand indicates that the number of weekly trips will increase as the demand from customers increases. The average shipment weight is negatively correlated with the number of weekly trips. This suggests that as the weight carried per trip increases, fewer trips will be required. Finally, fewer weekly trips will be generated if the distance to the traditional market increases, indicating a preference for markets located nearby. We ran a series of regression models and eliminated insignificant attributes, until all the remaining attributes are statistically significant (Table 4).
Finally, we also have tested for the heteroscedasticity of the residuals using the Breusch-Pagan test and found that there is no evidence to reject the null hypothesis that the residuals are homoscedastic, thus ensuring the robustness of the estimators (Table 4).
Models 1,2,3 are attractive as they are helpful in understanding the effect of each of the three primary variables – number of persons employed, weekly goods demand and the average shipment weight. However, the goodness of fit as indicated by R2 is very low. Model 1 is perhaps the weakest of all in terms of goodness of fit with the least R2, and also the coefficient estimate for the independent variable (x1) being very low and insignificant. However, Model 1 demonstrates the importance of own-ing a two-wheeler with the highest coefficient estimate, followed by the presence of traditional market. Model 2 is better with higher R2 (0.29) and the coefficients are
Table 3 Correlation analysis of modelled variables
y : Number of weekly tripsx1 : Number of persons employed
x2 : Weekly goods demand (tonnes)
x3 : Average shipment weight (tonnes)
x4 : Crow-fly distance between retailers and the nearest traditional
market (km)
y x1
x2
x3
x4
y 1.00x1
0.14 1.00x2
0.35 0.26 1.00x3
− 0.43 0.47 0.45 1.00x4
− 0.21 0.16 -0.04 0.15 1.00
955Independent Retailer Restocking Choices in Urban Goods Movement…
1 3
Tabl
e 4
Esti
mat
ed in
depe
nden
t ret
aile
r gen
erat
ion
mod
els
y : N
umbe
r of w
eekl
y tri
psx1 : N
umbe
r of p
erso
ns e
mpl
oyed
x2 : W
eekl
y go
ods d
eman
d (to
nnes
)x3 : A
vera
ge sh
ipm
ent w
eigh
t (to
nnes
)x4 : C
row
fly
dist
ance
bet
wee
n re
taile
rs a
nd th
e ne
ares
t tra
ditio
nal m
arke
t (km
)x5 : D
umm
y fo
r tw
o-w
heel
er o
wne
rshi
p, 1
if th
e re
taile
r has
a tw
o-w
heel
er, 0
oth
erw
ise
x6 : D
umm
y fo
r the
pre
senc
e of
a tr
aditi
onal
mar
ket,
1 if
a re
taile
r is l
ocat
ed <
= 3
km fr
om a
trad
ition
al m
arke
t, 0
othe
rwis
ex7 : P
rodu
ct o
f x5 a
nd x
6
*sig
nific
ance
at 9
9% c
onfid
ence
leve
l; **
sign
ifica
nce
at 9
5% c
onfid
ence
leve
l; **
*sig
nific
ance
at 9
0% c
onfid
ence
leve
l; #
p-va
lue
for B
reus
ch-P
agan
Tes
t
Attr
ibut
eM
odel
1M
odel
2M
odel
3M
odel
4M
odel
5M
odel
6M
odel
7
Coe
ffici
ent
p-va
lue
Coeffi
cient
p-va
lue
Coeffi
cient
p-va
lue
Coeffi
cient
p-va
lue
Coeffi
cient
p-va
lue
Coeffi
cient
p-va
lue
Coeffi
cient
p-va
lue
Inte
rcep
t0.
748
0.00
0*0.
749
0.04
5**3.
550.
000*
1.06
0.01
9**3.
110.
000*
2.39
0.00
0*1.
590.
000*
x1
0.00
20.
985
––
––
0.12
0.02
3**0.
210.
074**
*–
–0.
190.
000*
x2
––
8.96
60.
000*
––
9.91
0.00
0*–
–16
.84
0.00
0*16
.84
0.00
0*
x3
––
––
− 12
.65
0.00
0*–
– −
14.1
30.
000*
− 29
.50
0.00
0*-3
1.18
0.00
0*
x4
− 0.
128
0.00
4*-0
.113
0.00
3* −
0.09
70.
021**
− 0.
100.
008*
− 0.
106
0.01
2** −
0.02
0.31
5–
–x5
1.22
10.
037**
1.64
30.
000*
0.43
60.
082**
*1.
520.
000*
0.57
0.05
4***
0.19
0.04
5**0.
580.
000*
x6
0.35
30.
041**
0.06
80.
005*
0.25
60.
024**
0.09
0.07
9**0.
180.
065**
*0.
410.
012**
0.16
0.05
3***
x7
0.24
90.
001*
0.11
10.
008*
0.06
30.
091**
*0.
102
0.08
2**0.
040.
092**
*0.
440.
011**
0.06
0.01
2**
R2
0.11
0.29
0.21
0.30
0.22
0.68
0.69
Adj
uste
d R
20.
090.
280.
190.
280.
200.
670.
68F-
test
5.62
18.5
011
.72
15.6
510
.478
.980
.9O
bser
vatio
n22
422
422
422
422
422
422
4H
eter
osce
dasti
city
te
st#0.
301
0.68
20.
404
0.54
20.
321
0.45
60.
578
956 T. S. Nugroho et al.
1 3
significant. Model 2 indicates that weekly goods demand plays a significant role in explaining the trip generation. Whilst Model 3 suffers from a slightly lower good-ness of fit, it clearly indicates that as the average weight carried per trip increases, weekly trips will significantly reduce. This indicates the potential for overloading of goods vehicles. Models 4, 5 run with combinations of independent variables (x1, x2) and (x1, x3) along with the dummy variables. Finally, Model 6 and Model 7 have markedly higher R2 values with significant coefficient estimates for all variables (except for the crow-fly distance in Model 6). Adjusted R2 is very similar to the R2 which verifies that additional explanatory variables did not significantly contribute to an increase in the goodness of fit of the estimation. Models 6 and 7, seen as sig-nificantly better fit than the rest, deserve further explanation.
Model 6 has the signs as expected. As the weekly goods demand increases, more trips per week will be needed which is indicated by a positive sign of x2 . Secondly, as the average shipment weight increases fewer trips per week will suffice, as indi-cated by the negative sign of x3 . However, the coefficient of the variable, crow-fly distance (x4) is not significant.
Model 7 includes all three primary explanatory variables (x1, x2, x3) in addition to the dummy variables, except crow-fly distance. All variables are significant, and the signs are as expected. x5 has a positive sign, meaning the retailer who owns a two-wheeler is likely to make more trips than the one who does not. This also suggests that if a retailer uses two-wheeler to restock the shop, this will generate more trips compared to a van. We have also tested the dummy variable for van ownership (not shown in the table), which resulted in a coefficient value of − 0.99. This suggests that owning a van is expected to decrease the number of trips per week. However, the dummy variable for van ownership is omitted from the final runs since it was statistically insignificant (p-value = 0.68). The dummy variable for traditional mar-ket presence has a positive sign, indicating that the presence of a traditional market is likely to increase the number of trips. However, the coefficient estimate of two-wheeler ownership is 3.6 times higher than that of the traditional market variable, implying that two-wheeler ownership has a significantly greater influence on the number of weekly trips than the proximity of a traditional market.
Models 6, 7 also include an interaction variable x7(= x5*x6 ), the purpose of which is to explain the influence of a traditional market on the trip generation of retailers owning two-wheelers. The sign is positive, meaning that two-wheeler owning retail-ers are likely to visit a traditional market more frequently. This highlights the nature of independent retailers, who rely heavily on two-wheelers and are more likely to visit a traditional market if it is located nearby.
Models 6, 7, however, will need to be interpreted carefully as one might intui-tively expect a correlation between the shipment size and demand. Typically, as the demand increases the shipment size will also increase. However, in the case of inde-pendent retailers in Bandung, the majority of them use a two-wheeler (regular or modified) for carrying goods and tend to maximise the load carried per trip. As a result, an increase in the demand leads to a greater number of trips by the retailers, rather than resulting in an increase in the average shipment size. This can be verified by the distribution of average weight carried per trip (as reported by the retailers) which has a mean value of 22.14 kg with a Coefficient of Variation (CV) of 0.25
957Independent Retailer Restocking Choices in Urban Goods Movement…

1 3
by regular two-wheelers, and a mean value of 52.58 kg with a CV of 0.26 by modi-fied two-wheelers. The low values of CV indicate very little dispersion of shipment size around the mean. Furthermore, it is noted that weekly demand variable is based on typical amount of goods sold to customers, whereas, average shipment size is the weight carried per trip (independent of the sales), obtained through a different question in the survey. Thus, it is reasonable to include both x2 and x3 variables in Models 6 and 7.
5.2.6 Restocking Choice Models
For the restocking choice models, the estimation used attribute data as described in Table 2. We also included interaction variables with the aim of obtaining the best specification based on combinations of all possible attributes and their interactions.
Estimated Supplier Location Choice Models The supplier location choice model predicts the probability that retailers will choose a particular TAZ given the attrib-utes of alternative locations. Maximum likelihood estimation method by BIOGEME software was used to estimate the parameter values. The results for the supplier loca-tion choice models (see Table 5) show a good fit of the models and are in line with the previous research found in the literature with rho-square values (ρ2) of about 0.23. Furthermore, results show that the signs for each attribute in all models are as expected and in line with previous research (Wisetjindawat et al. 2006; Nuzzolo and Comi 2014).
Table 5 Estimated supplier location choice models
x8 : Travel time between O-D pairs (in hours)
x9 : Number of establishments in supplier zones
x10
: Dummy for traditional market presence in supplier zones, 1 if there is a traditional market on the zone, 0 otherwisex11
: Dummy for vehicle ownership, 1 if the retailer has a vehicle, 0 otherwisex12
: Product of x10
and x11
*significant at 99% confidence level; **significant at 95% confidence level
Attribute Model 1 Model 2
Coefficient p-value Exp(B) Coefficient p-value Exp(B)
x8
-0.295 0.00* 0.74 -0.291 0.00* 0.75x9
0.042 0.00* 1.04 0.042 0.00* 1.04x10
0.547 0.01* 1.72 0.328 0.03* 1.38x12
– – – 0.287 0.04** 1.33Initial LL -726.63 − 799.634Final LL -558.89 − 555.724ρ2 adjusted 0.22 0.23Number of alternatives 14 14Number of observations 303 303
958 T. S. Nugroho et al.

1 3
Model 1 for supplier location choice has no interaction variable. The estimated model fits well with a good ρ2 value (0.22), with all the signs as expected. Travel time has a negative sign, implying that increasing travel time to a particular supplier location means the retailers are less likely to choose it. Travel time thus acts as an impedence factor in the retailer decision. On the other hand, the number of estab-lishments and the presence of traditional markets in the supplier zone act as zonal attractiveness factors. Both variables have positive signs, meaning zones with more establishments and zones with traditional markets are more attractive for independ-ent retailers since the zones provide more supplier options.
Model 2 includes an interaction variable between vehicle ownership and presence of traditional market in a destination zone. The model also fits well with a good ρ2 value (0.23), and all the coefficient signs are as expected, and all estimates are statis-tically significant. The result shows a positive sign for the interaction variable with a 1.33 odds-ratio, which implies that the retailers are 33% more likely to go to a TAZ which has a traditional market, given that the retailers have their own vehicle.
Estimated Transport Service Choice Models We have applied the 2SCF method set out earlier to resolve the endogeneity problem indicated by high rho-squared values such as 0.49, due to a suspected correlation between transport choice and shipment size variables. The first step is to choose an instrumental variable which should be correlated with the endogenous variable i.e. shipment size, and uncorrelated with an omitted attribute.
We have reviewed the dataset and found four possible candidate attributes:
– Distance from retailer to supplier (km)– Transport cost (thousands IDR)– Number of deliveries (Trips)– Value of goods carried per delivery (thousands IDR)
We ran correlation analysis and the results are as shown in Table 6.Table 6 shows that the value of goods is highly correlated with shipment size
and can therefore be used as an instrumental variable ( zin) . By choosing this as an instrument, we can avoid the weak instrument problem. Moreover, in the case of
Table 6 Correlation between shipment size and potential instrumental variable
Shipment size Distance supplier—retailer
Transport cost Number of deliveries
Goods value
Shipment size 1.00Distance supplier—retailer 0.09 1.00Transport cost − 0.18 − 0.14 1.00Number of deliveries − 0.21 − 0.17 0.52 1.00Goods value 0.65 0.05 0.07 0.34 1.00
959Independent Retailer Restocking Choices in Urban Goods Movement…

1 3
independent retailers, we can assume that goods value is not correlated with the error term in the transport choice alternative (exogenous).
We then applied the 2SCF method to resolve the suspected endogeneity. The first stage corresponds to the regression of endogenous variable (Shipment size) on the instrument (Goods value). The result is shown in Table 7 below:
The second step includes the residuals of the first step as an additional variable in the systematic utility and re-estimates the choice model. Table 8 shows the esti-mated results with the endogeneity correction � included. We note that the correc-tion variable is statistically significant (p-value < 0.05). The shipment size coefficient
Table 7 Transport choice estimation—First stage of the 2SCF method
Variables �̂z t-stat
Intercept 27.55 7.986zin 0.043 8.632R2 0.198Adjusted R2 0.195Observations 303F 74.527
Table 8 Transport choice estimation—Second stage of the 2SCF method
x6 : Dummy for the presence of traditional market, 1 if a retailer located < = 3 km from a traditional mar-
ket, 0 otherwisex11
: Dummy for vehicle ownership, 1 if a retailer has a vehicle, 0 otherwisex13
: Revealed travel times (hours)x14
: Average shipment weight (tonnes)x15
: Product of x6 and x
11
*Significant at 99% confidence level**Significant at 95% confidence level
Attribute Model 1 with � correction Model 2 with � correction
Coefficient p-value Exp(B) Coefficient p-value Exp(B)
Alternative ov Fixed (0) (n/a) Fixed (0) (n/a)ASC (alternative ds) -0.68 0.00* 0.50 − 0.72 0.00* 0.84x6
-0.48 0.05** 0.61 − 0.94 0.03** 0.39x11
-1.36 0.00* 0.25 − 1.56 0.01* 0.21x13
0.311 0.02** 0.131 0.382 0.03** 1.46x14
3.24 0.05** 25.53 3.19 0.05** 24.28x15
– – – − 1.84 0.04** 0.15� 0.554 0.04** (n/a) 0.729 0.02** (n/a)Initial LL -185.024 − 185.024 − 185.024Final LL -106.883 − 88.299 − 104.116ρ2 adjusted 0.35 0.49 0.36Number of alternatives 2 2 2Number of observations 303 303 303
960 T. S. Nugroho et al.

1 3
decreases (relative to the model without � correction) implying the benefit of includ-ing the correction variable. The correction applied also improves the overall model as noted by a lower value of ASC (relative to the model without � correction). Also, the rho-square value of models with correction factor decreases. Thus the correla-tion between shipment size and transport choice in the model without correction is properly addressed by the instrumental variable in the model with � correction.
As for transport choice models, Model 1 fits well with a good ρ2 value (0.35). In this model delivery service (ds) is the base to the alternative own vehicle (ov). The variables are significant and have the expected signs. Negative ASC indicates an inherent preference for own vehicle use. The revealed travel time variable (x13) and average shipment weight (x14) have postive signs, meaning that higher values of both variables will increase the utility of delivery service alternative. Hence, if there is an increase in perceived travel time (i.e. the supplier location is difficult to reach), retailers will opt to use the delivery service. The positive sign of shipment size var-iable reflects the context in Bandung, where the delivery services to independent retailers are mostly free, as long as independent retailers agree with the suppliers to meet a minimum scale of delivery. Hence, delivery service is a better option for independent retailers receiving larger shipments. Dummy variables for presence of a traditional market (x6) and vehicle ownership (x11) have negative signs, meaning that the variables have a negative effect on the delivery service utility. This implies that retailers who possess a vehicle, or, if located within the proximity of a traditional market, tend to use their own vehicle to restock their shop.
Model 2 includes an interaction variable ( x15 ) between vehicle ownership and proximity of a traditional market. The interaction variable has a negative sign, which implies that if retailers have their own vehicle and the location of their shop is rel-atively close to a traditional market, they would tend to use their own vehicle to restock the shop. The odds-ratio of 0.15 for the interaction variable shows that retail-ers who own a vehicle and are located near a traditional market are 85% less likely to use the delivery service to restock their shop and preferring to use their own vehicle.
Estimated Joint Supplier Location and Transport Choice Models Similarity of attrib-utes between supplier location choice and transport service choice models points us towards further analysis on exploring the joint choice between them. Note, also in real life, the decisions of supplier location and transport service may not be sequen-tial. Hence, a joint model has also been estimated using MNL.
The results of joint MNL model estimation are presented in Table 9. The initial model (Model 1) for joint supplier location and transport choice model gives a good rho-square value (ρ2 = 0.30) meaning the data are quite robust and fit well with the model. All parameters are significant at 95% confidence level, and the signs are as expected. The travel time attribute has a negative sign, while the number of establishments and the traditional market presence have positive signs as with the previous models. The dummy for vehicle ownership has a negative sign relative to the delivery service option, meaning retailers would prefer to choose their own vehicle to restock their shop. Lastly, the dummy for average
961Independent Retailer Restocking Choices in Urban Goods Movement…

1 3
shipment size has a positive sign meaning that an increase in shipment size would increase the probability of using delivery service transport option. Model 2 includes interaction variables between the dummy for presence of traditional markets and vehicle ownership attributes. However, the result indicates that the interaction variable is not significant (p-value = 0.17), suggesting that in the pres-ence of the vehicle ownership attribute, the interaction variable is unnecessary as the effect has already been absorbed by the former variable.
Finally, we also have tested a nested logit model (NL) to investigate whether a hierarchical approach indeed provides a better explanation of the retailer behaviour. The hypothesis is that some supplier zones are more attractive to those retailers that choose their own vehicle to restock. Therefore, we nested the alternative based on transport service choice (Fig. 13).
The estimation resulted in expected signs with a fair rho-square value (ρ2 = 0.20). However, the model resulted in a negative nesting coefficient value ( � = − 0.283).
Table 9 Joint supplier location and transport service choice with multinomial logit model normalised to retailers’ characteristics
x8 : Travel time between O-D pairs (in hours)
x9 : Number of establishments in supplier zones
x10
: Dummy for traditional market presence in supplier zones, 1 if there is a traditional market on the zone, 0 otherwisex11
: Dummy for vehicle ownership, 1 if the retailer has a vehicle, 0 otherwisex12
: Product of x10
and x11
x14
: Average shipment weight (tonnes)*significance at 99% confidence level**significance at 95% confidence level
Attribute Model 1 Model 2
Coefficient p-value Exp(B) Coefficient p-value Exp(B)
Joint supplier location and transport service choicex8
-0.296 0.00* 0.74 -0.293 0.00* 0.74x9
0.043 0.00* 1.04 0.043 0.00* 1.24x10
1.00 0.00* 2.71 1.03 0.02** 2.80x12
– – 0.01 0.17 1.01x11
Alternative ov Fixed (0) (n/a) Fixed (0) (n/a)Alternative ds − 2.36 0.00* 0.09 − 2.36 0.00* 0.09x14
Alternative ov Fixed (0) (n/a) Fixed (0) (n/a)Alternative ds 4.18 0.03** 65.36 4.18 0.03** 65.36Initial LL − 985.39 − 985.39Final LL − 676.12 − 674.72ρ2 adjusted 0.30 0.31Number of alternatives 28 28Number of observations 303 303
962 T. S. Nugroho et al.

1 3
This suggests that the model is not consistent with the theoretical derivation of ran-dom utility models, and, thus, we reject this approach.
5.3 Elasticities and Market Shares
In this section, we aim to explain the sensitivity of independent retailer choices to the supplier location and transport services. In the context of choice models, elas-ticity measures the percent change in choice probability of alternative i, (Pi) with respect to a percent change in an attribute level of that alternative (Koppelman and Bhat 2006). We have computed the elasticity of supplier location choice with respect to travel time x8, and also with respect to the number of establishments x9, and the results are shown in Table 10. Elasticity of supplier location choice with respect to time is negative, indicating that an increase in travel time will reduce the probability of an independent retailer choosing that location. Elasticity with respect to the num-ber of establishments, however, is positive, implying larger wholesale markets are more attractive to retailers. Balong Gede (inside BCC) is highly sensitive to changes in travel time, indicating that improving access roads to this location will be signifi-cantly helpful. Similarly, Cibadak, Kebon Jeruk and Nyengseret, all located within the BCC, will be suitable for expansion of wholesale markets as they are highly sen-sitive to the establishment numbers. Ciroyom is sensitive to both travel time and the number of establishments, but, it is located outside of the BCC area, hence, may not be considered for improvements by the BCC.
Table 11 shows the elasticity of transport choice with respect to 𝑥13 (Revealed travel time) and 𝑥14 (Average shipment weight). It is noted that they are relatively inelastic, indicating that retailers have a strong preference to use own vehicle over the delivery service.
We have computed market shares for Cibadak, as an illustration, which has the highest number of establishments in the city. 50% of the retailers located within one hour of travel time from Cibadak prefer to shop within this mar-ket, but, if the travel time to Cibadak increases (for example, due to conges-tion), market shares to competing alternative locations such as Kebon Jeruk and Ciroyom will increase (Fig. 14). Similarly, increasing the number of establish-ments in Cibadak to about 6000 will protect the wholesale market, by giving it a near monopoly status within Bandung, though at the cost of other markets such as Ciroyom and Nyengseret (Fig. 15). We also have computed market shares for transport choice, where there is a strong preference for own vehicle (79%), over delivery service (21%). However, increasing travel time and/or increasing aver-age shipment weight can potentially increase the use of delivery service.
Fig. 13 Nesting structure for NL choice model
963Independent Retailer Restocking Choices in Urban Goods Movement…

1 3
Table 10 Elasticities of supplier location choice
Zone, location Elasticity with respect to
Travel time Number of establishments
1 Balong Gede − 1.04 0.222 Braga − 0.88 0.433 Ciateul − 0.71 0.064 Cibadak − 0.58 1.495 Cikawao − 0.64 0.066 Karang Anyar − 0.74 0.147 Kebon Jeruk − 0.70 1.208 Kebon Pisang − 0.66 0.929 Nyengseret − 0.51 1.1010 Pangledang − 0.72 0.1111 Pungkur − 0.67 0.8612 Ancol − 0.94 0.5213 Situsaeur − 0.92 0.2114 Ciroyom − 1.10 1.68
Table 11 Elasticity of transport choice
Variable with respect to Elasticity
x13 (Revealed travel time) 0.19x14 (Average shipment weight) 0.21
Cibadak, [SERIES NAME]
Kebon Jeruk, [SERIES NAME]
Nyengseret, [SERIES NAME]
Ciroyom, [SERIES NAME]
0.00
0.10
0.20
0.30
0.40
0.50
0.60
0 1 2 3 4 5 6 7 8 9 10
Mar
kets
hare
,%
Travel me to Cibadak (in hours)
P_CB P_KJ P_NY P_CR
Fig. 14 Estimated market shares for Cibadak, with varying travel times
964 T. S. Nugroho et al.

1 3
It is also important to note that the market shares computed above do not reflect the real traffic conditions, in which, decreasing travel time to Cibadak may also affect the travel time to competing destinations. The calculation of market shares above does not capture the traffic dynamics, and, therefore, further modelling needs to be undertaken to capture the market share of supplier loca-tion by explicitly considering the traffic conditions.
6 Concluding Remarks
This paper analyzes restocking activities used by independent retailers and inves-tigates the relationship between restocking decisions made by such retailers in the presence of traditional markets. Our modelling approach provides important point-ers for policymakers requiring a better understanding of the trip characteristics of independent retailers in respect of their restocking activities. Since every city has a different context with different needs to operate, freight trip generation patterns in each city will also differ.
In relation to the estimated demand models for Bandung, specific insights drawn for policy makers to improve goods movement can be summarised as below.
(i) Promoting goods deliveries in a cooperative method would improve the over-all efficiency. Arranging collaborative shipments allows for consolidation of goods and reduces the retailers needing to use inefficient two-wheelers owned.
Cibadak, [SERIES NAME]
Nyengseret, [SERIES NAME]
Ciroyom, [SERIES NAME]
0.00
0.10
0.20
0.30
0.40
0.50
0.60
0.70
0.80
0.90
1.00
25 30 35 40 45 50 55 60 65
Mar
kets
hare
,%
Number of establishments (in hundreds)P_CB P_NY P_CR
Fig. 15 Estimated market shares for Cibadak, with varying number of establishments
965Independent Retailer Restocking Choices in Urban Goods Movement…

1 3
(ii) Another notable point is the importance of traditional markets in shaping UGM movements in Bandung. Our modelling work shows that traditional market presence has a significant bearing on retailers’ decisions, both in terms of choosing supplier location and how the goods are actually transported. There-fore, it should be pointed out that improving traditional market operations and management in Bandung can significantly improve the overall urban goods movement in the city.
(iii) From the elasticities computed, we note that retailers prefer markets with large numbers of establishments. Thus, expanding the markets in Cibadak, Kebon Jeruk and Nyengseret located within the BCC will hugely help in consolidat-ing the position of traditional markets. Similarly, improving the access to Balong Gede will help in dealing with congestion.
Transferability of results is, in general, a challenging topic in transport studies, and yet many cities around the world are willing to emulate what works elsewhere. Though the results of our research are based on the case of Bandung city in Indo-nesia, we believe the approach developed in this research may be useful for other similar cities. Bandung is characterised by the use of two-wheelers by independent retailers, and also by the presence of thriving traditional markets, where bargaining is common. In our view, other cities of Indonesia such as Jakarta, Surabaya, Medan and cities of other countries such as Vietnam, India, Brazil, Mexico, Italy, Portugal, where either the use of two-wheelers is common, and/or where traditional markets are thriving, could benefit from the research presented in this paper. In general, the approach presented herein, may be found useful in urban freight policy making in the following respects.
(i) The demand model quantifies the effect of traditional market presence which can be used to assess any changes in restocking trip patterns resulting from changes in market locations.
(ii) The approach in the paper can be used to estimate the market share of a new wholesale market to minimise pressure on the transport network.
(iii) Attractive TAZ’s can be identified based on the characteristics of zones, allow-ing planners/decision makers to determine appropriate policies, for example, in determining delivery restrictions in order to improve local traffic conditions and environmental conditions; and
(iv) The transport service choice model provides important insights into whether trips are made by own vehicle (trip productions from retailers to supplier) or by delivery vehicle (trip attractions from supplier to retailers). The model provides an estimate of O-D trips of retailer restocking activities, by mode, which is essential for all transport/freight planning exercises.
The survey in this study did not investigate the precise trading relationship between suppliers and retailers. This study focused on the number of trips generated by independent retailers, and not on the range of commodities carried in such trips. Future work could add to our findings through a more explicit consideration of the impact on trip generation of the mix of product types being purchased.
966 T. S. Nugroho et al.

1 3
Supplementary Information The online version contains supplementary material available at https:// doi. org/ 10. 1007/ s11067- 021- 09555-4.
Acknowledgements The authors wish to express their gratitude to the Indonesia Endowment Fund for Education (LPDP), Ministry of Finance Republic Indonesia for sponsoring this research. The authors also thank the ITENAS university students for helping with the establishment survey in Bandung.
Authors’ Contribution TSN Conceptualisation; Data collection/analysis; Writing—original draft; Visuali-sation; Funding acquisition; CB Conceptualisation; Data analysis; Writing—reviewing/editing the draft; supervision. AW Conceptualisation; Writing—reviewing/editing the draft; supervision.
Open Access This article is licensed under a Creative Commons Attribution 4.0 International License, which permits use, sharing, adaptation, distribution and reproduction in any medium or format, as long as you give appropriate credit to the original author(s) and the source, provide a link to the Creative Commons licence, and indicate if changes were made. The images or other third party material in this article are included in the article’s Creative Commons licence, unless indicated otherwise in a credit line to the material. If material is not included in the article’s Creative Commons licence and your intended use is not permitted by statutory regulation or exceeds the permitted use, you will need to obtain permis-sion directly from the copyright holder. To view a copy of this licence, visit http:// creat iveco mmons. org/ licen ses/ by/4. 0/.
References
Alho AR, de Abreu e Silva J (2015) Lisbon’s establishment-based freight Survey: revealing retail estab-lishments’ characteristics, goods ordering and delivery processes. Eur Transp Res Rev. https:// doi. org/ 10. 1007/ s12544- 015- 0163-7
Allen J, Browne M, Cherrett T (2012) Survey techniques in urban freight transport studies. Transp Rev 32:287–311. https:// doi. org/ 10. 1080/ 01441 647. 2012. 665949
Anand N, van Duin R, Quak H, Tavasszy L (2015) Relevance of city logistics modelling efforts: a review. Transp Rev 35:701–719. https:// doi. org/ 10. 1080/ 01441 647. 2015. 10521 12
Bastida C, Holguín-Veras J (2009) Freight generation models. Transp Res Rec J Transp Res Board 2097:51–61. https:// doi. org/ 10. 3141/ 2097- 07
Ben-Akiva M, Lerman SR (1985) Discrete choice analysis: theory and application to travel demand. MIT Press, Cambridge
BPS (2015) Establishment Listing: 2014 National Socio Economic Survey. Badan Pusat Statistik Indonesia, Jakarta
Cadilhon J-J, Moustier P, Poole ND, Tam PTG, Fearne AP (2006) Traditional vs. modern food systems? Insights from vegetable supply chains to Ho Chi Minh City (Vietnam). Dev Policy Rev 24:31–49. https:// doi. org/ 10. 1111/j. 1467- 7679. 2006. 00312.x
Cherrett T, Allen J, McLeod F, Maynard S, Hickford A, Browne M (2012) Understanding urban freight activity – key issues for freight planning. J Transp Geogr 24:22–32. https:// doi. org/ 10. 1016/j. jtran geo. 2012. 05. 008
Comi A, Donnelly R, Russo F (2014) Urban Freight Models. Modelling Freight Transport. Elsevier, Amsterdam, pp 163–200
Comi A, Nuzzolo A (2014) Simulating urban freight flows with combined shopping and restocking demand models. Procedia - Soc Behav Sci 125:49–61. https:// doi. org/ 10. 1016/j. sbspro. 2014. 01. 1455
Dablanc L (2009) Urban Freight Toolkit. Washington, DCDablanc L (2007) Goods transport in large European cities: Difficult to organize, difficult to modernize.
Transp Res Part A Policy Pract 41:280–285. https:// doi. org/ 10. 1016/j. tra. 2006. 05. 005De Magalhães DJAV (2010) Urban freight transport in a metropolitan context: the belo horizonte city
case study. Procedia - Soc Behav Sci 2:6076–6086. https:// doi. org/ 10. 1016/j. sbspro. 2010. 04. 020de Ortuzar J, Willumsen D (2011) Modelling Transport. Modelling Transport. https:// doi. org/ 10. 1002/
97811 19993 308
967Independent Retailer Restocking Choices in Urban Goods Movement…

1 3
Dell’Olio L, Moura JL, Ibeas A, Cordera R, Holguin-Veras J (2017) Receivers’ willingness-to-adopt novel urban goods distribution practices. Transp Res Part A Policy Pract 102:130–141. https:// doi. org/ 10. 1016/j. tra. 2016. 10. 026
Dyck J, Woolverton AE, Rangkuti FY (2012) Indonesia’s modern retail sector: interaction with changing food consumption and trade patterns
Farda M, Balijepalli C (2018) Exploring the effectiveness of demand management policy in reducing traf-fic congestion and environmental pollution: Car-free day and odd-even plate measures for Bandung city in Indonesia. Case Stud Transp Policy. https:// doi. org/ 10. 1016/j. cstp. 2018. 07. 008
Fernie J, Sparks L, McKinnon AC (2010) Retail logistics in the UK: past, present and future. Int J Retail Distrib Manag 38:894–914. https:// doi. org/ 10. 1108/ 09590 55101 10859 75
Golhar DY, Banerjee S (2013) An optimal ordering strategy for a third-party managed supply chain. Int J Prod Res 51:2969–2980. https:// doi. org/ 10. 1080/ 00207 543. 2012. 751512
Guevara CA (2010) Endogeneity and sampling of alternatives in spatial choice models. PhD Thesis. MITHeitz A, Dablanc L, Olsson J, Sanchez-Diaz I, Woxenius J (2018) Spatial patterns of logistics facilities in
Gothenburg. J. Transp. Geogr, Sweden. https:// doi. org/ 10. 1016/j. jtran geo. 2018. 03. 005Herzog BO (2009) Urban Freight In Developing Cities. BonnHolguín-Veras J (2002) Revealed preference analysis of commercial vehicle choice process. J Transp Eng
128:336–346. https:// doi. org/ 10. 1061/ (ASCE) 0733- 947X(2002) 128: 4(336)Holguín-Veras J, Silas M, Polimeni J, Cruz B (2008) An investigation on the effectiveness of joint
receiver-carrier policies to increase truck traffic in the off-peak hours. Part II: The behavior of carri-ers. Networks Spat Econ 8:327–354. https:// doi. org/ 10. 1007/ s11067- 006- 9011-6
Holguín-Veras J, Xu N, de Jong G, Maurer H (2011) An experimental economics investigation of shipper-carrier interactions in the choice of mode and shipment size in freight transport. Networks Spat Econ 11:509–532. https:// doi. org/ 10. 1007/ s11067- 009- 9107-x
Kato H, Sato J (2006) Urban Freight Transportation Analysis in Developing Countries: Case Study in Medan, Indonesia. Department of Civil Engineering, University of Tokyo, Tokyo, Japan
Koppelman FS, Bhat C (2006) A self instructing course in mode choice modeling : multinomial and nested logit models by with technical support from table of contents
Mei B (2013) Destination choice model for commercial vehicle movements in metropolitan area. Transp Res Rec J Transp Res Board 2344:126–134. https:// doi. org/ 10. 3141/ 2344- 14
Morganti E, Gonzalez-feliu J (2015) Case studies on transport policy city logistics for perishable prod-ucts. the case of the parma ’ s food hub. Case Stud Transp Policy 3:120–128. https:// doi. org/ 10. 1016/j. cstp. 2014. 08. 003
Nielsen (2015) Maximizing tradition - The shop, shopper, and shopkeeper. SingaporeNuzzolo A, Comi A (2014) Urban freight demand forecasting: A mixed quantity/delivery/vehicle-based
model. Transp Res Part E Logist Transp Rev 65:84–98. https:// doi. org/ 10. 1016/j. tre. 2013. 12. 014Ogden KW (1992) Urban goods movement : a guide to policy and planning Ashgate. Brookfield USA,
Aldershot, Hants, EnglandPaddeu D (2017) The Bristol-Bath Urban freight Consolidation Centre from the perspective of its users.
Case Stud Transp Policy 5:483–491. https:// doi. org/ 10. 1016/j. cstp. 2017. 06. 001Pani A, Sahu PK, Patil GR, Sarkar AK (2018) Modelling urban freight generation: a case study of seven
cities in Kerala. India Transp Policy 69:49–64. https:// doi. org/ 10. 1016/j. tranp ol. 2018. 05. 013Praharsi Y, Wee HM, Sukwadi R, Padilan MV (2014) Small-independent retailers vs. organized retailers:
An empirical study in Indonesian economics of service industries. J Retail Consum Serv 21:108–117. https:// doi. org/ 10. 1016/j. jretc onser. 2013. 09. 002
Quak H, de Koster M, René BM (2006) The impacts of time access restrictions and vehicle weight restrictions on food retailers and the environment. Eur J Transp Infrastruct Res 6:131–150. https:// doi. org/ 10. 18757/ ejtir. 2006.6. 2. 3430
Rahadi RA (2012) Factors related to repeat consumption behaviour: a case study in traditional market in bandung and surrounding region. Procedia Soc Behav Sci 36:529–539. https:// doi. org/ 10. 1016/j. sbspro. 2012. 03. 058
Russo F, Comi A (2011) A model system for the ex-ante assessment of city logistics measures. Res Transp Econ 31:81–87. https:// doi. org/ 10. 1016/j. retrec. 2010. 11. 011
Russo F, Comi A (2010) A modelling system to simulate goods movements at an urban scale. Transporta-tion (amst) 37:987–1009. https:// doi. org/ 10. 1007/ s11116- 010- 9276-y
Sakai T, Kawamura K, Hyodo T (2015) Locational dynamics of logistics facilities: Evidence from Tokyo. J Transp Geogr. https:// doi. org/ 10. 1016/j. jtran geo. 2015. 05. 003
968 T. S. Nugroho et al.

1 3
Shaw S (1999) Procurement strategies of small retailers faced with uncertainty: an analysis of chan-nel choice and behaviour. Int Rev Retail Distrib Consum Res 9:93–109. https:// doi. org/ 10. 1080/ 09593 96993 42705
Taniguchi E, Thompson RG, Yamada T (2003) Predicting the effects of city logistics schemes. Transp Rev 23:489–515. https:// doi. org/ 10. 1080/ 01441 64021 01639 99
Toilier F, Serouge M, Routhier J-L, Patier D, Gardrat M (2016) How can Urban Goods Movements be Surveyed in a Megacity? The Case of the Paris Region. Transp Res Procedia 12:570–583. https:// doi. org/ 10. 1016/j. trpro. 2016. 02. 012
Visser J, van Binsbergen A (1999) Urban freight transport policy and planning. In: Taniguchi E, Thompson RG (eds) First International Symposium on City Logistics Institute of System Science Research. Kyoto Japan, pp. 39–69
Wang Q, Hu J (2012) Behavioral analysis of decisions in choice of commercial vehicular mode in urban areas. Transp Res Rec J Transp Res Board 2269:58–64. https:// doi. org/ 10. 3141/ 2269- 07
Wisetjindawat W, Sano K, Matsumoto S, (2007) Micro-simulation model, for modelling freight agents interactions in Urban Freight Movement. In: 86th Annual Meeting of the Transportation Research Board. Washington DC, January 21–25
Wisetjindawat W, Sano K, Matsumoto S (2006) Commodity distribution model incorporating spatial interactions for urban freight movement. Transp Res Rec J Transp Res Board 1966:41–50. https:// doi. org/ 10. 3141/ 1966- 06
Publisher’s Note Springer Nature remains neutral with regard to jurisdictional claims in published maps and institutional affiliations.
969Independent Retailer Restocking Choices in Urban Goods Movement…