india coffee annual bean counters lower production … gain publications/coffee...bean counters...
TRANSCRIPT

THIS REPORT CONTAINS ASSESSMENTS OF COMMODITY AND TRADE ISSUES MADE BY
USDA STAFF AND NOT NECESSARILY STATEMENTS OF OFFICIAL U.S. GOVERNMENT
POLICY
Required Report - public distribution
Date: 5/15/2018
GAIN Report Number: IN8060
India
Coffee Annual
Bean Counters Lower Production and Exports Press Ahead
Approved By:
Adam Branson
Prepared By:
Dhruv Sood
Report Highlights:
India’s MY 2018/19 coffee crop (Oct/Sep) is forecast at 5.5 million 60-kg bags as erratic rains and
unusually high temperatures touched coffee growing regions. Domestic consumption is forecast higher
with growth attributed to soluble coffee consumption. MY 2018/19 exports are forecast lower after
strong MY 2017/18 numbers due to smaller carryover stocks and uncertainty with the future of the
export incentive scheme.

Commodities:
Coffee, Green
Production:
FAS Post forecasts marketing year (MY) 2018/19 (Oct/Sep) coffee production at 5.5 million 60-kg bags
(330,000 metric tons or, MT). The 2018/19 crop forecast is 100,000 60-kg bags lower than the official
USDA 2017/18 crop estimate owing to unusually high temperatures and inadequate rains during the
Northeast Monsoon that hindered Arabica plant development. Rising temperatures damaged coffee
plants and led to stunted growth and moisture stress. Trade sources indicated a high incidence of white
stem borer infestations on the MY 2017/18 Arabica crop. Growers have been advised by state
governments to uproot and burn infested plants.
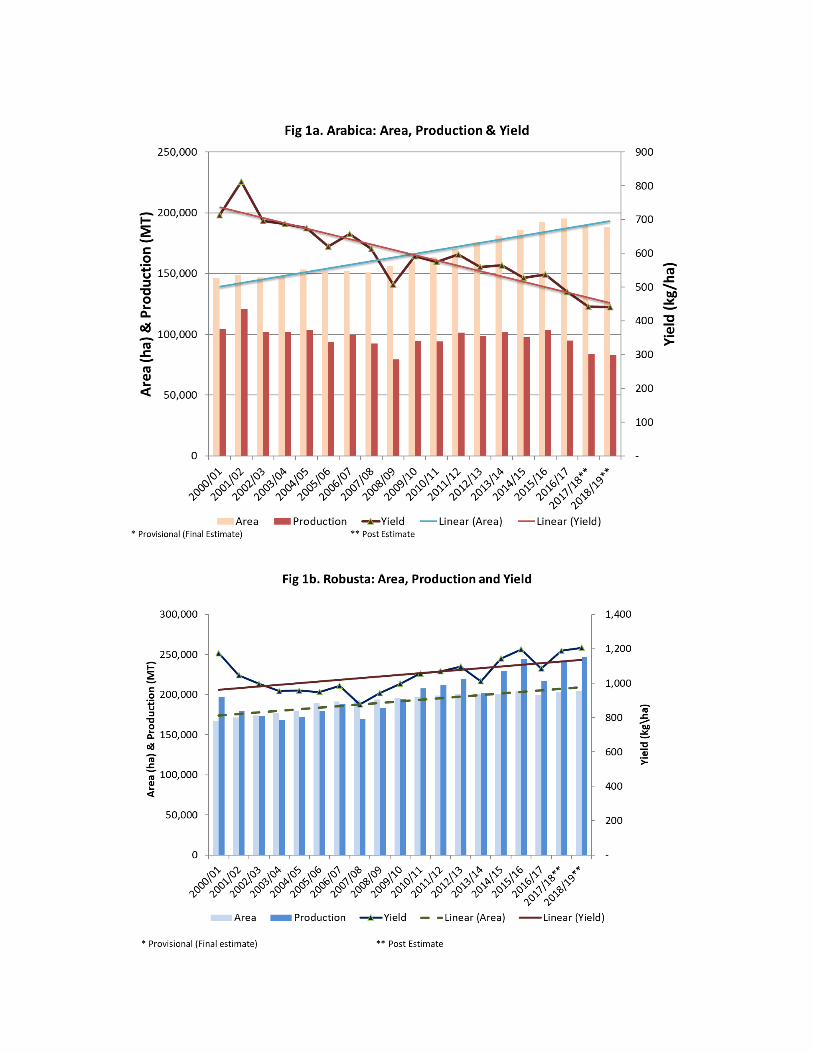
Robusta is the more popular variety and accounts for over 70 percent of India’s coffee crop. The
Arabica crop is entering the ‘off-year’ of the biennial production cycle and is expected to bear fewer
fruit than last year. The Robusta crop is expected to produce slightly more fruit than last year owing to
good rainfall and irrigation water availability. The Arabica harvest takes place from November to
January while the Robusta harvest is December to February. Blossom showers during March and April
are required for the development of coffee floral buds.
For MY 2018/19, blossom showers have been uniform and favorable for both Arabica and Robusta and
should support plant development (bud enlargements, opening, and flowering). The normal rainfall
requirement for blossoms is 25mm occurring in seven consecutive days for Arabica and 20mm in seven
consecutive days for Robusta.
FAS Post forecasts Robusta yields at 1,206 kilograms per hectare and Arabica yields at around 440
kilograms per hectare.
According to the Indian Meteorological Department, during the period from March 1, 2018 to May 9,
2018, the coffee growing district in Chikmagalur (southern Karnataka) received 147.4 millimeters (mm)
of rainfall (55 percent above normal). During the same time period, the Kodagu district of Karnataka
received 221.7 mm rainfall (54 percent above normal) and the Hassan district of Karnataka received
148.9 mm of rainfall (61 percent above normal). Other major coffee growing regions in Tamil Nadu
and Kerala received above normal rainfall, as well.
As reported by Post in IN7126, the Coffee Board of India estimated MY 2017/18 production at 5.84
million 60-kg bags (350,400 MT) in its post-blossom (i.e., pre-monsoon) forecast. The Coffee Board is
expected to lower the MY 2017/18 estimated based on field surveys. Post’s estimate of the MY
2017/18 Robusta and Arabica coffee crop is 5.42 million 60-kg bags. Post estimate is lower than FAS
Washington estimate of 5.6 million 60 kg bags, primarily due to the high incidence of white stem borer
infestations that has affected the MY 2017/18 Arabica crop, and the erratic weather conditions
specifically high temperatures that affected the Robusta crop.
For the MY 2016/17 crop, the Board revised its final estimate to 5.2 million 60-kg bags (312,000 MT
comprising 95,000 MT of Arabica and 217,000 MT of Robusta). Post revised the MY 2016/17
production estimate to reflect the Board’s final estimate.

Area
Area harvested and plant inventory forecasts are higher compared to last year as older trees were
replaced with newer trees ones that have since started bearing fruit. The southern states of Karnataka,
Kerala, and Tamil Nadu account for 82 percent of planted area. The non-traditional lower-yielding areas
of Andhra Pradesh, Orissa, and Northeastern India have seen a marginal increase in area, but planted
area in these states is limited. With coffee estates in close proximity to protected forest reserves, there is
limited opportunity for further area expansion. Growers are gradually shifting towards replanting to
replace their aging plantations at an annual rate of 1-2 percent per year which leaves a difference of
approximately 40,000 ha between harvested and planted area. Generally, the first fruit is expected from
after the third year.
February and March rains are crucial for determining the crop yield. Pre-monsoon rains (blossom
showers) in March and April have been above normal in all traditional coffee growing states. The well-
distributed rains will provide irrigation and moisture for the Robusta plants.
White stem borer remains a major pest issue affecting the Arabica crop. Fungal diseases such as leaf
rust and black rot are the most widespread coffee diseases in India.
Post revised its planted and bearing area to align with Coffee Board data for MY 2016/17. According to
the Coffee Board data, the planted area in MY 2016/17 was 449,357 hectares, but the bearing area was
409,924 hectares. For MY 2018/19, FAS Post forecasts the planted area to increase to 450,000 hectares
with the bearing area forecast at around 422,000 hectares.
Table 1. India: Coffee Planted Area in Major States (in hectares)
State 2014/15 2015/16 2016/17
Arabica Robusta Total Arabica Robusta Total Arabica Robusta Total
Karnataka 109,032 121,402 230,434 111,225 124,213 235,438 108,845 135.940 244.785
Kerala 4,203 81,253 85,456 4,217 81,284 85,501 4,228 81,642 85.870
Tamil Nadu 26,058 5,613 31,671 29,062 5,870 34,932 29,513 6.094 35.607
Andhra
Pradesh 64,689 267 64,956 71,280
(NTA)
267
(NTA) 71,547
(NTA)
75,237
(NTA) 261 75.594
Odisha 4,140 - 4,140
North
Eastern
Region
5,340 1,273 6,613 5,595 1,423 7,018 5,903 1.598 7.501
Total 213,462 209,808 423,270 221,379 213,057 434,436 223,816 225,541 449,357
NTA- Non Traditional Area
Source: Ministry of Commerce and Industry, November 2017
Table 2. India: Estimated Number of Persons (permanent and casual labor)
Engaged in Coffee Cultivation
Karnataka 514,695
Kerala 44,186
Tamil Nadu 29,339
Non Traditional Area (Odisha and Andhra Pradesh) 65,427
Source: Ministry of Commerce and Industry, November 2017


Inputs

Recent increases in farm input costs along with the elimination of fertilizer and diesel subsidies have
increased production costs for growers. With increasing off-farm employment opportunities, coffee
planters have started experiencing shortages of skilled labor. Labor costs, which account for more than
50 percent of the cost of cultivation, continue to escalate. According to Coffee Board of India statistics,
the general daily wage rate in the state of Karnataka increased by 8 percent from Rs. 257 (US$3.80) to
Rs. 277 (US$ 4.10) per day between March, 2017 and November, 2017.
India Coffee Types Dominated by Robusta The Arabica plants are self-pollinating and are typically grown at higher elevation under rain-fed
conditions. The plants are grown under shade to prevent variation in soil temperature and moisture
levels as well as for protecting the plants in case of heavy rainfall. In India, there is a two-tier shade for
Arabica crop. The higher canopy shade (30-40 feet) is mostly evergreen trees such as Indian rosewood /
jackfruit while Dadap / Silver oak are used for the lower canopy shade (15-20 feet). The leaf litter from
these trees acts as soil cover and prevents the direct impact of rain water and soil erosion. The planting
space in Arabica crop is 6 feet by 6 feet with an average of 3,000 plants per hectare. The Robusta crop
planting space is 10 feet by 10 feet with about 460 plants per hectare. As Arabica is a deep rooted plant,
it is able to sustain itself during drought conditions, though Robusta, with its shallow roots, requires
irrigation during the season. There has been a shift from Arabica to Robusta plantations due to the
susceptibility of the Arabica crop to stem borer pest and leaf rust. With the changes in the distribution
pattern of the rains in the last decade, the elevation at which Arabica is grown is pushing the cultivation
to much higher altitudes. More than 60 percent of the labor working at the estates is contracted during
the harvesting season.
Table 3. India: Coffee Types
Processing Method Coffee Varieties Cultivated in India
Arabica Robusta
Washed
(wet processed) Parchment / Plantation Coffee Parchment
Unwashed
(natural/dry processed) Cherry Cherry
Policy:
Merchandise Export Incentive Scheme (MEIS) under review
The current rate of reward under the MEIS Scheme is set to expire on June 30, 2018. There is
uncertainty on the decision regarding whether the scheme will receive an extension. Trade sources
indicate that the Government of India may review the existing scheme, and make it compliant with the
global trade norms. The MEIS reward rate can range from 3-7 percent of the FOB value of exports
depending on the harmonized tariff schedule and coffee classification (green coffee, roast and ground, or
instant/soluble)
Consumption:
The MY 2018/19 consumption forecast is 1.25 million 60-kg bags (75,000 MT). Industry estimates
indicate coffee consumption remained between 1.16 million 60-kg bags and 1.25 million 60-kg bags
(70,000 – 75,000 MT) over the past few years. The Coffee Board of India has not published any
consumption data since 2011.

One reason for the large variation in industry consumption estimates is the widespread use of chicory in the
domestic market. Many popular instant coffees contain 20 to 49 percent chicory. The recent FSSAI draft
notification as reported by Post in IN8055 is attempting to regulate the chicory content in coffee-chicory
mixture and consequently increase coffee content in soluble/instant coffee sector. Once the notification is
finalized, the domestic soluble industry (organized and unorganized) will need to ensure that coffee-chicory
mixture will contain at least 70 percent coffee. Trade sources indicate the notification as a positive step to
increase domestic coffee consumption, but remain skeptical whether the available methodology to test the
percentage of chicory content in the mixture exists or will be used.
Trade sources cite that instant/soluble manufactures are altering the percentage of coffee in blends to
match consumer tastes and preferences around the country and to maintain commercial and financial
competitiveness. Trade sources further indicate that while the ratio of roast and ground coffee
consumption has traditionally been higher, the share of instant/soluble coffee has increased in recent
years, especially in northern India, and will continue to remain high in MY 2018/19.
The bulk of India’s coffee production is exported and the domestic industry focuses much of its
marketing effort on export promotion. There are signs that the popularity of coffee is increasing with the
spread of both foreign and home-grown coffee shops and restaurant chains. However, exports continue
to siphon large amounts of coffee away from the domestic market and consumption estimates are
largely unchanged. The instant/soluble coffee segment is almost entirely branded and packaged, and is
dominated by a few multinationals, accounting for almost 90 percent of the total soluble coffee market.
Hundreds of western-influenced coffee shops have emerged across India’s major and smaller “second
tier” cities over the past decade. Coffee now competes against the once dominant tea in these cafes,
especially among younger consumers. Aside from large coffee shop chains, artisanal coffee brands are
emerging in metro cities but these remain a niche category as coffee sold at these cafes are priced at a
premium.
A growing willingness to consume food and drink outside the home and increasing disposable income
has helped fuel coffee consumption growth in recent years. Many firms have targeted young
professionals; especially, women, but the pace of expansion appears to have slowed in recent years.
MY 2017/18 consumption estimates have been revised based on industry analysis, and Post discussions
with industry stakeholders.
Trade:
Post’s MY 2018/19 export forecast is 5.4 million 60-kg bags, marginally lower than FAS Washington
forecast from last year. The uncertainty around the export benefit scheme and anticipated low carryover
stocks for next year may prompt lower exports than the current year. A large percentage of the crop is
still expected to be exported. November 2017 green coffee prices for Arabica Parchment and Robusta
Cherry in Karnataka have fallen by 20 percent since the beginning of the year. Indian prices have
tracked with global prices for both varietals. Arabica and Robusta prices have declined since January
with reports of expected higher production in other major coffee producing countries.
According to the Coffee Board export data, the permits issued for coffee exports by volume for
(October – May) in MY 2017/18 were higher by 16 percent compared to the previous year, but the unit

value per ton has fallen by 7 percent during the same period. Post estimates that MY 2017/18 exports
will surpass MY 2016/17 export volumes and be a record export year. Strong exports in MY 2017/18
are being witnessed as the Indian Rupee has depreciated by more than 5 percent since the beginning of
the year and this has provided support for exports. Another reason for strong exports is the export
incentive scheme for exporters. The Merchandise Export from India Scheme (MEIS Scheme) is set to
expire on June 30, 2018, and exporters are aligning a large volumes of shipments to take advantage of
the reward rates and to help cut into what have been large carryover stocks. Large carry-over stocks
from MY 2017/18 have supported strong export shipments for beans and soluble coffee. Italy, Germany
and Russia were top export markets for green coffee, while Russia, Turkey and Indonesia were the top
export markets for instant/soluble coffee in MY 2017/18.
Imports of green coffee for the purpose of re-export was dominated by Vietnam, Uganda, and Indonesia
due to duty exemptions and lower overall prices.
Delay in filing of return of confirmations (ROC) leading to over reporting of export data
On January 28, 2018, the Coffee Board of India issued a circular instructing exporters to file their
ROC/post shipment documents within 45 days from the date of export. Failure to file the proof of export
will lead to non-issuance of new export permits. The delay in filing is leading to over reporting of
export data, as the Coffee Board is not able to validate the actual shipments against the export permits
that were issued. For more details please refer to the screenshot of the circular below for your reference.
FAS Post uses the shipment data published by the Ministry of Commence, Government of India for its
analysis

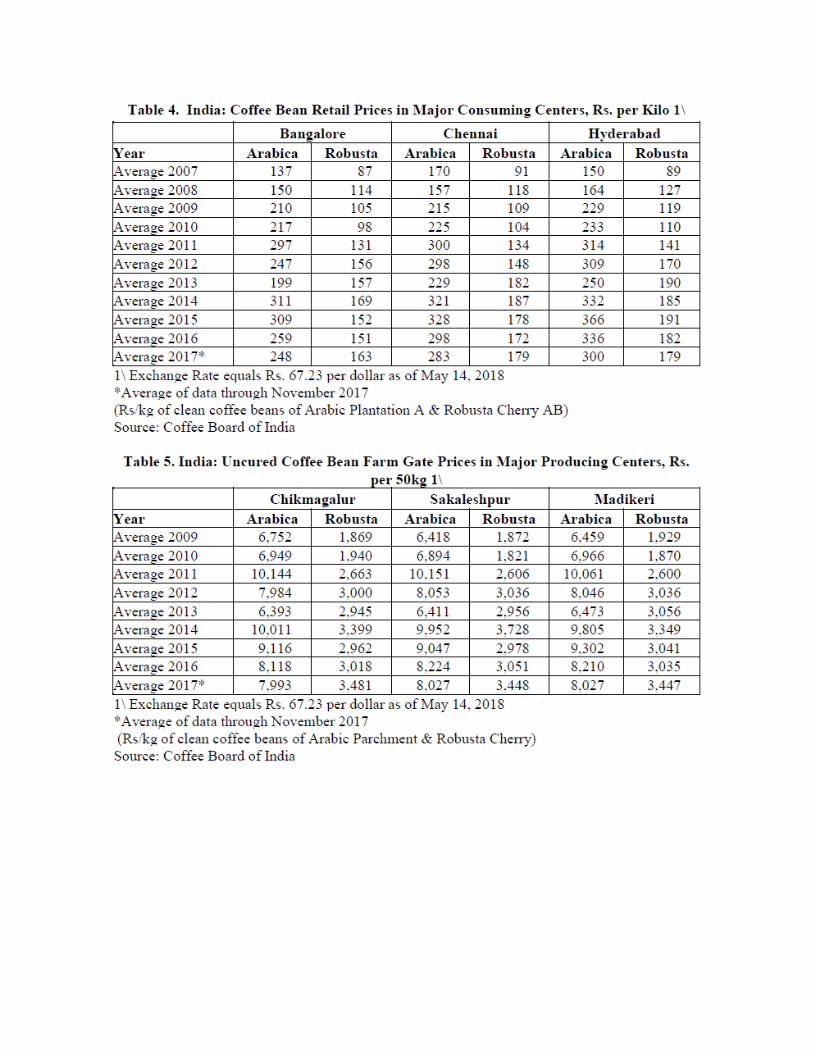

Table 6. India: Coffee Exports
(Oct/Sep Marketing Year, Includes Re-Exports)
S
No. Destination
MY
2011/12
MY
2012/13
MY
2013/14
MY
2014/15
MY
2015/16
MY
2016/17
Quantity
(MT)
Quantity
(MT)
Quantity
(MT)
Quantity
(MT)
Quantity
(MT)
Quantity
(MT)
1 Italy 78,010 68,662 70,782 65,509 83,769 78,780
2 Germany 25,726 28,372 29,163 24,256 32,699 39,217
3 Russia 29,392 19,596 18,914 20,914 28,149 29,806
4 Belgium 18,007 18,055 13,641 14,830 20,125 18,828
5 Turkey 4,906 9,905 14,055 15,293 14,656 18,167
6 Poland 4,567 2,558 3,208 5,051 8,500 13,980
7 Spain 7,982 6,421 4,998 5,709 8,173 10,109
8 Libya 3,879 5,816 5,835 5,759 6,173 9,768
9 Jordan 7,506 10,337 7,741 6,772 8,643 8,672
10 USA 6,376 5,804 5,993 5,149 5,884 8,353
11 Slovenia 13,133 10,339 7,868 9,248 11,839 8,316
12 Australia 4,736 6,888 5,114 6,341 5,496 7,048
13 Ukraine 5,163 6,815 5,691 5,044 3,537 6,393
14 Malaysia 8,328 6,777 5,819 5,742 6,185 6,387
15 Others 92,559 85,221 89,818 81,152 101,631 111,580
TOTAL 310,270 291,566 288,640 276,769 345,459 375,404
Source: Coffee Board of India (Database - November 2017)
Table 7. India: Import Duty on Coffee and Related Products*
HTS Code Product description MFN Basic
Duty
0901.11 Coffee neither roasted nor decaffeinated 100%
0901.12 Coffee not roasted decaffeinated 100%
0901.21 Coffee roasted not decaffeinated 100%
0901.22 Coffee roasted and decaffeinated 100%
2101.11.10 Instant coffee flavored 30%
2101.11.20 Instant coffee not flavored 30%
2101.11.30 Coffee Aroma 30%
2101.11.90 Others 30%
2101.12.00 Preparations with a basis of extracts, essences or concentrates with a
basis of coffee 30%
*Owing to India’s trade agreements, several countries can have lower than MFN duty rates on HTS
0901 and other tariff chapters.

Table 8. India: Export Tax/Cess on Coffee and Related Products
S No. Product description Basic duty
1 Green 0%
2 Roasted 0%
3 Soluble 0%
Table 9. India: Import Tariff on Coffee and Related Products
HS Code Description Standard Rate
(Applied Rate)
Preferential Rate
0901 Coffee, whether or not roasted or decaffeinated;
0901.11 Coffee nether roasted nor
decaffeinated
100% 100% less 13 paise
per kg
0901.12 Coffee not roasted decaffeinated 100% 100% less 13 paise
per kg
0901.21 Coffee roasted not decaffeinated 100% 100% less 13 paise
per kg
0901.22 Coffee roasted and decaffeinated 100% 100% less 13 paise
per kg
2101.11 Extracts, essences and concentrates of coffee, preparation with a basis of these
extracts, essences or concentrates or with a basis of coffee:
2101.11.10 Instant coffee flavored 30% -
2101.11.20 Instant coffee not flavored 30% -
2101.11.30 Coffee Aroma 30% -
2101.11.90 Others 30% -
2101.12.00 Preparation with a basis of
extracts, essences
or concentrates with a basis of
coffee
30% -
Policy:
Merchandise Export Incentive Scheme (MEIS) under review
The current rate of reward under the MEIS Scheme is set to expire on June 30, 2018. There is
uncertainty on the decision regarding whether the scheme will receive an extension. Trade sources
indicate that the Government of India may review the existing scheme, and make it compliant with the
global trade norms. The MEIS reward rate can range from 3-7 percent of the FOB value of exports
depending on the harmonized tariff schedule and coffee classification (green coffee, roast and ground,
or instant/soluble)
Marketing:
Indian Coffee Marketing System
Common marketing practices include: 1) selling to exporters through an agent; 2) storing at a curing
plant before selling; 3) selling at auctions; and 4) exporting directly. Small holders typically sell their
parchment coffee (or dry cherry) to exporters through export agents and consolidators. The agent takes
the coffee beans to the curing factory, where they are checked for quality against the standards of the
destination country. Storing the coffee at a curing plant allows the coffee grower to retain ownership of

the coffee before selling it in order to take advantage of price movements. Larger producers typically
sell at auctions organized by the Indian Coffee Traders’ Association or export directly.
Production, Supply and Demand Data Statistics:
Coffee, Green 2016/2017 2017/2018 2018/2019
Market Begin Year Oct 2016 Oct 2017 Oct 2018
India USDA
Official
New
Post
USDA
Official
New
Post
USDA
Official
New
Post
Area Planted 415 449 420 440 - 450
Area Harvested 370 410 380 400 - 422
Bearing Trees 530 532 540 540 - 542
Non-Bearing Trees 100 100 100 98 - 97
Total Tree
Population
630 632 640 638 - 639
Beginning Stocks 2,645 2,645 1,932 1,873 - 1,233
Arabica Production 1,583 1,583 1,440 1,400 - 1,380
Robusta Production 3,617 3,617 4,160 4,020 - 4,120
Other Production - - - - - -
Total Production 5,200 5,200 5,600 5,420 - 5,500
Bean Imports 1,292 1,306 1,250 1,300 - 1,250
Roast & Ground
Imports
2 2 2 2 - 2
Soluble Imports 81 78 63 78 - 70
Total Imports 1,375 1,386 1,315 1,380 - 1,322
Total Supply 9,220 9,231 8,847 8,673 - 8,055
Bean Exports 4,250 4,273 3,960 4,310 - 3,750
Rst-Grnd Exp. 5 5 7 5 - 5
Soluble Exports 1,833 1,880 1,583 1,910 - 1,670
Total Exports 6,088 6,158 5,550 6,225 - 5,425
Rst,Ground Dom.
Consum
550 550 520 525 - 530
Soluble Dom. Cons. 650 650 685 690 - 720
Domestic
Consumption
1,200 1,200 1,205 1,215 - 1,250
Ending Stocks 1,932 1,873 2,092 1,233 - 1,380
Total Distribution 9,220 9,231 8,847 8,673 - 8,055
(1000 HA) ,(MILLION TREES) ,(1000 60 KG BAGS)