india semiconductor and embedded design service · pdf fileindia semiconductor and embedded...
TRANSCRIPT

Market, Technology and Ecosystem Analysis
ISA-IDC REPORT2008
INDIA SEMICONDUCTOR ANDEMBEDDED DESIGN SERVICE INDUSTRY
(2007-2010)
INDIA SEMICONDUCTOR ANDEMBEDDED DESIGN SERVICE INDUSTRY
(2007-2010)

blank page blank page

4
IndIa SemIConduCtor and embedded deSIgn ServICe InduStry (2007-2010)market, teChnology and eCoSyStem analySIS
I S a - I d C r e p o r t , 2 0 0 8
Copyright©2008, India Semiconductor Association
India Semiconductor Association
UNI Building, 4th FloorMillers Tank Bund RoadBangalore 560 052, IndiaTelephone: +91 80 41473250Facsimile: + 91 80 4122 1866Email: [email protected]: www.isaonline.org
ISA is the trade body representing the Indian semiconductor driven industry. ISA has around 120 members from the semiconductor driven industry from India and outside. These include design companies, solar fabs, manufacturing companies, VLSI companies, EDA companies and others in the ecosystem like venture funds, legal and academic institutions. ISA aims to establish India as the preferred global semiconductor destination. It is committed towards building global awareness for the Indian semiconductor driven industry and supporting its growth through focused activities. ISA has played a prominent role in supporting the Government of India in the formation of the Semiconductor Policy 2007.
The material in this publication is copyrighted. No part of this book can be reproduced either on paper or on electronic media without permission in writing from the publisher. Requests for permission to reproduce portions of it should be sent to the ISA at the above address.
First Print:April 2008
Published by:India Semiconductor Association, Bangalore
Copyright NoticeAll content included in this Report, such as text, graphics, logos, images, data compilations, etc. is the property of India Semiconductor Association (“ISA”). The Report is for customers’ internal use and not for general publication or disclosure to third parties. No part of this Report may be given, lent, resold, or disclosed to non-customers or exploited for any commercial purposes. Furthermore, the Report in its entirety or any part cannot be reproduced, stored in a retrieval system, or transmitted in any form or by any means, electronic, mechanical, photocopying, recording, or otherwise, without the prior written consent of ISA.
Disclaimer of Warranties and Limitation Of LiabilityThis report is provided by ISA on an "as is" and "as available" basis. ISA and IDC have provided information that is provided by market participants, survey respondents and secondary research of publicly available information. ISA and IDC take no responsibility for any incorrect information supplied to us by market participants (manufacturers or users). Quantitative market information is based primarily on interviews and therefore is subject to fluctuation. No claims are made for the accuracy or applicability of the information to any specific situation.
ISA and IDC make no representations or warranties of any kind, express or implied, as to the information, content, materials, etc., included in this report. The user of the report shall do so at the user’s sole risk. In the event the user intends taking any steps that could have an adverse effect on the users business, ISA expressly states that the user should consult its legal, tax or other advisors, in order to protect the interests of the user, which may be specific from case to case. It is emphasized that ISA has participated in preparation of this report with IDC in an independent manner and should not be construed as necessarily being reflective of the views or position of any individual member company of the ISA or of the representatives of such member companies that may serve on the ISA's executive council or other member forums.
To the full extent permissible by applicable law, ISA and IDC disclaim all warranties, express or implied, including, but not limited to, implied warranties of merchantability and fitness for a particular purpose. ISA and IDC will not be liable for any damages of any kind arising from the use of this report, including, but not limited to direct, indirect, incidental, punitive, and consequential damages.
INDIA SEMICONDUCTOR ANDEMBEDDED DESIGN SERVICE INDUSTRY
(2007-2010)
Market, Technology and Ecosystem Analysis
ISA-IDC REPORT2008
6
IndIa SemIConduCtor and embedded deSIgn ServICe InduStry (2007-2010)market, teChnology and eCoSyStem analySIS
I S a - I d C r e p o r t , 2 0 0 8
ForewordTo help analyse the milestones achieved so far and refine the future growth path for the Indian semiconductor and embedded design services industry, the India Semiconductor Association ISA, the premier industry body of semiconductor-driven companies approached IDC India to gauge the current size, future potential and direction of this industry.
The findings of the report more than justified the excitement of the IDC India research team, when viewed in the context of a whole new growth opportunity emerging in the areas of VLSI design, hardware/board design and embedded software.
The total design market in India for 2007 was estimated at US$ 6 billion and employed around 130, 000 personnel. The total design services market is expected to grow at a CAGR of 21.7% to US$ 10.96 billion in 2010, employing 218,800 professionals.
The Indian semiconductor and embedded design services market entered a growth phase in the last couple of years and since then there has been no looking back. With an unprecedented growth, the market is set to cross the US$ 7.37 billion in 2008.
But is this the end of the current growth phase? Will the market mature and reach a plateau? The ISA and IDC India teams expect that there will be significant, new developments in the years ahead. The nature of opportunities and engagements between design services’ ecosystem players would be quite challenging moving forward. Thus, in a manner of speaking, the domestic semiconductor and embedded design services industry enters a new phase – Ver 2.0, following on from where Ver 1.0 left off.
What is this Ver 2.0 and how will the overall Indian semiconductor and embedded design services industry start evolving in 2008? What will be the key dynamics of this new phase of growth?
These are some of the key questions on the minds of all stakeholders. These are also the issues, which the ISA-IDC India team answers through the pages of the current report – “India Semiconductor and Embedded Design Services Industry 2007-2010: Market, Technology and Ecosystem Analysis “.
Kapil Dev SinghCountry ManagerIDC (India) Ltd.An ISO 9001:2000 Company
prefaceEver since its inception in 2004, the India Semiconductor Association ISA has strived to play a role in facilitating a vibrant semiconductor ecosystem in the country. Research has been one of the cornerstones of ISA’s key activities. After bringing out research reports on the Indian semiconductor sector, ISA is releasing its research report on the Indian semiconductor design industry in collaboration with IDC India.
The Indian design story started in the mid 1980s when a few global companies set up their captive engineering centers in India to harness the local talent pool. This trend evolved into a compelling imperative in the world economic order during the late 90s and many more companies set up Indian operations. Eyeing the enormous potential of the design market, domestic companies and MNCs expanded their offerings. Today, the Indian semiconductor and embedded design industry has come of age with increasing complexity of design work from India.
This report is a bi-annual exercise to update data on the Indian semiconductor design industry, identify future opportunities and strengthen the existing design ecosystem in India.
The ISA-IDC report provides details on design workforce details; analysis of the main design services segments-VLSI, hardware/board design and embedded software; revenue, market drivers and trends. The report offers a review of the Indian semiconductor and embedded design services market for 2007 and projections up to 2010.
ISA will continue its role to aid the growth of the sector through its initiatives that focus on brand building, talent, creating an ecosystem and supporting public policy.
Our thanks to all members of ISA who participated in the study; the research teams at IDC-Sanjit Sinha, Praveen Sengar, Mrydul Vats and Thomas George, who put it together; A. Vasudevan (Wipro Technologies), Sanjeev Keskar (Freescale), K. Chandrasekhar (NXP), S.R. Dinesh (MindTree Consulting) and Vivek Tyagi (Freescale) formed the core committee from industry and Dr Vidya Mulky from the Secretariat supported the process.
Poornima Shenoy S. Janakiraman
President Chairman
8
IndIa SemIConduCtor and embedded deSIgn ServICe InduStry (2007-2010)market, teChnology and eCoSyStem analySIS
I S a - I d C r e p o r t , 2 0 0 8
m a r k e t a n a l y S I S
market analySIS
India Semiconductor and embedded design Services Industry (2007-2010), market, technology and ecosystem analysis
ISA-IDC Opinion
Embedded electronics is becoming pervasive, whether it is in the form of consumer devices, handheld and multimedia devices, automotive or medical devices. The convergence of ICE (Information, Communication and Entertainment) that started few years back has gained momentum. This has led to paradigm shift in devices from fixed function to multifunction with more features at incremental costs.
In this backdrop, product companies are striving to maintain their competitive edge in the market while newer entrants want to create differentiation in their products. Hence, the markets in reference are faced with challenges, which include lower design and production costs, faster time-to-market, and multiple product models with rapid innovation.
The above forces have created a strong focus on the semiconductor and embedded design separately within the electronics design and development value chain. The Indian semiconductor and embedded design industry has come of age and is of a significant size. The presence of multinational companies, growth of Indian services companies, establishment of product design centers and a huge domestic market have together created an interesting ecosystem. Companies in India have moved up the value chain from mere project execution to end-to-end development of products. This report attempts to map the market for VLSI, hardware/board design and embedded software industry and the market dynamics between the members of the ecosystem.
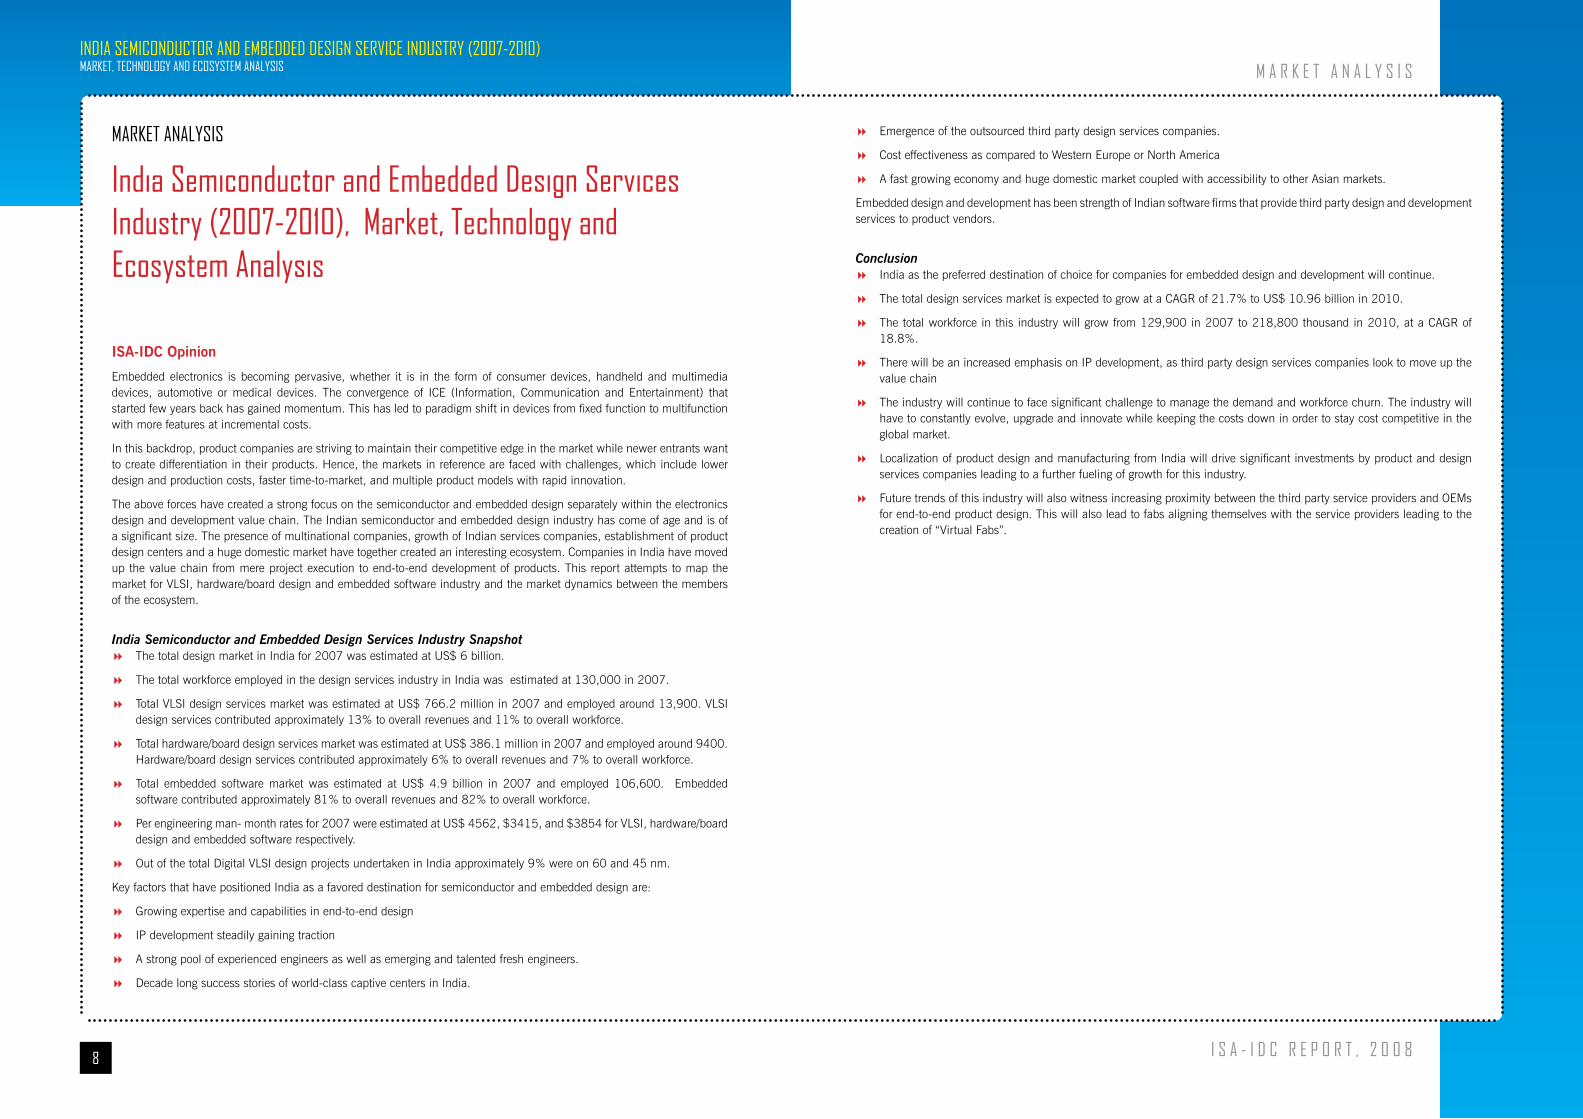
India Semiconductor and Embedded Design Services Industry SnapshotThe total design market in India for 2007 was estimated at US$ 6 billion. �
The total workforce employed in the design services industry in India was estimated at 130,000 in 2007. �
Total VLSI design services market was estimated at US$ 766.2 million in 2007 and employed around 13,900. VLSI �design services contributed approximately 13% to overall revenues and 11% to overall workforce.
Total hardware/board design services market was estimated at US$ 386.1 million in 2007 and employed around 9400. �Hardware/board design services contributed approximately 6% to overall revenues and 7% to overall workforce.
Total embedded software market was estimated at US$ 4.9 billion in 2007 and employed 106,600. Embedded �software contributed approximately 81% to overall revenues and 82% to overall workforce.
Per engineering man- month rates for 2007 were estimated at US$ 4562, $3415, and $3854 for VLSI, hardware/board �design and embedded software respectively.
Out of the total Digital VLSI design projects undertaken in India approximately 9% were on 60 and 45 nm. �
Key factors that have positioned India as a favored destination for semiconductor and embedded design are:
Growing expertise and capabilities in end-to-end design �
IP development steadily gaining traction �
A strong pool of experienced engineers as well as emerging and talented fresh engineers. �
Decade long success stories of world-class captive centers in India. �
Emergence of the outsourced third party design services companies. �
Cost effectiveness as compared to Western Europe or North America �
A fast growing economy and huge domestic market coupled with accessibility to other Asian markets. �
Embedded design and development has been strength of Indian software firms that provide third party design and development services to product vendors.
ConclusionIndia as the preferred destination of choice for companies for embedded design and development will continue. �
The total design services market is expected to grow at a CAGR of 21.7% to US$ 10.96 billion in 2010. �
The total workforce in this industry will grow from 129,900 in 2007 to 218,800 thousand in 2010, at a CAGR of �18.8%.
There will be an increased emphasis on IP development, as third party design services companies look to move up the �value chain
The industry will continue to face significant challenge to manage the demand and workforce churn. The industry will �have to constantly evolve, upgrade and innovate while keeping the costs down in order to stay cost competitive in the global market.
Localization of product design and manufacturing from India will drive significant investments by product and design �services companies leading to a further fueling of growth for this industry.
Future trends of this industry will also witness increasing proximity between the third party service providers and OEMs �for end-to-end product design. This will also lead to fabs aligning themselves with the service providers leading to the creation of “Virtual Fabs”.

10
IndIa SemIConduCtor and embedded deSIgn ServICe InduStry (2007-2010)market, teChnology and eCoSyStem analySIS
I S a - I d C r e p o r t , 2 0 0 8
t a b l e o F C o n t e n t S
table of ContentsChapter 1- Total Design Market 13Introduction .................................................................................................................................................................. 13Summary of Findings ..................................................................................................................................................... 13 Indian Design Services Market 2007-2010 ............................................................................................................... 13 Total Engineering Workforce Forecast ........................................................................................................................ 14 Average Engineering Man-month Rate for the Total Market .......................................................................................... 14 Revenue Share by VLSI, Embedded and Hardware / Board Design Services .................................................................. 15 Engineering Workforce Split by Type of Design Services .............................................................................................. 15 Technical Workforce Breakup by Educational Qualification and Gender Ratio ................................................................. 16
Chapter 2 - VLSI Design Market 17Market Snapshot ........................................................................................................................................................... 17Market Details ............................................................................................................................................................... 17 Types of Contracts .................................................................................................................................................. 18 Geographies Served by Indian Semiconductor Companies ........................................................................................... 18 VLSI Design Ecosystem ........................................................................................................................................... 18Market Drivers ............................................................................................................................................................... 18Market Challenges ......................................................................................................................................................... 19Future Trends ................................................................................................................................................................ 19Quantitative Analysis ...................................................................................................................................................... 20 Total Number of VLSI Design Projects ....................................................................................................................... 20 Total Number of Design Projects by Gate Count ......................................................................................................... 20 VLSI Design Projects Forecast by Technology ............................................................................................................. 20 VLSI Projects Breakup by the Type of Design ............................................................................................................. 22 VLSI Design Market Revenue Forecast ...................................................................................................................... 22 Market Forecast by Workforce for VLSI Market ........................................................................................................... 23 Market Forecast by Engineering Man-month Rate for VLSI Design Market ..................................................................... 23 Percentage of VLSI Design Projects by Industry Segments ........................................................................................... 23 VLSI Technical Workforce Breakup by Educational Qualification and Gender Ratio .......................................................... 24
Chapter 3 – EDA Tools Market 25Market Snapshot ........................................................................................................................................................... 25Market Details ............................................................................................................................................................... 25Market Drivers ............................................................................................................................................................... 25Challenges Faced by EDA Companies ............................................................................................................................... 26Changing Scenario in Procurement Process ....................................................................................................................... 26License Models ............................................................................................................................................................. 26Role of EDA Companies in the Overall Semiconductor Design Service Industry ...................................................................... 26
Chapter 4 - Hardware/Board Design Market 27Market Snapshot ........................................................................................................................................................... 27Market Detail ................................................................................................................................................................ 27Business Model Evolution ............................................................................................................................................... 27Hardware/Board Design Ecosystem of the Industry ............................................................................................................ 28Market Drivers ............................................................................................................................................................... 28Market Challenges ......................................................................................................................................................... 29Future Trends ................................................................................................................................................................ 29Quantitative Analysis ...................................................................................................................................................... 29 Total Number of Design Projects .............................................................................................................................. 29 Number of Design Projects by Number of Layers/Complexity ....................................................................................... 30 Number of Design Projects by Frequency .................................................................................................................. 30 Revenue and Forecast of the Market ......................................................................................................................... 30 Existing and Forecasted Manpower by Different Demographics .................................................................................... 31
Engineering Man-month Rate for Hardware/Board Design ........................................................................................... 32 Percentage of Board Design by Industry Segments ..................................................................................................... 32
Chapter 5 - Embedded Software Industry in India 34Market Snapshot ........................................................................................................................................................... 34Market Structure ............................................................................................................................................................ 34Indian Embedded Software Industry ................................................................................................................................ 34Market Drivers ............................................................................................................................................................... 35Market Challenges ......................................................................................................................................................... 35Future Trends ................................................................................................................................................................ 36Quantitative Analysis ...................................................................................................................................................... 36 Market Forecast by Revenues for Embedded Software ................................................................................................ 36 Market Forecast by Workforce for Embedded Software ................................................................................................ 37 Market Forecast by Engineering Man-month Rate for Embedded Software ..................................................................... 37 Embedded Technical Workforce Breakup by Educational Qualification and Gender Ratio ................................................. 38 Headcount Break Up by Embedded Software Activities ............................................................................................... 38
Chapter 6 - Embedded Design Services Market Ecosystem - Moving Up the Value Chain 39Market Snapshot ........................................................................................................................................................... 39Current Industry Practices ............................................................................................................................................... 40Disruption in the Ecosystem ............................................................................................................................................ 40Impact on the Embedded Design Services Industry ............................................................................................................ 41
India Semiconductor and Embedded Design Market Ver. 2.0 41 Manpower............................................................................................................................................................. 42 Moving up in the Value Chain .................................................................................................................................. 42 Cost Structure ........................................................................................................................................................ 42
Introduction to Definitions 43Overall Market – Assumptions and Detailed Definitions ...................................................................................................... 43 Captive unit ........................................................................................................................................................... 43 Non-captive unit .................................................................................................................................................... 43 Revenue ............................................................................................................................................................... 43 Markets ................................................................................................................................................................ 43 Service ................................................................................................................................................................. 43 Technology ............................................................................................................................................................ 43 Average Engineering Man-month Rate ...................................................................................................................... 43VLSI – Assumptions and Detailed Definitions .................................................................................................................... 43 VLSI Revenue ........................................................................................................................................................ 43 VLSI Services......................................................................................................................................................... 44 Design Projects ...................................................................................................................................................... 44Hardware/Board -Assumptions and Detailed Definitions ..................................................................................................... 44 Revenue ............................................................................................................................................................... 44 Markets ................................................................................................................................................................ 44 Services ................................................................................................................................................................ 44 Technology ............................................................................................................................................................ 44Embedded Software -Assumptions and Detailed Definitions ................................................................................................ 44 Revenue ............................................................................................................................................................... 44 Markets ................................................................................................................................................................ 44 Services ................................................................................................................................................................ 44
Page

12
IndIa SemIConduCtor and embedded deSIgn ServICe InduStry (2007-2010)market, teChnology and eCoSyStem analySIS
I S a - I d C r e p o r t , 2 0 0 8
Chapter 1
total design marketIntroduction
This study offers a review of the India semiconductor design services market for 2007 and market forecast up to 2010. It covers the market performance of the following services in overall semiconductor design services.
VLSI Design �
Hardware/ Board Design �
Embedded Software Development �
This study presents market size for different design services covering both captive and non-captive.
In addition to the overall market view, this study brings out the trends, key drivers and inhibitors for above mentioned design services and also provides details of the future outlook for this market in India.
Summary of Findings
Indian Design Services Market 2007-2010The total design services market in India was estimated at US$ 6.08 billion in 2007 and is expected to grow at compounded annual growth rate (CAGR) of 21.7% to become US$ 10.96 billion by 2010. The major contributor to the revenues is embedded software development followed by VLSI design and hardware/board design. Ramping up of the engineering human resource in existing setup of both captive and non-captive, with few more captives setting up base in India, is expected to drive the revenues for the total design services market in India.
Rev
enue
(US
$Bn)
Total (US $Bn) 6.08 7.37 8.97 10.96
2007 2008 2009 20100
2
4
6
8
10
12
FIGURE 1
Revenues for VLSI, Board Design and Embedded Software, 2007-2010(US $Bn)
Source: ISA -IDC, 2008
CAGR21.7%
C h a p t e r 1 - t o t a l d e S I g n m a r k e t
list of tables1 Revenues Split for VLSI, Board Design and Embedded Software .................................................................................. 152 Total No. of VLSI Design Projects.............................................................................................................................. 203 Percentage of Design Projects by Gate Counts ............................................................................................................ 204 Percentage of VLSI Design Projects by Technology ...................................................................................................... 215A Percentage Breakup of VLSI Design Projects by Process Technology- Digital ................................................................... 215B Percentage Breakup of VLSI Design Projects by Process Technology- Analog .................................................................. 215C Percentage Breakup of VLSI Design Projects by Process Technology- Mixed ................................................................... 226 VLSI Projects Breakup by the Type of Design ............................................................................................................. 227 VLSI Design Projects Split According to the Verticals ................................................................................................... 248 Total No. of Hardware/Board Design Projects ............................................................................................................. 309 Hardware/Board Design Projects Break-up by Layer of Complexity .............................................................................. 3010 Hardware/Board Design Projects Break-up by Frequency ............................................................................................ 3011 Hardware/Board Design Projects Split According to the Verticals .................................................................................. 3312 Embedded Software Activities Defined ...................................................................................................................... 3513 Headcount Break-up by Embedded Software Activities ............................................................................................... 38
list of Figures1 Revenues for VLSI, Board Design and Embedded Software, 2007-2010 (US $Bn) ........................................................ 132 Total Workforce Size for VLSI, Board Design and Embedded Software, 2007-2010 ........................................................ 143 Average Engineering Man-month Rate for VLSI, Board Design and Embedded Software, 2007-2010 ............................... 144 Revenue Share for VLSI, Board Design and Embedded Software, 2007 ....................................................................... 155 Workforce Size for VLSI, Board Design and Embedded Software, 2007 ........................................................................ 156 Engineering Workforce Break-up by Educational Qualification, 2007 ............................................................................ 167 Engineering Workforce Break-up by Gender Ratio, 2007 ............................................................................................. 168 Evolution of the Indian VLSI Design Services Industry ................................................................................................. 179 VLSI Design Ecosystem ........................................................................................................................................... 1810 Market Forecast by Revenues for VLSI Design ............................................................................................................ 2211 Market Forecast by Total Workforce for VLSI Design .................................................................................................... 2312 Market Forecast by Engineering Man-month Rate for the VLSI Design ........................................................................... 2313 VLSI Engineering Workforce Break-up by Educational Qualification, 2007 ..................................................................... 2414 VLSI Engineering Workforce Break-up by Gender Ratio, 2007 ..................................................................................... 2415 Components and Activities of EDA Software in Semiconductor Value Chain ................................................................... 2516 Hardware/Board Design Value Chain ........................................................................................................................ 2717 Lifecycle of Hardware/Board Design Development ..................................................................................................... 2818 Market Forecast by Revenues for Hardware/Board Design ........................................................................................... 3119 Market Forecast by Total Workforce for the Hardware/Board Design .............................................................................. 3120 Hardware/Board Engineering Workforce Break-up by Educational Qualification 2007 ..................................................... 3221 Hardware/Board Engineering Workforce Break-up by Gender Ratio, 2007 ..................................................................... 3222 Market Forecast by Engineering Man-month Rate for the Hardware/Board Design .......................................................... 3223 Activities in the Embedded Software Stack ................................................................................................................ 3524 Market Forecast by Revenues for Embedded Software ................................................................................................ 3625 Market Forecast by Total Workforce for the Embedded Software ................................................................................... 3726 Market Forecast by Engineering Man-month Rate for the Embedded Software ............................................................... 3727 Embedded Software Engineering Workforce Break-up by Educational Qualification, 2007 ............................................... 3828 Embedded Software Engineering Workforce Break-up by Gender Ratio, 2007 ............................................................... 3829 Ecosystem Entities and Their Linkages between Each Other ........................................................................................ 3930 Scenario of Re-alignment in the Overall Business Model ............................................................................................ 40
list of appendices1. Appendix I: List of Acronyms2. Appendix II: Research Methodology3. Appendix III: Bibliography
14
IndIa SemIConduCtor and embedded deSIgn ServICe InduStry (2007-2010)market, teChnology and eCoSyStem analySIS
I S a - I d C r e p o r t , 2 0 0 8
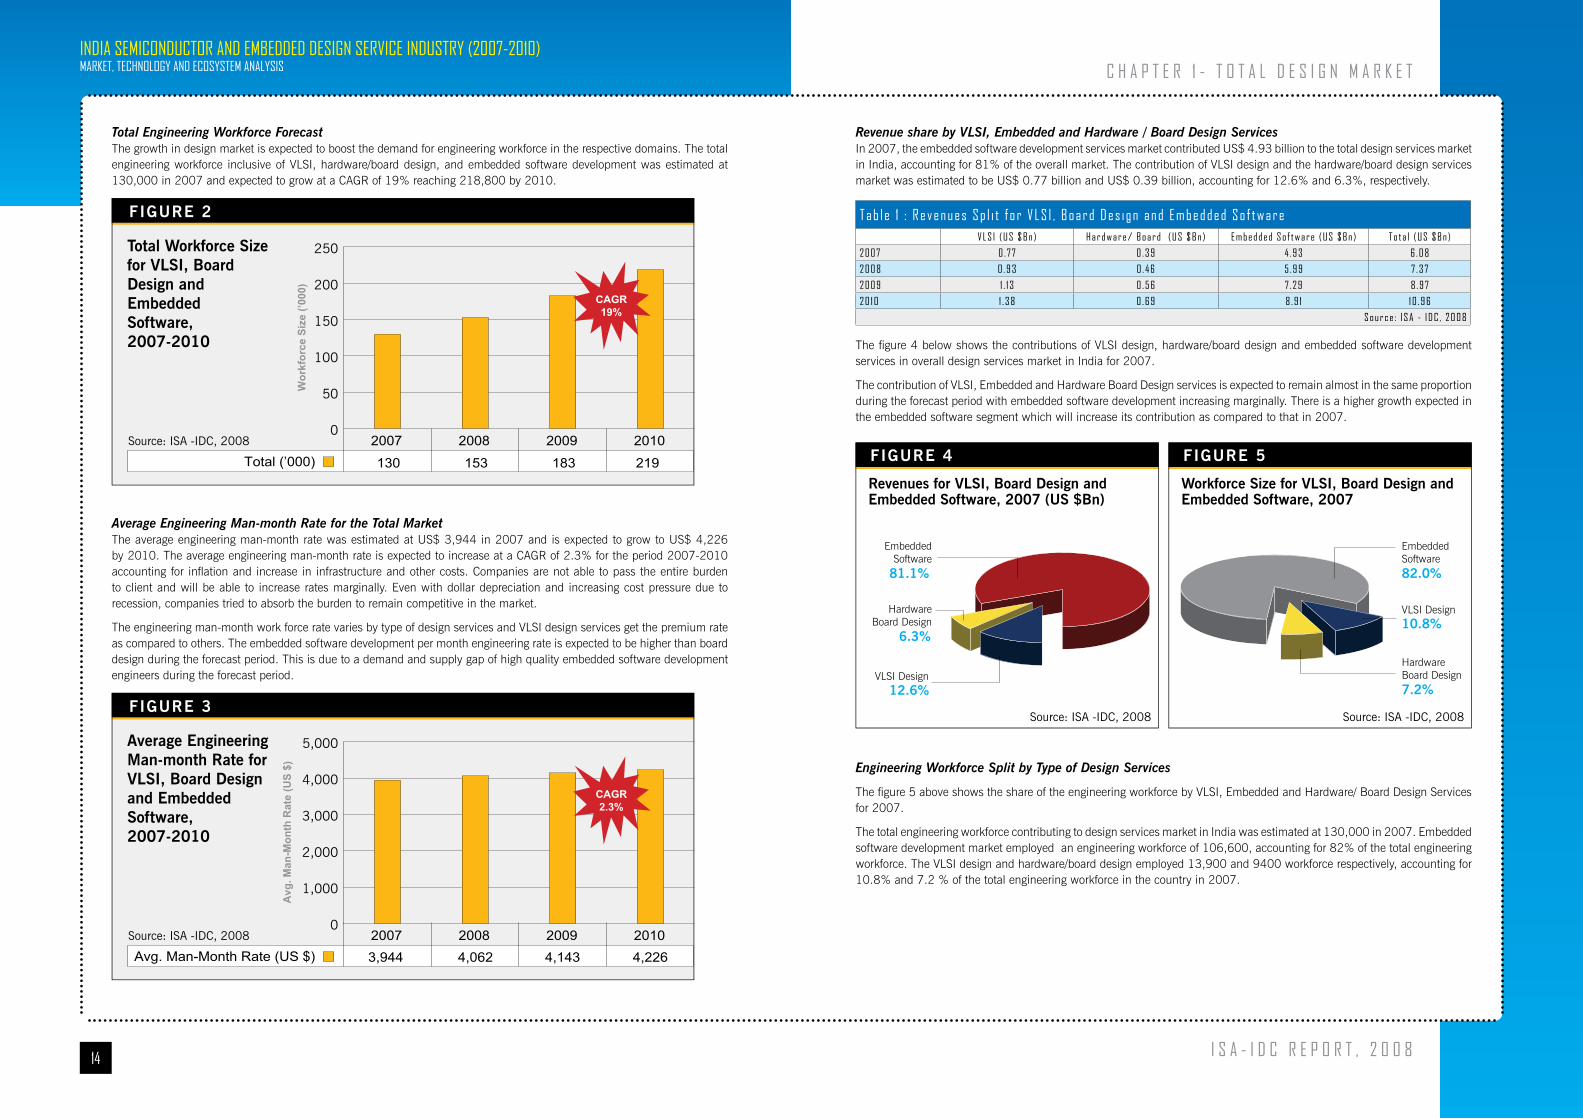
Revenue share by VLSI, Embedded and Hardware / Board Design Services In 2007, the embedded software development services market contributed US$ 4.93 billion to the total design services market in India, accounting for 81% of the overall market. The contribution of VLSI design and the hardware/board design services market was estimated to be US$ 0.77 billion and US$ 0.39 billion, accounting for 12.6% and 6.3%, respectively.
t a b l e 1 : r e v e n u e s S p l i t f o r v l S I , b o a r d d e s i g n a n d e m b e d d e d S o f t w a r ev l S I ( u S $ b n ) h a r d w a r e / b o a r d ( u S $ b n ) e m b e d d e d S o f t w a r e ( u S $ b n ) t o t a l ( u S $ b n )
2 0 0 7 0 . 7 7 0 . 3 9 4 . 9 3 6 . 0 8
2 0 0 8 0 . 9 3 0 . 4 6 5 . 9 9 7 . 3 7
2 0 0 9 1 . 1 3 0 . 5 6 7 . 2 9 8 . 9 7
2 0 1 0 1 . 3 8 0 . 6 9 8 . 9 1 1 0 . 9 6
S o u r c e : I S a - I d C , 2 0 0 8
The figure 4 below shows the contributions of VLSI design, hardware/board design and embedded software development services in overall design services market in India for 2007.
The contribution of VLSI, Embedded and Hardware Board Design services is expected to remain almost in the same proportion during the forecast period with embedded software development increasing marginally. There is a higher growth expected in the embedded software segment which will increase its contribution as compared to that in 2007.
Engineering Workforce Split by Type of Design Services
The figure 5 above shows the share of the engineering workforce by VLSI, Embedded and Hardware/ Board Design Services for 2007.
The total engineering workforce contributing to design services market in India was estimated at 130,000 in 2007. Embedded software development market employed an engineering workforce of 106,600, accounting for 82% of the total engineering workforce. The VLSI design and hardware/board design employed 13,900 and 9400 workforce respectively, accounting for 10.8% and 7.2 % of the total engineering workforce in the country in 2007.
C h a p t e r 1 - t o t a l d e S I g n m a r k e t
FIGURE 4
Revenues for VLSI, Board Design and Embedded Software, 2007 (US $Bn)
Source: ISA -IDC, 2008
EmbeddedSoftware
81.1%
HardwareBoard Design
6.3%
VLSI Design 12.6%
FIGURE 5
Workforce Size for VLSI, Board Design and Embedded Software, 2007
Source: ISA -IDC, 2008
EmbeddedSoftware82.0%
HardwareBoard Design7.2%
VLSI Design 10.8%
Total Engineering Workforce ForecastThe growth in design market is expected to boost the demand for engineering workforce in the respective domains. The total engineering workforce inclusive of VLSI, hardware/board design, and embedded software development was estimated at 130,000 in 2007 and expected to grow at a CAGR of 19% reaching 218,800 by 2010.
Wor
kfor
ce S
ize
(’000
)
Total (’000) 130 153 183 219
2007 2008 2009 20100
50
100
150
200
250
FIGURE 2
Total Workforce Size for VLSI, Board Design and Embedded Software, 2007-2010
Source: ISA -IDC, 2008
CAGR19%
Average Engineering Man-month Rate for the Total MarketThe average engineering man-month rate was estimated at US$ 3,944 in 2007 and is expected to grow to US$ 4,226 by 2010. The average engineering man-month rate is expected to increase at a CAGR of 2.3% for the period 2007-2010 accounting for inflation and increase in infrastructure and other costs. Companies are not able to pass the entire burden to client and will be able to increase rates marginally. Even with dollar depreciation and increasing cost pressure due to recession, companies tried to absorb the burden to remain competitive in the market.
The engineering man-month work force rate varies by type of design services and VLSI design services get the premium rate as compared to others. The embedded software development per month engineering rate is expected to be higher than board design during the forecast period. This is due to a demand and supply gap of high quality embedded software development engineers during the forecast period.
Avg
. Man
-Mon
th R
ate
(US
$)
Avg. Man-Month Rate (US $)2007 2008 2009 2010
0
1,000
2,000
3,000
4,000
5,000
FIGURE 3
Average Engineering Man-month Rate for VLSI, Board Design and Embedded Software, 2007-2010
Source: ISA -IDC, 2008
CAGR2.3%
3,944 4,062 4,143 4,226
16
IndIa SemIConduCtor and embedded deSIgn ServICe InduStry (2007-2010)market, teChnology and eCoSyStem analySIS
I S a - I d C r e p o r t , 2 0 0 8
Chapter 2
vlSI design marketMarket Snapshot
The total revenue from VLSI design services market in India was estimated at US$ 0.76 billion in 2007 and is expected to grow to US$ 1.38 billion by 2010, charting a compound annual growth rate of 21.7%. The worldwide semiconductor market has grown at a conservative y-o-y growth rate of 4.8% in 2007, compared to 8.8% in 2006. Despite the global slow down, the Indian embedded design services market grew at 20% y-o-y in 2007. The worldwide semiconductor market is to grow at 8% in 2008 based on the current scenario, while the Indian embedded design services market is estimated to grow at 21% in 2008. The market witnessed mergers and acquisitions in 2007 and the market will consolidate further. Industries like communication equipment, wireless and networking equipments dominate the growth of VLSI industry as of now, but in future, consumer electronics and portable/wireless technologies are expected to fuel further growth.
Market Details
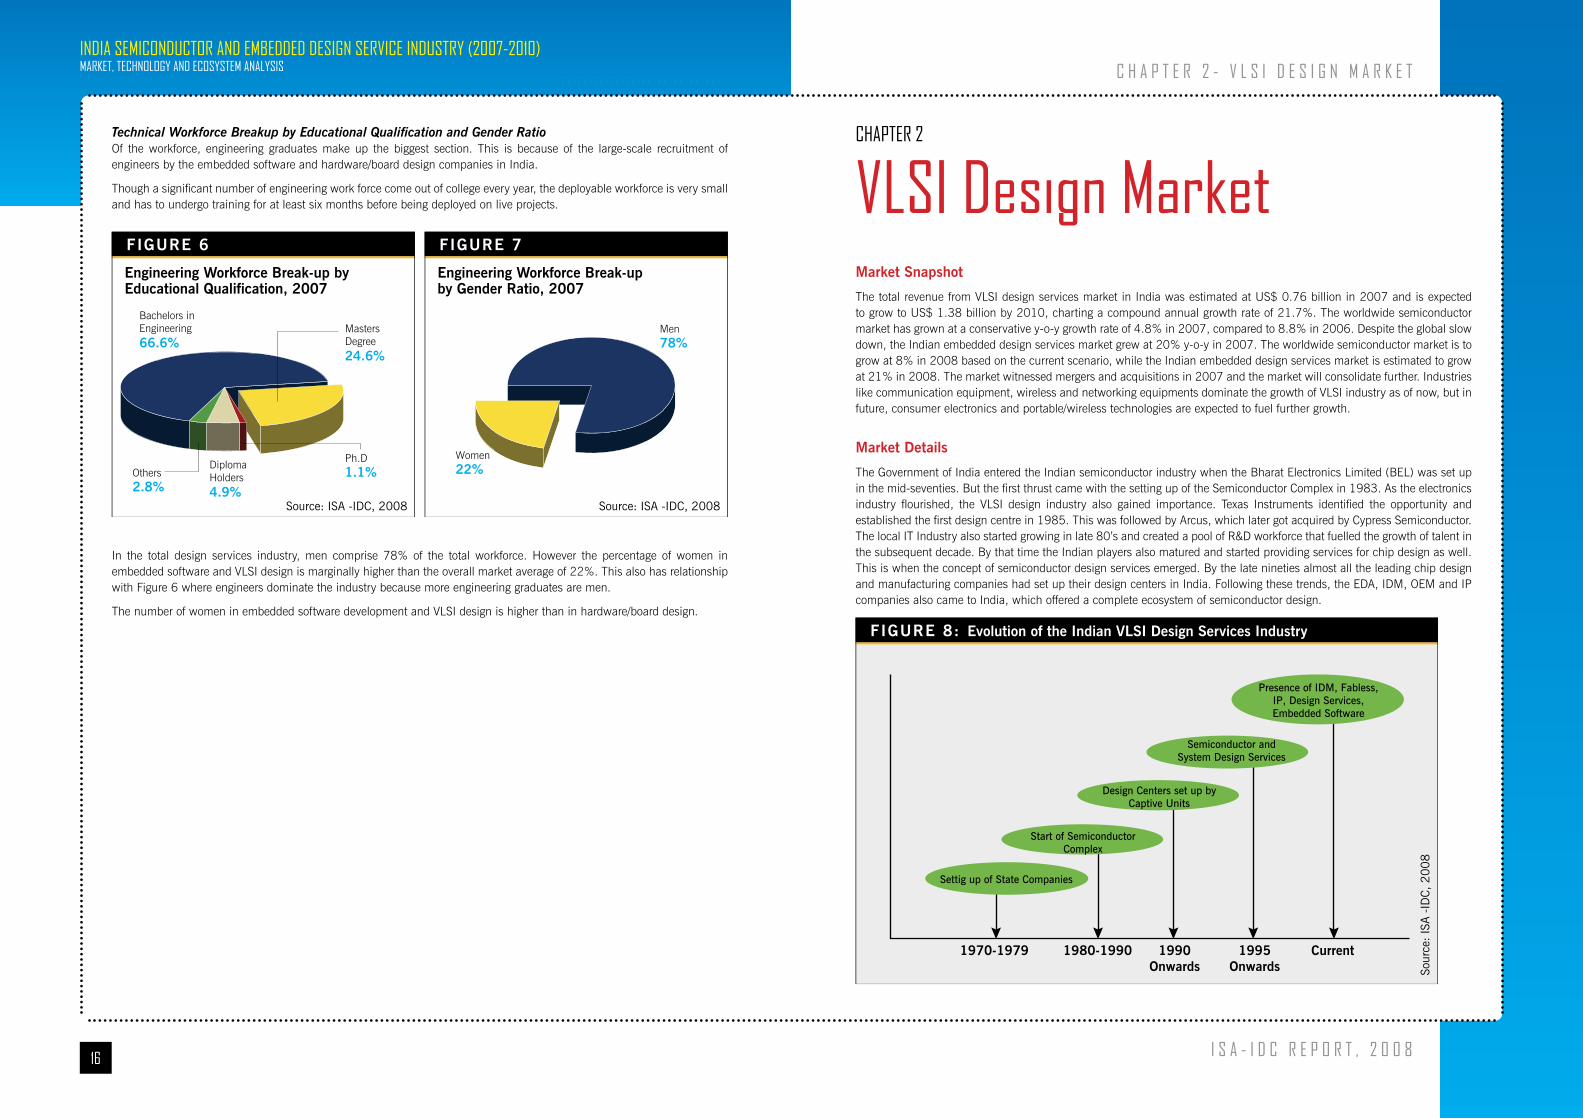
The Government of India entered the Indian semiconductor industry when the Bharat Electronics Limited (BEL) was set up in the mid-seventies. But the first thrust came with the setting up of the Semiconductor Complex in 1983. As the electronics industry flourished, the VLSI design industry also gained importance. Texas Instruments identified the opportunity and established the first design centre in 1985. This was followed by Arcus, which later got acquired by Cypress Semiconductor. The local IT Industry also started growing in late 80’s and created a pool of R&D workforce that fuelled the growth of talent in the subsequent decade. By that time the Indian players also matured and started providing services for chip design as well. This is when the concept of semiconductor design services emerged. By the late nineties almost all the leading chip design and manufacturing companies had set up their design centers in India. Following these trends, the EDA, IDM, OEM and IP companies also came to India, which offered a complete ecosystem of semiconductor design.
FIGURE 8: Evolution of the Indian VLSI Design Services Industry
Sour
ce:
ISA -
IDC
, 2008
Presence of IDM, Fabless,IP, Design Services,Embedded Software
Semiconductor andSystem Design Services
Design Centers set up byCaptive Units
Start of SemiconductorComplex
Settig up of State Companies
1970-1979 1980-1990 1990Onwards
1995Onwards
Current
C h a p t e r 2 - v l S I d e S I g n m a r k e t
Technical Workforce Breakup by Educational Qualification and Gender Ratio Of the workforce, engineering graduates make up the biggest section. This is because of the large-scale recruitment of engineers by the embedded software and hardware/board design companies in India.
Though a significant number of engineering work force come out of college every year, the deployable workforce is very small and has to undergo training for at least six months before being deployed on live projects.
In the total design services industry, men comprise 78% of the total workforce. However the percentage of women in embedded software and VLSI design is marginally higher than the overall market average of 22%. This also has relationship with Figure 6 where engineers dominate the industry because more engineering graduates are men.
The number of women in embedded software development and VLSI design is higher than in hardware/board design.
FIGURE 6
Engineering Workforce Break-up by Educational Qualification, 2007
Source: ISA -IDC, 2008
MastersDegree24.6%
Bachelors inEngineering66.6%
DiplomaHolders4.9%
Ph.D1.1%Others
2.8%
FIGURE 7
Engineering Workforce Break-up by Gender Ratio, 2007
Source: ISA -IDC, 2008
Men78%
Women22%
18
IndIa SemIConduCtor and embedded deSIgn ServICe InduStry (2007-2010)market, teChnology and eCoSyStem analySIS
I S a - I d C r e p o r t , 2 0 0 8
Indian design services companies have already proved their capability by designing complex chips at 65 nm process �technologies. So they are getting more design contracts from OEMs, chip manufacturers and design services companies from around the world.
Complete design activities, starting from specification to tape outs, are increasingly being done in India. India has �gradually started moving up the value chain from a destination of cost arbitrage.
The captives that started on a small note have now ramped up. The captives that have matured in terms of headcount �numbers have started increasing outsourcing to Indian services companies, thus increasing headcount.
2. Availability of TalentThe availability of ready talent is another major reason why companies are setting up their design centers. India has �thousands of English-speaking engineers graduating every year who have the potential to join this industry.
3. Cost CompetitivenessEven though salaries and overall infrastructure setup costs in India are increasing, there is still a significant cost �differential, around 30-40%, as compared to USA and Europe, which are the parent locations for a number of large VLSI companies. There is a definite move towards cost management amongst the design companies in India in order to maintain the differential.
4. Geographical ExpansionSeveral states in India have started offering fiscal and non-fiscal incentives to semiconductor companies. This will attract �companies in the long run.
Companies from other regions such as Japan have started establishing their centers here either through third-party �companies or captive offshore centers.
5. Increasing Demand for Consumer Products in India.India’s domestic demand is increasing and will indirectly contribute to the growth of the VLSI design service industry �in India
Market Challenges
1. Lack of Readily Deployable TalentIndia has good English-speaking fresh engineering workforce graduating every year from colleges. However their skill set �level is low and require considerable training and skill development before they can actually be deployed on live projects. Also with a job boom retention is a challenge.
2. Appreciating Rupee and Rising Cost StructuresThe Rupee is appreciating, putting pressure on bottomlines of companies. However firms have been able to absorb the �cost so far without increasing the billing rates. The rising infrastructure and salary costs are putting even more pressure on companies.
3. Need to Evolve Towards Complete System Knowledge.Indian companies are strong in product design but have not made significant advances in complete system design and �development
4. Availability of Design Services Support Facilities in IndiaAvailability of Testing and Validation facilities: There is a shortage of testing and validation facilities in India. Government �has to take steps to create a conducive environment for setting up of the manufacturing and related infrastructure.
Some other challenges for product companies are high customs and excise duty on equipment import and delay in �custom clearance.
Future Trends
India is continuously moving up the value chain with end-to-end work from spec to tape-out, increasing from the country. However, it is still modular design that dominates the Indian design scenario.
Normally when a chip is required for a new application with a new set of functions or increased functionality for older applications, considerable effort is required to accomplish the design IP.
C h a p t e r 2 - v l S I d e S I g n m a r k e t
Types of Contracts The billing contracts vary from per-person-per-hour, project-based, transaction-based or on a TNM (time and material) based contracts. The rates are either on an hourly or monthly basis, though most companies prefer the latter. These rates depend on the seniority of the engineers involved in a project and vary between US$ 3520 and US$ 6160 per engineering man-month.
In bigger projects, an FFP (firm and fixed price) contract is also used. An FFP contract provides for a price that is not subject to any adjustment and is decided on the basis of the contractor’s cost experience in performing the contract. Total cost is taken into contract, which is not segregated on the basis of the number of engineers or coders. This contract type places the maximum risk and responsibility on the service provider. It provides the maximum incentive to the service provider if service provider is able to control costs and perform effectively. The administrative burden upon the contracting parties is also minimal.
Geographies Served by Indian Semiconductor CompaniesTill date almost 70% of the business comes from USA while Europe is the next largest contributor. Recently, the Indian design services companies managed to get a good number of contracts from Japan also. Though the Japanese market has immense potential, it comes with challenges of language and managing relationship. Besides, most of the Indian companies do not have a strong presence in Japan. In the long run Japan has the potential to be one of the major customers of Indian companies.
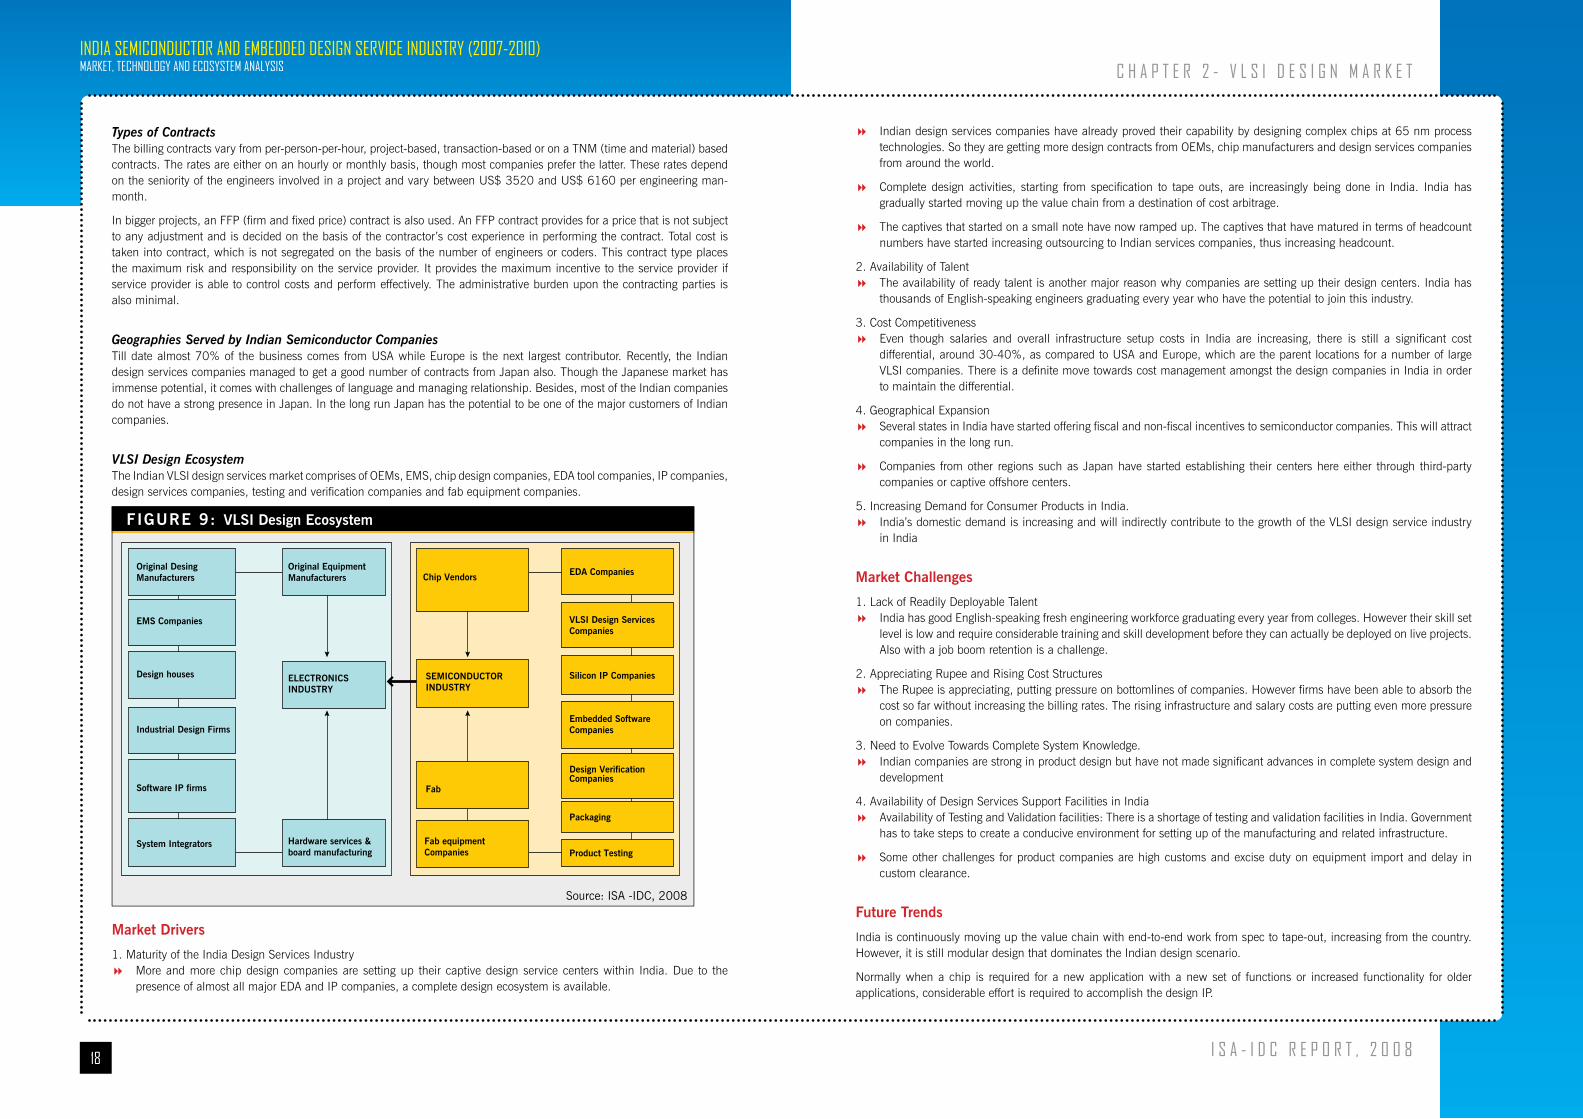
VLSI Design EcosystemThe Indian VLSI design services market comprises of OEMs, EMS, chip design companies, EDA tool companies, IP companies, design services companies, testing and verification companies and fab equipment companies.
Market Drivers
1. Maturity of the India Design Services IndustryMore and more chip design companies are setting up their captive design service centers within India. Due to the �presence of almost all major EDA and IP companies, a complete design ecosystem is available.
FIGURE 9: VLSI Design Ecosystem
Source: ISA -IDC, 2008
Original DesingManufacturers
EMS Companies
Design houses
Industrial Design Firms
Software IP firms
System Integrators Hardware services &board manufacturing
Original EquipmentManufacturers Chip Vendors
Fab
EDA Companies
VLSI Design Services Companies
Silicon IP Companies
Embedded SoftwareCompanies
Design VerificationCompanies
Packaging
Product TestingFab equipment Companies
ELECTRONICSINDUSTRY
SEMICONDUCTORINDUSTRY

20
IndIa SemIConduCtor and embedded deSIgn ServICe InduStry (2007-2010)market, teChnology and eCoSyStem analySIS
I S a - I d C r e p o r t , 2 0 0 8
into ASICs, companies are moving towards a mixed signal technology. In India there is a demand for trained talent to work on analog and mixed signal designs. If this shortage of talent is addressed, India can emerge as a major powerhouse in mixed signal design. There are a few large captive and non-captive units that have the capabilities for handling mixed and analog designs and will increase their volume in the future.
t a b l e 4 : p e r c e n t a g e o f v l S I d e s i g n p r o j e c t s b y t e c h n o l o g yd i g i t a l a n a l o g m i x e d
2 0 0 7 7 2 % 1 6 % 1 2 %
2 0 0 8 6 9 % 1 7 % 1 4 %
2 0 0 9 6 5 % 1 9 % 1 6 %
2 0 1 0 6 3 % 2 0 % 1 7 %
S o u r c e : I S a - I d C , 2 0 0 8
In India 83% of the chips were designed in 90 nm and 130 nm. Some companies have designed chips at 45 nm process technology and some are in the process of creating libraries. For any technology upgrade, cost is a major factor. The 90/65 nm process technology is successfully meeting the geometries and the cost target. For analog and mixed signal it ranges largely between 130 nm and 180 nm. Some captive companies will migrate directly to 45 nm; these however, will be very few in number.
t a b l e 5 a : p e r c e n t a g e b r e a k u p o f v l S I d e s i g n p r o j e c t s b y p r o c e s s t e c h n o l o g y - d i g i t a l2 0 0 7 2 0 0 8 2 0 0 9 2 0 1 0
a b o v e 1 . 5
0 . 5 t o 1 . 5
0 . 3 5
0 . 2 5 2 . 0 % 1 . 0 % 1 . 0 % 0 . 6 %
0 . 1 8 6 . 0 % 4 . 0 % 3 . 0 % 2 . 2 %
0 . 1 3 3 1 . 0 % 1 3 . 0 % 1 1 . 0 % 9 . 0 %
0 . 0 9 5 2 . 0 % 5 7 . 0 % 4 8 . 0 % 4 0 . 0 %
0 . 0 6 7 . 0 % 1 6 . 0 % 2 2 . 0 % 2 7 . 0 %
0 . 0 4 5 2 . 0 % 9 . 0 % 1 5 . 0 % 2 1 . 2 %
b e l o w 0 . 0 4 5
S o u r c e : I S a - I d C , 2 0 0 8
t a b l e 5 b : p e r c e n t a g e b r e a k u p o f v l S I d e s i g n p r o j e c t s b y p r o c e s s t e c h n o l o g y - a n a l o g2 0 0 7 2 0 0 8 2 0 0 9 2 0 1 0
a b o v e 1 . 5
0 . 5 t o 1 . 5
0 . 3 5
0 . 2 5
0 . 1 8 4 6 . 0 % 4 2 . 0 % 3 8 . 0 % 3 5 . 0 %
0 . 1 3 3 4 . 0 % 3 5 . 0 % 3 3 . 0 % 3 1 . 0 %
0 . 0 9 1 8 . 0 % 2 0 . 7 % 2 4 . 0 % 2 7 . 0 %
0 . 0 6 2 . 0 % 2 . 3 % 5 . 0 % 7 . 0 %
0 . 0 4 5
b e l o w 0 . 0 4 5
S o u r c e : I S a - I d C , 2 0 0 8
t a b l e 5 C : p e r c e n t a g e b r e a k u p o f v l S I d e s i g n p r o j e c t s b y p r o c e s s t e c h n o l o g y - m i x e d2 0 0 7 2 0 0 8 2 0 0 9 2 0 1 0
a b o v e 1 . 5
0 . 5 t o 1 . 5
0 . 3 5
0 . 2 5
0 . 1 8 4 8 . 0 % 4 4 . 0 % 4 2 . 0 % 4 1 . 0 %
C h a p t e r 2 - v l S I d e S I g n m a r k e t
Even if a new chip has components having the same general types of functionality as the existing multiprocessor chips, the number of components may change. As an example, for a given application, a multiprocessor chip may need considerable RAM (random access memory) and minimal cache or floating-point math capability while in another application, the cache or floating point math capability may have to be expanded with minimal RAM. In other applications, the functionality may primarily be directed to media applications.
The market will mature towards a functionality-oriented process where different reusable components can be assembled or orchestrated depending on the need. It would call for standard design rules to initially create functional reusable components of a chip whereby these usable components can be use in a simple add or subtract process to create new chips. Such standardization would reduce cycle time.
In the near future, some of the VLSI design companies will be able to scale up to maintain the in-house IP portfolio necessary to compete effectively. The third-party market provides IP to multiple customers, thereby sharing the development and maintenance costs across these customers. Although licensing negotiations and quality control can be time-consuming, the third-party market can usually offer a faster time-to-market for mature IP products than in-house development. The design reuse methodology will remain fundamental to System-on-a-Chip (SoC) design. By boosting the productivity of design teams, IP reuse fuels, one of the main trends in the chip industry. IP reuse will be crucial if chipmakers are to achieve the large-gate-count chips required by future electronic products. The reuse methodology is evolving to higher levels of abstraction, to the level of subsystems and the entire chip. Today, in most of the design houses, IP development is perceived as a marketing tool rather than a revenue generator.
In post-silicon stage, testing is important and not many testing facilities are available. As fabs are not there in India, this activity of design validation and testing has not flourished. With presence of testing and validation ecosystem in India, the cycle time can be reduced, which will lead to further growth in the design service houses.
Quantitative Analysis
Total Number of VLSI Design ProjectsApproximately 1826 VLSI Design projects were executed in 2007 both by captives and non-captive units.
t a b l e 2 : t o t a l n o . o f v l S I d e s i g n p r o j e c t s2 0 0 7 2 0 0 8 2 0 0 9 2 0 1 0
C a p t i v e 1 0 2 7 1 3 2 4 1 6 1 3 1 9 2 0
n o n C a p t i v e 7 9 9 9 5 9 1 2 1 7 1 5 0 9
t o t a l 1 8 2 6 2 2 8 3 2 8 3 1 3 4 2 9
S o u r c e : I S a - I d C , 2 0 0 8
The number of design projects increased significantly for captives. The increase in portable consumer wireless products industry is pushing new designs. ISA & IDC sees the trend continuing and the market growing at a CAGR of 23.4% in terms of the number of design projects.
Total Number of Design Projects by Gate CountAs a result of taking up more and more SoC design, the gate count in designs has increased and ranges from 5 to 10 million today. This increase in gate count has further increased the functionalities of the chip and the mainstream process technology, taking it from 180 nm to 130 nm and 90 nm respectively. In general, efforts are generally made to increase gate counts on a chip to minimize linkages, as more the linkages more are the chances of failure.
t a b l e 3 : p e r c e n t a g e o f d e s i g n p r o j e c t s b y g a t e C o u n t su p t o 1 m 1 m - 1 0 m 1 0 m - 2 0 m 2 0 m - 3 0 m 3 0 m - 5 0 m > 5 0 m
2 0 0 7 2 1 % 6 1 % 1 2 % 3 % 2 % 1 %
S o u r c e : I S a - I d C , 2 0 0 8
VLSI Design Projects Forecast by TechnologyCompanies in India are largely involved in digital design, but the industry is expected to shift towards the mixed signal technology in a few years. The interfacing devices till date are analog. By incorporating more and more analog components
22
IndIa SemIConduCtor and embedded deSIgn ServICe InduStry (2007-2010)market, teChnology and eCoSyStem analySIS
I S a - I d C r e p o r t , 2 0 0 8
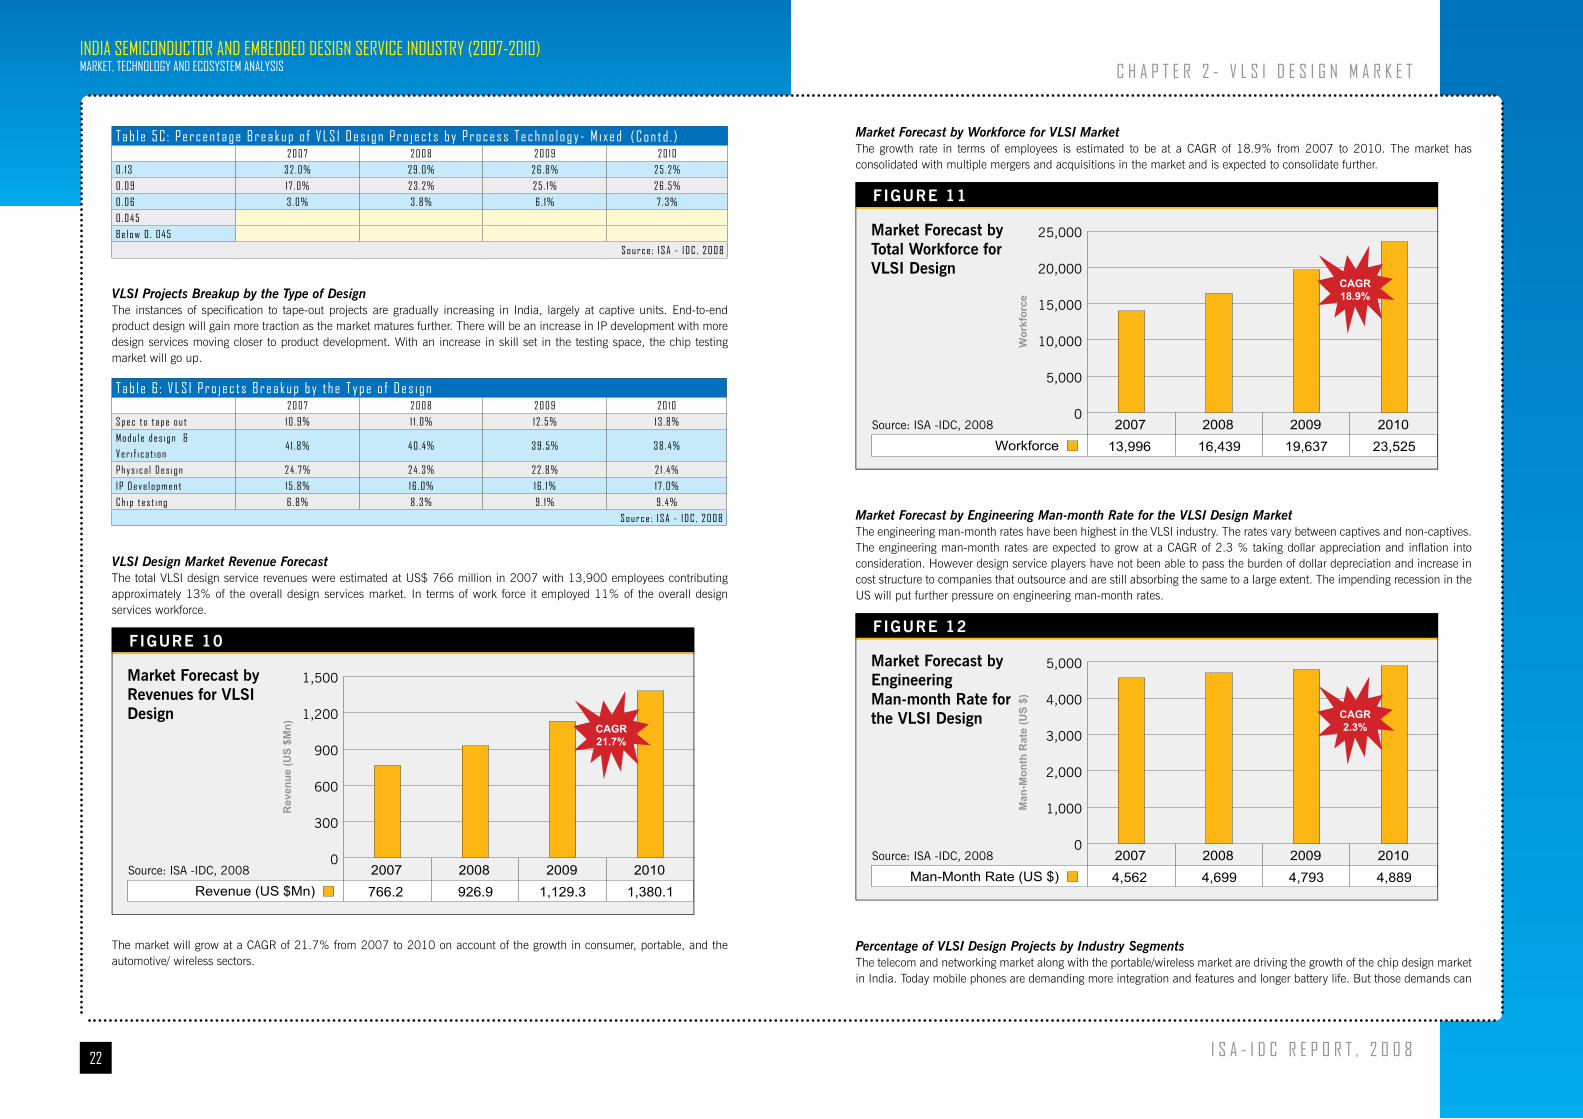
Market Forecast by Workforce for VLSI MarketThe growth rate in terms of employees is estimated to be at a CAGR of 18.9% from 2007 to 2010. The market has consolidated with multiple mergers and acquisitions in the market and is expected to consolidate further.
Wor
kfor
ce
Workforce2007 2008 2009 2010
0
5,000
10,000
15,000
20,000
25,000
FIGURE 11
Market Forecast by Total Workforce for VLSI Design
Source: ISA -IDC, 2008
CAGR18.9%
13,996 16,439 19,637 23,525
Market Forecast by Engineering Man-month Rate for the VLSI Design MarketThe engineering man-month rates have been highest in the VLSI industry. The rates vary between captives and non-captives. The engineering man-month rates are expected to grow at a CAGR of 2.3 % taking dollar appreciation and inflation into consideration. However design service players have not been able to pass the burden of dollar depreciation and increase in cost structure to companies that outsource and are still absorbing the same to a large extent. The impending recession in the US will put further pressure on engineering man-month rates.
Man
-Mon
th R
ate
(US
$)
Man-Month Rate (US $)2007 2008 2009 2010
0
1,000
2,000
3,000
4,000
5,000
FIGURE 12
Market Forecast by Engineering Man-month Rate for the VLSI Design
Source: ISA -IDC, 2008
CAGR2.3%
4,562 4,699 4,793 4,889
Percentage of VLSI Design Projects by Industry SegmentsThe telecom and networking market along with the portable/wireless market are driving the growth of the chip design market in India. Today mobile phones are demanding more integration and features and longer battery life. But those demands can
C h a p t e r 2 - v l S I d e S I g n m a r k e t
t a b l e 5 C : p e r c e n t a g e b r e a k u p o f v l S I d e s i g n p r o j e c t s b y p r o c e s s t e c h n o l o g y - m i x e d2 0 0 7 2 0 0 8 2 0 0 9 2 0 1 0
0 . 1 3 3 2 . 0 % 2 9 . 0 % 2 6 . 8 % 2 5 . 2 %
0 . 0 9 1 7 . 0 % 2 3 . 2 % 2 5 . 1 % 2 6 . 5 %
0 . 0 6 3 . 0 % 3 . 8 % 6 . 1 % 7 . 3 %
0 . 0 4 5
b e l o w 0 . 0 4 5
S o u r c e : I S a - I d C , 2 0 0 8
VLSI Projects Breakup by the Type of DesignThe instances of specification to tape-out projects are gradually increasing in India, largely at captive units. End-to-end product design will gain more traction as the market matures further. There will be an increase in IP development with more design services moving closer to product development. With an increase in skill set in the testing space, the chip testing market will go up.
t a b l e 6 : v l S I p r o j e c t s b r e a k u p b y t h e t y p e o f d e s i g n2 0 0 7 2 0 0 8 2 0 0 9 2 0 1 0
S p e c t o t a p e o u t 1 0 . 9 % 1 1 . 0 % 1 2 . 5 % 1 3 . 8 %
m o d u l e d e s i g n &
v e r i f i c a t i o n4 1 . 8 % 4 0 . 4 % 3 9 . 5 % 3 8 . 4 %
p h y s i c a l d e s i g n 2 4 . 7 % 2 4 . 3 % 2 2 . 8 % 2 1 . 4 %
I p d e v e l o p m e n t 1 5 . 8 % 1 6 . 0 % 1 6 . 1 % 1 7 . 0 %
C h i p t e s t i n g 6 . 8 % 8 . 3 % 9 . 1 % 9 . 4 %
S o u r c e : I S a - I d C , 2 0 0 8
VLSI Design Market Revenue Forecast The total VLSI design service revenues were estimated at US$ 766 million in 2007 with 13,900 employees contributing approximately 13% of the overall design services market. In terms of work force it employed 11% of the overall design services workforce.
Rev
enue
(US
$Mn)
Revenue (US $Mn)2007 2008 2009 2010
0
300
600
900
1,200
1,500
FIGURE 10
Market Forecast by Revenues for VLSI Design
Source: ISA -IDC, 2008
CAGR21.7%
766.2 926.9 1,129.3 1,380.1
The market will grow at a CAGR of 21.7% from 2007 to 2010 on account of the growth in consumer, portable, and the automotive/ wireless sectors.
( C o n t d . )

24
IndIa SemIConduCtor and embedded deSIgn ServICe InduStry (2007-2010)market, teChnology and eCoSyStem analySIS
I S a - I d C r e p o r t , 2 0 0 8
Chapter 3
eda tools marketMarket Snapshot
Electronic Design Automation (EDA) is the category of tools for designing and producing electronic systems ranging from printed circuit boards (PCBs) to integrated circuits. This is sometimes referred to as electronic computer-aided design (ECAD or just CAD). EDA tools are highly sophisticated and consist of highly complex algorithms.
Market Details
The Indian subsidiaries of the global electronics design automation (EDA) software and services companies, along with a few Indian players, are benefiting from the trend of India becoming a design hub. While most of the global giants have put up their captive design units in India, many non-captive units have also flourished in India. Being an integral part of the semiconductor value chain, the EDA industry is growing at a rate of more than 30% for the last few years.
Market Drivers
Growth of the Indian domestic electronic goods market. �
India has moved up in the overall semiconductor value chain and more and more specs to tape-out roll-outs are being �done out of India.
FIGURE 15: Components and Activities of EDA Software in Value Chain
Source: ISA -IDC, 2008
Compilers
Mappers
EDAPlacers
Routers
Timing Engines
ParaslticExtractions
Code Coverage
Memory LeakageLexical
Analyzers
Logic Generators
LogicStimulators
PatternRecognitionParallel
Computation
User FriendlyGUI
Extremely Compact & Fast Access
Database
Boolean LogicOptimizers
C h a p t e r 3 - e d a t o o l S m a r k e t
be fulfilled only when there is innovation. It is not just the handset, but also the connectivity in mobile phones that is one of the biggest growth drivers for semiconductors over the forecast horizon. Year after year, consumer demand for connectivity has also increased. The growth of connectivity technologies like Bluetooth, Wi-Fi, GPS and Wi Max has fuelled the growth of this segment. Though the consumer market has slowed down a bit due to a decrease in the purchasing power of the population worldwide and an oversupply of goods, it is expected to pick up by 2008. Automobiles is another important potential segment. Automobile requires fail safe and proactive safety to be built in the chip. This can be achieved through well defined process adherence and stringent checks on the final product. The 2-wheeler and 4-wheeler segments could significantly drive the growth of this particular industry segment.
t a b l e 7 : v l S I d e s i g n p r o j e c t s s p l i t a c c o r d i n g t o t h e I n d u s t r y S e g m e n t s2 0 0 7 2 0 0 8 2 0 0 9 2 0 1 0
C o m p u t i n g p r o d u c t s 9 . 3 % 9 . 5 % 9 . 7 % 9 . 9 %
t e l e c o m / n e t w o r k i n g p r o d u c t s 3 1 . 2 % 3 0 . 2 % 2 9 . 0 % 2 8 . 0 %
I n d u s t r i a l / p o w e r e l e c t r o n i c s p r o d u c t s 5 . 6 % 5 . 1 % 4 . 5 % 4 . 0 %
p o r t a b l e / W i r e l e s s p r o d u c t s 1 4 . 1 % 1 4 . 4 % 1 4 . 8 % 1 5 . 2 %
C o n s u m e r e l e c t r o n i c s p r o d u c t s 3 3 . 3 % 3 3 . 5 % 3 4 . 0 % 3 4 . 6 %
a u t o m o b i l e p r o d u c t s 4 . 1 % 4 . 6 % 5 . 0 % 5 . 2 %
o t h e r s * 2 . 4 % 2 . 7 % 3 . 0 % 3 . 1 %
* o t h e r s I n c l u d e m e d i c a l , d e f e n s e p r o d u c t s e t c . S o u r c e : I S a - I d C , 2 0 0 8
VLSI Technical Workforce Breakup by Educational Qualification and Gender Ratio Of the workforce, engineering graduates make up the biggest section. The percentage of Masters Degree is highest in VLSI as compared to Board Design and Embedded Software development.
FIGURE 13
VLSI Engineering Workforce Break-up by Educational Qualification, 2007
Source: ISA -IDC, 2008
MastersDegree27.3%
Bachelors inEngineering66.2%
DiplomaHolders2.9%
Ph.D1.5%
Others2.0%
FIGURE 14
VLSI Engineering Workforce Break-up by Gender Ratio, 2007
Source: ISA -IDC, 2008
Men79.5%
Women20.5%
The VLSI design services industry is dominated by men, however the percentage of women in VLSI design has marginally increased year- on- year as compared to 2006.
26
IndIa SemIConduCtor and embedded deSIgn ServICe InduStry (2007-2010)market, teChnology and eCoSyStem analySIS
I S a - I d C r e p o r t , 2 0 0 8
Chapter 4
hardware/board design marketMarket Snapshot
ISA and IDC have estimated the hardware/board design market at US$ 386.1 million in 2007. The strongest revenue growth is expected to come from consumer electronics products and the telecom/networking product segment in 2008. ISA & IDC anticipates that these sectors will grow to 31% and 22% respectively. The total hardware/board design market is expected to reach US$ 679 million by 2010.
The growth of the domestic semiconductor industry and investments announced by the global majors are paving the way for a strong ecosystem to support the electronics industry. The robust growth in the local consumer electronics market and the global trend towards outsourcing are fuelling India’s engineering design industry. The hardware/board design market is driven by reference board design developed by both the semiconductor marketers and OEMs as a part of their new product development. This would also include the re-spinning on the existing boards. The emergence of India as an electronics hub will lead to more investment with a strong ecosystem developing and more centers of electronics manufacturing excellence coming up.
In terms of technology, designers are using FPGA devices in hardware design more frequently. This is because FPGA devices have increased their speed of operation and also have enhanced capacity.
Proximity to markets has a significant impact on board design. Customer taste and nuances need to be kept under consideration. Recently many captives have started working on hardware/board designs giving a boost to the overall industry.
Market Detail
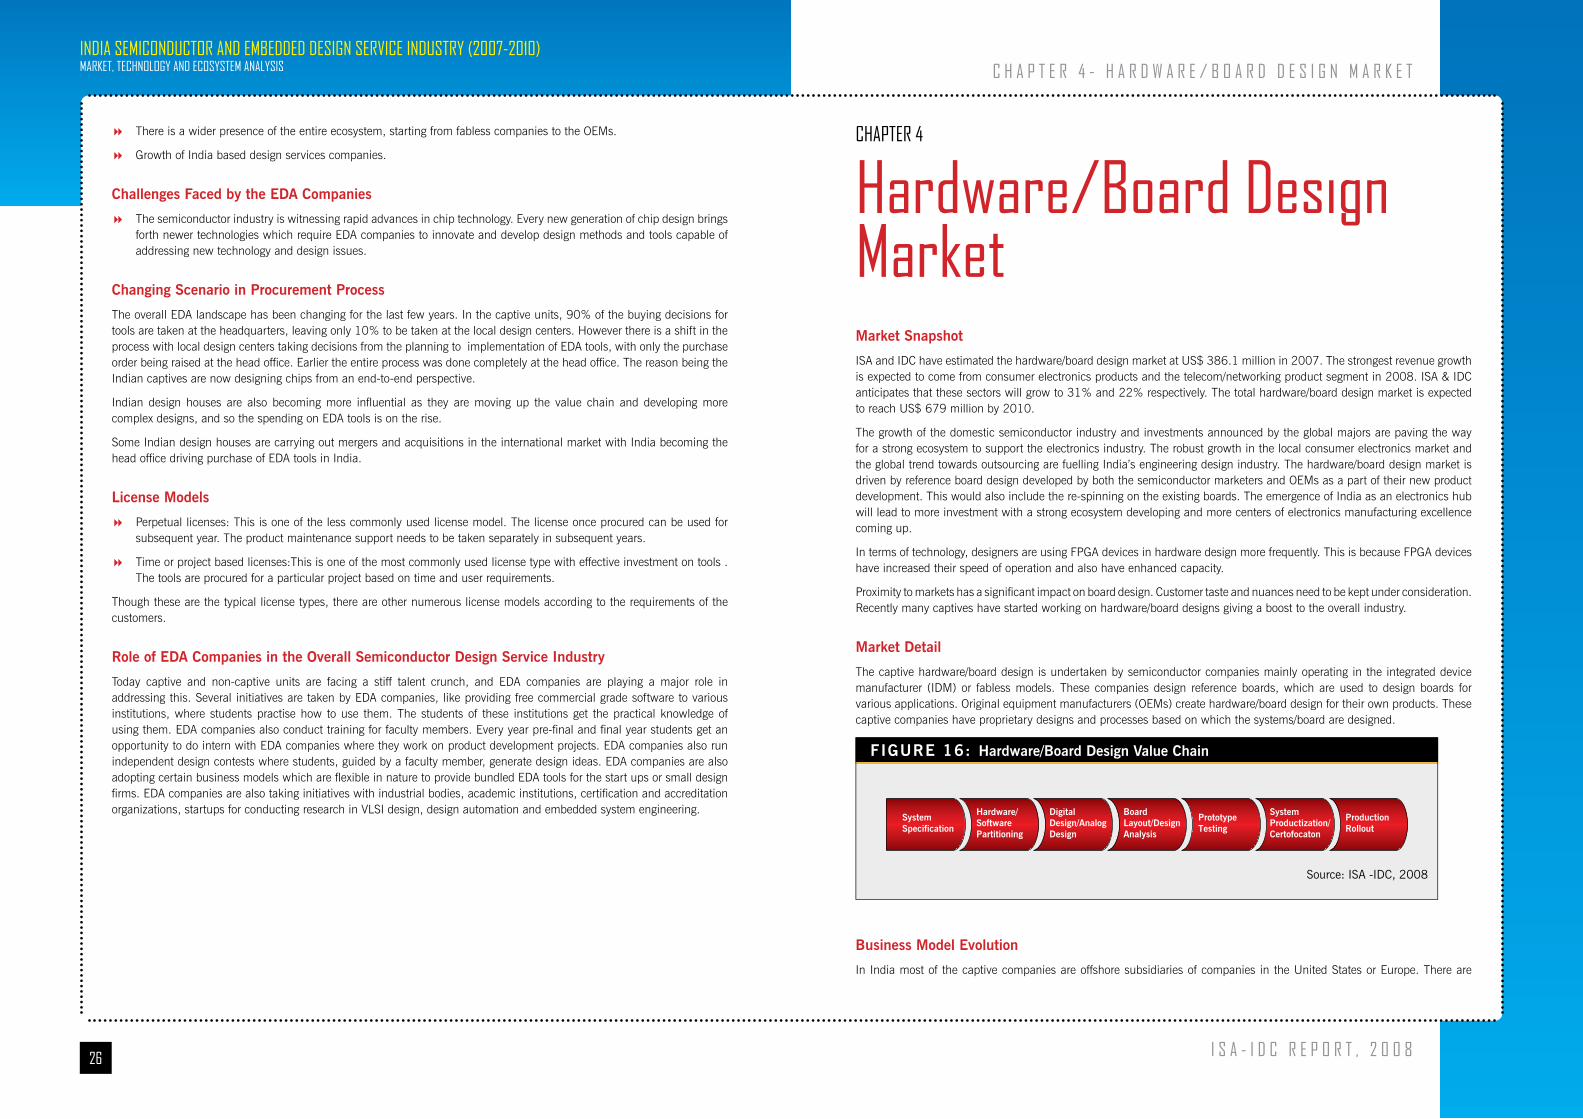
The captive hardware/board design is undertaken by semiconductor companies mainly operating in the integrated device manufacturer (IDM) or fabless models. These companies design reference boards, which are used to design boards for various applications. Original equipment manufacturers (OEMs) create hardware/board design for their own products. These captive companies have proprietary designs and processes based on which the systems/board are designed.
FIGURE 16: Hardware/Board Design Value Chain
Source: ISA -IDC, 2008
SystemSpecification
Hardware/SoftwarePartitioning
DigitalDesign/AnalogDesign
BoardLayout/DesignAnalysis
PrototypeTesting
SystemProductization/Certofocaton
ProductionRollout
Business Model Evolution
In India most of the captive companies are offshore subsidiaries of companies in the United States or Europe. There are
C h a p t e r 4 - h a r d W a r e / b o a r d d e S I g n m a r k e t
There is a wider presence of the entire ecosystem, starting from fabless companies to the OEMs. �
Growth of India based design services companies. �
Challenges Faced by the EDA Companies
The semiconductor industry is witnessing rapid advances in chip technology. Every new generation of chip design brings �forth newer technologies which require EDA companies to innovate and develop design methods and tools capable of addressing new technology and design issues.
Changing Scenario in Procurement Process
The overall EDA landscape has been changing for the last few years. In the captive units, 90% of the buying decisions for tools are taken at the headquarters, leaving only 10% to be taken at the local design centers. However there is a shift in the process with local design centers taking decisions from the planning to implementation of EDA tools, with only the purchase order being raised at the head office. Earlier the entire process was done completely at the head office. The reason being the Indian captives are now designing chips from an end-to-end perspective.
Indian design houses are also becoming more influential as they are moving up the value chain and developing more complex designs, and so the spending on EDA tools is on the rise.
Some Indian design houses are carrying out mergers and acquisitions in the international market with India becoming the head office driving purchase of EDA tools in India.
License Models
Perpetual licenses: This is one of the less commonly used license model. The license once procured can be used for �subsequent year. The product maintenance support needs to be taken separately in subsequent years.
Time or project based licenses:This is one of the most commonly used license type with effective investment on tools . �The tools are procured for a particular project based on time and user requirements.
Though these are the typical license types, there are other numerous license models according to the requirements of the customers.
Role of EDA Companies in the Overall Semiconductor Design Service Industry
Today captive and non-captive units are facing a stiff talent crunch, and EDA companies are playing a major role in addressing this. Several initiatives are taken by EDA companies, like providing free commercial grade software to various institutions, where students practise how to use them. The students of these institutions get the practical knowledge of using them. EDA companies also conduct training for faculty members. Every year pre-final and final year students get an opportunity to do intern with EDA companies where they work on product development projects. EDA companies also run independent design contests where students, guided by a faculty member, generate design ideas. EDA companies are also adopting certain business models which are flexible in nature to provide bundled EDA tools for the start ups or small design firms. EDA companies are also taking initiatives with industrial bodies, academic institutions, certification and accreditation organizations, startups for conducting research in VLSI design, design automation and embedded system engineering.

28
IndIa SemIConduCtor and embedded deSIgn ServICe InduStry (2007-2010)market, teChnology and eCoSyStem analySIS
I S a - I d C r e p o r t , 2 0 0 8
3. Need for re-engineering
There are opportunities in re-engineering, with product development companies displaying an interest in re-engineering �the existing products to facilitate design reuse, compliance (RoHS etc), lower costs, enhance features, and deal with competition over similar products.
Market Challenges
1. Increase in board complexity
Exponentially increasing silicon capacity and performance affect more than just the silicon. It also affects the IC �packaging and printed circuit boards (PCBs) that interconnect the silicon in a complete system. New levels of integration are required as pin counts exceed 1000, digital frequencies exceed 500 MHz, and sensitive analog signals cross IC boundaries.
Connecting high-speed packages to a PCB-board is an increasingly complex activity. An improper electrical connection �can generate signal-integrity and electromagnetic-interference problems. Large, multilayer boards, complex, multi-terminal IC packages and 3-dimensional (3-D) on-chip passive structures are becoming common in high-performance designs. Common failure modes, including inter-signal interference and ground bounce, require electro-magnetic analysis. In addition, engineers often perform frequency-domain power-integrity analysis, which they did not require to do earlier.
In a high-speed-differential or source-synchronous design, signals need to arrive at the receivers at the same time. Due �to space limitations, a designer must route a signal around many bends and corners, reduce the signal’s propagation delay and compensate for this reduction by lengthening the trace. Most signal traces in a package have different lengths and designers must compensate for these differences on the PCB.
2. Scaling up to high speed complex board design need
One of the biggest challenges is to develop more expertise in designing multi-layer, high-speed boards, complying with �various regulatory standards, restricting electromagnetic emission in the environment.
3. Need for ecosystem development
There is a need for high precision manufacturing setup in India which will further boost the growth of board design �industry.
Future Trends
With the rapidly changing demands for quicker turnaround times and higher performance at a lower cost, a development platform that allows for the control and debugging of designs in real time with real data is needed which can enhance a product’s success. The problems of integrating the hardware and software components increase as the logic density and application sizes increase. A hardware/software co-design development system is becoming essential to success. ISA - IDC sees the emergence of new platforms to address the needs and skills of both the hardware and the software engineers.
Quantitative Analysis
Total Number of Design ProjectsThe total number of design projects has been estimated at 1797 in 2007 and is expected to grow to 3534 in 2010 at a CAGR of 25.4% percent. These include new boards as well as modifications to the boards, which were based on existing designs.
The increase in the number of design projects is attributed to the increase in the OEMs carrying out multiple designs, both for the domestic as well as the export market. It is also attributed to outsourcing of work to the non-captive companies for hardware/board design. This is supplemented by the reference designs carried out by the non-captive companies for the complete VLSI design carried out in India.
C h a p t e r 4 - h a r d W a r e / b o a r d d e S I g n m a r k e t
product companies that design and license products to companies that manufacture and market them under their own brand.
The non-captive companies are third-party hardware design service providers. Independent companies in hardware/board design include VLSI design service providers, typically carrying out VLSI design, hardware/board design, and also embedded software services. The design services involve activities such as “System Specifications”, “Hardware/Software partitioning”, “Digital design/analog design”, “Board Layout/Design analysis”, “Prototype testing”, “System Productization/Certification” and “Production roll out”.
A non-captive company does not own the designs. It nevertheless partners with a board fabricator or contract manufacturing companies either in India or abroad to provide the OEM with complete hardware in case the OEM wants the full product supply for the non-captive company. This partnership model is eventually emerging in the market place.
Hardware/Board Design Ecosystem of the Industry
Hardware design is a complex process and complexity is increasing everyday. Miniaturization, convergence, high performance, and having to reduce power consumption are some of the key trends driving hardware design. More and more companies are focusing on specialty areas like automotive, medical, and aerospace electronic applications. These call for designs to accommodate advanced electronic technologies, extremely fast clock speeds, sharp rise times, wider bus width, shrinking size, low power consumption, and increased functionality, with narrower timing, noise, and thermal margins. At the same time, companies have to improve overall system performance and reliability, shorten board delivery schedules, and decrease costs. This makes hardware design a great challenge for the players in the industry.
FIGURE 17
Source: ISA -IDC, 2008
CapturingRequirements
SchematicDesign
Board Design,Thermal Analysis
Prototyping &Testing
Manufacturing
Lifecycle of Hardware/BoardDesign Development
Market Drivers
Emergence of EMS companies in India
EMS companies emerging in the market: EMS as a model has evolved in the global market for almost a decade. In India, �EMS model is becoming an extension of global scenario. EMS companies are setting up facilities to support the global customers and to tap local customers in India.
2. India as a consumer market
India is emerging as a strong consumer market and product companies come to India not only for cost-effective quality �design services but also to sell their products in India.
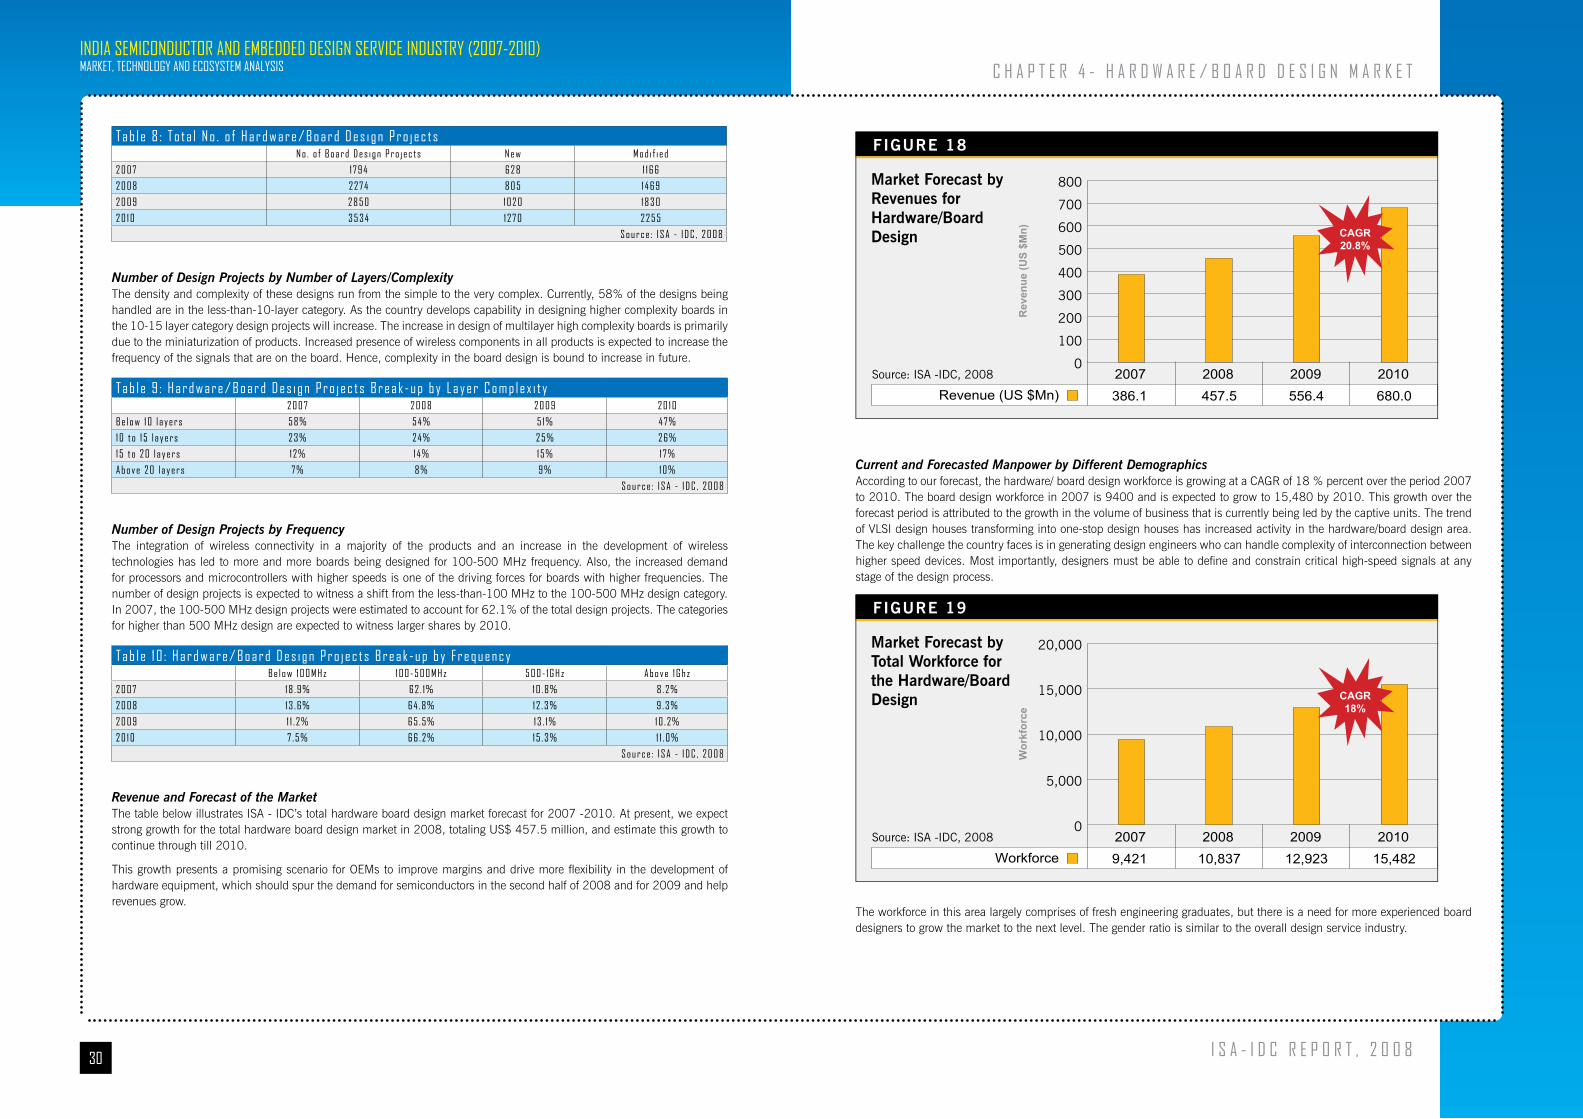
30
IndIa SemIConduCtor and embedded deSIgn ServICe InduStry (2007-2010)market, teChnology and eCoSyStem analySIS
I S a - I d C r e p o r t , 2 0 0 8
Rev
enue
(US
$Mn)
Revenue (US $Mn)2007 2008 2009 2010
0
100
200
300
400
500
600
700
800
FIGURE 18
Market Forecast by Revenues for Hardware/Board Design
Source: ISA -IDC, 2008
CAGR20.8%
386.1 457.5 556.4 680.0
Current and Forecasted Manpower by Different DemographicsAccording to our forecast, the hardware/ board design workforce is growing at a CAGR of 18 % percent over the period 2007 to 2010. The board design workforce in 2007 is 9400 and is expected to grow to 15,480 by 2010. This growth over the forecast period is attributed to the growth in the volume of business that is currently being led by the captive units. The trend of VLSI design houses transforming into one-stop design houses has increased activity in the hardware/board design area. The key challenge the country faces is in generating design engineers who can handle complexity of interconnection between higher speed devices. Most importantly, designers must be able to define and constrain critical high-speed signals at any stage of the design process.
Wor
kfor
ce
Workforce2007 2008 2009 2010
0
5,000
10,000
15,000
20,000
FIGURE 19
Market Forecast by Total Workforce for the Hardware/Board Design
Source: ISA -IDC, 2008
CAGR18%
9,421 10,837 12,923 15,482
The workforce in this area largely comprises of fresh engineering graduates, but there is a need for more experienced board designers to grow the market to the next level. The gender ratio is similar to the overall design service industry.
C h a p t e r 4 - h a r d W a r e / b o a r d d e S I g n m a r k e t
t a b l e 8 : t o t a l n o . o f h a r d w a r e / b o a r d d e s i g n p r o j e c t sn o . o f b o a r d d e s i g n p r o j e c t s n e w m o d i f i e d
2 0 0 7 1 7 9 4 6 2 8 1 1 6 6
2 0 0 8 2 2 7 4 8 0 5 1 4 6 9
2 0 0 9 2 8 5 0 1 0 2 0 1 8 3 0
2 0 1 0 3 5 3 4 1 2 7 0 2 2 5 5
S o u r c e : I S a - I d C , 2 0 0 8
Number of Design Projects by Number of Layers/ComplexityThe density and complexity of these designs run from the simple to the very complex. Currently, 58% of the designs being handled are in the less-than-10-layer category. As the country develops capability in designing higher complexity boards in the 10-15 layer category design projects will increase. The increase in design of multilayer high complexity boards is primarily due to the miniaturization of products. Increased presence of wireless components in all products is expected to increase the frequency of the signals that are on the board. Hence, complexity in the board design is bound to increase in future.
t a b l e 9 : h a r d w a r e / b o a r d d e s i g n p r o j e c t s b r e a k - u p b y l a y e r C o m p l e x i t y 2 0 0 7 2 0 0 8 2 0 0 9 2 0 1 0
b e l o w 1 0 l a y e r s 5 8 % 5 4 % 5 1 % 4 7 %
1 0 t o 1 5 l a y e r s 2 3 % 2 4 % 2 5 % 2 6 %
1 5 t o 2 0 l a y e r s 1 2 % 1 4 % 1 5 % 1 7 %
a b o v e 2 0 l a y e r s 7 % 8 % 9 % 1 0 %
S o u r c e : I S a - I d C , 2 0 0 8
Number of Design Projects by FrequencyThe integration of wireless connectivity in a majority of the products and an increase in the development of wireless technologies has led to more and more boards being designed for 100-500 MHz frequency. Also, the increased demand for processors and microcontrollers with higher speeds is one of the driving forces for boards with higher frequencies. The number of design projects is expected to witness a shift from the less-than-100 MHz to the 100-500 MHz design category. In 2007, the 100-500 MHz design projects were estimated to account for 62.1% of the total design projects. The categories for higher than 500 MHz design are expected to witness larger shares by 2010.
t a b l e 1 0 : h a r d w a r e / b o a r d d e s i g n p r o j e c t s b r e a k - u p b y F r e q u e n c yb e l o w 1 0 0 m h z 1 0 0 - 5 0 0 m h z 5 0 0 - 1 g h z a b o v e 1 g h z
2 0 0 7 1 8 . 9 % 6 2 . 1 % 1 0 . 8 % 8 . 2 %
2 0 0 8 1 3 . 6 % 6 4 . 8 % 1 2 . 3 % 9 . 3 %
2 0 0 9 1 1 . 2 % 6 5 . 5 % 1 3 . 1 % 1 0 . 2 %
2 0 1 0 7 . 5 % 6 6 . 2 % 1 5 . 3 % 1 1 . 0 %
S o u r c e : I S a - I d C , 2 0 0 8
Revenue and Forecast of the MarketThe table below illustrates ISA - IDC’s total hardware board design market forecast for 2007 -2010. At present, we expect strong growth for the total hardware board design market in 2008, totaling US$ 457.5 million, and estimate this growth to continue through till 2010.
This growth presents a promising scenario for OEMs to improve margins and drive more flexibility in the development of hardware equipment, which should spur the demand for semiconductors in the second half of 2008 and for 2009 and help revenues grow.
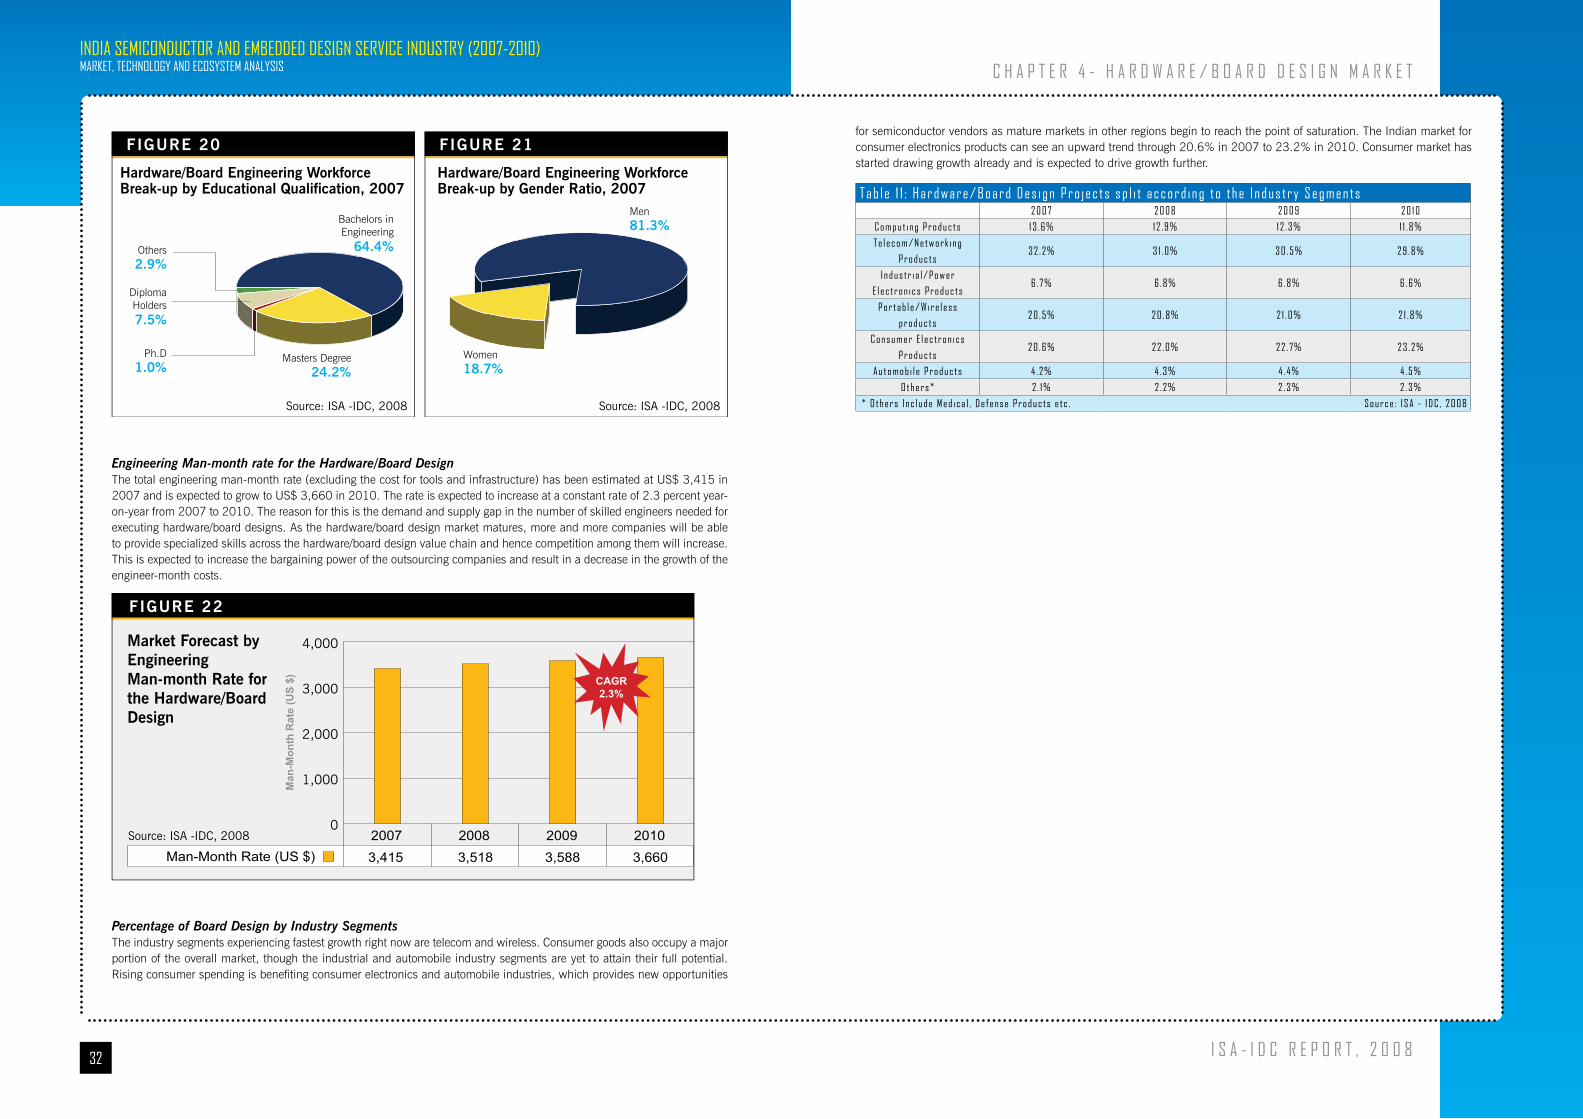
32
IndIa SemIConduCtor and embedded deSIgn ServICe InduStry (2007-2010)market, teChnology and eCoSyStem analySIS
I S a - I d C r e p o r t , 2 0 0 8
for semiconductor vendors as mature markets in other regions begin to reach the point of saturation. The Indian market for consumer electronics products can see an upward trend through 20.6% in 2007 to 23.2% in 2010. Consumer market has started drawing growth already and is expected to drive growth further.
t a b l e 1 1 : h a r d w a r e / b o a r d d e s i g n p r o j e c t s s p l i t a c c o r d i n g t o t h e I n d u s t r y S e g m e n t s2 0 0 7 2 0 0 8 2 0 0 9 2 0 1 0
C o m p u t i n g p r o d u c t s 1 3 . 6 % 1 2 . 9 % 1 2 . 3 % 1 1 . 8 %
t e l e c o m / n e t w o r k i n g
p r o d u c t s3 2 . 2 % 3 1 . 0 % 3 0 . 5 % 2 9 . 8 %
I n d u s t r i a l / p o w e r
e l e c t r o n i c s p r o d u c t s6 . 7 % 6 . 8 % 6 . 8 % 6 . 6 %
p o r t a b l e / W i r e l e s s
p r o d u c t s2 0 . 5 % 2 0 . 8 % 2 1 . 0 % 2 1 . 8 %
C o n s u m e r e l e c t r o n i c s
p r o d u c t s2 0 . 6 % 2 2 . 0 % 2 2 . 7 % 2 3 . 2 %
a u t o m o b i l e p r o d u c t s 4 . 2 % 4 . 3 % 4 . 4 % 4 . 5 %
o t h e r s * 2 . 1 % 2 . 2 % 2 . 3 % 2 . 3 %
* o t h e r s I n c l u d e m e d i c a l , d e f e n s e p r o d u c t s e t c . S o u r c e : I S a - I d C , 2 0 0 8
C h a p t e r 4 - h a r d W a r e / b o a r d d e S I g n m a r k e t
FIGURE 20
Hardware/Board Engineering Workforce Break-up by Educational Qualification, 2007
Source: ISA -IDC, 2008
Masters Degree24.2%
Bachelors inEngineering
64.4%
DiplomaHolders7.5%
Ph.D1.0%
Others2.9%
FIGURE 21
Hardware/Board Engineering Workforce Break-up by Gender Ratio, 2007
Source: ISA -IDC, 2008
Men81.3%
Women18.7%
Engineering Man-month rate for the Hardware/Board DesignThe total engineering man-month rate (excluding the cost for tools and infrastructure) has been estimated at US$ 3,415 in 2007 and is expected to grow to US$ 3,660 in 2010. The rate is expected to increase at a constant rate of 2.3 percent year-on-year from 2007 to 2010. The reason for this is the demand and supply gap in the number of skilled engineers needed for executing hardware/board designs. As the hardware/board design market matures, more and more companies will be able to provide specialized skills across the hardware/board design value chain and hence competition among them will increase. This is expected to increase the bargaining power of the outsourcing companies and result in a decrease in the growth of the engineer-month costs.
Man
-Mon
th R
ate
(US
$)
Man-Month Rate (US $)2007 2008 2009 2010
0
1,000
2,000
3,000
4,000
FIGURE 22
Market Forecast by Engineering Man-month Rate for the Hardware/Board Design
Source: ISA -IDC, 2008
CAGR2.3%
3,415 3,518 3,588 3,660
Percentage of Board Design by Industry SegmentsThe industry segments experiencing fastest growth right now are telecom and wireless. Consumer goods also occupy a major portion of the overall market, though the industrial and automobile industry segments are yet to attain their full potential. Rising consumer spending is benefiting consumer electronics and automobile industries, which provides new opportunities
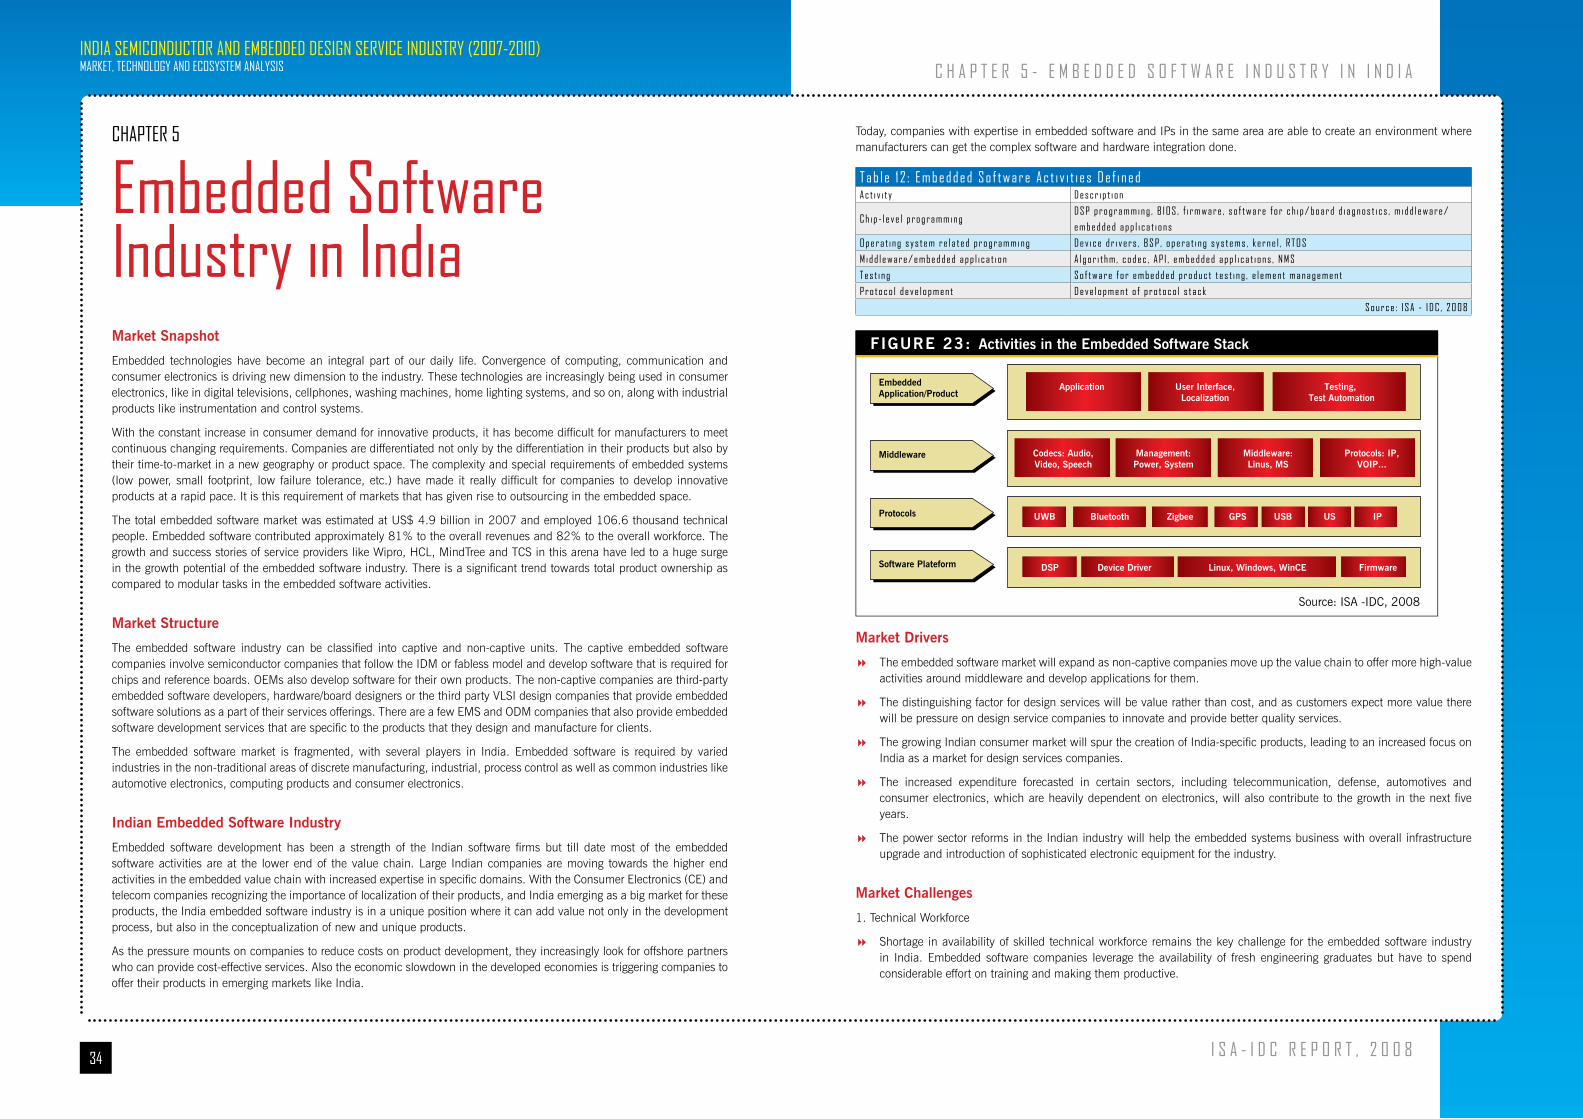
34
IndIa SemIConduCtor and embedded deSIgn ServICe InduStry (2007-2010)market, teChnology and eCoSyStem analySIS
I S a - I d C r e p o r t , 2 0 0 8
Today, companies with expertise in embedded software and IPs in the same area are able to create an environment where manufacturers can get the complex software and hardware integration done.
t a b l e 1 2 : e m b e d d e d S o f t w a r e a c t i v i t i e s d e f i n e da c t i v i t y d e s c r i p t i o n
C h i p - l e v e l p r o g r a m m i n gd S p p r o g r a m m i n g , b I o S , f i r m w a r e , s o f t w a r e f o r c h i p / b o a r d d i a g n o s t i c s , m i d d l e w a r e /
e m b e d d e d a p p l i c a t i o n s
o p e r a t i n g s y s t e m r e l a t e d p r o g r a m m i n g d e v i c e d r i v e r s , b S p , o p e r a t i n g s y s t e m s , k e r n e l , r t o S
m i d d l e w a r e / e m b e d d e d a p p l i c a t i o n a l g o r i t h m , c o d e c , a p I , e m b e d d e d a p p l i c a t i o n s , n m S
t e s t i n g S o f t w a r e f o r e m b e d d e d p r o d u c t t e s t i n g , e l e m e n t m a n a g e m e n t
p r o t o c o l d e v e l o p m e n t d e v e l o p m e n t o f p r o t o c o l s t a c k
S o u r c e : I S a - I d C , 2 0 0 8
Market Drivers
The embedded software market will expand as non-captive companies move up the value chain to offer more high-value �activities around middleware and develop applications for them.
The distinguishing factor for design services will be value rather than cost, and as customers expect more value there �will be pressure on design service companies to innovate and provide better quality services.
The growing Indian consumer market will spur the creation of India-specific products, leading to an increased focus on �India as a market for design services companies.
The increased expenditure forecasted in certain sectors, including telecommunication, defense, automotives and �consumer electronics, which are heavily dependent on electronics, will also contribute to the growth in the next five years.
The power sector reforms in the Indian industry will help the embedded systems business with overall infrastructure �upgrade and introduction of sophisticated electronic equipment for the industry.
Market Challenges
1. Technical Workforce
Shortage in availability of skilled technical workforce remains the key challenge for the embedded software industry �in India. Embedded software companies leverage the availability of fresh engineering graduates but have to spend considerable effort on training and making them productive.
FIGURE 23: Activities in the Embedded Software Stack
Source: ISA -IDC, 2008
Application
Codecs: Audio,Video, Speech
Management:Power, System
UWB
DSP Device Driver Linux, Windows, WinCE Firmware
Bluetooth Zigbee GPS USB US IP
Middleware:Linus, MS
Protocols: IP,VOIP...
User Interface,Localization
Testing, Test Automation
Embedded Application/Product
Middleware
Protocols
Software Plateform
C h a p t e r 5 - e m b e d d e d S o F t W a r e I n d u S t r y I n I n d I a
Chapter 5
embedded Software Industry in IndiaMarket Snapshot
Embedded technologies have become an integral part of our daily life. Convergence of computing, communication and consumer electronics is driving new dimension to the industry. These technologies are increasingly being used in consumer electronics, like in digital televisions, cellphones, washing machines, home lighting systems, and so on, along with industrial products like instrumentation and control systems.
With the constant increase in consumer demand for innovative products, it has become difficult for manufacturers to meet continuous changing requirements. Companies are differentiated not only by the differentiation in their products but also by their time-to-market in a new geography or product space. The complexity and special requirements of embedded systems (low power, small footprint, low failure tolerance, etc.) have made it really difficult for companies to develop innovative products at a rapid pace. It is this requirement of markets that has given rise to outsourcing in the embedded space.
The total embedded software market was estimated at US$ 4.9 billion in 2007 and employed 106.6 thousand technical people. Embedded software contributed approximately 81% to the overall revenues and 82% to the overall workforce. The growth and success stories of service providers like Wipro, HCL, MindTree and TCS in this arena have led to a huge surge in the growth potential of the embedded software industry. There is a significant trend towards total product ownership as compared to modular tasks in the embedded software activities.
Market Structure
The embedded software industry can be classified into captive and non-captive units. The captive embedded software companies involve semiconductor companies that follow the IDM or fabless model and develop software that is required for chips and reference boards. OEMs also develop software for their own products. The non-captive companies are third-party embedded software developers, hardware/board designers or the third party VLSI design companies that provide embedded software solutions as a part of their services offerings. There are a few EMS and ODM companies that also provide embedded software development services that are specific to the products that they design and manufacture for clients.
The embedded software market is fragmented, with several players in India. Embedded software is required by varied industries in the non-traditional areas of discrete manufacturing, industrial, process control as well as common industries like automotive electronics, computing products and consumer electronics.
Indian Embedded Software Industry
Embedded software development has been a strength of the Indian software firms but till date most of the embedded software activities are at the lower end of the value chain. Large Indian companies are moving towards the higher end activities in the embedded value chain with increased expertise in specific domains. With the Consumer Electronics (CE) and telecom companies recognizing the importance of localization of their products, and India emerging as a big market for these products, the India embedded software industry is in a unique position where it can add value not only in the development process, but also in the conceptualization of new and unique products.
As the pressure mounts on companies to reduce costs on product development, they increasingly look for offshore partners who can provide cost-effective services. Also the economic slowdown in the developed economies is triggering companies to offer their products in emerging markets like India.
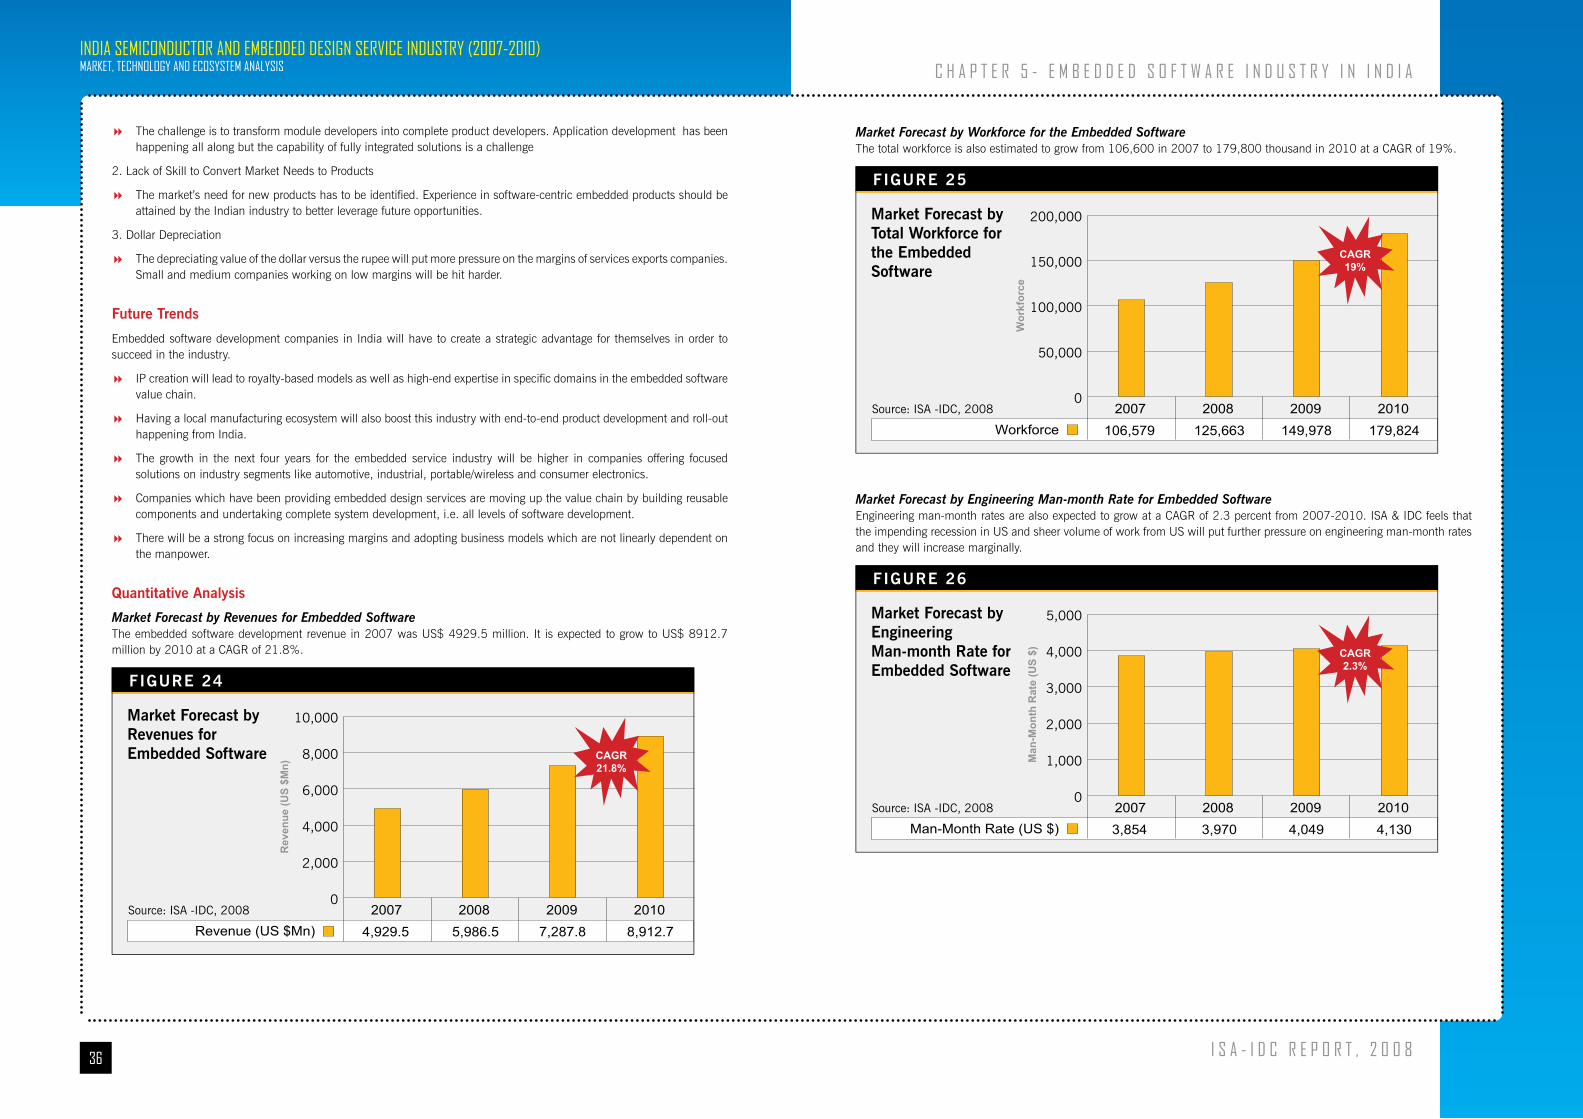
36
IndIa SemIConduCtor and embedded deSIgn ServICe InduStry (2007-2010)market, teChnology and eCoSyStem analySIS
I S a - I d C r e p o r t , 2 0 0 8
Market Forecast by Workforce for the Embedded SoftwareThe total workforce is also estimated to grow from 106,600 in 2007 to 179,800 thousand in 2010 at a CAGR of 19%.
Wor
kfor
ce
Workforce2007 2008 2009 2010
0
50,000
100,000
150,000
200,000
FIGURE 25
Market Forecast by Total Workforce for the Embedded Software
Source: ISA -IDC, 2008
CAGR19%
106,579 125,663 149,978 179,824
Market Forecast by Engineering Man-month Rate for Embedded SoftwareEngineering man-month rates are also expected to grow at a CAGR of 2.3 percent from 2007-2010. ISA & IDC feels that the impending recession in US and sheer volume of work from US will put further pressure on engineering man-month rates and they will increase marginally.
Man
-Mon
th R
ate
(US
$)
Man-Month Rate (US $)2007 2008 2009 2010
0
1,000
2,000
3,000
4,000
5,000
FIGURE 26
Market Forecast by Engineering Man-month Rate for Embedded Software
Source: ISA -IDC, 2008
CAGR2.3%
3,854 3,970 4,049 4,130
C h a p t e r 5 - e m b e d d e d S o F t W a r e I n d u S t r y I n I n d I a
The challenge is to transform module developers into complete product developers. Application development has been �happening all along but the capability of fully integrated solutions is a challenge
2. Lack of Skill to Convert Market Needs to Products
The market’s need for new products has to be identified. Experience in software-centric embedded products should be �attained by the Indian industry to better leverage future opportunities.
3. Dollar Depreciation
The depreciating value of the dollar versus the rupee will put more pressure on the margins of services exports companies. �Small and medium companies working on low margins will be hit harder.
Future Trends
Embedded software development companies in India will have to create a strategic advantage for themselves in order to succeed in the industry.
IP creation will lead to royalty-based models as well as high-end expertise in specific domains in the embedded software �value chain.
Having a local manufacturing ecosystem will also boost this industry with end-to-end product development and roll-out �happening from India.
The growth in the next four years for the embedded service industry will be higher in companies offering focused �solutions on industry segments like automotive, industrial, portable/wireless and consumer electronics.
Companies which have been providing embedded design services are moving up the value chain by building reusable �components and undertaking complete system development, i.e. all levels of software development.
There will be a strong focus on increasing margins and adopting business models which are not linearly dependent on �the manpower.
Quantitative Analysis
Market Forecast by Revenues for Embedded SoftwareThe embedded software development revenue in 2007 was US$ 4929.5 million. It is expected to grow to US$ 8912.7 million by 2010 at a CAGR of 21.8%.
Rev
enue
(US
$Mn)
Revenue (US $Mn)2007 2008 2009 2010
0
2,000
4,000
6,000
8,000
10,000
FIGURE 24
Market Forecast by Revenues for Embedded Software
Source: ISA -IDC, 2008
CAGR21.8%
4,929.5 5,986.5 7,287.8 8,912.7

38
IndIa SemIConduCtor and embedded deSIgn ServICe InduStry (2007-2010)market, teChnology and eCoSyStem analySIS
I S a - I d C r e p o r t , 2 0 0 8
Chapter 6
embedded design Services market ecosystem - moving up the value ChainMarket Snapshot
The embedded design services market ecosystem consists of multiple entities. The key entities that drive this ecosystem include OEMs, IDMs and fabless semiconductor companies, service providers, and the fabs.
Figure 29, describes the ecosystem as a combination of multiple entities that are part of the product development value chain. It also depicts the relationship amongst these entities and their linkages between each other.
FIGURE 29: Ecosystem Entities and their Linkages between Each Other
Source: ISA -IDC, 2008
OEMsDesignService
Providers
IDMs
Market
Fabs
C h a p t e r 6 - e m b e d d e d d e S I g n S e r v I C e S m a r k e t e C o S y S t e m
Embedded Technical Workforce Breakup by Educational Qualification and Gender Ratio Of the workforce, engineering graduates make up the biggest section with very few Ph.Ds.
FIGURE 27
Embedded Software Engineering Workforce Break-up by Educational Qualification, 2007
Source: ISA -IDC, 2008
Masters Degree22.2%
Bachelors inEngineering
69.3%
DiplomaHolders3.9%
Ph.D1.0%
Others3.6%
FIGURE 28
Embedded Software Engineering Workforce Break-up by Gender Ratio, 2007
Source: ISA -IDC, 2008
Men74%
Women26%
The percentage of women percentage is higher in embedded software industry because of nature of work that is much closer to software development industry.
Headcount Break up by Embedded Software ActivitiesCurrently, the major activities outsourced to India are middleware/embedded application and testing. It is expected that there will be a further growth in these areas and catering to industry segments such as telecommunications and consumer electronics.
t a b l e 1 3 : h e a d c o u n t b r e a k u p b y e m b e d d e d S o f t w a r e a c t i v i t i e s2 0 0 7 2 0 0 8 2 0 0 9 2 0 1 0
C h i p l e v e l p r o g r a m m i n g 1 0 . 0 % 9 . 5 % 9 . 0 % 8 . 0 %
m i d d l e w a r e / e m b e d d e d a p p l i c a t i o n 3 0 . 0 % 3 0 . 5 % 3 1 . 0 % 3 1 . 5 %
o S r e l a t e d p r o g r a m m i n g 1 2 . 5 % 1 3 . 0 % 1 3 . 0 % 1 3 . 5 %
t e s t i n g 2 6 . 5 % 2 7 . 0 % 2 8 . 0 % 2 9 . 2 %
C o m m u n i c a t i o n p r o t o c o l 2 1 . 0 % 2 0 . 0 % 1 9 . 0 % 1 7 . 8 %
S o u r c e : I S a - I d C , 2 0 0 8
The future of embedded software looks bright given the exceeding pressure on US companies for time-to-market and cost. Indian companies are investing in infrastructure and building domain expertise.
The industry is increasingly recognizing the importance of having IPs in their portfolios to showcase their technical strengths. Besides, the industry is also seeing an evolution in business models of the top players who are looking for ways to have revenue streams that are not linearly related to the employee strength. This effectively translates into moving up the value chain and driving margins.
The slowdown has definitely had an effect on Indian companies with the overall investments slowing down marginally but it is seen as more of a short-term effect. There are a number of new avenues opening up for the industry—localization being one. Dollar depreciation has directly affected the margins, but has also propelled the industry to look beyond certain geographies and explore opportunities for business in Europe and Japan.

40
IndIa SemIConduCtor and embedded deSIgn ServICe InduStry (2007-2010)market, teChnology and eCoSyStem analySIS
I S a - I d C r e p o r t , 2 0 0 8
This need in the market will give rise to a new set of players that have essentially been design services providers to the IDMs but will now start inching towards OEMs with an intention of complete solutions provisioning. Several service providers are investing heavily on acquiring end-to-end product design and development service expertise in order to provide increased services and to generate better margins. These increased capabilities will permit the services companies to market themselves more successfully as one-stop shops for product design and development.
These service providers will essentially come from the group of players that have developed extensive competencies in products over a period of time. However, the industry will continue to witness competition due to a low entry barrier and market growth.
As part of the overall disruption, IDMs will shift towards a fablite model. Till date, the major IDMs have continued to operate their own fabs and use the independent fabs only for minor designs or during peak demands. This has translated into a huge cyclic capex for the IDMs over the years. There will be a move to outsource the manufacturing by almost 30% to independent fabs.
Impact on the Embedded Design Services Industry
The service providers moving up the product value chain would need to understand the market needs and consumer behavior, which were so far an activity of the OEM. Much of the architecture, component and design platform decisions for outsourced design work in India were driven by the IDMs and OEMs. There will be an increased trend where Indian design services companies will make decisions about what components and microprocessor architectures to use, as well as influence the selection of real-time operating systems and embedded system development platforms. Newer business models, including risk-reward or royalty-based models will emerge from the existing TNM (Time and Material) and FP (Fixed Price) contracts, which have been the norm till date in the embedded design services industry. This will also isolate them from the competition in the run-rate market and give them access to higher billing rates due to increased value creation and for providing ready to manufacture designs.
End-to-end product design and development will also mean that the service providers will be the decision-makers in terms of choosing the technologies and IDMs. This will bring in a reverse dependence by the IDMs on the product/services companies. At the lower end of the spectrum, service providers will continue to depend on IDMs for revenues. Competition will also drive efficiencies within both IDMs and service providers in terms of manpower and operations.
IDMs will continue to undergo consolidation and acquire niche product IP companies in the ecosystem in order to move towards providing end-to-end chip solutions for the OEMs and product service providers. Due to the disruption, the IDMs will also have to rework on their strategy to bring in cost efficiencies and reduce the overall chip solution development cycle time. IDMs having design centers in India will feel the pressure of appreciating rupee and the rising costs of operations from India. This will lead them to realign, leverage and develop solutions for the local geographies.
The increasing importance of the product/service providers will also lead to fabs aligning with them, leading to the creation of “virtual fabs” for them. The virtual fabs will offer benefits to the product/service providers in terms of responsiveness, confidentiality, production flexibility and access to information. The virtual fabs will also provide other benefits in the areas of technology, quality and cost savings. The independent fabs will also have to implement initiatives to support the increasing requirements of the product/service provider as the process technologies steadily march towards decreasing nanometers.
India Semiconductor and Embedded Design Market Ver. 2.0
The India semiconductor and embedded design services market entered a growth phase in last couple of years and since then there has been no looking back. With an unprecedented growth in the last five years, the market is set to cross the US$ 7.37 billion in 2008.
But is this the end of the current growth phase? Will the market mature and plateau? There are significant new developments in the years ahead, feels the ISA-IDC analyst team. The nature of opportunities and engagements between design services ecosystem players would be quite different moving forward. Thus, in a manner of speaking, the domestic semiconductor and embedded design services industry enters a new phase – Ver. 2.0, continuing from where Ver. 1.0 left off.
What is this Ver. 2.0 and How will the overall India semiconductor and embedded design services industry start evolve in 2008? What will be the key dynamics of this phase of future growth?
To achieve its next phase of growth i.e. Ver.2.0, it requires to focus on following key growth vectors -
C h a p t e r 6 - e m b e d d e d d e S I g n S e r v I C e S m a r k e t e C o S y S t e m
Current Industry Practices
OEMs build brands and sell their own devices in the market and are characterized by their understanding of the market and buying behaviors. OEMs are heavily dependent on IDMs and fabless companies for providing the chip solution for their products. IDMs in turn outsource specifications-based design and development services to services companies that are responsible for VLSI design, board design and embedded software.
Services companies specialize in developing reference designs/applications on semiconductor chipsets. They concentrate their research and development resources on the end market without investing capital resources to stay current in semiconductor process technology and outsourcing the manufacturing to fabs.
The silicon manufacturing process was and is cost-prohibitive, especially for services companies. In this overall equation, the independent fabs have continued to grow. The cost of building a new fab normally ranges from US$ 2-3 billion. Today, the independent fabs are far and few between and have a virtual monopoly in the worldwide semiconductor manufacturing market due to the increased dependence of IDMs and the services companies on them.
Disruption in the Ecosystem
ISA & IDC believes that there will be a new world order based on the current momentum of the overall industry. There will be a disruption, which will see the entities shift their strategies, align and engage with each other within this ecosystem in a manner that will take them up one level in the overall product value chain.
OEMs continue to outsource in pursuit of increased flexibility, reduced manufacturing assets and greater focus on their core competencies. In addition, faster time-to-market and shortening product lifecycles will make the OEMs start looking for companies that can conceptualize and design complete products for them at the lowest possible costs.
OEMs are moving up the value chain with a definitive shift towards a service-driven model for a long-term engagement with their customers. OEMs will continue to reevaluate business strategies to compete effectively and to better leverage the growing capabilities of the service providers.
Figure 30 provides a likely scenario of re-alignment in the overall business model in the product value chain.
FIGURE 30: Scenario of Re-alignment in the Overall Business Model
Source: ISA -IDC, 2008
Market
Focus on core competenciesMarketing
Virtual
Fabs
Product conceptualizationMarket understandingRisk reward model
Cost efficienciesStaff Augmentation
Fablight M&ADrive InnovationAlignment with Product/Service providers
OEMs
OEMs OEMs
Products andDesign Service
Providers
Tier IIDesign Service
Providers

42
IndIa SemIConduCtor and embedded deSIgn ServICe InduStry (2007-2010)market, teChnology and eCoSyStem analySIS
I S a - I d C r e p o r t , 2 0 0 8
Introduction to DefinitionsOverall Market – Assumptions and Detailed DefinitionsCaptive UnitA firm that develops a total product or a module, which it brands and markets as a part of its (own) product development. The India unit does the work for the global organization.
Non-captive UnitA firm that provides third-party services/IP design and development in the areas of interest mentioned below for a fee and the activity undertaken is not for its own use.
Revenue The year 2007 was the base taken over which the revenue was estimated for the total design market. The revenue presented in this chapter for the design market reflects the aggregated monthly engineering costs across the design industry, both by the captive companies as well as the services provided by the non-captive companies in the area of VLSI, hardware/board design, and embedded software development. The forecast period for the total design market is from 2007 to 2010 unless otherwise specified.
Markets This study looks at the market for VLSI, hardware/board design, and embedded software development, both from the captive as well as the non-captive companies. Captive companies include integrated device manufacturers (IDMs), fabless companies, original equipment manufacturers (OEMs), and product development companies. Third-party independent companies providing VLSI design, hardware/board design and embedded, software services, EMS and original design manufacturers (ODMs) form a part of the non-captive segment.
Service The service includes VLSI design, hardware/board design and embedded software development offered by captive and non-captive.
Technology VLSI Design: Very large scale integration (VLSI) circuit design refers to technology by which it is possible to design and implement large circuits on silicon. These circuits have more than one million transistors. The VLSI technology has been successfully used to build microprocessors, signal processors, systolic arrays, large capacity memories, memory controllers, I/O controllers, and inter connection networks.
Hardware/board Design: Hardware/board design refers to the reference board for semiconductors and also includes boards designed as a part of new product development. It excludes board design that is part of the recurring engineering changes to the existing board.
Embedded Software: This can be as simple as a microcode instruction set of a microprocessor or as complex as the security software. Embedded software performs a specific function, which is not under the control of the primary user.
Average Engineering Man-month Rate The engineering man-month rate is the average of the per month per engineer rate of VLSI, hardware/board design and embedded software development as mentioned in the individual chapters. It depicts the average engineer rate per month for design and development activity in the semiconductor and embedded design industry in India.
VLSI – Assumptions and Detailed DefinitionsVLSI Revenue The revenue presented in this research service for the VLSI design market reflects the total engineering month costs incurred (excluding the EDA tools) through VLSI design work executed by the offshore centers of captive companies and the non-captive companies.
I n t r o d u C t I o n t o d e F I n I t I o n S
ManpowerFocus on increasing productivity: There is strong a strong need to increase productivity given the rising cost structure �and depreciating dollar. Organizations are looking towards reducing management cost in the overall project cost by having a right mix in the project team. There will be a need to adopt parameters to define workforce productivity. Organizations are also looking at revenue as a common benchmark to measure productivity.
Need to create readily deployable engineering workforce: Industry associations need to work more closely with academia �to upgrade the existing curriculum and industry oriented courses in order to create readily deployable engineering workforce.
Focus on developing high end skills: As the semiconductor and embedded design services matures with increasing �product complexity, more and more high-end skillsets will be required for the Indian captive and non-captive players to move up the value chain. Organizations will have to spend considerable time and effort to create/upgrade the skills required to move up the value chain.
Moving up the Value ChainFocus on end-to-end product development: The captive and non-captive semiconductor and embedded design services �players have to develop end to end systems knowledge by concentrating more on the domain knowledge and providing end-to-end design services to their customers.
Invest in R&D/IP development: Investments in R&D/IP development will help in creating to royalty-based models as well �as high-end expertise in specific domains.
Develop India specific products: Indian consumer market has grown and is further showing high rate of growth. Having �end-to-end product development and product roll-outs for Indian market along with a local manufacturing ecosystem, which will boost this industry.
Partner with OEMs: To move up the value chain, there is a need to understand the market needs and consumer behavior, �which was so far an activity of the OEM. As much of the architecture, component and design platform decisions for outsourced design work in India were driven by the IDMs and OEMs. To influence decisions about which components use, companies have to partner with OEMs to understand their business model, which will help evolve to next level in the value chain.
Cost StructureCost Management: The major cost elements especially infrastructure and salary costs have been constantly increasing �in last few years.A further rise in these cost elements will make it difficult to survive and organization will either increase productivity or move up the value chain.
Manage the dollar impact: To minimize the impact of the depreciating U.S. dollar, design services need to look at India �and other geographies like Europe and Japan etc. as target markets and also to reduce their exposure to dollars.

44
IndIa SemIConduCtor and embedded deSIgn ServICe InduStry (2007-2010)market, teChnology and eCoSyStem analySIS
I S a - I d C r e p o r t , 2 0 0 8
VLSI Services VLSI design: This includes the services provided by captive companies to their parent company as an offshore center and by non-captive companies as part of their services’ model.
Digital: This includes all the services offered for a digital chip from specifications till tape out.
Analog: This includes all the services offered for an analog chip from specifications till tape out.
Mixed signal: This includes all the services offered for a mixed signal chip from specifications till tape out.
Design ProjectsThe design projects include both new and derivatives design done by captive and non-captive.
Hardware/Board -Assumptions and Detailed DefinitionsRevenue The base year for which revenue estimates for hardware/board design market are given is 2007. The revenue presented in this chapter for the hardware/board design market reflects the engineering month costs incurred for hardware/board design both by captive companies as well as services provided by non-captive companies. The forecast period for the hardware/board design market is from 2007-2010, unless otherwise specified.
Markets This study looks at the markets for hardware/board design companies from reference board designers and product developers to hardware service providers and electronic manufacturing service (EMS) companies.
Services The services offered by the hardware/board design market participants include digital design, analog design, board layout and routing, design for manufacturability, system/board testing and system productization.
Technology Board Design: Low and medium complexity boards in embedded technologies, x86, ethernet switches, digital video boards, field programmable gate array (FPGA) validation boards, and standard form-factor boards.
PCB Design: Library services, board component placement, manual routing, auto routing, Gerber processing and CAM services
Embedded Software -Assumptions and Detailed DefinitionsRevenue The base year for which revenue estimates for the embedded software market are given is 2007. The revenue presented in this research service for the embedded software market reflects the total engineering month costs incurred (excluding the EDA tools) through embedded software development work executed by the offshore centers of captive companies and the non-captive companies.
Markets This report looks at the market available for embedded software development companies for both captive and non-captive companies. Captive companies include integrated device manufacturers (IDMs), fabless companies, original equipment manufacturers (OEMs), and product companies. The VLSI, hardware/board design services providers, electronic manufacturing services (EMS) and original design manufacturers (ODMs) form a part of the non-captive segment.
Services The services offered by the embedded software development market participants include developing software for integrated circuits (ICs), boards and systems.
appendix I
Acronyms
ASIC: Application-specific Integrated Circuit
CAD: Computer Aided Design
EDA: Electronic Design Automation
EMS: Electronic Manufacturing Services
GPS: Global Positioning Systems
GUI: Graphic User Interface
IC: Integrated Circuit
IDM: Integrated Device Manufacturer
OEM: Original Equipment Manufacturer
PCB: Printed Circuit Boards
SoC: System on Chip
VLSI: Very Large-Scale Integration
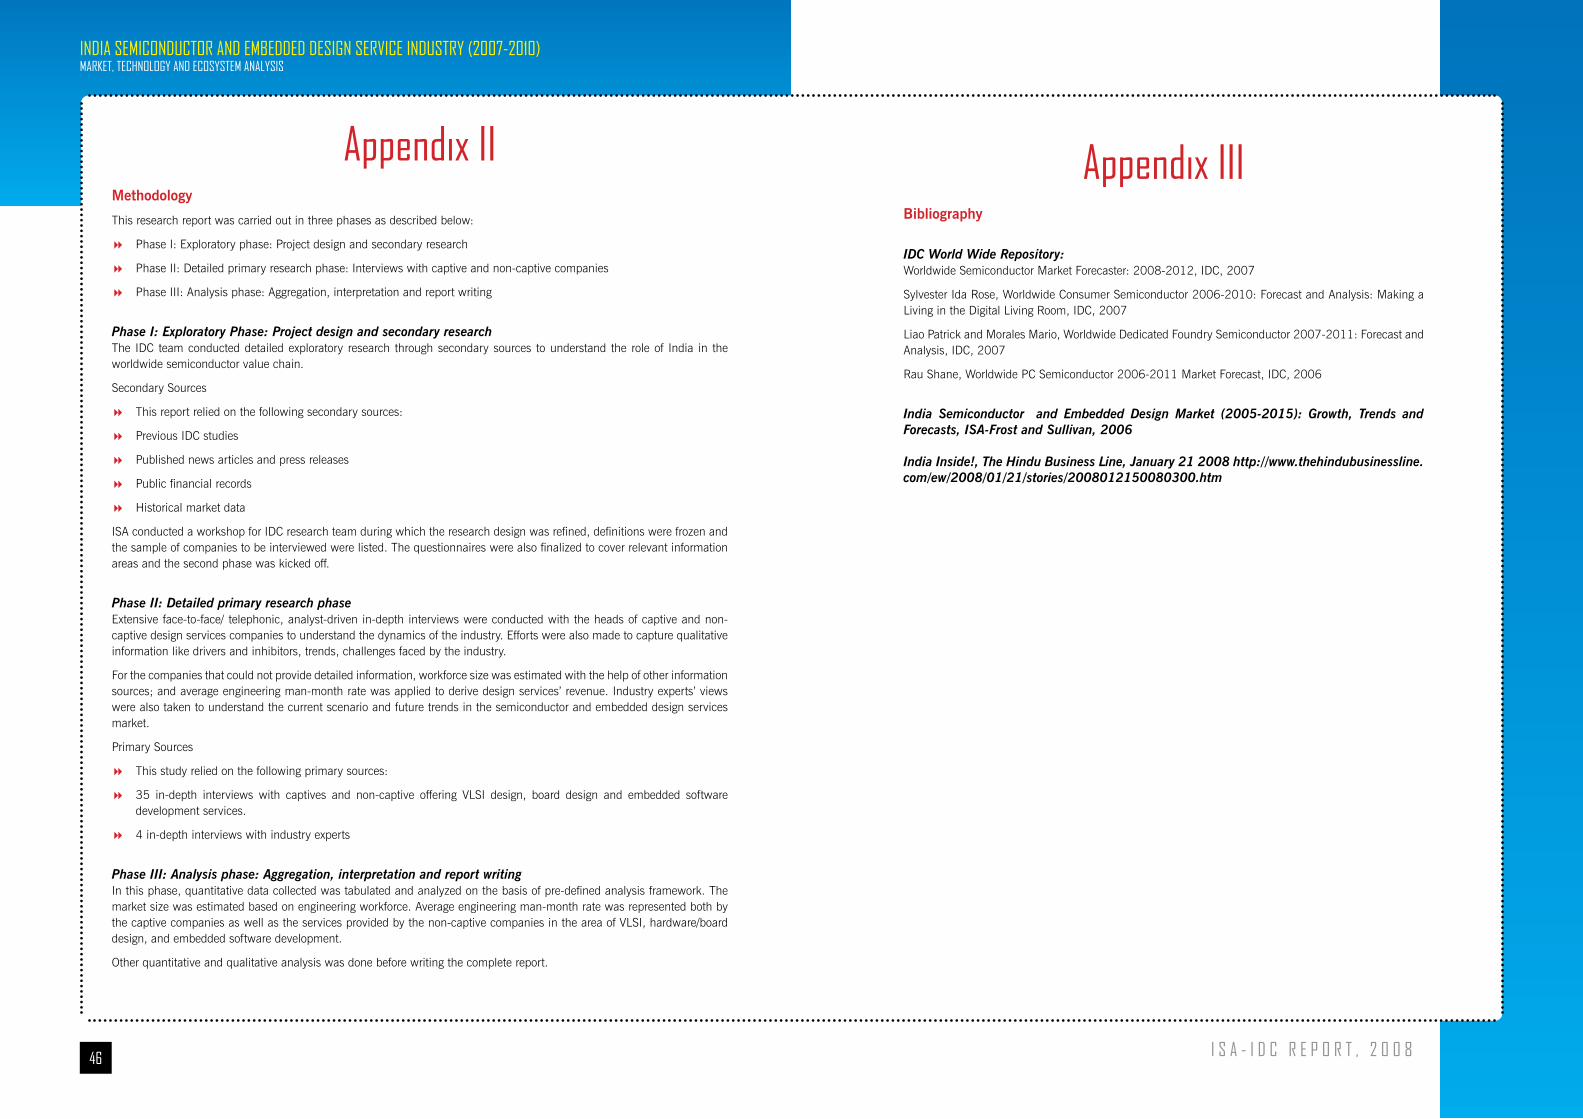
46
IndIa SemIConduCtor and embedded deSIgn ServICe InduStry (2007-2010)market, teChnology and eCoSyStem analySIS
I S a - I d C r e p o r t , 2 0 0 8
appendix IIMethodology
This research report was carried out in three phases as described below:
Phase I: Exploratory phase: Project design and secondary research �
Phase II: Detailed primary research phase: Interviews with captive and non-captive companies �
Phase III: Analysis phase: Aggregation, interpretation and report writing �
Phase I: Exploratory Phase: Project design and secondary researchThe IDC team conducted detailed exploratory research through secondary sources to understand the role of India in the worldwide semiconductor value chain.
Secondary Sources
This report relied on the following secondary sources: �
Previous IDC studies �
Published news articles and press releases �
Public financial records �
Historical market data �
ISA conducted a workshop for IDC research team during which the research design was refined, definitions were frozen and the sample of companies to be interviewed were listed. The questionnaires were also finalized to cover relevant information areas and the second phase was kicked off.
Phase II: Detailed primary research phaseExtensive face-to-face/ telephonic, analyst-driven in-depth interviews were conducted with the heads of captive and non-captive design services companies to understand the dynamics of the industry. Efforts were also made to capture qualitative information like drivers and inhibitors, trends, challenges faced by the industry.
For the companies that could not provide detailed information, workforce size was estimated with the help of other information sources; and average engineering man-month rate was applied to derive design services’ revenue. Industry experts’ views were also taken to understand the current scenario and future trends in the semiconductor and embedded design services market.
Primary Sources
This study relied on the following primary sources: �
35 in-depth interviews with captives and non-captive offering VLSI design, board design and embedded software �development services.
4 in-depth interviews with industry experts �
Phase III: Analysis phase: Aggregation, interpretation and report writingIn this phase, quantitative data collected was tabulated and analyzed on the basis of pre-defined analysis framework. The market size was estimated based on engineering workforce. Average engineering man-month rate was represented both by the captive companies as well as the services provided by the non-captive companies in the area of VLSI, hardware/board design, and embedded software development.
Other quantitative and qualitative analysis was done before writing the complete report.
appendix IIIBibliography
IDC World Wide Repository:Worldwide Semiconductor Market Forecaster: 2008-2012, IDC, 2007
Sylvester Ida Rose, Worldwide Consumer Semiconductor 2006-2010: Forecast and Analysis: Making a Living in the Digital Living Room, IDC, 2007
Liao Patrick and Morales Mario, Worldwide Dedicated Foundry Semiconductor 2007-2011: Forecast and Analysis, IDC, 2007
Rau Shane, Worldwide PC Semiconductor 2006-2011 Market Forecast, IDC, 2006
India Semiconductor and Embedded Design Market (2005-2015): Growth, Trends and Forecasts, ISA-Frost and Sullivan, 2006
India Inside!, The Hindu Business Line, January 21 2008 http://www.thehindubusinessline.com/ew/2008/01/21/stories/2008012150080300.htm
