indian household investors
TRANSCRIPT
INDIAN HOUSEHOLD INVESTORS SURVEY – 2004
The Changing Market Environment
Investors’ Preferences
Problems
Policy Issues
Sponsored by:
Ministry of Company Affairs Investor Education & Protection Fund
Government of India
Conducted by: Society for Capital Market Research & Development
10-D, BigJo’s Tower Netaji Subhash Place
Pitampura, Delhi – 110 034
Revised Version
June 2005

(i)
Survey Team
Dr. L. C. Gupta, Director
Naveen Jain, M.Com, M.Phil, Coordinator
Utpal K. Choudhury, MBA, Programmer
Sachit Gupta, MIB, Senior Research Associate
Raksha Sharma, LL.B., PGDBM, Data Supervisor
Poornima Kaushik, M.A. (Eco.), Research Associate
Monika Chopra, Computer In-charge
Manoj Kumar Tyagi, Computer Operator
Sambhav Jain, Senior Research Associate

(ii)
PREFACE
1. Investor protection is as important an issue in India today as
it was in 1980s and 1990s but the whole complexion of the
problem has changed.
2. The structure as well as the functioning of the Indian
securities market has been transformed beyond recognition
since the 1990s. The profile of the investing public, the
investment choices available, the market environment and the
nature of problems bothering the investors are substantially
different today from what they were 10-20 years ago.
3. The Ministry of Company Affairs had sponsored this massive
study under the Investor Education and Protection Fund
(IEPF) with the object of creating a deeper understanding of
the ordinary investors’ concerns, problems and needs. The
study provides a firm foundation of facts for formulating
policies for the protection and promotion of the small
investors’ interest. It will hopefully be of wide interest to all
those interested in the development and reform of the Indian
capital market.
Acknowledgements
4. The idea of this study originated in the course of my
discussions with Dr. (Mrs.) Sheela Bhide, formerly Joint
Secretary in-charge of IEPF, and Ms. Sucheta Dalal,
well-known investigative journalist and writer. We have

(iii)
received staunch support and valuable guidance from
Mrs. Komal Anand, Secretary, Ministry of Company Affairs.
She has taken keen personal interest in the study and is
particularly eager to expand investor education programmes
countrywide.
5. We are grateful for the kind help provided by Mr. Y.S. Mallik
who succeeded Dr. (Mrs.) Bhide as Joint Secretary, in-charge
of the IEPF. We greatly appreciate the encouragement and
many useful suggestions offered by members of the IEPF
Committee.
6. The distinguished members of the Society’s Board of
Governors have taken keen interest in this study. I had the
benefit of their valuable comments and suggestions on the
interim findings of the survey. I am specially indebted to
Chairman Dr. Abid Hussain for being always ready to spare
his valuable time for the affairs of the Society and to muster
support for it.
7. The success of the massive household investors survey 2004,
the largest ever of its kind, owes much to the dogged
perseverance shown by our interviewers, who were mostly
drawn from teachers / researchers at Universities / colleges
and other professionals. It was because of their patience and
persuasiveness that we were able to collect private financial
data from households. There exists widespread reluctance to
provide such private information to any outsiders. This is a

(iv)
well-known problem in this kind of surveys. Almost 200
interviewers were involved. We owe sincere thanks to them.
8. Every completed questionnaire was scrutinised to identify
deficiencies, inconsistencies, etc., and to get them rectified.
About 10% of the questionnaires had to be rejected due to
deficiencies. This work was looked after by our Senior
Research Associate Mr. Sachit Gupta and by Data Supervisor
Mrs. Raksha Sharma. The massive task of data entry and
processing was carried out very ably by Research Associate
Ms. Poornima Kaushik, Computer In-charge Ms. Monika
Chopra, and Mr. Manoj Tyagi, Computer Operator. The
entire Computer Programming for the project was done with
great ingenuity and versatility by Mr. Utpal K. Choudhury.
Both Ms. Poornima and Ms. Monika displayed great patience
in preparing the tables, charts and several drafts of the
Report. Mr. Manoj and Mr. Jayprakash Narayan looked after
the heavy postal work. The excellent cooperation extended
by all staff members lightened my burden.
9. A final word of disclaimer. The responsibility for the facts
presented and the views expressed in this report is entirely
that of the undersigned and not that of the Ministry of
Company Affairs who had sponsored the study.
L. C. GUPTA
Director Society for Capital Market Research & Development

(v)
CONTENTS
Chapter
Page
Preface ii-iv List of Tables x-xv List of Charts xvi-xviii Acronyms / Indian Numerals xix Executive Summary 1-20
1. INTRODUCTION
21-28
Objective Methodology and sampling Two-stage questionnaire Household as the economic unit Sampling procedure Sample size and characteristics Chapter scheme
2. THE HOUSEHOLD INVESTORS’ MAIN WORRIES ABOUT STOCK MARKET
29-42
Introduction
Collapse of capital raising function Recent bull market Probing the retail investors’ mind
An Over-view of the Findings
Price Manipulation and Volatility
Market’s erratic behaviour Effect on genuine investors Wide intra-day movements Delivery-based trading
Concluding Comments
Wake-up call for Indian authorities What the economists say

(vi)
Chapter
Page
3. INVESTORS’ PERCEPTIONS ABOUT
CORPORATE GOVERNANCE
43-52
Why important Key questions Indian situation in international perspective Complexity of Indian situation Biggest corporate - governance challenge Institutional shareholders council
4. DELISTED COMPANIES
53-59
Violation of listing rules Estimate of affected retail investors Need for further research Legal changes needed
5. INDIAN MUTUAL FUND INDUSTRY AND THE RETAIL INVESTOR
60-94
Introduction
Mutual funds as product innovation Layout of the chapter
Empirical Evidence on Retail
Investors’ Preferences
Multi-dimensional analysis Investment types owned by households Future intentions Households’ past experience
of investment types Investment game
The Changing Structure of
Indian MF Industry
US-64 crisis and after The residual UTI
(vii)
Chapter
Page
Conclusions : A Critique of Mutual Funds
A contradiction Investors’ unhappy experiences Managerial incompetence,
malpractices and herd behaviour Unfamiliarity factor What should be done? The maturing of retail investors How retail investors “beat”
the mutual funds Final comment Appendix to Chapter 5
6. SHARE PORTFOLIO PRACTICES
OF RETAIL INVESTORS
95-116
New light on share portfolio diversification practices
Diversification and “market risk” Typical diversification Effect of investor’s income and age Amount invested in portfolio companies Advantages of narrow diversification Market “risk” turned into
market opportunity” Diversification of demat shareholding Length of shareholding period Indian middle-class dominantly
long-term investors
7. THE CHANGING PATTERN OF HOUSEHOLDS’ INVESTMENT PREFERENCES
117-162
Introduction
General Historical perspective
(viii)
Chapter
Page
Empirical Data on Households’ Investment Preferences
Market penetration of investment types Investment game to identify preferences Remarkable closeness Future intention Effect of fall in interest rates on
attitude towards equity shares Effect of holding period on risk and return
The Maturing of India’s Retail
Investor Population
Shareowners’ age qua shareowners Effect of income and age Impact on share diversification Emergence of discerning retail investors How maturity has made a difference Appendix to Chapter 7
8. SMALL INVESTORS’ PROBLEMS
WITH DEMAT SYSTEM
163-178
Small long-term investors bear the brunt The original purpose Problem recognized but action awaited How the depository system works How competition is obstructed Most retail investors remain
outside the demat system Demat in the context of investors’ strategies Retail investors’ specific complaints Concluding comments
9. INVESTOR EDUCATION
179-189
The need Implications of socio-economic changes Delivery mechanism and method Investor education: U.S. practices

(ix)
Chapter
Page
Importance of starting early Evolving a systematic training
methodology Investment games as training tools Behaviour of returns from share investment Emphasize the key factors Investors’ suggestions Topics for education programmes Annexure to Chapter 9
10. WRAP-UP OF STUDY
190-197
(x)
LIST OF TABLES
Table
Page1.1 SAMPLE COMPOSITION BY HOUSEHOLD INCOME
(Questionnaire - 1 & 2)
26
1.2 SAMPLE COMPOSITION BY AGE OF HOUSEHOLD HEAD (Questionnaire - 1 & 2)
26
1.3 SAMPLE COMPOSITION BY OCCUPATION (Questionnaire 1)
27
1.4 SAMPLE COMPOSITION BY EDUCATION (Questionnaire 1)
27
1.5 STATE-WISE DISTRIBUTION OF SAMPLE HOUSEHOLDS
28
2.1 BIGGEST WORRIES OF HOUSEHOLD INVESTORS ABOUT INDIAN STOCK MARKET (Income-classwise Analysis)
33
2.2 BIGGEST WORRIES OF HOUSEHOLD INVESTORS ABOUT INDIAN STOCK MARKET (Age-classwise Analysis)
34
3.1 DO YOU BELIEVE THAT INDIAN COMPANY MANAGEMENTS ARE HONEST AND SINCERE TOWARDS THEIR SHAREHOLDERS? (Income-classwise Analysis)
50
3.2 DO YOU BELIEVE THAT INDIAN COMPANY MANAGEMENTS ARE HONEST AND SINCERE TOWARDS THEIR SHAREHOLDERS? (Age-classwise Analysis)
50
3.3 DO YOU BELIEVE THAT SHAREHOLDERS CAN RELY ON COMPANY AUDITORS IN PREVENTING FINANCIAL IRREGULARITIES BY COMPANY MANAGEMENTS? (Income-classwise Analysis)
51
3.4 DO YOU BELIEVE THAT SHAREHOLDERS CAN RELY ON COMPANY AUDITORS IN PREVENTING FINANCIAL IRREGULARITIES BY COMPANY MANAGEMENTS? (Age-classwise Analysis)
51

(xi)
Table
Page
3.5 DO YOU BELIEVE THAT INDIAN COMPANY MANAGEMENTS ARE NOW TAKING MORE CARE OF THE SHAREHOLDERS’ INTERESTS THAN BEFORE? (Income-classwise Analysis)
52
3.6 DO YOU BELIEVE THAT INDIAN COMPANY MANAGEMENTS ARE NOW TAKING MORE CARE OF THE SHAREHOLDERS’ INTERESTS THAN BEFORE? (Age-classwise Analysis)
52
4.1 PERCENTAGE OF HOUSEHOLDS WHO ARE SHAREHOLDERS IN ANY DELISTED COMPANIES CONTROLLED BY INDIAN MANAGEMENTS
58
4.2 PERCENTAGE OF HOUSEHOLDS WHO HAVE SUFFERED IN VARIOUS WAYS DUE TO BEING SHAREHOLDERS IN DELISTED COMPANIES
59
5.1 PERCENTAGE OF TOTAL SAMPLE HOUSEHOLDS OWNING VARIOUS CAPITAL MARKET INSTRUMENTS
63
5.2 ANALYSIS OF TOTAL SAMPLE HOUSEHOLDS ACCORDING TO HOW LIKELY THEY ARE TO MAKE NET ADDITION TO INVESTMENTS IN THE FOLLOWING TYPES DURING NEXT ONE YEAR?
65
5.3 ANALYSIS OF HOUSEHOLD INVESTORS ACCORDING TO HOW SATIFACTORY WAS THEIR EXPERIENCE OF INVESTING IN VARIOUS INVESTMENT TYPES
66
5.4 ALLOCATION OF A NOTIONAL SUM OF RS. 100,000 BY SAMPLE HOUSEHOLDS AMONG SPECIFIC INVESTMENT TYPES
68
5.5 ALLOCATION OF A NOTIONAL SUM OF RS. 100,000 BY SAMPLE HOUSEHOLDS AMONG THREE FORMS OF SHARE INVESTMENT
70
5.6 PERCENTAGE ALLOCATION OUT OF A NOTIONAL SUM OF RS. 1,00,000 AMONG EQUITY INVESTMENT FORMS BY A SAMPLE OF HOUSEHOLD INVESTORS
71
5.7 AMOUNT OF ASSETS UNDER MANAGEMENT OF MUTUAL FUNDS AS ON 30TH JUNE OF 1999 TO 2004
77
(xii)
Table
PageA5 (1) ANALYSIS OF HOUSEHOLD INVESTORS ACCORDING
TO HOW SATISFACTORY WAS THEIR EXPERIENCE OF INVESTING IN: EQUITY SHARES (Income-classwise Analysis)
87
A5 (2) ANALYSIS OF HOUSEHOLD INVESTORS ACCORDING TO HOW SATISFACTORY WAS THEIR EXPERIENCE OF INVESTING IN: EQUITY SHARES (Age-classwise Analysis)
88
A5 (3) ANALYSIS OF HOUSEHOLD INVESTORS ACCORDING TO HOW SATISFACTORY WAS INVESTOR’S EXPERIENCE OF INVESTING IN : MUTUAL FUND EQUITY / GROWTH SCHEMES (Income-classwise Analysis)
89
A5 (4) ANALYSIS OF HOUSEHOLD INVESTORS ACCORDING TO HOW SATISFACTORY WAS INVESTOR’S EXPERIENCE OF INVESTING IN : MUTUAL FUND EQUITY / GROWTH SCHEMES (Age-classwise Analysis)
90
A5 (5) ANALYSIS OF HOUSEHOLD INVESTORS ACCORDING TO HOW SATISFACTORY WAS INVESTOR’S EXPERIENCE OF INVESTING IN : MUTUAL FUND INCOME SCHEMES (Income-classwise Analysis)
91
A5 (6) ANALYSIS OF HOUSEHOLD INVESTORS ACCORDING TO HOW SATISFACTORY WAS INVESTOR’S EXPERIENCE OF INVESTING IN : MUTUAL FUND INCOME SCHEMES (Age-classwise Analysis)
92
A5 (7) ANALYSIS OF HOUSEHOLD INVESTORS ACCORDING TO HOW SATISFACTORY WAS INVESTOR’S EXPERIENCE OF INVESTING IN : NON-GOVT COMPANY BONDS (Income-classwise Analysis)
93
A5 (8) ANALYSIS OF HOUSEHOLD INVESTORS ACCORDING TO HOW SATISFACTORY WAS INVESTOR’S EXPERIENCE OF INVESTING IN : NON-GOVT. COMPANY BONDS (Age-classwise Analysis)
94

(xiii)
Table Page6.1 NUMBER OF COMPANIES REPRESENTED IN
INDIVIDUAL HOUSEHOLDS’ SHARE PORTFOLIOS (Income-classwise Analysis)
111
6.2 NUMBER OF COMPANIES REPRESENTED IN INDIVIDUAL HOUSEHOLDS’ SHARE PORTFOLIOS (Age-classwise Analysis)
112
6.3 NUMBER OF COMPANIES REPRESENTED IN INDIVIDUAL HOUSEHOLDS’ SHAREHOLDINGS HELD IN DEMAT FORM (Income-classwise Analysis)
113
6.4 NUMBER OF COMPANIES REPRESENTED IN INDIVIDUAL HOUSEHOLDS’ SHAREHOLDINGS HELD IN DEMAT FORM (Age-classwise Analysis)
114
6.5 RETAIL INVESTORS’ PREFERRED STRATEGY REGARDING SHARE INVESTMENT IN TERMS OF TIME HORIZON (Income- classwise Analysis)
115
6.6 RETAIL INVESTORS’ PREFERRED STRATEGY REGARDING SHARE INVESTMENT IN TERMS OF TIME HORIZON
(Age-classwise Analysis)
116
7.1 PERCENTAGE OF HOUSEHOLDS OWNING VARIOUS CAPITAL MARKET INSTRUMENTS (Income-classwise Analysis)
145
7.2 PERCENTAGE OF HOUSEHOLDS OWNING VARIOUS CAPITAL MARKET INSTRUMENTS (Age-classwise Analysis)
146
7.3 PERCENTAGE OF SAMPLE HOUSEHOLD INVESTORS WHO CHOSE PARTICULAR INVESTMENT TYPES FOR ALLOCATING A NOTIONAL SUM OF RS. 100,000 (Income-classwise Analysis)
147
7.4 PERCENTAGE OF SAMPLE HOUSEHOLD INVESTORS WHO CHOSE PARTICULAR INVESTMENT TYPES FOR ALLOCATING A NOTIONAL SUM OF RS. 100,000 (Age-classwise Analysis)
148
(xiv)
Table
Page7.5 PERCENTAGE OF A NOTIONAL SUM OF RS 1,00,000
ALLOCATED BY SAMPLE HOUSEHOLD INVESTORS TO VARIOUS INVESTMENT TYPES (Income-classwise Analysis)
149
7.6 PERCENTAGE OF A NOTIONAL SUM OF RS 1,00,000 ALLOCATED BY SAMPLE HOUSEHOLD INVESTORS TO VARIOUS INVESTMENT TYPES (Age-classwise Analysis)
150
7.7 ANSWERS TO QUESTION: HAS FALL IN INTEREST RATE MADE SHARE INVESTMENT MORE ATTRACTIVE TO YOU? (Income-classwise Analysis)
151
7.8 ANSWERS TO QUESTION: HAS FALL IN INTEREST RATE MADE SHARE INVESTMENT MORE ATTRACTIVE TO YOU? (Age-classwise Analysis)
152
7.9 INDICATE THE YEAR/PERIOD IN WHICH YOU (i.e. YOUR HOUSEHOLD) PURCHASED SHARES FOR THE FIRST TIME IN YOUR LIFE (Income-classwise Analysis)
153
7.10 INDICATE THE YEAR/PERIOD IN WHICH YOU (i.e. YOUR HOUSEHOLD) PURCHASED SHARES FOR THE FIRST TIME IN YOUR LIFE (Age-classwise Analysis)
154
A7 (1) ANALYSIS OF HOUSEHOLD INVESTORS ACCORDING TO HOW LIKELY THEY ARE TO MAKE NET ADDITION DURING NEXT ONE YEAR TO INVESTMENT IN: EQUITY SHARES (Income-classwise Analysis)
155
A7 (2)
ANALYSIS OF HOUSEHOLD INVESTORS ACCORDING TO HOW LIKELY THEY ARE TO MAKE NET ADDITION DURING NEXT ONE YEAR TO INVESTMENT IN: EQUITY SHARES (Age-classwise Analysis)
156
A7 (3) ANALYSIS OF HOUSEHOLD INVESTORS ACCORDING TO HOW LIKELY THEY ARE TO MAKE NET ADDITION DURING NEXT ONE YEAR TO INVESTMENT IN: MUTUAL FUND EQUITY / GROWTH SCHEMES (Income-classwise Analysis)
157

(xv)
Table Page
A7 (4)
ANALYSIS OF HOUSEHOLD INVESTORS ACCORDING TO HOW LIKELY THEY ARE TO MAKE NET ADDITION DURING NEXT ONE YEAR TO INVESTMENT IN: MUTUAL FUND EQUITY / GROWTH SCHEMES (Age-classwise Analysis)
158
A7 (5)
ANALYSIS OF HOUSEHOLD INVESTORS ACCORDING TO HOW LIKELY THEY ARE TO MAKE NET ADDITION DURING NEXT ONE YEAR TO INVESTMENT IN: MUTUAL FUND INCOME SCHEMES (Income-classwise Analysis)
159
A7 (6)
ANALYSIS OF HOUSEHOLD INVESTORS ACCORDING TO HOW LIKELY THEY ARE TO MAKE NET ADDITION DURING NEXT ONE YEAR TO INVESTMENT IN: MUTUAL FUND INCOME SCHEMES (Age-classwise Analysis)
160
A7 (7)
ANALYSIS OF HOUSEHOLD INVESTORS ACCORDING TO HOW LIKELY THEY ARE TO MAKE NET ADDITION DURING NEXT ONE YEAR TO INVESTMENT IN: PRIVATE SECTOR COMPANY BONDS (Income-classwise Analysis)
161
A7 (8)
ANALYSIS OF HOUSEHOLD INVESTORS ACCORDING TO HOW LIKELY THEY ARE TO MAKE NET ADDITION DURING NEXT ONE YEAR TO INVESTMENT IN: PRIVATE SECTOR COMPANY BONDS (Age-classwise Analysis)
162
8.1 PER CENT OF PHYSICAL SHAREHOLDERS IN A SAMPLE OF 130 COMPANIES CLASSIFIED BY MARKET CAPITALISATION (Around Aug – Sep. 2003)
169
8.2 PER CENT OF PHYSICAL SHAREHOLDERS IN MAJOR INDIAN COMPANIES (Around Aug – Sep 2003)
170
8.3 REASONS GIVEN BY HOUSEHOLD SHAREOWNERS FOR NOT CONVERTING THEIR SHAREHOLDINGS INTO DEMAT FORM (Income- classwise Analysis)
177
8.4 REASONS GIVEN BY HOUSEHOLD SHAREOWNERS FOR NOT CONVERTING THEIR SHAREHOLDINGS INTO DEMAT FORM (Age-classwise Analysis)
178
10.1 HOUSEHOLD INVESTORS’ OVERALL PERCEPTIONS ABOUT REGULATION OF CAPITAL MARKET IN INDIA
197
(xvi)
LIST OF CHARTS
Charts
Page
5.1 PERCENTAGE OF TOTAL SAMPLE HOUSEHOLDS OWNING VARIOUS CAPITAL MARKET INSTRUMENTS
63
5.2 INTENDING INVESTORS
65
5.3 PERCENTAGE OF HOUSEHOLDS WHO HAD SATISFACTORY PAST EXPERIENCE WITH SPECIFIC INVESTMENT TYPES
66
5.4 INVESTMENT GAME: AMOUNT ALLOCATED TO DIRECT SHAREHOLDING Vs. MFs
69
5.5 ALLOCATION BETWEEN DIRECT AND INDIRECT INVESTMENT IN EQUITY SHARES
70
5.6A PER CENT OF SUM OF RS. 1,00,000 ALLOCATED BY HOUSEHOLDS AMONG PARTICULAR FORMS OF EQUITY INVESTMENT (Income-classwise Analysis)
72
5.6B PER CENT OF SUM OF RS. 1,00,000 ALLOCATED BY HOUSEHOLDS AMONG PARTICULAR FORMS OF EQUITY INVESTMENT (Age-classwise Analysis)
73
5.7 PER CENT OF ASSETS UNDER MANAGEMENT UNDER VARIOUS TYPES OF MUTUAL FUND SCHEMES FOR SELECTED DATES
78
6.1 PERCENT DISTRIBUTION OF SHARE-OWNING HOUSEHOLDS BY NUMBER OF COMPANIES IN HOUSEHOLDS' SHARE PORTFOLIOS By Income-class of household head
97
6.2 PERCENT DISTRIBUTION OF SHARE-OWNING HOUSEHOLDS BY NUMBER OF COMPANIES IN HOUSEHOLDS' SHARE PORTFOLIOS By Age-class of households
98
6.3 DIVERSIFICATION OF HOUSEHOLDS’ SHARE PORTFOLIOS: ALL SHAREHOLDINGS VIS-À-VIS DEMAT SHAREHOLDINGS
104
(xvii)
Charts
Page
6.4 RETAIL SHARE INVESTORS’ TIME HORIZON (Income-classwise Analysis)
107
6.5 RETAIL SHARE INVESTORS’ TIME HORIZON (Age-classwise Analysis)
108
7.1 PERCENT OF HOUSEHOLDS OWNING PARTICULAR INVESTMENT TYPES, SURVEY 2004 (Income-classwise Analysis – 1st Method)
121
7.1A PERCENT OF HOUSEHOLDS OWNING VARIOUS CAPITAL MARKET INSTRUMENTS, SURVEY 2004 (Income-classwise Analysis - 2nd Method)
122
7.2 PERCENT OF HOUSEHOLDS OWNING PARTICULAR INVESTMENT TYPES, SURVEY 2004 (Age-classwise Analysis – 1st Method)
123
7.2A PERCENT OF HOUSEHOLDS OWNING VARIOUS CAPITAL MARKET INSTRUMENTS, SURVEY 2004 (Age-classwise Analysis - 2nd Method)
124
7.3 PER CENT OF HOUSEHOLDS WHO CHOSE PARTICULAR INVESTMENT TYPES WHILE ALLOCATING A SUM RS. 1,00,000 (Income-classwise analysis)
128
7.4 PER CENT OF HOUSEHOLDS WHO CHOSE PARTICULAR INVESTMENT TYPES WHILE ALLOCATING A SUM RS. 1,00,000 (Age-classwise analysis)
129
7.5 PERCENT OF A SUM OF RS. 1,00,000 ALLOCATED BY HOUSEHOLDS TO VARIOUS INVESTMENT TYPES (Income-classwise Analysis – 1st Method)
131
7.5A PERCENT OF A NOTIONAL SUM OF RS. 1,00,000 ALLOCATED BY SAMPLE HOUSEHOLD INVESTORS TO VARIOUS INVESTMENT TYPES (Income-classwise Analysis - 2nd Method)
132
7.6 PERCENT OF A SUM OF RS. 1,00,000 ALLOCATED BY HOUSEHOLDS TO VARIOUS INVESTMENT TYPES (Age-classwise Analysis – 1st Method)
133

(xviii)
Charts
Page
7.6A PERCENT OF A NOTIONAL SUM OF RS. 1,00,000 ALLOCATED BY SAMPLE HOUSEHOLD INVESTORS TO VARIOUS INVESTMENT TYPES (Age-classwise Analysis - 2nd Method)
134
7.7 ANSWERS TO QUESTION : HAS FALL IN INTEREST RATE MADE SHARE INVESTMENT MORE ATTRACTIVE TO YOU? (Income-classwise Analysis excluding ‘can’t say’ cases)
137
7.8 ANSWERS TO QUESTION: HAS FALL IN INTEREST RATE MADE SHARE INVESTMENT MORE ATTRACTIVE TO YOU? (Age-classwise Analysis excluding ‘can’t say’ cases)
138
7.9 THE YEAR / PERIOD IN WHICH THE SAMPLE HOUSEHOLDS HAD PURCHASED SHARES FIRST TIME IN LIFE (Income-classwise Analysis)
140
7.10 THE YEAR / PERIOD IN WHICH THE SAMPLE HOUSEHOLDS HAD PURCHASED SHARES FIRST TIME IN LIFE (Age-classwise Analysis)
141

(xix)
ACRONYMS
AMFI Association of Mutual Funds in India BSE Bombay Stock Exchange B/S Balance Sheet CDSL Central Depository Services Limited CEO Chief Executive Officer DP Depository Participant DTCC Depository Trust and Clearing Corporation EPFO Employees Provident Fund Organisation EPS Earning Per Share FERA Foreign Exchange Regulation Act FFS Flat Fee Structure FII Foreign Institutional Investor GDP Gross Domestic Product GOI Government of India HNI High Networth Individuals IDBI Industrial Development Bank of India IEPF Investor Education and Protection Fund IPO Initial Public Offering MCA Ministry of Company Affairs MF Mutual Fund NAV Net Asset Value NCAER National Council of Applied Economic Research NSDL National Securities Depository Limited NSE National Stock Exchange OECD Organisation for Economic Co-operation and Development P/E Ratio Price to Earnings Ratio PSU Public Sector Undertaking SCMRD Society for Capital Market Research and Development SCRA Securities Contracts (Regulation) Act SEBI Securities and Exchange Board of India SEC Securities and Exchange Commission SHCIL Stock Holding Corporation of India Limited US-64 Unit Scheme - 1964 UTI Unit Trust of India Indian Numeral Terms Used 1 crore = 100 lakh = 10 million 100 crore = 1 billion

(1)
EXECUTIVE SUMMARY
Object of study
1. The present study attempts to deepen our understanding of the household investors’ problems, needs and concerns regarding investment in capital market instruments in particular. Our findings have a bearing both on investor protection and on capital market’s development. The study provides a firm foundation of facts, thereby facilitating a clearer understanding of problems. This will help in the formulation of appropriate policies and regulatory measures. The size of domestic population of stock market investors in India has stagnated for the last 5-6 years. The RBI data on household financial saving also shows that there has been a steady decline since 1992-93 in the percentage of saving flowing into private sector shares and bonds and even mutual fund units. Recognising the problem mentioned above, the Ministry of Company Affairs decided to sponsor this wide-ranging survey of household investors under the Investors Education and Protection Fund (IEPF).
Methodology and sample
2. The study is based on direct interviewing of a very large sample of 5908 household heads. Rigorous checks have been employed for ensuring genuineness and reliability of data. Among such checks was the use of two partially overlapping questionnaires, i.e. Questionnaire-1 filled through personal interview and supplementary Questionnaire-2 sent by post, along with Business Reply Envelope, directly to every interviewee at his/her residential address. A little over 200
(2)
interviewers, spread over about 90 cities/towns and across 24 states/union territories, were involved in the interviewing work.
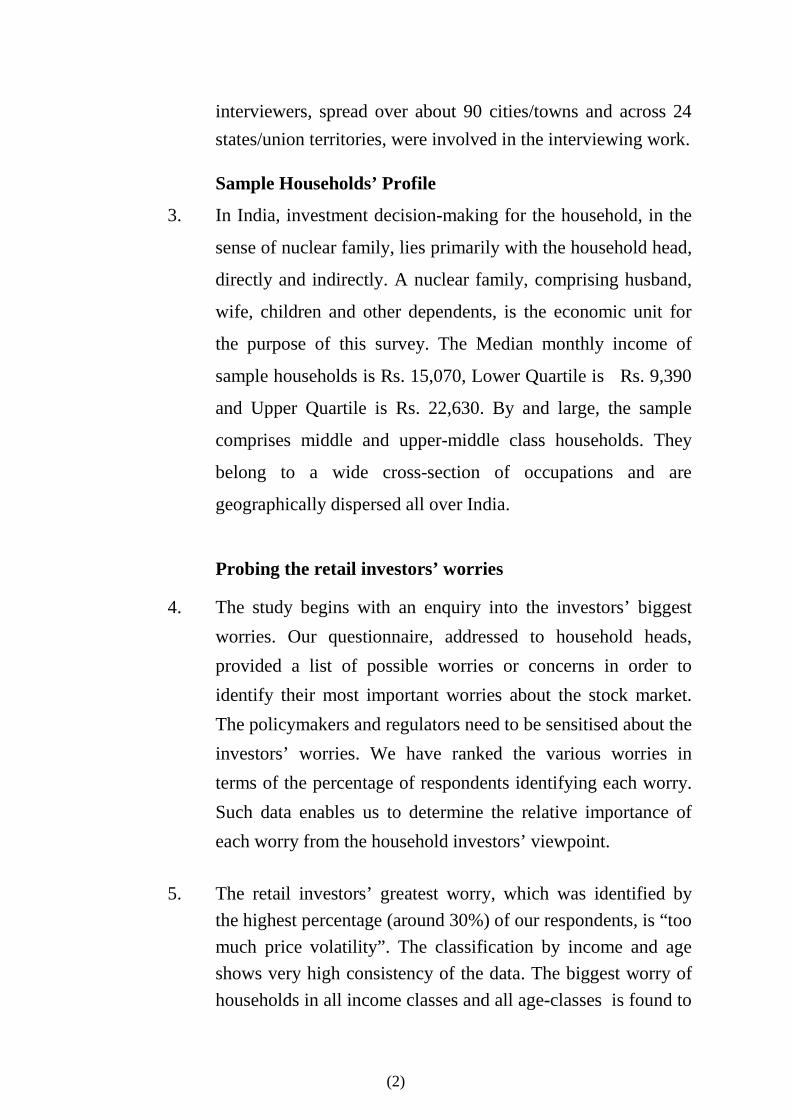
Sample Households’ Profile
3. In India, investment decision-making for the household, in the
sense of nuclear family, lies primarily with the household head,
directly and indirectly. A nuclear family, comprising husband,
wife, children and other dependents, is the economic unit for
the purpose of this survey. The Median monthly income of
sample households is Rs. 15,070, Lower Quartile is Rs. 9,390
and Upper Quartile is Rs. 22,630. By and large, the sample
comprises middle and upper-middle class households. They
belong to a wide cross-section of occupations and are
geographically dispersed all over India.
Probing the retail investors’ worries
4. The study begins with an enquiry into the investors’ biggest worries. Our questionnaire, addressed to household heads, provided a list of possible worries or concerns in order to identify their most important worries about the stock market. The policymakers and regulators need to be sensitised about the investors’ worries. We have ranked the various worries in terms of the percentage of respondents identifying each worry. Such data enables us to determine the relative importance of each worry from the household investors’ viewpoint.
5. The retail investors’ greatest worry, which was identified by the highest percentage (around 30%) of our respondents, is “too much price volatility”. The classification by income and age shows very high consistency of the data. The biggest worry of households in all income classes and all age-classes is found to
(3)
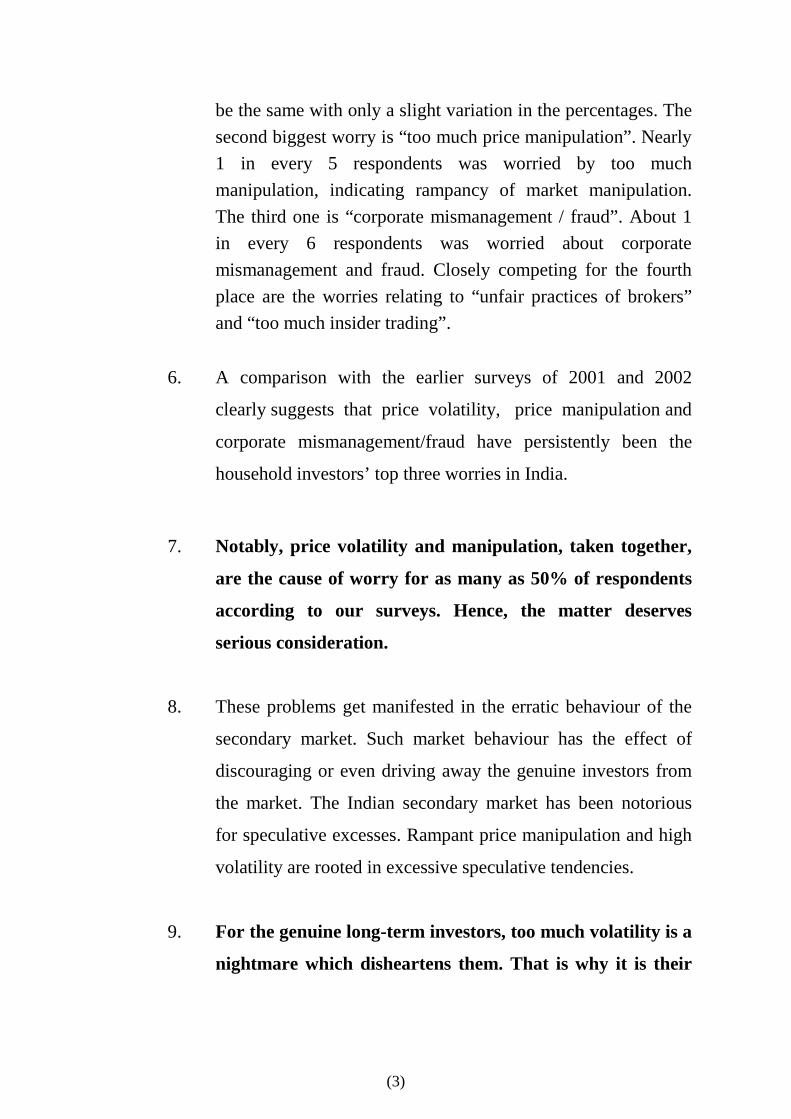
be the same with only a slight variation in the percentages. The second biggest worry is “too much price manipulation”. Nearly 1 in every 5 respondents was worried by too much manipulation, indicating rampancy of market manipulation. The third one is “corporate mismanagement / fraud”. About 1 in every 6 respondents was worried about corporate mismanagement and fraud. Closely competing for the fourth place are the worries relating to “unfair practices of brokers” and “too much insider trading”.
6. A comparison with the earlier surveys of 2001 and 2002
clearly suggests that price volatility, price manipulation and
corporate mismanagement/fraud have persistently been the
household investors’ top three worries in India.
7. Notably, price volatility and manipulation, taken together,
are the cause of worry for as many as 50% of respondents
according to our surveys. Hence, the matter deserves
serious consideration.
8. These problems get manifested in the erratic behaviour of the
secondary market. Such market behaviour has the effect of
discouraging or even driving away the genuine investors from
the market. The Indian secondary market has been notorious
for speculative excesses. Rampant price manipulation and high
volatility are rooted in excessive speculative tendencies.
9. For the genuine long-term investors, too much volatility is a
nightmare which disheartens them. That is why it is their

(4)
most important worry even though Indian policy making
and regulatory authorities tend to play it down.
Investors’ perceptions about corporate governance
10. A large percentage (around 50%) of respondents had a negative
opinion about company managements, around 30% had a
positive opinion and a little above 20% answered “can’t say”.
The negative opinions far exceed the positive ones for the
sample as a whole as also for every income/age class. In
other words, the number of households who have trust in
company managements is far less than those who have no trust.
This is so in every income-class and every age-class.
11. The household investors’ opinion is dominantly negative
about company auditors too. Again, this is true for every
income-class and every age-class.
12. However, some hope is raised by the finding that more than
one-half of the respondents were positive about the current
efforts being made to improve corporate governance, even
though tangible results have yet to be achieved.
13. In our opinion, since the typical Indian listed company is
family-controlled, the corporate governance reform should be
designed to deal with this specific Indian situation. Indian
authorities have borrowed the definition of independent
directors from U.K. and U.S., but have not ensured that such
directors will be truly “independent of management,” i.e. the
controlling group in the Indian context. The so-called
(5)
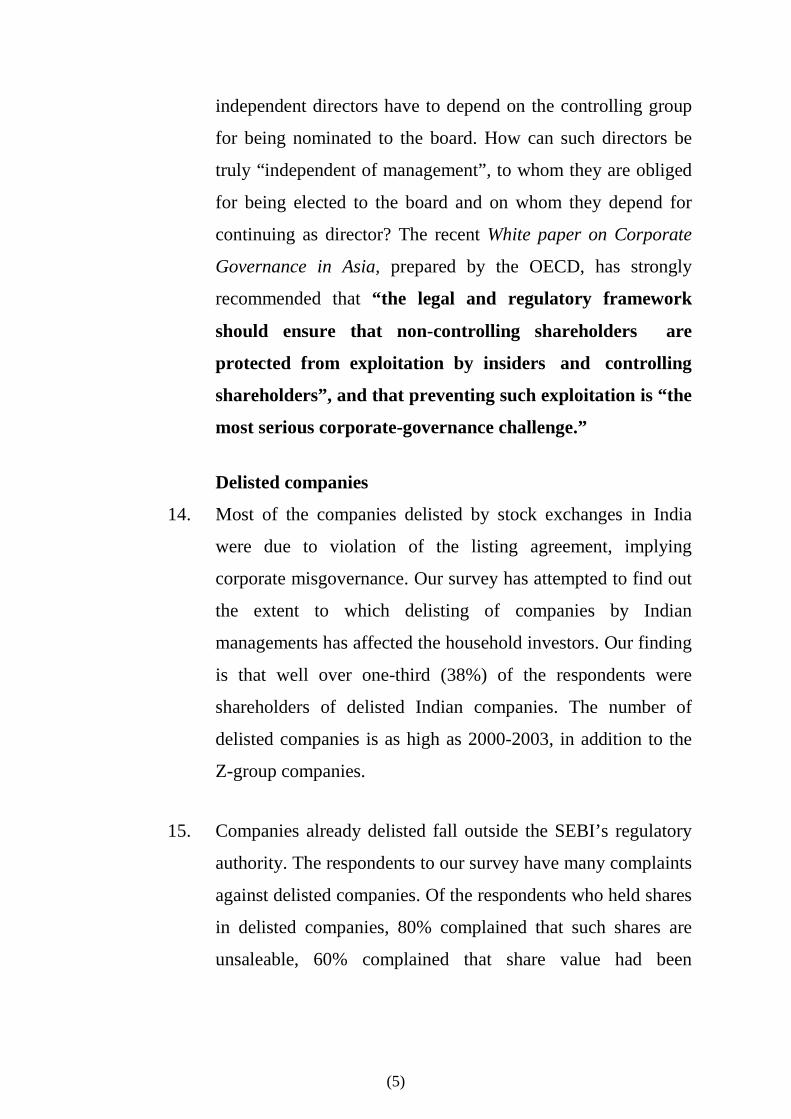
independent directors have to depend on the controlling group
for being nominated to the board. How can such directors be
truly “independent of management”, to whom they are obliged
for being elected to the board and on whom they depend for
continuing as director? The recent White paper on Corporate
Governance in Asia, prepared by the OECD, has strongly
recommended that “the legal and regulatory framework
should ensure that non-controlling shareholders are
protected from exploitation by insiders and controlling
shareholders”, and that preventing such exploitation is “the
most serious corporate-governance challenge.”
Delisted companies
14. Most of the companies delisted by stock exchanges in India
were due to violation of the listing agreement, implying
corporate misgovernance. Our survey has attempted to find out
the extent to which delisting of companies by Indian
managements has affected the household investors. Our finding
is that well over one-third (38%) of the respondents were
shareholders of delisted Indian companies. The number of
delisted companies is as high as 2000-2003, in addition to the
Z-group companies.
15. Companies already delisted fall outside the SEBI’s regulatory
authority. The respondents to our survey have many complaints
against delisted companies. Of the respondents who held shares
in delisted companies, 80% complained that such shares are
unsaleable, 60% complained that share value had been
(6)
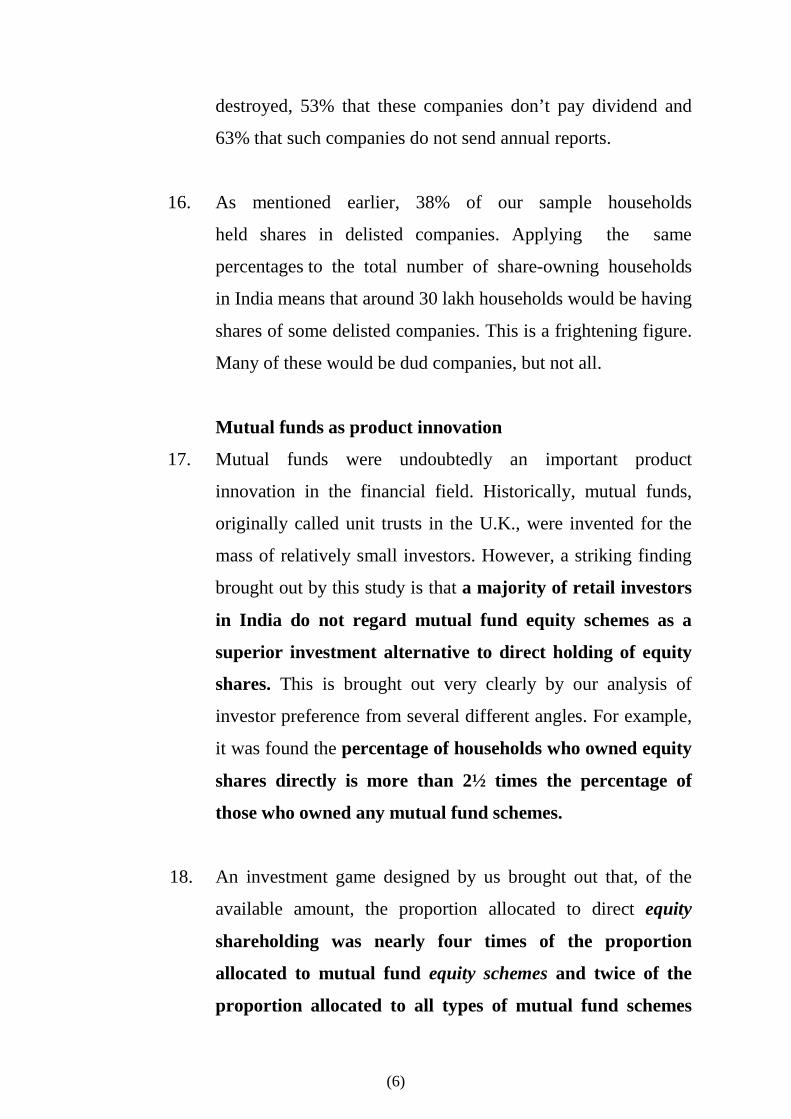
destroyed, 53% that these companies don’t pay dividend and
63% that such companies do not send annual reports.
16. As mentioned earlier, 38% of our sample households
held shares in delisted companies. Applying the same
percentages to the total number of share-owning households
in India means that around 30 lakh households would be having
shares of some delisted companies. This is a frightening figure.
Many of these would be dud companies, but not all.
Mutual funds as product innovation
17. Mutual funds were undoubtedly an important product
innovation in the financial field. Historically, mutual funds,
originally called unit trusts in the U.K., were invented for the
mass of relatively small investors. However, a striking finding
brought out by this study is that a majority of retail investors
in India do not regard mutual fund equity schemes as a
superior investment alternative to direct holding of equity
shares. This is brought out very clearly by our analysis of
investor preference from several different angles. For example,
it was found the percentage of households who owned equity
shares directly is more than 2½ times the percentage of
those who owned any mutual fund schemes.
18. An investment game designed by us brought out that, of the
available amount, the proportion allocated to direct equity
shareholding was nearly four times of the proportion
allocated to mutual fund equity schemes and twice of the
proportion allocated to all types of mutual fund schemes
(7)
combined. Only the government savings schemes had a higher
allocation than direct equity shares. Bank fixed deposits are
also a highly preferred type of investment but less preferred
than government savings schemes. There are very few takers
for non-govt. company bonds. Bonds of PSUs and financial
institutions are far more preferred than private sector bonds.
19. Our analysis shows that the mutual fund industry in India is an
under-developed segment of the Indian financial markets.
Mutual fund equity schemes have accounted for well below
one-fifth of total assets under management of mutual funds
in India. The Indian mutual fund industry as a whole holds
just around 2% of the market capitalization of listed equity
shares. Households in India directly hold an average of
15% or perhaps more of the quoted equity. These macro
figures tell us that mutual fund cult has yet to catch up in
India.
20. The income funds represented the largest component of mutual
fund business in India since 1999 till recently. These funds
have generally accounted for over 50% of the total mutual fund
assets, except in 2004. Balanced funds accounted for around
25% of total assets in 1999 but declined steadily to just around
15% in 2002; and thereafter, they have been reduced to only
about 3% because of winding up of US-64 scheme, which was
by far the single largest balanced fund in Indian mutual fund
industry.

(8)
21. A major shift in the MF industry’s focus is represented by the
rise of Liquid / Money Market Funds from the level of only
about 2% of the total assets of Indian MF industry in 1999 to
40% in September 2004, becoming the largest chunk of mutual
fund assets. The liquid funds cater mainly to the needs of
corporate clients and high networth individuals. Retail
investors overwhelmingly prefer bank deposits rather than
liquid / money market funds. According to our household
investors survey of 2004, only 3-4% of retail investors showed
interest in liquid funds and around 5% in gilt funds, but these
investors were prepared to invest no more than 1% of the total
available sum in liquid / money market funds. Such funds are a
substitute for bank fixed deposits.
22. The data compiled by AMFI indicates that the mutual fund
industry has shifted its focus towards corporates and high
networth individuals and away from the retail investors.
The reduced relative importance of retail business in the
total MF business is explainable partly by the retail
investors’ disenchantment with mutual fund products and
partly by business compulsions of the mutual fund
organisations.
23. Investors in mutual funds have been discouraged by nasty
surprises many times since mid-1990s due to managerial
incompetence, malpractices and frauds. The biggest shock was
the US-64 crisis which caused heavy and widespread losses.
Some foreign-sponsored funds under world-renowned
managements, which had raised great expectations, proved to
(9)
be a flop. Many mutual fund managers trade too much. Too
much churning of portfolios does not necessarily result in
higher returns because of brokerage and other costs and lack of
a long-term approach. Secret sharing of commissions between
fund managers and market intermediaries is not unknown. The
IT boom of 1999-2000 showed how mutual fund managers
were as much susceptible to herd behaviour as the ordinary
investors. Of course, some equity schemes have given excellent
performance but these are relatively few.
24. A subtle point brought out by our analysis is that retail
investors are not sufficiently familiar with mutual funds. In
relative terms, there is much more unfamiliarity with mutual
funds than with the share market among the retail investors.
Retail investors’ share portfolio practices
25. Interestingly, the typical extent of share portfolio
diversification by retail investors lies in the narrow range of
3-10 companies’ shares. Our examination of the advantage of
such narrow diversification shows it to be an “ideal
diversification” for the retail investors from the practical
viewpoint. Curiously, the typical extent of diversification is the
same across all income classes and age-classes of our sample
households. It works better than the more highly diversified
mutual fund equity schemes, so much so that demand for
mutual fund equity products has been seriously affected. This is
an interesting finding of our study.

(10)
26. The study found that one-fifth of the sample households had
only 1 or 2 companies in their share portfolio. Of course, this
can hardly be regarded as diversification. Perhaps in most cases
this may arise from occasional subscription to a glamorous or
much trumpeted IPO. Such shareholders may not be very active
investors in shares.
27. Roughly around 50% of households in all the five income
classes held 3-10 companies in their share portfolios. Age-
classwise analysis showed a broadly similar pattern. This
suggests that the practice of narrow diversification
(shareholding in 3-10 companies) is the dominant practice
among retail shareholders in all income and age classes. Higher
diversification beyond 10 companies is much less common.
About one-sixth of total sample households held shares of 11-
20 companies and about one-eighth of the sample held shares
in more than 20 companies.
28. Clearly, it is narrow diversification (portfolio comprising 3-
10 companies) which is dominant or most popular in all
income and age groups. Even though mutual funds offer much
greater diversification, most retail investors find more
advantage in direct holding of shares in a few selected
companies.
29. An important practical reason is that an average retail
investor cannot effectively supervise too many companies.
Further, a weighty advantage of direct shareholding vis-à-vis
mutual fund equity schemes is that direct investors do not

(11)
have to pay the annual management fees and expenses
charged by mutual funds. Such burden usually amounts to
around 2.5% per annum of mutual fund portfolio value, in
addition to the entry and exit loads. For the direct long-term
investor, this makes considerable difference to net annual
return from investment. A majority of retail investors are
long-term oriented shareholders, if we exclude those who stated
that they are not interested in shares for whatever reason.
30. No extent of portfolio diversification can reduce ‘market risk’,
i.e. the whole market going up and down. However, such
“risk” is turned into an “opportunity” by the mature investors
practising narrow diversification. In case of temporary fall
in market prices, they buy more shares of the well-
performing companies already in their portfolio, thereby
reducing the average acquisition cost of the portfolio. A
majority of respondents in all income and age groups have
reported more satisfactory experience from direct
shareholding than from mutual fund equity schemes.
Middle-class investors: long term and conservative
31. Our findings suggest that the middle and the upper-middle
class households in India are a conservative lot. It is also
noteworthy that the predominance of long-term investors is
significantly more in the higher income and higher age
categories of household investors. On the whole, they do not
generate much short-term speculative activity on the stock
exchanges. Most of the speculative activity is the handiwork of
stockbroking firms and market operators. A unique feature of
(12)
the Indian stock market is the power, influence and
ubiquitousness of market operators. That the Indian stock
market is overwhelmingly dominated by speculation is not due
to the presence of middle-class investors but due to excessive
proprietary trading by broking firms and market operators.
SEBI should compile regular data on such proprietary trading.
32. Less than one-fifth of our respondents intended to
hold shares for a few days only. About one-third of
them intended to hold shares for some months but not
exceeding one year. The largest proportion of our sample
comprised investors who intended to hold the shares for some
years.
Households’ investment preferences
33. Equity share ownership had increasingly become a middle
class phenomenon in India since around 1980s and received a
great boost in the beginning of the 1990s after introduction of
economic liberalisation. The abolition of Capital Issues
Control and replacing it by a free-pricing system in 1992
opened the flood-gates for unscrupulous company promoters
due to euphoric market conditions. The IPOs were lapped up
avidly and indiscriminately by the investing public during
most part of the period from 1992 to 1994. The widespread
bad experiences led to withdrawal of the retail investors from
the stock market for many years after the mid-1990s.
34. One simple measure of relative preference among various
investment products is the market penetration of such products.
Equity shares have achieved a much higher degree of
(13)
penetration among middle-class households compared to other
capital market instruments. For example, shareowning
households were nearly 74% among the sample households in
the lowest income class (upto Rs. 10,000 per month), going up
to more than 85% in the highest income class (above Rs.
25,000 per month). Age-class variation of sharownership
among households had also about the same kind of range.
Market penetration of equity shares is fairly flat across income-
classes and also age-classes, showing only a very gradual rise
with increase in income and age.
35. The percentage figures mentioned above are far higher than the
average for the entire population which has a large component
of poor and also illiterate households. To place the whole thing
in a broad perspective, it may be noted that only 4-5 percent of
all Indian households are shareowning households.
Shareowning individuals hardly constitute 2% of India’s total
population.
36. The penetration achieved by mutual funds in the case of every
income-class and age-class is only a fraction (one-third to one-
half) compared to that of equity shares. Corporate bonds have
lower penetration than mutual funds, except in the case of
infrastructure tax-saving bonds among the tax-paying classes.
37. The substantial fall in interest rates over the last few years had
led to a greater inclination among a majority of household
investors towards equity shares, i.e. to accept higher risk in the
(14)
hope of higher return. This is clearly indicated by our survey of
retail investors.
38. Our survey has revealed that majority shareowners in almost all
income and age-classes have been shareowners for 10 years or
more. This finding should be viewed in the context of portfolio
diversification practices. The extent of diversification does not
increase beyond 10 companies for most of the investors
despite their long experience as shareowners. Only in the
highest income-class (above Rs 25,000 per month) and the
elderly investors (over 60 years), the typical diversification
of portfolios becomes 3-20 companies instead of 3-10
companies.
39. Our survey brings out that the bulk of the present generation of
Indian retail investors got their exposure to the vicissitudes of
the equity market during the last 15 years, specially the 1990s.
They have gone through many boom-bust market cycles and
also witnessed the many incidents of market frauds and
manipulative practices. While some of them became so
disgusted that they vowed never to touch the stock market
again, most others were less cynical and felt that it was a
learning experience. They derived useful lessons and evolved
practical approaches to equity investment.
40. The retail investors in India have become wiser, more
sophisticated and discerning investors. They have begun to
understand the amplitude and duration of the Indian stock
(15)
market’s cyclical ups and downs and also the magnitude of
daily gyrations. The popular TV news channels, which now
regularly broadcast daily stock market report at prime time,
have created greater awareness among ordinary investors about
the market’s behaviour and parameters.
41. The recent boom of 2003-04 attracted the retail investors
mostly as sellers rather than as buyers. Having become
wiser from the mistakes of the past, the retail investors
have become less gullible. They have started looking at
IPOs with a magnifying glass. Very few IPOs are now able
to pass muster. In recent times, a rise in the average P/E
ratio to just 17-18, based on BSE Sensex and NSE Nifty
companies, begins to ring an alarm bell for investors and
market authorities, whereas an average P/E ratio of 30-40
in early 1990s was simplistically accepted because not many
market participants understood the ratio.
42. Retail investors have been encountering serious problems with
the demat system. This has happened because the SEBI, in a
hurry, made demat compulsory without giving due
consideration to the realities of our socio-economic situation.
The result is that India’s demat system has not evolved as a
voluntary business service, priced attractively for the mass of
investors. It was forced down their throat. It is heavily tilted in
favour of speculators and large market participants but against
the retail investors. Its effect has been to gradually push out the
retail investors from the equity market. The demat system was
(16)
never promoted by compulsion in the U.S. or U.K. It grew
there gradually as investors became familiar with it and found
it beneficial and economical to them.
43. Belatedly in February 2004, the SEBI recognised the problem
of high demat charges in the case of small investors and
constituted a Group on Reduction of Demat Charges. The
Group recommended that the small investors should be
charged on the basis of ad valorem only (instead of a fixed
flat fee system) and that the charges, like account maintenance,
should not be levied on small investors at all by DPs. The
Group also recognised that the companies have really been the
main beneficiaries of the depository system which has saved
them huge cost incurred earlier on registration of share
transfers. It recommended that all companies should pay a one-
time fee to the Depository at 0.1% of their market
capitalisation. The group’s recommendations have yet to be
fully implemented.
44. Not many people know that despite the existence of the
depository system in India for nearly eight years and despite
demat form being made compulsory by SEBI for trading on
stock exchanges, most of the small investors, who constitute the
majority of shareholding population in India, have remained
outside the share depository system. This is true of many
companies which have lakhs of shareholders and very active
trading in their shares.
(17)
45. The number of shareholders having a depository account at the
end of December 2004 is only a little over 70 lakh, whereas the
total shareowning individuals in India, as per independent
estimates provided by the Society for Capital Market Research
and Development and by SEBI-NCAER survey, is around 2
crore. Even if we allow for some consolidation of shareholding
by various members of the same family for economizing
demat cost, it is reasonable to infer that a majority of individual
shareowners of individual companies have not joined the
depository system.
46. The Indian market regulatory authorities seem to have played
down the fact that a majority of retail investors have remained
outside the depository system. No official agency has even
tried to compile and provide company-wise official data on
the percentage of the number of investors who continue to
hold shares in the form of paper certificates and of those
who hold in demat form. The only figures being officially
provided relate to the amount of equity share capital held in
demat form and traded in demat form. The retail investors’
problem has thus been swept under the carpet.
47. Our analysis shows that the single most important complaint of
household investors about demat system is that demat charges
are too high. One out of every five respondents mentioned this
complaint. Households in all income and age-classes have this
complaint. Notably, the proportion of complainants is distinctly
higher, being 24-25%, among the elderly shareowners aged
above 65 years compared to 16-17% among the young

(18)
shareholders aged 30 years or below. The annual custody and
account maintenance charges penalise the small long-term
holders of shares. They have the effect of squeezing them out
from the equity market. This is already happening to some
extent.
48. The over-all effect of the demat system has not been to attract a
greater number of domestic retail investors into shareownership
but the opposite. The demat system has been very attractive
to speculators and frequent traders. For this and other
reasons, the speculative trading volumes have grown
enormously but the percentage of households’ financial saving
flowing into direct shareholding and mutual fund schemes has
fallen to a negligible level.
Investor education
49. What should be the delivery mechanism and method for
investor education programmes is an important problem in a
vast and diverse country like India with many regional
languages.
50. Most of even the educated English-knowing middle-class
people are familiar only with simple forms of investments, like
fixed deposits and government savings schemes. Their
understanding about the share market and mutual funds is
mostly poor. Hence, investment education programmes are
needed for large numbers of people across the country.

(19)
51. The Ministry of Company Affairs (MCA) recognised this problem
by giving it special attention under the Investor Education and
Protection Fund (IEPF). We understand that the MCA intends to
redouble its efforts in this direction. It is a laudable idea. Much
more thought will have to be given in designing the content and
delivery mechanism for investor education. We have elaborated it
in detail in chapter 9 of this report.
52. Our survey data indicated that 68 per cent of our respondents have
neither watched the T.V. programmes on investor education
sponsored by the Ministry of Company Affairs nor attended any
investor education seminars sponsored by SEBI. That is why we
need to explore more effective ways and alternative delivery
channels for investor education programmes. The internet is a
potent tool for making this possible. There could be formal
training “schools”, workshops, etc., based on today’s e-business
model, catering to investors spread across the country.
53. It is well recognized that one should start the habit of saving and
investing from early years of working life. Understandably, the
first investments by a young person usually take the form of life
insurance and bank fixed deposits. One should also consider
starting to invest small amounts in shares too because the
returns can be higher but learning is necessary for successful
investing in shares.
54. A large number of people lose money by investing in shares
because they may be investing at the wrong time, like the peak of
a bull market, or their stock selection may not be based on sound
(20)
criteria. They may lack a historical perspective about the stock
market’s boom-bust characteristic and inherent volatility. Such
perspective will guard the investors against being over-optimistic
and will help them in evolving a sound long-term investment
strategy. There is a definite need for some formal and systematic
training for investors during their working life even if they
may not be investing significantly in shares at that time.
55. At younger age, the potential investors can be encouraged to
experiment for a while taking small bets with share
investment. The young people have a long future before them.
They will learn from mistakes. By the time they have grown and
have substantial money to invest, they would be much better
prepared for investing skilfully.
56. It is worth examining the methods adopted in the U.S. by the
Securities and Exchange Commission (SEC) and by the Securities
Industry Foundation for Economic Education. The SEC’s Office of
Investor education and Assistance organizes investors’ “Town
Meetings” in cities throughout the country to help the people learn
how to save and invest wisely. The Securities Industry Foundation
uses the novel method of Stock Market Game involving schools
throughout the U.S. in a competition on fantasy stock-picking.
57. Based on the need felt by the respondents covered by our survey,
we have drawn up a detailed list of topics for investor education,
classified under broad heads (see Annexure to Chapter 9). We
hope that this list will be very useful for the organizers of investor
education programmes.

(21)
Chapter 1
INTRODUCTION
Objective
1.1 The present research study has been undertaken in order to deepen our understanding of the household investors’ problems and needs. A better understanding in this regard will help in furthering the objectives of the Investor Education and Protection Fund (IEPF), administered by the Ministry of Company Affairs. The investors’ problems and needs today are very different from what they were 10-15 years ago due to changes in the legal, technological and institutional arrangements of financial markets and the emergence of new investment products and sales practices.
Methodology and sampling 1.2 The investors’ problems and needs can be best known from the
investors themselves. Our methodology of study therefore relies primarily on in-depth interviews of investors through structured questionnaires covering a variety of interrelated aspects, such as the investor’s socio-economic and financial position, including income and types of investment held, past experiences, future investment intentions, problems being felt with regard to the use of demat system, etc.
1.3 A countrywide survey of this kind is a rather difficult exercise, specially because many investors are reluctant to disclose their personal financial data to outsiders. We have tried to overcome this problem by informing the respondents that our objective is wholly focused on promoting the ordinary investors’ interest and strengthening their protection, and that we are a non-profit body.
(22)
1.4 Collecting such data on countrywide basis from a large number of geographically dispersed households is a stupendous task. The data will be meaningful only if its reliability and genuineness is ensured. There have to be good built-in checks in the system of survey. We have conducted many such surveys since 1990 and have perfected the methodology. 1
Two- stage questionnaire 1.5 The survey was actually conducted during May-October
2004 after recruiting field interviewers. A prominent feature of our method is a two-stage system of questionnaires, the first stage being a personally administered questionnaire through field interviewers, followed, in the second stage, by a differently structured second questionnaire mailed, along with Business Reply Envelop, directly to every respondent interviewed in the first stage. The second questionnaire is partially over-lapping the first as an in-built check against the possibility of fake interviewing. This, combined with several other checks, ensures a high level of reliability and genuineness of data.
Household as the economic unit
1.6 We treat the household, in the sense of nuclear family
(husband, wife and dependents) as the economic unit for our
purpose. The data was collected from Household Heads on
behalf of the household as a whole.
1 See L.C. Gupta, Indian Shareowners: A Survey (Society for Capital Market Research &
Development, Delhi, 1991). The Survey covered a sample of 5822 households. See pp. 2-8.

(23)
Sampling procedure 1.7 Our sampling procedure was designed to overcome the
problem due to widespread reluctance to disclose personal income and investments. To ensure near-randomness and countrywide cross-sectional representation, we have used a highly dispersed network of local interviewers, drawn mostly from college/university teachers, bank employees, and other professionals. Each interviewer was given instructions in the form of “Guidelines for Interviewers” and was to first submit 6 completed questionnaires as specimen for our scrutiny. Further questionnaires were sent to the interviewer in instalments and only if the questionnaires were being completed properly. Every completed questionnaire was scrutinised and the improperly filled questionnaires were returned.
1.8 The interviewers were required to conduct interviews in their neighborhood residential areas and not in offices. This helped to achieve more random sampling. The interviewing work often involved more than one visit to a household to suit the convenience and availability of the respondent. Given the widespread reluctance of households to disclose personal financial information, the sample covers only those households who were willing to cooperate in the survey by volunteering to provide the information required. Our method of sampling is good enough to give a feel of the entire system by covering the main stream of investors.
1.9 Admittedly, the sample does not represent the country’s entire population but only the “universe of potential investors”. Those below the poverty line or having little

(24)
voluntary savings for financial investments or no ability to understand investments, like shares and bonds, had to be excluded, because they were irrelevant for the purpose of the present survey.
Sample size and characteristics
1.10 The survey covered 5908 households who were interviewed through Questionnaire-1. Of these, 1017 responded to the mailed questionnaire (Questionnaire-2). The respondents to the mailed questionnaire are thus a sub-set of the respondents to Questionnaire1. The two questionnaires have been analysed separately. 1 The results show a high degree of consistency and comparability.
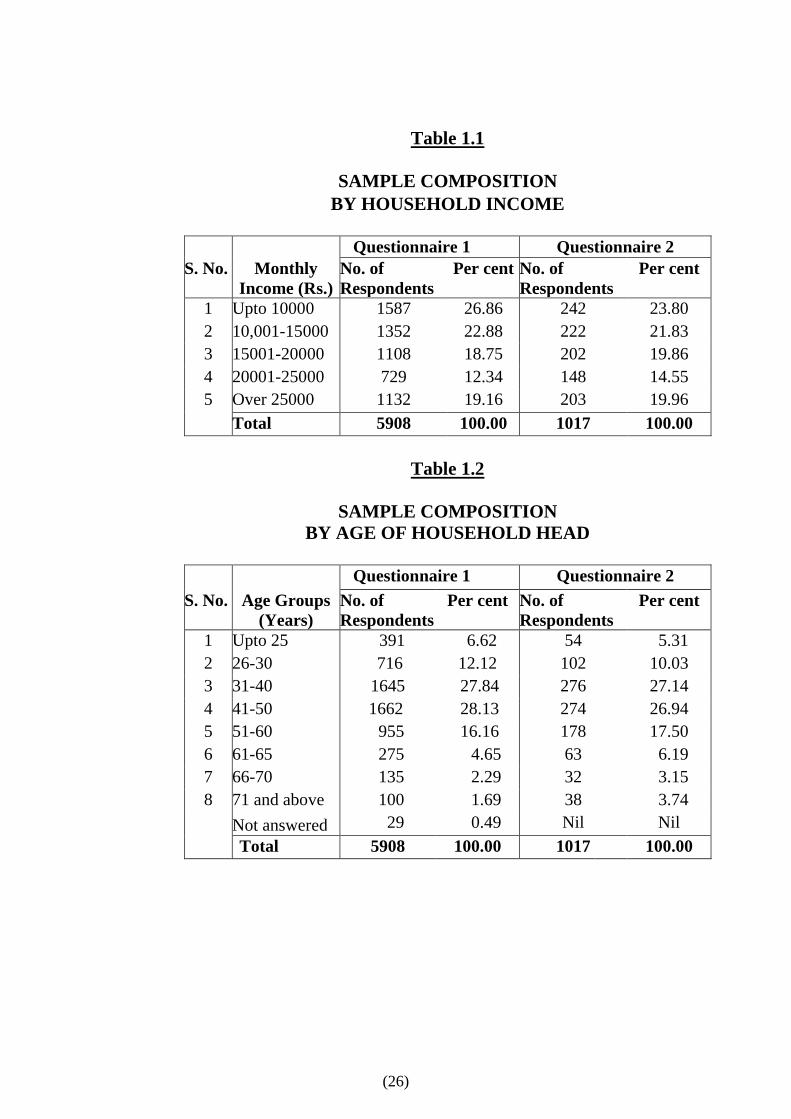
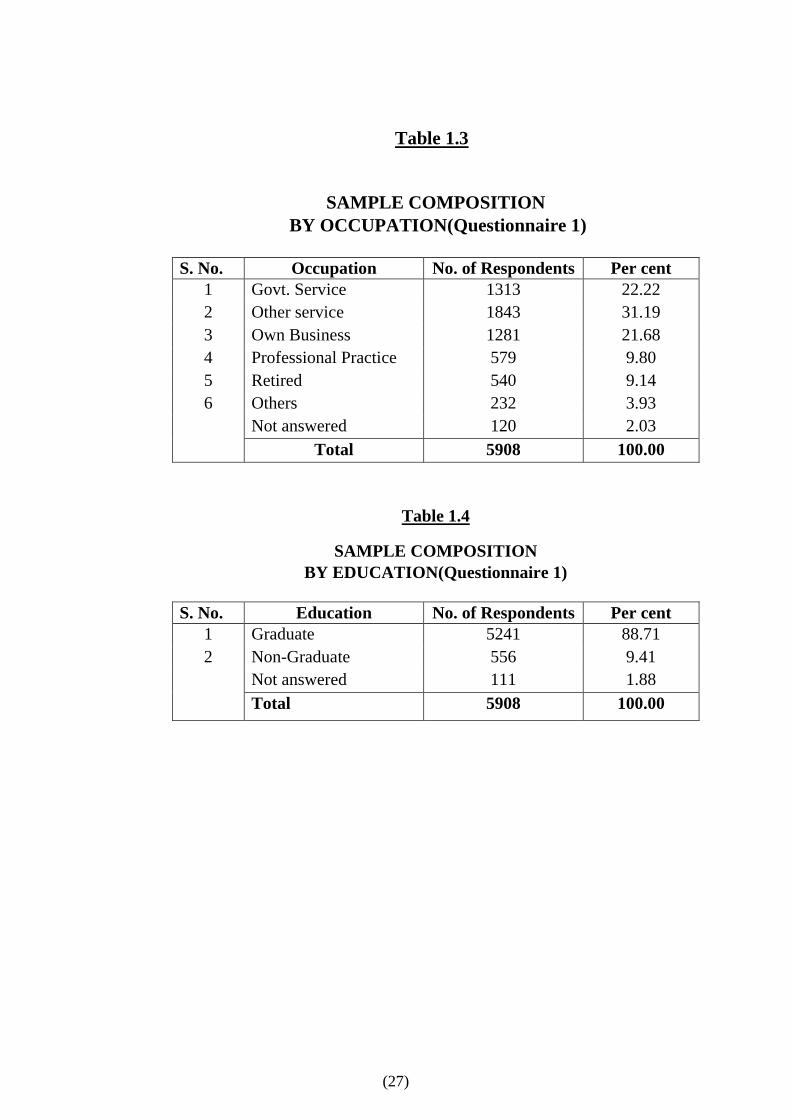
1.11 Our sample is dispersed among 24 States/Union Territories and about 90 cities/places in India. The bulk of the sample comprises the middle and upper-middle class households. Nearly 200 field interviewers have co-operated in conducting the personal interviews. The composition of respondents by income, age, occupation and education is shown in the Appendix to this chapter in Tables 1.1–1.4. The distribution of sample households by states/union territories is shown in Table 1.5.
Chapter scheme 1.12 For the convenience of exposition, the findings of the study
have been divided into three parts. Part 1 comprises chapters 2 to 4, dealing respectively with (a) investor’s worries about the stock market, (b) their perceptions about corporate governance
1 An interesting and noteworthy point for researchers is that replies to directly mailed questionnaires,
being entirely voluntary and left to convenience of the respondents, are more reliable and richer in comments than questionnaires filled through the help of interviewers. The personal interviews tend to be a hurried affair in practice because interviewees are often too busy to spare sufficient time.
(25)
and (c) how they have been affected by delisting of an unusually large number of companies in India in the last few years.
1.13 Part II comprises chapters 5 to 7 which are concerned with various aspects of investor’s preferences and share portfolio practices. Chapter 5 is focused on investors’ attitude towards mutual funds, often claimed by managers and theorists alike, as a superior alternative to direct investment in equity shares. The findings contradict the claim and point to the investors’ relatively low preference for mutual fund products, compared to direct holding of equity shares. Chapter 6 throws new light on share portfolio practices of retail investors. There are hardly any other studies in this area. Chapter 7 goes deeper into household’s investment preferences and also describes what we call “maturing of retail investors” and the emergence of ‘discerning’ investors.
1.14 Part III has two chapters. Chapter 8 highlights the retail investors’ complaints and problems about the demat system, specially unjustly high demat charges. We show how this system has the effect of squeezing out the long-term retail investors from the equity market. Chapter 9 deals with the problem of educating the ordinary investors so that they can invest more wisely in order to provide for financial security. A more innovative approach is suggested.
1.15 The concluding Chapter 10 wraps up the study.
(26)
Table 1.1
SAMPLE COMPOSITION
BY HOUSEHOLD INCOME
Questionnaire 1 Questionnaire 2 S. No. Monthly
Income (Rs.)No. of Respondents
Per cent No. of Respondents
Per cent
1 Upto 10000 1587 26.86 242 23.80 2 10,001-15000 1352 22.88 222 21.83 3 15001-20000 1108 18.75 202 19.86 4 20001-25000 729 12.34 148 14.55 5 Over 25000 1132 19.16 203 19.96 Total 5908 100.00 1017 100.00
Table 1.2
SAMPLE COMPOSITION
BY AGE OF HOUSEHOLD HEAD
Questionnaire 1 Questionnaire 2 S. No. Age Groups
(Years) No. of Respondents
Per cent No. of Respondents
Per cent
1 Upto 25 391 6.62 54 5.31 2 26-30 716 12.12 102 10.03 3 31-40 1645 27.84 276 27.14 4 41-50 1662 28.13 274 26.94 5 51-60 955 16.16 178 17.50 6 61-65 275 4.65 63 6.19 7 66-70 135 2.29 32 3.15 8 71 and above 100 1.69 38 3.74 Not answered 29 0.49 Nil Nil Total 5908 100.00 1017 100.00
(27)
Table 1.3
SAMPLE COMPOSITION
BY OCCUPATION(Questionnaire 1)
S. No. Occupation No. of Respondents Per cent 1 Govt. Service 1313 22.22 2 Other service 1843 31.19 3 Own Business 1281 21.68 4 Professional Practice 579 9.80 5 Retired 540 9.14 6 Others 232 3.93 Not answered 120 2.03
Total 5908 100.00
Table 1.4
SAMPLE COMPOSITION
BY EDUCATION(Questionnaire 1)
S. No. Education No. of Respondents Per cent 1 Graduate 5241 88.71 2 Non-Graduate 556 9.41 Not answered 111 1.88 Total 5908 100.00

(28)
Table 1.5
STATE-WISE DISTRIBUTION OF SAMPLE
HOUSEHOLDS S. No. State/Union
Territory No. of
Respondents Per cent
1 Andhra Pradesh 671 11.36 2 Assam 167 2.83 3 Bihar 155 2.62 4 Chandigarh 48 0.81 5 Chhattisgarh 36 0.61 6 Delhi 414 7.01 7 Goa 67 1.13 8 Gujarat 504 8.53 9 Haryana 244 4.13 10 Himachal Pradesh 16 0.27 11 Jammu & Kashmir 10 0.17 12 Jharkhand 14 0.24 13 Karnataka 585 9.90 14 Kerala 260 4.40 15 Madhya Pradesh 99 1.68 16 Maharashtra 341 5.77 17 Orissa 64 1.08 18 Pondicherry 62 1.05 19 Punjab 78 1.32 20 Rajasthan 355 6.01 21 Tamil Nadu 593 10.04 22 Uttaranchal 42 0.71 23 Uttar Pradesh 545 9.22 24 West Bengal 538 9.11 Total 5908 100.00
(29)
Chapter 2
THE HOUSEHOLD INVESTORS’ MAIN WORRIES ABOUT STOCK MARKET
I. Introduction
Collapse of capital raising function 2.1 It is extremely important for the capital market policy making
and regulatory authorities to understand the household investors’ worries or concerns about the stock market. The reason is provided by the virtual collapse of the capital market as a source of corporate financing after the mid-1990s. We have not yet truly recovered from that collapse despite great technological strides in the market’s trading system.
2.2 Dr. Rakesh Mohan, in a lecture on “Finance for Industrial Growth”, made a similar point in the following words:
“After the exuberance of the stock market in the mid-1990s and its decline thereafter, a large number of individual investors took flight to safety in bank deposits, safe retirement instruments and insurance. It remains to be seen when and how fast such savers return to the capital market so that it performs its intermediary function efficiently.”1
2.3 He cited data to show that public equity issues by non-
government public limited companies declined from 1.1% of GDP during 1992-97 to merely 0.1% during 1998-2002 and further to 0.01% during 2002-03, i.e., far below what it used to be even during the 1980s, as shown below:2
1 Lecture delivered by Dr. Rakesh Mohan at the Administrative Staff College of India, Hyderabad as
reported in the Reserve Bank of India Bulletin, March 2004, pp. 319-39, esp. p. 334. 2 See RBI Bulletin, March 2004, Table 9, p. 334.

(30)
Year New Equity Issues (Percentage of GDP)
1980s 0.2
1990s 0.7
1992-93 to 1996-97 1.1
1997-98 to 2001-02 0.1
2002-03 0.01
By relating the amount of capital raised to the GDP, Dr. Rakesh Mohan has provided a very realistic picture of the phenomenal decline in capital market’s role in the raising of capital. This has belied the expectation that the capital market’s role in raising capital for corporate enterprises would progressively increase as a result of economic liberalisation introduced in 1991.
2.4 The RBI data shows that the percentage of households’ financial saving going into private-sector shares and bonds, either directly or through mutual funds, has persistently declined since mid-1990s instead of rising. The RBI Annual Report 1999-2000, showed that 7.5%-8.5% of households’ gross financial saving each year was invested directly in shares and debentures of private corporates in the boom years, 1992-93 to 1994-95 but the percentage declined steadily thereafter to a mere 1.6% in 1997-98 and 1.5% in 1998-99. It temporarily rose to 3.4% during the IT boom year, 1999-2000, but gradually slipped to just 0.7% in 2003-04.3
2.5 The households’ indirect investment in private corporates through the UTI and other mutual funds also went down as percentage of financial savings, from 8.6% in 1992-93 to only
3 RBI Annual Report, 2003-04, Appendix Table II.11, p. 260.
(31)
0.6% in 1997-98, rose temporarily to 4.2% in 1999-2000 (period of IT boom) and gradually slipped back to 0.7% in 2003-04.4
2.6 Considering both direct and indirect forms of investment by households in corporate shares and debentures, we find from RBI data that 17% of households’ gross financial savings went into the private corporate share and bonds in 1992-93 but this came down to just 2.5% by 1998-99. Thereafter, it spurted temporarily to 7.6% in 1999-2000 and then slipped to 1.4% in 2003-04.
2.7 The household investors’ disenchantment with corporate stocks and bonds is also indicated by the drying up of the new issues market. Public and rights issues of shares and bonds fell persistently from the peak of Rs. 27,632 crore during 1994-95 to as low as Rs. 4,570 during 1997-98 and remained relatively low around this level over the subsequent 7-8 years.5
2.8 The household (i.e. retail) investors account for the great bulk (around 85-90%) of India’s gross domestic saving which is 23-24% of GDP. A little below one-half (around 45%) of the households’ gross saving is in financial forms and the rest is in physical forms.6 Many households have tended to withdraw from the stock market after mid-1990s because of bad experiences.
4 Ibid. 5 SEBI Annual Reports. 6 GOI, pre-budget Economic Surveys.
(32)
Recent bull market
2.9 Since around mid-2003, share prices have shown smart recovery and so also public issue activity. It can not, however, be asserted with confidence that the household (i.e. retail) investors, taken as a whole, have started making significant net addition to their equity shareholdings. Our data suggests that retail investors have used the recent bull market situation as an opportunity for exiting from the market. The prolonged market depression since mid-1990s had almost locked them in. The recent emergence of the bull market is attributable, not to the retail investors rushing back to corporate stocks but to the swelling FII inflows.
Probing the retail investors’ mind
2.10 Our questionnaire for the household investors survey of 2004, addressed to household heads, inter alia, provided a list of possible worries or concerns with the idea of identifying their most important worries about the stock market7. We have ranked the various worries in terms of the percentage of respondents identifying each worry. Such data enables us to determine the relative importance of each worry from the household investors’ viewpoint.
II. An Over-view of the Findings
2.11 Our analysis classifies the respondents by income-class and age-class. The findings are presented in Tables 2.1 and 2.2 respectively. As may be observed from these tables, the retail
7 We have carried out two surveys earlier in 2001 and 2002, asking the household investors to indicate
their ‘single’ most important worry. For details of these surveys, see L.C. Gupta, Naveen Jain and Utpal Choudhury, India’s Stock Market & Household Investors’ (Society for Capital Market Research & Development, Delhi, 2004) pp. 8-19.
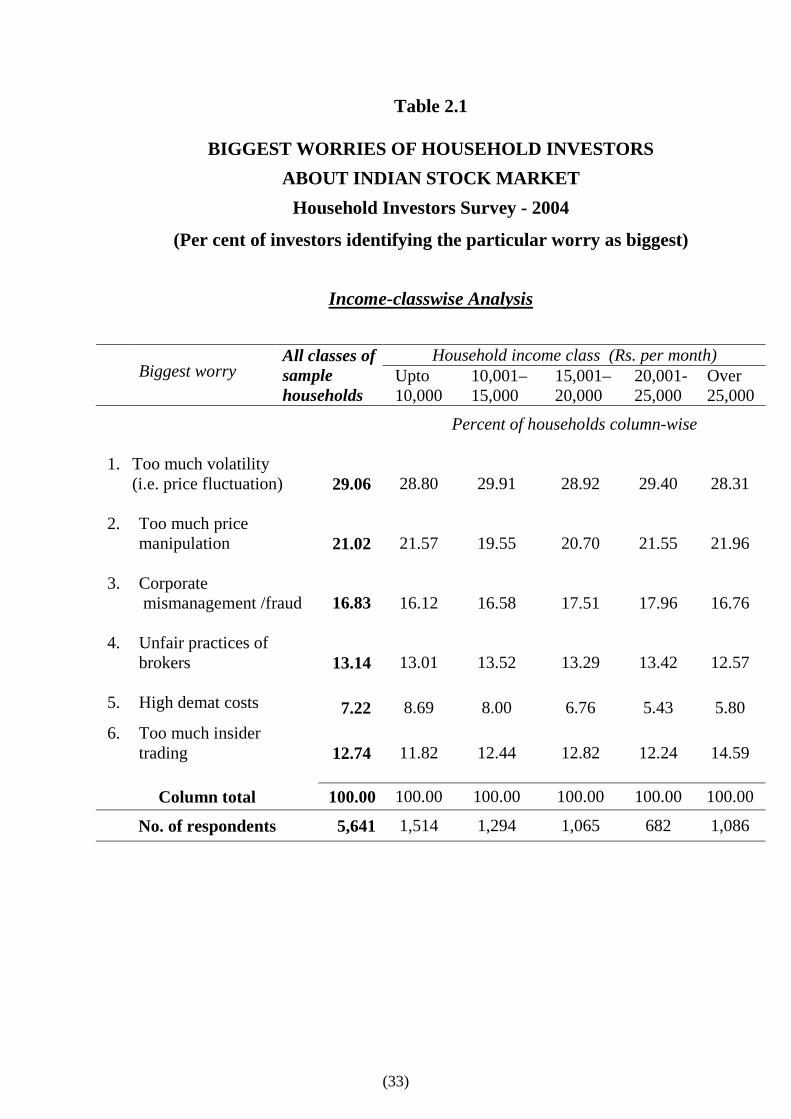
(33)
Table 2.1
BIGGEST WORRIES OF HOUSEHOLD INVESTORS ABOUT INDIAN STOCK MARKET
Household Investors Survey - 2004
(Per cent of investors identifying the particular worry as biggest)
Income-classwise Analysis
Household income class (Rs. per month)
Biggest worry All classes of sample households
Upto 10,000
10,001– 15,000
15,001– 20,000
20,001- 25,000
Over 25,000
Percent of households column-wise
1. Too much volatility
(i.e. price fluctuation)
29.06 28.80 29.91 28.92 29.40 28.31
2. Too much price manipulation
21.02 21.57 19.55 20.70 21.55 21.96
3. Corporate mismanagement /fraud 16.83
16.12 16.58 17.51 17.96 16.76
4. Unfair practices of brokers
13.14 13.01 13.52 13.29 13.42 12.57
5. High demat costs 7.22 8.69 8.00 6.76 5.43 5.80 6. Too much insider
trading
12.74 11.82 12.44 12.82 12.24 14.59
Column total 100.00 100.00 100.00 100.00 100.00 100.00
No. of respondents 5,641 1,514 1,294 1,065 682 1,086

(34)
Table 2.2
BIGGEST WORRIES OF HOUSEHOLD INVESTORS ABOUT INDIAN STOCK MARKET
Household Investors Survey - 2004
(Per cent of investors identifying the particular worry as biggest)
Age-classwise Analysis
Age of household head( in years) Biggest worry
All classes of sample households
Upto 25
26-30 31-40 41-50 51-60 61-65 66-70 71 and above
Percent of households column-wise
1 Too much volatility (i.e. price fluctuation)
29.06
30.25
31.24
28.02
29.12
29.30
27.86
28.20
25.77
2 Too much price manipulation
21.02
20.57
21.20
20.83
21.54
20.15
21.37
19.55
23.71
3 Corporate mismanagement/fraud 16.83
16.08
14.03
16.98
17.42
17.27
18.51
15.41
21.13
4 Unfair practices of brokers
13.14
11.72
13.96
13.77
12.89
12.85
12.40
13.91
11.34
5 High demat costs
7.22
7.22
6.20
7.03
6.98
7.63
9.54
10.90
6.70
6 Too much insider trading
12.74
14.17
13.37
13.36
12.04
12.80
10.31
12.03
11.34
Column total 100.00 100.0 100.00 100.00 100.00 100.00 100.00 100.00 100.00
No. of respondents 5,641* 367 677 1,572 1,590 918 262 133 97
* Out of total sample respondents, a few did not provide information on their age. They have therefore, not been included in the individual age-classes but are included in the total sample.

(35)
investors’ greatest worry, which was identified by the highest percentage (around 30%) of our respondents, is “too much price volatility”. The classification by income and age shows very high consistency of the data. The biggest worry of households in all income classes (Table 2.1) and all age-classes (Table 2.2) is found to be the same with only a slight variation in the percentages. The second biggest worry is “too much price manipulation” and the third one is “corporate mismanagement / fraud”. Closely competing for the fourth place are the worries relating to “unfair practices of brokers” and “too much insider trading”, as shown in Tables 2.1 and 2.2. Many household investors, who are not frequent traders, were highly critical of the heavy demat costs, as brought out later by separate questions on the demat system. However, this problem is of a lower order than the other problems covered by Tables 2.1 and 2.2.
2.12 Nearly 1 in every 5 respondents was worried by too much manipulation, indicating rampancy of market manipulation. About 1 in every 6 respondents was worried about corporate mismanagement and fraud.
2.13 Since investors’ perceptions go on changing as market conditions
change, it is useful to compare the findings of the survey of 2004 with our earlier surveys of 2001 and 2002. Such comparison clearly suggests that price volatility, price manipulation and corporate mismanagement / fraud have persistently been the household investors’ top three worries in India8.
8 The surveys of 2001 and 2002 requested the respondents to indicate their “single greatest” worry. Some
respondents had difficulty in picking just one worry and marked against two. The survey of 2004 proceeded slightly differently by asking respondents to indicate their TWO biggest worries. This is like allowing two “votes” to each respondent with the condition that the two votes shall be used but not in favour of the same “candidate”. In order that the total votes are equal to the total number of respondents, each vote is counted as half a person (respondent). This makes the results of 2004 survey comparable with the surveys of 2001 and 2002 without in any way affecting the relative ranking of the various worries. For details of earlier surveys, see L.C. Gupta, Naveen Jain and Utpal Choudhury, India’s Stock Market & Household Investors 2001-04 (Society for Capital Market Research and Development, Delhi, 2004), pp. 12-13.

(36)
2.14 The year 2001 was a particularly turbulent year for the Indian
stock market. It was marked by a spectacular market crisis in March 2001 due to blatant market manipulation by a big market operator, Ketan Parekh, a la Harshad Mehta. Soon to follow was another blow to the market due to a major crisis in the UTI’s US-64 Unit Scheme.
2.15 The year 2002 saw some reduction in the level of volatility and
manipulation but considerable increase in the investors’ concern about corporate governance. Such increased concern was due to the winds blowing from the western countries, specially the U.S. The Enron and many other corporate scandals in the U.S. had a worldwide echo which reached Indian shores also. Of course, corporate governance has always been a serious problem area in India and even lending banks / financial institutions suffered on this account. However, there was lack of political will to rectify the problem. The severity of corporate governance reforms adopted in the U.S. made Indian authorities also to wake up.
2.16 More recently in India, the concern about price volatility and
manipulation rose suddenly due to the wild gyrations of the Indian share index on May 17, 2004 (which came to be called ‘Black Monday’). It was caused by large-scale net selling by FIIs on account of the prevailing political uncertainty at that time. Political stability was soon restored within a few weeks and the market sentiment went on improving appreciably thereafter. Nevertheless, such events surely increase the stock market’s riskiness and to some extent dents the investors’ general confidence. Our household investors’ survey was started in May 2004 but the bulk of responses were received during July-September, 2004.
(37)
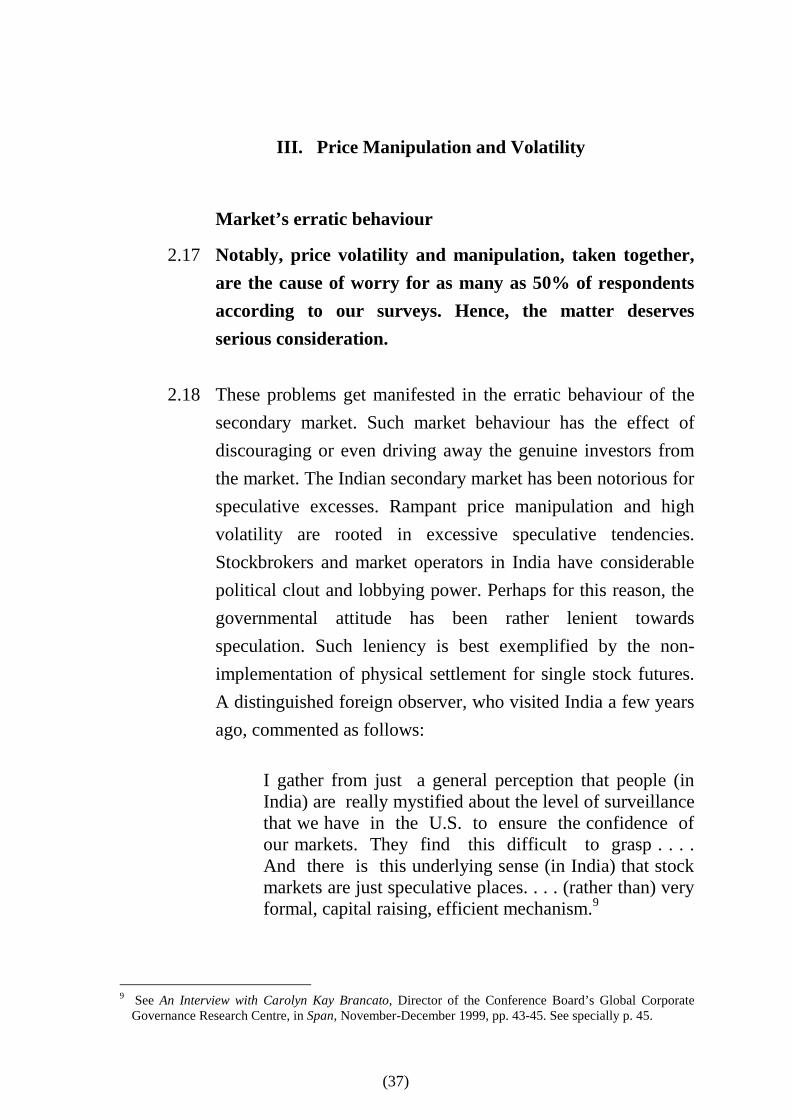
III. Price Manipulation and Volatility
Market’s erratic behaviour
2.17 Notably, price volatility and manipulation, taken together, are the cause of worry for as many as 50% of respondents according to our surveys. Hence, the matter deserves serious consideration.
2.18 These problems get manifested in the erratic behaviour of the
secondary market. Such market behaviour has the effect of discouraging or even driving away the genuine investors from the market. The Indian secondary market has been notorious for speculative excesses. Rampant price manipulation and high volatility are rooted in excessive speculative tendencies. Stockbrokers and market operators in India have considerable political clout and lobbying power. Perhaps for this reason, the governmental attitude has been rather lenient towards speculation. Such leniency is best exemplified by the non-implementation of physical settlement for single stock futures. A distinguished foreign observer, who visited India a few years ago, commented as follows:
I gather from just a general perception that people (in India) are really mystified about the level of surveillance that we have in the U.S. to ensure the confidence of our markets. They find this difficult to grasp . . . . And there is this underlying sense (in India) that stock markets are just speculative places. . . . (rather than) very formal, capital raising, efficient mechanism.9
9 See An Interview with Carolyn Kay Brancato, Director of the Conference Board’s Global Corporate
Governance Research Centre, in Span, November-December 1999, pp. 43-45. See specially p. 45.
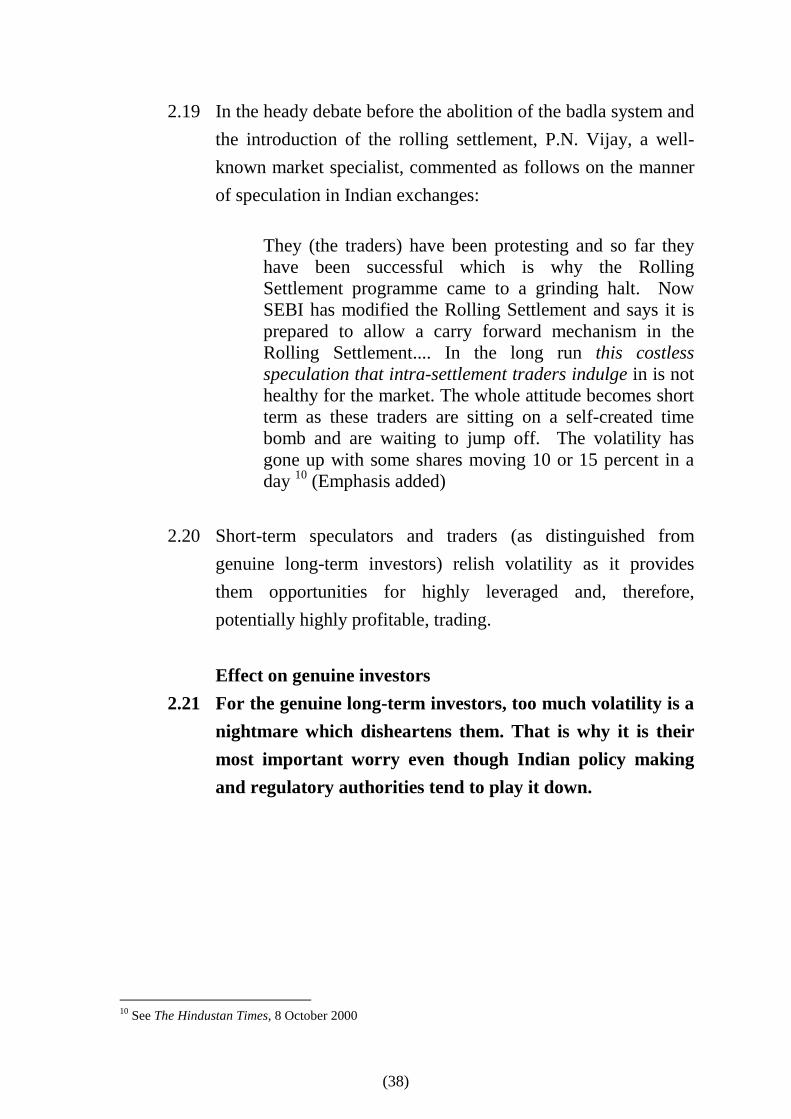
(38)
2.19 In the heady debate before the abolition of the badla system and the introduction of the rolling settlement, P.N. Vijay, a well-known market specialist, commented as follows on the manner of speculation in Indian exchanges:
They (the traders) have been protesting and so far they have been successful which is why the Rolling Settlement programme came to a grinding halt. Now SEBI has modified the Rolling Settlement and says it is prepared to allow a carry forward mechanism in the Rolling Settlement.... In the long run this costless speculation that intra-settlement traders indulge in is not healthy for the market. The whole attitude becomes short term as these traders are sitting on a self-created time bomb and are waiting to jump off. The volatility has gone up with some shares moving 10 or 15 percent in a day 10 (Emphasis added)
2.20 Short-term speculators and traders (as distinguished from genuine long-term investors) relish volatility as it provides them opportunities for highly leveraged and, therefore, potentially highly profitable, trading. Effect on genuine investors
2.21 For the genuine long-term investors, too much volatility is a nightmare which disheartens them. That is why it is their most important worry even though Indian policy making and regulatory authorities tend to play it down.
10 See The Hindustan Times, 8 October 2000

(39)
2.22 The relevant measure of volatility from the viewpoint of long-term investors is not the daily volatility but the yearly volatility as indicated by the ratio between a year’s High-to-Low price. The Economic Times reports the preceding 52-week High / Low prices along with daily price quotations. The yearly High-to-Low ratio for most of the leading stocks in India is quite large, being 1.5:1 or 2:1 or even more. This means a loss of 30-50% in many cases if the investor purchased the stock at the year’s high or it may mean a gain of 50-100% if the purchase was made at the year’s low. Thus, the range of risk (the extent of gain or loss) is very wide.
Wide intra-day movements
2.23 Excessive speculative trading often leads to sharp intra-day price movements of 3-5% frequently and even 8-10% many times in the leading scrips. Such behaviour is at odds with the claim of our stock exchanges that India has deep and liquid markets and the impact cost for fairly large-sized orders is just around 0.1% of the average market price.11 Given the large intra-day price movements, the low impact cost can be misleading. It provides no comfort to the genuine long-term oriented investors. The problem of high intra-day share price movements is worthy of a special investigation by our share market authorities.
Delivery-based trading
2.24 The Indian stock exchanges also claim that the spot market in stocks is a “pure delivery market” although delivery-based
11 According to Indian Government’s Economic Survey 2002-03 (pp. 70-71), the market impact cost of
trades for Rs. 50 lakh of Nifty had come down to around 0.1% of the normal price. It then adds: “This reflects a weighted average of the transactions costs when doing trades on each of the 50 stocks that make up the Nifty index”. This is grossly misleading because this has no relation to delivery-based trades. The impact cost should be measured with reference to delivery-based trades.
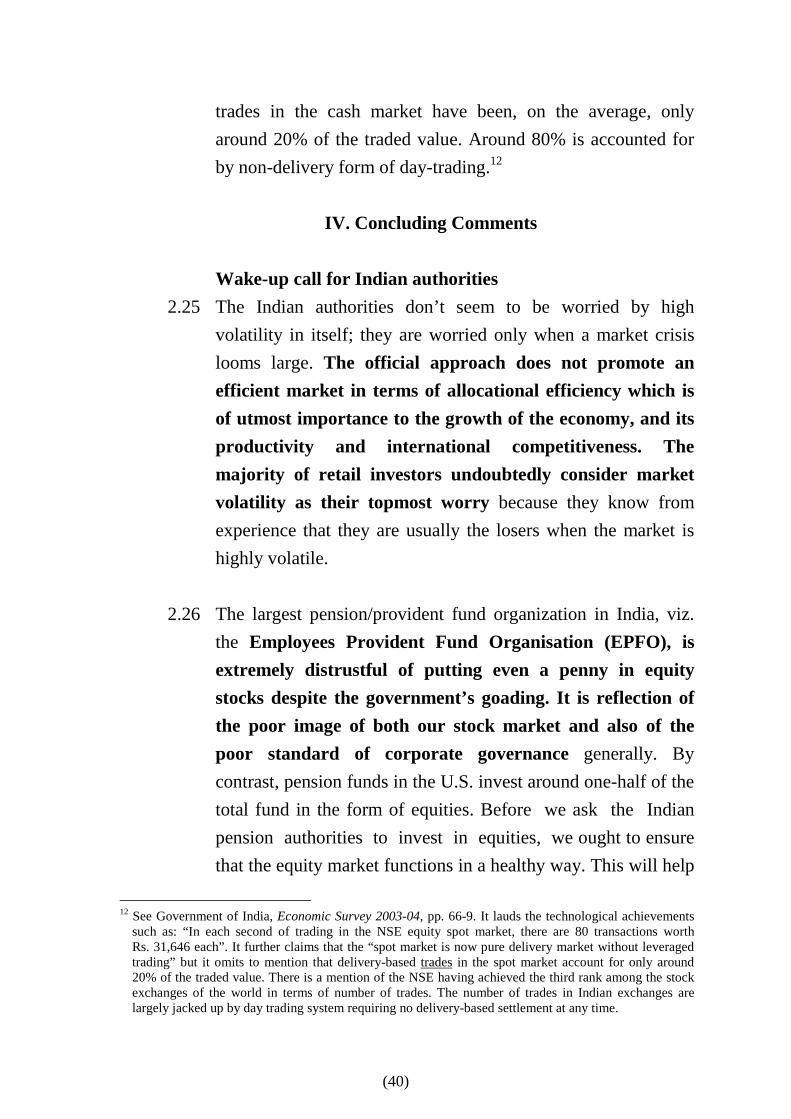
(40)
trades in the cash market have been, on the average, only around 20% of the traded value. Around 80% is accounted for by non-delivery form of day-trading.12
IV. Concluding Comments
Wake-up call for Indian authorities
2.25 The Indian authorities don’t seem to be worried by high volatility in itself; they are worried only when a market crisis looms large. The official approach does not promote an efficient market in terms of allocational efficiency which is of utmost importance to the growth of the economy, and its productivity and international competitiveness. The majority of retail investors undoubtedly consider market volatility as their topmost worry because they know from experience that they are usually the losers when the market is highly volatile.
2.26 The largest pension/provident fund organization in India, viz.
the Employees Provident Fund Organisation (EPFO), is extremely distrustful of putting even a penny in equity stocks despite the government’s goading. It is reflection of the poor image of both our stock market and also of the poor standard of corporate governance generally. By contrast, pension funds in the U.S. invest around one-half of the total fund in the form of equities. Before we ask the Indian pension authorities to invest in equities, we ought to ensure that the equity market functions in a healthy way. This will help
12 See Government of India, Economic Survey 2003-04, pp. 66-9. It lauds the technological achievements
such as: “In each second of trading in the NSE equity spot market, there are 80 transactions worth Rs. 31,646 each”. It further claims that the “spot market is now pure delivery market without leveraged trading” but it omits to mention that delivery-based trades in the spot market account for only around 20% of the traded value. There is a mention of the NSE having achieved the third rank among the stock exchanges of the world in terms of number of trades. The number of trades in Indian exchanges are largely jacked up by day trading system requiring no delivery-based settlement at any time.

(41)
to induce the genuine retail investors also to invest a larger proportion of their savings in corporate stocks
What the economists say
2.27 Keynes had long ago drawn pointed attention to the serious damage to a country’s economy due to excessive short-term speculation. He underlined that a distinction of great importance lies between genuine investment interest and short-term speculative interest. By genuine investment interest he meant the skilled and serious-minded investors who “purchase investments on the best genuine long-term expectations”, and emphasized that market efficiency depended on “whether or not they predominate in their influence over the game-players”.13 His famous remark is worth re-emphasizing:
“Speculators may do no harm as bubbles on a steady stream of enterprise. But the position is serious when enterprise becomes the bubbles on a whirlpool of speculation. When the capital development of a country becomes a by-product of the activities of a casino, the job is likely to be ill-done”.
2.28 Eminent economist Kaldor had argued that the great majority
among speculators are bound to be losers, but they get tempted by the possibility of easy riches. His reasoning was as follows:
“. . . even if speculation as a whole is attended by a net loss, rather than a net gain this will not prove, even in the long run, self-corrective. For the losses of a floating
13 See J.M. Keynes, The General Theory of Employment, Interest and Money, Chapter on “The state of
long-term expectation” and which contains a very detailed and insightful discussion on the problem. See also G. C. Harcourt, “Taming Speculators and Putting the World on Course to Prosperity”, in Economic and Political Weekly, September 17, 1994, pp. 2490-92; and L.C. Gupta, P.K. Jain and C.P. Gupta, Indian Stock Market P/E Ratios (Society for Capital Market Research & Development, Delhi, 1998), pp. 51-2.

(42)
population of unsuccessful speculators will be sufficient to maintain permanently a small body of successful speculators; and the existence of this body of successful speculators will be a sufficient attraction to secure a permanent supply of this floating population. So long as speculators differ in their own degree of foresight, and so long as they are numerous, they need not prove successful in forecasting events outside; they can live on each other.”14
2.29 The objective should be to build a stock market system which will benefit the economy as well as the mass of investors by attracting a growing volume of savings flow and allocating it efficiently to the most productive uses from the economy’s viewpoint. The present design of the Indian stock market, however impressive from technological viewpoint, is faulty in an important respect – it is extremely attractive to speculators and market operators but it is able to garner only a pitiable proportion of the household saving. Its behaviour is characterized by too much price volatility and manipulation, which are the biggest worries of ordinary investors.
14 Nicholas Kaldor, Essays of Economic Stability and Growth (London, 1960), p. 19.

(43)
Chapter 3
INVESTORS’ PERCEPTIONS ABOUT
CORPORATE GOVERNANCE
Why important
3.1 It is well recognised that a good system of corporate governance
facilitates the flow of people’s savings to corporate enterprises.
By contrast, a weak system retards such flow. In the words of
Dyck, “the measure of the strength of a corporate governance
system is the extent and efficiency of investments in
corporations.”15 Corporate governance reform has become a part
of the national agenda in many countries.16 In India, the SEBI has
framed a Code of Corporate Governance which is being
implemented through stock exchange listing rules (Clause 49)
since February 2000. The clause has been revised very recently.
3.2 There is a tendency to assume that the Code has improved the
corporate governance. As part of the present household investor
survey, we have tried to evaluate the situation by examining the
investors’ perceptions in this regard. Our focus is on two distinct
aspects of the operation of the corporate governance system, viz.,
(1) the corporate top management in terms of its accountability to
the shareholders, and (2) the corporate auditors in terms if their
role as ‘independent watchdog’ over the management on behalf
of the “outside” shareholders.
15 I.J. Alexander Dyck, “Ownership Structure, Legal Protections and Corporate Governance,” in the
Proceedings of Annual World Bank Conference on Development Economic, 2000 (World Bank, Washington, D.C. 2001), p. 294.
16 See Business Week (Asia Edition), May 17, 2004, p. 47
(44)
Key questions
3.3 As the term “corporate governance” is not understood by
ordinary people, our questionnaires used the language of the
layman. Our first key question in this regard was as follows:
“Do you believe that Indian company managements are honest and sincere towards their shareholders?”
The respondents were requested to place a tick against one of the
three options, viz., (a) mostly yes, (b) mostly no, and (c) can’t
say.
3.4 Tables 3.1 and 3.2 present an analysis of the replies. The results
have been computed for the whole sample and also for income-
classes (see Table 3.1) and for age-classes (see Table 3.2).
Notably, the largest percentage (around 50%) of respondents
had a negative opinion about company managements, around
30% had a positive opinion and a little above 20% answered
“can’t say”. The negative opinions far exceed the positive ones
for the sample as a whole as also for every income/age class. That
is, there are many more households who do not trust company
managements than those who trust them. Even more striking is
the fact that every income-class and every age-class tells the
same story (see Tables 3.1 and 3.2).
3.5 Company auditors have a very crucial role in corporate
governance. In this regard, our key question to the respondents
was phrased as follows:
“Do you believe that shareholders can rely on
company auditors in preventing financial irregularities by company managements?”
(45)
3.6 Table 3.3 shows that household investors’ opinion is
dominantly negative about company auditors too. Again, this
is true for every income-class and every age-class (Tables 3.3 and
3.4).
3.7 We asked respondents a third question as follows:
“Do you believe that Indian company managements are taking more care of the shareholders’ interest than before?”
Unlike the first two questions, more than one-half of the
respondents were positive in their replies to our third question.
Tables 3.5 and 3.6 present the findings income-classwise and
age-classwise respectively. The findings may be interpreted to
mean that the regulatory pressures on company managements
have started working to some extent even though tangible results
have yet to be achieved. There is some improvement in limited
areas, like redressal of investors’ grievances, as companies are
required to report on grievances remaining unrectified. However,
as our empirical findings have shown, the totality of the picture
about the corporate governance situation in India continues
to be a matter of considerable concern. Tangible achievement
from the viewpoint of “outside” (i.e. non-management)
shareholders is not much to talk about. More effective measures
are needed from the ordinary shareholders’ angle.
Indian situation in international perspective
3.8 In this regard, we are far behind the U.S. and U.K. In these
countries, the power of CEOs to nominate board members has
been taken away from them. Now, this power is vested in a sub-
committee of the Board of Directors, usually called
(46)
“nomination committee”, chaired by an independent director and
comprising mainly of independent directors. The institutional
investors, who hold majority of voting stock in most of the large
American and British listed companies, are an important
influence on board composition. The institutions, as dominant
shareholders, may sometimes dictate specific changes in the
board. They may intervene directly also on crucial corporate
decisions in many cases. They have, for example, forced several
companies to withdraw proposals for granting over-lavish pay
package to CEOs, to dismiss CEOs for poor performance, or to
make changes in the board composition. The institutions are
openly adopting the posture of being guardians for small
investors. This is not yet happening to a desired extent in India.17
3.9 The Naresh Chandra Committee on Corporate Audit and
Governance, in its report submitted to the Department of
Company Affairs in January 2003, admitted that the promoters
usually pack the board of directors with their cronies and indulge
in many abuses, depriving minority shareholders of their rights. It
observed: “In the Indian context, not only a large number of retail investors, but also several creditors, especially financial institutions, will echo this sentiment.”18
The Committee narrated several kinds of frauds or tricks by
which promoters transfer the shareholders’ money into own
coffers. It observed that even where no fraud was committed and
17 In India, pubic-sector investment and financial institutions have generally avoided being outspoken
or openly declaring their voting intentions even when the interest of minority shareholders is involved. Mr. Mark Mobious of Franklin Templeton Mutual Fund has declared the intention to push Indian companies to adopt more fair practices towards minority shareholders. He showed willingness to “gang up” or coordinate with other mutual funds, where necessary, as they do in the U.S. See The Economics Times, November 20, 2004.
18 See the Naresh Chandra Committee Report, Para 1.12 – 1.14.

(47)
there was no destruction of value by the promoter-managers,
“more often than not, wealth has not been fairly shared (with
minority shareholders)”.19
3.10 In our opinion, since the typical Indian listed company is family-
controlled, the corporate governance reform should be designed
to deal with this specific Indian situation. Indian authorities have
borrowed the definition of independent directors from U.K. and
U.S., but have not ensured that such directors will be truly
“independent of management,” i.e. the controlling group.
3.11 Unlike the British and American companies, most Indian
companies, including the largest and well-established ones, have
a controlling family-group which nominates all the board
members. Hence, the independent directors have to depend on the
controlling group for being nominated to the board. How can
such directors be “independent of management”, with whose
support they have been elected and on whom they depend for
continuing as director? The controlling groups would elect as
directors only those whom they like and who may be expected to
be ‘pliable’.
Complexity of Indian situation
3.12 The complexity of corporate governance reform is admittedly
greater in the family-controlled listed companies than in the other
companies. The top management of a company which has no
controlling group, can be dismissed and replaced if the outside
shareholders (such as dominant institutional shareholders) so
demand. In contrast, even the combined might of institutional
19 Ibid.
(48)
shareholders cannot dislodge a controlling group, so long as the
group holds majority of voting power.
3.13 In any case, the corporate governance standards should not be
lower for family-controlled companies which raise at least
some part of their capital from the public. Although the
institutional shareholders in most of the Indian listed companies,
including the largest ones, are minority shareholders, but being
trustees for millions of small investors, they should be enabled to
play a countervailing role to check self-serving practices of
controlling groups. Protecting small investors is an important
societal objective. This can be furthered only if the institutional
shareholders are given more voice. There is no doubt that the
regulation of corporate governance needs to be considerably
tightened in India.
3.14 Recently, The Economist summed up the worldwide ongoing
debate on corporate governance in a very illuminating way. It
first posed the question “What exactly are directors supposed to
be doing” and said that the “obvious” answer was “representing
shareholders”.20 Next it asked whether this was best achieved
when directors “aim to help the chief executive by offering
advice on management or strategy”, or when they view their main
task to be “to monitor a firm’s managers, and make sure they
obey the rules, don’t pay themselves too much and generally
behave”. It concluded that “the primary function of
independent board directors in a large public company is to
monitor the firm’s managers [the controlling family-group in
20 See The Economist, “Board of Directors : No More, Mr. Nice Guy”, March 20, 2004, pp. 16-17
(49)
the Indian context] not to give strategic or managerial
advice”.
Biggest corporate - governance challenge
3.15 We may draw attention to the following pertinent
recommendation made in the White paper on Corporate
Governance in Asia as it is applicable to India:
“The legal and regulatory framework should ensure that non-controlling shareholders are protected from exploitation by insiders and controlling shareholders. The corporate landscape in most Asian countries is characterized by concentrated ownership. In many Asian jurisdictions, there have been instances where controlling shareholders of family-dominated, publicly-listed companies and other enterprises with concentrated ownership have abused their control to exploit other shareholders. Regionally, exploitation of non-controlling shareholders has been identified as the most serious corporate-governance challenge.”21
Institutional shareholders council
3.16 We suggest that a formal device which can be usefully adopted in
India is to constitute an Institutional Shareholders Council, as in
U.K. If business houses have associations / federations to
represent their interests, the institutional shareholders, in their
capacity as shareholders of companies and as trustees for
millions of small shareholders, should also establish a
consultative mechanism for jointly evolving the institutional
shareholders’ policies in cases of companies having
governance problems. Such a Council can be a channel of
communication between institutional shareholders,
businessmen’s federations and Governmental authorities on
matters affecting institutional shareholders.
21 Published in June 2003 under the auspices of the OECD’s Centre for Cooperation with Non-
Members, para 52-3, p. 15.
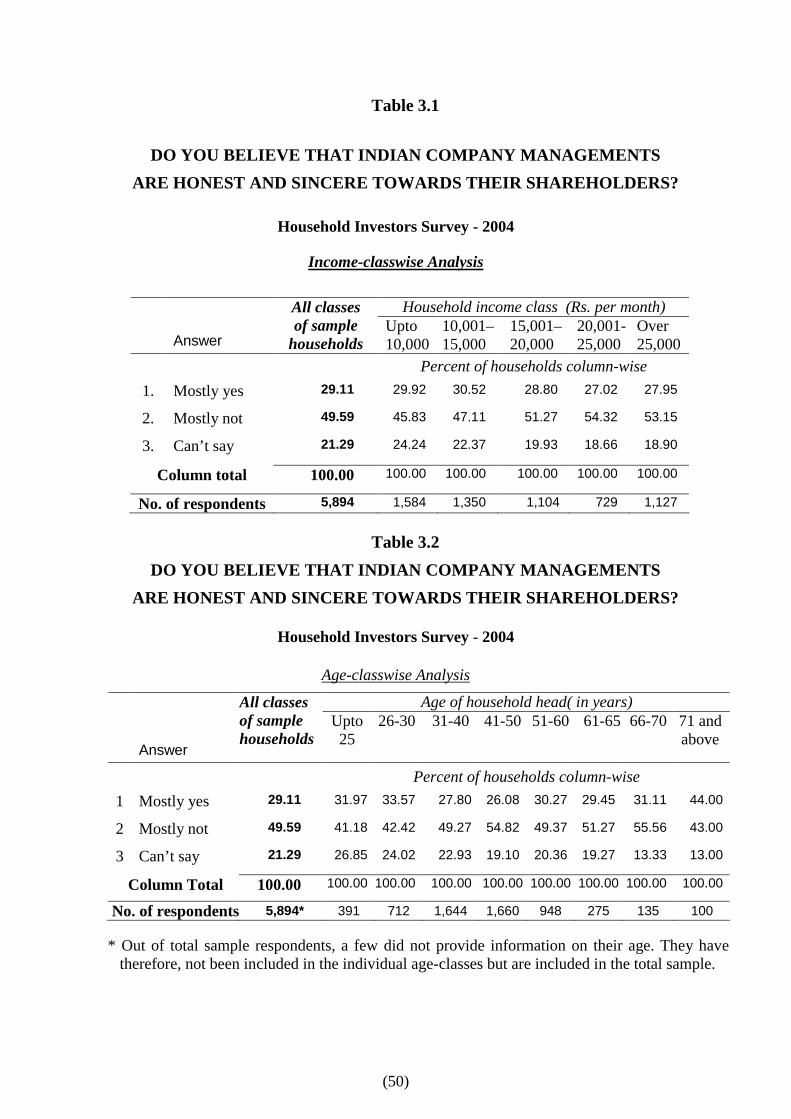
(50)
Table 3.1
DO YOU BELIEVE THAT INDIAN COMPANY MANAGEMENTS ARE HONEST AND SINCERE TOWARDS THEIR SHAREHOLDERS?
Household Investors Survey - 2004
Income-classwise Analysis
Household income class (Rs. per month)
Answer
All classes of sample
households Upto 10,000
10,001– 15,000
15,001– 20,000
20,001- 25,000
Over 25,000
Percent of households column-wise
1. Mostly yes
29.11 29.92 30.52 28.80 27.02 27.95
2. Mostly not
49.59 45.83 47.11 51.27 54.32 53.15
3. Can’t say 21.29 24.24 22.37 19.93 18.66 18.90
Column total 100.00 100.00 100.00 100.00 100.00 100.00
No. of respondents 5,894 1,584 1,350 1,104 729 1,127
Table 3.2 DO YOU BELIEVE THAT INDIAN COMPANY MANAGEMENTS
ARE HONEST AND SINCERE TOWARDS THEIR SHAREHOLDERS?
Household Investors Survey - 2004
Age-classwise Analysis
Age of household head( in years)
Answer
All classes of sample households
Upto 25
26-30 31-40 41-50 51-60 61-65 66-70 71 and above
Percent of households column-wise
1 Mostly yes
29.11 31.97 33.57 27.80 26.08 30.27 29.45 31.11 44.00
2 Mostly not
49.59 41.18 42.42 49.27 54.82 49.37 51.27 55.56 43.00
3 Can’t say
21.29 26.85 24.02 22.93 19.10 20.36 19.27 13.33 13.00
Column Total 100.00 100.00 100.00 100.00 100.00 100.00 100.00 100.00 100.00
No. of respondents 5,894* 391 712 1,644 1,660 948 275 135 100
* Out of total sample respondents, a few did not provide information on their age. They have therefore, not been included in the individual age-classes but are included in the total sample.
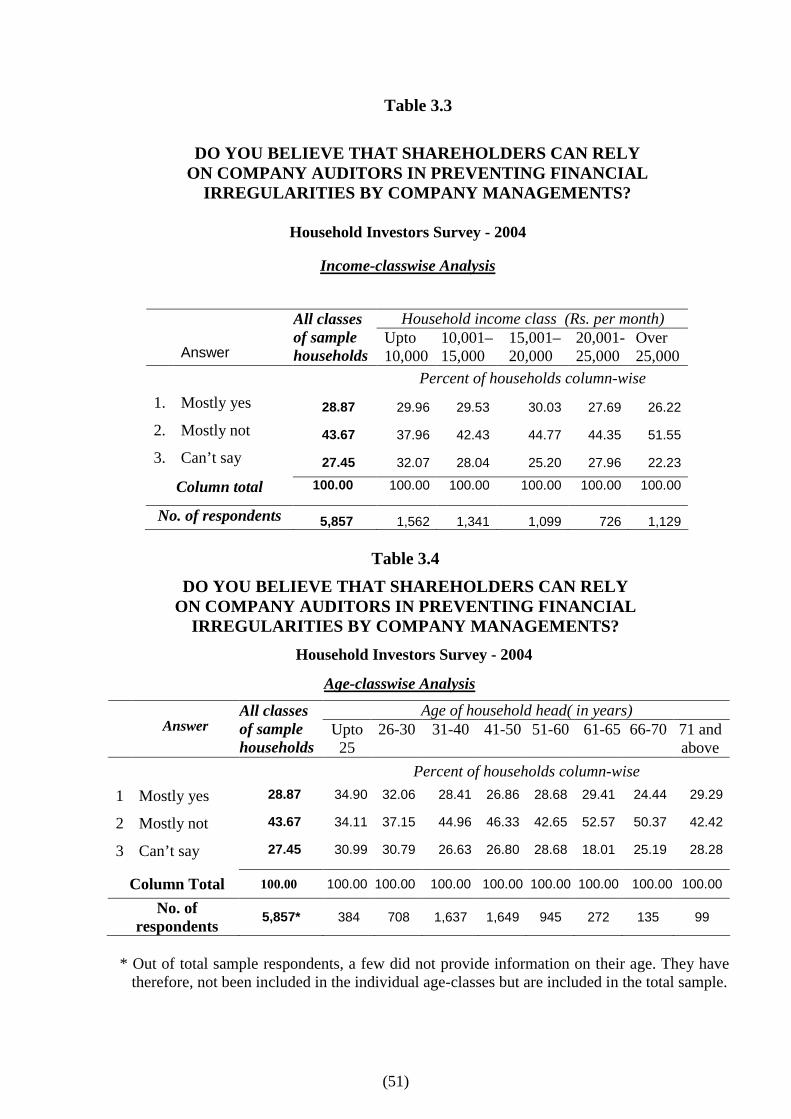
(51)
Table 3.3
DO YOU BELIEVE THAT SHAREHOLDERS CAN RELY ON COMPANY AUDITORS IN PREVENTING FINANCIAL
IRREGULARITIES BY COMPANY MANAGEMENTS?
Household Investors Survey - 2004
Income-classwise Analysis
Household income class (Rs. per month)
Answer
All classes of sample households
Upto 10,000
10,001– 15,000
15,001– 20,000
20,001- 25,000
Over 25,000
Percent of households column-wise
1. Mostly yes
28.87 29.96 29.53 30.03 27.69 26.22
2. Mostly not
43.67 37.96 42.43 44.77 44.35 51.55
3. Can’t say 27.45 32.07 28.04 25.20 27.96 22.23
Column total 100.00 100.00 100.00 100.00 100.00 100.00
No. of respondents
5,857
1,562
1,341
1,099
726
1,129
Table 3.4 DO YOU BELIEVE THAT SHAREHOLDERS CAN RELY
ON COMPANY AUDITORS IN PREVENTING FINANCIAL IRREGULARITIES BY COMPANY MANAGEMENTS?
Household Investors Survey - 2004
Age-classwise Analysis Age of household head( in years)
Answer All classes of sample households
Upto 25
26-30 31-40 41-50 51-60 61-65 66-70 71 and above
Percent of households column-wise
1 Mostly yes
28.87 34.90 32.06 28.41 26.86 28.68 29.41 24.44 29.29
2 Mostly not
43.67 34.11 37.15 44.96 46.33 42.65 52.57 50.37 42.42
3 Can’t say
27.45 30.99 30.79 26.63 26.80 28.68 18.01 25.19 28.28
Column Total 100.00 100.00 100.00 100.00 100.00 100.00 100.00 100.00 100.00
No. of respondents 5,857* 384 708 1,637 1,649 945 272 135 99
* Out of total sample respondents, a few did not provide information on their age. They have
therefore, not been included in the individual age-classes but are included in the total sample.
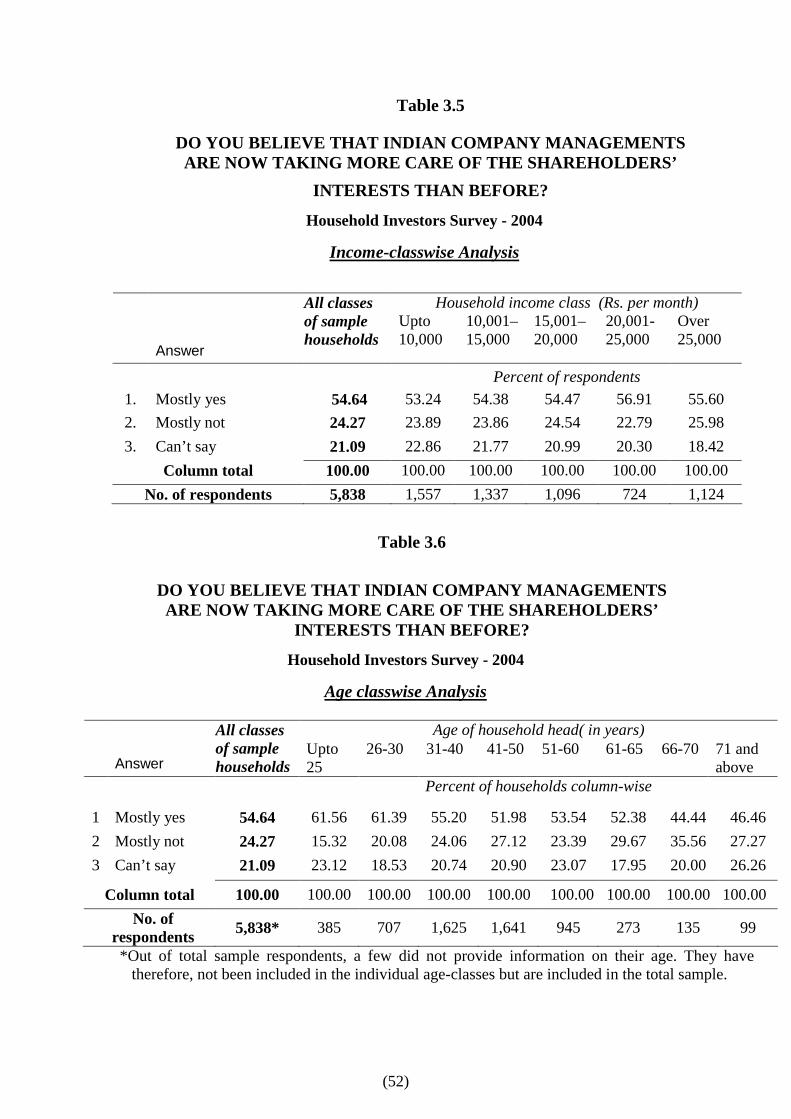
(52)
Table 3.5
DO YOU BELIEVE THAT INDIAN COMPANY MANAGEMENTS ARE NOW TAKING MORE CARE OF THE SHAREHOLDERS’
INTERESTS THAN BEFORE?
Household Investors Survey - 2004
Income-classwise Analysis
Household income class (Rs. per month)
Answer
All classes of sample households
Upto 10,000
10,001– 15,000
15,001– 20,000
20,001- 25,000
Over 25,000
Percent of respondents 1. Mostly yes 54.64 53.24 54.38 54.47 56.91 55.60 2. Mostly not 24.27 23.89 23.86 24.54 22.79 25.98 3. Can’t say 21.09 22.86 21.77 20.99 20.30 18.42
Column total 100.00 100.00 100.00 100.00 100.00 100.00 No. of respondents 5,838 1,557 1,337 1,096 724 1,124
Table 3.6
DO YOU BELIEVE THAT INDIAN COMPANY MANAGEMENTS ARE NOW TAKING MORE CARE OF THE SHAREHOLDERS’
INTERESTS THAN BEFORE?
Household Investors Survey - 2004
Age classwise Analysis
Age of household head( in years)
Answer
All classes of sample households
Upto 25
26-30 31-40 41-50 51-60 61-65 66-70 71 and above
Percent of households column-wise
1 Mostly yes 54.64 61.56 61.39 55.20 51.98 53.54 52.38 44.44 46.46 2 Mostly not 24.27 15.32 20.08 24.06 27.12 23.39 29.67 35.56 27.27 3 Can’t say 21.09 23.12 18.53 20.74 20.90 23.07 17.95 20.00 26.26
Column total 100.00 100.00 100.00 100.00 100.00 100.00 100.00 100.00 100.00 No. of
respondents 5,838* 385 707 1,625 1,641 945 273 135 99
*Out of total sample respondents, a few did not provide information on their age. They have therefore, not been included in the individual age-classes but are included in the total sample.
(53)
Chapter 4
DELISTED COMPANIES
Violation of listing rules
4.1 Most of the companies delisted by stock exchanges in India were
due to violation of the listing agreement,22 implying corporate
misgovernance. As this affects all their shareholders adversely,
our survey has attempted to find out the extent to which delisting
of companies has affected the household investors.
Estimate of affected retail investors
4.2 We asked respondents whether they are shareholders in any
delisted companies controlled by Indian managements23 and, if
so, in what way they have suffered. Tables 4.1 and 4.2 present the
findings. Table 4.1 shows that well over one-third (38%) of the
respondents were shareholders of delisted Indian companies. The
break-up by income and age-classes has some interesting
features.
4.3 It may be observed from our analysis in Table 4.1 that the
percentage of households having shares of delisted companies
steadily increases with income and age. The increase is much
sharper in the case of age classes; from 20% in the lowest age
class (upto 25 years) to 50% in the case of the highest age-class 22 303 companies were delisted from the BSE in the year April 2003-March 2004. Most of these
companies were delisted for violation of the listing agreement, while a few were delisted after their merger or amalgamation with other companies. Of the 303 firms, 246 companies were delisted from the BSE in January 2004, after the SEBI’s delisting guidelines came into force. These stocks were already suspended by the Sebi for violation of listing agreement clauses for more than five years. Forty-four companies were delisted after they had merged or amalgamated with other companies while another 13 companies were delisted after their parent company acquired more than a 90% stake. (Business Standard, April 9, 2004, as cited in Capital Market Chronicle, published by SHCIL, May 7, 2004 p. 24.
23 Delisting of foreign-controlled companies involves very different issues and the reasons are different.
(54)
(above 71 years). The explanation for this is that more of the
people in the higher income classes and higher age-classes
became shareholders during the roaring bull market of early
1990s. A lot of bogus or unsound companies were floated during
those years. Investors who entered the market in more recent
years had become more cautious. There has also been tightening
of the application of listing rules. This has induced many
promoters to get their companies delisted. The SEBI has recently
tried to stop the misuse of delisting by promoters at the cost of
the shareholders.
4.4 The exact number of companies which have already been delisted
is not known. Our rough guess is that such number may be as
high as 2000 or even 3000, in addition to the Z-group companies.
According to the SEBI Annual Report 2001-02, the total number
of companies listed on the Indian stock exchanges was 9644
(excluding double counting of companies listed on two or more
exchanges). The SEBI annual reports for subsequent years give
no figure of listed companies.
4.5 The BSE had 6330 listed companies.24 Of these, as many as
3500 were in Z group which comprises companies not complying
with listing agreement. Companies already delisted fall outside
the SEBI’s regulatory authority. The respondents to our survey
have many complaints against delisted companies, such as that
shares are unsaleable, share value has been destroyed, companies
are not paying any dividend and not sending annual reports.
Table 4.2 presents the detailed data.
24 See BSE, The Stock Exchange Review, October 2003, P-11

(55)
4.6 If we consider Tables 4.1 and 4.2 together, interesting inferences
emerge. Of the respondents who held shares in delisted
companies, 80% complained that such shares are unsaleable, 60%
complained that share value had been destroyed, 53% that these
companies don’t pay dividend and 63% that such companies do
not send annual reports. It may be observed from Table 4.2 that
this pattern is true of all income and age classes.
4.7 A huge number of our respondents are shareholders of delisted
companies. These companies have already gone out of SEBI’s
jurisdiction. They had made initial public offer and had collected
money from the public mostly during the boom years of early
1990s. A rough estimate of the total number of shareowning
households who held shares of delisted companies may be made
as follows: Roughly 4% of total Indian households are estimated
to be shareowners.25 The number of shareowning households can
be derived to be around 80 lakh out of a little over 20 crore total
households in India. As many as 38% of our sample households
held shares in delisted companies. Applying the same
percentages to the total number of share-owning households in
India means that around 30 lakh households would be having
shares of some delisted companies. This is a frightening figure.
Many of these would be dud companies, but not all.
4.8 Given such a large number of sufferers among ordinary investors,
special provision in company law is needed to protect outside
shareholders of delisted companies. These companies were not
complying with the listing agreement, very often deliberately in
order to get delisted and free the management from the strict 25 The SEBI-NCAER Surveys have estimated the percentage to be almost twice which is definitely an
over-estimate. See L. C. Gupta, C. P. Gupta and Naveen Jain, Indian Households’ Investment Preferences (Society for Capital Market Research & Development, Delhi, 2001), pp. 120-21.

(56)
listing rules. Their managements should have been punished long
ago. Not all these companies are bankrupt. From what we hear,
many of them are running businesses. Their managements may
be deriving lavish benefits from the companies in a variety of
ways. In the U.S., many of these company managements would
have been severely punished for playing a fraud on the
shareholders.
Need for further research
4.9 Delisted companies are a fit subject for a full-scale research
study, specially to understand the true reasons why they were
delisted, the motives of the management, the number of
shareholders of individual delisted companies, the year in which
they made public issue, their latest financial position as per
annual reports, specially to find out whether the auditors’ report
had disclosed any financial irregularities and had certified the
accounts on going-concern basis. The proposed study should also
examine shareholders’ complaints about these companies. This
could be of great help in deriving regulatory lessons for the
protection of investors.
Legal changes needed
4.10 Certain changes in company law seem necessary to enable
shareholder action against managements of delisted companies.
The Companies Act, in Sections 397-408, presently provides that
complaint about oppression or mismanagement can be made to
the Company Law Board if at least 100 shareholders holding at
least 10% of voting shares join hands to make such a complaint.
When shareholders are dispersed, such action by shareholders is
rarely possible. Experience has shown that the existing company
law provisions are too cumbersome to be workable. In the case of
(57)
most delisted companies, prima facie there was mismanagement.
It is, therefore, suggested that present legal provision be amended
as follows. A smaller number of, say, at least 20 shareholders,
holding among them at least 5% of the equity share capital,
should be allowed to make a complaint to the Company Law
Board about oppression or mismanagement. Secondly, we also
suggest that legal provision should specially facilitate class-
action suits by shareholders against the directors and top
executives of companies. Through class-action suits, shareholders
should be enabled to claim damages due to mismanagement and
fraud which had led to delisting of the company. Another
suggestion worth considering is that delisted companies should
be required to adopt the principle of proportional representation
by single transferable vote for constituting their Boards of
Directors. This will facilitate some outside shareholders’
representation on the board of directors. These outsiders can keep
a watch on the company management for protecting the interests
of shareholders.26
26 The Companies Act also allows companies to constitute their board of directors on the basis of
proportional representation (usually by adopting a cumulative voting system) on the presumption that it will facilitate some representation of minority shareholders on the board of directors. Such representatives are expected to keep a check on the management, i.e. the controlling group. However, no company is known to have adopted this system. This fact is that no controlling group would voluntarily give up the absolute power enjoyed by it. Under the ordinary voting system, a shareholder is entitled to cast as many votes as the number of shares he holds. Suppose a total of 8 directors are to be elected. A person holding 51% shares can elect all the 8. The proportional representation system in the form of cumulative voting has been devised to prevent such monopolization of the board of directors by the majority shareowner. Under this system of voting, each stockholder has as many votes as is equal to the number of voting shares he owns, multiplied by the number of directors to be elected. In the above example, a person owning 1000 shares will have 1000×8=8000 votes. He may give all the votes to one candidate or may distribute his votes among the candidates of his choice in any way he sees fit. This may enable a group of minority shareholders to elect one or two directors, depending on the size of minority shareholding. See Section 265, Companies Act, 1956.
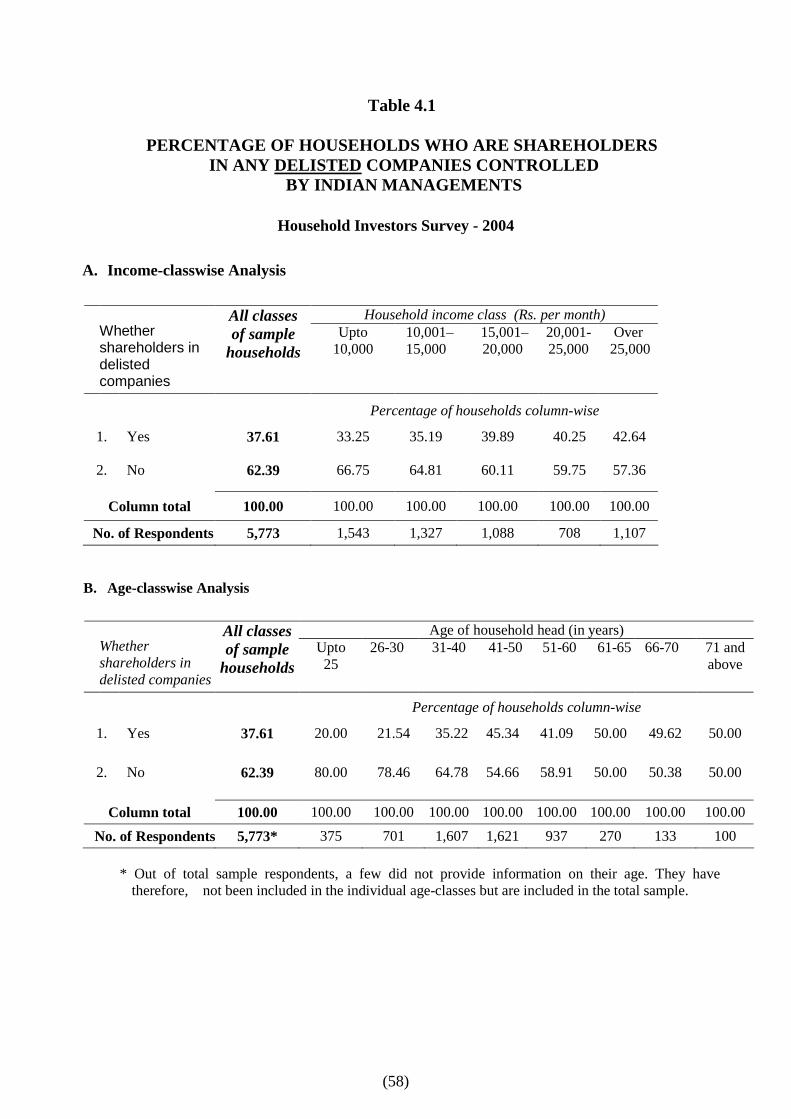
(58)
Table 4.1
PERCENTAGE OF HOUSEHOLDS WHO ARE SHAREHOLDERS IN ANY DELISTED COMPANIES CONTROLLED
BY INDIAN MANAGEMENTS
Household Investors Survey - 2004
A. Income-classwise Analysis
Household income class (Rs. per month) Whether shareholders in delisted companies
All classes of sample
households Upto
10,000 10,001– 15,000
15,001– 20,000
20,001- 25,000
Over 25,000
Percentage of households column-wise
1. Yes 37.61 33.25 35.19 39.89 40.25 42.64
2. No 62.39 66.75 64.81 60.11 59.75 57.36
Column total 100.00 100.00 100.00 100.00 100.00 100.00
No. of Respondents 5,773 1,543 1,327 1,088 708 1,107
B. Age-classwise Analysis
Age of household head (in years) Whether shareholders in delisted companies
All classes of sample
households Upto
25 26-30 31-40 41-50 51-60 61-65 66-70 71 and
above
Percentage of households column-wise
1. Yes 37.61 20.00 21.54 35.22 45.34 41.09 50.00 49.62 50.00
2. No 62.39 80.00 78.46 64.78 54.66 58.91 50.00 50.38 50.00
Column total 100.00 100.00 100.00 100.00 100.00 100.00 100.00 100.00 100.00
No. of Respondents 5,773* 375 701 1,607 1,621 937 270 133 100 * Out of total sample respondents, a few did not provide information on their age. They have
therefore, not been included in the individual age-classes but are included in the total sample.
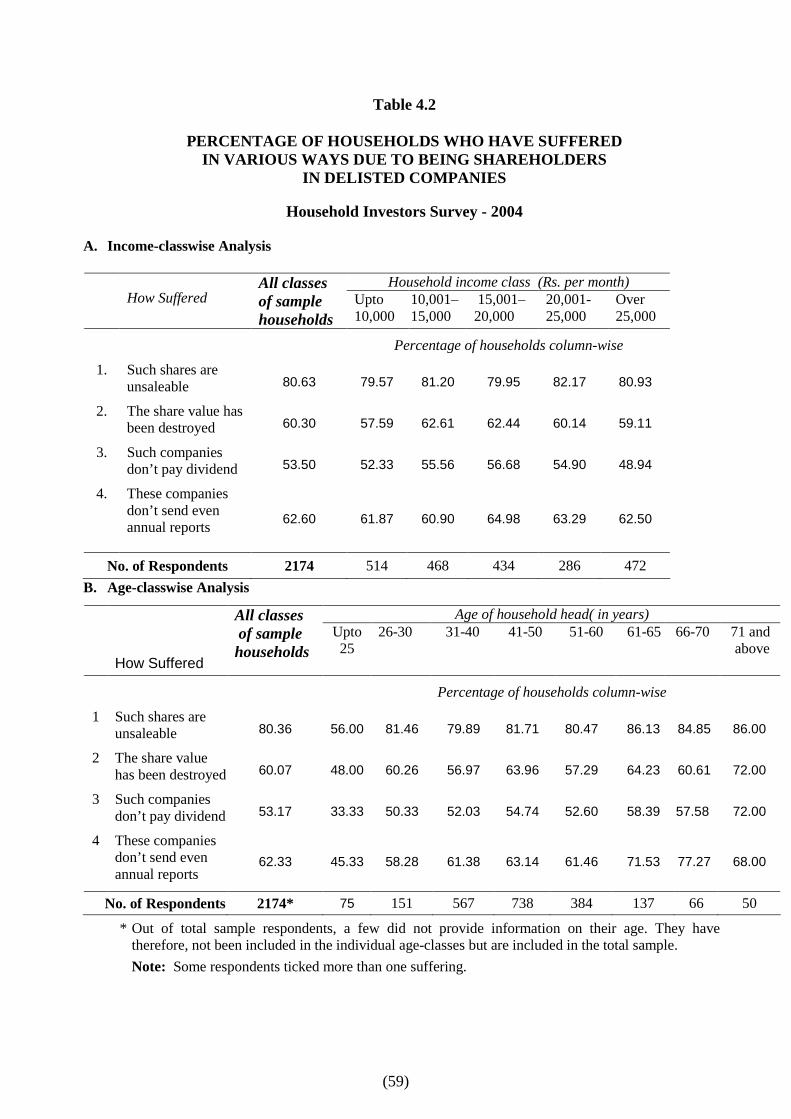
(59)
Table 4.2
PERCENTAGE OF HOUSEHOLDS WHO HAVE SUFFERED IN VARIOUS WAYS DUE TO BEING SHAREHOLDERS
IN DELISTED COMPANIES
Household Investors Survey - 2004
A. Income-classwise Analysis
Household income class (Rs. per month) How Suffered
All classes of sample households
Upto 10,000
10,001– 15,000
15,001– 20,000
20,001- 25,000
Over 25,000
Percentage of households column-wise
1. Such shares are unsaleable
80.63 79.57 81.20 79.95 82.17 80.93
2. The share value has been destroyed
60.30 57.59 62.61 62.44 60.14 59.11
3. Such companies don’t pay dividend
53.50 52.33 55.56 56.68 54.90 48.94
4. These companies don’t send even annual reports
62.60 61.87 60.90 64.98 63.29 62.50
No. of Respondents 2174 514 468 434 286 472 B. Age-classwise Analysis
Age of household head( in years)
How Suffered
All classes of sample households
Upto 25
26-30 31-40 41-50 51-60 61-65 66-70 71 and above
Percentage of households column-wise
1 Such shares are unsaleable
80.36 56.00 81.46 79.89 81.71 80.47 86.13 84.85 86.00
2 The share value has been destroyed
60.07 48.00 60.26 56.97 63.96 57.29 64.23 60.61 72.00
3 Such companies don’t pay dividend
53.17 33.33 50.33 52.03 54.74 52.60 58.39 57.58 72.00
4 These companies don’t send even annual reports
62.33 45.33 58.28 61.38 63.14 61.46 71.53 77.27 68.00
No. of Respondents 2174* 75 151 567 738 384 137 66 50
* Out of total sample respondents, a few did not provide information on their age. They have therefore, not been included in the individual age-classes but are included in the total sample.
Note: Some respondents ticked more than one suffering.
(60)
Chapter 5
INDIAN MUTUAL FUND INDUSTRY AND THE RETAIL INVESTOR
I. Introduction
Mutual funds as product innovation
5.1 Mutual funds were undoubtedly an important product innovation in the
financial field, as an instrument of raising capital from the wider public
for corporate enterprise growth. Historically, mutual funds, originally
called unit trusts in the U.K., were invented for the mass of relatively
small investors. Most such investors have inadequate knowledge and face
difficulty, not only in choosing the right stocks but also in managing the
risk because they can not achieve sufficient diversification with only a
small amount to invest.1 A striking finding brought out by this study is
that a majority of retail investors in India do not regard mutual fund
equity schemes as a superior investment alternative to direct holding
of equity shares.
Layout of the chapter
5.2 Section II, which follows this brief introduction, will present the
empirical findings. These findings are based on the industry’s situation as
prevailing today. Section III presents a flashback to indicate the enormity
of the structural change in the Indian mutual fund industry in recent years.
This has a bearing on the trend of change in the near future and the
factors underlying the change. Concluding comments are offered in
Section IV.
1 See L. C. Gupta, The Changing Structure of Industrial Finance in India (Claredon Press, Oxford, London
1969), p. 64. Even a novice investor, by investing a small sum in mutual fund units, immediately gets the advantage of diversifying his investment over scores, or hundreds, of companies, selected by full-time professional managers. The investor can easily follow the performance of his mutual fund investment by simply looking at the weekly reported NAV of his fund. If he needs money, he can liquidate the investment any day in the case of open-ended mutual fund schemes.

(61)
Empirical Evidence on Retail Investors’ Preferences
5.3 A very important question on which we shall focus is: Do the
majority of Indian retail investors regard mutual fund equity
schemes as being a superior investment alternative compared to
direct shareholding? In a sense, it tests the practical validity of the
theory underlying the original purpose of mutual funds.
5.4 In India, the Unit Trust of India (UTI), created in 1964, had
complete monopoly of mutual fund business upto 1988. The other
MF organisations have a very short history because the MF industry
was opened to limited competition in 1988 and almost free
competition in the 1990s only.
5.5 In the U.S., where mutual funds have a long history, there exists
much theoretical literature on whether mutual fund managers are
actually able to “beat the market”, i.e. secure a return higher than the
market’s average rate of return based on a representative market
index.2 Such an investigation can be hardly meaningful in India at
the present stage of the industry. Hence, we decided to proceed from
a different angle by examining the retail investors’ own
perceptions about mutual funds as a vehicle for accumulating
savings. This is best brought out by determining the retail
investors’ preference between mutual fund products on the one
hand and direct holding of equity shares on the other.
2 Some perceptive market practitioners as well as scholarly studies in the U.S. had come to the conclusion that
most fund managers most of the time do worse than the market average after allowing for management fees, expenses, and brokerage. The wide recognition of such failure led to the emergence of index funds. See Peter Lynch and John Rothchild, Learn to Earn (New York, 1995), pp. 124-5. See also Josef Lakonishok, Andrei Shleifer and Robert W. Vishny, “The Structure and Performance of Money Management Industry”, in Brookings Papers: Microeconomics, 1992, pp. 339-391, sp. pp. 354-56.

(62)
5.6 Our method is based on interviewing of household heads, as already
explained earlier in the Chapter 1.
Multi-dimensional analysis
5.7 In order to determine the investors’ preferences reliably, we adopted a
multi-dimensional approach by collecting from household heads a variety
of information regarding their investment activities, such as:
(a) the investment types presently held by them;
(b) future investment intentions;
(c) their past experiences; and
(d) their choices of investment types in a hypothetical investment game. This game was devised because not many households are prepared to disclose the actual amount of their savings and investments. Our game used a notional sum and asked the investors to indicate how much of this sum would they like to ‘bet’ on each investment type. Even though hypothetical, it did throw more light on the households’ thinking about the relative merits of a wide range of investment types. The findings from all the angles show that the investor’s preference for mutual fund products is far behind that for direct equity shareholding.
5.8 The main findings are presented in this chapter for the total sample of
households. Detailed disaggregated analysis by income-class and age-
class will be presented later in Chapter 7 along with a broader
examination of households’ investment preferences.
Investment types owned by households
5.9 The order of preferences for the various investment types can be
determined on the basis of market penetration of each investment type.
Our main focus is on capital market instruments, distinguished into the
following five types: (a) direct equity shareholding, (b) mutual fund
schemes (all types combined), (c) infrastructure tax-saving bonds, (d)
non-govt. company bonds and (e) PSU bonds. The findings are shown in
Chart 5.1 along with Table 5.1.

(63)
Table 5.1 and Chart 5.1
PERCENTAGE OF TOTAL SAMPLE HOUSEHOLDS OWNING VARIOUS CAPITAL MARKET INSTRUMENTS:
(HOUSEHOLD INVESTORS’ SURVEY 2004)
Capital Market Instruments
Per cent of Households
(a) Equity shares 81.74
(b) Any mutual fund schemes 33.21
(c) Infrastructure tax-saving bonds 10.95
(d) Bonds/debentures of non-govt. Cos. 17.16
(e) Bonds/debentures of PSUs 30.79
No. of sample households 5908
81.74
33.21
10.9517.16
30.79
0
10
20
30
40
50
60
70
80
90
Equity shares Any mutualfund schemes
Infrastructuretax-saving
bonds
Non-govt. Co.bonds.
PSU bonds
Per C
ent o
f Hou
seho
lods
Note: PSU = Public Sector Undertaking.
5.10 The most noteworthy finding in the present context is that the percentage
of households who owned equity shares directly is more than 2½
times the percentage of those who owned any mutual fund schemes.
Thus, on a very simple criterion of how popular the various investment
types are, the mutual funds are far behind direct shareholding.
Future intentions
5.11 Our next criterion was based on the retail investors’ future investment
intentions with respect to capital market instruments. We asked them:
How likely are you to make “net addition” during the next one year
to investment in (1) equity shares, (2) mutual fund equity / growth
schemes, (3) mutual fund income schemes and (4) private sector company
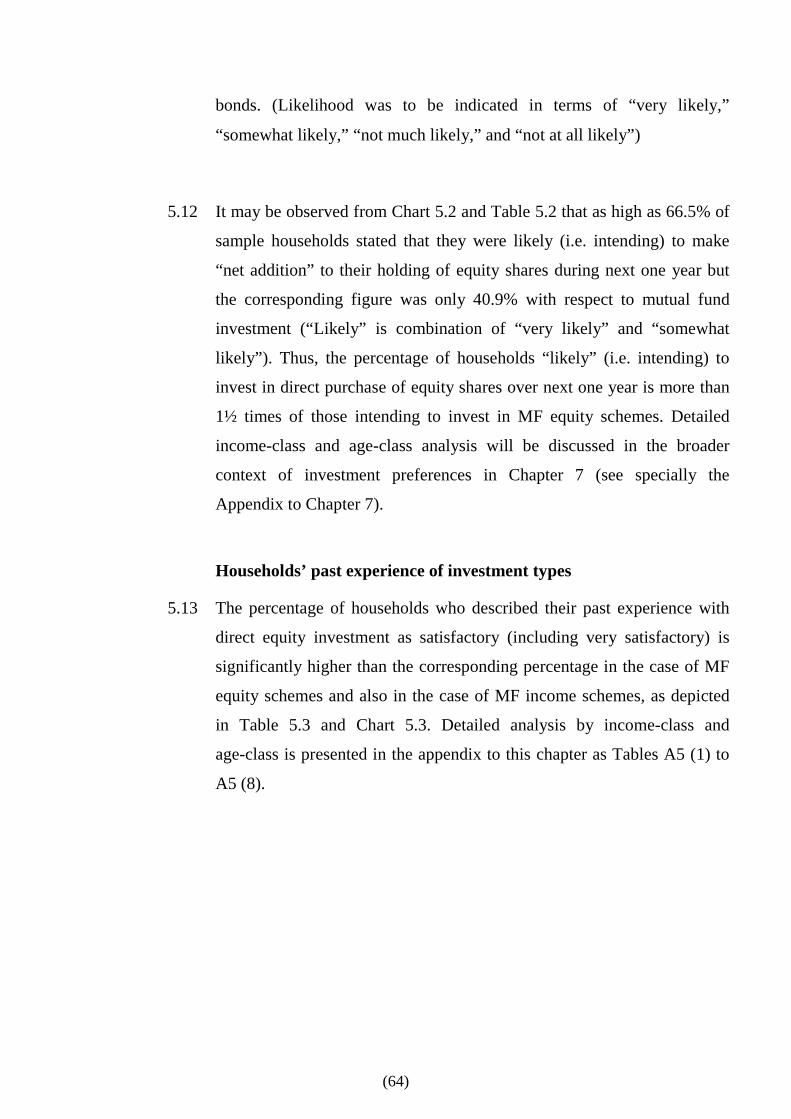
(64)
bonds. (Likelihood was to be indicated in terms of “very likely,”
“somewhat likely,” “not much likely,” and “not at all likely”)
5.12 It may be observed from Chart 5.2 and Table 5.2 that as high as 66.5% of
sample households stated that they were likely (i.e. intending) to make
“net addition” to their holding of equity shares during next one year but
the corresponding figure was only 40.9% with respect to mutual fund
investment (“Likely” is combination of “very likely” and “somewhat
likely”). Thus, the percentage of households “likely” (i.e. intending) to
invest in direct purchase of equity shares over next one year is more than
1½ times of those intending to invest in MF equity schemes. Detailed
income-class and age-class analysis will be discussed in the broader
context of investment preferences in Chapter 7 (see specially the
Appendix to Chapter 7).
Households’ past experience of investment types
5.13 The percentage of households who described their past experience with
direct equity investment as satisfactory (including very satisfactory) is
significantly higher than the corresponding percentage in the case of MF
equity schemes and also in the case of MF income schemes, as depicted
in Table 5.3 and Chart 5.3. Detailed analysis by income-class and
age-class is presented in the appendix to this chapter as Tables A5 (1) to
A5 (8).

(65)
Table 5.2
ANALYSIS OF TOTAL SAMPLE HOUSEHOLDS ACCORDING TO HOW LIKELY THEY ARE TO MAKE NET ADDITION
TO INVESTMENTS IN THE FOLLOWING TYPES DURING NEXT ONE YEAR?
(SURVEY 2004)
Percent of Responses
How likely
Equity shares
MF equity schemes
MF income schemes
Non-govt. co. bonds
1. Very likely 41.84 16.23 13.09 4.76 2. Somewhat likely 24.67
24.68 21.52 8.43
Subtotal (1+2)
66.51 40.91 34.61 13.19 3. Not much likely 13.36 17.71 19.10 15.10 4. Not at all likely 20.12 41.38 46.28 71.71
Subtotal (3+4)
33.48 59.09 65.38 86.81
Column total 100.00 100.00 100.00 100.00 No. of Respondents 5,597 4,867 4,758 4,624
Chart 5.2 Intending Investors
34.61%Likely
40.91%Likely
66.51% Likely
33.48%Not likely
59.09%Not likely
65.38%Not likely
0%
20%
40%
60%
80%
100%
Equity shares MF equityschemes
MF incomeschemes
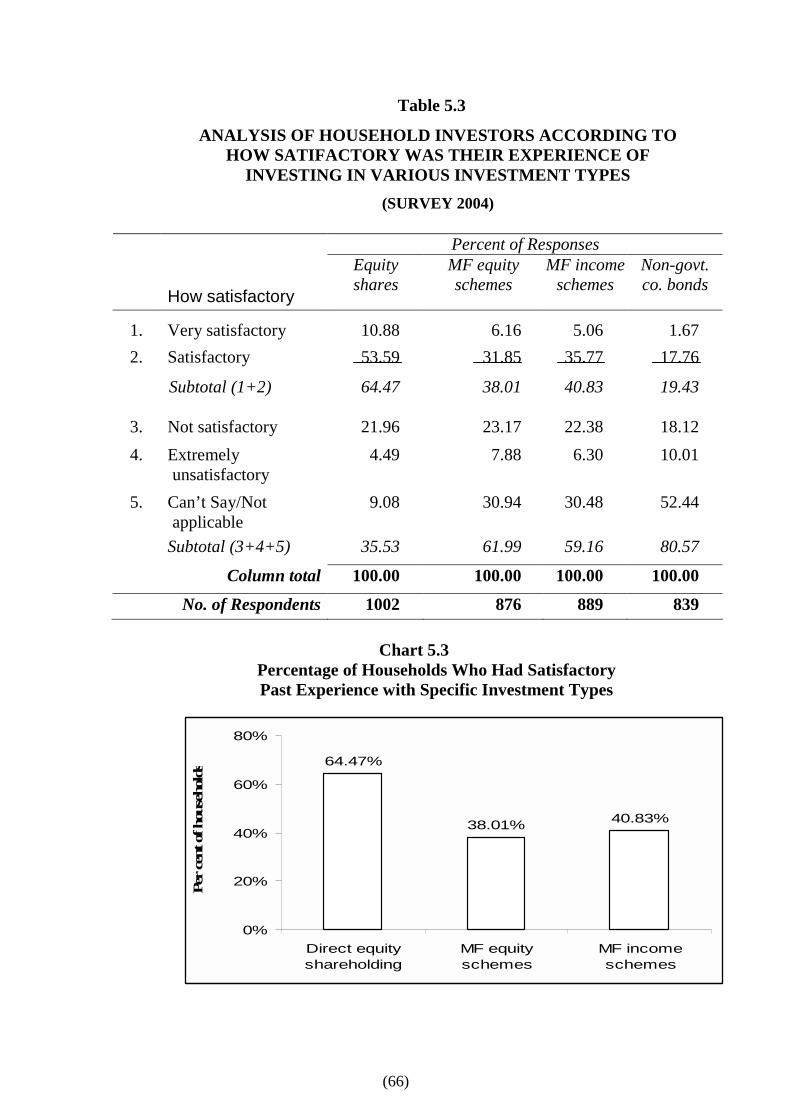
(66)
Table 5.3
ANALYSIS OF HOUSEHOLD INVESTORS ACCORDING TO HOW SATIFACTORY WAS THEIR EXPERIENCE OF
INVESTING IN VARIOUS INVESTMENT TYPES
(SURVEY 2004)
Chart 5.3
Percentage of Households Who Had Satisfactory Past Experience with Specific Investment Types
64.47%
38.01% 40.83%
0%
20%
40%
60%
80%
Direct equityshareholding
MF equityschemes
MF incomeschemes
Per ce
nt o
f hou
seho
lds
Percent of Responses
How satisfactory
Equity shares
MF equity schemes
MF income schemes
Non-govt. co. bonds
1. Very satisfactory 10.88 6.16 5.06 1.67 2. Satisfactory 53.59
31.85 35.77 17.76
Subtotal (1+2)
64.47 38.01 40.83 19.43
3. Not satisfactory 21.96 23.17 22.38 18.12 4. Extremely
unsatisfactory
4.49 7.88 6.30 10.01
5. Can’t Say/Not applicable
9.08 30.94 30.48 52.44
Subtotal (3+4+5)
35.53 61.99 59.16 80.57
Column total 100.00 100.00 100.00 100.00
No. of Respondents 1002 876 889 839
(67)
Investment game
5.14 The Investment game was devised by us to peep into the investor’s mind a
little more deeply than is possible by head-count only. The game asked
investors to allocate a notional sum of Rs. 100,000 among different
investment types, chosen from a given list of 10 major types but restricting
their allocation to not more than 5 types. The 10 types from which the
respondents had to choose comprised not only capital market instruments
but also bank fixed deposits and government savings schemes.
5.15 For practical reasons, we asked respondents to choose investment types
from our restricted list only. This artificial restriction was intended to make
the exercise easier and less time-consuming. The purpose of the game was
to understand the retail investor’s relative preferences between any
pairs of investment types from our list. Even though the percentages are
artificial (and would not match the national data on financial savings
compiled by the RBI), they are good enough for comparisons within the
given investment types.
5.16 Table 5.4 shows the percentage of the notional sum allocated to various
investment types by all the sample households taken together. Chart 5.4
highlights that direct equity shareholding gets nearly four times as much
allocation as mutual fund equity schemes and twice as much allocation
as all types of mutual fund schemes combined. The sub-classes of mutual
fund schemes are also shown in Chart 5.4. It may be observed from Table
5.4 that only the government savings schemes have a higher allocation than
direct equity shareholding and that bank fixed deposits are also a highly
preferred type of investment but less preferred than government savings
schemes. There are very few takers for non-govt. company bonds. Bonds of
PSUs and financial institutions are far more preferred than private sector
bonds.
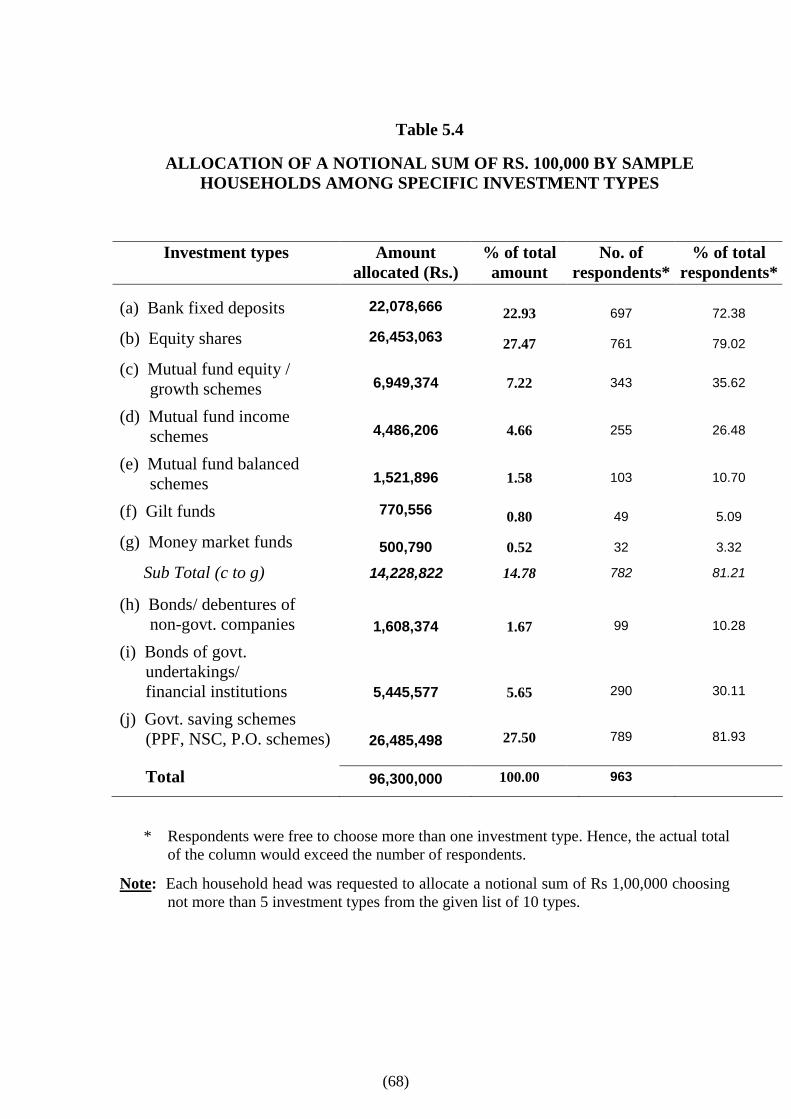
(68)
* Respondents were free to choose more than one investment type. Hence, the actual total of the column would exceed the number of respondents.
Note: Each household head was requested to allocate a notional sum of Rs 1,00,000 choosing not more than 5 investment types from the given list of 10 types.
Table 5.4
ALLOCATION OF A NOTIONAL SUM OF RS. 100,000 BY SAMPLE HOUSEHOLDS AMONG SPECIFIC INVESTMENT TYPES
Investment types Amount allocated (Rs.)
% of total amount
No. of respondents*
% of total respondents*
(a) Bank fixed deposits
22,078,666 22.93 697 72.38
(b) Equity shares
26,453,063 27.47 761 79.02
(c) Mutual fund equity / growth schemes
6,949,374 7.22 343 35.62
(d) Mutual fund income schemes
4,486,206 4.66 255 26.48
(e) Mutual fund balanced schemes
1,521,896 1.58 103 10.70
(f) Gilt funds
770,556 0.80 49 5.09
(g) Money market funds
500,790 0.52 32 3.32
Sub Total (c to g) 14,228,822 14.78 782 81.21
(h) Bonds/ debentures of non-govt. companies
1,608,374
1.67
99
10.28
(i) Bonds of govt. undertakings/ financial institutions
5,445,577
5.65
290
30.11
(j) Govt. saving schemes (PPF, NSC, P.O. schemes) 26,485,498
27.50
789
81.93
Total 96,300,000 100.00 963
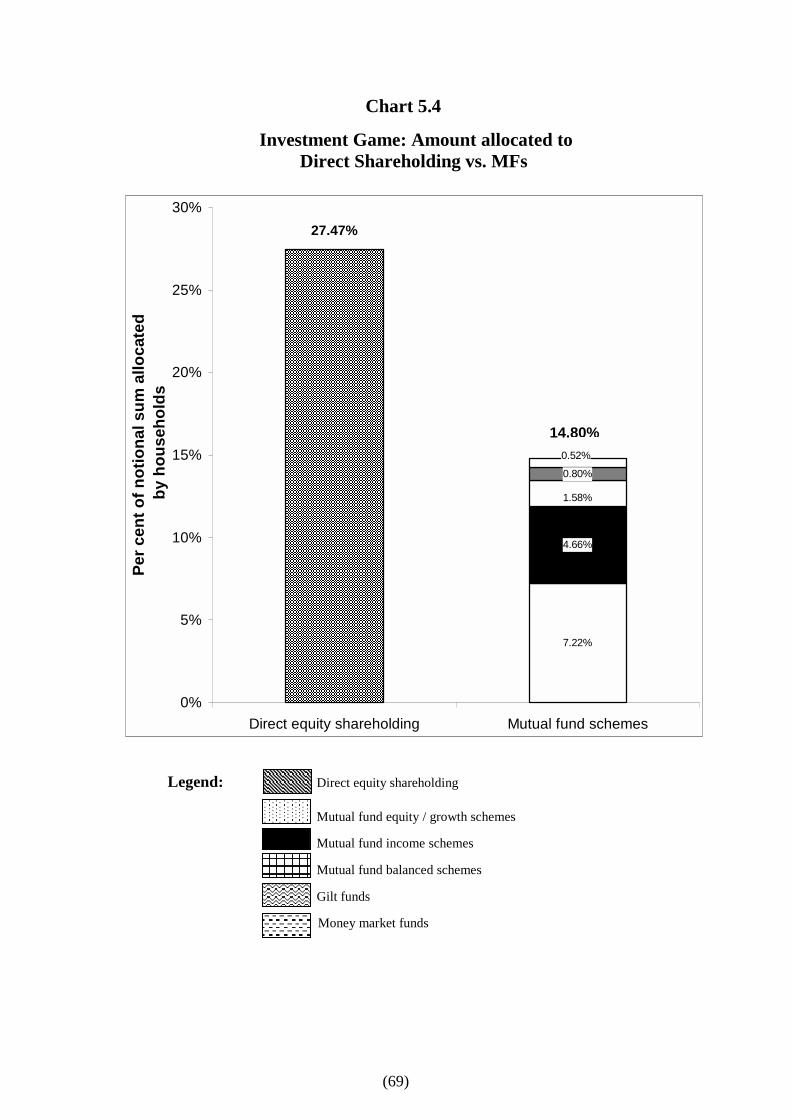
(69)
Chart 5.4
Investment Game: Amount allocated to Direct Shareholding vs. MFs
27.47%
0%
5%
10%
15%
20%
25%
30%
Direct equity shareholding Mutu
Per c
ent o
f not
iona
l sum
allo
cate
d b
y ho
useh
olds
Legend: Direct equity shareholding
Mutual fund equity / growth schemes
Mutual fund income schemes
Mutual fund balanced schemes
Gilt funds
Money market funds
%
14.807.22%
4.66%
1.58%
0.80%
0.52%
al fund schemes

(70)
Table 5.5
ALLOCATION OF A NOTIONAL SUM OF RS. 100,000 BY SAMPLE HOUSEHOLDS AMONG THREE FORMS
OF SHARE INVESTMENT
Household Investors Survey-2004
Form of share investment Amount allocated
% of total amount
No. of respondents*
% of total respondents*
(a) Direct holdings of equity shares
56,540,000 58.83 917 95.42
(b) Mutual fund index schemes (i.e. index funds)
14,060,500
14.63
548
57.02
(c) Mutual fund equity/growth schemes
25,499,500 26.53 737 76.69
Total (all respondents) 96,100,000 100.00 961
* Respondents were free to choose more than one form. Hence, the actual total of the column would exceed the number of respondents.
Note: Each household head was requested to give his/her preferred allocation among the three forms of share investment in his/her circumstances.
Chart 5.5
Allocation between Direct and Indirect Investment in Equity Shares
58.83%
14.63%
26.53%
0%
10%
20%
30%
40%
50%
60%
70%
80%
90%
100%
Direct equity Index funds MF equity schemes
Per ce
nt o
f not
iona
l sum
allo
cate
d by
hou
seho
lds
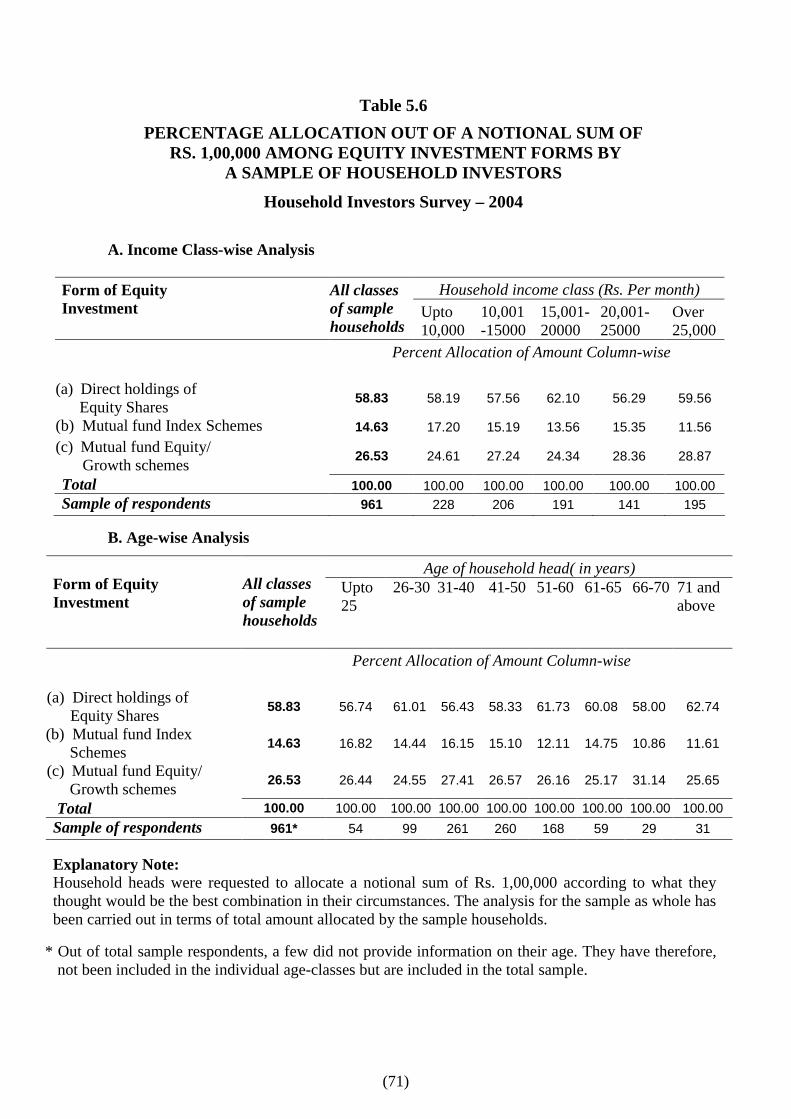
(71)
Table 5.6
PERCENTAGE ALLOCATION OUT OF A NOTIONAL SUM OF RS. 1,00,000 AMONG EQUITY INVESTMENT FORMS BY
A SAMPLE OF HOUSEHOLD INVESTORS
Household Investors Survey – 2004
A. Income Class-wise Analysis
Household income class (Rs. Per month) Form of Equity Investment
All classes of sample households
Upto 10,000
10,001-15000
15,001-20000
20,001-25000
Over 25,000
Percent Allocation of Amount Column-wise
(a) Direct holdings of Equity Shares 58.83 58.19 57.56 62.10 56.29 59.56
(b) Mutual fund Index Schemes 14.63 17.20 15.19 13.56 15.35 11.56 (c) Mutual fund Equity/
Growth schemes 26.53 24.61 27.24 24.34 28.36 28.87
Total 100.00 100.00 100.00 100.00 100.00 100.00 Sample of respondents 961 228 206 191 141 195
B. Age-wise Analysis
Age of household head( in years) Form of Equity Investment
All classes of sample households
Upto 25
26-30 31-40 41-50 51-60 61-65 66-70 71 and above
Percent Allocation of Amount Column-wise
(a) Direct holdings of Equity Shares 58.83 56.74 61.01 56.43 58.33 61.73 60.08 58.00 62.74
(b) Mutual fund Index Schemes 14.63 16.82 14.44 16.15 15.10 12.11 14.75 10.86 11.61
(c) Mutual fund Equity/ Growth schemes 26.53 26.44 24.55 27.41 26.57 26.16 25.17 31.14 25.65
Total 100.00 100.00 100.00 100.00 100.00 100.00 100.00 100.00 100.00 Sample of respondents 961* 54 99 261 260 168 59 29 31
Explanatory Note: Household heads were requested to allocate a notional sum of Rs. 1,00,000 according to what they thought would be the best combination in their circumstances. The analysis for the sample as whole has been carried out in terms of total amount allocated by the sample households.
* Out of total sample respondents, a few did not provide information on their age. They have therefore, not been included in the individual age-classes but are included in the total sample.
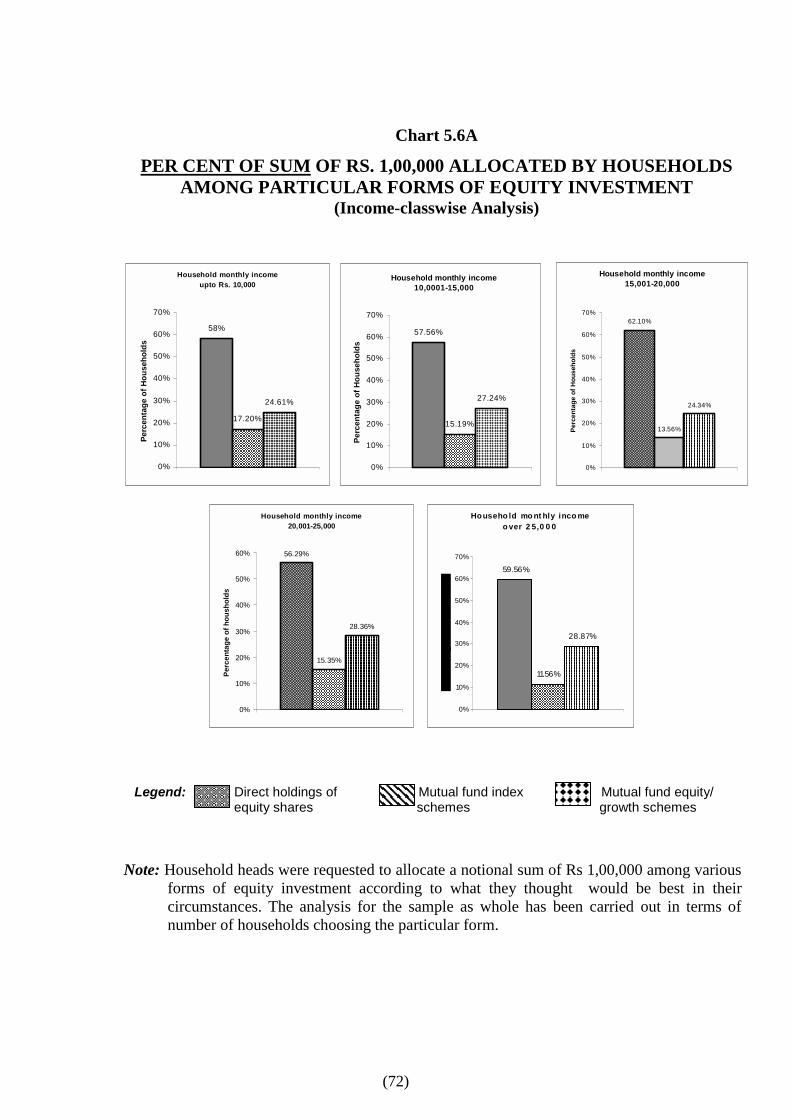
(72)
Chart 5.6A
PER CENT OF SUM OF RS. 1,00,000 ALLOCATED BY HOUSEHOLDS AMONG PARTICULAR FORMS OF EQUITY INVESTMENT
(Income-classwise Analysis)
Household monthly income upto Rs. 10,000
58%
17.20%
24.61%
0%
10%
20%
30%
40%
50%
60%
70%
Perc
enta
ge o
f Hou
seho
lds
Household monthly income 10,0001-15,000
57.56%
15.19%
27.24%
0%
10%
20%
30%
40%
50%
60%
70%
Perc
enta
ge o
f Hou
seho
lds
Household monthly income 15,001-20,000
62.10%
13.56%
24.34%
0%
10%
20%
30%
40%
50%
60%
70%
Perc
enta
ge o
f Hou
seho
lds
Household monthly income
20,001-25,000
56.29%
15.35%
28.36%
0%
10%
20%
30%
40%
50%
60%
Perc
enta
ge o
f hou
shol
ds
Househo ld mo nt hly inco me o ver 2 5,0 0 0
59.56%
11.56%
28.87%
0%
10%
20%
30%
40%
50%
60%
70%
Legend: Direct holdings of Mutual fund index Mutual fund equity/
equity shares schemes growth schemes Note: Household heads were requested to allocate a notional sum of Rs 1,00,000 among various
forms of equity investment according to what they thought would be best in their circumstances. The analysis for the sample as whole has been carried out in terms of number of households choosing the particular form.
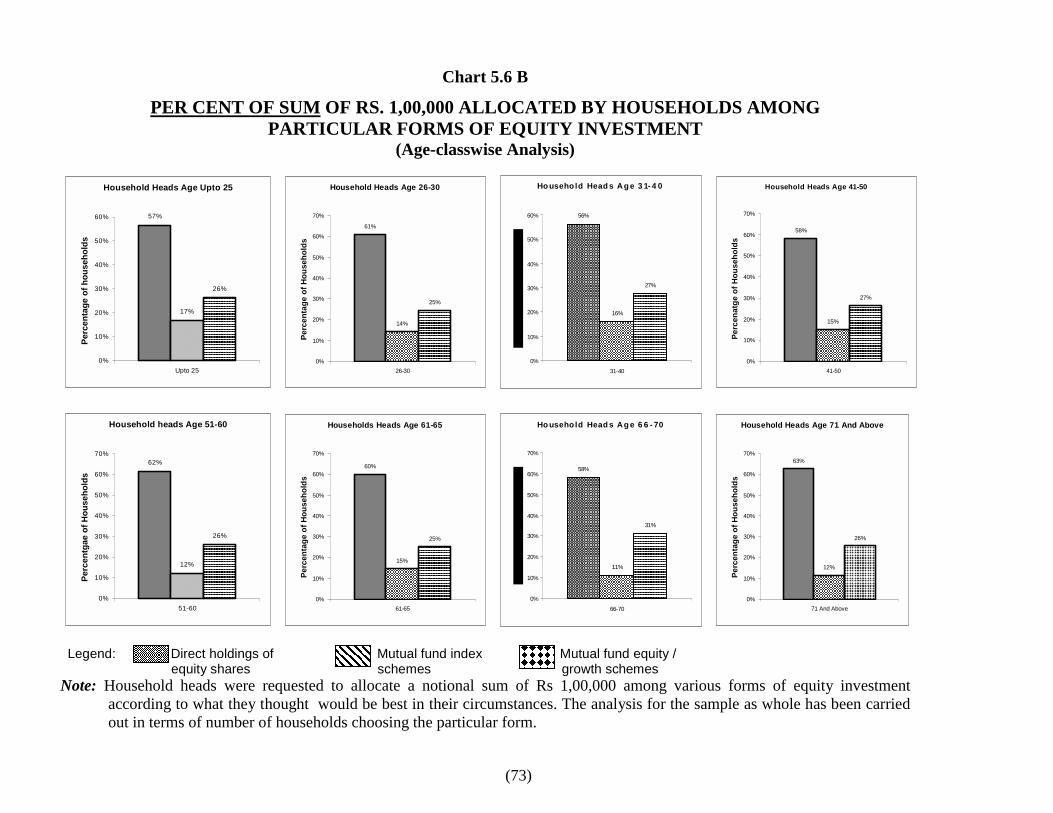
(73)
Chart 5.6 B
PER CENT OF SUM OF RS. 1,00,000 ALLOCATED BY HOUSEHOLDS AMONG PARTICULAR FORMS OF EQUITY INVESTMENT
(Age-classwise Analysis)
Household Heads Age Upto 25
57%
17%
26%
0%
10%
20%
30%
40%
50%
60%
Upto 25
Perc
enta
ge o
f hou
seho
lds
Household Heads Age 26-30
61%
14%
25%
0%
10%
20%
30%
40%
50%
60%
70%
26-30
Perc
enta
ge o
f Hou
seho
lds
Ho usehold Head s Ag e 3 1- 4 0
56%
16%
27%
0%
10%
20%
30%
40%
50%
60%
31-40
Household Heads Age 41-50
58%
15%
27%
0%
10%
20%
30%
40%
50%
60%
70%
41-50
Perc
enat
ge o
f Hou
seho
lds
Household heads Age 51-60
62%
12%
26%
0%
10%
20%
30%
40%
50%
60%
70%
51-60
Perc
entg
ae o
f Hou
seho
lds
Households Heads Age 61-65
60%
15%
25%
0%
10%
20%
30%
40%
50%
60%
70%
61-65
Perc
enta
ge o
f Hou
seho
lds
Ho usehold Head s Ag e 6 6 - 70
58%
11%
31%
0%
10%
20%
30%
40%
50%
60%
70%
66-70
Household Heads Age 71 And Above
63%
12%
26%
0%
10%
20%
30%
40%
50%
60%
70%
71 And Above
Perc
enta
ge o
f Hou
seho
lds
Legend: Direct holdings of Mutual fund index Mutual fund equity / equity shares schemes growth schemes Note: Household heads were requested to allocate a notional sum of Rs 1,00,000 among various forms of equity investment
according to what they thought would be best in their circumstances. The analysis for the sample as whole has been carried out in terms of number of households choosing the particular form.

(74)
5.17 Chart 5.5 and Table 5.5 present the results of a similar game by
restricting the allocation of the notional sum to three types only, viz.,
direct equity shareholding, index funds and other MF equity
schemes, in order to determine the relative preferences within these
three forms of equity investment. As may be observed, direct equity
shareholding is far more preferred than investing through mutual
fund equity schemes, including both index funds and other equity
funds. This is true of all income-classes and age-classes (see Table
5.6 and Chart 5.6A / 5.6B).
5.18 Thus, from all the angles of our analysis, the households’
preference for direct shareholding far outweighs their
preference for mutual fund equity schemes and even all mutual
fund schemes taken together. This is so despite the theoretical
advantages claimed by advocates of mutual funds. The reasons
for this will be discussed in the concluding section IV. The
mutual fund industry needs to do some hard thinking.
III. The Changing Structure of Indian MF Industry
5.19 The mutual fund business was progressively opened to competition
from 1988 onwards. This move gathered momentum after the
adoption of economic liberalization in 1991 and the creation of SEBI
as a statutory body in 1992. Around this time, it began to be felt
that all SEBI regulations, applicable to the newly established
mutual funds, should also apply to the UTI in order to ensure a
level-playing field but the process of change was not completed
even by 2001.
(75)
5.20 Upto the end of the 1990s, despite intensifying competition, the UTI
continued to be like Gulliver among Lilliputians. The assets
under the UTI’s management amounted to a little over Rs.
64,000 crore, forming almost two-thirds (64.7%, to be precise)
of total assets of all Indian mutual funds combined as on 31st
December 2000.4 This was just a few months before a crisis hit the
UTI with the force of a tornado and virtually broke it up.5
US-64 crisis and after
5.21 Soon after the stock market scam of March 2001, there was an inside
scam in the UTI. As a result, the UTI’s US-64 Unit Scheme
suddenly collapsed in July 2001. Its NAV plunged far below the sale
price of the units and well below even the face value of the units.
The scheme faced bankruptcy of a kind. There was much public
outcry as millions of US-64 unitholders had to bear heavy losses.
The government could not escape its responsibility because the UTI
was always regarded as a public sector institution. A bail-out
package for US-64 scheme was worked out to limit the losses of
unitholders to some extent. The scheme was wound up in 2003 by
giving Government Guaranteed 6.75% Tax Free Bonds to US-64
unitholders. This exchange involved an average loss of around 35-
40% of the cost price paid by the unitholders.
5.22 An important point to be noted is that the winding up of US-64
scheme meant that a sizable chunk of investors went out of the
mutual fund industry. This scheme was the only mutual fund
scheme held by many households. Besides the US-64 scheme, the
4 For a detailed historical account upto end of 2000, see L. C. Gupta and Utpal Choudhury, How Good
Are Mutual Funds (SCMRD, Delhi, 2001), p. 88. The figures are based on AMFI data.
5 The UTI faced a milder crisis earlier in 1998. See Ibid., pp. 78-83. For subsequent events, see L.C. Gupta, Naveen Jain and Utpal Choudhury, India’s Stock Market & Household Investors 2001-04 (SCMRD, Delhi, 2004), pp. 26-29.
(76)
UTI’s guaranteed income schemes have also mostly been wound
up.6
The residual UTI
5.23 The remaining UTI schemes have been hived off and transferred to a
new organizational set up, called UTI Mutual Fund. The assets under
management of this new UTI Mutual Fund at the end of September
2004 amounted to Rs. 20,224 crore representing less than 15% of the
total for the Indian mutual fund industry as a whole, compared to the
erstwhile UTI’s 64.7% share of all mutual fund assets at the end of
2000. There were 29 MF organizations operating in India as on
September 30, 2004, managing a total of Rs. 1,53,108 crore assets,
as per data provided by AMFI. The industry leadership, market
shares and the composition of products and clients of the mutual
fund industry have been changing very rapidly.
5.24 The change in the composition of mutual fund business has been
quite drastic between 1999 and 2004, as brought out by Table 5.7
and specially Chart 5.7.
5.25 Table 5.7 shows that equity schemes have accounted for well
below one-fifth of total assets under management of mutual
funds in India. The Indian mutual fund industry as a whole
holds just around 2% of the market capitalization of listed
equity shares. Households in India directly hold an average of
15% or perhaps more of the quoted equity. These macro figures
tell us that mutual fund cult has yet to catch up in India.
6 See L. C. Gupta, Naveen Jain and Utpal Choudhury, India’s Stock Market and Household Investors,
2001-04 (SCMRD, Delhi, 2004), pp. 26-29.
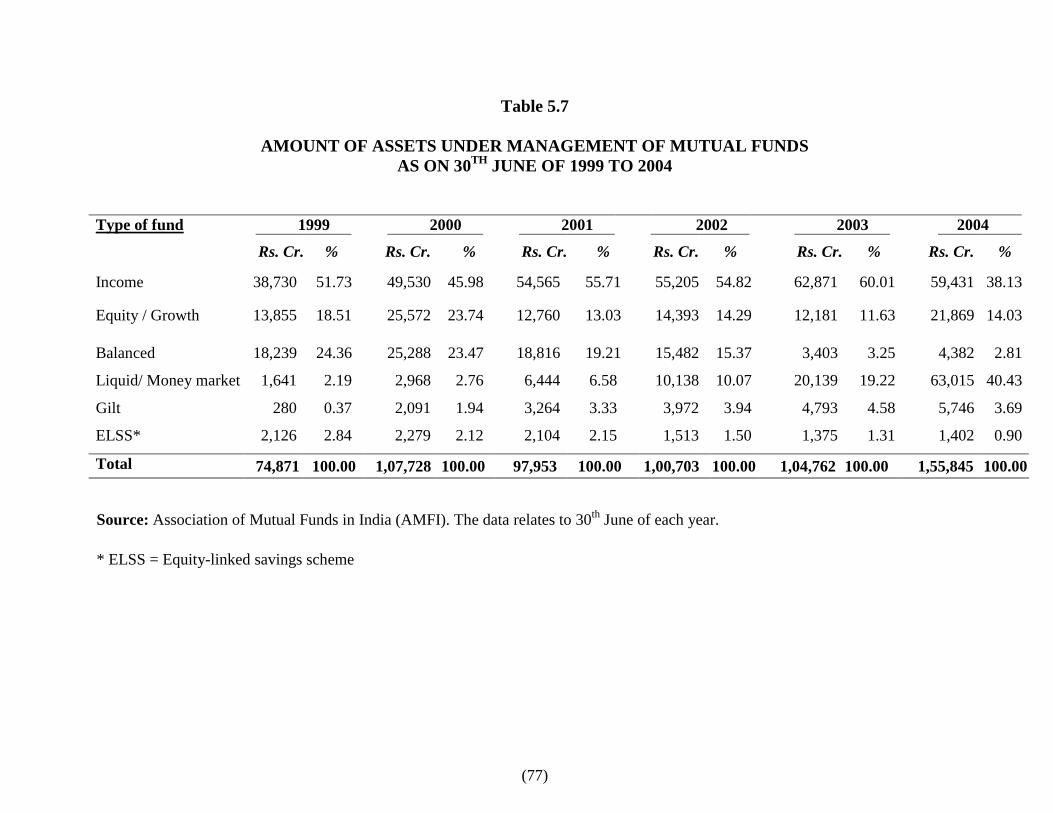
(77)
Table 5.7
AMOUNT OF ASSETS UNDER MANAGEMENT OF MUTUAL FUNDS AS ON 30TH JUNE OF 1999 TO 2004
Type of fund 1999 2000 2001 2002 2003 2004
Rs. Cr. % Rs. Cr. % Rs. Cr. % Rs. Cr. % Rs. Cr. % Rs. Cr. % Income 38,730 51.73 49,530 45.98 54,565 55.71 55,205 54.82 62,871 60.01 59,431 38.13
Equity / Growth 13,855 18.51 25,572 23.74 12,760 13.03 14,393 14.29 12,181 11.63 21,869 14.03
Balanced 18,239 24.36 25,288 23.47 18,816 19.21 15,482 15.37 3,403 3.25 4,382 2.81
Liquid/ Money market 1,641 2.19 2,968 2.76 6,444 6.58 10,138 10.07 20,139 19.22 63,015 40.43
Gilt 280 0.37 2,091 1.94 3,264 3.33 3,972 3.94 4,793 4.58 5,746 3.69
ELSS* 2,126 2.84 2,279 2.12 2,104 2.15 1,513 1.50 1,375 1.31 1,402 0.90
Total 74,871 100.00 1,07,728 100.00 97,953 100.00 1,00,703 100.00 1,04,762 100.00 1,55,845 100.00 Source: Association of Mutual Funds in India (AMFI). The data relates to 30th June of each year. * ELSS = Equity-linked savings scheme
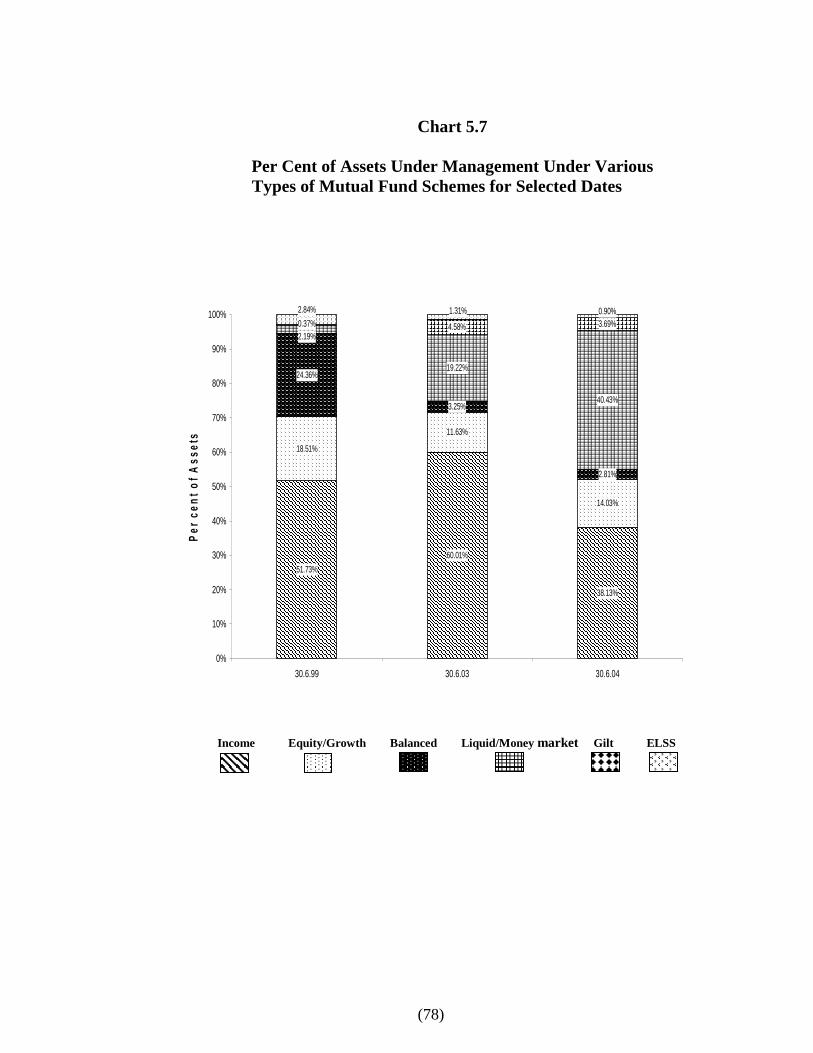
(78)
Chart 5.7
Per Cent of Assets Under Management Under Various Types of Mutual Fund Schemes for Selected Dates
51.73%60.01%
38.13%
18.51%
11.63%
14.03%
24.36%
3.25%
2.81%
19.22%
40.43%
4.58% 3.69%2.19%0.37%
0.90%1.31%2.84%
0%
10%
20%
30%
40%
50%
60%
70%
80%
90%
100%
30.6.99 30.6.03 30.6.04
Per c
ent o
f Ass
ets
Income Equity/Growth Balanced Liquid/Money market Gilt ELSS
79
5.26 The income funds represented the largest component of mutual
fund business in India since 1999 till recently. These funds have
generally accounted for over 50% of the total mutual fund assets,
except in 2004.
5.27 Balanced funds seem to fall between two stools. They were a
significant component upto 2002. They accounted for around 25%
of total assets in 1999 but declined steadily to just around 15% in
2002; and thereafter, they have been reduced to only about 3%
because of winding up of US-64 scheme, which was by far the
single largest balanced fund in Indian mutual fund industry.
5.28 A major shift in the MF industry’s focus is represented by the rise
of Liquid / Money Market Funds from the level of only about 2%
of the total assets of Indian MF industry in 1999 to 40% in
September 2004, becoming the largest chunk of mutual fund
assets. The liquid funds cater mainly to the needs of corporate
clients and high networth individuals. Retail investors
overwhelmingly prefer bank deposits rather than liquid /
money market funds. According to our household investors
survey of 2004, only 3-4% of retail investors showed interest in
liquid funds and around 5% in gilt funds, but these investors were
prepared to invest no more than 1% of the total available sum in
liquid / money market funds (see Table 5.4 above). Such funds are
a substitute for bank fixed deposits.
5.29 The data compiled by AMFI indicates that the mutual fund
industry has shifted its focus towards corporates and high
networth individuals and away from the retail investors.7 The
reason is that mobilizing savings from small investors and
mofussil areas is very expensive and, therefore, unattractive as a 7 See The Economic Times, October 27, 2004, quoting the CEO of Taurus Mutual Fund.

80
business proposition. On the other hand, corporates and large
clients can provide to the mutual fund a critical mass to recover its
management costs. Thus, the reduced relative importance of
retail business in the total MF business is explainable partly by
the retail investors’ disenchantment with mutual fund
products and partly by business compulsions of the mutual
fund organisations.
IV. Conclusions :
A Critique of Mutual Funds
A contradiction
5.30 Mutual funds and retail investors were like “made for each other”
and, therefore, the disenchantment of retail investors with MFs is a
curious and surprising phenomenon. It contradicts the theory
underlying mutual funds. The AMFI has recently expressed
concern “that households are not allocating their savings to the
mutual fund schemes, particularly equity schemes”.8 As we
have noted earlier, retail investors are no more the dominant
class of clients served by the mutual fund industry.
Investors’ unhappy experiences
5.31 After the MF industry was opened to competition and many new
kinds of “attractive” MF schemes were launched, a growing
number of retail investors bought these mutual fund products for
some time. Investors relied on the implicit, and sometimes explicit,
promises made in the offer documents. In many cases, the
promises made could not be honoured. In some cases, the
sponsoring bank had to bail out the mutual fund and, in other
8 See AMFI Update (Newsletter of the Association of Mutual Funds in India) July-September 2004.
81
cases, the investors had to grin and bear the loss. The first lot of
new mutual funds were set up by public sector banks and financial
institutions with deputed staff who had no experience of the
relevant kind and who were only waiting for promotion in their
parent organisations. It is not surprising that most such funds
performed poorly.
Managerial incompetence, malpractices and herd behaviour
5.32 Investors in mutual funds have been discouraged by nasty
surprises many times since mid-1990s due to managerial
incompetence, malpractices and frauds. The biggest shock was the
US-64 crisis which caused heavy and widespread losses. Some
foreign-sponsored funds under world-renowned managements,
which had raised great expectations, proved to be a flop.
5.33 Many mutual fund managers trade too much. We came across an
annual report of one equity mutual fund which claimed with pride
that their whole investment portfolio turns over during a year as if
active trading was synonymous with intelligent fund management!
Too much churning of portfolios does not necessarily result in
higher returns because of brokerage and other costs and lack of a
long-term approach. Secret sharing of commissions between fund
managers and market intermediaries is not unknown. The IT boom
of 1999-2000 showed how mutual fund managers were as much
susceptible to herd behaviour as the ordinary investors. Of course,
some equity schemes have given excellent performance but these
are relatively few. 9
9 Value Research, a reputed organization, devoted to the analysis of mutual funds, has developed a
system of mutual fund ratings. See their monthly journal, Mutual Fund Insight.
82
Unfamiliarity factor
5.34 A subtle point brought out by our analysis is that retail
investors are not sufficiently familiar with mutual funds.
In relative terms, there is much more unfamiliarity with
mutual funds than with the share market among the
retail investors. Unfamiliarity with an investment type
affects the investor’s confidence level. Our all-India
Household Survey of 2004 revealed that as high as 40-45%
of respondents did not at all intend to make “net addition”
to investment in MF equity schemes and MF income
schemes. The corresponding figure for direct equity
shareholding was only about 20% (see Table 5.2 above).
The relatively greater unfamiliarity of households with
mutual funds than with direct shareholding is indicated also
by Table 5.3 which depicts how satisfactory or
unsatisfactory was the investor’s past experience with
various investment types. About 30% of respondents
answered “can’t say / not applicable” in the case of MF
equity schemes and MF income schemes, indicating their
lack of familiarity. The corresponding figure for direct
equity shareholding was less than 10%. Such wide
difference is at least partly due to the difference in
familiarity with the various types of investment.
What should be done?
5.35 While there is some recognition in mutual fund circles
about the need to educate investors about the advantage
83
(or superiority) of mutual fund equity schemes over
direct shareholding, the effort has not been
commensurate with the need. The approach has not
been that of “marketing” which lays emphasis on
precisely knowing the customer’s needs. The approach
being adopted mostly is the “selling” approach, or
rather “hard selling” of particular “products”.
5.36 More importantly, the majority of retail investors are
not persuaded by the idea of mutual funds because such
funds have not so far demonstrated the ability to possess
a really superior investment strategy, not attainable by
intelligent retail investors.
The maturing of retail investors
5.37 The bulk of the present generation of retail investors got
their exposure to the vicissitudes of the equity market
during the last 15 years, specially the 1990s. Their attitudes
have considerably matured as a result of lessons derived
from boom-bust market cycles and market frauds. They
became far more cautious and discerning. They have re-
jigged their investment strategy to make it more appropriate
to the prevailing Indian environment where market volatility
is relatively high and regulation is weak. Their strategy is
explained below.

84
How retail investors “beat” the mutual funds
5.38 The equity investment strategy evolved by the mature and
intelligent retail investors has the following broad features:
(a) They limit the equity share portfolio to a small
number of very selected companies, generally not
exceeding 10. This allows better portfolio supervision
by knowing the individual companies. The companies
are selected strictly on the basis of their long-term
potential and not for short-term trading. Our household
investors survey of 2004 revealed that about 70% of
such investors held shares in not more than 10
companies. Just about 50% of them held shares in 3-10
companies (i.e. narrow diversification). This was
broadly true of all income-classes and age-classes of
retail investors. 10
(b) Over the years, they become more familiar with the
companies in their portfolio. They wait for the
opportunity of buying more shares of the good
companies in their portfolio, whenever the market
temporarily dips. This reduces their average acquisition
cost of the shares without adding to the number of
companies in the portfolio but their investment increases.
This is a way of neutralizing the market risk. It is a
well-defined strategy.
10 For an earlier survey, see L.C. Gupta, C.P. Gupta and Naveen Jain, Indian Households’ Investment
preferences (Society for Capital Market Research and Development, Delhi, 2001), pp. 96-8

85
(c) This strategy involves no annual management fee to be
paid to anybody. This is an important advantage
compared to investment through mutual funds which
involve annual management and other expenses of about
2.0-2.5% plus entry/exit loads. Many high networth
individuals use the services of portfolio managers but
such services are costly for retail investors who depend
on informal sources of advice.11
5.39 There is theoretical support for the policy of moderate
diversification of share portfolios. It has been statistically
shown that more than one-half of the investment risk, as
measured by standard deviation of individual share
returns, is eliminated by portfolios of 5 shares; more than
two-thirds of risk is eliminated by portfolios of 10 shares
and about four-fifths of risk is eliminated by portfolios of
20 shares. Diversification over 100 shares eliminates 90%
of the risk.12 However, none of this at all provides
protection against “market risk” (also known as
“systematic risk”) whereas the intelligent retail investor’s
strategy described above provides against market risk by
maintaining a long vision and lowering the average cost by
taking advantage of market dips.
11 For information on sources of investment advice used by retail investors, see India’s Stock Market &
Household Investors (2004), op. cit., pp. 53-55. 12 See L. C. Gupta, Rate of Return on Equities: The Indian Experience (Oxford University Press, 1981),
pp. 33-34. ‘Market risk’ has to be distinguished from the risk of random error or insurable risk. See ibid., pp. 31-32.
86
5.40 Peter Lynch, a world renowned fund manager, had observed
that the herd of fund managers “tend to graze in the same
pastures of stocks. They feel comfortable buying the same
stocks which other managers are buying and they avoid
wandering off into unfamiliar territory. So they miss the
exciting prospects that can be found outside the boundaries of
the herd”.13 We find, for example, that most of the mutual
funds and other institutional investors in India are making the
same mistake as pointed out by Lynch: they are investing in
the same group of well-known top companies whose share
prices are, therefore, often bid up too high.
Final comment
5.41 The Indian mutual fund industry does not seem to be in
good shape. There is need for a thorough over-all review
of the industry, including its regulation, management
structure, investment practices and performance.
13 See Peter Lynch and John Rothchild, Learn to Earn (Fireside New York, 1995), p. 118-19.
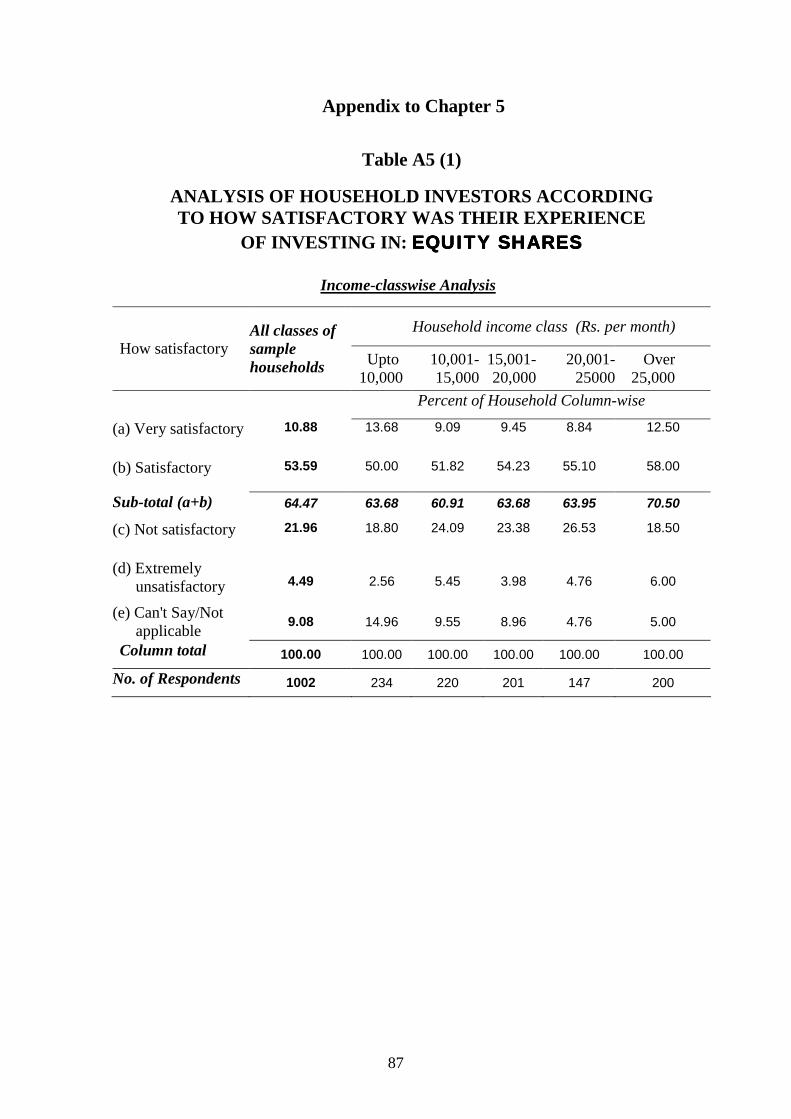
87
Appendix to Chapter 5
Table A5 (1)
ANALYSIS OF HOUSEHOLD INVESTORS ACCORDING TO HOW SATISFACTORY WAS THEIR EXPERIENCE
OF INVESTING IN: EQUITY SHARESEQUITY SHARESEQUITY SHARESEQUITY SHARES
Income-classwise Analysis
Household income class (Rs. per month) How satisfactory
All classes of sample households Upto
10,000 10,001-15,000
15,001-20,000
20,001-25000
Over 25,000
Percent of Household Column-wise
(a) Very satisfactory
10.88 13.68 9.09 9.45 8.84 12.50
(b) Satisfactory
53.59 50.00 51.82 54.23 55.10 58.00
Sub-total (a+b) 64.47
63.68
60.91
63.68
63.95
70.50
(c) Not satisfactory
21.96 18.80 24.09 23.38 26.53 18.50
(d) Extremely unsatisfactory
4.49 2.56 5.45 3.98 4.76 6.00
(e) Can't Say/Not applicable 9.08 14.96 9.55 8.96 4.76 5.00
Column total 100.00 100.00 100.00 100.00 100.00 100.00
No. of Respondents 1002 234 220 201 147 200
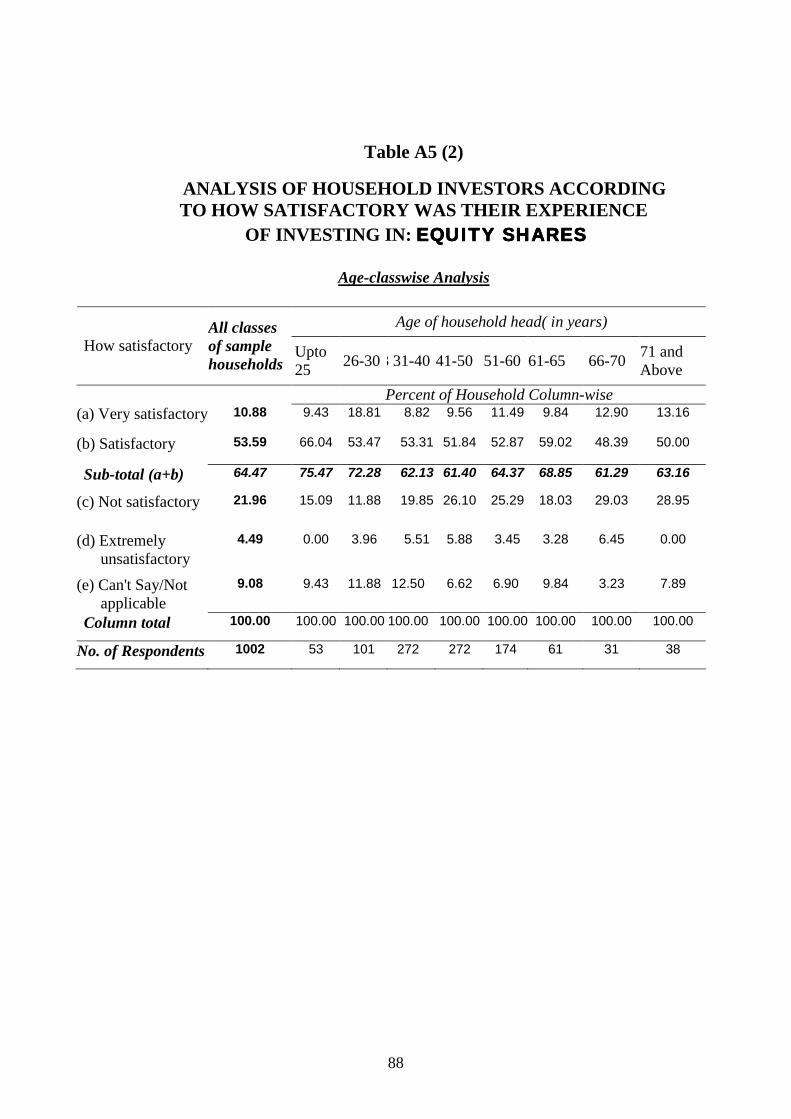
88
Table A5 (2)
ANALYSIS OF HOUSEHOLD INVESTORS ACCORDING TO HOW SATISFACTORY WAS THEIR EXPERIENCE
OF INVESTING IN: EQUITY SHARESEQUITY SHARESEQUITY SHARESEQUITY SHARES
Age-classwise Analysis
Age of household head( in years) How satisfactory
All classes of sample households
Upto 25 26-303 31-40 41-50 51-60 61-65 66-70 71 and
Above Percent of Household Column-wise
(a) Very satisfactory
10.88 9.43 18.81 8.82 9.56 11.49 9.84 12.90 13.16
(b) Satisfactory
53.59 66.04 53.47 53.31 51.84 52.87 59.02 48.39 50.00
Sub-total (a+b) 64.47 75.47 72.28 62.13 61.40 64.37 68.85 61.29 63.16
(c) Not satisfactory
21.96 15.09 11.88 19.85 26.10 25.29 18.03 29.03 28.95
(d) Extremely unsatisfactory
4.49 0.00 3.96 5.51 5.88 3.45 3.28 6.45 0.00
(e) Can't Say/Not applicable
9.08 9.43 11.88 12.50 6.62 6.90 9.84 3.23 7.89
Column total 100.00 100.00 100.00 100.00 100.00 100.00 100.00 100.00 100.00
No. of Respondents 1002 53 101 272 272 174 61 31 38

89
Table A5 (3)
ANALYSIS OF HOUSEHOLD INVESTORS ACCORDING TO HOW SATISFACTORY WAS INVESTOR’S EXPERIENCE OF INVESTING
IN: MUTUAL FUND EQUITY / GROWTH SCHEMESMUTUAL FUND EQUITY / GROWTH SCHEMESMUTUAL FUND EQUITY / GROWTH SCHEMESMUTUAL FUND EQUITY / GROWTH SCHEMES
Income-classwise Analysis
Household income class (Rs. per month)
How satisfactory All classes of sample households Upto
10,000 10,001-15,000
15,001-20,000
20,001-25000
Over 25,000
Percent of Household Column-wise
(a) Very satisfactory
6.16 6.44 4.71 4.62 8.40 7.26
(b) Satisfactory
31.85 31.68 32.46 28.32 32.82 34.08
Sub-total (a+b) 38.01 38.12 37.17 32.95 41.22 41.34 (c) Not satisfactory
23.17 20.79 19.37 25.43 25.19 26.26
(d) Extremely unsatisfactory
7.88 5.94 6.28 8.09 9.16 10.61
(e) Can't Say/Not applicable 30.94 35.15 37.17 33.53 24.43 21.79
Column total 100.00 100.00 100.00 100.00 100.00 100.00
No. of Respondents 876 202 191 173 131 179
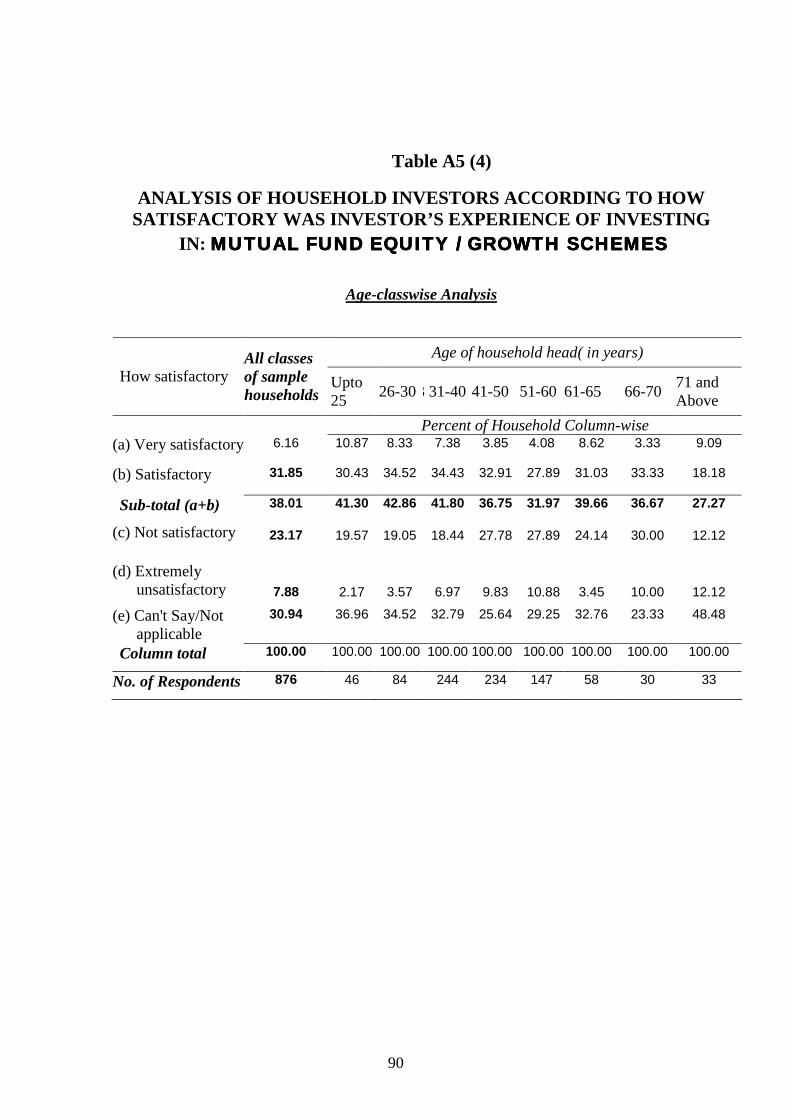
90
Table A5 (4)
ANALYSIS OF HOUSEHOLD INVESTORS ACCORDING TO HOW SATISFACTORY WAS INVESTOR’S EXPERIENCE OF INVESTING
IN: MUTUAL FUND EQUITY / GROWTH SCHEMESMUTUAL FUND EQUITY / GROWTH SCHEMESMUTUAL FUND EQUITY / GROWTH SCHEMESMUTUAL FUND EQUITY / GROWTH SCHEMES
Age-classwise Analysis
Age of household head( in years) How satisfactory
All classes of sample households
Upto 25 26-303 31-40 41-50 51-60 61-65 66-70 71 and
Above Percent of Household Column-wise
(a) Very satisfactory
6.16 10.87 8.33 7.38 3.85 4.08 8.62 3.33 9.09
(b) Satisfactory
31.85 30.43 34.52 34.43 32.91 27.89 31.03 33.33 18.18
Sub-total (a+b) 38.01 41.30 42.86 41.80 36.75 31.97 39.66 36.67 27.27
(c) Not satisfactory
23.17
19.57
19.05
18.44
27.78
27.89
24.14
30.00
12.12
(d) Extremely unsatisfactory
7.88
2.17
3.57
6.97
9.83
10.88
3.45
10.00
12.12
(e) Can't Say/Not applicable
30.94 36.96 34.52 32.79 25.64 29.25 32.76 23.33 48.48
Column total 100.00 100.00 100.00 100.00 100.00 100.00 100.00 100.00 100.00
No. of Respondents 876 46 84 244 234 147 58 30 33

91
Table A 5 (5)
ANALYSIS OF HOUSEHOLD INVESTORS ACCORDING TO HOW SATISFACTORY WAS INVESTOR’S EXPERIENCE OF INVESTING
IN: MUTMUTMUTMUTUAL FUND INCOME SCHEMESUAL FUND INCOME SCHEMESUAL FUND INCOME SCHEMESUAL FUND INCOME SCHEMES
Income-classwise Analysis
Household income class (Rs. per month)
How satisfactory All classes of sample households Upto
10,000 10,001-15,000
15,001-20,000
20,001-25000
Over 25,000
Percent of Household Column-wise
(a) Very satisfactory
5.06 4.00 4.17 4.47 5.93 7.10
(b) Satisfactory
35.77 38.00 34.90 31.28 38.52 36.61
Sub-total (a+b) 40.83 42.00 39.06 35.75 44.44 43.72
(c) Not satisfactory
22.38 19.50 21.88 23.46 22.96 24.59
(d) Extremely unsatisfactory
6.30 5.00 3.13 8.38 7.41 8.20
(e) Can't Say/Not applicable
30.48 33.50 35.94 32.40 25.19 23.50
Column total 100.00 100.00 100.00 100.00 100.00 100.00
No. of Respondents 889 200 192 179 135 183

92
Table A5 (6)
ANALYSIS OF HOUSEHOLD INVESTORS ACCORDING TO HOW SATISFACTORY WAS INVESTOR’S EXPERIENCE OF INVESTING IN:
MUTUAL FUND INCOME SCHEMESMUTUAL FUND INCOME SCHEMESMUTUAL FUND INCOME SCHEMESMUTUAL FUND INCOME SCHEMES
Age-classwise Analysis Age of household head( in years)
How satisfactory All classes of sample households
Upto 25 26-303 31-40 41-50 51-60 61-65 66-70 71 and
Above Percent of Household Column-wise
(a) Very satisfactory
5.06 2.22 4.82 7.53 4.42 1.32 8.62 3.45 8.82
(b) Satisfactory
35.77 35.56 30.12 36.40 34.54 42.11 32.76 27.59 38.24
Sub-total (a+b) 40.83 37.78 34.94 43.93 38.96 43.42 41.38 31.03 47.06 (c) Not satisfactory
22.38 15.56 26.51 18.83 25.70 23.03 18.97 34.48 14.71
(d) Extremely unsatisfactory
6.30
2.22
3.61
5.44
8.43
7.24
1.72
10.34
8.82
(e) Can't Say/Not applicable
30.48
44.44
34.94
31.80
26.91
26.32
37.93
24.14
29.41
Column total 100.00 100.00 100.00 100.00 100.00 100.00 100.00 100.00 100.00
No. of Respondents 889 45 83 239 249 152 58 29 34
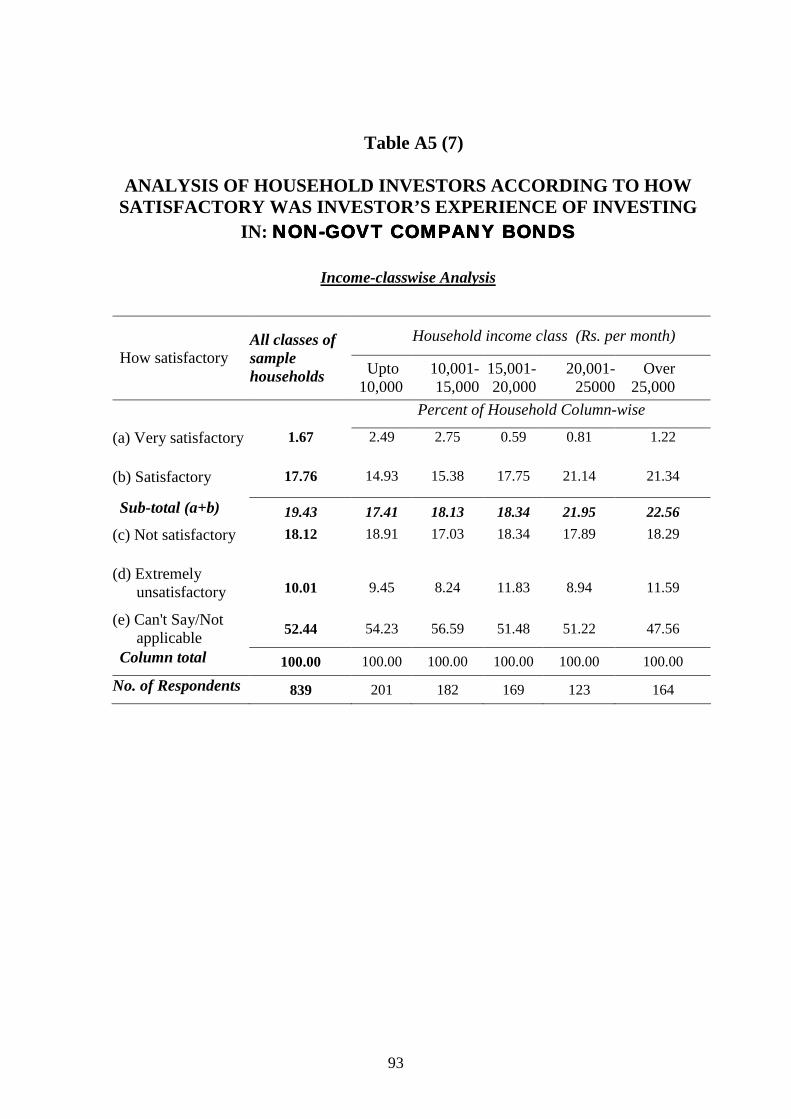
93
Table A5 (7)
ANALYSIS OF HOUSEHOLD INVESTORS ACCORDING TO HOW SATISFACTORY WAS INVESTOR’S EXPERIENCE OF INVESTING
IN: NONNONNONNON----GOVT COMPANY BONDSGOVT COMPANY BONDSGOVT COMPANY BONDSGOVT COMPANY BONDS
Income-classwise Analysis
Household income class (Rs. per month)
How satisfactory All classes of sample households Upto
10,000 10,001-15,000
15,001-20,000
20,001-25000
Over 25,000
Percent of Household Column-wise
(a) Very satisfactory
1.67 2.49 2.75 0.59 0.81 1.22
(b) Satisfactory
17.76 14.93 15.38 17.75 21.14 21.34
Sub-total (a+b) 19.43 17.41 18.13 18.34 21.95 22.56 (c) Not satisfactory
18.12 18.91 17.03 18.34 17.89 18.29
(d) Extremely unsatisfactory
10.01 9.45 8.24 11.83 8.94 11.59
(e) Can't Say/Not applicable 52.44 54.23 56.59 51.48 51.22 47.56
Column total 100.00 100.00 100.00 100.00 100.00 100.00
No. of Respondents 839 201 182 169 123 164
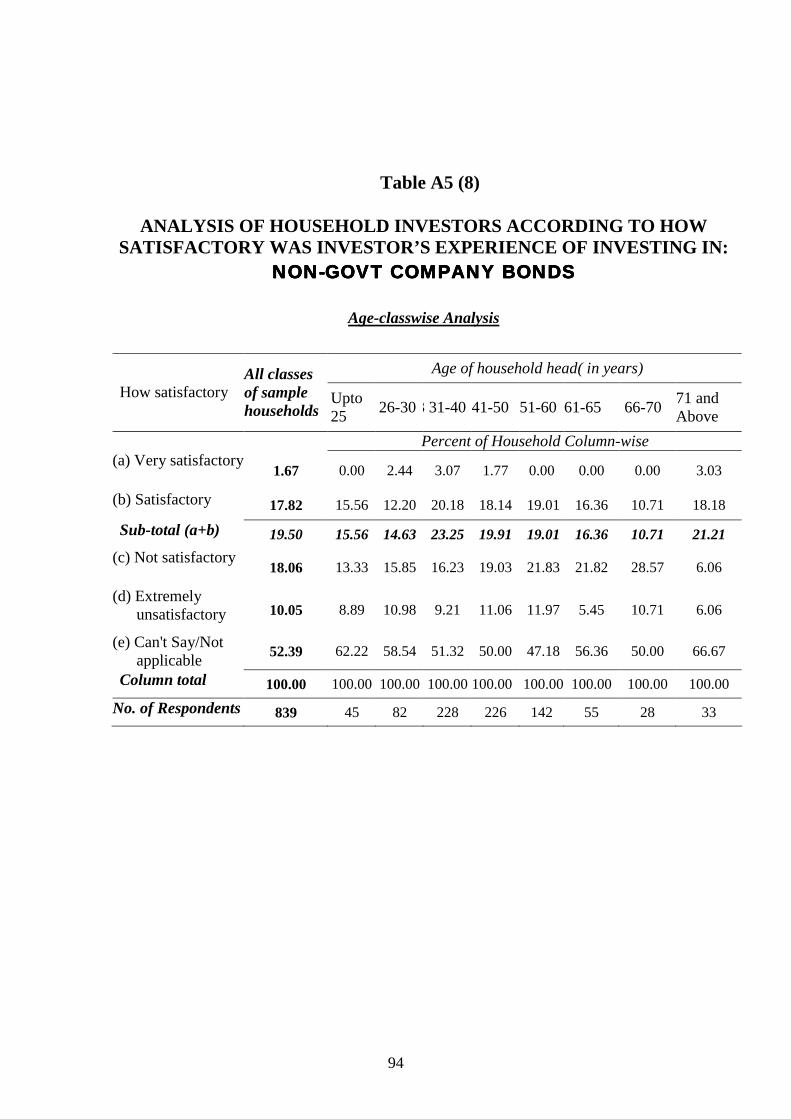
94
Table A5 (8)
ANALYSIS OF HOUSEHOLD INVESTORS ACCORDING TO HOW SATISFACTORY WAS INVESTOR’S EXPERIENCE OF INVESTING IN:
NONNONNONNON----GOVT COMPANY BONDSGOVT COMPANY BONDSGOVT COMPANY BONDSGOVT COMPANY BONDS
Age-classwise Analysis Age of household head( in years)
How satisfactory All classes of sample households
Upto 25 26-303 31-40 41-50 51-60 61-65 66-70 71 and
Above Percent of Household Column-wise
(a) Very satisfactory
1.67 0.00 2.44 3.07 1.77 0.00 0.00 0.00 3.03
(b) Satisfactory
17.82 15.56 12.20 20.18 18.14 19.01 16.36 10.71 18.18
Sub-total (a+b) 19.50 15.56 14.63 23.25 19.91 19.01 16.36 10.71 21.21 (c) Not satisfactory
18.06 13.33 15.85 16.23 19.03 21.83 21.82 28.57 6.06
(d) Extremely unsatisfactory
10.05 8.89 10.98 9.21 11.06 11.97 5.45 10.71 6.06
(e) Can't Say/Not applicable 52.39 62.22 58.54 51.32 50.00 47.18 56.36 50.00 66.67
Column total 100.00 100.00 100.00 100.00 100.00 100.00 100.00 100.00 100.00
No. of Respondents 839 45 82 228 226 142 55 28 33

95
Chapter 6
SHARE PORTFOLIO PRACTICES
OF RETAIL INVESTORS
New light on share portfolio diversification practices
6.1 This chapter presents empirical data about share portfolio
diversification practices of retail shareholders in India.
6.2 It is well recognised in portfolio theory that diversification can
help to minimize the risk. Diversification may be across
individual companies, across industry-groups, or across
countries. Retail investors diversify their portfolios among
chosen companies usually from different industry groups. Our
measure of share portfolio diversification is simply the number of
companies represented in the individual investor’s share
portfolio.
Diversification and “market risk”
6.3 It needs to be noted that such diversification cannot ordinarily
reduce “market risk”, i.e. the risk due to the whole market going
up or down but it can reduce the random type of risk or the so-
called “insurable risk”. We shall present below the findings on
how diversified are share portfolios of retail investors in India.
We shall also discuss the implications of such findings. The data
was collected directly from the investors in the course of our
household investors survey of 2004.27
27 For an earlier survey, see L. C. Gupta, C. P. Gupta and Naveen Jain, Indian Households’ Investment
Preferences (Society for Capital Market Research and Development, Delhi, 2001), pp. 96-8.
96
6.4 The sample households have been classified by income and age
for checking the consistency of findings and also for bringing out
significant differences among income-classes and among age-
classes.
6.5 The extent of share portfolio diversification varies very widely
among our sample households from holding just one company’s
shares to more than 100 companies’ shares. We have identified
certain patterns depending on income and age of the investors.
Typical diversification
6.6 Interestingly, the typical extent of diversification lies in the
narrow range of 3-10 companies’ shares. Most market
professionals will perhaps regard such narrow diversification as
very inadequate. However, as we show later, this is “ideal
diversification” for the retail investors from the practical
viewpoint because of many advantages. Curiously, the typical
extent of diversification is broadly the same across all income
classes as shown in Chart 6.1 and all age-classes as shown in
Chart 6.2. The charts are based on Tables 6.1 and 6.2 given at the
end of this chapter. This interesting phenomenon and the reasons
underlying it are worth noting, as explained later.
6.7 We shall show that such moderate diversification, which is
typical now, seems to work quite well from the viewpoint of
investment performance; in fact, it works better than mutual fund
equity schemes, so much so that demand for mutual fund equity
products has been seriously affected. This is not a known fact so
far. The mutual fund industry needs to give serious consideration
to it.

Chart 6.1
PERCENT DISTRIBUTION OF SHARE-OWNING HOUSEHOLDS BY NUMBER OF COMPANIES IN HOUSEHOLDS'
SHARE PORTFOLIOS
By Income-class of household head
13.08% 13.11%8.78% 9.45%
5.38%
13.34% 11.48%11.48% 10.26%
7%
28.12%27.22%
27.52% 25.08%
22.72%
21.41% 23.42%22.97%
22.80%
24.75%
14.36% 14.74%17.33%
19.22%
18.66%
7.90% 8.41% 8.88% 10.10%
16.13%
1.27% 1.45% 2.06% 2.44% 4.46%
0.51% 0.18% 0.98% 0.91%0.50%
0%
10%
20%
30%
40%
50%
60%
70%
80%
90%
100%
Upto 10000 10001-15000 15001-20000 20001-25000 Over 25000
Household Monthly Income (Rs. in thousand)
Perc
ent o
f Hou
seho
lds
Legend: Number of companies in share portfolio
1
Note: The m
2 3
ost typic
97
-5 6
al portfo
-10 1
lio size h
1-20 2
as been hi
1-50 51
ghlighted.
-100 O
ver 100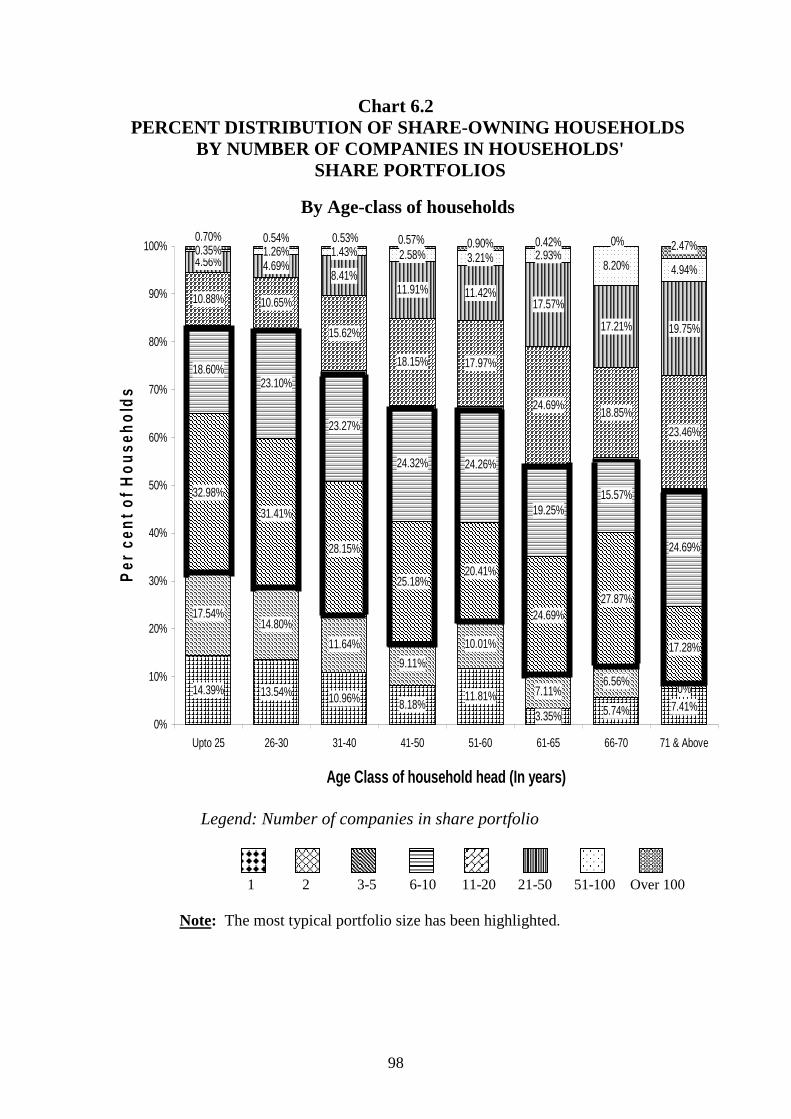
98
Chart 6.2 PERCENT DISTRIBUTION OF SHARE-OWNING HOUSEHOLDS
BY NUMBER OF COMPANIES IN HOUSEHOLDS' SHARE PORTFOLIOS
By Age-class of households
14.39% 13.54% 10.96% 8.18% 11.81%3.35% 5.74% 7.41%
17.54%14.80%
11.64%9.11%
10.01%
7.11%6.56% 0%
32.98%31.41%
28.15%
25.18%20.41%
24.69%27.87%
17.28%
18.60%23.10%
23.27%
24.32% 24.26%
19.25%15.57%
24.69%
10.88% 10.65%
15.62%
18.15% 17.97%
24.69% 18.85%23.46%
4.56% 4.69%8.41%
11.91% 11.42%17.57%
17.21% 19.75%
0.35% 1.26% 1.43% 2.58% 3.21% 2.93%8.20% 4.94%
0%0.42%0.90%0.57%0.53%0.54%0.70%2.47%
0%
10%
20%
30%
40%
50%
60%
70%
80%
90%
100%
Upto 25 26-30 31-40 41-50 51-60 61-65 66-70 71 & Above
Age Class of household head (In years)
Per c
ent o
f Hou
seho
lds
Legend: Number of companies in share portfolio
1 2 3-5 6-10 11-20 21-50 51-100 Over 100 Note: The most typical portfolio size has been highlighted.
99
6.8 As may be observed from Table 6.1, one-fifth of the sample
households had only 1 or 2 companies in their share portfolio. Of
course, this can hardly be regarded as diversification. The
performance of the shareholding confined to 1 or 2 companies
will depend much on chance factor. However, so long as the
amount invested is small in relation to the investor’s total wealth,
the investor may be quite willing to take a chance. Perhaps, he
may have subscribed to a glamorous IPO. Such shareholders are
‘casual’ investors in shares.
6.9 The more serious type of investors will usually have shareholding
in several companies. Our analysis shows that about one-half of
the total sample households had between 3-10 companies in their
share portfolio. Hence, a portfolio of 3-10 companies is the
typical diversification of retail share portfolios. Moreover,
income-class analysis showed that this much diversification is
typical for every income class and age class.
6.10 A little above or below 50% of households in all the five income
classes held 3-10 companies in their share portfolios. Age-
classwise analysis showed a broadly similar pattern. This
suggests that the practice of narrow diversification
(shareholding in 3-10 companies) is the dominant practice among
retail shareholders in all income and age classes.
6.11 Higher diversification beyond 10 companies is much less
common. About one-sixth of total sample households held shares
of 11-20 companies and about one-eighth of the sample held
shares in more than 20 companies, as shown by Tables 6.1 and
6.2.
100
Effect of investor’s income and age
6.12 Ordinarily, one would expect households in the higher income
classes to have somewhat more diversified portfolios than lower
income classes but the typical diversification does not change
much across income classes. This is visually confirmed by Chart
6.1. The chart shows that, as we move to higher income classes,
the percentage of households having shares of only 1 or 2
companies (negligible diversification) goes on declining. On the
other hand, as may be expected, the percentage of those having
shares of more than 10 companies (somewhat high
diversification) goes on increasing. Thus, the effect of income
level on portfolio diversification is perceptible only with regard
to extremes of diversification, i.e. in relation to negligible
diversification at one end and high diversification beyond 10
companies at the other end. Nevertheless, the typical or dominant
extent of diversification (portfolio of 3-10 companies) is not
much affected by income level and age level.
Amount invested in portfolio companies
6.13 While the income-class has little effect on the typical extent of
diversification, there are reasons to believe that the amount
invested in the portfolio companies by wealthier or higher
income households would be significantly more than the amount
invested by households in lower brackets. For example, the
average invested amount per company in a portfolio of 10
companies in the case of the richer investors may be, say, Rs.
1,00,000, whereas in the case of less well-to-do investors, such
average may be much lower, say, only Rs. 10,000 or Rs. 20,000.
It was not possible to collect actual data on the amounts invested
101
by individual households because of extreme reluctance to
disclose such personal financial data.28
6.14 As regards age-class analysis, one would expect the extent of
diversification to increase with age (of household head), as the
household goes on accumulating the share portfolio gradually
over life time. This is visible in Chart 6.2 in the same way as in
Chart 6.1. The percentage of investors having only 1 or 2
companies in their share portfolios goes on declining with
increase in age. Exactly the opposite is true about high
diversification: the percentage of those having more than 10
companies in the portfolio goes on increasing with the age of the
investor. However, this does not affect the typical or dominant
extent of diversification which remains the same (3-10
companies) in the case of every age group too, as pointed out
earlier.
Advantages of narrow diversification
6.15 Clearly, it is moderate diversification (portfolio comprising 3-
10 companies) which is dominant or most popular in all
income and age groups. Even though mutual funds offer much
greater diversification, most retail investors find more
advantage in direct holding of shares in a few selected
companies. Their approach seems to have a strong rationale, as
explained below.
6.16 An important practical reason why moderate diversification is the
dominant practice among retail investors is that an average retail 28 Those who are familiar with such surveys know the difficulties involved. Many households refuse to
disclose their monthly income. We included only those who were willing to disclose at least the broad income-class to which they belong. It is known that income is often under-stated because of the apprehension that the information may be leaked to tax authorities, despite our assurance of strict confidentiality.

102
investor cannot effectively supervise too many companies. It is
difficult to keep track of all the events/news and corporate actions
if the number of companies is too large. There are several other
advantages in adopting this practice.
6.17 The first advantage of direct shareholding vis-à-vis mutual fund
equity schemes is that direct investors do not have to pay the
annual management fees and expenses charged by mutual
funds. Such burden usually amounts to around 2.5% per annum
of mutual fund portfolio value, in addition to the entry and exit
loads. For the direct long-term investor, this makes considerable
difference to net annual return from investment. A majority of
retail investors are long-term shareholders, as shown by our
empirical data about retail investors’ investment strategies,
according to the household investors survey of 2004.
6.18 A second advantage is that over the years, the direct investor
becomes more knowledgeable about the companies and about the
share market. The investor begins to understand how to evaluate
companies and the market situation. He/she can then differentiate
the more promising companies from the less promising ones.
He/she also begins to understand when to enter the market and
when to quit. Such gain in investment skills is a valuable asset.
This enables the retail investor to sharpen the investment
strategy. He/she may wait and watch for market dips which
provide a good opportunity to buy more shares of the good
companies in his/her portfolio, thereby reducing the average
acquisition cost. This practical policy is followed by many retail
investors. It is not easy to implement a similar policy in the case
of mutual funds because NAVs of mutual funds are not available
103
from day-to-day. Individual share prices are available from hour
to hour.
Market “risk” turned into market “opportunity”
6.19 We would like to underline that no extent of portfolio
diversification can reduce ‘market risk’, i.e. the whole market
going up and down. Many practising investors regard a
temporary fall in market prices, not as a risk, but as an
opportunity to buy more shares of the well-performing
companies already in their portfolio.
6.20 Thus, narrow diversification of share portfolios offers solid
advantages to retail investors. This may be an important reason
why a majority of respondents in all income and age groups
have reported more satisfactory experience from direct
shareholding than from mutual fund equity schemes.
Diversification of demat shareholding
6.21 We undertook a separate analysis of share portfolio
diversification for demat shareholders (see Tables 6.3 and 6.4 for
data regarding diversification practices of demat shareholders).
The analysis showed, more or less, similar pattern for demat
shareholders as for all shareholders (see Chart 6.3).
6.22 There is theoretical support for the policy of moderate
diversification of share portfolios. It has been statistically
shown

Chart 6.3
DIVERSIFICATION OF HOUSEHOLDS’ SHARE PORTFOLIOS: ALL SHAREHOLDINGS VIS-À-VIS DEMAT
SHAREHOLDINGS*
10.22% 9.92%
10.86% 10.77%
26.30% 27.05%
23.03%26.06%
16.52%
16.28%
10.17%8.17%
2.27% 1.50%0.25%0.62%
0%
10%
20%
30%
40%
50%
60%
70%
80%
90%
100%
All Shareholdings Demat Shareholdings
Perc
ent o
f Hou
seho
lds
Legend: Number of companies in share portfolio
1
Note: Th
*All shar
2
e most ty
eholding
3-5 6
pical por
s includ
104
-10 11
tfolio size
e both ph
-20 2
has been
ysical an
1-50 51
highlight
d demat
-100 Ov
ed.
sharehol
er 100
dings.
105
that more than one-half of the investment risk, as measured by
standard deviation of individual share returns, is eliminated
by portfolios of 5 shares; and more than two-thirds of risk is
eliminated by portfolios of 10 shares.29 Hence, diversifying
beyond 10 companies can reduce the risk further to a minor
extent only. Such minor reduction in risk through wider
diversification does not seem worthwhile as it may be more
than offset by the costs and difficulties of supervising and
managing the portfolio.
Length of shareholding period
6.23 We have pointed out above the advantages of maintaining a long-
term but narrowly diversified portfolio of shares in the case of
retail investors. We have also collected empirical data to find out
how the investing population is distributed in terms of investment
strategies adopted. An important aspect of such strategy is
whether it is short-term oriented or long-term oriented. We
asked respondents to indicate their preferred period of holding
shares bought as investment.
6.24 The kind of market participants who dominate a country’s stock
market determines the market’s behaviour and its allocative
efficiency. Markets which are excessively dominated by short-
term speculators are prone to crises and are characterised by high
volatility.30 Our empirical data throws some interesting light on
the holding period length in the case of retail investors, classified
29 See L. C. Gupta, Rates of Return on Equities: The Indian Experience (Oxford University Press,
1981, pp. 33-34. ‘Market risk’ has to be distinguished from the risk of random error or insurable risk. See op. cit., pp. 31-32.
30 There is much theoretical literature by eminent economists on this subject, as indicated in our earlier studies. See, for example, L. C. Gupta, Naveen Jain and Utpal Choudhury, India’s Stock Market and Household Investors 2001-04, pp. 92-4.

106
by income-class and age-class (see Charts 6.4 and 6.5 as also the
related Tables 6.5 and 6.6 respectively). Some investors
follow a combination of strategies. They are neither purely
short-term oriented nor purely long-term oriented. Despite this
problem, a fairly clear broad picture does emerge from our
empirical analysis.
Indian middle-class dominantly long-term investors
6.25 The most noteworthy finding is that, contrary to popular belief,
the greater part representing over one-half of our respondents
(leaving aside those not interested in shares) stated that they
are long-term investors and intend to hold shares for some
years.31 Less than one-fifth of our respondents, shown against
category (a), intended to hold shares for a few days only (being
traders in shares rather than investors). Their behaviour is
governed by transient events and news rather than by
fundamental factors. Their activities accentuate the market’s
volatility as they mostly swim with the current rather than against
it, i.e. they sell when prices are declining due to heavy selling in
the market, and they buy when prices are rising because of heavy
buying in the market.
6.26 Somewhat more than one-third of respondents stated that they
intended to hold shares for some months but not exceeding one
year, as shown against category (b). Indian stock market shows
very wide fluctuation of prices over a year, as indicated by the
ratio of 52-week High/Low prices, published by financial
papers along with daily quotations. Such ratio for shares of many
31 The proportion of long-term oriented retail investors seems to have gone down over the last 3-4
years. This is a matter of concern. For comparative data from the household investors survey of 2002, see ibid., Table 4.3, p. 42. An important reason for the decline of long-term oriented retail investors is that depository charges weigh heavily on the long-term holders as distinguished from frequent traders.
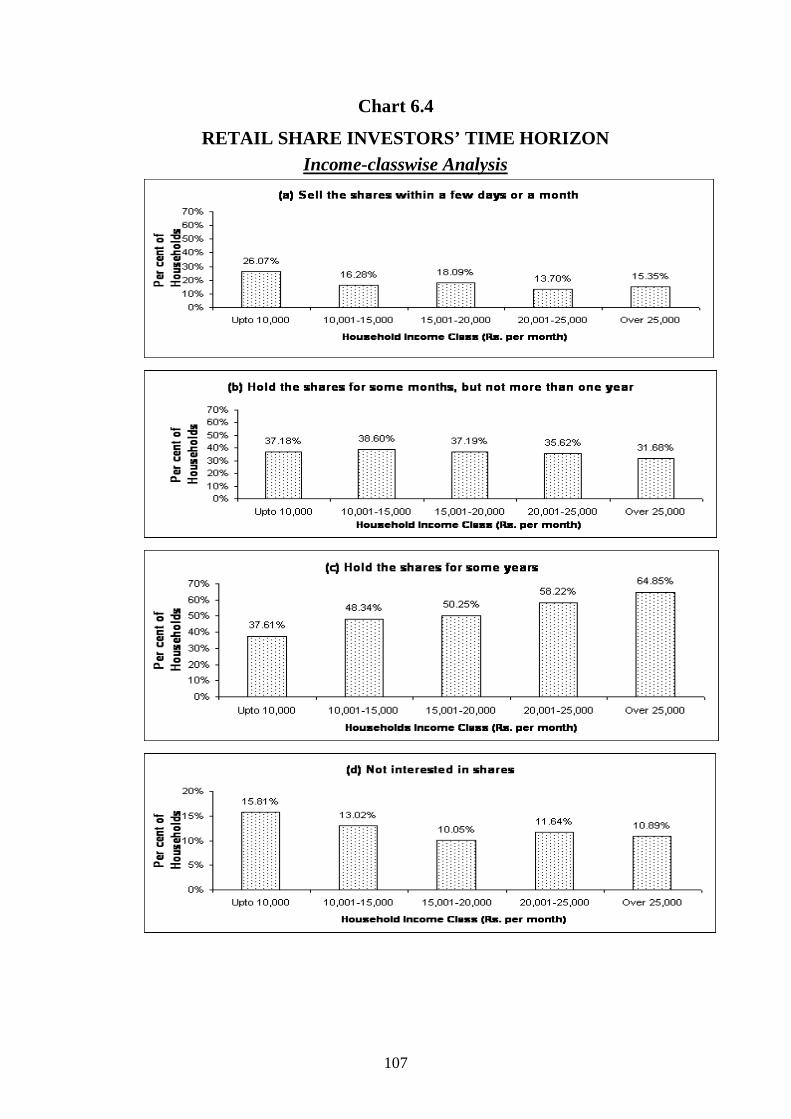
107
Chart 6.4
RETAIL SHARE INVESTORS’ TIME HORIZON
Income-classwise Analysis
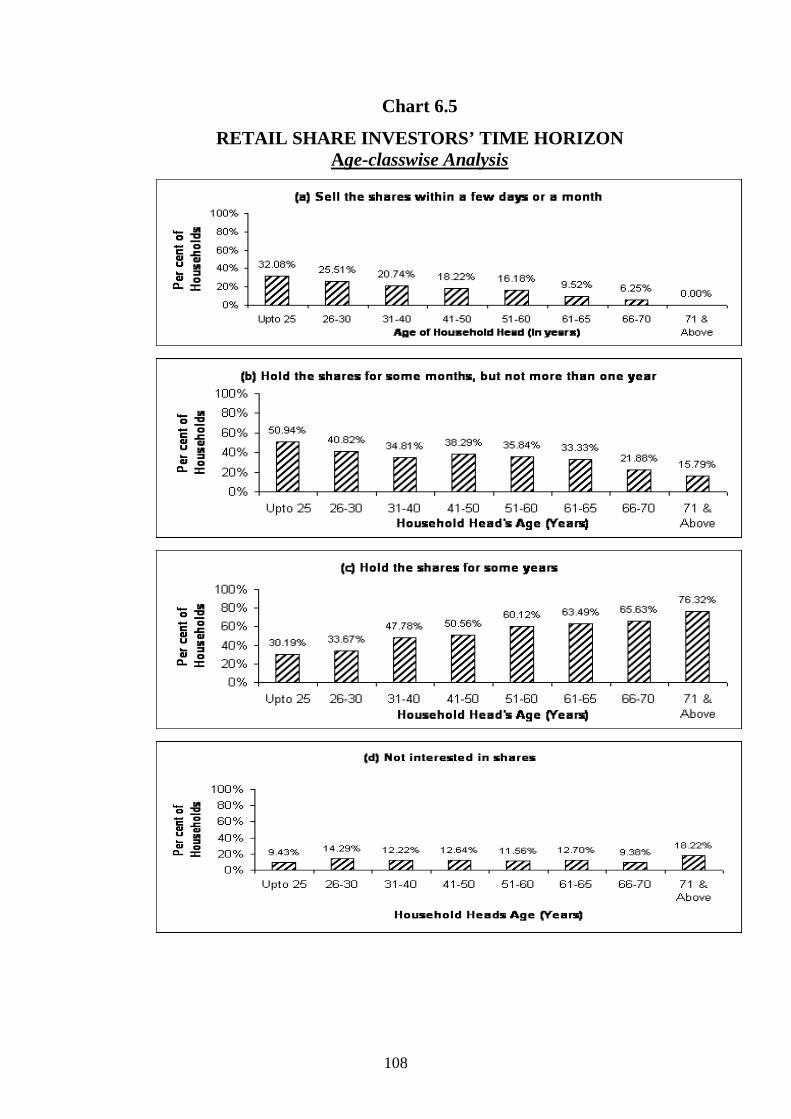
108
Chart 6.5
RETAIL SHARE INVESTORS’ TIME HORIZON Age-classwise Analysis

109
leading companies is found to be 2:1 or even more. This provides
opportunities for stock picking. Their behaviour can be a
stabilizing influence on the market because such behaviour will
usually be based on intelligent analysis of certain underlying
fundamental factors. For example, it may be the case of a
company or industry recovering from sickness or from a
recessionary phase or the opposite case of going into a
recessionary phase. Such phases may characterise a company or a
whole industry at particular times.
6.27 Investors who are able to identify such cases correctly and in
time can make very handsome profit within a few months. Such
opportunities are more attractive than the usual slow pace of
long-term rate of returns on shareholdings. To take advantage of
such opportunities requires special ability or contact with
insiders.
6.28 The income and age-class analysis shows that the long-term
investors are more predominant in the higher income and
higher age-categories, as may be observed from Tables 6.5 and
6.6 and Charts 6.4 and 6.5.
6.29 It is noteworthy that category (a), comprising pure short-
term speculators, is the smallest so far as ordinary household
investors are concerned. Category (b) is twice more numerous
compared to category (a) but much smaller than category (c),
shown in Tables 6.5 and 6.6. This is understandable because
purely short-term speculation, or satta in popular parlance, is
looked down upon by ordinary households who are mostly
conservative long-term oriented investors.32 Our earlier
household investors surveys had also brought out that a majority 32 See L. C. Gupta, Naveen Jain and Utpal Choudhury, India’s Stock Market and Household Investors
2001-04, SCMRD, 2004), pp. 41-43.

110
of retail investors are long-term oriented, but there appears to be
a tendency for their proportion to decline.
6.30 Our findings indicate that the middle and the upper middle-
class households in India are a relatively conservative lot. On
the whole, they do not generate much speculative activity on
the stock exchanges. The great bulk of stock market
speculation in India is the handiwork of stockbroking firms
and professional market operators engaged in day-trading in
both cash market and single stock futures market.

111
Table 6.1 NUMBER OF COMPANIES REPRESENTED IN INDIVIDUAL
HOUSEHOLDS’ SHARE PORTFOLIOS ¹
Household Investors Survey - 2004
Income-classwise Analysis
Household income class (Rs. per month) No. of Companies
All classes of sample households
Upto 10,000
10,001- 15,000
15,001- 20,000
20,001- 25,000
Over 25,000
Percent distribution of households column-wise
(a) 1 10.22 13.08 13.11 8.78 9.45 5.38 (b) 2 10.86 13.34 11.48 11.48 10.26 7.00 (c) 3-5 26.30 28.12 27.22 27.52 25.08 22.72 (d) 6-10 23.03 21.41 23.42 22.97 22.80 24.75 (e) 11-20 16.52 14.36 14.74 17.33 19.22 18.66 (f) 21-50 10.17 7.90 8.41 8.88 10.10 16.13 (g) 51-100 2.27 1.27 1.45 2.06 2.44 4.46 (h) Over 100 0.62 0.51 0.18 0.98 0.5 0.91
Column total 100.00 100.00 100.00 100.00 100.00 100.00 No. of Respondents 4,806 1,177 1,106 923 614 986
¹ This Table covers all shareholdings whether held in physical form or demat form.

112
Table 6.2
NUMBER OF COMPANIES REPRESENTED IN INDIVIDUAL HOUSEHOLDS’ SHARE PORTFOLIOS ¹
Household Investors Survey - 2004
Age-classwise Analysis
Age of household head in years No. of Companies
All classes of sample households
Upto 25
26-30 31-40 41-50 51-60 61-65 66-70 71 and above
Percent distribution of households column-wise (a) 1 10.22 14.39 13.54 10.96 8.18 11.81 3.35 5.74 7.41 (b) 2 10.86 17.54 14.80 11.64 9.11 10.01 7.11 6.56 0.00 (c) 3-5 26.30 32.98 31.41 28.15 25.18 20.41 24.69 27.87 17.28 (d) 6-10 23.03 18.60 23.10 23.27 24.32 24.26 19.25 15.57 24.69 (e) 11-20 16.52 10.88 10.65 15.62 18.15 17.97 24.69 18.85 23.46 (f) 21-50 10.17 4.56 4.69 8.41 11.91 11.42 17.57 17.21 19.75 (g) 51-100 2.27 0.35 1.26 1.43 2.58 3.21 2.93 8.20 4.94 (h) Over 100 0.62 0.70 0.54 0.53 0.57 0.90 0.42 0.00 2.47
Column total 100.00 100.00 100.00 100.00 100.00 100.00 100.00 100.00 100.00 No. of Respondents 4,806* 285 554 1,331 1,394 780 239 122 81
See note under Table 6.1 * Out of total sample respondents, a few did not provide information on their age. They have
therefore, not been included in the individual age-classes but are included in the total sample.

113
Table 6.3 NUMBER OF COMPANIES REPRESENTED IN INDIVIDUAL
HOUSEHOLDS’ SHAREHOLDINGS HELD IN DEMAT FORM ¹
Household Investors Survey – 2004
Income-classwise Analysis
Household income class (Rs. per month) No. of Companies
All classes of sample households
Upto 10,000
10,001– 15,000
15,001– 20,000
20,001- 25,000
Over 25,000
Percent distribution of households column-wise
(a) 1 9.92 10.78 13.15 10.03 9.93 5.56 (b) 2 10.77 14.60 9.99 10.49 11.70 6.99 (c) 3-5 27.05 28.16 31.48 27.05 24.72 22.64 (d) 6-10 26.06 25.61 24.15 27.20 25.39 27.94 (e) 11-20 16.28 13.79 14.92 17.02 17.66 19.02 (f) 21-50 8.17 6.14 5.44 6.84 8.83 13.97 (g) 51-100 1.50 0.93 0.88 0.91 1.32 3.36 (h) Over 100 0.25 0.00 0.00 0.46 0.44 0.52
Column total 100.00 100.00 100.00 100.00 100.00 100.00
No. of Respondents 3538 863 791 658 453 773
¹ This Table covers shareholdings held in demat form only, i.e. excluding physical form.
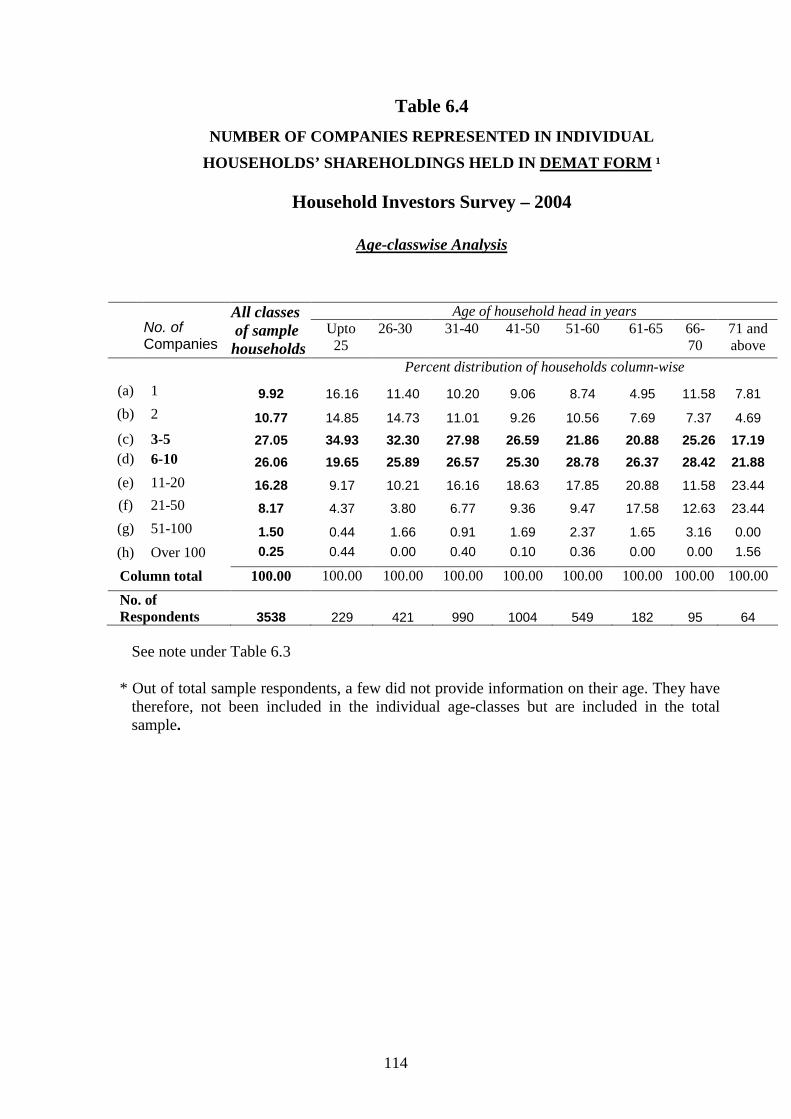
114
Table 6.4 NUMBER OF COMPANIES REPRESENTED IN INDIVIDUAL
HOUSEHOLDS’ SHAREHOLDINGS HELD IN DEMAT FORM ¹
Household Investors Survey – 2004
Age-classwise Analysis
Age of household head in years No. of Companies
All classes of sample households
Upto 25
26-30 31-40 41-50 51-60 61-65 66-70
71 and above
Percent distribution of households column-wise (a) 1 9.92 16.16 11.40 10.20 9.06 8.74 4.95 11.58 7.81 (b) 2 10.77 14.85 14.73 11.01 9.26 10.56 7.69 7.37 4.69 (c) 3-5 27.05 34.93 32.30 27.98 26.59 21.86 20.88 25.26 17.19 (d) 6-10 26.06 19.65 25.89 26.57 25.30 28.78 26.37 28.42 21.88 (e) 11-20 16.28 9.17 10.21 16.16 18.63 17.85 20.88 11.58 23.44 (f) 21-50 8.17 4.37 3.80 6.77 9.36 9.47 17.58 12.63 23.44 (g) 51-100 1.50 0.44 1.66 0.91 1.69 2.37 1.65 3.16 0.00 (h) Over 100 0.25 0.44 0.00 0.40 0.10 0.36 0.00 0.00 1.56
Column total 100.00 100.00 100.00 100.00 100.00 100.00 100.00 100.00 100.00
No. of Respondents 3538 229 421 990 1004 549 182 95 64 See note under Table 6.3 * Out of total sample respondents, a few did not provide information on their age. They have
therefore, not been included in the individual age-classes but are included in the total sample.

115
Note: Column totals may add to more than 100 because some investors follow a fixed
strategy and have ticked two or three strategies.
Table 6.5
RETAIL INVESTORS’ PREFERRED STRATEGY REGARDING SHARE INVESTMENT IN TERMS OF TIME HORIZON
Household Investors Survey – 2004
Income- classwise Analysis
Household income class (Rs. per month)
Time horizon
All classes of sample households
Upto 10,000
10,001-15,000
15,001-20,000
20,001-25000
Over 25,000
Percent of Household Column-wise (a) Sell the shares
within a few days or a month
18.37
26.07
16.28
18.09
13.70
15.35
(b) Hold the shares for some months, but not more than one year
36.14
37.18
38.60
37.19
35.62
31.68
(c) Hold the shares for some years
51.00 37.61 48.37 50.25 58.22 64.85
(d) Not interested in shares
12.45 15.81 13.02 10.05 11.64 10.89
No. of Respondents 996 234 215 199 146 202
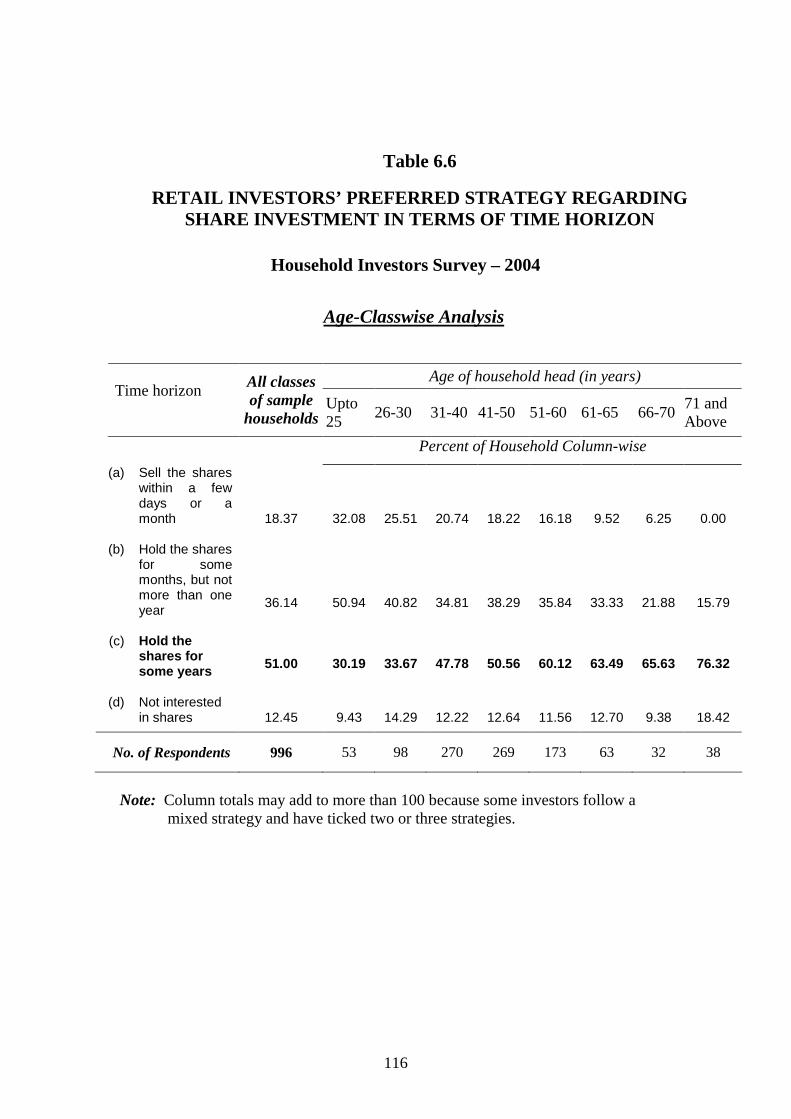
116
Table 6.6
RETAIL INVESTORS’ PREFERRED STRATEGY REGARDING SHARE INVESTMENT IN TERMS OF TIME HORIZON
Household Investors Survey – 2004
Age-Classwise Analysis
Age of household head (in years) Time horizon
All classes of sample
households Upto 25 26-30 31-40 41-50 51-60 61-65 66-70 71 and
Above Percent of Household Column-wise
(a) Sell the shares within a few days or a month
18.37
32.08
25.51
20.74
18.22
16.18
9.52
6.25
0.00
(b) Hold the shares for some months, but not more than one year
36.14
50.94
40.82
34.81
38.29
35.84
33.33
21.88
15.79
(c) Hold the shares for some years
51.00 30.19 33.67 47.78 50.56 60.12 63.49 65.63 76.32
(d) Not interested in shares
12.45
9.43
14.29
12.22
12.64
11.56
12.70
9.38
18.42
No. of Respondents 996 53 98 270 269 173 63 32 38
Note: Column totals may add to more than 100 because some investors follow a
mixed strategy and have ticked two or three strategies.
117
Chapter 7
THE CHANGING PATTERN OF HOUSEHOLDS’
INVESTMENT PREFERENCES
I. Introduction
General
7.1 Investment preferences among household investors have
important socio-economic implications. Such preferences
influence the direction in which, and the channels through which,
household financial savings would flow. A developing economy,
like India, needs a growing amount of household savings to flow
to corporate enterprises. Such flow can grow on a sustained basis
if, and only if, there is an effective system to ensure that the
enterprises receiving the flow are sound and will make proper use
of the money provided. In the absence of effective checks on
mismanagement and misappropriation at the corporate enterprise
level, the saver’s investment preference is turned away from
corporate shares and securities towards other savings instruments.
7.2 Our focus is on the investment preferences of middle class
households, more specially on the extent to which they use shares
and other non-government capital market instruments as vehicles
for accumulating their hard-earned savings.
Historical perspective
7.3 Prior to 1980s, the stock market’s role in financing of Indian
corporate enterprises was relatively minor. Shareownership was
uncommon, except among a small segment of wealthy
individuals. Share investment was not regarded highly among

118
Indian middle-class households and was equated in the public
mind with “satta” or speculation.33
7.4 Shares were popularised among the middle-class households in
India by the so-called FERA issues. Under the Foreign Exchange
Regulation Act (FERA) of 1973, foreign companies were
required to reduce their shareholding in Indian subsidiaries to the
maximum permissible limit of 40 per cent. As a result, share
issues had to be made to the public by a large number of well-
established highly profitable foreign-controlled Indian companies
in order to reduce the foreign holding to the permissible limit.
7.5 The share issue price was fixed by the Controller of Capital
Issues according to a conservative formula which invariably
resulted in substantial under-pricing. Hence, the subscribers to
such issues could earn substantial capital appreciation overnight.
Understandably, there was tremendous rush for FERA issues
from ordinary investors, many of them putting in multiple
applications. Almost every FERA issue was heavily over-
subscribed and allotment had to be made by a draw of lots which
favoured small applicants. Underpricing due to Capital Issues
Control was also a feature of public issues by established
domestic companies. The rapid spread of shareownership among
middle-class urban households all over the country was aided by
an allotment system which favoured small investors in case of
over-subscription. It was also promoted by requiring issuing
companies to have a large number of collection centres for share
applications from all over the country.
33 See L. C. Gupta, The Changing Structure of Industrial Finance in India (London, Claredon Press,
1969), Chapter 9, esp. p. 155. See also L. C. Gupta, P.K. Jain and C.P. Gupta, Indian Stock Market P/E Ratios (Society for Capital Market Research & Development, Delhi, 1998), pp. 28-29.

119
7.6 In fact, equity share ownership had increasingly become a middle
class phenomenon in India since around 1980s. Our first
household investor survey conducted in 1990 found that the
domestic middle-class households had become the backbone of
the Indian equity market.
7.7 The abolition of Capital Issues Control and replacing it by a free-
pricing system in 1992 removed the safeguard for ordinary
investors. However, economic liberalization of 1991 had led to
such euphoric conditions that new issues were lapped up avidly
and indiscriminately by the investing public. This was so for
most part of the period from 1992 to 1994. Because of euphoria,
and the lack of proper regulation, this period saw the flotation of
a large number of unsound and even fraudulent companies. The
widespread bad experiences led to withdrawal of the investors
from the stock market for many years after the mid-1990s.
II. Empirical Data on Households’ Investment Preferences
Market penetration of investment types
7.8 In our empirical analysis, we shall specially look at the following
two aspects of household investors’ preferences:
(1) The first aspect relates to examining how the market
penetration of the various investment types differs among
income classes and among age-classes of households.
(Market penetration of a ‘product’, whether financial or
other, is measured as the percentage of households
possessing or buying the product).

120
(2) The second aspect relates to the current preferences as
reflected in the current choices of investment type. This is
not readily apparent. This has to be inferred by exploring
the investment intentions.
7.9 How the market penetration, i.e. the per cent of owners of each
type of capital market instrument, varies among income classes is
shown in Chart 7.1, and how the penetration varies among age
classes is shown in Chart 7.2. Alternatively, for some purposes,
these charts may be designed to focus on the patterns within each
income-class and age-class, as shown in Charts 7.1A and 7.2A.
The Charts are based on Tables 7.1 and 7.2 given after the text of
this chapter.
7.10 Two features of market penetration stand out:
(a) It is noteworthy that equity shares have achieved a fairly
high degree of penetration among the well-to-do middle-
class investors. This is indicated by widespread
shareownership within each income and age class of
households in our sample. Shareowning households were
nearly 74% among the sample households in the lowest
income class (upto Rs. 10,000 per month), going up to
more than 85% in the highest income class (above Rs.
25,000 per month).34 Age-class variation of
sharownership among households had also about the
same kind of range. It may be observed from our data
that market penetration of equity shares is fairly flat
34 The percentage figures mentioned above are far higher than the average for the entire population
which has a large component of poor and also illiterate households. To place the whole thing in a broad perspective, it may be noted that only 4 -5 percent of all Indian households are shareowning households. Shareowning individuals hardly constitute 2% of India’s total population.
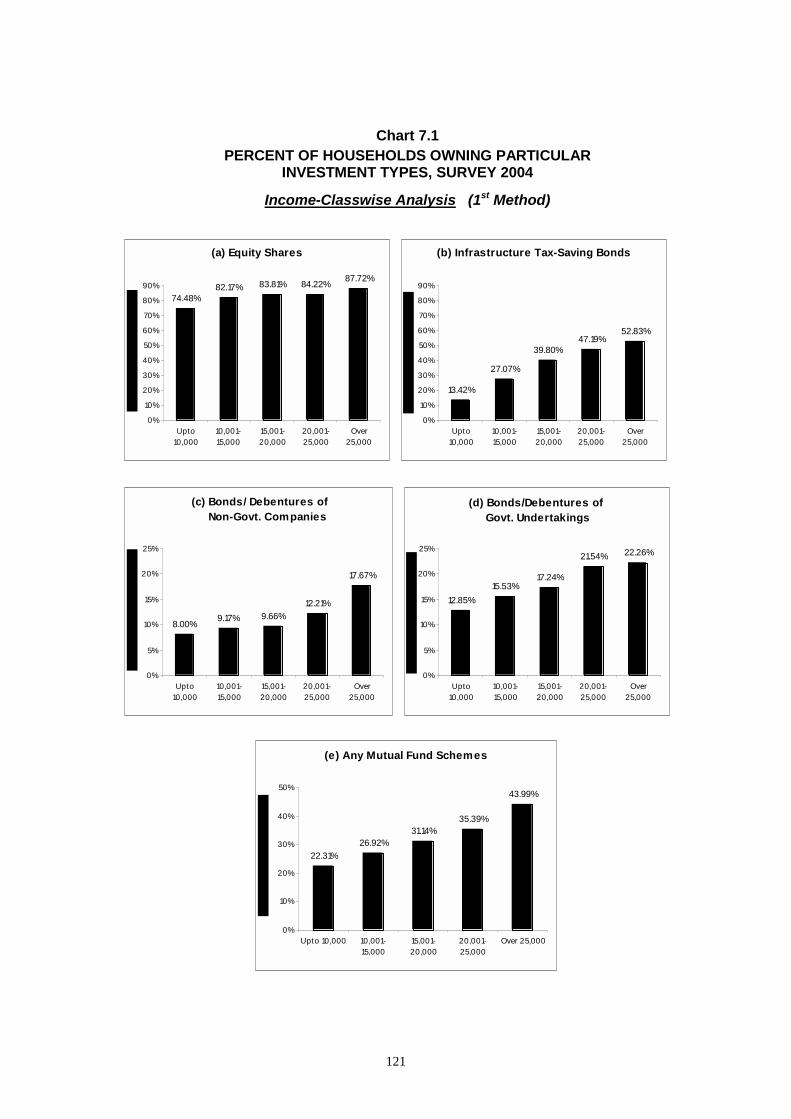
121
Chart 7.1
PERCENT OF HOUSEHOLDS OWNING PARTICULAR INVESTMENT TYPES, SURVEY 2004
Income-Classwise Analysis (1st Method)
(a) Equity Shares
74.48%82.17% 83.81% 84.22% 87.72%
0%
10%
20%
30%
40%
50%
60%
70%
80%
90%
Upto10,000
10,001-15,000
15,001-20,000
20,001-25,000
Over25,000
(b) Infrastructure Tax-Saving Bonds
13.42%
27.07%
39.80%47.19%
52.83%
0%
10%
20%
30%
40%
50%
60%
70%
80%
90%
Upto10,000
10,001-15,000
15,001-20,000
20,001-25,000
Over25,000
(c) Bonds/ Debentures of Non-Govt. Companies
8.00%9.17% 9.66%
12.21%
17.67%
0%
5%
10%
15%
20%
25%
Upto10,000
10,001-15,000
15,001-20,000
20,001-25,000
Over25,000
(d) Bonds/Debentures of Govt. Undertakings
12.85%15.53%
17.24%
21.54% 22.26%
0%
5%
10%
15%
20%
25%
Upto10,000
10,001-15,000
15,001-20,000
20,001-25,000
Over25,000
(e) Any Mutual Fund Schemes
22.31%26.92%
31.14%35.39%
43.99%
0%
10%
20%
30%
40%
50%
Upto 10,000 10,001-15,000
15,001-20,000
20,001-25,000
Over 25,000
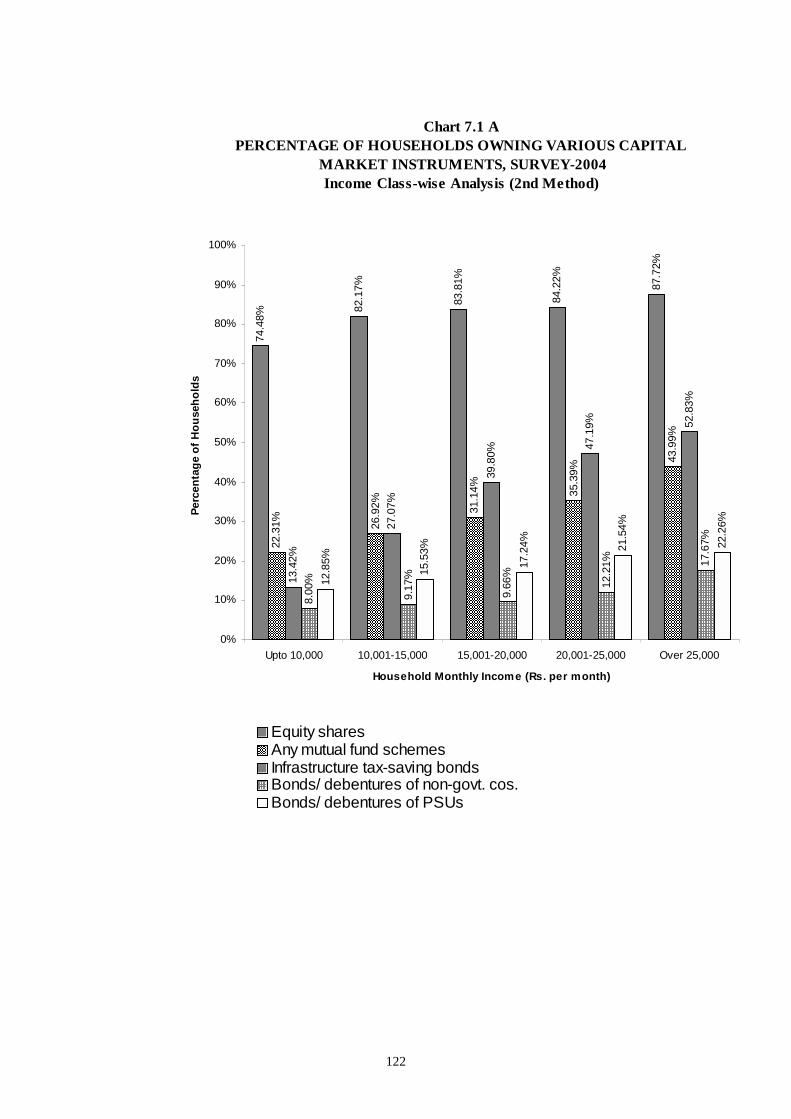
122
Chart 7.1 A PERCENTAGE OF HOUSEHOLDS OWNING VARIOUS CAPITAL
MARKET INSTRUMENTS, SURVEY-2004Income Class-wise Analysis (2nd Method)
74.4
8%
82.1
7%
83.8
1%
84.2
2%
87.7
2%
22.3
1% 26.9
2% 31.1
4% 35.3
9%
43.9
9%
13.4
2%
27.0
7%
39.8
0%
47.1
9% 52.8
3%
8.00
%
9.17
%
9.66
%
12.2
1% 17.6
7%
12.8
5%
15.5
3%
17.2
4% 21.5
4%
22.2
6%
0%
10%
20%
30%
40%
50%
60%
70%
80%
90%
100%
Upto 10,000 10,001-15,000 15,001-20,000 20,001-25,000 Over 25,000
Household Monthly Income (Rs. per month)
Perc
enta
ge o
f Hou
seho
lds
Equity sharesAny mutual fund schemesInfrastructure tax-saving bondsBonds/ debentures of non-govt. cos.Bonds/ debentures of PSUs
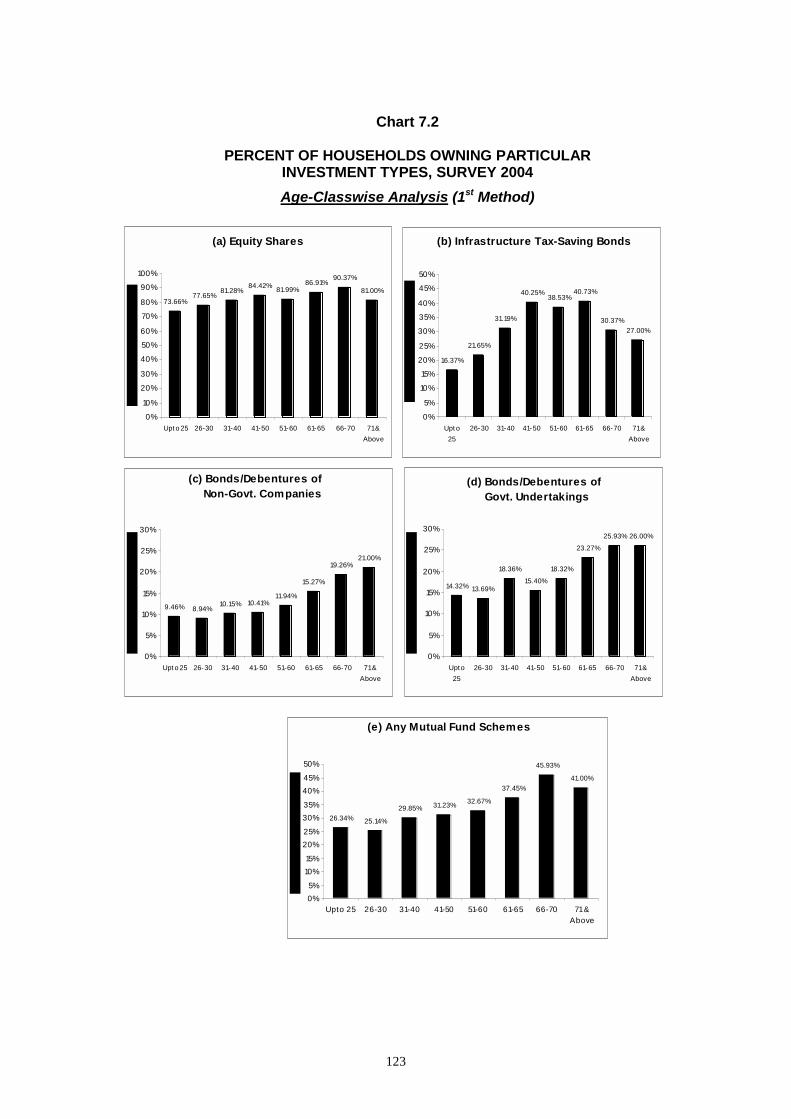
123
Chart 7.2
PERCENT OF HOUSEHOLDS OWNING PARTICULAR INVESTMENT TYPES, SURVEY 2004
Age-Classwise Analysis (1st Method)
(a) Equity Shares
73.66%77.65%
81.28%84.42% 81.99%
86.91%90.37%
81.00%
0%
10%
20%
30%
40%
50%
60%
70%
80%
90%
100%
Upt o 25 26-30 31-40 41-50 51-60 61-65 66-70 71 &Above
(b) Infrastructure Tax-Saving Bonds
16.37%
21.65%
31.19%
40.25%38.53%
40.73%
30.37%27.00%
0%
5%
10%
15%
20%
25%
30%
35%
40%
45%
50%
Upt o25
26-30 31-40 41-50 51-60 61-65 66-70 71 &Above
(c) Bonds/Debentures of Non-Govt. Companies
9.46% 8.94%10.15% 10.41%
11.94%
15.27%
19.26%21.00%
0%
5%
10%
15%
20%
25%
30%
Upt o 25 26-30 31-40 41-50 51-60 61-65 66-70 71 &Above
(d) Bonds/Debentures of Govt. Undertakings
14.32% 13.69%
18.36%
15.40%
18.32%
23.27%
25.93% 26.00%
0%
5%
10%
15%
20%
25%
30%
Upto25
26-30 31-40 41-50 51-60 61-65 66-70 71 &Above
(e) Any Mutual Fund Schemes
26.34% 25.14%
29.85% 31.23% 32.67%
37.45%
45.93%
41.00%
0%5%
10%15%
20%25%
30%35%
40%45%
50%
Upto 25 26-30 31-40 41-50 51-60 61-65 66-70 71 &Above
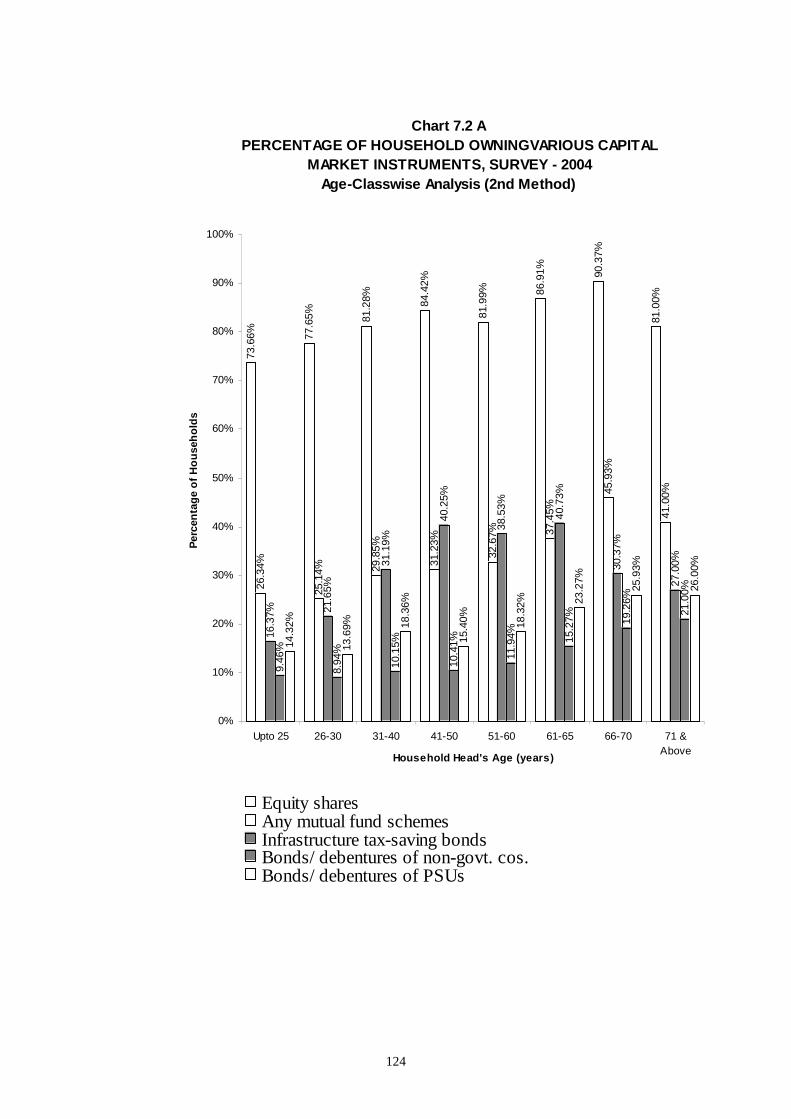
124
Chart 7.2 A PERCENTAGE OF HOUSEHOLD OWNINGVARIOUS CAPITAL
MARKET INSTRUMENTS, SURVEY - 2004Age-Classwise Analysis (2nd Method)
73.6
6% 77.6
5% 81.2
8% 84.4
2%
81.9
9% 86.9
1% 90.3
7%
81.0
0%
26.3
4%
25.1
4% 29.8
5%
31.2
3%
32.6
7% 37.4
5%
45.9
3%
41.0
0%
16.3
7% 21.6
5%
31.1
9%
40.2
5%
38.5
3%
40.7
3%
30.3
7%
27.0
0%
9.46
%
8.94
%
10.1
5%
10.4
1%
11.9
4% 15.2
7% 19.2
6%
21.0
0%
14.3
2%
13.6
9% 18.3
6%
15.4
0% 18.3
2% 23.2
7%
25.9
3%
26.0
0%
0%
10%
20%
30%
40%
50%
60%
70%
80%
90%
100%
Upto 25 26-30 31-40 41-50 51-60 61-65 66-70 71 &AboveHousehold Head's Age (years)
Perc
enta
ge o
f Hou
seho
lds
Equity sharesAny mutual fund schemesInfrastructure tax-saving bondsBonds/ debentures of non-govt. cos.Bonds/ debentures of PSUs

125
across income-classes and also age-classes, showing
only a very gradual rise with increase in income and age.
(b) Compared to shares, the other capital market instruments
have much lower penetration among household investors.
The penetration achieved by mutual funds in the case of
every income-class and age-class is only a fraction (one-
third to one-half) compared to that of equity shares.
Corporate bonds have lower penetration than mutual
funds, except in the case of infrastructure tax-saving
bonds among the tax-paying classes.
Investment game to identify preferences
7.11 Ownership of particular financial assets (or any durable
“product”) by households at a point of time is based on purchases
made in the past, sometimes many years ago, and may not
indicate the current demand or the current pattern of investment
preferences. For understanding the current investment
preferences, we have used two tools, viz. (1) investment game
which was explained in Chapter 5 earlier and (2) asking each
household head to indicate what was the likelihood of making
‘net addition’ over the next one year to the household’s
investment in selected investment types. Likelihood was
distinguished into ‘very likely’, ‘somewhat likely’, ‘not much
likely’ and ‘not at all likely’.
7.12 The allocations determined from the investment game are based
on subjective thinking among the respondents. Nevertheless, as
we shall show, the subjective allocational choices clearly reflect
the distinct ethos and feelings of the various income-classes and
age-classes. This becomes clear from the fact that even though

126
the notional sum to be allocated by every income and age group
was exactly the same, a systematic relationship both with income
and age is observable from our analysis. Of course, the absolute
numbers produced by this game should not be taken at face
value35 but used only for determining the relative preference
between one investment type and another and also the strength of
such relative preference.
7.13 Two aspects of findings of the investment game should be
distinguished: (a) The first aspect is the percent of households
who chose a certain investment type for allocating some money
at least. This percentage is comparable to market penetration
based on ownership of investment types. All these percentages
are not exclusive, i.e. the same household may choose or own
several investment types. (b) The second aspect is the percent of
total amount allocated to a given investment type. The total of
allocations cannot exceed 100% of the amount to be allocated
because allocation to each investment type is exclusive.
7.14 The investment game shows that the percentage of households
choosing to allocate some amount to equity shares is nearly as
high in the case of all income groups as the penetration levels of
shareownership. The relevant percentages are shown below for
ready comparison.
35 The game permitted allocation within a limited list of investment types whereas the choices available
to investors in the real world are unlimited. Hence, the real world pattern of allocations would be different from the pattern observed in our game.
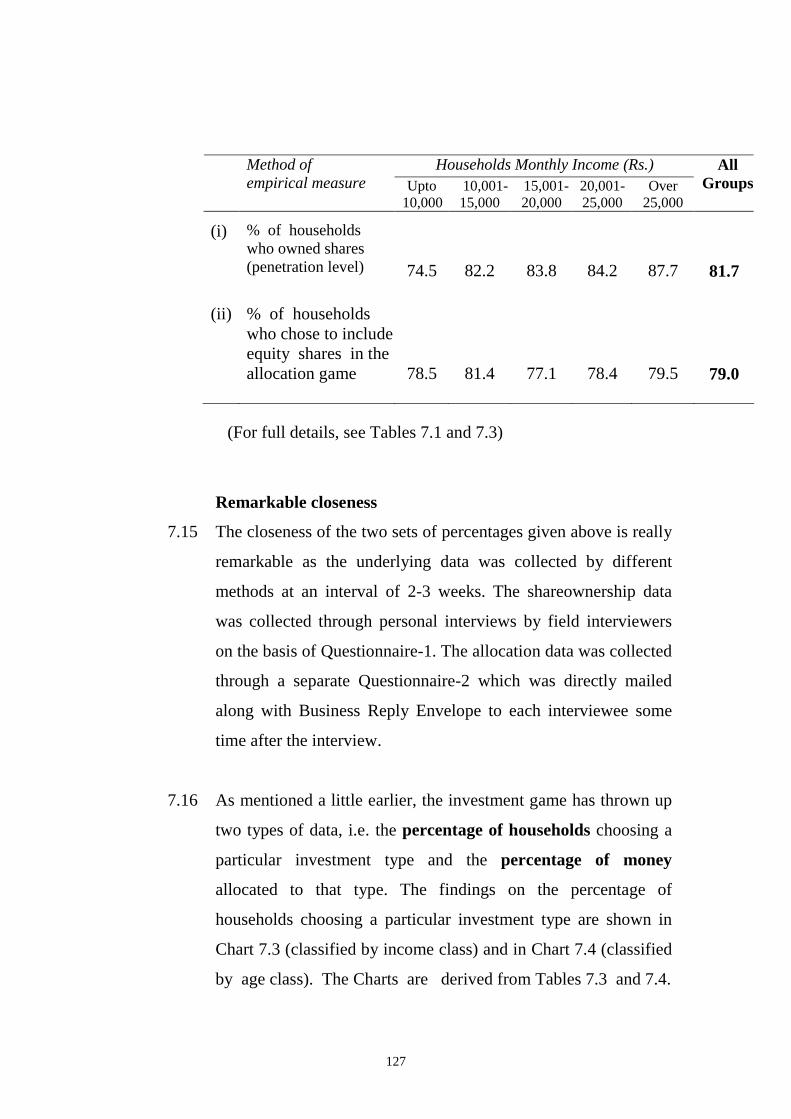
127
Households Monthly Income (Rs.)
Method of empirical measure Upto
10,00010,001-15,000
15,001- 20,000
20,001- 25,000
Over 25,000
All Groups
(i) % of households who owned shares (penetration level)
74.5
82.2
83.8
84.2
87.7
81.7
(ii) % of households who chose to include equity shares in the allocation game
78.5
81.4
77.1
78.4
79.5
79.0
(For full details, see Tables 7.1 and 7.3)
Remarkable closeness
7.15 The closeness of the two sets of percentages given above is really
remarkable as the underlying data was collected by different
methods at an interval of 2-3 weeks. The shareownership data
was collected through personal interviews by field interviewers
on the basis of Questionnaire-1. The allocation data was collected
through a separate Questionnaire-2 which was directly mailed
along with Business Reply Envelope to each interviewee some
time after the interview.
7.16 As mentioned a little earlier, the investment game has thrown up
two types of data, i.e. the percentage of households choosing a
particular investment type and the percentage of money
allocated to that type. The findings on the percentage of
households choosing a particular investment type are shown in
Chart 7.3 (classified by income class) and in Chart 7.4 (classified
by age class). The Charts are derived from Tables 7.3 and 7.4.

128
Chart 7.3
PER CENT OF HOUSEHOLDS WHO CHOSE PARTICULAR
INVESTMENT TYPES WHILE ALLOCATING A SUM RS. 1,00,000
(Income-classwise analysis)
Households income class Upto 10,000 Per Month
84.0
5%
78.4
5%
27.5
9%
23.7
1%
3.88
%
5.17
%
4.31
%
1.47
%
4.62
%
80.6
0%
0%
20%
40%
60%
80%
100%
Perc
enta
ge o
f Hou
seho
lds
Household income class 10,001-15,000 Per month
0%
20%
40%
60%
80%
100%
Houshold income class 15,001-20,000 Per month
71.3
5%
77.0
8%
32.2
9%
22.9
1%
14.5
8%
4.68
%
1.04
%
1.26
%
5.79
%
84.3
7%
0%
20%
40%
60%
80%
100%
Perc
enta
ge o
f hou
seho
lds
Households income class 20,001-25,000 per month
0%
20%
40%
60%
80%
100%
Households income class Over 25,000 Per month
0%
20%
40%
60%
80%
100%
Bank Fixed Deposits Gilt funds
Equity shares Money market funds
Mutual fund equity / growth schemes Bonds/ debentures of non-govt. cos.
Mutual Fund income schemes Bonds of PSUs/Financial Institutions
Mutual fund balanced schemes Govt. saving schemes Note: Each respondent was requested to allocate a notional sum of Rs.1,00,000
among not more than 5 of the above-mentioned investment types in the most preferred way in his/her circumstances.
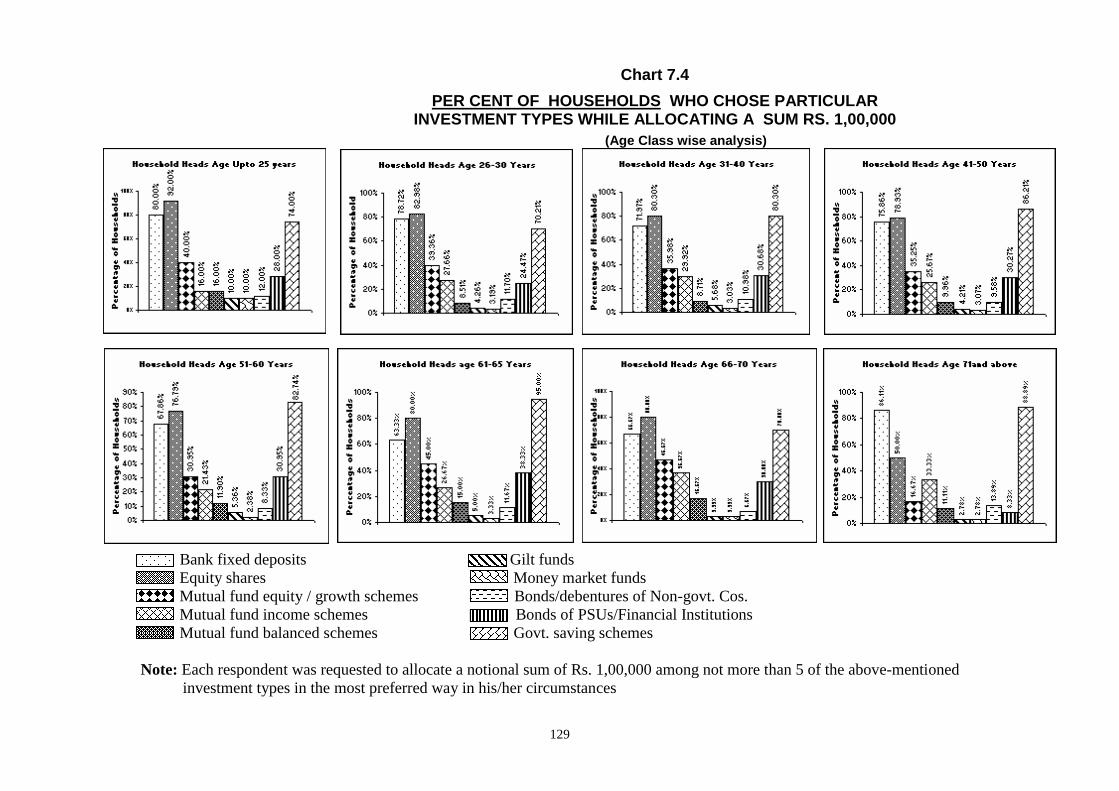
Bank fixed
Equity sha Mutual fun Mutual fun Mutual fun
Note: Each respo
investmen
129
Chart 7.4 PER CENT OF HOUSEHOLDS WHO CHOSE PARTICULAR
INVESTMENT TYPES WHILE ALLOCATING A SUM RS. 1,00,000 (Age Class wise analysis)
deposits Gilt funds res Money market funds d equity / growth schemes Bonds/debentures of Non-govt. Cos. d income schemes Bonds of PSUs/Financial Institutions d balanced schemes Govt. saving schemes
ndent was requested to allocate a notional sum of Rs. 1,00,000 among not more than 5 of the above-mentioned t types in the most preferred way in his/her circumstances
130
7.17 How the allocation of the available fixed amount (notional sum)
among investment types varies with income-class and with age-
class is shown in Charts 7.5 and 7.6 respectively. They are
derived from Tables 7.5 and 7.6. Observe the changes from one
income-class to the next and from one age-class to the next in
these charts which are self-explanatory. Charts 7.5 and 7.6 may
be alternatively presented to focus directly on the sensitiveness of
the allocations to change in income and age, as shown in Charts
7.5A and 7.6A.
7.18 It may be observed from Charts 7.5A and 7.6A that there is
remarkably high orderliness and consistency of findings relating
to income-classwise and age-classwise investment preferences, as
brought out by the investment game. For example, even though
the notional sum to be allocated was the same for all income and
age classes, the amount allocated to bank fixed deposits shows a
systematic decline as we move from lower to higher income
classes. This is along expected lines. On the other hand, the
amount allocated to mutual fund schemes shows a, more or less,
systematic rise as we move from lower to higher income classes.
7.19 Government savings schemes are found to enjoy substantial
popularity among all income classes. This is mainly because
they are the safest instruments, even though not as liquid as bank
fixed deposits. Some of the government savings schemes (like
public provident fund) offer tax concessions upto a certain limit.
They are more attractive to tax payers than to non-tax payers.
Since there is also a limit on the allowable tax concession, the
amount allocated to savings schemes by the first three income
classes at the lower end shows a rising tendency and thereafter a
decline (see Chart 7.5A).
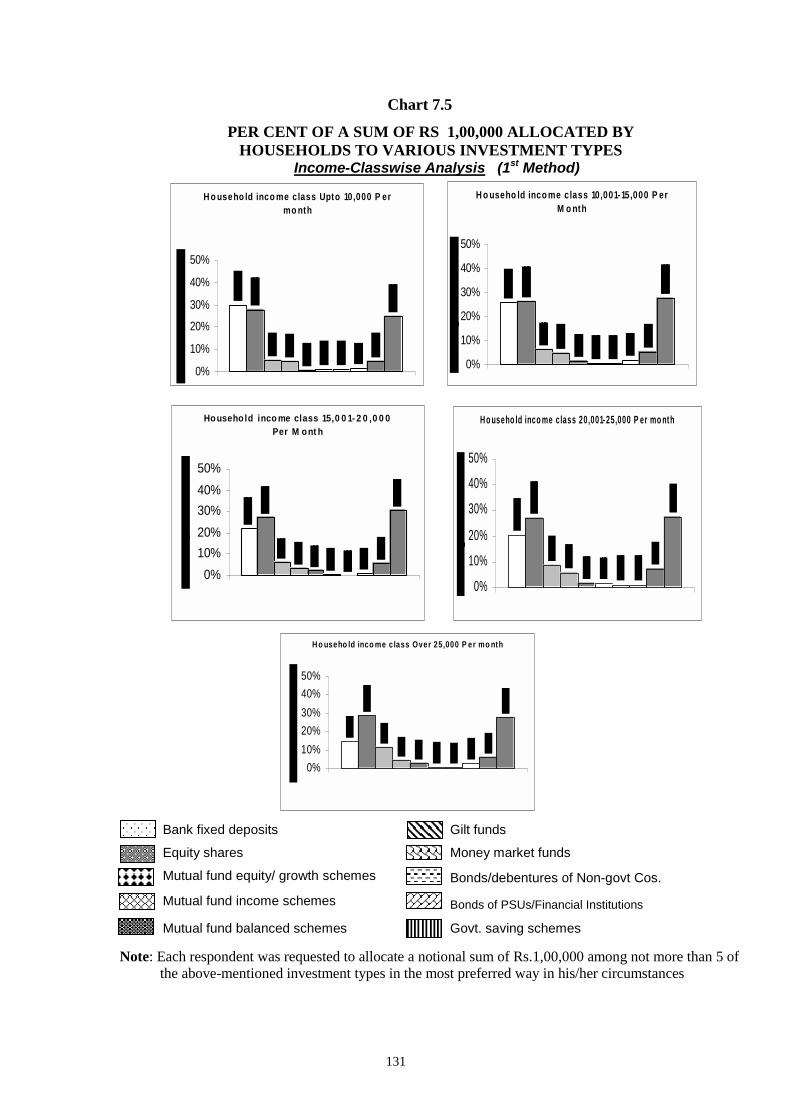
131
Chart 7.5
PER CENT OF A SUM OF RS 1,00,000 ALLOCATED BY HOUSEHOLDS TO VARIOUS INVESTMENT TYPES
Income-Classwise Analysis (1st Method)
H o useho ld inco me class Upto 10,000 P er mo nth
0%
10%
20%
30%
40%
50%
H o useho ld inco me class 10,001-15,000 P er M o nth
0%
10%
20%
30%
40%
50%
Househo ld inco me class 15,0 0 1- 2 0 ,0 0 0 Per M ont h
0%10%20%30%40%50%
H o useho ld inco me class 20,001-25,000 P er mo nth
0%
10%
20%
30%
40%
50%
H o useho ld inco me c lass Over 25,000 P er mo nth
0%10%20%30%40%50%
Bank fixed deposits
Gilt funds
Equity shares
Money market funds
Mutual fund equity/ growth schemes
Bonds/debentures of Non-govt Cos.
Mutual fund income schemes
Bonds of PSUs/Financial Institutions
Mutual fund balanced schemes
Govt. saving schemes
Note: Each respondent was requested to allocate a notional sum of Rs.1,00,000 among not more than 5 of the above-mentioned investment types in the most preferred way in his/her circumstances
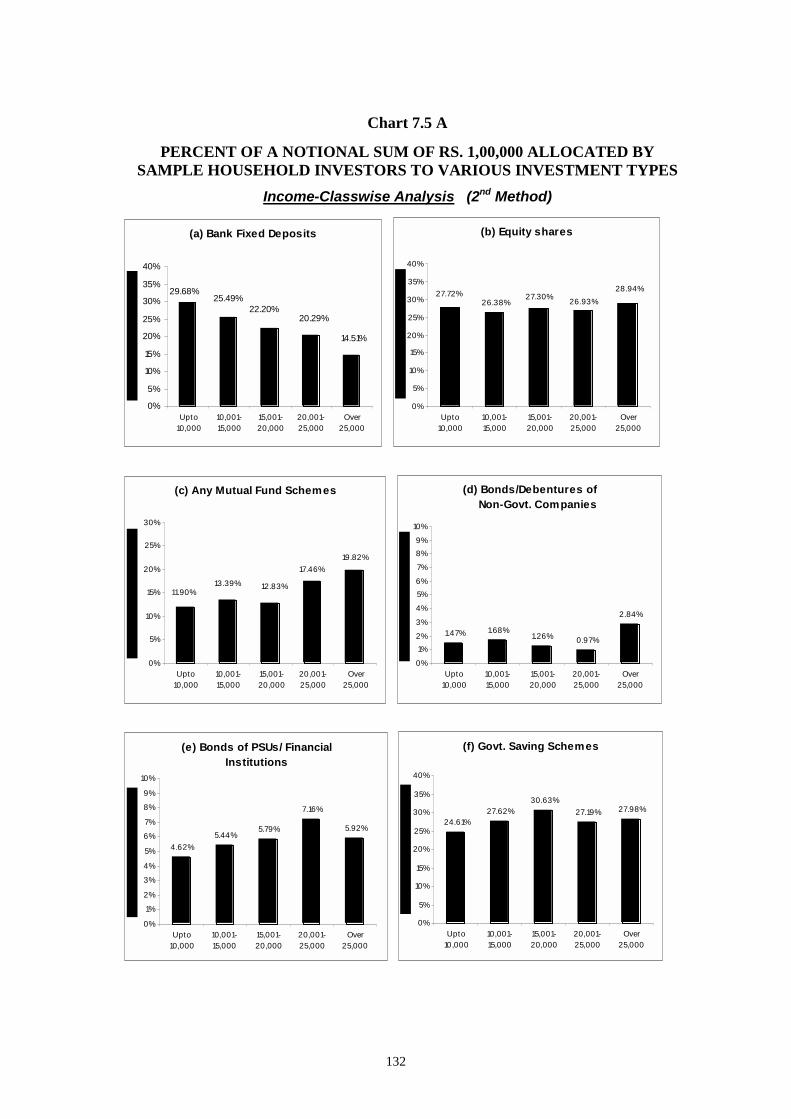
132
Chart 7.5 A
PERCENT OF A NOTIONAL SUM OF RS. 1,00,000 ALLOCATED BY SAMPLE HOUSEHOLD INVESTORS TO VARIOUS INVESTMENT TYPES
Income-Classwise Analysis (2nd Method)
(a) Bank Fixed Deposits
14.51%
20.29%22.20%
25.49%29.68%
0%
5%
10%
15%
20%
25%
30%
35%
40%
Upto10,000
10,001-15,000
15,001-20,000
20,001-25,000
Over25,000
(b) Equity shares
28.94%26.93%27.30%
26.38%27.72%
0%
5%
10%
15%
20%
25%
30%
35%
40%
Upto10,000
10,001-15,000
15,001-20,000
20,001-25,000
Over25,000
(c) Any Mutual Fund Schemes
11.90%13.39% 12.83%
17.46%19.82%
0%
5%
10%
15%
20%
25%
30%
Upto10,000
10,001-15,000
15,001-20,000
20,001-25,000
Over25,000
(d) Bonds/Debentures of Non-Govt. Companies
1.47% 1.68%1.26% 0.97%
2.84%
0%
1%2%
3%
4%
5%6%
7%
8%9%
10%
Upto10,000
10,001-15,000
15,001-20,000
20,001-25,000
Over25,000
(e) Bonds of PSUs/ Financial Institutions
4.62%5.44%
5.79%
7.16%
5.92%
0%
1%
2%
3%
4%
5%
6%
7%
8%
9%
10%
Upto10,000
10,001-15,000
15,001-20,000
20,001-25,000
Over25,000
(f) Govt. Saving Schemes
24.61%27.62%
30.63%27.19% 27.98%
0%
5%
10%
15%
20%
25%
30%
35%
40%
Upto10,000
10,001-15,000
15,001-20,000
20,001-25,000
Over25,000
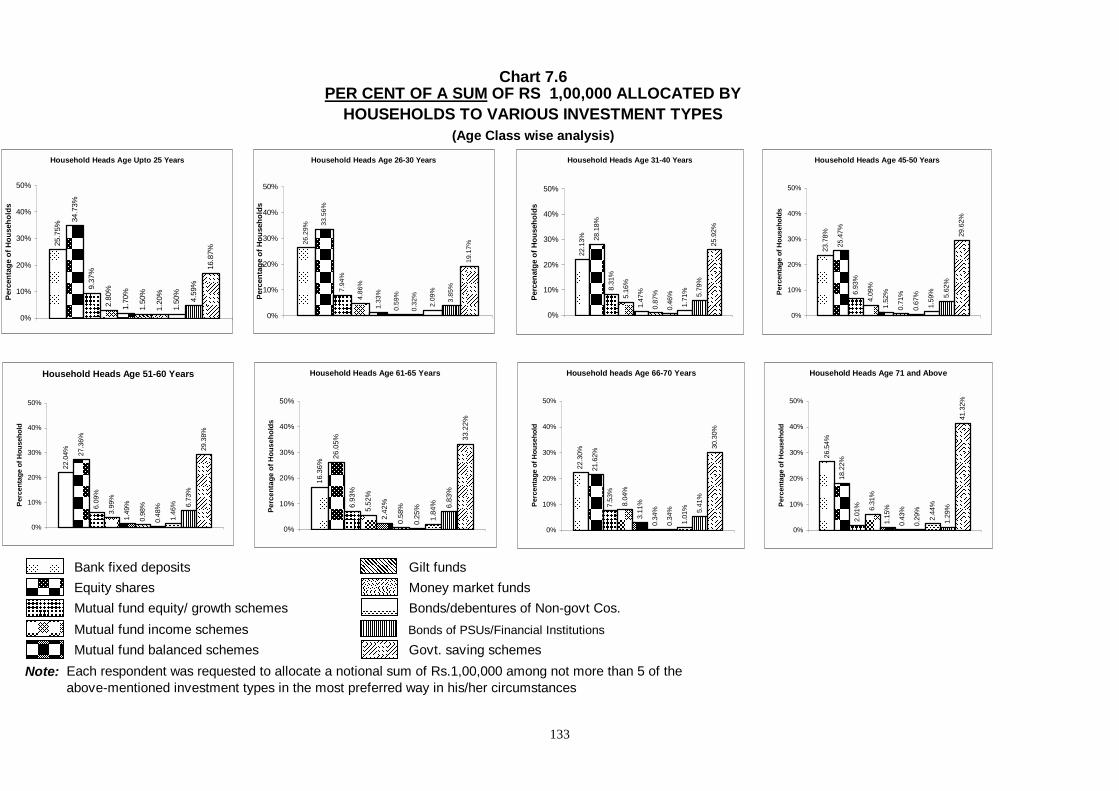
133
Bank fixed deposits Gilt funds Money market funds Bonds/debentures of Non-govt Cos. Bonds of PSUs/Financial Institutions
Note: Each respondent was requested to allocate a notional sum of Rs.1,00,000 among not more than 5 of the above-mentioned investment types in the most preferred way in his/her circumstances
Chart 7.6PER CENT OF A SUM OF RS 1,00,000 ALLOCATED BY
HOUSEHOLDS TO VARIOUS INVESTMENT TYPES(Age Class wise analysis)
Equity shares Mutual fund equity/ growth schemes Mutual fund income schemes Mutual fund balanced schemes Govt. saving schemes
Household Heads Age Upto 25 Years
25.7
5%
9.37
%
2.80
%
1.70
%
1.50
%
1.20
%
1.50
%
4.59
%
16.8
7%
34.7
3%
0%
10%
20%
30%
40%
50%
Perc
enta
ge o
f Hou
seho
lds
Household Heads Age 26-30 Years
26.2
9%
33.5
6%
7.94
%
4.86
%
1.33
%
0.59
%
0.32
%
2.09
%
3.85
%
19.1
7%
0%
10%
20%
30%
40%
50%
Perc
enta
ge o
f Hou
seho
lds
Household Heads Age 31-40 Years
22.1
3%
8.31
%
5.16
%
1.47
%
0.87
%
0.46
%
1.71
% 5.79
%
25.9
2%
28.1
8%
0%
10%
20%
30%
40%
50%
Perc
enat
ge o
f Hou
seho
lds
Household Heads Age 45-50 Years
23.7
8%
25.4
7%
6.93
%
4.09
%
1.52
%
0.71
%
0.67
%
1.59
% 5.62
%
29.6
2%
0%
10%
20%
30%
40%
50%
Perc
enta
ge o
f Hou
seho
lds
Household Heads Age 51-60 Years
22.0
4% 27.3
6%
6.09
%
3.99
%
1.49
%
0.98
%
0.48
%
1.46
% 6.73
%
29.3
8%
0%
10%
20%
30%
40%
50%
Perc
enta
ge o
f Hou
seho
ld
Household Heads Age 61-65 Years
16.3
6%
26.0
5%
6.93
%
5.52
%
2.42
%
0.58
%
0.25
%
1.84
% 6.83
%
33.2
2%
0%
10%
20%
30%
40%
50%
Perc
enta
ge o
f Hou
seho
lds
Household heads Age 66-70 Years
22.3
0%
21.6
2%
7.53
%
8.04
%
3.11
%
0.34
%
0.34
%
1.01
% 5.41
%
30.3
0%
0%
10%
20%
30%
40%
50%
Perc
enta
ge o
f Hou
seho
ld
Household Heads Age 71 and Above
26.5
4%
18.2
2%
2.01
% 6.31
%
1.15
%
0.43
%
0.29
%
2.44
%
1.29
%
41.3
2%
0%
10%
20%
30%
40%
50%
Perc
enta
ge o
f Hou
seho
ld
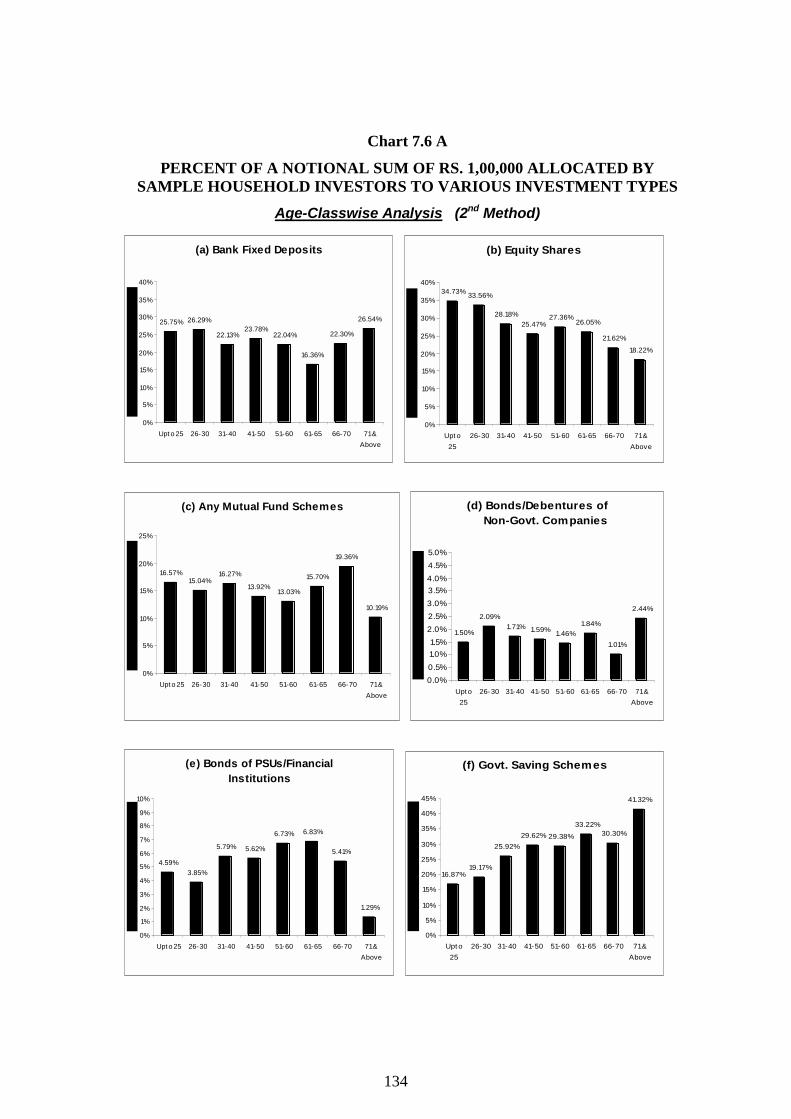
134
Chart 7.6 A
PERCENT OF A NOTIONAL SUM OF RS. 1,00,000 ALLOCATED BY SAMPLE HOUSEHOLD INVESTORS TO VARIOUS INVESTMENT TYPES
Age-Classwise Analysis (2nd Method)
(a) Bank Fixed Deposits
25.75% 26.29%
22.13%23.78%
22.04%
16.36%
22.30%
26.54%
0%
5%
10%
15%
20%
25%
30%
35%
40%
Upt o 25 26-30 31-40 41-50 51-60 61-65 66-70 71 &Above
(b) Equity Shares
34.73% 33.56%
28.18%25.47%
27.36%26.05%
21.62%
18.22%
0%
5%
10%
15%
20%
25%
30%
35%
40%
Upt o25
26-30 31-40 41-50 51-60 61-65 66-70 71 &Above
(c) Any Mutual Fund Schemes
16.57%15.04%
16.27%
13.92%13.03%
15.70%
19.36%
10.19%
0%
5%
10%
15%
20%
25%
Upt o 25 26-30 31-40 41-50 51-60 61-65 66-70 71 &Above
(d) Bonds/Debentures of Non-Govt. Companies
1.50%
2.09%1.71% 1.59% 1.46%
1.84%
1.01%
2.44%
0.0%0.5%1.0%1.5%
2.0%2.5%3.0%3.5%4.0%4.5%5.0%
Upto25
26-30 31-40 41-50 51-60 61-65 66-70 71 &Above
(e) Bonds of PSUs/Financial Institutions
4.59%3.85%
5.79% 5.62%
6.73% 6.83%
5.41%
1.29%
0%
1%
2%
3%
4%
5%
6%
7%
8%
9%
10%
Upt o 25 26-30 31-40 41-50 51-60 61-65 66-70 71 &Above
(f) Govt. Saving Schemes
16.87%19.17%
25.92%29.62% 29.38%
33.22%30.30%
41.32%
0%
5%
10%
15%
20%
25%
30%
35%
40%
45%
Upt o25
26-30 31-40 41-50 51-60 61-65 66-70 71 &Above

135
Future intention
7.20 The investment game has provided some useful clues about the retail
investors’ current preferences among a wide range of financial assets. We
separately explored future intentions by a carefully worded question on
likelihood of making ‘net addition’36 over the next one year to the
holding of (1) equity shares, (2) mutual fund equity shares (3) mutual
fund income schemes and (4) private sector company bonds. All these are
particularly relevant to capital market’s development. Likelihood was
distinguished into ‘very likely’, ‘somewhat likely’, ‘not much likely’, and
‘not at all likely’. For convenience of comparison, we may focus on the
combined percentage of ‘very likely’, and somewhat likely’. The
percentages for the four investment types indicated the highest
likelihood for equity shares (66.5%), followed, at considerable distance,
by mutual fund equity schemes (40.9%) and mutual fund income
schemes (34.6%), the least being in the case of private sector company
bonds (13.2%). This was largely true of all income classes and age-
classes. The detailed Tables are presented in Appendix to this chapter,
Tables A 7 (1) to A 7 (8).
Effect of fall in interest rates on attitude towards equity shares
7.21 An interesting aspect covered by our empirical study is the change in the
household investors’ attitude towards equity shares as a result of fall in
interest rates. The interest rates in India have declined substantially over
the last few years to touch very low levels. For bank fixed deposits of 1
year or more, the interest rate is now only around 5.0-5.5%. Interest rates
on government savings schemes have also been significantly reduced.
36 The wording of our question allows for the fact that most people cannot be very certain about their future
investment intentions but can, at best, given an idea of their general inclination knowledge of inclinations is a useful information. It was explained to the respondents that “net addition means that purchases exceed sales.”
136
This has led to a greater inclination among a majority of household
investors towards equity shares, i.e. to accept higher risk in the hope of higher
return. This is indicated by the replies to our question whether the fall in interest
rates has made share investment more attractive to them. The analysis of
replies is presented in Tables 7.7 (for income classes) and 7.8 (for age
classes) and also in the form of Charts 7.7 and 7.8. The respondents have
been classified by income and age groups in order to ascertain whether
there are significant differences among different groups regarding their
response to fall in interest rates.
7.22 Table 7.7 shows that slightly over one-half of the total sample
households answered ‘Yes’ and only around 30% answered ‘No’ to our
question whether the fall in interest rates had made equity shares more
attractive to them. If we exclude ‘can’t say’ answers (which account for
less than 20% of replies), the ratio of ‘Yes’ to ‘No’ is 64:36. That is, a
little below two-thirds of respondents reported that equity share
investment has become more attractive due to fall in interest rates on
fixed-income investments. This is, more or less, true for all income-
classes with slightly rising proportion of ‘Yes’ in the higher income
classes
7.23 It is noteworthy that age-wise analysis showed a different pattern: the
percentage respondents who find equity share investment more attractive
due to fall in interest rates is substantially less in the case of higher age
groups (over 40 years) than in the case of younger people (upto 30 years).
Effect of holding period on risk and return
7.24 Equity share investment is quite risky for short holding periods because of wide
cyclical swings. At the same time, the total rate of return (including both dividend
and capital appreciation) on equity portfolios held for a long-term of 10-15
years has been found to be generally higher than the return on the fixed-income
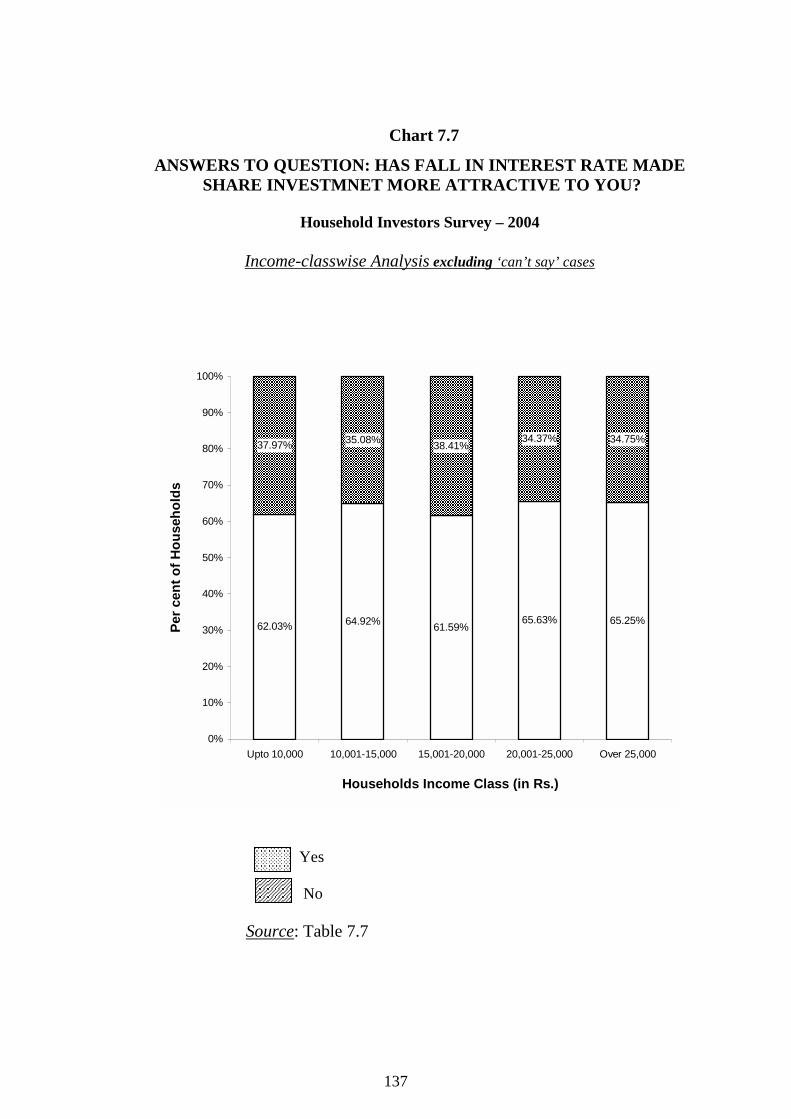
Chart 7.7
ANSWERS TO QUESTION: HAS FALL IN INTEREST RATE MADE SHARE INVESTMNET MORE ATTRACTIVE TO YOU?
Household Investors Survey – 2004
Income-classwise Analysis excluding ‘can’t say’ cases
62.03% 64.92% 61.59%65.63% 65.25%
37.97% 35.08% 38.41%34.37% 34.75%
0%
10%
20%
30%
40%
50%
60%
70%
80%
90%
100%
Upto 10,000 10,001-15,000 15,001-20,000 20,001-25,000 Over 25,000
Households Income Class (in Rs.)
Per c
ent o
f Hou
seho
lds
Yes
So
No
137
urce: Table 7.7
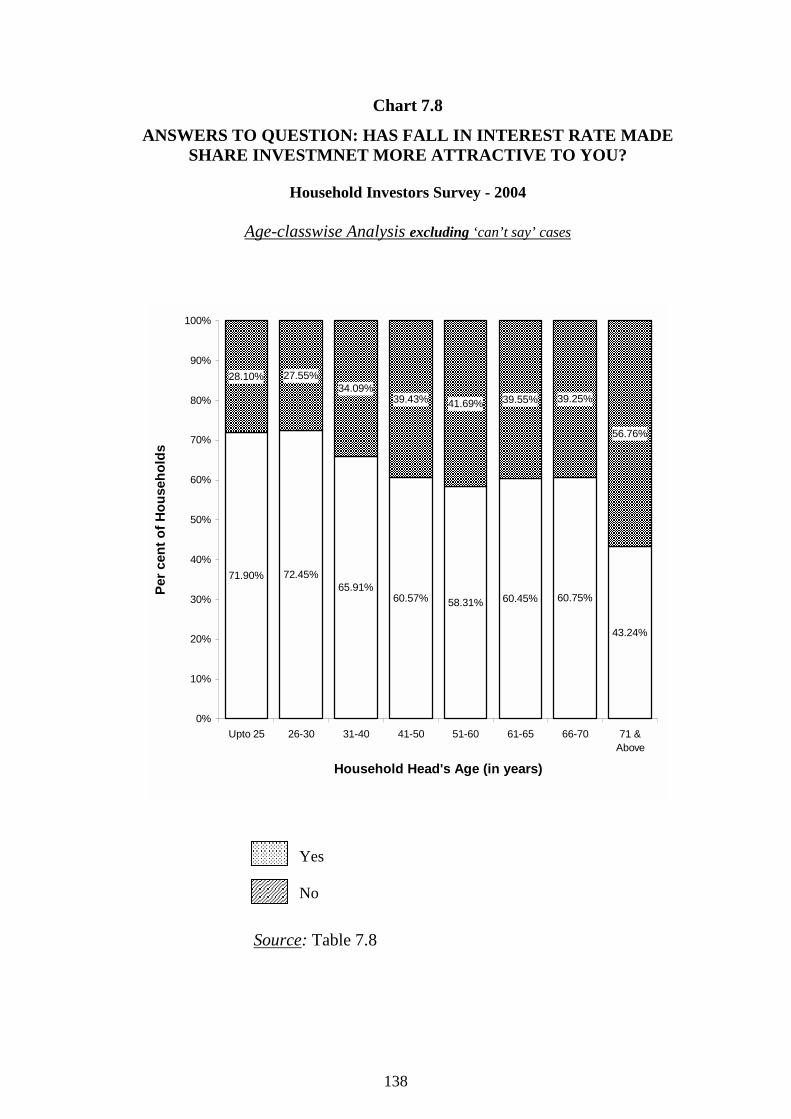
138
Chart 7.8
ANSWERS TO QUESTION: HAS FALL IN INTEREST RATE MADE SHARE INVESTMNET MORE ATTRACTIVE TO YOU?
Household Investors Survey - 2004
Age-classwise Analysis excluding ‘can’t say’ cases
71.90% 72.45%65.91%
60.57% 58.31% 60.45% 60.75%
43.24%
28.10% 27.55%34.09%
39.43% 41.69% 39.55% 39.25%
56.76%
0%
10%
20%
30%
40%
50%
60%
70%
80%
90%
100%
Upto 25 26-30 31-40 41-50 51-60 61-65 66-70 71 &Above
Household Head's Age (in years)
Per c
ent o
f Hou
seho
lds
Yes
No
Source: Table 7.8
139
types of investments. The excess return represents the ‘risk premium’. However, over short holding periods, the return on equity shareholding may often be even negative. The shorter the holding period, the more variable is the return from equity investment.37 For holding periods of less than 5 years, the risk of negative returns is considerably high. This explains why the older people are not attracted towards putting fresh money into equity share investment, except holding on to earlier investments.
7.25 Younger people have time on their side. They can afford to take higher risk because they can tide over even a long period of depression by holding on to the share investment and also because, in case of actual loss, they have time to recoup the loss in future.
III. The Maturing of India’s Retail
Investor Population
Shareowners’ age qua shareowners 7.26 What we mean is the number of years since a person became a
shareowner for the first time in life. Maturity in terms of years and also in terms of having been through many market vicissitudes has led to mature behaviour, as we shall show. Of the sample shareowning households in 2004, about 62% had held shares for 10 years or more (see Tables 7.9 and 7.10, as also Charts 7.9 and 7.10). This is in contrast with the 1990-survey38 when only 35% households at that point of time were found holding shares for over 10 years. There is wide difference also in per cent of respondents who had shares for less than 5 years. This percentage was much lower at 23% in the 2004-survey compared to much higher figure of 35% in the 1990-survey. Looking at the two extremes (over 10-years and under 5-years of shareholding experience), the present shareowning population is far more mature than was the case in 1990. At the time of survey in 2004, a majority of responding households had the experience of being shareholders of one or
37 See L. C. Gupta, Rates of Return on Equities: The Indian Experience (Oxford University Press, Delhi,
1981), pp. 44-8. See also L.C. Gupta and Utpal K. Choudhury, Rates of Return on Indian Equity Shares (Society for Capital Market Research & Development, Delhi, 2000), pp. 103-4.
38 For 1990 survey, See L. C. Gupta, Indian Shareowners: A Survey (Society for Capital Market Research & Development, Delhi, 1991), p. 32.
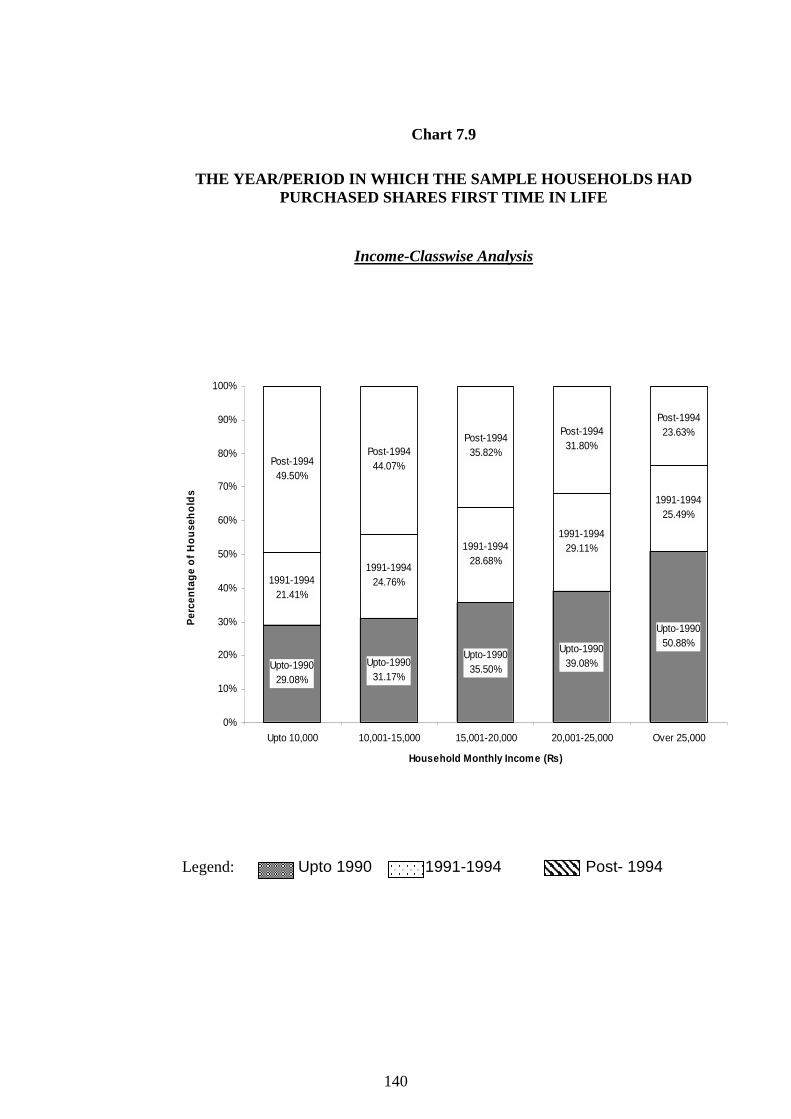
140
Chart 7.9
THE YEAR/PERIOD IN WHICH THE SAMPLE HOUSEHOLDS HAD PURCHASED SHARES FIRST TIME IN LIFE
Income-Classwise Analysis
Upto-199029.08%
Upto-199031.17%
Upto-199035.50%
Upto-199039.08%
Upto-199050.88%
1991-199421.41%
1991-199424.76%
1991-199428.68%
1991-199429.11%
1991-199425.49%
Post-199449.50%
Post-199444.07%
Post-199435.82%
Post-199431.80%
Post-199423.63%
0%
10%
20%
30%
40%
50%
60%
70%
80%
90%
100%
Upto 10,000 10,001-15,000 15,001-20,000 20,001-25,000 Over 25,000
Household Monthly Income (Rs)
Perc
enta
ge o
f Hou
seho
lds
Legend: Upto 1990 1991-1994 Post- 1994

141
Chart 7.10
THE YEAR/PERIOD IN WHICH THE SAMPLE HOUSEHOLDS HAD PURCHASED SHARES FIRST TIME IN LIFE
Age-Classwise Analysis
Upto-199011.27%
Upto-199024.07%
Upto-199047.65%
Upto-199051.53%
Upto-199056.45%
Upto-199060.32%
Upto-199070.79%
1991-199415.03%
1991-199432.31%
1991-199428.11%
1991-199424.91%
1991-199419.35%
1991-199420.63%
1991-199421.35%
Upto-199010.54%
1991-19949.86%
Post-19947.87%
Post-199473.71%Post-1994
79.58%
Post-199443.67%
Post-199424.24%
Post-199423.56%
Post-199424.21%
Post-199419.04%
0%
10%
20%
30%
40%
50%
60%
70%
80%
90%
100%
Upto 25 26-30 31-40 41-50 51-60 61-65 66-70 71 & AboveAge of Household Head in Years
Legend: Upto 1990 1991-1994 Post- 1994
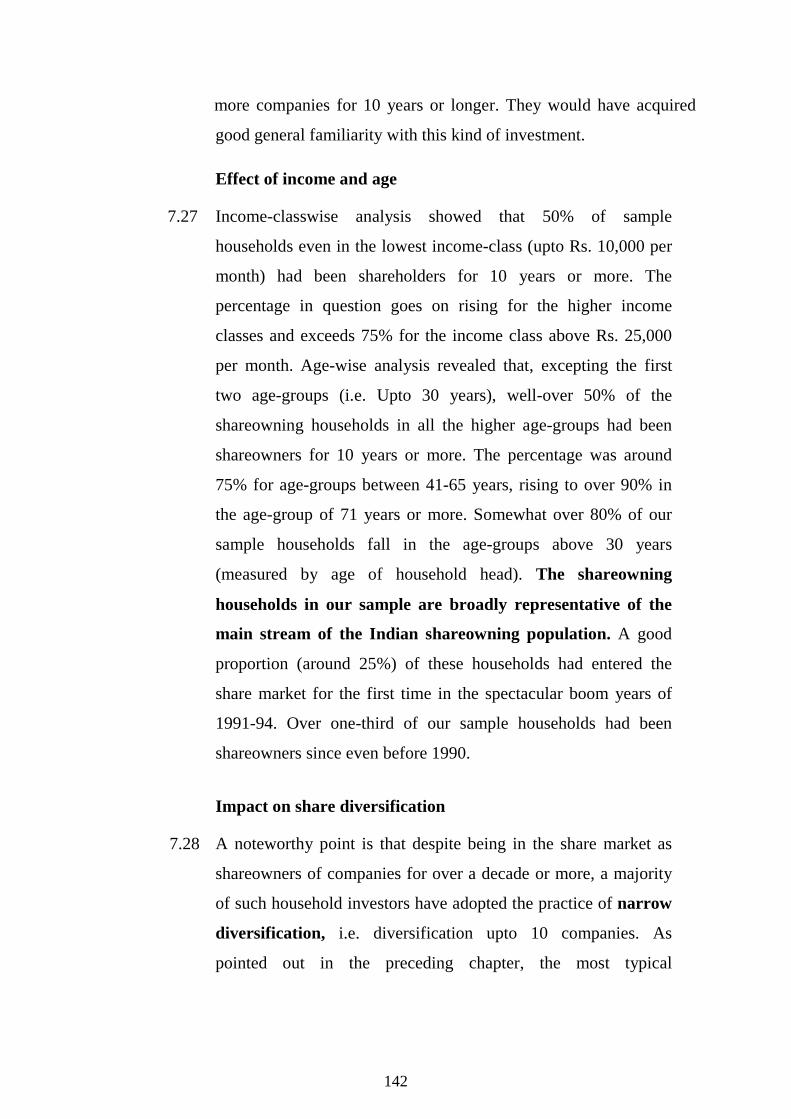
142
more companies for 10 years or longer. They would have acquired
good general familiarity with this kind of investment.
Effect of income and age
7.27 Income-classwise analysis showed that 50% of sample
households even in the lowest income-class (upto Rs. 10,000 per
month) had been shareholders for 10 years or more. The
percentage in question goes on rising for the higher income
classes and exceeds 75% for the income class above Rs. 25,000
per month. Age-wise analysis revealed that, excepting the first
two age-groups (i.e. Upto 30 years), well-over 50% of the
shareowning households in all the higher age-groups had been
shareowners for 10 years or more. The percentage was around
75% for age-groups between 41-65 years, rising to over 90% in
the age-group of 71 years or more. Somewhat over 80% of our
sample households fall in the age-groups above 30 years
(measured by age of household head). The shareowning
households in our sample are broadly representative of the
main stream of the Indian shareowning population. A good
proportion (around 25%) of these households had entered the
share market for the first time in the spectacular boom years of
1991-94. Over one-third of our sample households had been
shareowners since even before 1990.
Impact on share diversification
7.28 A noteworthy point is that despite being in the share market as
shareowners of companies for over a decade or more, a majority
of such household investors have adopted the practice of narrow
diversification, i.e. diversification upto 10 companies. As
pointed out in the preceding chapter, the most typical
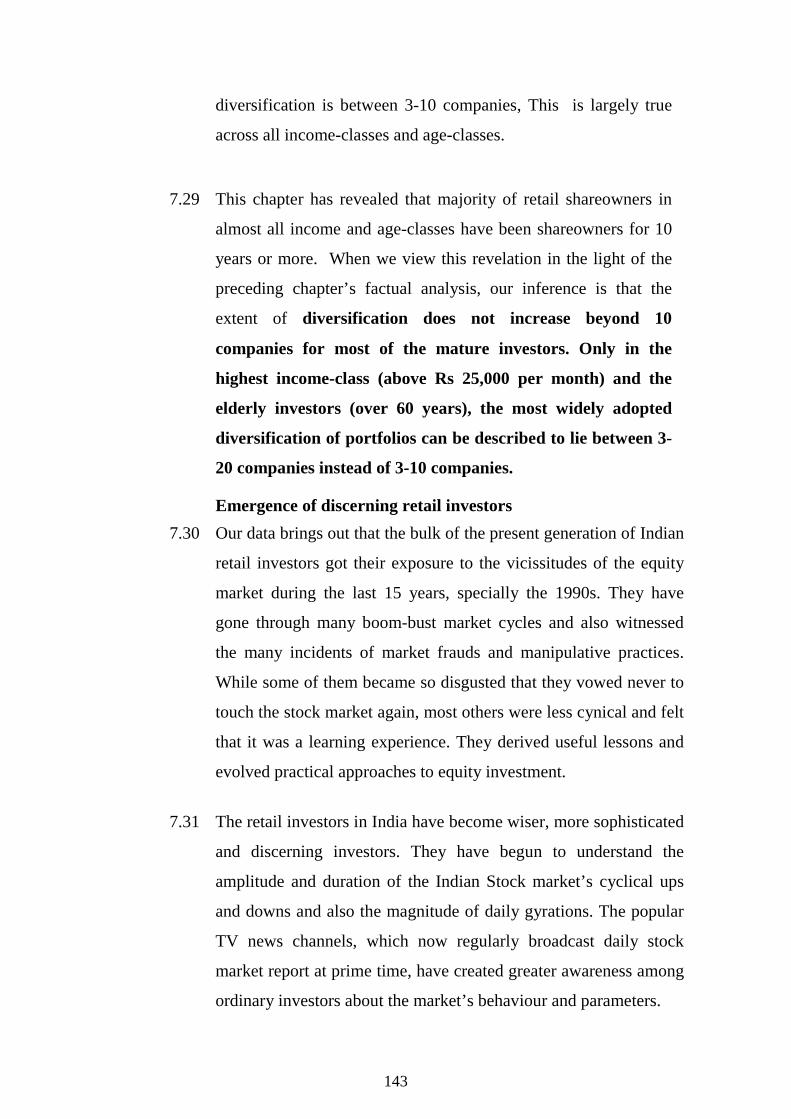
143
diversification is between 3-10 companies, This is largely true
across all income-classes and age-classes.
7.29 This chapter has revealed that majority of retail shareowners in
almost all income and age-classes have been shareowners for 10
years or more. When we view this revelation in the light of the
preceding chapter’s factual analysis, our inference is that the
extent of diversification does not increase beyond 10
companies for most of the mature investors. Only in the
highest income-class (above Rs 25,000 per month) and the
elderly investors (over 60 years), the most widely adopted
diversification of portfolios can be described to lie between 3-
20 companies instead of 3-10 companies.
Emergence of discerning retail investors 7.30 Our data brings out that the bulk of the present generation of Indian
retail investors got their exposure to the vicissitudes of the equity
market during the last 15 years, specially the 1990s. They have
gone through many boom-bust market cycles and also witnessed
the many incidents of market frauds and manipulative practices.
While some of them became so disgusted that they vowed never to
touch the stock market again, most others were less cynical and felt
that it was a learning experience. They derived useful lessons and
evolved practical approaches to equity investment.
7.31 The retail investors in India have become wiser, more sophisticated
and discerning investors. They have begun to understand the
amplitude and duration of the Indian Stock market’s cyclical ups
and downs and also the magnitude of daily gyrations. The popular
TV news channels, which now regularly broadcast daily stock
market report at prime time, have created greater awareness among
ordinary investors about the market’s behaviour and parameters.
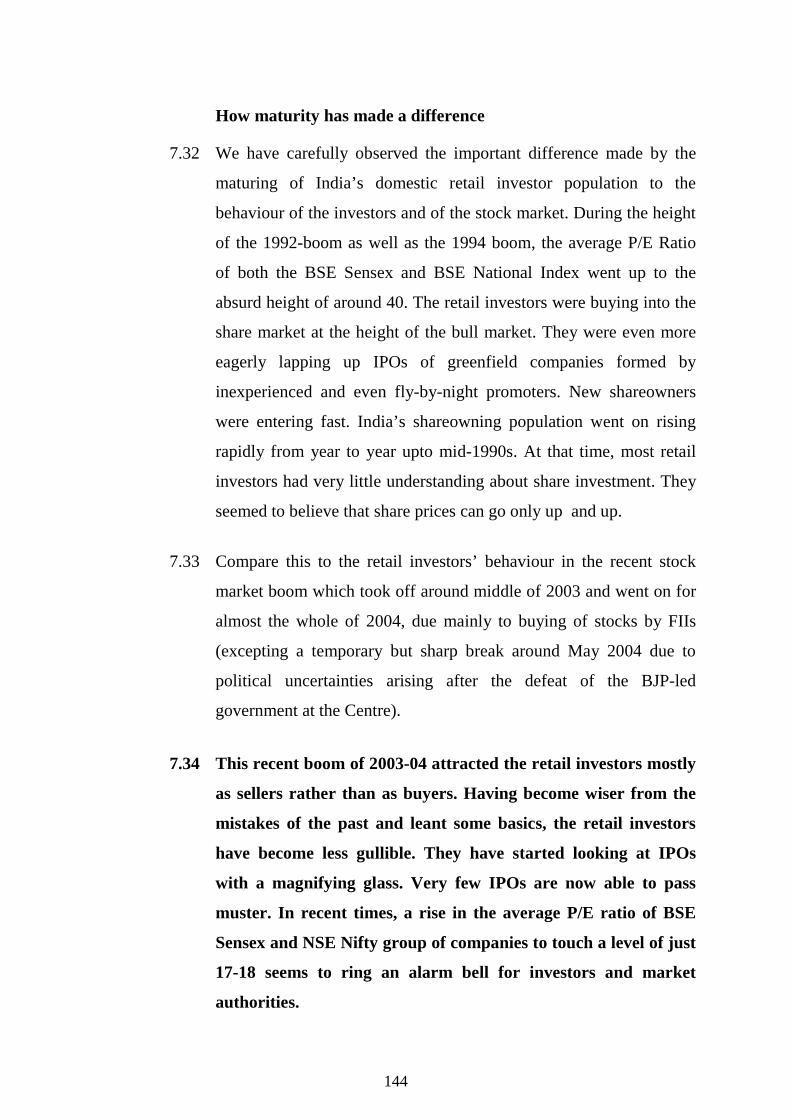
144
How maturity has made a difference
7.32 We have carefully observed the important difference made by the
maturing of India’s domestic retail investor population to the
behaviour of the investors and of the stock market. During the height
of the 1992-boom as well as the 1994 boom, the average P/E Ratio
of both the BSE Sensex and BSE National Index went up to the
absurd height of around 40. The retail investors were buying into the
share market at the height of the bull market. They were even more
eagerly lapping up IPOs of greenfield companies formed by
inexperienced and even fly-by-night promoters. New shareowners
were entering fast. India’s shareowning population went on rising
rapidly from year to year upto mid-1990s. At that time, most retail
investors had very little understanding about share investment. They
seemed to believe that share prices can go only up and up.
7.33 Compare this to the retail investors’ behaviour in the recent stock
market boom which took off around middle of 2003 and went on for
almost the whole of 2004, due mainly to buying of stocks by FIIs
(excepting a temporary but sharp break around May 2004 due to
political uncertainties arising after the defeat of the BJP-led
government at the Centre).
7.34 This recent boom of 2003-04 attracted the retail investors mostly
as sellers rather than as buyers. Having become wiser from the
mistakes of the past and leant some basics, the retail investors
have become less gullible. They have started looking at IPOs
with a magnifying glass. Very few IPOs are now able to pass
muster. In recent times, a rise in the average P/E ratio of BSE
Sensex and NSE Nifty group of companies to touch a level of just
17-18 seems to ring an alarm bell for investors and market
authorities.

145
Table 7.1
PERCENTAGE OF HOUSEHOLDS OWNING VARIOUS CAPITAL MARKET INSTRUMENTS
Household Investors Survey - 2004
Income-classwise Analysis
Household income class (Rs. per month) Capital Market instruments
All classes of sample households
Upto 10,000
10,001– 15,000
15,001– 20,000
20,001- 25,000
Over 25,000
Percent of households column-wise
(a) Equity shares
81.74 74.48 82.17 83.84 84.22 87.72 (b) Infrastructure tax-saving bonds
33.21
13.42
27.07
39.80
47.19
52.83
(c) Bonds/Debentures of non-govt. companies
10.95
8.00
9.17
9.66
12.21
17.67
(d) Bonds/Debentures of govt. undertakings
17.16
12.85
15.53
17.24
21.54
22.26
(e) Any mutual fund schemes
30.79
22.31
26.92
31.14
35.39
43.99
No. of households
5,908
1,587
1,352
1,108
729
1,132
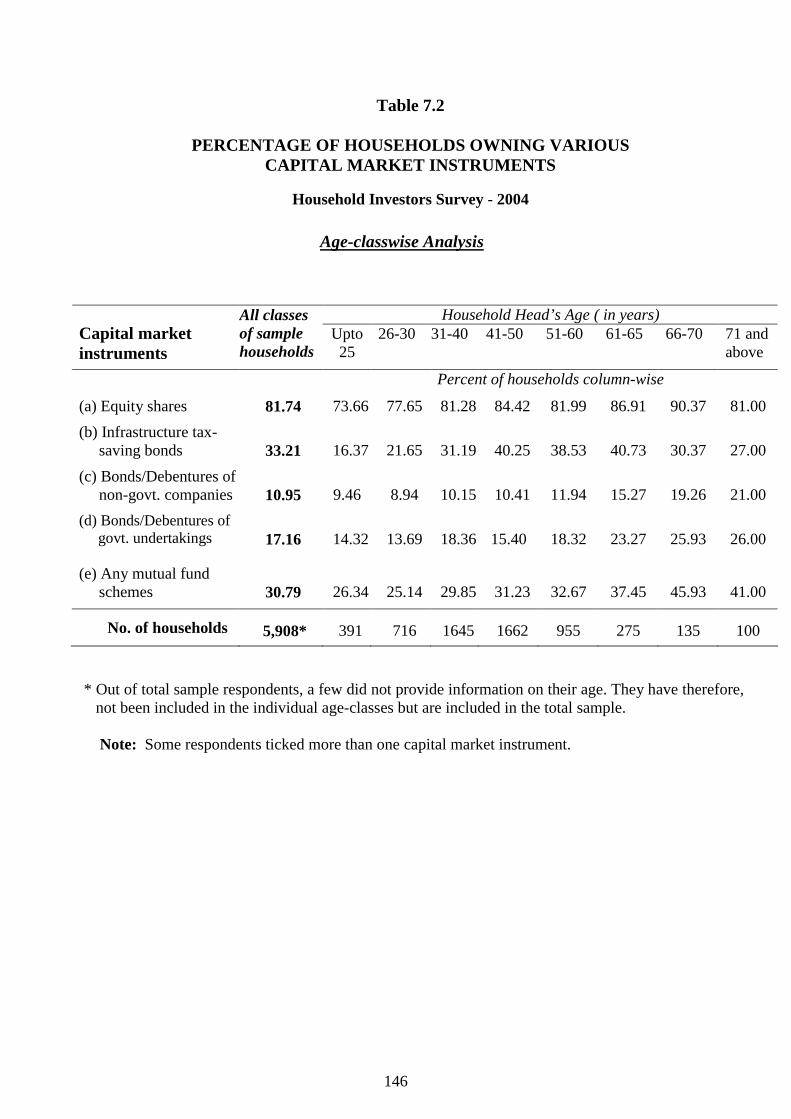
146
Table 7.2
PERCENTAGE OF HOUSEHOLDS OWNING VARIOUS CAPITAL MARKET INSTRUMENTS
Household Investors Survey - 2004
Age-classwise Analysis
Household Head’s Age ( in years)
Capital market instruments
All classes of sample households
Upto 25
26-30 31-40 41-50 51-60 61-65 66-70 71 and above
Percent of households column-wise
(a) Equity shares
81.74 73.66 77.65 81.28 84.42 81.99 86.91 90.37 81.00 (b) Infrastructure tax- saving bonds
33.21
16.37
21.65
31.19
40.25
38.53
40.73
30.37
27.00
(c) Bonds/Debentures of non-govt. companies
10.95
9.46
8.94
10.15
10.41
11.94
15.27
19.26
21.00
(d) Bonds/Debentures of govt. undertakings
17.16
14.32
13.69
18.36
15.40
18.32
23.27
25.93
26.00
(e) Any mutual fund schemes
30.79
26.34
25.14
29.85
31.23
32.67
37.45
45.93
41.00
No. of households
5,908*
391
716
1645
1662
955
275
135
100
* Out of total sample respondents, a few did not provide information on their age. They have therefore,
not been included in the individual age-classes but are included in the total sample.
Note: Some respondents ticked more than one capital market instrument.
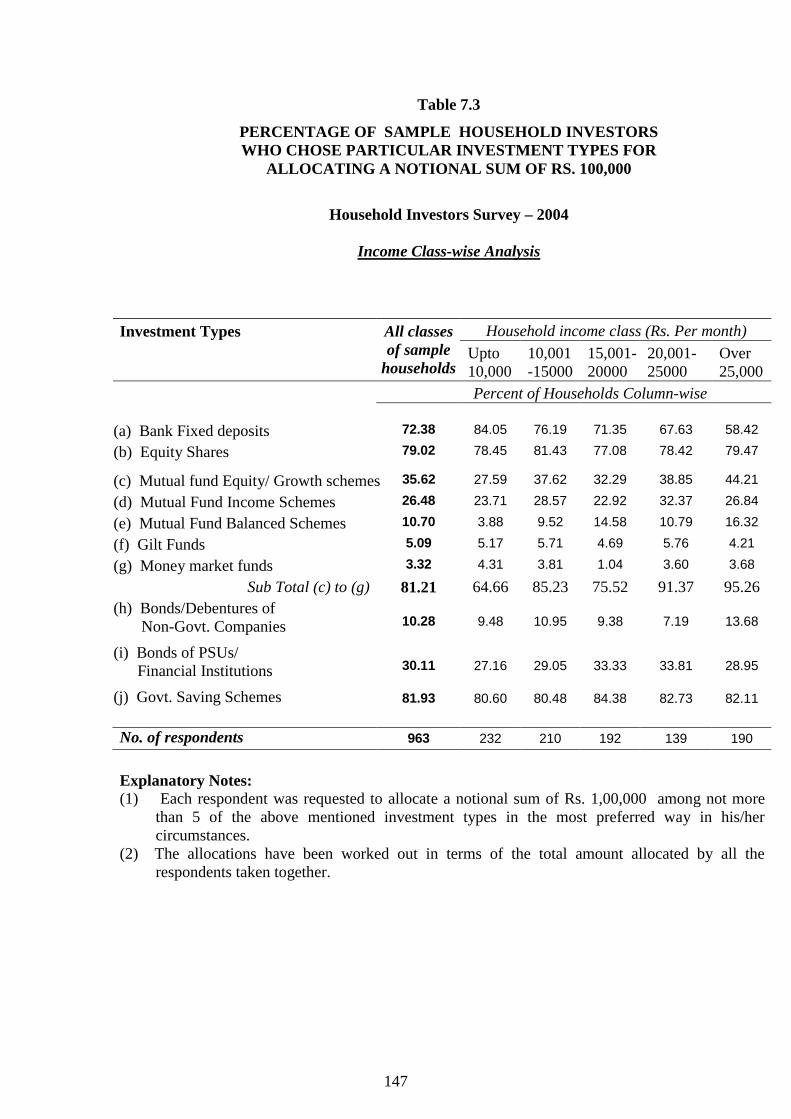
147
Table 7.3
PERCENTAGE OF SAMPLE HOUSEHOLD INVESTORS WHO CHOSE PARTICULAR INVESTMENT TYPES FOR
ALLOCATING A NOTIONAL SUM OF RS. 100,000
Household Investors Survey – 2004
Income Class-wise Analysis
Household income class (Rs. Per month) Investment Types
All classes of sample
householdsUpto 10,000
10,001-15000
15,001-20000
20,001-25000
Over 25,000
Percent of Households Column-wise
(a) Bank Fixed deposits 72.38 84.05 76.19 71.35 67.63 58.42
(b) Equity Shares 79.02 78.45 81.43 77.08 78.42 79.47
(c) Mutual fund Equity/ Growth schemes 35.62 27.59 37.62 32.29 38.85 44.21
(d) Mutual Fund Income Schemes 26.48 23.71 28.57 22.92 32.37 26.84
(e) Mutual Fund Balanced Schemes 10.70 3.88 9.52 14.58 10.79 16.32
(f) Gilt Funds 5.09 5.17 5.71 4.69 5.76 4.21
(g) Money market funds 3.32 4.31 3.81 1.04 3.60 3.68
Sub Total (c) to (g) 81.21 64.66 85.23 75.52 91.37 95.26 (h) Bonds/Debentures of Non-Govt. Companies
10.28 9.48 10.95 9.38 7.19 13.68
(i) Bonds of PSUs/ Financial Institutions
30.11 27.16 29.05 33.33 33.81 28.95
(j) Govt. Saving Schemes 81.93 80.60 80.48 84.38 82.73 82.11 No. of respondents 963 232 210 192 139 190
Explanatory Notes: (1) Each respondent was requested to allocate a notional sum of Rs. 1,00,000 among not more
than 5 of the above mentioned investment types in the most preferred way in his/her circumstances.
(2) The allocations have been worked out in terms of the total amount allocated by all the respondents taken together.
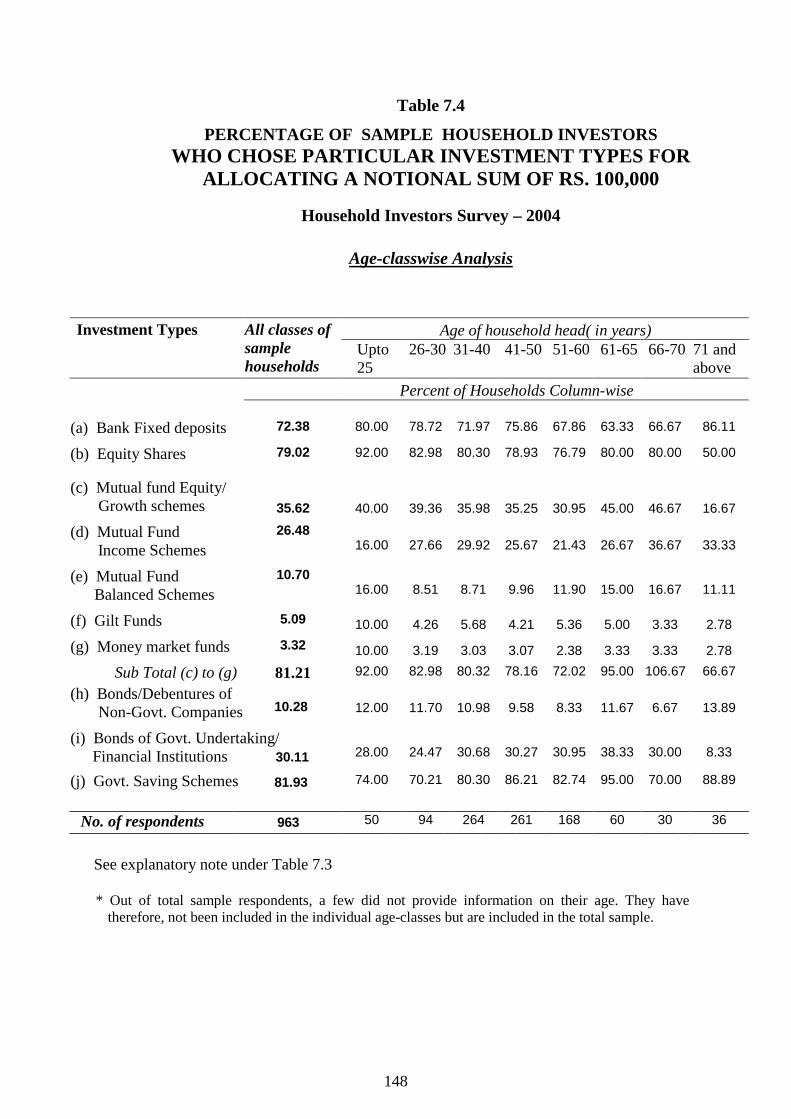
148
Table 7.4
PERCENTAGE OF SAMPLE HOUSEHOLD INVESTORS WHO CHOSE PARTICULAR INVESTMENT TYPES FOR
ALLOCATING A NOTIONAL SUM OF RS. 100,000
Household Investors Survey – 2004
Age-classwise Analysis
* Out of total sample respondents, a few did not provide information on their age. They have therefore, not been included in the individual age-classes but are included in the total sample.
Age of household head( in years) Investment Types
All classes of sample households
Upto 25
26-30 31-40 41-50 51-60 61-65 66-70 71 and above
Percent of Households Column-wise
(a) Bank Fixed deposits
72.38 80.00 78.72 71.97 75.86 67.86 63.33 66.67 86.11
(b) Equity Shares
79.02 92.00 82.98 80.30 78.93 76.79 80.00 80.00 50.00
(c) Mutual fund Equity/ Growth schemes
35.62
40.00
39.36
35.98
35.25
30.95
45.00
46.67
16.67
(d) Mutual Fund Income Schemes
26.48 16.00 27.66 29.92 25.67 21.43 26.67 36.67 33.33
(e) Mutual Fund Balanced Schemes
10.70 16.00 8.51 8.71 9.96 11.90 15.00 16.67 11.11
(f) Gilt Funds
5.09 10.00 4.26 5.68 4.21 5.36 5.00 3.33 2.78
(g) Money market funds
3.32 10.00 3.19 3.03 3.07 2.38 3.33 3.33 2.78
Sub Total (c) to (g) 81.21 92.00 82.98 80.32 78.16 72.02 95.00 106.67 66.67
(h) Bonds/Debentures of Non-Govt. Companies
10.28
12.00
11.70
10.98
9.58
8.33
11.67
6.67
13.89
(i) Bonds of Govt. Undertaking/ Financial Institutions 30.11
28.00
24.47
30.68
30.27
30.95
38.33
30.00
8.33
(j) Govt. Saving Schemes 81.93 74.00 70.21 80.30 86.21 82.74 95.00 70.00 88.89
No. of respondents 963 50 94 264 261 168 60 30 36
See explanatory note under Table 7.3
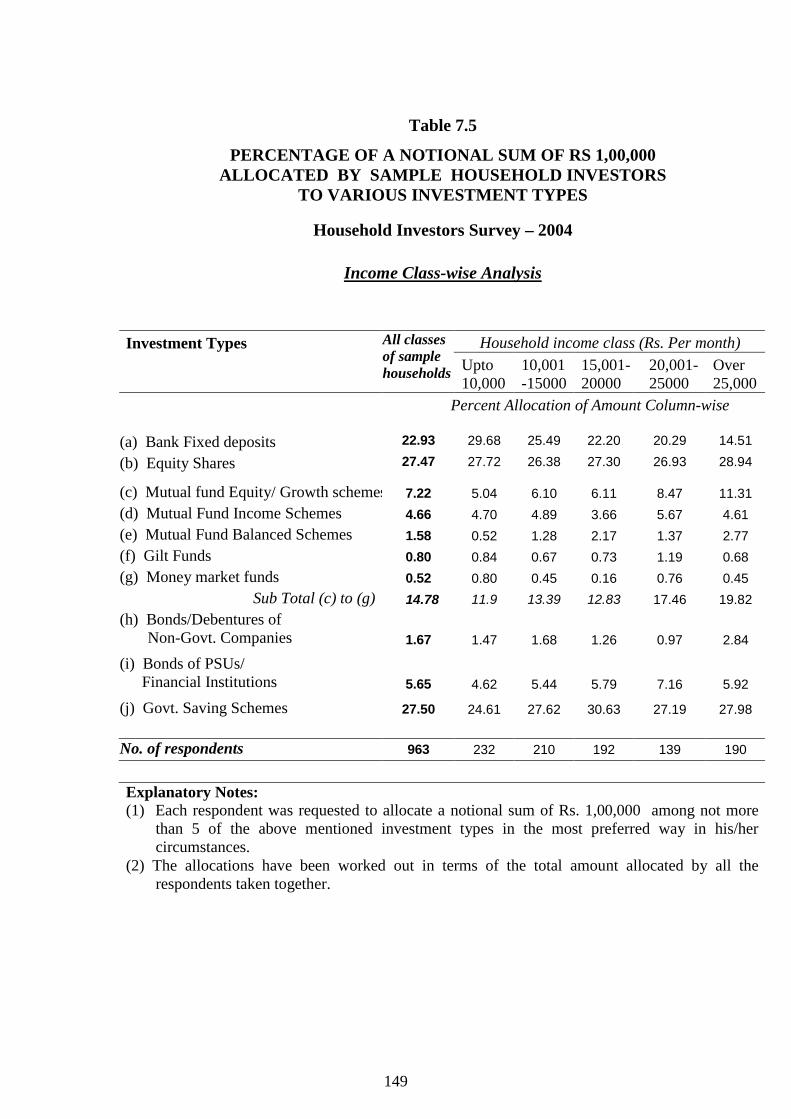
149
Table 7.5
PERCENTAGE OF A NOTIONAL SUM OF RS 1,00,000 ALLOCATED BY SAMPLE HOUSEHOLD INVESTORS
TO VARIOUS INVESTMENT TYPES
Household Investors Survey – 2004
Income Class-wise Analysis
Household income class (Rs. Per month) Investment Types
All classes of sample households Upto
10,000 10,001-15000
15,001-20000
20,001- 25000
Over 25,000
Percent Allocation of Amount Column-wise
(a) Bank Fixed deposits 22.93 29.68 25.49 22.20 20.29 14.51
(b) Equity Shares 27.47 27.72 26.38 27.30 26.93 28.94
(c) Mutual fund Equity/ Growth schemes 7.22 5.04 6.10 6.11 8.47 11.31 (d) Mutual Fund Income Schemes 4.66 4.70 4.89 3.66 5.67 4.61 (e) Mutual Fund Balanced Schemes 1.58 0.52 1.28 2.17 1.37 2.77 (f) Gilt Funds 0.80 0.84 0.67 0.73 1.19 0.68 (g) Money market funds 0.52 0.80 0.45 0.16 0.76 0.45
Sub Total (c) to (g) 14.78 11.9 13.39 12.83 17.46 19.82 (h) Bonds/Debentures of Non-Govt. Companies
1.67
1.47
1.68
1.26
0.97
2.84
(i) Bonds of PSUs/ Financial Institutions
5.65
4.62
5.44
5.79
7.16
5.92
(j) Govt. Saving Schemes 27.50 24.61 27.62 30.63 27.19 27.98 No. of respondents 963 232 210 192 139 190
Explanatory Notes: (1) Each respondent was requested to allocate a notional sum of Rs. 1,00,000 among not more
than 5 of the above mentioned investment types in the most preferred way in his/her circumstances.
(2) The allocations have been worked out in terms of the total amount allocated by all the respondents taken together.

150
Table 7.6
PERCENTAGE OF A NOTIONAL SUM OF RS 1,00,000 ALLOCATED BY SAMPLE HOUSEHOLD INVESTORS
TO VARIOUS INVESTMENT TYPES
Household Investors Survey – 2004
Age-classwise Analysis
Age of household head( in years) Investment types
All classes of sample households
Upto 25
26-30 31-40 41-50 51-60 61-65 66-70 71 and above
Percent Allocation of Amount Column-wise (a) Bank Fixed deposits
22.93 25.75 26.29 22.13 23.78 22.04 16.36 22.30 26.54
(b) Equity Shares
27.47 34.73 33.56 28.18 25.47 27.36 26.05 21.62 18.22
(c) Mutual fund Equity/ Growth schemes
7.22 9.37 7.94 8.31 6.93 6.09 6.93 7.53 2.01
(d) Mutual Fund Income Schemes
4.66 2.80 4.86 5.16 4.09 3.99 5.52 8.04 6.31
(e) Mutual Fund Balanced Schemes
1.58 1.70 1.33 1.47 1.52 1.49 2.42 3.11 1.15
(f) Gilt Funds
0.80 1.50 0.59 0.87 0.71 0.98 0.58 0.34 0.43
(g) Money market funds
0.52 1.20 0.32 0.46 0.67 0.48 0.25 0.34 0.29
Sub Total (c) to (g) 14.78 16.57 15.04 16.27 13.92 13.03 15.7 19.36 10.19 (h) Bonds/Debentures of Non-Govt. Companies
1.67 1.50 2.09 1.71 1.59 1.46 1.84 1.01 2.44
(i) Bonds of PSUs / Financial Institutions
5.65 4.59 3.85 5.79 5.62 6.73 6.83 5.41 1.29
(j) Govt. Saving Schemes 27.50 16.87 19.17 25.92 29.62 29.38 33.22 30.30 41.32 Column Total 100.00 100.00 100.00 100.00 100.00 100.00 100.00 100.00 100.00No. of respondents 963 50 94 264 261 168 60 30 36
See explanatory note under Table 7.5
* Out of total sample respondents, a few did not provide information on their age. They have therefore, not been included in the individual age-classes but are included in the total sample.
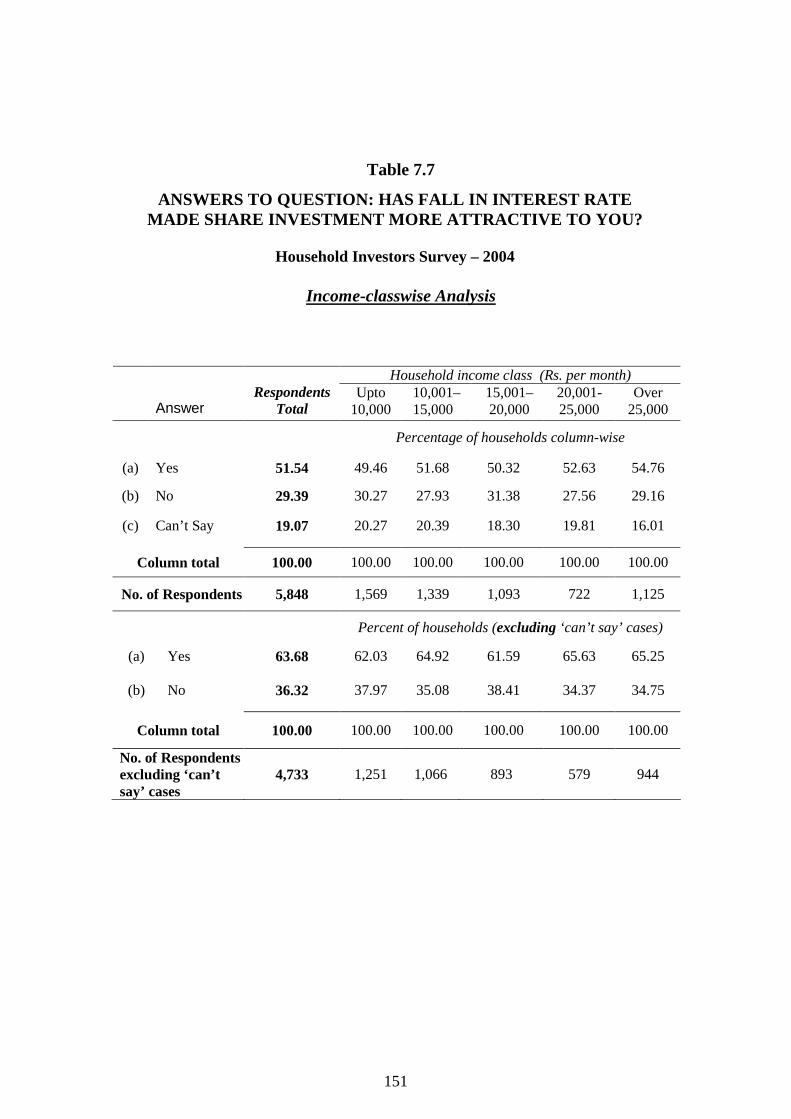
151
Table 7.7
ANSWERS TO QUESTION: HAS FALL IN INTEREST RATE MADE SHARE INVESTMENT MORE ATTRACTIVE TO YOU?
Household Investors Survey – 2004
Income-classwise Analysis
Household income class (Rs. per month)
Answer
Respondents
Total Upto
10,000 10,001– 15,000
15,001– 20,000
20,001- 25,000
Over 25,000
Percentage of households column-wise
(a) Yes 51.54 49.46 51.68 50.32 52.63 54.76
(b) No 29.39 30.27 27.93 31.38 27.56 29.16
(c) Can’t Say 19.07 20.27 20.39 18.30 19.81 16.01
Column total 100.00 100.00 100.00 100.00 100.00 100.00
No. of Respondents 5,848 1,569 1,339 1,093 722 1,125
Percent of households (excluding ‘can’t say’ cases)
(a) Yes 63.68 62.03 64.92 61.59 65.63 65.25
(b) No 36.32 37.97 35.08 38.41 34.37 34.75
Column total 100.00 100.00 100.00 100.00 100.00 100.00
No. of Respondentsexcluding ‘can’t say’ cases
4,733
1,251
1,066
893
579
944

152
Table 7.8
ANSWERS TO QUESTION: HAS FALL IN INTEREST RATE MADE SHARE INVESTMENT MORE ATTRACTIVE TO YOU?
Household Investors Survey - 2004
Age-classwise Analysis
Age of household head in years
Answer Respondents
Total Upto 25
26-30 31-40 41-50 51-60 61-65 66-70 71 and above
Percentage of households column-wise
(a) Yes 51.62 57.14 60.34 54.77 48.20 46.77 48.54 48.15 32.32
(b) No 29.44 22.34 22.95 28.34 31.38 33.44 31.75 31.11 42.42
(c) Can’t Say 18.94 20.52 16.71 16.89 20.41 19.79 19.71 20.74 25.25
Column total 100.00 100.00 100.00 100.00 100.00 100.00 100.00 100.00 100.00
No. of Respondents 5,848* 385 706 1,634 1,641 945 274 135 99
Percent of households (excluding ‘can’t say’ cases)
(a) Yes 63.68 71.90 72.45 65.91 60.57 58.31 60.45 60.75 43.24
(b) No 36.32 28.10 27.55 34.09 39.43 41.69 39.55 39.25 56.76
Column total 100.00 100.00 100.00 100.00 100.00 100.00 100.00 100.00 100.00
No. of Respondentsexcluding ‘can’t say’ cases
4,717*
306
588
1,358
1,306
758
220
107
74
* Out of total sample respondents, a few did not provide information on their age. They
have therefore, not been included in the individual age-classes but are included in the total sample.
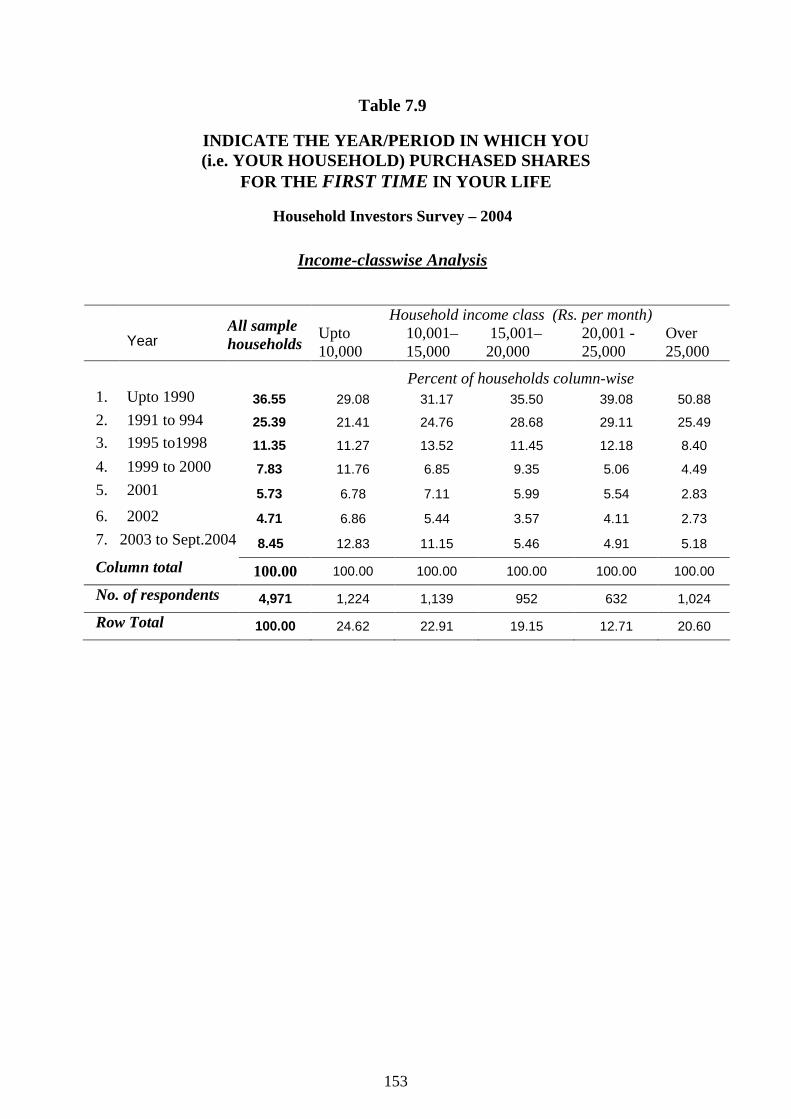
153
Table 7.9
INDICATE THE YEAR/PERIOD IN WHICH YOU (i.e. YOUR HOUSEHOLD) PURCHASED SHARES
FOR THE FIRST TIME IN YOUR LIFE
Household Investors Survey – 2004
Income-classwise Analysis
Household income class (Rs. per month)
Year
All sample households
Upto 10,000
10,001– 15,000
15,001– 20,000
20,001 - 25,000
Over 25,000
Percent of households column-wise 1. Upto 1990 36.55 29.08 31.17 35.50 39.08 50.88 2. 1991 to 994 25.39 21.41 24.76 28.68 29.11 25.49 3. 1995 to1998 11.35 11.27 13.52 11.45 12.18 8.40 4. 1999 to 2000 7.83 11.76 6.85 9.35 5.06 4.49 5. 2001 5.73 6.78 7.11 5.99 5.54 2.83
6. 2002 4.71 6.86 5.44 3.57 4.11 2.73 7. 2003 to Sept.2004 8.45 12.83 11.15 5.46 4.91 5.18
Column total 100.00 100.00 100.00 100.00 100.00 100.00
No. of respondents 4,971 1,224 1,139 952 632 1,024
Row Total 100.00 24.62 22.91 19.15 12.71 20.60
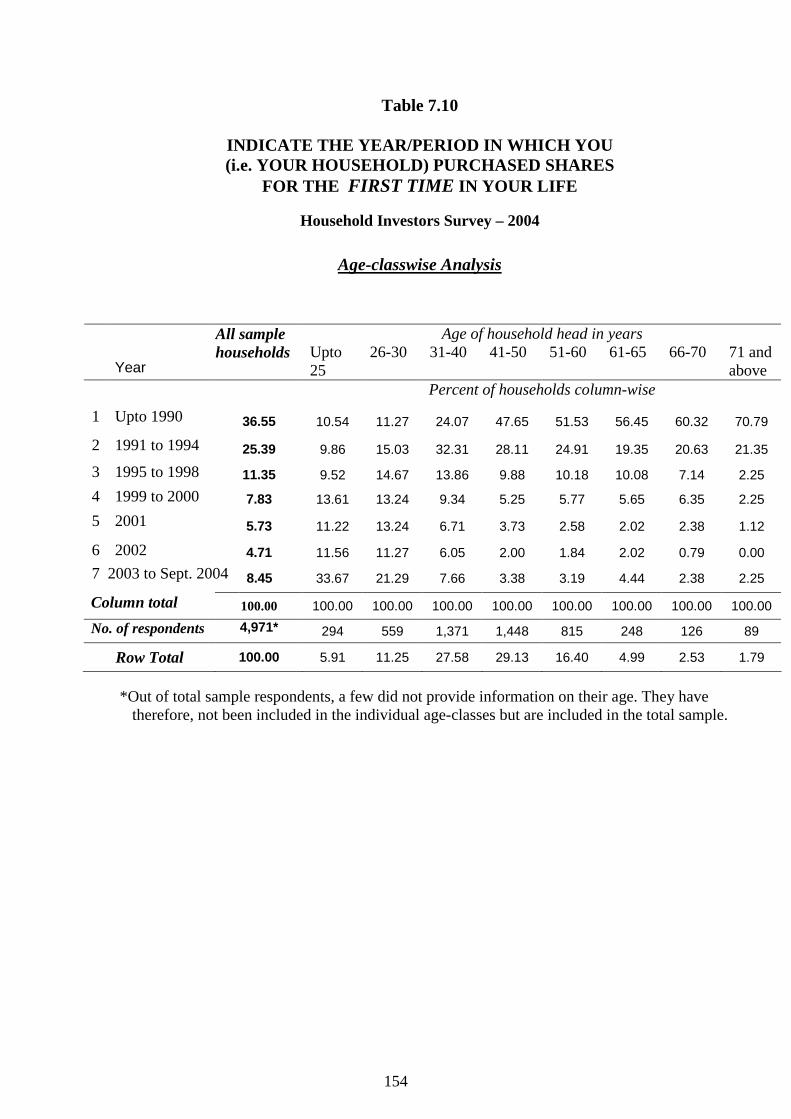
154
Table 7.10
INDICATE THE YEAR/PERIOD IN WHICH YOU (i.e. YOUR HOUSEHOLD) PURCHASED SHARES
FOR THE FIRST TIME IN YOUR LIFE
Household Investors Survey – 2004
Age-classwise Analysis
Age of household head in years
Year
All sample households Upto
25 26-30 31-40 41-50 51-60 61-65 66-70 71 and
above Percent of households column-wise
1 Upto 1990 36.55 10.54 11.27 24.07 47.65 51.53 56.45 60.32 70.79
2 1991 to 1994 25.39 9.86 15.03 32.31 28.11 24.91 19.35 20.63 21.35
3 1995 to 1998 11.35 9.52 14.67 13.86 9.88 10.18 10.08 7.14 2.25 4 1999 to 2000 7.83 13.61 13.24 9.34 5.25 5.77 5.65 6.35 2.25
5 2001 5.73 11.22 13.24 6.71 3.73 2.58 2.02 2.38 1.12
6 2002 4.71 11.56 11.27 6.05 2.00 1.84 2.02 0.79 0.00 7 2003 to Sept. 2004 8.45 33.67 21.29 7.66 3.38 3.19 4.44 2.38 2.25
Column total
100.00 100.00 100.00 100.00 100.00 100.00 100.00 100.00 100.00
No. of respondents 4,971*
294 559 1,371 1,448 815 248 126 89
Row Total 100.00 5.91 11.25 27.58 29.13 16.40 4.99 2.53 1.79 *Out of total sample respondents, a few did not provide information on their age. They have
therefore, not been included in the individual age-classes but are included in the total sample.

155
Appendix to Chapter 7
Table A7 (1)
ANALYSIS OF HOUSEHOLD INVESTORS ACCORDING TO HOW LIKELY THEY ARE TO MAKE NET ADDITION DURING NEXT
ONE YEAR TO INVESTMENT IN: EQUITY EQUITY EQUITY EQUITY SHARESSHARESSHARESSHARES
Household Investors Survey - 2004
Income-classwise Analysis
Household income class (Rs. per month) How likely
Respondents Total Upto
10,000 10,001– 15,000
15,001– 20,000
20,001- 25,000
Over 25,000
Percentage of households column-wise
1. Very likely 41.84 43.22 42.58 38.84 37.45 44.82
2. Somewhat likely 24.67 23.00 25.02 26.43 27.26 23.19
Sub Total (1+2) 66.51 66.22 67.60 65.27 64.71 68.01
3. Not much likely 13.36 12.48 13.52 14.69 14.63 12.28
4. Not at all likely 20.12 21.30 18.88 20.04 20.66 19.71
Column total 100.00 100.00 100.00 100.00 100.00 100.00
No. of Respondents 5,597 1,474 1,287 1,048 697 1,091
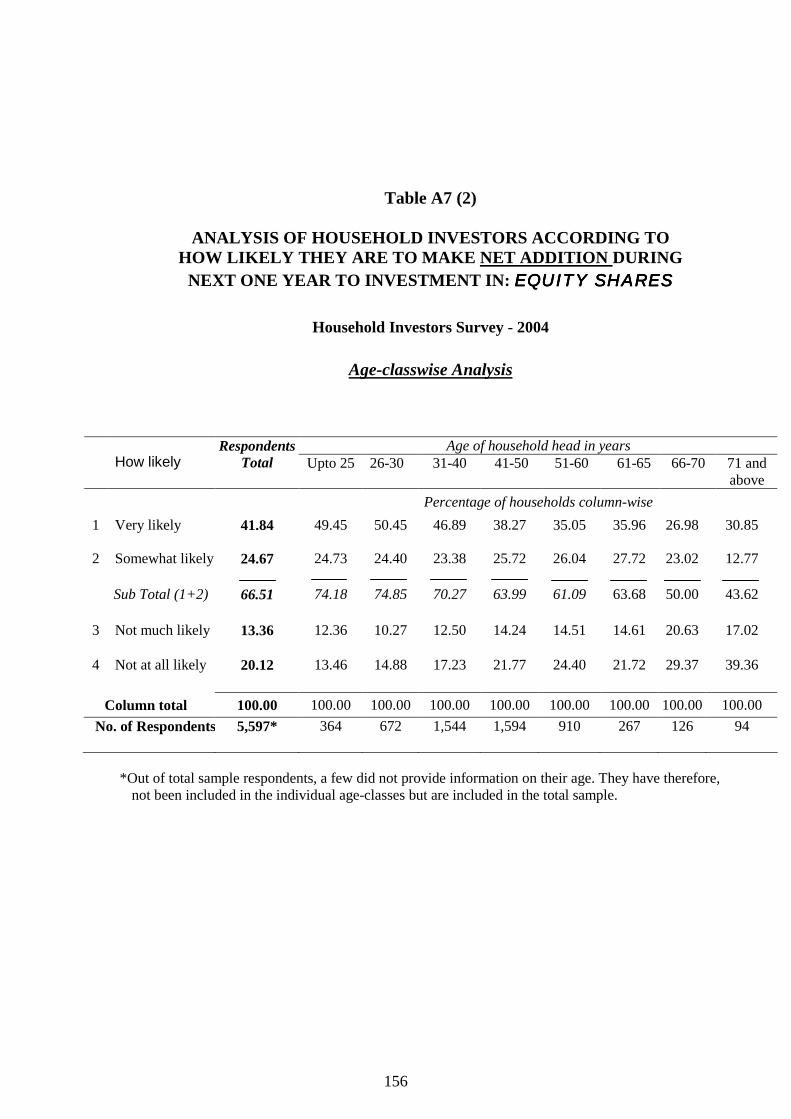
156
Table A7 (2)
ANALYSIS OF HOUSEHOLD INVESTORS ACCORDING TO HOW LIKELY THEY ARE TO MAKE NET ADDITION DURING
NEXT ONE YEAR TO INVESTMENT IN: EQUITY SHARESEQUITY SHARESEQUITY SHARESEQUITY SHARES
Household Investors Survey - 2004
Age-classwise Analysis
Age of household head in years How likely
Respondents Total Upto 25 26-30 31-40 41-50 51-60 61-65 66-70 71 and
above
Percentage of households column-wise
1 Very likely 41.84 49.45 50.45 46.89 38.27 35.05 35.96 26.98 30.85
2 Somewhat likely 24.67 24.73 24.40 23.38 25.72 26.04 27.72 23.02 12.77
Sub Total (1+2) 66.51 74.18 74.85 70.27 63.99 61.09 63.68 50.00 43.62
3 Not much likely 13.36 12.36 10.27 12.50 14.24 14.51 14.61 20.63 17.02
4 Not at all likely 20.12 13.46 14.88 17.23 21.77 24.40 21.72 29.37 39.36
Column total 100.00 100.00 100.00 100.00 100.00 100.00 100.00 100.00 100.00 No. of Respondents 5,597* 364 672 1,544 1,594 910 267 126 94
*Out of total sample respondents, a few did not provide information on their age. They have therefore,
not been included in the individual age-classes but are included in the total sample.

157
Table A7 (3)
ANALYSIS OF HOUSEHOLD INVESTORS ACCORDING TO HOW LIKELY THEY ARE TO MAKE NET ADDITION DURING NEXT ONE YEAR TO INVESTMENT IN: MUTUAL FUND EQUITY / GROWTH SCHEMESMUTUAL FUND EQUITY / GROWTH SCHEMESMUTUAL FUND EQUITY / GROWTH SCHEMESMUTUAL FUND EQUITY / GROWTH SCHEMES
Household Investors Survey - 2004
Income-classwise Analysis
Household income class (Rs. per month) How likely
Respondents Total Upto
10,000 10,001– 15,000
15,001– 20,000
20,001- 25,000
Over 25,000
Percentage of households column-wise
1. Very likely 16.23 12.94 15.46 16.19 15.71 21.80
2. Somewhat likely 24.68 22.49 25.50 25.06 27.40 24.48
Sub Total (1+2) 40.91 35.43 40.96 41.25 43.11 46.28
3. Not much likely 17.71 15.63 17.54 19.84 19.23 17.67
4. Not at all likely 41.38 48.93 41.50 38.91 37.66 36.05
Column total 100.00 100.00 100.00 100.00 100.00 100.00
No. of Respondents 4,867 1,267 1,106 902 624 968
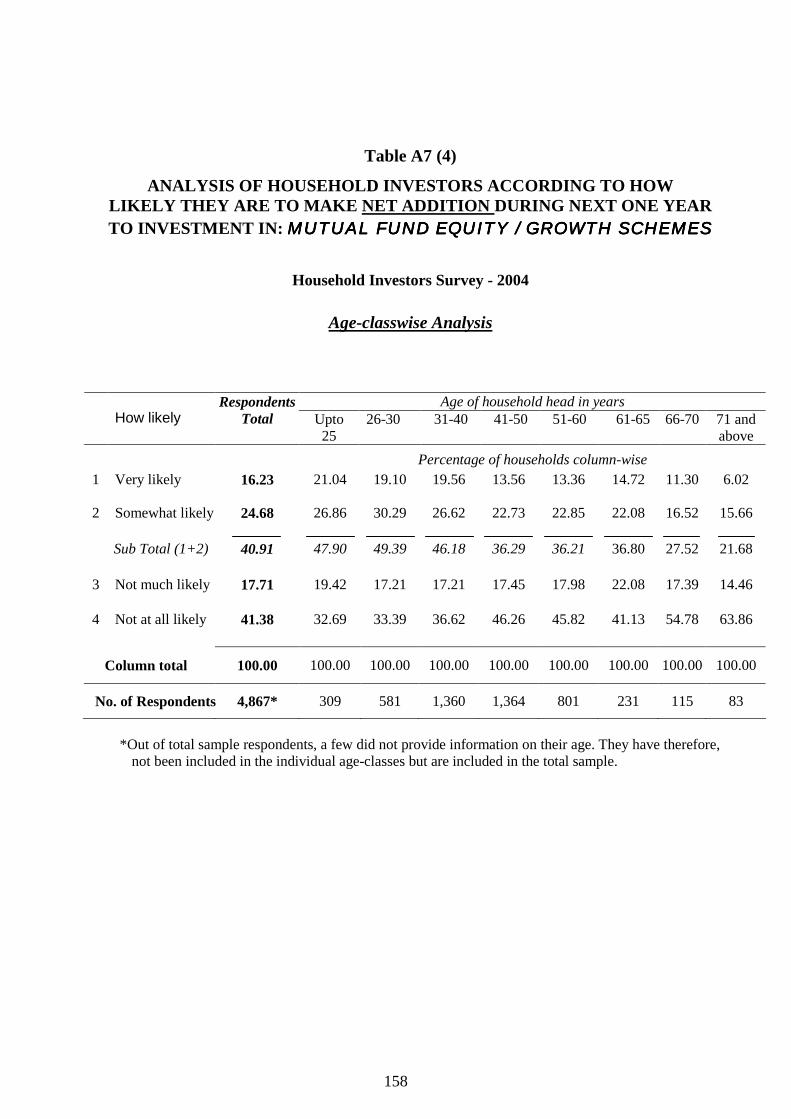
158
Table A7 (4)
ANALYSIS OF HOUSEHOLD INVESTORS ACCORDING TO HOW LIKELY THEY ARE TO MAKE NET ADDITION DURING NEXT ONE YEAR TO INVESTMENT IN: MUTUAL FUND EQUITY / GROWTH SCHEMESMUTUAL FUND EQUITY / GROWTH SCHEMESMUTUAL FUND EQUITY / GROWTH SCHEMESMUTUAL FUND EQUITY / GROWTH SCHEMES
Household Investors Survey - 2004
Age-classwise Analysis
Age of household head in years How likely
Respondents Total Upto
25 26-30 31-40 41-50 51-60 61-65 66-70 71 and
above
Percentage of households column-wise
1 Very likely 16.23 21.04 19.10 19.56 13.56 13.36 14.72 11.30 6.02
2 Somewhat likely 24.68 26.86 30.29 26.62 22.73 22.85 22.08 16.52 15.66
Sub Total (1+2) 40.91 47.90 49.39 46.18 36.29 36.21 36.80 27.52 21.68
3 Not much likely 17.71 19.42 17.21 17.21 17.45 17.98 22.08 17.39 14.46
4 Not at all likely 41.38 32.69 33.39 36.62 46.26 45.82 41.13 54.78 63.86
Column total 100.00 100.00 100.00 100.00 100.00 100.00 100.00 100.00 100.00
No. of Respondents 4,867* 309 581 1,360 1,364 801 231 115 83
*Out of total sample respondents, a few did not provide information on their age. They have therefore,
not been included in the individual age-classes but are included in the total sample.
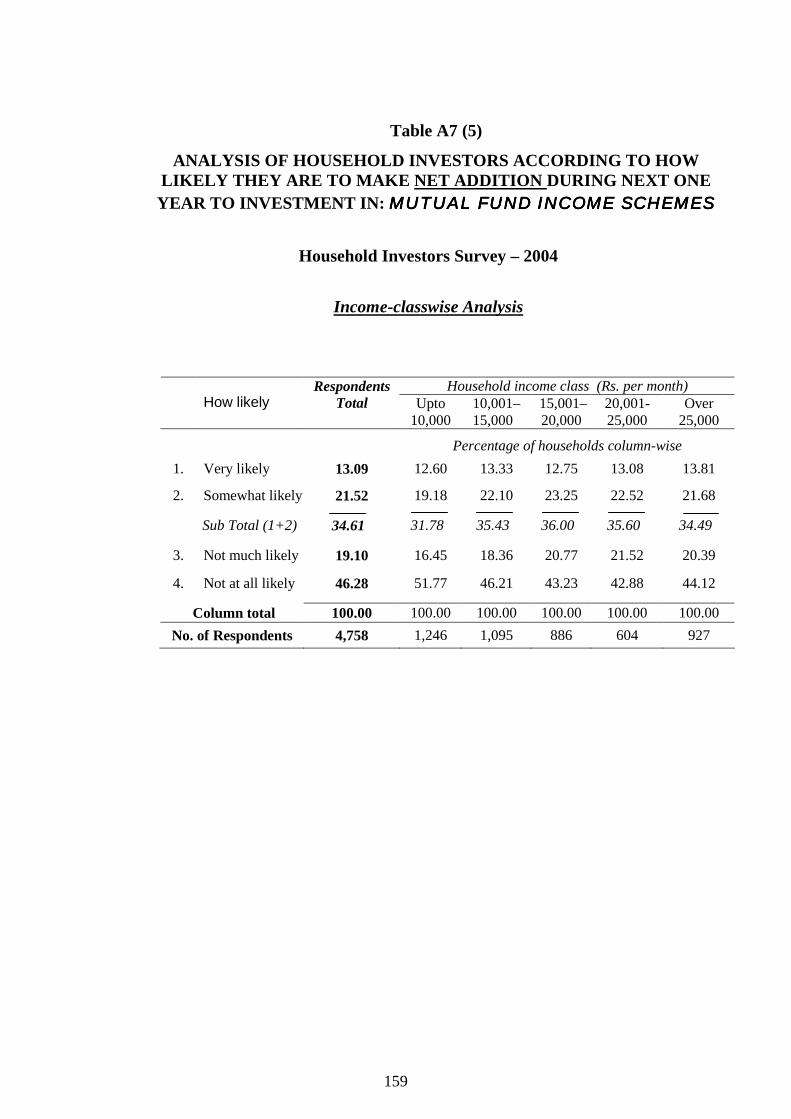
159
Table A7 (5)
ANALYSIS OF HOUSEHOLD INVESTORS ACCORDING TO HOW LIKELY THEY ARE TO MAKE NET ADDITION DURING NEXT ONE
YEAR TO INVESTMENT IN: MUTUAL FUND INCOME SCHEMESMUTUAL FUND INCOME SCHEMESMUTUAL FUND INCOME SCHEMESMUTUAL FUND INCOME SCHEMES
Household Investors Survey – 2004
Income-classwise Analysis
Household income class (Rs. per month) How likely
Respondents Total Upto
10,000 10,001– 15,000
15,001– 20,000
20,001- 25,000
Over 25,000
Percentage of households column-wise
1. Very likely 13.09 12.60 13.33 12.75 13.08 13.81
2. Somewhat likely 21.52 19.18 22.10 23.25 22.52 21.68
Sub Total (1+2) 34.61 31.78 35.43 36.00 35.60 34.49
3. Not much likely 19.10 16.45 18.36 20.77 21.52 20.39
4. Not at all likely 46.28 51.77 46.21 43.23 42.88 44.12
Column total 100.00 100.00 100.00 100.00 100.00 100.00 No. of Respondents 4,758 1,246 1,095 886 604 927

160
Table A7 (6)
ANALYSIS OF HOUSEHOLD INVESTORS ACCORDING TO HOW LIKELY THEY ARE TO MAKE NET ADDITION DURING NEXT ONE
YEAR TO INVESTMENT IN: MUTUAL FUND INCOME SCHEMESMUTUAL FUND INCOME SCHEMESMUTUAL FUND INCOME SCHEMESMUTUAL FUND INCOME SCHEMES
Household Investors Survey – 2004
Age-classwise Analysis
Age of household head in years How likely
Respondents Total Upto
25 26-30 31-40 41-50 51-60 61-65 66-70 71 and
above
Percentage of households column-wise
1 Very likely 13.09 18.57 14.11 1.51 11.22 11.10 16.16 10.08 6.02
2 Somewhat likely 21.52 21.17 21.96 22.64 21.46 20.55 19.21 24.37 15.66
Sub Total (1+2) 34.61 39.74 36.07 37.15 32.68 31.65 35.37 34.45 21.68
3 Not much likely 19.10 22.15 23.21 19.07 17.02 19.92 20.52 10.08 13.25
4 Not at all likely 46.28 38.11 40.71 43.77 50.30 48.42 44.10 55.46 65.06
Column total 100.00 100.00 100.00 100.00 100.00 100.00 100.00 100.00 100.00 No. of Respondents 4,758* 307 560 1,316 1,328 793 229 119 83
*Out of total sample respondents, a few did not provide information on their age. They have
therefore, not been included in the individual age-classes but are included in the total sample.
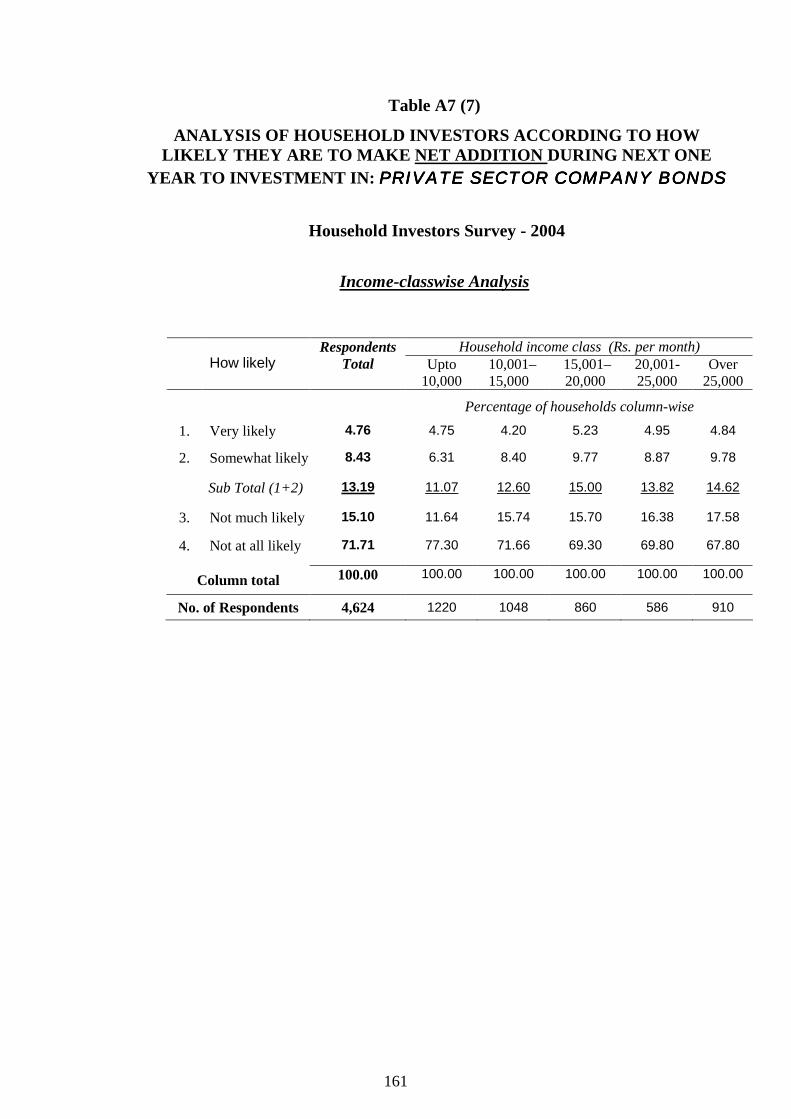
161
Table A7 (7)
ANALYSIS OF HOUSEHOLD INVESTORS ACCORDING TO HOW LIKELY THEY ARE TO MAKE NET ADDITION DURING NEXT ONE
YEAR TO INVESTMENT IN: PRIVATE SECTOR COMPANY BONDSPRIVATE SECTOR COMPANY BONDSPRIVATE SECTOR COMPANY BONDSPRIVATE SECTOR COMPANY BONDS
Household Investors Survey - 2004
Income-classwise Analysis
Household income class (Rs. per month) How likely
Respondents Total Upto
10,000 10,001– 15,000
15,001– 20,000
20,001- 25,000
Over 25,000
Percentage of households column-wise
1. Very likely 4.76 4.75 4.20 5.23 4.95 4.84
2. Somewhat likely 8.43 6.31 8.40 9.77 8.87 9.78
Sub Total (1+2) 13.19 11.07 12.60 15.00 13.82 14.62
3. Not much likely 15.10 11.64 15.74 15.70 16.38 17.58
4. Not at all likely 71.71 77.30 71.66 69.30 69.80 67.80
Column total 100.00 100.00 100.00 100.00 100.00 100.00
No. of Respondents 4,624 1220 1048 860 586 910

162
Table A7 (8)
ANALYSIS OF HOUSEHOLD INVESTORS ACCORDING TO HOW LIKELY THEY ARE TO MAKE NET ADDITION DURING NEXT ONE
YEAR TO INVESTMENT IN: PRIVATE SECTOR COMPANY BONDSPRIVATE SECTOR COMPANY BONDSPRIVATE SECTOR COMPANY BONDSPRIVATE SECTOR COMPANY BONDS
Household Investors Survey - 2004
Age-classwise Analysis
Age of household head in years How likely
Respondents Total Upto
25 26-30 31-40 41-50 51-60 61-65 66-70 71 and
above
Percentage of households column-wise
1 Very likely 4.76 6.83 5.15 4.69 4.99 3.79 3.62 5.36 3.66
2 Somewhat likely 8.43 10.58 10.48 8.67 8.14 7.44 6.33 8.04 4.88
Sub Total (1+2) 13.19 17.41 15.63 13.36 13.13 11.23 9.95 13.39 8.54
3 Not much likely 15.10 20.14 15.81 17.03 11.75 14.10 17.19 14.29 15.85
4 Not at all likely 71.71 62.46 68.57 69.61 75.12 74.67 72.85 72.32 75.61
Column total 100.00 100.00 100.00 100.00 100.00 100.00 100.00 100.00 100.00
No. of Respondents 4,624* 293 544 1280 1302 766 221 112 82 *Out of total sample respondents, a few did not provide information on their age. They have
therefore, not been included in the individual age-classes but are included in the total sample.
163
Chapter 8
SMALL INVESTORS’ PROBLEMS
WITH DEMAT SYSTEM
Small long-term investors bear the brunt
8.1 Retail investors have been encountering serious problems with
the demat system. This has happened because the SEBI, in a
hurry, made demat compulsory without giving due consideration
to the realities of our socio-economic situation. The result is that
India’s demat system has not evolved as a voluntary business
service, priced attractively for the mass of investors. It is heavily
tilted in favour of speculators and large market participants but
against the retail investors. Its effect has been to gradually push
out the retail investors from the equity market. The demat system
was never promoted by compulsion in the U.S. or U.K. It grew
there gradually as investors became familiar with it and found it
beneficial and economical to them.
The original purpose
8.2 The report of the Working Group, set up in 1994, on the legal
framework of a depository system for India,39 had envisaged that
“it would be optional for an investor to hold and transfer the
securities through or outside the depository”, although, in long
run, the Group expected that the bulk of the securities would be
held in depository form. The Group also recognised that “in
many cases, investors would be residing at a place where no
39 The members of the SEBI Working Group on Framework for Depository System were : Mr.
C. Achuthan, Dr. L.C. Gupta, Mr. S. Murthy and Ms. D.N. Raval. See Report of the Working Group (August 1994, unpublished), specially para 11.4.
164
depository facilities are available and a small investor might find
it costly to transfer the shares through depository.”
8.3 The original objective of introducing the depository system was to
eliminate the many irritating problems and costs (like back-and-forth
transmission of millions of physical share certificates, bad deliveries,
shares lost or stolen in transit, delay in share transfer registration, etc.).
It has undoubtedly solved these problems but, at the same time, the
structure of demat charges has played mischief due to being highly
biased against small investors. It has hurt them so much that they are
tending to quit the equity market.2 This could not have been the
SEBI’s intention.
8.4 Around the time when the Depositories Act was enacted in 1996 to
enable the creation of a depository system, the official expectation
from the new system of dematerialisation of securities was expressed
by SEBI in the following words:
“It is expected that as the network of depository participants expands, and the proportion of securities dematerialized in the depository increases, the benefits of reduced risk and lower transaction costs will extend to the vast majority of market participants and lead to improved investor protection and service.”3 (Emphasis added.)
The truth is that the “vast majority of market participants” have
been disappointed by the depository system mainly because of its
structure and the use of compulsion leaving no option to the
2 For more detailed discussion, see L. C. Gupta and Naveen Jain, Economic and Political Weekly, May
17, 2003, pp. 1969-74. See also by same authors, “Small Investors at the Receiving End” in The Economic Times, 25 January, 2003.
3 See SEBI Annual Report, 1996-97, p. 20. In May 1996, SEBI also notified SEBI (Depositories and Participants) Regulations. Following the notification, National Securities Depository Limited (NSDL) was sponsored by IDBI, UTI and NSE. The NSDL began its operations in November 1996.
165
investor. There is an inherent monopoly element in such a
system.
Problem recognized but action awaited
8.5 Belatedly in February 2004, the SEBI recognised the problem of
high demat charges in the case of small investors and constituted
a Group on Reduction of Demat Charges. The Report of the
Group observed:
Ever since Depositories changed the method of charging
depository participants on transactions, from the earlier
method of ad valorem to flat fee structure (FFS), there has
been a perception in certain quarters that small investors are
overcharged. Further, it has been felt that the charges are
beyond the bearable capacity sometimes for certain class of
investors and thus it was reported that small investors have
been driven away from the Indian equity market . . . .
Considering the role of small investors in Indian capital
market, we need to have a cost effective system which will
address many of the issues concerning small investors. . . .
The depositories started charging DPs on FFS basis since
May, 2002 and DPs in turn started charging on FFS basis to
investors. This system is tilted in favour of high networth
and institutional investors who trade in large quantities. The
long-term small investors who trade less frequently feel the
unwanted burden of heavy outgo on account of FFS.4
4 See SEBI’s website: www.sebi.gov.in
166
8.6 The Group recommended that the small investors should be
charged on the basis of ad valorem only and that the charges, like
account maintenance and demat charges, should not be levied on
small investors at all by DPs. The Group also recognised that the
companies have really been the main beneficiaries of the
depository system which has saved them huge cost incurred
earlier on registration of share transfers. It recommended that all
companies should pay a one-time fee to the Depository at 0.1%
of their market capitalisation. The suggestions of the Group have
yet to be implemented.
How the depository system works
8.7 For a proper understanding of the retail investors’ problems with
the demat system, the following historical background should be
kept in view. The securities depository system was introduced in
India towards the end of 1996 with the creation of the National
Securities Depository Limited (NSDL) under the sponsorship of
IDBI, UTI and NSE. Subsequently, in February 1999, a second
depository, called Central Depository Services Limited (CDSL),
was sponsored by the Bombay Stock Exchange. The First
Working Group (1994) on the Depository System had envisaged
a competitive system of multiple depositories. The Group thought
that it would be too risky to have a single depository in the initial
stages (Para 10 of Group’s Report). The Depositories Act
recognised the competitive principle by keeping the door open
for multiple depositories.

167
8.8 However, initially the depository system came to be entirely
controlled by a single depository, viz. NSDL, Well before the
second depository could come up, SEBI had already made
trading through depository compulsory. This gave NSDL
enormous monopoly power by placing the later entrant, CDSL, at
enormous disadvantage. The CDSL could garner only the ‘left
over’ depository business because switching from one depository
to another was not workable in practice. The NSDL took full
advantage of its monopoly power.
8.9 The depositories levy certain fees from Depository Participants
(DPs), who are like agencies for providing depository services to
investors. The investors have direct contact with the DPs only
and no contact at all with the depositories.
8.10 DPs are completely free to decide in what manner and how much
they will charge to the investors for the depository services.
Most DPs charge for account opening, account maintenance,
custody, transaction settlement, pledge creation and closure, etc.
The DPs have to charge to investors substantially more in total
because DPs have to recover their own operational expenses,
besides the fee they pay to the depositories. Many DPs levy
several miscellaneous types of charges too, such as courier
charges, penalties, interest-free deposit with the DP, etc.
How competition is obstructed
8.11 The system of DPs’ charges to the investors is a virtual jungle
and obstructs competition. The charges differ a great deal with
respect to the heads under which they are made and also with
respect to the level of each type of charge. For this reason, the
investors have great difficulty in comparing the charges of
168
various DPs and determining the cheapest. This makes the whole
system very opaque.
8.12 The NSDL has argued that because of the existence of several
hundred DPs in the country and two competing depositories,
there is sufficient competition in the Indian depository system.
This argument is fallacious. An examination of ground realities
shows that competition does not seem to work in the depository
system. The reasons are: an opaque and confusing system of
charges at the DP level; substantial costs and hassles for the
investor if he wants to change his DP and a heavy annual flat fee
payable by every DP with the result that many small places have
no DP and some places have only one DP.
Most retail investors remain outside the demat system
8.13 A stark reality is that despite the existence of the depository
system in India for nearly eight years and despite demat form
being made compulsory by SEBI for trading on stock exchanges,
most of the small investors, who constitute the majority of
shareholding population in India, have remained outside the
share depository system. This is true of many companies which
have lakhs of shareholders and very active trading in their shares.
8.14 This was confirmed by the data collected by us directly from 130
individual companies in 2003, as summarised in Tables 8.1 and
8.2.5 Table 8.1 classifies the companies into five size-groups by
market capitalisation. The analysis shows that a majority of
shareholders in every size-class were holding physical shares.
5 See. L.C. Gupta, Naveen Jain and Utpal Choudhury, India’s Stock Market and Household Investors
2001-04 (SCMRD, 2004), p. 40.

169
8.15 Table 8.2 specially looks at 20 individual companies which had
the largest number of shareholders in our sample. (Names of
individual companies have been kept confidential). Table 8.2
shows that, in the case of six companies having over 5 lakh
shareholders each, over three-fourths (78-84%) of their
shareholders held physical shares. Each of the 20 companies
covered by Table 8.2 had over 1,50,000 shareholders. The
percentage of shareholders having physical certificates varied
among the companies but in as many as 16 out of 20 companies,
more than 50% of shareholders held physical shares. The data on
which Tables 8.1 and 8.2 are based relates mostly to August-
September 2003. The number of depository accounts have been
gradually increasing but it has not so far altered the over-all
picture presented by us. It is known that the total number of
demat accounts is still much below 50% of India’s shareowning
population.
Table 8.1
PER CENT OF PHYSICAL SHAREHOLDERS IN A SAMPLE OF 130 COMPANIES CLASSIFIED
BY MARKET CAPITALISATION
Around Aug – Sep. 2003
Market capitalization Size Group (Rs. Cr.)
Total Market Capitalisation (Rs. Cr.)
Total No. of Shareholders
% physical shareholders to total number of shareholders
1. Upto 200 2,239 5,35,129 53.84
2. 201-500 8,257 17,18,444 51.91
3. 501-2000 29,940 22,90,940 62.20
4. 2001-5000 37,543 16,95,769 61.91
5. 5000 & above 1,54,297 33,74,364 51.31
All-groups 2,32,276 96,14,646 54.02
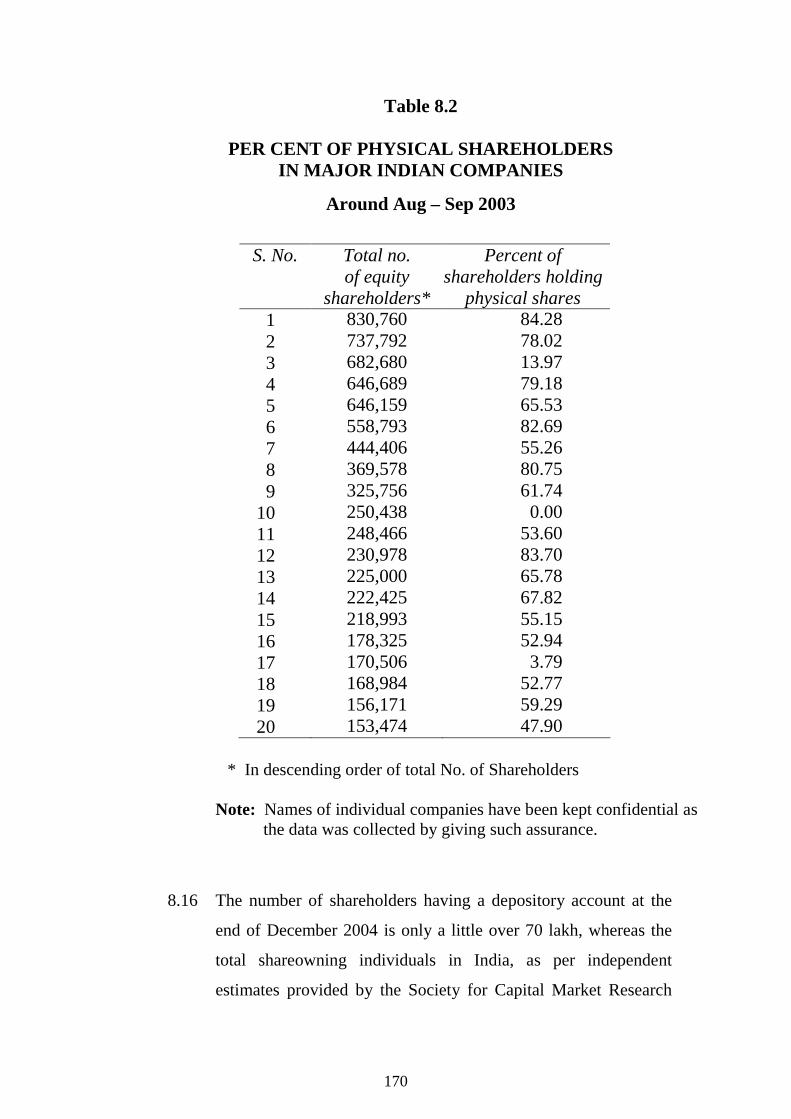
170
Table 8.2
PER CENT OF PHYSICAL SHAREHOLDERS IN MAJOR INDIAN COMPANIES
Around Aug – Sep 2003
S. No. Total no. of equity
shareholders*
Percent of shareholders holding
physical shares 1 830,760 84.28 2 737,792 78.02 3 682,680 13.97 4 646,689 79.18 5 646,159 65.53 6 558,793 82.69 7 444,406 55.26 8 369,578 80.75 9 325,756 61.74
10 250,438 0.00 11 248,466 53.60 12 230,978 83.70 13 225,000 65.78 14 222,425 67.82 15 218,993 55.15 16 178,325 52.94 17 170,506 3.79 18 168,984 52.77 19 156,171 59.29 20 153,474 47.90
* In descending order of total No. of Shareholders
Note: Names of individual companies have been kept confidential as
the data was collected by giving such assurance.
8.16 The number of shareholders having a depository account at the
end of December 2004 is only a little over 70 lakh, whereas the
total shareowning individuals in India, as per independent
estimates provided by the Society for Capital Market Research
171
and Development and by SEBI-NCAER survey, is around 2
crore.6 Even if we allow for some consolidation of shareholding
by various members of the same family for economising demat
cost, it is reasonable to infer that a majority of individual
shareowners of individual companies have not joined the
depository system.
8.17 The Indian market regulatory authorities seem to have played
down the fact about majority of retail investors remaining outside
the depository system. No official agency has even tried to
compile and provide company-wise official data on the
percentage of the number of investors who continue to hold
shares in the form of paper certificates and of those who hold
in demat form. The only figures being officially provided relate
to the amount of equity share capital held in demat form and
traded in demat form. The retail investors’ problem has thus been
swept under the carpet.
8.18 If we look only at the amount of capital, it should be noted in this
context that the top 10 shareholders of most of the listed Indian
companies hold over 60% of the share capital. At the other end
are thousands or even lakhs of small shareholders who account
for only about 10-20% of a company’s amount of share capital. It
may well be that the bulk (80-90%) of the total share capital is
held in demat form and yet a majority (50-60%) of retail
investors remain outside the depository system. The focus of our
analysis is on this huge mass of small investors, most of whom,
as we have shown, have remained outside the share depository
system.
6 See SEBI-NCAER Survey of Indian Investors (published by SEBI, June 2000). See also L.C. Gupta,
C.P. Gupta and Naveen Jain, Households’ Investment Preferences : The 3rd all-India Investors’ Survey (SCMRD, 2001), specially pp. 110-21.

172
8.19 Our surveys have shown that:
(a) a little less than one-fourth of the total number of
shareowners in our sample had all their shareholdings in
demat form only;
(b) about one-third had paper certificates only without having
any demat account; and
(c) two-fifths had paper certificates for some scrips and demat
account for the other scrips.
8.20 The third category mentioned above is the result of a strategy of
some shareowners to demat those shares in which they would
like to trade frequently, but not demat the other shareholdings.
This explains why nearly three-fourths of retail shareowners in
India continue to hold paper certificates for some shareholdings.
Demat in the context of investors’ strategies
8.21 We had enquired from our sample of households why they had
not converted some or all shareholdings into demat form. We
discovered that the individual investor’s attitude to demat form
was closely related to their investment strategy in terms of
whether the investor bought shares for long-term investment
extending over some years or for short-term speculation.7 A
significant fact revealed by our analysis is that, contrary to
popular belief, a majority of household investors are long-
term oriented. The proportion of such investors tends to rise
7 In real life, the dividing line is not clear. Some respondents explicitly mentioned that they followed a
mixed strategy (i.e. indulging in both short-term speculation and long-term investment), taking into account the market conditions.

173
with income and age (see Tables 6.6 and 6.7 in the preceding
chapter).
8.22 Buying shares for long-term holding implies that the buyer is
basically guided by economic and corporate fundamentals.
Hence, the predominance of long-term oriented investors
enhances market efficiency, as also the flow of savings into
corporate enterprises. Such investors need to be encouraged.
Retail investors’ specific complaints
8.23 We asked respondents to our survey why they have not converted
all or some of their shareholdings into demat form. Tables 8.3
and 8.4 presents an analysis of the replies by income-class and
age-class. The following points are noteworthy:
(a) As our analysis shows, the single most important complaint
of household investors about demat system is that demat
charges are too high. One out of every five respondents
mentioned this complaint. Households in all income and
age-classes have this complaint. Notably, the proportion of
complainants is distinctly higher, being 24-25%, among the
elderly shareowners aged above 65 years compared to 16-
17% among the young shareholders aged 30 years or below.
(b) A related point made by a little over 10% of respondents
was that they are long-term shareholders and don’t need the
demat system. The demat system penalizes the small long-
term shareholder. The demat is a requirement when a person
wants to sell and not during holding period. For holding
shares, one needs only safe custody which should be
cheaply provided. Notably, the percentage of respondents

174
making this point is distinctly higher among those above 40
years than among the younger investors. This may be
observed from Table 8.4.
(c) The complaint that companies concerned have not joined the
depository system has been voiced by about one-sixth of
total respondents but this proportion is distinctly higher
among those above 40 years than among the younger
groups. While the number of listed companies is reported to
be over 9000, the number of companies which have joined
the demat system is 5216 according to the SEBI Annual
Report 2003-04. However, the report says nothing about
how the regulatory authorities propose to protect the
shareholders of over 4000 listed companies which have not
joined the depository system.8
(d) A significant percentage of respondents stated that they are
unable to understand the demat system or that they find the
procedure too complicated (see Tables 8.3 and 8.4). Their
problems deserve sympathetic consideration by simplifying
the procedures.
(e) The complaint of some respondents is that depository
service was not available in the town. As per SEBI Annual
Report 2003-04, NSDL covers, through its Depository
Participants (DPs), 242 locations (i.e. cities/towns) and
CDSL 108 locations. Many of the locations would be
common between NSDL and CDSL. Together they may be
covering only around 250 locations in the whole country.
One-third of locations are reported to have only one DP who
8 As per SEBI Annual Report 2001-02, India had 9644 listed companies. Its subsequent annual reports
do not provide any information on the number of listed companies.

175
is free to fix its own charges. The depository system does
not cover all class-1 towns, i.e. places having more than one
lakh population. In the light of this fact, it is unreasonable to
make the demat system compulsory for all shareholders
wherever located. The compulsory requirement is
preventing the spread of shareownership to smaller towns
and thus restraining the growth of shareowning population.
8.24 The annual custody and account maintenance charges penalise
the small long-term holders of shares.9 They have the effect of
squeezing them out from the equity market. This is already
happening to some extent.
8.25 The small investors are faced with a serious dilemma. On the one
hand, if they demat the holding, they find that long-term holding
of shares in demat form is often uneconomical due to annual
account maintenance and custody charges. Both these charges
have to be paid annually even when the return from holdings is
negative or negligible. On the other hand, if they continue to hold
paper certificates, they will have difficulty in selling their holding
as and when they want because trading arrangements for paper
certificates have been dismantled in haste without creating an
alternative reasonably economical trading system. Hence, long-
term small investors are gradually quitting the equity market
by becoming mostly sellers when market conditions become
bullish, as in 2003 and 2004.
Concluding comments
8.26 The over-all effect of the demat system has not been to attract a
greater number of domestic retail investors into shareowners but 9 The demat system has a ‘penalising’ effect on small investors ever since the basis of charge was
changed from ad velorem system into flat rate system.

176
the opposite. The demat system has been very attractive to the
speculators and frequent traders. For this and other reasons,
the speculative trading volumes have grown enormously but the
percentage of annual households’ financial saving flowing into
direct shareholding and mutual fund schemes has fallen to a
negligible level.
8.27 What has fundamentally gone wrong with the depository system
is that it is designed to cater mainly to frequent traders,
speculators and large investors rather than to provide an
economical paperless system for long-term holding of
securities by the huge number of small investors.10 The needs
of large investors are well taken care of by the present flat fee
system of depository charges. If the recommendation of the SEBI
Group (2004) to charge small investors on ad valorem basis is
implemented, it will largely alleviate the problem being faced by
small investors.
8.28 According to our analysis, the demat system, because of the
design of its charges, has led to compression of the size of
shareowning population in India instead of expanding it. We need
a demat system with which the retail investors can feel secure,
comfortable and happy. This is not so with the present system.
10 It is interesting to note that the Depository Trust & Clearing Corporation (DTCC) of the U.S.
provides for the safe-keeping of securities for customers. See News and Information for DTC customers, October 2002, page 11, attached to its Annual Report, 2001.
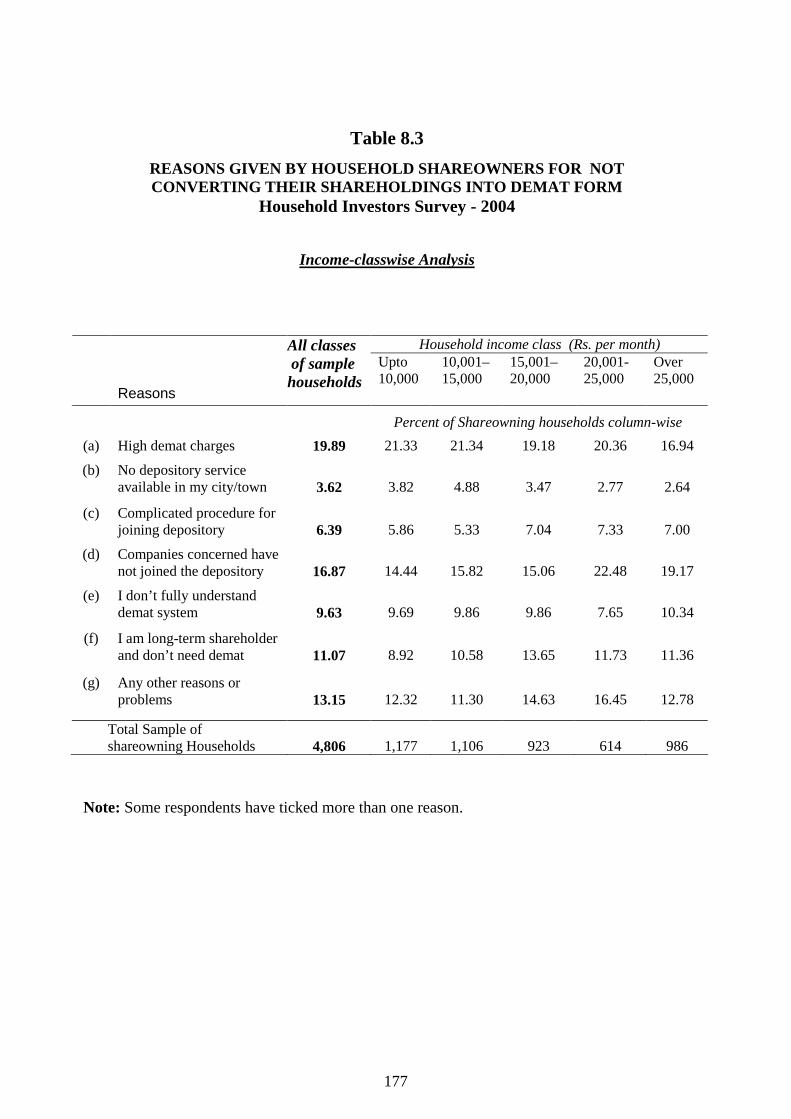
177
Table 8.3 REASONS GIVEN BY HOUSEHOLD SHAREOWNERS FOR NOT CONVERTING THEIR SHAREHOLDINGS INTO DEMAT FORM
Household Investors Survey - 2004
Income-classwise Analysis
Household income class (Rs. per month)
Reasons
All classes of sample households
Upto 10,000
10,001– 15,000
15,001– 20,000
20,001- 25,000
Over 25,000
Percent of Shareowning households column-wise (a) High demat charges
19.89 21.33 21.34 19.18 20.36 16.94
(b) No depository service available in my city/town
3.62
3.82
4.88
3.47
2.77
2.64
(c) Complicated procedure for joining depository
6.39
5.86
5.33
7.04
7.33
7.00
(d) Companies concerned have not joined the depository
16.87
14.44
15.82
15.06
22.48
19.17
(e) I don’t fully understand demat system
9.63
9.69
9.86
9.86
7.65
10.34
(f) I am long-term shareholder and don’t need demat
11.07
8.92
10.58
13.65
11.73
11.36
(g) Any other reasons or problems
13.15
12.32
11.30
14.63
16.45
12.78
Total Sample of shareowning Households
4,806
1,177
1,106
923
614
986
Note: Some respondents have ticked more than one reason.
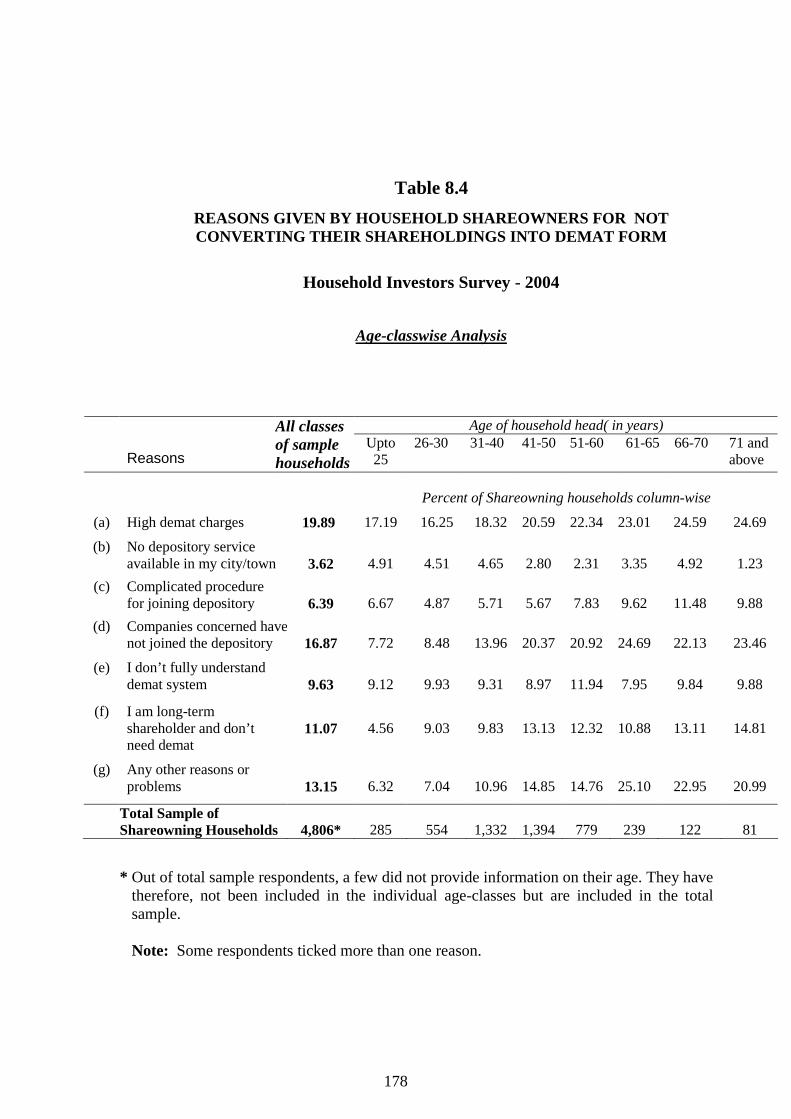
178
Table 8.4 REASONS GIVEN BY HOUSEHOLD SHAREOWNERS FOR NOT CONVERTING THEIR SHAREHOLDINGS INTO DEMAT FORM
Household Investors Survey - 2004
Age-classwise Analysis
Age of household head( in years)
Reasons
All classes of sample households
Upto 25
26-30 31-40 41-50 51-60 61-65 66-70 71 and above
Percent of Shareowning households column-wise
(a) High demat charges
19.89 17.19 16.25 18.32 20.59 22.34 23.01 24.59 24.69
(b) No depository service available in my city/town
3.62
4.91
4.51
4.65
2.80
2.31
3.35
4.92
1.23
(c) Complicated procedure for joining depository
6.39
6.67
4.87
5.71
5.67
7.83
9.62
11.48
9.88
(d) Companies concerned havenot joined the depository
16.87
7.72
8.48
13.96
20.37
20.92
24.69
22.13
23.46
(e) I don’t fully understand demat system
9.63
9.12
9.93
9.31
8.97
11.94
7.95
9.84
9.88
(f) I am long-term shareholder and don’t need demat
11.07
4.56
9.03
9.83
13.13
12.32
10.88
13.11
14.81
(g) Any other reasons or problems
13.15
6.32
7.04
10.96
14.85
14.76
25.10
22.95
20.99
Total Sample of Shareowning Households
4,806*
285
554
1,332
1,394
779
239
122
81
* Out of total sample respondents, a few did not provide information on their age. They have
therefore, not been included in the individual age-classes but are included in the total sample.
Note: Some respondents ticked more than one reason.

179
Chapter 9
INVESTOR EDUCATION
The need
9.1 The Indian stock market has witnessed impressive technological
progress in the last decade regarding the trading system.
However, unless the retail investors are educated enough to
understand the basics of the stock market’s behaviour and stock
selection criteria, most of them would be unable to benefit from
the market’s technical progress. There are many cases of stock
market investors losing the bulk of the money invested due to
their own lack of understanding, as well as their greed and
gullibility. Financial markets abound with people who are
looking for easy preys, i.e. ignorant investors.
9.2 The Ministry of Company Affairs has recognised this problem. It
administers a special fund, known as Investor Education and
Protection Fund (IEPF). It is a laudable idea but it is just a
beginning. There is need for vastly greater efforts in the direction
of promoting investor education and for giving more thought to
both the content and the delivery mechanism for investor
education on countrywide basis.
Implications of socio-economic changes
9.3 The fast socio-economic changes in India, as in other countries,
are increasingly forcing people to provide for their own
retirement during their working life.40 While some of this
40 See article on ‘Global Aging”, based on P. Engardio, and C. Matlack Report, The Economic
Times, 30 January 2005, p.7

180
provision is to be through public or private pension funds, a good
part should preferably be through self-managed investments.
How well one manages own investments will determine the
retirement income. The investors should be equipped with
knowledge to undertake this task. Such knowledge should be
imparted in a systematic way. The affluent people can hire
portfolio management services but the ordinary people will find
these too costly.
9.4 Understandably, the first investments by a young person usually
take the form of life insurance and bank fixed deposits. In the
case of shares, some learning is necessary for successful
investing. Hence, the need for suitable educational programmes
for investors.
Delivery mechanism and method
9.5 What should be the delivery mechanism and method for investor
education programmes is an important problem in a vast and
diverse country like India with many regional languages.
9.6 Most of even the educated English-knowing middle-class people
are familiar only with simple forms of investments, like fixed
deposits and government savings schemes. Their understanding
about the share market and mutual funds is mostly poor. Hence,
investment education programmes are needed for large
numbers of retail investors across the country.
Investor education: U.S. practices
9.7 In the U.S., the Securities and Exchange Commission (SEC) has
what it calls the Office of Investor Education and Assistance. It
organises investors’ “Town Meetings” in cities throughout the

181
country to help the people learn how to save and invest wisely
and prepare for retirement and achieve financial security. It
also publishes free brochures and other educational materials on
numerous investment topics.41
9.8 It is also reported that schools throughout the U.S. have
brought fantasy stock-picking into the classroom, with The
Stock Market Game, sponsored and distributed by The
Securities Industry Foundation for Economic Education.42
Lakhs of students play the game every year. The game is played
over 10 weeks from start to finish. The students are divided into
teams which compete among themselves for selecting the best
performing stocks. School teams compete at the local,
provincial and regional levels, just like tennis, volleyball,
hockey, etc., tournaments.
9.9 The investment game is both fun and education. The players
learn the basics of investing through the game. Of course, 10
weeks, or even a year, is too short a period for true test of the
winning stocks over the long-term in real life.
Importance of starting early
9.10 A large number of people lose money by investing in shares
because they start investing before they have learnt the basics
of share investment. They may be investing at the wrong time,
like the peak of a bull market, or their stock selection may not be
based on sound criteria. They may lack a historical perspective
about the stock market’s boom-bust characteristic and inherent
volatility. Such perspective will guard the investors against being 41 See SEC’s website: www.sec.gov 42 See Peter Lynch, Learn to Earn (Fireside, New York 1995), p. 128.

182
over-optimistic and will help them in evolving a sound long-term
investment strategy.
Evolving a systematic training methodology
9.11 There is a definite need for some formal and systematic
training for investors during their working life even if they
may not be investing significantly in shares at that time. Just
as they go through training for a vocation or occupation to earn a
living, every earner should ordinarily save and invest a part of
the earnings to provide for old age, children’s education, etc.
Learning to invest should be regarded as a preparation for
adult life. Education programmes to facilitate this process
should be made easily accessible on a countrywide basis. The
internet is a potent tool for making this possible.
Investment games as training tools
9.12 The training of investors can take many forms, including exciting
investment portfolio games. We have used some investment
games in the course of earlier household investor surveys to
create awareness among investors about how much, or how little,
they know. There is scope for devising varied investment games
which can be used as pedagogical tool. There could be a formal
training “school” catering to investors spread across the country,
based on today’s e-business model.
9.13 At younger age, the potential investors can be encouraged to
experiment for a while taking small bets with share
investment. The young people have a long future before them.
They will learn from mistakes. By the time, they have grown and

183
have substantial money to invest, they would be much better
prepared for investing skilfully.
Behaviour of returns from share investment
9.14 Most of the ordinary investors are familiar with simple
investments, like bank fixed deposits and government savings
schemes. Share investment is a more complex type of
investment. It can be more exciting because it can earn a far
higher return than fixed-income types but it has to be learnt.
Serious share investment is methodological and not just a
lottery. One should understand the various investment strategies,
methods of risk control, the importance of timing and how the
share market as a whole and the individual shares behave and
what the underlining factors are.
Emphasize the key factors
9.15 Such training should particularly drive home the point that shares
which do well in the long run belong to companies which do well
in the long run and hence the key to successful investing is to buy
shares of successful companies, or potentially successful
companies.43 This is well conveyed by the principle advocated by
Warrren Buffett that when you buy any shares, think as if you are
buying a part of the business. Investors must also ensure at the
same time that they are not paying too much for the same. They
must know that a share is a good buy only if the buying price is
“good” (i.e. advantageous for the buyer). Buying a good
company’s share at too high a price is a bad investment. This
aspect also needs to be driven home. The factors which
determine the risks and returns should be understood.
43 Peter Lynch, op. cit.
184
9.16 Depending entirely on tips can be very risky. If one has learnt
share investing, one would also be able to evaluate a tip. One
should be clear about the type of information on which the
investor should focus. The investor should understand the basic
elements of both market behaviour and company financial
performance.
Investors’ suggestions
9.17 The investors themselves are feeling the need for education
programmes. Suggestions received by us from respondents in the
course of the recent household investors survey indicate the need
for improving the investor education programmes being offered.
The suggestions make a long list of what they want to learn –
from the evaluation of a company’s performance and prospects to
the evaluation of the market conditions, procedures of buying
and selling, how to devise a good investment portfolio suited to
one’s own circumstances, how to choose mutual funds, how the
changes in interest rate affect the value of investments, how to
interpret stock indices, etc.
9.18 Our feedback from the sample households indicated that 68 per
cent of them have neither watched the T.V. programmes on
investor education nor attended any investor education seminar.
More effective ways and alternative delivery channels have to be
devised. Educating the ordinary investors should be an important
mission for the benefit of the mass of ordinary investors.

185
Topics for education programmes
9.19 We are giving in the Appendix to this chapter an edited and
selected version of the respondent’s suggestions on topics for
investor education programmes. Going through the list of topics
can be educative for the organisers of such programmes.

186
Annexure to Chapter 9
Classified List of Topics for Investor Education Programmes
1. Stock Market
a. Fundamentals of stock market b. Functioning of the stock market c. How investment in shares helps the industry
and the economy. d. How a small investor can benefit by investing
in the stock market. e. Difference between Indian stock market and
international stock markets. f. Technical analysis: Is it useful?
2. Investment types and selection of right investment
a. Basic types of investments. b. Selection of right investment. c. Comparison of returns among various instruments. d. Categories of investment. e. Benefits of investment: Short-term vs. long-term f. Difference between speculation and investment.
3. Investment Risks and Returns
a. How to analyse risk factors regarding various investment types.
b. Safety of investments in Govt and non-govt. schemes. c. Return maximization strategies. d. De-risking through diversification. e. Highlight the risks involved in equity investments. f. How to calculate risk. g. Precautions to be taken while investing in equity market. h. How to protect against market volatility

187
4. Company Analysis
a. How to find out real worthiness of a company. b. Choosing the right stock. c. How to know whether a company is good or not
from investment purposes. d. How to study a Balance Sheet. e. Z-category companies. f. How to evaluate a company’s performance. g. How to recognize fraudulent companies.
5. Book Building Procedures and Mechanisms
a. Information about book-building. b. Various aspects of book building and dangers to public.
6. Bonds
a. Difference between private and govt. bonds. b. Interest rate risk c. Credit rating d. Evaluating bond investment e. Role of Trustees
7. Mutual Funds
a. Functioning of mutual funds. b. Types of schemes c. Sources of grievance redressal of small investors with
regard to mutual fund schemes. d. Difference between mutual funds and shares. e. Assured/guaranteed returns. f. Risks associated with MFs.
8. Grievance Redressal Mechanisms
a. Sources where to file grievances in case of non-payment of bonds/debentures. as per terms of bonds/debentures.
b. Types of Investor Grievances in the case of bonds c. Protection to Investors under SCRA and SEBI Act. d. Investor Grievance laws.

188
9. Demat Procedures
a. NSDL, CDSL and DPs. b. Depository services. c. How to open demat account d. Share Transfer. e. Benefits of demat. f. Cost of demat services
10. Hedging and derivatives
a. What are Derivatives b. What are futures c. What are options d. Different types of options e. Different types of futures f. Trading of futures and options g. What is Hedging h. Mark-to-market margins
11. Delisted Companies
a. Why are companies delisted? b. Sources from where to get information regarding shares
which are no longer traded at certain stock exchanges. c. Remedies against delisted companies
12. Understanding of Investment related Tools
a. Ratio’s b. B/S analysis c. Investment related terms d. Financial analysis of securities e. Risk Management Analysis f. P/E Ratio g. EPS h. Dividend Yield i. Circuit Breakers
13. Net Trading
a. How to trade on net

189
14. Market’s Behaviour
a. How to determine optimum time of buying and selling b. Market fluctuations c. Analysis of price movement d. When to exit and when to enter the stock market e. Warning signals to investors in case of a volatile market
15. Insider Trading
a. How to be aware of insider trading
16. T+1
a. What is T+1
17. Buyback
a. What is share buyback
18. Portfolio management
a. Principles of diversification b. How should retail investors go about
portfolio management

190
Chapter 10
WRAP-UP OF STUDY
10.1 The study is based on a massive amount of primary data
specially collected for the purpose of creating a deeper
understanding of the household investors’ problems, needs and
changing investment preferences, specially with regard to capital
market instruments.
10.2 The major strands of our analysis may now be brought together
in order to derive a broad picture about the emerging situation
and its implications for policymaking and regulation.
10.3 Special attention has been given to bring out the concerns of
investors by using a variety of questions. The three most
important and persistent worries of household investors have
been identified as (a) too much volatility of stock market
prices, (b) too much price manipulation and (c) deficient
corporate governance.
10.4 Our analysis suggests that measures adopted often tend to be
inadequate, specially because no long-term view is taken or the
attempt is simply to prevent an immediate market crisis.
Averting a crisis is, of course, important but market crisis is an
extreme event. It is rare in well-developed markets but was
recurrent in India and made the Indian market notorious.
10.5 From investor protection viewpoint, we need to progress towards
a more positive approach than mere crisis prevention. The aim
should be to ensure greater orderliness in the working of the
stock market and to assure all investors at all times that they
shall get a fair deal and shall be protected against

191
malpractices and frauds. Only then they can be expected to
invest more of their saving in capital market instruments.
10.6 An example of a serious unfair practice, which borders on fraud
and has adversely affected lakhs of retail investors, is the delisting
of companies without ensuring the protection of interests of the
outside shareholders vis-à-vis the company managements. By first
allowing a company to be listed, it was enabled to collect money
from many outside investors. Delisting means that the management
can almost walk away with that money or fritter it away with no
checks. Since the persons responsible for creating a situation
leading to delisting are hardly ever punished, there has been no
effective deterrent.
10.7 It seems to us that limiting the regulatory objective to the
prevention of market crisis is not enough for ensuring proper
investor protection. Such protection has been recognized as a
very important objective in itself. More active and direct pursuit
of investor protection objective is necessary. Of course, protection
of investors can be only against market malpractices and fraud, not
against loss due to for investors’ own miscalculation and greed, or
the market’s ups and downs due to economic reasons.
10.8 The respondents’ feed-back to our questions on corporate
governance indicates that their trust in corporate managements and
auditors is quite weak. This is also indicated by the negligible
percentage of the households’ annual financial savings going into
shares and bonds, as per RBI data.
10.9 Corporate governance of the family-controlled listed companies
is a thorny problem. The top management of a company, which has
no controlling group, can be dismissed and replaced if a dominant

192
group of outside shareholders (such as institutional shareholders)
so demand. In contrast, even the combined might of institutional
shareholders cannot dislodge a controlling group, so long as the
group holds majority of voting power.
10.10 In this context, we should remember that the institutional
shareholders are trustees for millions of small investors who need
to be protected. For furthering such protection, the institutions
should be enabled to play a countervailing role to check self-
serving practices of controlling groups. There is no doubt that
corporate governance standard need to be considerably raised
in most of the listed companies. The need is recognised but a
practical or workable remedy is yet to be found. Although a
code of corporate governance has been prescribed by SEBI,
tangible results from the investor’s viewpoint have yet to be
achieved.
10.11 According the OECD’s White Paper on Corporate Governance in
Asia, the non-controlling shareholders need to be protected
from exploitation by the controlling shareholders. The paper
identified this problem “as the most serious corporate-governance
challenge” in the Asian region, which includes India.
10.12 We suggest the adoption of a formal device in the form of an
Institutional Shareholders Council. If business houses have
associations / federations to represent their interests, the
institutional shareholders, in their capacity as shareholders of
companies and as trustees for millions of small shareholders,
should also establish a consultative mechanism for jointly
evolving the institutional shareholders’ policies in cases of
companies having governance problems. Such a Council can be
a channel of communication between institutional shareholders,

193
businessmen’s federations and governmental authorities on matters
affecting institutional shareholders. It will help to crystallise
thinking on corporate governance reform in the specific Indian
context.
10.13 Examination of the household’s investment preferences is a major
part of this study. Much of our analysis has been devoted to a
comparison between shares vs mutual fund products. Investment
in mutual fund products was found to enjoy a relatively low
preference compared to direct share investment. The result is a
stunted growth of the mutual fund industry in India. A
comprehensive review of all aspects of the mutual fund industry,
including its management structure, practices and regulation, is
needed in order to work out a long-term role and perspective for
this industry.
10.14 A significant finding of this study is that, contrary to popular
belief, a majority of household investors in the stock market
are long-term oriented investors rather than short-term
speculators. This is clearly indicated by our examination of the
investment strategies being followed at the individual investor-
level. This is a very healthy feature and should be encouraged by
the policymakers and regulators.
10.15 While top-level economic policies (like exemption to long-term
capital gains) are intended to promote long-term shareholding,
some of the operational systems of the stock market, such as the
system of depository charges, have the effect of discouraging
small long-term shareholders. The data collected by us revealed
that a majority of shareholders of many leading companies in
India have remained outside the depository system because
of high burden of depository charges on small long-term
shareholders. The total number of depository accounts at the end

194
of December 2004 was only around 70 lakh. This is less than
one-half of the estimated total number of shareholders in India.
This shows that the depository system in India has failed to cater
to the needs of a majority of small investors. Some attempt is
being made to rectify the situation but the results are not yet
clear.
10.16 The demat system has undoubtedly helped immensely in solving
certain irritating problems, such as shares stolen or lost in transit
and delays in registering share transfers. However, making it
compulsory in haste without fully taking into account the
problems of small long-term shareholders, specially those in
mofussit places, has adversely affected the growth of shareowning
population.
10.17 The demat system, despite its technical virtuosity, has not at
all helped in stimulating the growth of shareowning
population. On the contrary, it has reduced the size of
shareowning population by squeezing out the small long-term
shareholders from the equity market. The demat system is
extremely attractive to speculators, frequent traders and large
investors but very burdensome and uneconomical for small long-
term investors, who have been complaining about this.
10.18 For the first time in India, detailed data has been collected from
household investors about their share portfolio practices. The
study has thrown up are many interesting findings in this regard. It
was found that the most typical extent of share portfolio
diversification by retail investors was “narrow diversification” in
the range of portfolios of 3-10 companies. Nearly 50% of
households in almost all income-classes and age-classes had such
narrow diversification. The study draws attention to certain

195
important practical advantages of such narrow diversification.
This strategy is worth popularizing.
10.19 The study draws attention to the emerging phenomenon of what
we call “maturing of retail investors” in India. The bulk of the
present generation of Indian retail investors got their exposure to
the vicissitudes of the equity market during the last 15 years,
specially the 1990s. They have gone through many boom-bust
market cycles and also witnessed the many incidents of market
frauds and manipulative practices. While some of them became so
disgusted that they vowed never to touch the stock market again,
most others were less cynical and felt that it was a learning
experience. They became wiser, more sophisticated and discerning
investors. Interestingly, as brought out by our data, the bulk of
the present shareowning population in India has been
shareowners for 10 years or more.
10.20 There has been a great improvement recently in the general public
perception about capital market regulation in India. This is clearly
reflected in the responses to our questionnaire. The findings are
presented in Table 10.1. The market’s regulation was regarded as
good or excellent by 57% of the total sample of respondents.
About one-third of the respondents rated the regulator as poor or
very poor.
10.21 Table 10.1 also shows analysis by income and age classes. The
results of income class analysis are in line with the over-all
results.
10.22 Analysis by age-classes revealed an interesting difference between
the young and the old. It showed that somewhat over 60 % of the
younger respondents upto 30 years of age regarded capital market

196
regulator as good or excellent but the percentage was only a little
above 50% in the case of older generation of respondents above 60
years of age. This may be because of earlier bad experiences,
almost throughout the 1990s and upto 2001 which witnessed the
Ketan Parekh - led stock market scam, the crisis in the UTI’s US-
64 Scheme and the appointment of the Joint Parliamentary
Committee (II) to investigate the market irregularities. The
market’s regulatory system has been considerably streamlined
since then. Those entering the stock market in recent years seem to
be fairly satisfied.
10.23 At the same time, it is also true that shareowning households in
India are no more than 4-5 percent of total households. This
percentage has been stagnant for nearly a decade. Strengthening of
investor protection can help to stimulate the savings flow to the
capital market. Share trading volumes have been booming in India
but very negligible proportion of household financial saving is
flowing into share investment. There is much to be done to
increase this flow in order to facilitate more rapid and broad-based
growth of corporate enterprises in India.

197
Table 10.1
HOUSEHOLD INVESTORS’ OVERALL PERCEPTIONS ABOUT REGULATION OF CAPITAL MARKET IN INDIA
Household Investors Survey - 2004
A. Income-classwise Analysis
Household income class (Rs. per month)
Opinion
All classes of sample households
Upto 10,000
10,001– 15,000
15,001– 20,000
20,001- 25,000
Over 25,000
Percent of households column-wise
1. Excellent
3.14 4.30 3.05 3.17 2.34 2.13
2. Good
54.22 51.83 56.80 55.84 53.99 53.07
3. Poor
28.85 26.99 26.91 28.96 29.89 32.98
4. Very poor
5.49 5.63 5.43 5.34 4.82 5.96
5. Can’t say
8.30 11.25 7.81 6.70 8.95 5.87
Column total 100.00 100.00 100.00 100.00 100.00 100.00
No. of respondents
5,883
1,582
1,345
1,105
726
1,125
B. Age-classwise Analysis
Age of household head in years
Opinion
All classes of sample households
Upto 25
26-30 31-40 41-50 51-60 61-65 66-70 71 and above
Percent of households column-wise
1 Excellent
3.14 3.60 4.06 3.24 3.02 2.84 1.82 3.73 2.02
2 Good
54.22 60.15 57.62 55.50 52.63 52.63 49.45 49.25 48.48
3 Poor
28.85 21.08 25.87 28.00 30.45 30.57 33.82 33.58 30.30
4 Very poor
5.49 3.86 4.48 4.65 7.31 5.78 4.36 3.73 7.07
5 Can’t say
8.30 11.31 7.97 8.62 6.59 8.19 10.55 9.70 12.12
Column total 100.00 100.0 100.00 100.00 100.00 100.00 100.00 100.00 100.00
No. of respondents
5,883*
389
715
1,636
1,655
952
275
134
99 *Out of total sample respondents, a few did not provide information on their age. They have
therefore, not been included in the individual age-classes but are included in the total sample.