indian investments in africa: scale, trends, and policy ... · indian companies are motivated...
TRANSCRIPT

FEBRUARY 2018
Indian Investments in Africa: Scale, Trends, and Policy
Recommendations
MALANCHA CHAKRABARTY

Indian Investments in Africa: Scale, Trends, and Policy
Recommendations
MALANCHA CHAKRABARTY

ABOUT THE AUTHOR
Malancha Chakrabarty is an Associate Fellow at the Observer Research
Foundation, New Delhi. She holds a PhD in Economics from the Centre for
Economic Studies and Planning, Jawaharlal Nehru University. She
researches on the impact of China and India on Africa’s development
process.
© 2018 Observer Research Foundation. All rights reserved. No part of this publication may be reproduced or transmitted in any form or by any means without permission in writing from ORF.
ISBN : 978-93-87407-71-8

Indian Investments in Africa: Scale, Trends, and Policy
Recommendations
ABSTRACT
Indian investments in Africa, from both public and private sector
entities, have increased considerably in the last decade. Yet despite the
growing importance of Indian investments in Africa, only a few
empirical studies have been carried out on the subject. This paper
undertakes a disaggregated analysis of Indian foreign direct investment
outflows to Africa from 2008 to 2016, and presents three main findings.
First, it confirms earlier analyses that the bulk of Indian investments in
Africa are directed to Mauritius, a tax haven. Second, energy security is
the main pull factor behind public-sector investment in Africa. Third,
the Indian private sector has also invested in a range of non-energy
sectors, including manufacturing. This paper also finds, however, that
the correlation between India’s development cooperative initiatives and
its investments in Africa is currently weak. It recommends the
establishment of an institutional vehicle to promote development-
friendly Indian investments in Africa.
1ORF OCCASIONAL PAPER # 142 FEBRUARY 2018
INTRODUCTION
Historically, the foundations of India’s relations with Africa were built
upon movements against colonialism and racial discrimination. India
also supported development initiatives in African countries under the
banner of South-South Cooperation. But trade and investment relations
between India and Africa were limited during the 1960s and ‘70s. There
were large Indian companies that invested in East African countries
even in the 1960s when domestic policies were highly restrictive in
releasing the foreign exchange necessary for domestic companies to
invest abroad. The Birla Group, for example, was the first Indian
company to invest in Ethiopia in 1956. In 1969, the Birla Group also
entered into a joint venture, Pan-Paper, with the Kenyan government
and the World Bank. However, investments in that era were typically led
by a handful of large Indian firms and were smaller in magnitude
compared to contemporary flows. Most studies suggest that the
domestic companies that ventured abroad during this period did so to
either defend the market for their export products or to avoid the anti-1monopoly legislation’s restrictions on their domestic activities.
Indian investments in Africa have increased remarkably in the last two
decades. This growth can be traced to a number of developments in both
sides. First, as a capital-scarce country with limited foreign-exchange
resources, India was highly restrictive in releasing the foreign exchange
necessary for Indian firms to invest abroad. With the economic reforms
of the 1990s, the rules and procedures for outward investments were
gradually liberalised. By 2003, the overall investment ceiling on outward
Indian investment had been abolished and Indian companies were
practically free to invest abroad. Second, with higher growth rates,
India’s energy requirements also increased dramatically, putting energy
security concerns at the centrestage of India’s foreign-policy discourse.
Diversification of energy suppliers and investment in oil and gas 2ventures overseas became important objectives of India’s foreign policy.
2 ORF OCCASIONAL PAPER # 142 FEBRUARY 2018
INDIAN INVESTMENTS IN AFRICA: SCALE, TRENDS, AND POLICY RECOMMENDATIONS

To facilitate the acquisition of energy assets abroad, the Oil and Natural
Gas Corporation-Videsh Limited (OVL) was established in 1996.
Significant changes took place within Africa as well. Once described
as a “hopeless continent”, Africa entered a phase of high growth in the
2000s. Sub-Saharan Africa’s gross domestic product (GDP) in constant
2010 prices grew at six percent per annum from 2000 to 2010 as
compared to two percent and one percent, respectively, in the two
preceding decades (Figure 1). Several African countries such as Ethiopia,
Kenya, Rwanda, Democratic Republic of Congo, and Angola experienced
an economic turnaround in the 2000s. The African continent emerged
as an attractive investment destination on account of the high rate of
growth experienced by many countries, the growth of a middle-class, as
well as resource abundance, particularly in energy. In 2016, Africa 3received FDI inflows worth US$ 54.1 billion. Its importance in the
Figure 1: Sub-Saharan Africa’s GDP (in constant 2010 US$ million) from 1960 to 2015
3ORF OCCASIONAL PAPER # 142 FEBRUARY 2018
Source: World Development Indicators, http://data.worldbank.org/data-catalog/world-development-indicators
INDIAN INVESTMENTS IN AFRICA: SCALE, TRENDS, AND POLICY RECOMMENDATIONS

world energy market grew as instability in the Gulf region prompted
many countries to turn to Africa. Moreover, technological advances
made it easier to extract Africa’s offshore oil reserves, and because
African crude is lighter, sweeter, and lower in sulphur content, it was 4
cheaper to refine than crude from the middle-east.
As shown in Figure 2, after a long period of stagnation, foreign direct
investment flows to Africa increased rapidly beginning in the mid-
2000s. China emerged as one of the most important sources of FDI flows
to Africa during this period, with its FDI stock increasing almost
threefold between 2010 and 2015. The country is currently the fourth
largest investor in Africa after the United States, United Kingdom, and 5
France. However, China is by no means the only developing country
which has increased its economic footprint in Africa. FDI flows from
other emerging countries such as Malaysia, Brazil, and India have also
4 ORF OCCASIONAL PAPER # 142 FEBRUARY 2018
INDIAN INVESTMENTS IN AFRICA: SCALE, TRENDS, AND POLICY RECOMMENDATIONS
Source: UNCTADSTAT, http://unctadstat.unctad.org/wds/ReportFolders/reportFolders.aspx?sCS_ChosenLang=en
Figure 2: Foreign direct inflows to Africa from 1980 to 2016
(in US$ million)
grown significantly. According to the World Investment Report 2017, 6India was the seventh largest investor in Africa in 2015. Both public and
private sector companies of India have made significant inroads in
Africa. For instance, OVL is one of the most active Indian companies in
Africa. Meanwhile, private corporations like Reliance, Varun Beverages,
Bharti Airtel, Essar Group, and the TATA Group have also made huge
investments in many African countries. In addition, there are a
multitude of small and medium Indian enterprises operating in Africa.
The remarkable growth of Indian investments in Africa has caught
widespread attention and it has become quite common to read
newspaper headlines such as “Africa is the next big frontier for Indian
companies”, “A marriage made in heaven? Indian companies in Africa”,
and “India’s investment in Africa: Feeding up an ambitious elephant”.
But the subject of Indian investments in Africa has not been accorded
enough scholarly scrutiny. There are only a few empirical studies on the
subject, and these, at best, provide an overview. Some of these studies
focus only on Indian investments in the energy sector. CII/WTO (2013)
was one of the earliest studies on India-Africa trade and investment
relations but it is outdated as it mainly relies on Indian overseas
investment data from the Ministry of Finance up to 2008-09 although it 7
lists “big ticket” Indian investments up to 2012. Prahalathan et al
(2014), for their part, provide a comprehensive analysis of Indian 8overseas direct investment to all regions and sectors. Meanwhile, Sinate
et al (2013) provide a detailed account of Indian investments in West 9African countries, Alden and Verma (2015) focus on Indian
10investments in Africa’s resource and infrastructure sector, and Lucey et
al (2015) underscore the importance of the private sector in furthering 11India-Africa relations using investment figures for only up to 2008-09.
There are wide variations in the reported investment figures in many
of these studies. For instance, the total value of Indian investments in
Africa is unclear from the literature, with the International Monetary
5ORF OCCASIONAL PAPER # 142 FEBRUARY 2018
INDIAN INVESTMENTS IN AFRICA: SCALE, TRENDS, AND POLICY RECOMMENDATIONS
6
Fund (IMF) putting the total stock value at US$ 14.1 billion in 2011 12
while others peg it at over US$ 35 billion. Thus, an updated,
disaggregated study of Indian investments in Africa across all sectors is
missing. The objective of this study is to fill this critical research gap by
analysing firm-level data on Indian overseas investments to African
countries across all sectors. Section II of the paper studies the
relationship between Indian private sector investments and India’s
development cooperation initiatives in Africa and highlights the need
for better coordination between India’s commercial interests and its
development cooperation. Section III concludes. Appendix A and B give
details of Indian FDI flows to major African countries.
The data sources for the study are as follows. Data on FDI outflows
by Indian firms to African countries from 2008 to 2016 were obtained
from the Reserve Bank of India’s FDI database (https://www.rbi.org.in/
scripts/BS_PressReleaseDisplay.aspx?prid=40189). Data on India’s
lines of credit to African countries were obtained from EXIM Bank
(https://www.eximbankindia.in/lines-of-credit-GOILOC.aspx ).
Mauritius: the Most Favoured Destination for Indian investments
The total Indian foreign direct investment (FDI) outflows from India to
the world from 2008 to 2016 are estimated at US$ 250.9 billion.
Receiving investments of US$ 52.6 billion, the African continent
accounted for about 21 percent of the total Indian investment outflows
during that period (Figure 3). Indian FDI outflows to Africa grew from
US$ 3.2 billion in 2008 to US$ 4.9 billion in 2016 (Figure 4). As is clear
from the figure, there are two peaks in the graph—in 2010 and 2014.
There was a fivefold increase in FDI outflows to Mauritius from US$ 2.7
billion in 2009 to US$ 11.6 billion in 2010. The peak in 2014 was due to
I. INDIAN INVESTMENTS IN AFRICA: KEY STYLISED FACTS
ORF OCCASIONAL PAPER # 142 FEBRUARY 2018
INDIAN INVESTMENTS IN AFRICA: SCALE, TRENDS, AND POLICY RECOMMENDATIONS

7ORF OCCASIONAL PAPER # 142 FEBRUARY 2018
Figure 4: Indian FDI outflows to Africa, 2008 to 2016 (in US$ billion)
Source: Author’s estimates from Reserve Bank of India Database
INDIAN INVESTMENTS IN AFRICA: SCALE, TRENDS, AND POLICY RECOMMENDATIONS
Figure 3: Share of Africa in total Indian ODI flows (2008-2016)
Source: Author’s estimates based on RBI data on Indian ODI

8
OVL’s investment in Mozambique’s oil and gas sector (which will be
discussed further in latter sections of this paper).
India’s FDI flows to Africa are concentrated in Mauritius, which
accounts for about 19 percent of Indian FDI flows to the world (Figure
3). From 2008 to 2016, Indian FDI outflows to Mauritius totalled US$
47.6 billion. Only US$ 5 billion went to the rest of Africa which
represents only two percent of global Indian FDI and 9.6 percent of
Indian FDI flows to Africa. Here, it is important to note that Mauritius is
also the largest source of inward FDI for India. Between 2000 and 2015,
Mauritius accounted for about one-third of all inflows of investment to
India. A large share of Indian FDI to Mauritius is ‘round-tripped’ back to
India due to its tax haven status facilitated by the double taxation
avoidance agreement with India signed in 1983. The treaty was re-
negotiated in 2016 but investors will pay taxes on short-term capital
gains at the full rate only after April 2019. Therefore, results of this
paper are not affected by the latest changes in the treaty. Although
Mauritius also serves as a gateway to Indian investment in other
countries, it is not possible to disaggregate the FDI data published by the
RBI to find out the volume of Indian FDI outflows that are routed to
other African countries via Mauritius. Therefore, for an accurate picture
of Indian investments in Africa, Mauritius has been excluded from the
analysis in the rest of the paper.
Dominance of a few large Indian firms in Africa
Although 597 Indian companies invested in Africa over 2008-2016,
totalling US$ 5 billion, the top 11 companies account for about 80
percent of the total Indian investment flows to Africa. Indian outward
investment to Africa is thus heavily concentrated within a few large
firms. OVL occupies the top spot with investments worth US$ 3,019.1
million (59.8 percent) followed by Gujarat State Petroleum Corporation
(6.3 percent), Interlabels Industries (2.4 percent), Oil India Limited (2.1
ORF OCCASIONAL PAPER # 142 FEBRUARY 2018
INDIAN INVESTMENTS IN AFRICA: SCALE, TRENDS, AND POLICY RECOMMENDATIONS

9ORF OCCASIONAL PAPER # 142 FEBRUARY 2018
Aut
hor’
s es
tim
ates
fro
m R
eser
ve B
ank
of I
ndi
a D
ata
Not
e: F
igur
es f
or I
ndi
an in
vest
men
t in
Mau
riti
us e
xclu
ded
INDIAN INVESTMENTS IN AFRICA: SCALE, TRENDS, AND POLICY RECOMMENDATIONS
Fig
ure
5: M
ajo
r In
dia
n in
vest
ors
in A
fric
a fr
om
20
08
to
20
16

10
percent), and Coromandel (1.9 percent)—at US$ 319.7 million, US$
121.4 million, US$ 105.4 million, and US$ 97.5 million, respectively
(Figure 5). Further, most of these large Indian firms have not expanded
across the continent and their investments are concentrated in a few
countries. Table 1 shows that with the exception of OVL and the TATA
Group (TATA Power, TATA Intl, TATA Steel) which has investments in
many African countries—Congo, Egypt, Ivory Coast, Libya,
Mozambique, and Sudan—all the major Indian companies have
established their presence in only one or two African countries. This
confirms Prahalathan’s assertion that overseas investment activities of
Indian companies are motivated essentially by a set of firm-specific 13
objectives.
ORF OCCASIONAL PAPER # 142 FEBRUARY 2018
INDIAN INVESTMENTS IN AFRICA: SCALE, TRENDS, AND POLICY RECOMMENDATIONS
Source: Author’s own from RBI data
Table 1: Geographical spread of major Indian companies in Africa
Company Name African countries where it has presence
ONGC Videsh Congo, Egypt, Ivory Coast, Libya, Mozambique and Sudan
Gujarat State Petroleum EgyptCorporation
Interlabels Industries Kenya
Oil India Limited Gabon, Libya, Nigeria
Coromandel Tunisia
Indian hotels Company South Africa
Gujarat State Fertiliser TunisiaCorporation
Varun Beverages Morocco
Tata steel South Africa
Tata International South Africa
Tata Power Zambia
11ORF OCCASIONAL PAPER # 142 FEBRUARY 2018
High levels of geographic concentration of Indian investments
in Africa
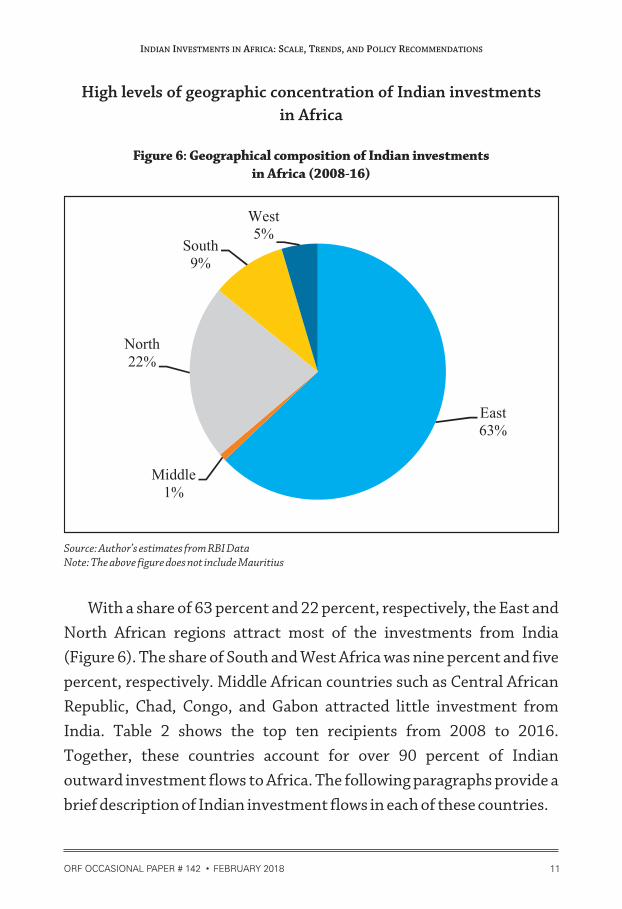
Figure 6: Geographical composition of Indian investments in Africa (2008-16)
Source: Author’s estimates from RBI DataNote: The above figure does not include Mauritius
With a share of 63 percent and 22 percent, respectively, the East and
North African regions attract most of the investments from India
(Figure 6). The share of South and West Africa was nine percent and five
percent, respectively. Middle African countries such as Central African
Republic, Chad, Congo, and Gabon attracted little investment from
India. Table 2 shows the top ten recipients from 2008 to 2016.
Together, these countries account for over 90 percent of Indian
outward investment flows to Africa. The following paragraphs provide a
brief description of Indian investment flows in each of these countries.
INDIAN INVESTMENTS IN AFRICA: SCALE, TRENDS, AND POLICY RECOMMENDATIONS

12
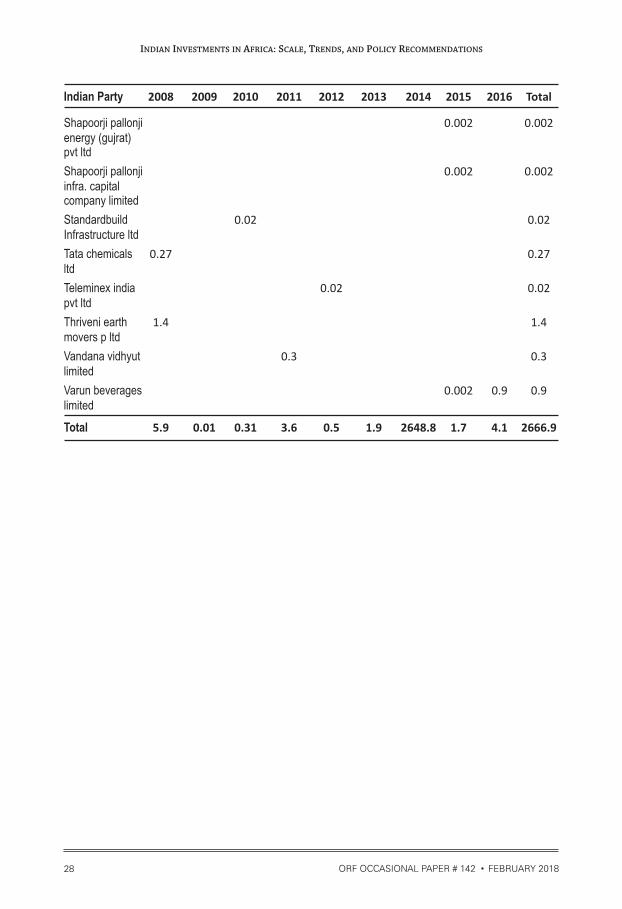
Mozambique
As mentioned earlier, if Mauritius is disregarded, then Mozambique
emerges as the leading destination for Indian FDI in Africa with a share
of about 52.9 percent. The total value of Indian FDI outflows to
Mozambique from 2008 to 2016 was US$ 2.6 billion. But its top position
is accounted for by one very large investment by Indian state-owned
company, OVL, which represents nearly 99 percent of Indian FDI in
Mozambique. In 2014, OVL purchased a 10-percent participating
interest in Area 1 of Rovuma gas field, which is estimated to hold about
70 trillion cubic feet of gas, for a price of US$ 2.6 billion. Area 1 is
strategically located to supply LNG to the Indian market. A final
investment decision on the Mozambique LNG project is expected
between April and June 2018 and the project is likely to commence 14 operations in 2022-23, after a four-year construction period. Coal
ORF OCCASIONAL PAPER # 142 FEBRUARY 2018
INDIAN INVESTMENTS IN AFRICA: SCALE, TRENDS, AND POLICY RECOMMENDATIONS
Table 2: Top ten African destinations for Indian overseas
direct investment (2008-16), in million US$
2008 2009 2010 2011 2012 2013 2014 2015 2016 Total Share Main sectors (%) in which India
has invested
Mozambique 5.9 0.0 0.3 3.6 0.5 1.9 2,648.8 1.7 4.1 2,666.9 52.9 Oil and gas, coal
Egypt 423.8 7.5 13.5 24.0 62.7 40.8 14.4 9.3 6.8 602.9 12.0 Oil and gas, solar, pharma
South Africa 29.0 84.7 29.5 23.6 137.0 18.9 27.6 63.9 28.3 442.5 8.8 Hotels, Steel,I.T., and FMCG
Tunisia 108.2 82.3 190.4 3.8 Manufacturing
Kenya 124.4 0.8 0.6 1.3 5.9 4.6 6.2 1.7 9.0 154.6 3.1 Manufacturing
Zambia 0.1 0.6 0.9 2.0 4.1 6.7 13.6 88.1 29.4 145.3 2.9 Manufacturing
Libya 24.5 12.9 52.5 3.5 0.6 27.4 7.4 0.1 128.8 2.6 Oil and gas
Ethiopia 1.0 3.5 3.0 4.1 2.8 4.0 42.7 14.1 21.1 96.4 1.9 Manufacturing
Morocco 2.5 1.1 38.0 4.9 5.8 10.7 13.7 19.4 96.1 1.9 Manufacturing
Sudan 55.5 16.2 13.9 0.0 0.0 0.0 85.7 1.7 Oil and gas
Sub Total 666.6 127.4 114.2 100.1 218.5 218.3 2,771.4 192.6 200.4 4,609.5 - -
All Africa* 731.5 198.7 165.7 145.6 259.3 266.8 2,828.7 224.1 220.1 5,040.5 - -
Share 91% 64% 69% 69% 84% 82% 98% 86% 91% 91% - -
Source: Author’s estimates from Reserve Bank of India’s Database*Excluding Mauritius

13ORF OCCASIONAL PAPER # 142 FEBRUARY 2018
India Limited, an Indian public-sector company, is another active Indian
company in Mozambique. Most of the investments by Coal India in
Mozambique are routed through Coal India Africana Limitada (CIAL), a
wholly owned subsidiary of Coal India. Between 2008 and 2016, CIAL
invested about US$ 5.1 million in Mozambique. Thus, almost all of
Indian investment in Mozambique is concentrated in the energy sector.
However, not all Indian investments in the energy sector have been
equally successful. CIAL, for example, had to ultimately surrender its
coal blocks after failing to find any commercially viable reserves in the 15
blocks it was allocated in 2009. Apart from OVL and CIAL, there are
only about 26 other Indian companies that have invested in
Mozambique, with the value of their investments at less than US$ 5
million each.
Egypt
With a share of 12 percent, Egypt is the second largest destination for
Indian investments in Africa. Indian FDI outflows to Egypt from 2008 to
2016 were valued at US$ 602.9 million. Like Mozambique, most of the
Indian investments in the country are concentrated in the energy sector.
Gujarat State Petroleum Corporation (GSPC) and OVL are the two
largest Indian companies in Egypt. The Gujarat government-supported
company, GSPC, has invested about US$ 319.7 million in Egypt’s oil and
gas sector. However, most of its investments in Egypt failed because the
blocks were found to be commercially unviable and five of the total six 16
were surrendered. In 2008, OVL invested US$ 227.5 million in Egypt.
Indian investments in Egypt’s energy sector are not only limited to
the oil and gas sector. Indian private sector company Shapoorji Pallonji
Capital Company Ltd. invested US$ 6.8 million in a 50MW solar power
plant in Egypt. There are other Indian companies that have invested
small amounts in the manufacturing sector. For instance, Dhunseri
Petrochem and Tea Ltd. has invested US$ 33.2 million in a downstream
INDIAN INVESTMENTS IN AFRICA: SCALE, TRENDS, AND POLICY RECOMMENDATIONS

14
petrochemicals facility. Pharmaceuticals are another important sector
for Indian private sector companies. Between 2008 and 2011, Glenmark
Pharma invested some US$ 7.6 million in Egypt.
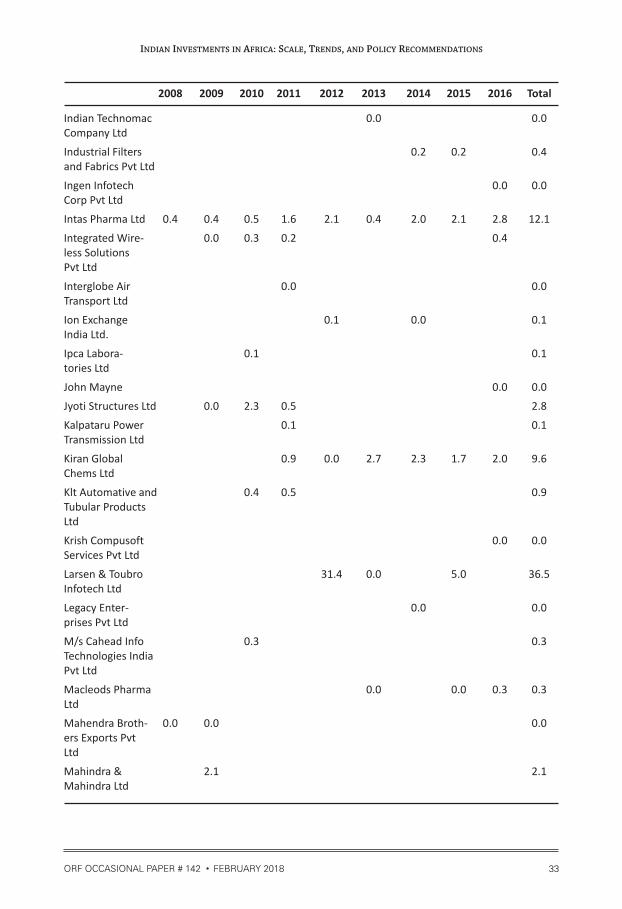
South Africa
About 119 Indian companies have invested US$ 442.5 million in the
South African market between 2008 and 2016, accounting for 8.8
percent of Indian investments in Africa. Unlike Mozambique and Egypt,
Indian investments in South Africa are neither led by state-owned
enterprises nor concentrated in the energy sector. The TATA Group is
one of the most active Indian companies in South Africa. TATA
International and TATA Steel have invested US$ 63 million and US$
65.3 million, respectively. The TATA Group’s hospitality arm, Indian
Hotels, has invested a total of US$ 93.8 million in South Africa. Larsen
and Toubro Infotech, the sixth largest Indian IT services player globally,
invested US$ 36.5 million between 2008 and 2011. Marico Industries, a
fast-moving consumer goods (FMCG) company entered the South
African market by acquiring South African brands such as Caivil and
Black Chic. Its total investments in South Africa between 2008 and 2011
were to the tune of US$ 34.3 million.
Tunisia
The total value of India’s FDI outflows to Tunisia between 2008 and
2016 is estimated at US$ 190.4 million (Table 2). The country accounts
for about 3.8 percent of India’s total investments in Africa during the
same period. Two Indian fertiliser companies, Coromandel
International and Gujarat State Fertilizers and Chemicals (GSFC),
account for over 99 percent of Indian investments in Tunisia. GSFC and
Coromandel International formed a joint venture, Tunisian Indian
Fertilizers (TIFERT), with Tunisian state-owned Groupe Chimique
Tunisien (GCT) and Compagnie Des Phosphates De Gafsa (CPG).
ORF OCCASIONAL PAPER # 142 FEBRUARY 2018
INDIAN INVESTMENTS IN AFRICA: SCALE, TRENDS, AND POLICY RECOMMENDATIONS

15ORF OCCASIONAL PAPER # 142 FEBRUARY 2018
Together, Coromandel International and GSFC, have invested US$
190.4 million in a phosphoric acid plant in order to secure an
uninterrupted supply of phosphoric acid which is critical for their India
operations. TIFERT’s plant which started its operations in 2013 will use
around 1.4 million tonnes of Tunisian rock phosphate per year, 17 producing 360,000 tonnes of phosphoric acid annually. These
investments have resulted in an uninterrupted supply of phosphoric
acid to India which is key to the production of phosphates, an essential
agricultural input. India currently accounts for over 50 percent of 18Tunisia’s global phosphoric acid exports.
Kenya
Total investments by Indian companies in Kenya (the earliest home to
Indian investments) from 2008 to 2016 are estimated at US$ 154.6
million and the country accounts for about 3.1 percent of Indian
investments to Africa during the same period (Table 2). Indian private
sector company Interlabels Industries, which manufactures self-
adhesive labels and labelling solutions, is the largest investor in Kenya
with a share of 79 percent in total Indian investments in Kenya. It is
interesting to note that between 2008 and 2016, 82 Indian companies
invested in Kenya, and out of those, 80 invested less than US$ 10
million. Also, most of these investments were directed to the
manufacturing sector. This can be explained largely by the fact that
Kenyans of Indian origin are an important segment in the country and
act as a strong pull factor for Indian investments there.
Zambia
Between 2008 and 2017, Indian companies invested a total of US$ 145.3
million in Zambia (Table 2). Although there are a few studies that have
focused on Indian investments in Zambia’s agriculture sector, this study
finds that Indian private sector’s presence in sectors such as
INDIAN INVESTMENTS IN AFRICA: SCALE, TRENDS, AND POLICY RECOMMENDATIONS

16
manufacturing, construction, and finance, insurance and banking is
much more important. Together, the top five Indian companies in
Zambia—TATA Power (33.6%), Varun Beverages (18.7%), PLR Projects
(8.6%), Chetak Enterprises (6.3%), and Manjeet Cotton Private Limited
(5.6%)—account for about 73 percent of Indian investment in Zambia.
TATA Power owns 50 percent shares in the joint venture Itezhi Tezhi
Power Corporation, with Zambian utility ZESCO. The 120 MW Itezhi
Tezhi power plant, which is being built under the Build-Own-Operate-
Transfer model, is expected to play a key role in addressing Zambia’s
massive power shortage. Varun Beverages, the second largest bottler of
PepsiCo. Beverages, invested US$ 27.2 million through its wholly owned
subsidiary, Varun Beverages Zambia Limited. PLR Projects is another
prominent Indian private-sector company that has invested US$ 12.5
million in Zambia’s construction sector. Another prominent player in
the construction sector is Chetak Enterprises which has invested US$
9.2 million. Indian public-sector banks have played an important role in
Zambia’s banking sector. In 2015, three Indian public-sector banks
invested in Zambia: Bank of Baroda, Bank of India, and Central Bank of
India.
Libya
Indian investments in Libya are entirely directed to the energy sector.
Three Indian public-sector enterprises–Oil India, OVL, and Indian Oil
Corporation—have invested US$ 65.9 million, US$ 51.4 million, and
US$ 10.3 million in Libya, respectively, and together account for about
99 percent of Indian investments in Libya.
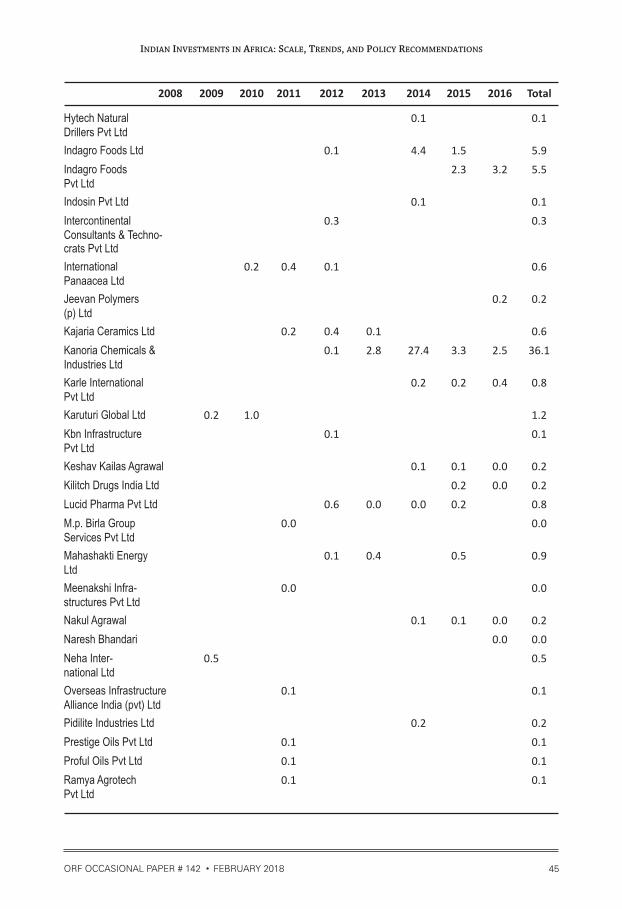
Ethiopia
Between 2008 and 2016, about 64 Indian companies invested a total of
US$ 96.4 million in Ethiopia. Unlike in other countries such as
ORF OCCASIONAL PAPER # 142 FEBRUARY 2018
INDIAN INVESTMENTS IN AFRICA: SCALE, TRENDS, AND POLICY RECOMMENDATIONS

Mozambique, Zambia, and Libya, about 92 percent of Indian
investments in Ethiopia is channelled to the manufacturing sector.
Kanoria Africa Textiles, a wholly owned subsidiary of Kanoria Chemicals
and Industries, has set up a denim unit near Addis Ababa with an
investment of about US$ 36.1 million. Both India and Ethiopia have a lot
to gain from this unit: The project will create about 500 direct jobs and 19
20,000 indirect jobs as well as further the mission of ‘Made in Africa’; at
the same time, the Indian company will get duty-free, quota-free access
to the US and EU markets through the African Growth and Opportunity
Act (AGOA) and Everything But Arms (EBA).
Food processing companies such as Indagro Foods and Frigerio
Conserva Allana Limited have also invested heavily in Ethiopia. The
Allana Group, India’s largest exporter of buffalo meat, has built a meat
processing plant in Zeway town near Addis Ababa. The meat plant will 20
have a capacity to produce 75 tonnes of meat every day.
Morocco
Indian companies have invested about US$ 96.1 million in Morocco
(Table 2). Unlike in countries such as Ethiopia, Kenya, and South Africa,
only eight Indian companies have invested in Morocco. Two Indian
private companies, Varun Beverages (78%) and TATA Motors (15%),
account for about 92 percent of Indian investments there, with the six
other companies having invested less than US$ 3 million each.
Sudan
Indian investment flows to Sudan from 2008 to 2016 are estimated at
US$ 85.7 million (Table 2). In Sudan, Indian investment is strictly
limited to oil, with ONGC Videsh accounting for 99 percent of Indian
investments (Table A10). The other six Indian companies present in
Sudan are Bhola Shri Marketing Private Limited, BLS International
17ORF OCCASIONAL PAPER # 142 FEBRUARY 2018
INDIAN INVESTMENTS IN AFRICA: SCALE, TRENDS, AND POLICY RECOMMENDATIONS
18
Services Limited, RAMCO Systems, Shivalikview Steel Trading, Titanic
Steel Trading, and Vintage Steel. These have invested less than half a
million USD each.
The notion that the private sector could play an important role in
development cooperation gained currency after the global financial
crisis in 2007-2008 and the consequent decline in government budgets
for official development assistance (ODA). The Fourth High Level
Forum (HLF4) on Aid Effectiveness held in Busan in 2011 established
the role of the private sector as an “actor and development partner”.
One of the main proposals of the Busan Partnership was to build
“stronger relationships between development cooperation and the
private sector, by supporting the creation of a favourable environment 21 for the different partners and fostering public-private partnerships”.
This was also the first time that representatives of the private sector
were signatories to the agreement. Subsequently, the role of the private
sector was emphasised in the Rio+20 Conference, the Global
Partnership for Effective Development Cooperation, and the G20
summits. The private sector is regarded as crucial to overcoming
development challenges in the developing world because it can
contribute to the creation of job opportunities which in turn leads to
poverty reduction. Given the private sector’s role in advancing
innovation, transfer of technology, creating wealth, incomes, and jobs;
the impacts of development cooperation will be more sustainable if
development cooperation builds on synergies with the priorities of the
private sector. As a result, most of the donor countries realigned their
development assistance to strengthen the private sector in their own
countries. ODA to the private sector has grown rapidly in recent years.
For instance, in Sweden, there has been a seven-fold increase in aid
II. ROLE OF PRIVATE SECTOR IN INDIA’S DEVELOPMENT COOPERATION
ORF OCCASIONAL PAPER # 142 FEBRUARY 2018
INDIAN INVESTMENTS IN AFRICA: SCALE, TRENDS, AND POLICY RECOMMENDATIONS

i. Spearman rank correlation is a non-parametric measure of rank correlation (statistical dependence between the rankings of two variables). It assesses how well the relationship between two variables can be described using a monotonic function. For details on calculation see Appendix B.
19ORF OCCASIONAL PAPER # 142 FEBRUARY 2018
channelled to the private sector from € 5.5 million (approx. INR 431 22
million) in 2006 to € 38 million (approx. INR 2,980 million) in 2012.
Between 2009 and 2016, Swedfund, the Swedish Government’s
development financier, financed 196 new establishments and business 23collaborations in the country.
In India, liberalisation brought about a fundamental change in the
country’s foreign policy. Economic diplomacy became the most
important feature of India’s foreign policy and the country’s
development cooperation strategy stressed on the principle of
“development partnership” for “mutual benefit”. Promoting India’s
exports, opening new markets for Indian companies, and securing
natural resources, food, and energy were declared as the objectives of 24
the Indian Development and Economic Assistance Scheme (IDEAS).
Samuel and George (2016) assert that India is increasingly promoting 25
its private sector in its development cooperation agenda.
However, Figure 7 seems to suggest patterns that differ from Samuel
and George’s assertion. To determine the relationship between India’s
development cooperation and its commercial interests, Figure 7 ranks
African countries according to the total value of lines of credit, a major
instrument of India’s development cooperation, and the total FDI
outflows from India between 2008 to 2016. The figure suggests that
there is a weak positive association between the total concessional credit
received by a country and the FDI in that country. The spearman rank icorrelation between Indian lines of credit and FDI flows is only 0.44.
Countries in the first quadrant—Mozambique, Kenya, Ethiopia,
Tanzania, Ghana, Mali, Rwanda, Gambia, and Sudan—are those that
INDIAN INVESTMENTS IN AFRICA: SCALE, TRENDS, AND POLICY RECOMMENDATIONS

20 ORF OCCASIONAL PAPER # 142 FEBRUARY 2018
INDIAN INVESTMENTS IN AFRICA: SCALE, TRENDS, AND POLICY RECOMMENDATIONS
Fig
ure
7: R
ank
ing
of
Afr
ican
co
un
trie
s b
ased
on
to
tal c
on
cess
ion
al
cred
it a
nd
FD
I re
ceiv
ed
IIIII
I
IV
Sour
ce: A
utho
r’s
own
bas
ed o
n d
ata
from
EX
IM B
ank
and
RB
I da
taba
se
21ORF OCCASIONAL PAPER # 142 FEBRUARY 2018
have been favoured destinations for both Indian investments as well as
credit lines. Of these, five countries (Mozambique, Kenya, Ethiopia,
Tanzania, and Rwanda) are in East Africa, a region with which India has
historically enjoyed close economic and cultural relations. The presence
of a large diaspora in those countries also helps Indian businesses,
besides fewer regulatory hurdles, and the fact that English is widely
spoken in the region. This region also occupies a special place in India’s
foreign policy due to its strategic location in the Indian Ocean. Countries
in the third quadrant such as Djibouti, Swaziland, and Benin have not
been major beneficiaries of either lines of credit or investments from
India.
Countries in the second and fourth quadrants represent a
disassociation between development cooperation and FDI flows.
Countries in the second quadrant—Burkina Faso, Sierra Leone, Niger,
Malawi, and Senegal—have been major beneficiaries of Indian lines of
credit but these countries have received scant FDI flows. This signifies
the failure of Indian credit lines in stimulating private sector
investments in these countries. For their part, countries in the fourth
quadrant (Zambia, Mauritania, Liberia, Nigeria, and Gabon) have
received high volumes of FDI but have not been major beneficiaries of
Indian lines of credit. In this case, it is clear that India’s credit lines are
not aligned with the priorities of the private sector. Here, investments
have not followed development cooperation. Private-sector companies
have found it profitable to invest in these countries anyway. Zambia’s
case is particularly interesting because as observed earlier, not only has it
been the fifth largest recipient of Indian investments, these investments
are also spread across various sectors of the economy. This is largely due 26
to the Zambian government’s efforts in attracting Indian investments.
Despite the fact that promotion of Indian companies in other
countries is a stated objective of India’s development cooperation, at the
INDIAN INVESTMENTS IN AFRICA: SCALE, TRENDS, AND POLICY RECOMMENDATIONS

22
moment, the role of Indian businesses in the delivery of development
cooperation is mostly limited to that of a contractor. Indian lines of
credit are the main instrument through which Indian companies
participate in the implementation of development cooperation. Once a
line of credit agreement is signed, the borrowing government or agency
organises a bidding and procurement procedure, in which Indian firms 27
participate. India’s development cooperation has yet to target private
sector development in African countries to foster broader economic
gains.
Existing Indian initiatives to promote Indian businesses in Africa
However, it would be wrong to assume that India has not taken up
measures to promote Indian companies in Africa. India has already
instituted a number of initiatives to encourage investment relations
with Africa. One of the first initiatives to promote trade and investment
ties between India and Africa was ‘Focus Africa’. The Focus Africa
Initiative was launched in 2002 initially with seven African countries
but later extended to 24. The main objective of the initiative was to
deepen India’s trade relations with Africa. Under this programme, India
extends assistance to exporters and Export Promotion Councils to
undertake visits to African countries to organise trade fairs, exhibitions,
hold B-2-B meetings and facilitate visits of African trade delegations in
India. The initiative is designed to promote closer cooperation between
Indian and African businesses and does not extend financial support to
Indian small businesses in Africa.
India’s EXIM Bank plays an important role in promoting India’s
commercial interests in Africa. In addition to operating concessional
lines of credit on behalf of the government of India, the EXIM Bank also
supports Indian companies in the execution of projects. The EXIM Bank
also supports Indian companies in their efforts to globalise their
ORF OCCASIONAL PAPER # 142 FEBRUARY 2018
INDIAN INVESTMENTS IN AFRICA: SCALE, TRENDS, AND POLICY RECOMMENDATIONS

23ORF OCCASIONAL PAPER # 142 FEBRUARY 2018
operations by extending loans and guarantees, equity participation, and
in some cases even through direct participation in equity along with
Indian promoters to set up ventures overseas. According to Sinate et al
(2014), the EXIM Bank supported six ventures with a total value of INR
354.4 million in three East African countries of Kenya, Tanzania, and 28
Uganda. One of the most outstanding initiatives of the EXIM Bank is
the SITA (Supporting India’s Trade Preferences for Africa) initiative,
where the EXIM Bank is partnering with the International Trade Centre
to promote trade and investment between India and five East African
countries (Kenya, Ethiopia, Rwanda, Tanzania and Uganda) by
supporting SMEs in their access to finance, technology and skills.
Although the SITA project has a number of advantages and it is playing
an important role in promoting sustainable development in East
African countries, its scope is limited to East Africa, a region with which
India already enjoys close ties. Moreover, it will end in 2020.
Need for an institutional mechanism/vehicle to promote Indian
overseas investments
Given India’s desire to play a positive development role in Africa, India
needs to adopt a more systematic approach engaging the private sector
in its development cooperation programme. On the one hand, there is a
need to synergise India’s development cooperation initiatives in a
manner that creates positive externalities for Indian companies
operating in Africa. Better targeting of development projects in sectors
and countries that are of interest for Indian businesses will foster trade
and investment linkages between India and Africa. This is particularly
important for countries in the fourth quadrant (see Figure 7). On the
other hand, it is also important to investigate why credit lines are failing
to serve as stepping stones to more vigorous investment ties for
countries in the second quadrant. Towards that end, it is imperative that
India creates an institutional mechanism to promote Indian overseas
INDIAN INVESTMENTS IN AFRICA: SCALE, TRENDS, AND POLICY RECOMMENDATIONS

24
investments in other developing countries. Prahalathan (2014)
recommends the creation of a separate division within the Ministry of
Finance – Overseas Investment Promotion Council (OPIC) to promote 29overseas investments by Indian enterprises. The CII report
recommends the creation of an institutional mechanism, India-Africa
Development Cooperation, under the aegis of the India-Africa Summits,
wherein the private sector can provide inputs on the geographical and 30
sectoral focus of development cooperation.
However, the Indian government must not be seen to be promoting
the interests of wrong businesses in Africa. It is important for the
institutional vehicle that will seek to promote Indian overseas
investments in Africa and other developing countries to bear in mind
the development priorities of the recipient countries as well; indeed,
there may be instances where the interests of India’s private sector may
not hew to the larger development goals of poverty alleviation and
sustainable development. Moreover, the expansion of private sector in
Africa does not automatically benefit the poorest and marginalised 31people, particularly so in Africa. Therefore, private-sector
engagement in India’s development cooperation should aim to result in
mutual benefit for both India and its partner countries. Towards that
end, the institutional vehicle to promote Indian overseas investments
must try to promote development-friendly investments in Africa.
Given the fact that small and medium enterprises have a much greater
impact on poverty by way of job creation, small and medium enterprises
must be targeted. This is not to undermine the importance of
technology and skills transfer which occurs through large companies.
But large companies are better placed financially and India’s
development cooperation strategy should harness the multitude of
private small and medium enterprises that have invested in Africa in
recent years to promote the development of the manufacturing sector
in the continent.
ORF OCCASIONAL PAPER # 142 FEBRUARY 2018
INDIAN INVESTMENTS IN AFRICA: SCALE, TRENDS, AND POLICY RECOMMENDATIONS

III. CONCLUSION
One of the main findings of this study is that Mauritius continues to
account for the bulk of Indian investments in Africa. Given that
Mauritius is a tax haven, most of the Indian investments to that country
do not contribute to African development and are merely round-tripped
back to India. This means that the actual volume of Indian investment in
Africa is much less than reported by both existing academic studies and
the media.
This study also finds that Indian investments in Africa is
characterised by large-scale investments in oil, gas, and mining sectors
by public-sector enterprises. Thus, energy security is the critical pull
factor behind the growth of Indian investments in Africa. However,
Indian public-sector companies have met with minimal success in
Africa’s energy market. In many instances they have had to relinquish
the blocks they acquired due to poor commercial prospects, inability to
meet contractual agreements, or because the blocks were still in their 32
exploratory phase. According to Alden and Verma (2015), lack of
technical and operational skills led to the failure of Indian companies in
Africa’s energy market. Between 2011 and 2015, GSPC surrendered ten
of its 11 overseas blocks in Egypt, Yemen, Indonesia, and Australia. The
Audit Report (PSUs) for the year ended 31 March 2015 made the
following observation about GSPC: “The Company went ahead acquiring
overseas blocks during 2006-10 mainly as an operator with considerably
high participating interests without any prior experience overseas as an
operator. Further, the delayed execution of the work committed
resulted in cost escalations in overseas blocks. As a result, the Company
had incurred expenditure of Rs 1,757.46 crore for 10 surrendered
overseas blocks, of which Rs 1,734.12 crore has been written off”.
Lastly, the Indian private sector’s footprint has also grown in the
African continent, albeit not as much as often claimed by the media.
25ORF OCCASIONAL PAPER # 142 FEBRUARY 2018
INDIAN INVESTMENTS IN AFRICA: SCALE, TRENDS, AND POLICY RECOMMENDATIONS
Indian private sector investment in Africa can be divided into two
categories. On the one hand are large private sector companies that have
undertaken “big-ticket” investments in select African countries in the
manufacturing sector, petrochemicals, fast-moving consumer goods,
and hotels. Their operations, however, are limited to one or two African
countries and they have been unable to spread their presence across the
continent. The driving force behind such investments is largely a set of
firm-specific reasons such as market entry strategy or access to raw
materials. On the other hand, there is also a multitude of small and
medium enterprises that have invested much smaller sums in the
manufacturing sector. These smaller firms are likely to have a stronger
impact on African development by way of jobs as well as forward and
backward linkages. However, making a decisive comment on the actual
impact of such investments on a country’s development requires field-
based research which is beyond the scope of this paper.
The relationship between India’s development cooperation and
Indian FDI in Africa is weak at the moment. India’s development
cooperation strategy should be more in tune with India’s commercial
interests in Africa. Towards that end, this paper recommends the
establishment of an institutional vehicle to promote Indian overseas
investments in Africa as well as other developing countries in the
neighbourhood. The institutional vehicle to promote Indian
investments must also try to channel Indian investments into
development-friendly projects for mutual benefit.
The author would like to thank the participants in the conference titled
“Promoting Indian Investments in Africa for African Development” held
on 15 June 2017 in Delhi, for their comments on the first draft of this
paper. The author would also like to thank the anonymous reviewer for
his/her comments.
ACKNOWLEDGEMENT
26 ORF OCCASIONAL PAPER # 142 FEBRUARY 2018
INDIAN INVESTMENTS IN AFRICA: SCALE, TRENDS, AND POLICY RECOMMENDATIONS

APPENDIX A:
Details of Indian FDI outflows to top ten recipient countries
Table A1: Indian foreign direct investment flows to Mozambique from 2008 to 2016
Indian Party 2008 2009 2010 2011 2012 2013 2014 2015 2016 Total
Adhunik Alloys 0.04 0.04and Power Ltd.
Anil V Patel 0.04 0.04
Austral coke 0.03 0.01 0.04& projects ltd
Beekay universal 1 1 2 impex pvt ltd
Bhavik parsot- 0.04 0.04tamdas patel
Coal India limited 0.27 2.7 2 0.15 5.13
Essar ports ltd 4.1 4.1
Gravita india ltd 0.2 0.01 0.2
Hemantbhai 0.04 0.04satishbhai patel
Jindal metal and 0.3 0.3mining limited
Jindal polyfilms ltd 0.2 0.2
Kwality pharma. 0.1 0.1pvt. Ltd.
Ongc videsh ltd. 2640 2.5 2642.5
Psi hydraulics 0.05 0.2 0.02 0.3
Rachana global 0.005 0.005excavation ltd
Railtech infra- 0.01 0.191 0.201venture pvt. Ltd.
Rajarambapu 0.17 0.17agro private limited
Resources 0.19 0.7 1.5 0.7 0.5 3.6International
Rites ltd 3.9 0.8 4.7
Rst mining and 0.001 0.001logistics pvt ltd
27ORF OCCASIONAL PAPER # 142 FEBRUARY 2018
INDIAN INVESTMENTS IN AFRICA: SCALE, TRENDS, AND POLICY RECOMMENDATIONS
Indian Party 2008 2009 2010 2011 2012 2013 2014 2015 2016 Total
Shapoorji pallonji 0.002 0.002energy (gujrat) pvt ltd
Shapoorji pallonji 0.002 0.002infra. capital company limited
Standardbuild 0.02 0.02Infrastructure ltd
Tata chemicals 0.27 0.27ltd
Teleminex india 0.02 0.02pvt ltd
Thriveni earth 1.4 1.4movers p ltd
Vandana vidhyut 0.3 0.3limited
Varun beverages 0.002 0.9 0.9limited
Total 5.9 0.01 0.31 3.6 0.5 1.9 2648.8 1.7 4.1 2666.9
28 ORF OCCASIONAL PAPER # 142 FEBRUARY 2018
INDIAN INVESTMENTS IN AFRICA: SCALE, TRENDS, AND POLICY RECOMMENDATIONS
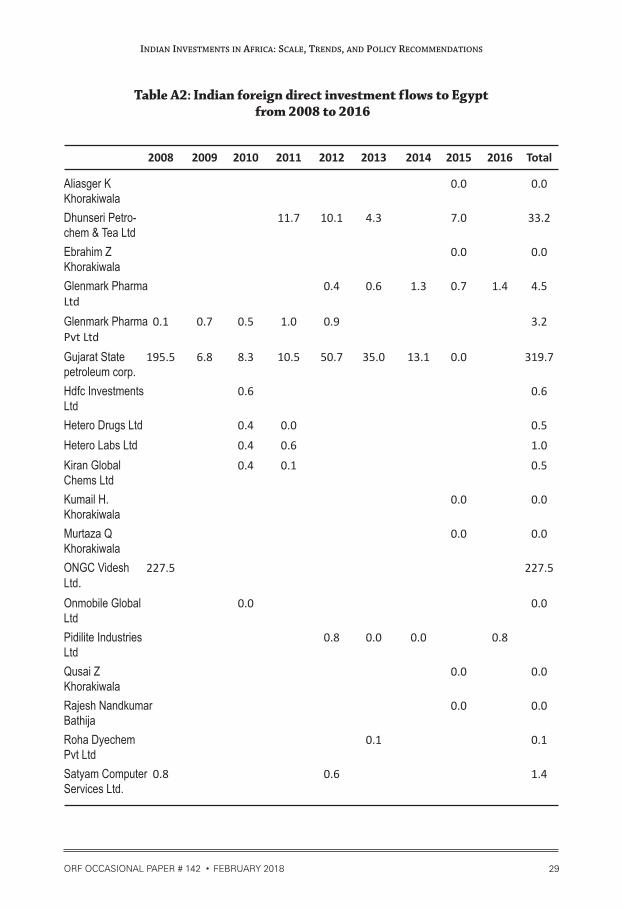
Table A2: Indian foreign direct investment flows to Egypt from 2008 to 2016
2008 2009 2010 2011 2012 2013 2014 2015 2016 Total
Aliasger K 0.0 0.0Khorakiwala
Dhunseri Petro- 11.7 10.1 4.3 7.0 33.2chem & Tea Ltd
Ebrahim Z 0.0 0.0Khorakiwala
Glenmark Pharma 0.4 0.6 1.3 0.7 1.4 4.5Ltd
Glenmark Pharma 0.1 0.7 0.5 1.0 0.9 3.2Pvt Ltd
Gujarat State 195.5 6.8 8.3 10.5 50.7 35.0 13.1 0.0 319.7petroleum corp.
Hdfc Investments 0.6 0.6Ltd
Hetero Drugs Ltd 0.4 0.0 0.5
Hetero Labs Ltd 0.4 0.6 1.0
Kiran Global 0.4 0.1 0.5Chems Ltd
Kumail H. 0.0 0.0Khorakiwala
Murtaza Q 0.0 0.0Khorakiwala
ONGC Videsh 227.5 227.5Ltd.
Onmobile Global 0.0 0.0Ltd
Pidilite Industries 0.8 0.0 0.0 0.8Ltd
Qusai Z 0.0 0.0Khorakiwala
Rajesh Nandkumar 0.0 0.0Bathija
Roha Dyechem 0.1 0.1Pvt Ltd
Satyam Computer 0.8 0.6 1.4Services Ltd.
29ORF OCCASIONAL PAPER # 142 FEBRUARY 2018
INDIAN INVESTMENTS IN AFRICA: SCALE, TRENDS, AND POLICY RECOMMENDATIONS

2008 2009 2010 2011 2012 2013 2014 2015 2016 Total
Shapoorji Pallonji 1.5 1.5Infrastructure Capital Company Limited
Shapoorji Pallonji 5.3 5.3Infrastructure Capital Company Pvt Ltd
South Asian 2.9 2.9Petrochem Limited
Sunil Vasudeo 0.0 0.0Kulkarni jt-1
Suresh Dhawan 0.0 0.0jt1
Zoher H 0.0 0.0Khorakiwala
Grand Total 423.8 7.5 13.5 24.0 62.7 40.8 14.4 9.3 6.8 602.9
30 ORF OCCASIONAL PAPER # 142 FEBRUARY 2018
INDIAN INVESTMENTS IN AFRICA: SCALE, TRENDS, AND POLICY RECOMMENDATIONS
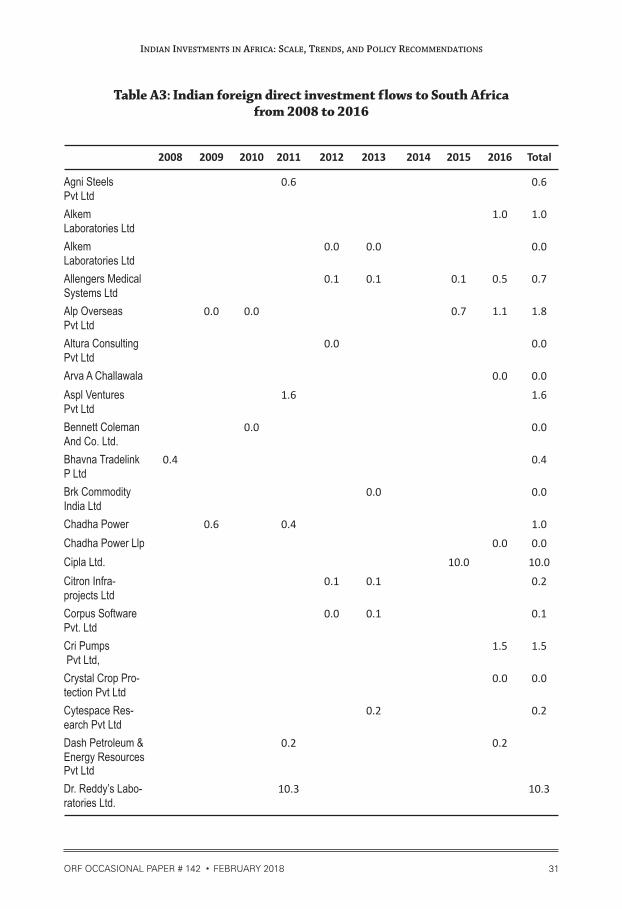
Table A3: Indian foreign direct investment flows to South Africa from 2008 to 2016
2008 2009 2010 2011 2012 2013 2014 2015 2016 Total
Agni Steels 0.6 0.6Pvt Ltd
Alkem 1.0 1.0Laboratories Ltd
Alkem 0.0 0.0 0.0Laboratories Ltd
Allengers Medical 0.1 0.1 0.1 0.5 0.7Systems Ltd
Alp Overseas 0.0 0.0 0.7 1.1 1.8Pvt Ltd
Altura Consulting 0.0 0.0Pvt Ltd
Arva A Challawala 0.0 0.0
Aspl Ventures 1.6 1.6Pvt Ltd
Bennett Coleman 0.0 0.0And Co. Ltd.
Bhavna Tradelink 0.4 0.4P Ltd
Brk Commodity 0.0 0.0India Ltd
Chadha Power 0.6 0.4 1.0
Chadha Power Llp 0.0 0.0
Cipla Ltd. 10.0 10.0
Citron Infra- 0.1 0.1 0.2projects Ltd
Corpus Software 0.0 0.1 0.1Pvt. Ltd
Cri Pumps 1.5 1.5 Pvt Ltd,
Crystal Crop Pro- 0.0 0.0tection Pvt Ltd
Cytespace Res- 0.2 0.2earch Pvt Ltd
Dash Petroleum & 0.2 0.2Energy Resources Pvt Ltd
Dr. Reddy’s Labo- 10.3 10.3ratories Ltd.
31ORF OCCASIONAL PAPER # 142 FEBRUARY 2018
INDIAN INVESTMENTS IN AFRICA: SCALE, TRENDS, AND POLICY RECOMMENDATIONS

2008 2009 2010 2011 2012 2013 2014 2015 2016 Total
Eduspark Inter- 0.3 0.3national Pvt Ltd
Emcure Pharma Ltd 0.0 0.0 0.0 0.1
Enercon (i) Power 0.1 0.1 0.1Development Pvt Ltd
Enercon [i] Ltd 0.1 0.1 0.1 0.3
Essel Media 1.0 1.0
Euro Safety Foot- 0.4 0.1 0.5wear India Pvt Ltd.
Expert Global 0.0 0.0Solutions Pvt Ltd
Financial Tech- 1.5 0.1 1.6nologies[i] Ltd
Forace Polymers 0.0 0.0 0.0Pvt Ltd
Fortune Metaliks 0.4 0.1 0.5Ltd
Fortune Metals Ltd 0.1 0.0 0.1
General Insurance 10.0 11.9 21.9Corporation
Genesis Mining & 0.6 0.6Minerals Pvt Ltd
Geospatial Media 0.0 0.0And Communications Pvt Ltd
Gis Development 0.0 0.0[p] Ltd
Goodearth Agro-chem P Ltd 1.7 1.7
Gpt Infraprojects 0.4 0.4Ltd
Gupta Coal 1.5 1.5India Ltd
I 2 I Telesource 0.0 0.0Pvt Ltd
Icreate Software 0.0 0.0India P Ltd
Il&fs Energy 0.1 0.1Development Company Ltd
Indiabulls Tech. 0.0 0.0Solutions Ltd
32 ORF OCCASIONAL PAPER # 142 FEBRUARY 2018
INDIAN INVESTMENTS IN AFRICA: SCALE, TRENDS, AND POLICY RECOMMENDATIONS
2008 2009 2010 2011 2012 2013 2014 2015 2016 Total
Indian Technomac 0.0 0.0Company Ltd
Industrial Filters 0.2 0.2 0.4and Fabrics Pvt Ltd
Ingen Infotech 0.0 0.0Corp Pvt Ltd
Intas Pharma Ltd 0.4 0.4 0.5 1.6 2.1 0.4 2.0 2.1 2.8 12.1
Integrated Wire- 0.0 0.3 0.2 0.4less Solutions Pvt Ltd
Interglobe Air 0.0 0.0Transport Ltd
Ion Exchange 0.1 0.0 0.1India Ltd.
Ipca Labora- 0.1 0.1tories Ltd
John Mayne 0.0 0.0
Jyoti Structures Ltd 0.0 2.3 0.5 2.8
Kalpataru Power 0.1 0.1Transmission Ltd
Kiran Global 0.9 0.0 2.7 2.3 1.7 2.0 9.6Chems Ltd
Klt Automative and 0.4 0.5 0.9Tubular Products Ltd
Krish Compusoft 0.0 0.0Services Pvt Ltd
Larsen & Toubro 31.4 0.0 5.0 36.5Infotech Ltd
Legacy Enter- 0.0 0.0prises Pvt Ltd
M/s Cahead Info 0.3 0.3Technologies India Pvt Ltd
Macleods Pharma 0.0 0.0 0.3 0.3Ltd
Mahendra Broth- 0.0 0.0 0.0ers Exports Pvt Ltd
Mahindra & 2.1 2.1Mahindra Ltd
33ORF OCCASIONAL PAPER # 142 FEBRUARY 2018
INDIAN INVESTMENTS IN AFRICA: SCALE, TRENDS, AND POLICY RECOMMENDATIONS

2008 2009 2010 2011 2012 2013 2014 2015 2016 Total
Marico Industries 15.0 12.5 0.5 6.4 34.3Ltd
Mbd Worldwide 0.0 0.2 0.1 0.2 0.5Pvt Ltd
Mcnally Bharat 0.0 0.1 0.0 0.1Engineering Co. Ltd.
Meril Life Sciences 1.8 1.8Pvt Ltd
Metropolis Health 0.7 0.1 0.9Services (i) P Ltd
Mouri Tech Pvt Ltd 0.0 0.0
Mphatek Systems 0.0 0.0Pvt Ltd.
Multigraph 0.0 0.0Machinery Co.
Nmdc Ltd 0.0 0.0
Nucleus Software 0.1 0.1Exports Ltd
Numeric Power 0.2 0.2Systems Ltd.
Onmobile Global 0.0 0.0Ltd
Orchid Chemicals 0.0 0.0& Pharmacueticals Ltd.
Pankaj B Koshti 0.1 0.1
Parle Biscuits 2.6 2.6Pvt Ltd
Pierian Services 0.0 0.0Pvt Ltd
Praj Industries Ltd. 0.0 0.7 3.7 0.4 4.8
Precision Bearing 0.1 0.1 0.1Pvt Ltd
Pride Overseas 0.0 0.0Pvt Ltd
Prodapt Solutions 0.0 0.0Pvt Ltd
R N Laboratories 0.0 0.0Pvt Ltd
Ramco Systems Ltd. 0.1 0.3 0.4 0.1 1.0 0.1 2.1
34 ORF OCCASIONAL PAPER # 142 FEBRUARY 2018
INDIAN INVESTMENTS IN AFRICA: SCALE, TRENDS, AND POLICY RECOMMENDATIONS

2008 2009 2010 2011 2012 2013 2014 2015 2016 Total
Rockland Steel 14.6 14.6Trading (p) Ltd.
Sankhyaa Learning 0.0 0.0 0.0Pvt Ltd
Saumya Textiles 1.5 0.2 0.2 1.8Pvt Ltd
Seagull Maritime 0.0 0.0Agencies Pvt Ltd
Second Avenue 0.0 0.0Consulting Pvt Ltd
Shalimar Precision 0.0 0.0Enterprises Pvt Ltd
Shankar Packaging 0.3 0.3Ltd
Silwin 0.0 0.0
Solid Tech India 0.0 0.0Computer Services Pvt Ltd
Span Diagnostics 0.0 0.0 0.0Ltd
Srg Mining Inter- 0.1 0.1national Pvt Ltd
Sun Minerals 1.0 1.0
Tagros Chemicals 0.8 0.2 0.1 1.0India Ltd
Tata Comm. 0.5 0.3 4.3Ltd 5.1
Tata Consultancy 10.4 10.4Services Ltd.
Tata Intl. Ltd. 8.0 55.0 63.0
Tata Motors Ltd. 0.0 1.5 1.8 3.3
Tata Projects Ltd 0.0 0.0
Tata Steel Ltd 65.3 65.3
Tech Mahindra Ltd 0.5 0.5
The Indian Hotels 5.2 0.1 45.1 2.3 41.1 93.8Co Ltd
Ubora Techno- 0.0 0.0logies Pvt Ltd
Ve Commercial 0.5 0.5Vehicles Ltd
35ORF OCCASIONAL PAPER # 142 FEBRUARY 2018
INDIAN INVESTMENTS IN AFRICA: SCALE, TRENDS, AND POLICY RECOMMENDATIONS

2008 2009 2010 2011 2012 2013 2014 2015 2016 Total
Vijay Mining and 3.4 0.0 3.4Infra Corp Pvt Ltd
Vulcan Indl Engg 0.1 0.1 0.2Co Ltd
Winjit Techno- 0.0 0.0logies Pvt Ltd
Wone Management 0.0 0.0Systems Pvt Ltd
Worlds Window 4.4 4.4Urja Pvt Ltd
Zensar Techno- 0.1 0.1logies Ltd
Total 29.0 84.7 29.5 23.6 137.0 18.9 27.6 63.9 28.3 442.5
Table A4: Indian foreign direct investment flows to Tunisia from 2008 to 2016
2013 2016 Total
Coromandel fertilizers ltd 56.4 56.4
Coromandel international limited 41.1 41.1
Gujarat state fertilisers & chemicals ltd 51.8 41.1 92.9
Kamal kishor swami 0.0 0.0
Raghav swami 0.0 0.0
Swapnil swami 0.0 0.0
Grand Total 108.2 82.3 190.4
36 ORF OCCASIONAL PAPER # 142 FEBRUARY 2018
INDIAN INVESTMENTS IN AFRICA: SCALE, TRENDS, AND POLICY RECOMMENDATIONS

Table A5: Indian foreign direct investment flows to Kenya from 2008 to 2016
2008 2009 2010 2011 2012 2013 2014 2015 2016 Total
Abakas Advisors 0.0 0.0and Investments
Adcc Infocad Pvt Ltd 0.3 0.1 0.4
Adcc Infocad Ltd 0.1 0.1
Alkem Laboratories 0.0 0.0Ltd,
Altura Consulting 0.0 0.0Pvt Ltd
Analytic Solutions 0.0 0.0
Angira Distributors 1.2 1.2Pvt Ltd
Arrow Webtex Ltd 3.8 3.8
Ashish Bhargava 0.0 0.0
Ashish Vyas 0.1 0.1
Associated Alum- 0.0 0.0inium Products Pvt Ltd
Astral Poly 0.0 0.1 0.3 0.0 1.4 0.3 0.4 0.6 3.1Trchnik Ltd
Bharat Arora 0.0 0.0
Bhola Shri Marketing 0.0 0.0Pvt Ltd
Bliss Gvs Pharma 0.4 0.4Ltd
Bonsai Network 0.0 0.0 0.1India P Ltd
Capricorn Logistics 0.0 0.0Pvt Ltd
Deval Kanaiyalal 0.1 0.0 0.1Modi
Devyani Food 0.1 5.0 2.5 7.6Industries Ltd
Doux Dentistry 0.0 0.0Pvt Ltd
Eastern Software 0.1 0.1Systems Pvt Ltd
37ORF OCCASIONAL PAPER # 142 FEBRUARY 2018
INDIAN INVESTMENTS IN AFRICA: SCALE, TRENDS, AND POLICY RECOMMENDATIONS

2008 2009 2010 2011 2012 2013 2014 2015 2016 Total
Enovateur 0.0 0.0Technologies
General Insurance 0.1 0.1Corporation
Gi Tech Gaming Co 0.0 0.0India Pvt Ltd
Glenmark Pharma 2.0 0.1 0.0 2.1Ltd
Gogreen Power 0.1 0.1Pvt Ltd
Gujarat Telelink 0.1 0.1Pvt Ltd
Healthcare Global 0.1 0.1Enterprises Ltd
Hind Aluminium 1.1 1.1Industries Ltd
Infrastructure Prof- 0.1 0.1 0.2essional Enterprise (p) Ltd
Innovis Telecom 0.0 0.2 0.2Services Pvt Ltd
Interlabels Industries 120.2 0.1 1.1 121.4Pvt Ltd
Ipe Global Ltd 0.1 0.2 0.3
K.g.n. Biofuels 0.0 0.0Pvt Ltd
Karan Ventures 0.1 0.1
Lcl Logistix 0.1 0.2 0.2India Pvt Ltd
Mahashakti 0.2 0.2Energy Ltd
Manipal Press Ltd 0.3 0.5 0.8
Manipal Techno- 0.2 2.2 2.4logies Ltd
Melimu Edutech 0.0 0.1 0.1Pvt Ltd
Mercury Industries 0.1 0.1 0.2Ltd
Metro Telworks 0.0 0.0Pvt Ltd
38 ORF OCCASIONAL PAPER # 142 FEBRUARY 2018
INDIAN INVESTMENTS IN AFRICA: SCALE, TRENDS, AND POLICY RECOMMENDATIONS

2008 2009 2010 2011 2012 2013 2014 2015 2016 Total
Metro Wireless 0.0 0.0Engineering I Pvt Ltd
Metropark Infratech 0.7 0.7& Realty Developments Pvt Ltd
Mode Finserver 0.0 0.0Pvt Ltd
Nagarjuna Const- 0.1 0.1ruction Co Ltd
Nestor Pharma Ltd 0.0 0.0 0.1
New Age 0.0 0.1 0.1 0.1 0.3International Pvt Ltd
Nupur Goenka 0.0 0.0
Onmobile Global Ltd 0.8 0.8
Parthiv Hareshkumar 0.1 0.1Shah
Pawan Rajesh Patel 0.0 0.0
Prakash Chemicals 0.0 0.1 0.1 0.2International Pvt Ltd
Preferred Card 0.0 0.0Marketing Pvt Ltd
Prince Plastics 0.2 0.2International Pvt Ltd
Quasar Media Pvt Ltd 0.0 0.0
Quick Heal Techno- 0.4 0.4logies Ltd
Quick Heal Techno- 0.2 0.0 0.5 0.7logies Pvt Ltd
Rajesh Vithalbahi 0.0 0.0Patel
Rj Corp Ltd 0.0 0.0 0.0
Rmn Infotech 0.0 0.0 0.0Pvt Ltd
Rony Darayas Gandhi 0.0 0.0
Royal Pen And 0.0 0.4 0.4 0.7Plastics Ltd
Sameep K Desai 0.0 0.0
Sameer Joshi 0.1 0.1
39ORF OCCASIONAL PAPER # 142 FEBRUARY 2018
INDIAN INVESTMENTS IN AFRICA: SCALE, TRENDS, AND POLICY RECOMMENDATIONS

2008 2009 2010 2011 2012 2013 2014 2015 2016 Total
Samin Tekmindz 0.0 0.0India Pvt Ltd
Satish Kelath Menon 0.0 0.0 0.0
Shalby Ltd 0.0 0.0
Shapoorji Pallonji 0.1 0.1Infrastructure Capital Company Pvt Ltd
Skanem Interlabels 0.9 0.9Industries P Ltd
Sls Software Pvt Ltd 0.0 0.0
Smile Multimedia 0.0 0.0Pvt Ltd
Softage Information 0.1 0.3 0.1 0.4Technology Ltd
Suguna Holdings 0.1 0.1P Ltd
Sujan Luxury 0.4 0.4Hosptality Pvt Ltd
Sunrise Buildhome 0.1 0.3 0.5Pvt Ltd
Supreme and 0.1 0.1 0.1 0.3Company Pvt Ltd
Tally Solutions Pvt Ltd 0.1 0.2 0.2 0.5
Tejas Goenka 0.0 0.0
Vaibhavi Varun 0.0 0.0Rupani
Vijai Infrastructure 0.3 0.3Ltd
Vir Rajesh Patel 0.1 0.1
Grand Total 124.4 0.8 0.6 1.3 5.9 4.6 6.2 1.7 9.0 154.6
40 ORF OCCASIONAL PAPER # 142 FEBRUARY 2018
INDIAN INVESTMENTS IN AFRICA: SCALE, TRENDS, AND POLICY RECOMMENDATIONS

Table A6: Indian foreign direct investment flows to Zambia from 2008 to 2016
2008 2009 2010 2011 2012 2013 2014 2015 2016 Total
Adcc Infocad Ltd 0.0 0.0
Arvee Electricals 0.0 0.0and Engineers Pvt Ltd
Bank Of Baroda 7.9 7.9
Bank Of India 7.8 7.8
Beena Bapu 0.0 0.0Bhosale
Bsbk Pvt Ltd 0.0 0.0
Buniyad Dwelling 0.0 0.0Pvt Ltd
Capital Corp 0.2 0.7 0.9
Central Bank 7.9 7.9Of India
Chetak Enterprises 0.5 7.5 1.2 9.2Ltd
Chiteta Mining 0.5 1.2 1.7Company Pvt Ltd
Dineshkumr Modi 0.0 0.0
Eastland Switch- 1.8 0.3 0.3 2.4gears Pvt Ltd
Era Hsg & Developers 0.4 0.6 0.1 0.1 0.0 1.2(I) Ltd
Eurasian Minerals 0.7 0.7 0.1 1.4& Enterprises P Ltd
Gkc Projects Ltd. 0.0 0.6 0.0 0.6
Gravita Exim Ltd 0.1 0.1 0.1
Grn Constructions 0.0 0.0Pvt Ltd
Hindustan Dorr- 0.0 0.0Oliver Ltd
Kohlenstoff Resource 0.2 0.2Developers Pvt Ltd
Manjeet Cotton 3.4 4.7 0.2 8.2Pvt Ltd
Manji Khimji Hirani 0.1 0.1
41ORF OCCASIONAL PAPER # 142 FEBRUARY 2018
INDIAN INVESTMENTS IN AFRICA: SCALE, TRENDS, AND POLICY RECOMMENDATIONS

2008 2009 2010 2011 2012 2013 2014 2015 2016 Total
Mcnally Bharat 0.0 1.0 1.0 0.8 0.8 3.7Engineering Co. Ltd.
Omax Minerals 0.0 0.0Pvt Ltd
Onmobile Global Ltd 0.2 0.2
Orbit Investments 0.2 0.6 0.8and Trading Pvt Ltd
Paritoshbhai 0.0 0.0Pravinchandra Modi
Plr Projects Pvt Ltd 1.2 0.4 10.6 0.3 12.5
Sm Niryat Pvt. Ltd 0.3 0.3
Srr Projects Pvt Ltd 0.8 0.8
Star Orechem Inter-. 0.2 0.1 0.0 0.1 0.4national Pvt Ltd
Suyog Chemicals 0.3 0.4 0.0 0.7Pvt Ltd
The Tata Power 48.8 48.8Company Ltd
Tyre Technocrats 0.1 0.1(India) Pvt Ltd
Varun Beverages Ltd 27.2 27.2
Voice Realtech 0.0 0.0 0.0 0.0 0.0Pvt Ltd
Zawar Natural 0.1 0.1 0.3Resources Pvt Ltd
Total 0.1 0.6 0.9 2.0 4.1 6.7 13.6 88.1 29.4 145.3
42 ORF OCCASIONAL PAPER # 142 FEBRUARY 2018
INDIAN INVESTMENTS IN AFRICA: SCALE, TRENDS, AND POLICY RECOMMENDATIONS

Table A7: Indian foreign direct investment flows to Libya from 2008 to 2016
2008 2009 2010 2011 2012 2013 2014 2015 Total
Hydrocarbon Resources 0.0 0.0Development Co P Ltd
Indian Oil Corporation Ltd. 10.3 10.3
Navayuga Engineering Co Ltd 0.2 0.2
Oil India Limited 8.8 3.9 24.7 3.3 0.6 17.1 7.4 0.1 65.9
Ongc Videsh Ltd. 15.6 8.1 27.7 51.4
Shapoorji Pallonji & 0.0 0.0Co Ltd
Simplex Infrastructures 0.8 0.8Ltd
Unitech Infra 0.2 0.2Limited
Total 24.5 12.9 52.5 3.5 0.6 27.4 7.4 0.1 128.8
43ORF OCCASIONAL PAPER # 142 FEBRUARY 2018
INDIAN INVESTMENTS IN AFRICA: SCALE, TRENDS, AND POLICY RECOMMENDATIONS

Table A8: Indian foreign direct investment flows to Ethiopia from 2008 to 2016
2008 2009 2010 2011 2012 2013 2014 2015 2016 Total
Adp Packaging 0.2 0.1 0.2 0.5Pvt Ltd
Advance Ispat 0.0 0.1 0.2(India) Ltd
Ajay Industrial 0.3 0.3Corporation Ltd
Anbu Infratech 0.3 0.1 0.4Pvt Ltd
Anish Vinod 0.1 0.1 0.0 0.2Agrawal
Anmol Polymers 0.7 1.6 0.4 0.1 0.5 1.5 0.1 0.0 4.8P Ltd
Arvind Brands and 6.6 6.6Retail Ltd
Arvind Ltd 2.8 1.2 4.0
Ashok Goyal 0.2 0.2
Avishkar Inter- 0.2 0.2national Pvt. Ltd
Bassi Steels Ltd 0.3 0.3
Birla Corporation Ltd 0.1 0.1
Bns Placement 0.1 0.1Services Private Ltd
C & E Ltd 0.0 0.0
Cadila Pharma Ltd 0.8 0.8
Citron Infra 0.0 0.2 0.1 0.3projects Ltd
Clc Enterprises Ltd 0.4 1.1 0.1 1.6
Cosmic Alloys and 0.0 0.3 0.3 0.1 0.6Metals Works Pvt Ltd
Dodla Dairy Ltd 0.0 0.2 0.3
Emami Biotech Ltd 0.8 0.0 0.8
Esdee Paints Ltd 2.6 2.6
Frigerio Conserva 0.1 6.7 1.6 1.3 9.7Allana Ltd
G.d. Ferro Alloys 0.0 0.5 0.2 0.6Pvt Ltd
Geetanjali Woollens 0.3 0.8 1.1Pvt Ltd
44 ORF OCCASIONAL PAPER # 142 FEBRUARY 2018
INDIAN INVESTMENTS IN AFRICA: SCALE, TRENDS, AND POLICY RECOMMENDATIONS
2008 2009 2010 2011 2012 2013 2014 2015 2016 Total
Hytech Natural 0.1 0.1Drillers Pvt Ltd
Indagro Foods Ltd 0.1 4.4 1.5 5.9
Indagro Foods 2.3 3.2 5.5Pvt Ltd
Indosin Pvt Ltd 0.1 0.1
Intercontinental 0.3 0.3Consultants & Techno-crats Pvt Ltd
International 0.2 0.4 0.1 0.6Panaacea Ltd
Jeevan Polymers 0.2 0.2(p) Ltd
Kajaria Ceramics Ltd 0.2 0.4 0.1 0.6
Kanoria Chemicals & 0.1 2.8 27.4 3.3 2.5 36.1Industries Ltd
Karle International 0.2 0.2 0.4 0.8Pvt Ltd
Karuturi Global Ltd 0.2 1.0 1.2
Kbn Infrastructure 0.1 0.1Pvt Ltd
Keshav Kailas Agrawal 0.1 0.1 0.0 0.2
Kilitch Drugs India Ltd 0.2 0.0 0.2
Lucid Pharma Pvt Ltd 0.6 0.0 0.0 0.2 0.8
M.p. Birla Group 0.0 0.0Services Pvt Ltd
Mahashakti Energy 0.1 0.4 0.5 0.9Ltd
Meenakshi Infra- 0.0 0.0structures Pvt Ltd
Nakul Agrawal 0.1 0.1 0.0 0.2
Naresh Bhandari 0.0 0.0
Neha Inter- 0.5 0.5national Ltd
Overseas Infrastructure 0.1 0.1Alliance India (pvt) Ltd
Pidilite Industries Ltd 0.2 0.2
Prestige Oils Pvt Ltd 0.1 0.1
Proful Oils Pvt Ltd 0.1 0.1
Ramya Agrotech 0.1 0.1Pvt Ltd
45ORF OCCASIONAL PAPER # 142 FEBRUARY 2018
INDIAN INVESTMENTS IN AFRICA: SCALE, TRENDS, AND POLICY RECOMMENDATIONS
2008 2009 2010 2011 2012 2013 2014 2015 2016 Total
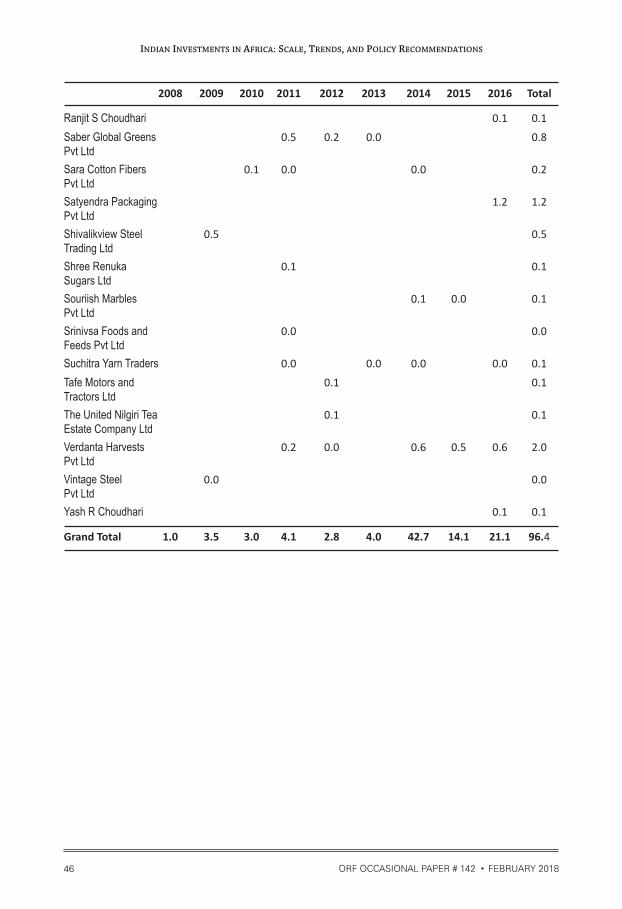
Ranjit S Choudhari 0.1 0.1
Saber Global Greens 0.5 0.2 0.0 0.8Pvt Ltd
Sara Cotton Fibers 0.1 0.0 0.0 0.2Pvt Ltd
Satyendra Packaging 1.2 1.2Pvt Ltd
Shivalikview Steel 0.5 0.5Trading Ltd
Shree Renuka 0.1 0.1Sugars Ltd
Souriish Marbles 0.1 0.0 0.1Pvt Ltd
Srinivsa Foods and 0.0 0.0Feeds Pvt Ltd
Suchitra Yarn Traders 0.0 0.0 0.0 0.0 0.1
Tafe Motors and 0.1 0.1Tractors Ltd
The United Nilgiri Tea 0.1 0.1Estate Company Ltd
Verdanta Harvests 0.2 0.0 0.6 0.5 0.6 2.0Pvt Ltd
Vintage Steel 0.0 0.0Pvt Ltd
Yash R Choudhari 0.1 0.1
Grand Total 1.0 3.5 3.0 4.1 2.8 4.0 42.7 14.1 21.1 96.4
46 ORF OCCASIONAL PAPER # 142 FEBRUARY 2018
INDIAN INVESTMENTS IN AFRICA: SCALE, TRENDS, AND POLICY RECOMMENDATIONS

Table A9: Indian foreign direct investment flows to Morocco from 2008 to 2016
2008 2009 2011 2012 2013 2014 2015 2016 Total
Gujarat Fluoro- 0.0 0.0chemicals Ltd
K N Infratech Pvt Ltd 0.5 0.5
Shreepati Infra Realty Ltd 0.3 0.3
Sumilon Industries Limited 2.0 0.9 2.9
Tata Consultancy 1.4 1.1 2.5Services Ltd.
Tata Motors Ltd. 2.7 4.3 7.1 14.1
Telangana Spinning & 1.1 1.1Weaving Mills Ltd
Varun Beverages 38.0 4.9 5.8 5.3 8.5 12.3 74.7(International) Limited
Grand Total 2.5 1.1 38.0 4.9 5.8 10.7 13.7 19.4 96.1
Table A10: Indian foreign direct investment flows to Sudan from 2008 to 2016
2008 2009 2010 2011 2012 2014 Total
Bhola shri marketing private limited 0.0 0.0
Bls international services limited 0.0 0.0
Ongc videsh ltd. 55.5 16.2 13.4 85.1
Ramco systems ltd. 0.0 0.0
Shivalikview steel trading ltd 0.2 0.2
Titanic steel industries ltd. 0.2 0.2
Vintage steel pvt ltd 0.2 0.2
Grand Total 55.5 16.2 13.9 0.0 0.0 0.0 85.7
47ORF OCCASIONAL PAPER # 142 FEBRUARY 2018
INDIAN INVESTMENTS IN AFRICA: SCALE, TRENDS, AND POLICY RECOMMENDATIONS

APPENDIX B:
Indian FDI outflows to select African countries (countries not in top 10)
Table B1: Indian foreign direct investment flows to Ghana from 2008 to 2016
2008 2009 2010 2011 2012 2013 2014 2015 2016 Total
Abellon Clean 0.0 0.3 0.1 0.4 0.4 0.4 1.4 3.0energy Ltd
Achyutha Prasad Bandi 0.0 0.1 0.0 0.1
Avs International 0.1 0.1Pvt Ltd
B Abhishek 0.0 0.1 0.0 0.1
Chetan Deep Bandi 0.0 0.1 0.0 0.1
D V Karthiknetha 0.0 0.1 0.0 0.1
Food Fats & 3.5 1.4 4.9Fertilisers Ltd
Foods, Fertilizers 5.4 6.9 4.2 2.5 19.0Fats, Ltd
Gravita India Ltd 1.5 1.5
Gravita India Ltd 0.1 0.1
Gujarat Gold Centre 0.3 0.3
Lavanya Mukkara 0.1 0.1
Laxmi Publications 0.1 0.0 0.1Pvt Ltd
Lmk Comtrade Pvt Ltd 0.1 0.1
Millith Karv Engineering 0.2 0.2& Trading (p) Ltd
R.v.r. Industries Pvt Ltd 0.2 0.2
Maganlal Govindbhai 0.0 0.0Khokhani
Manaksia Ltd 1.0 1.0
Met Trade India Ltd 0.2 0.2
Muskaan Tradex 0.2 0.2Pvt Ltd
Nsl Energy Ventures 0.1 0.1Private Ltd
Nsl Sugars Ltd 0.1 0.1
48 ORF OCCASIONAL PAPER # 142 FEBRUARY 2018
INDIAN INVESTMENTS IN AFRICA: SCALE, TRENDS, AND POLICY RECOMMENDATIONS
2008 2009 2010 2011 2012 2013 2014 2015 2016 Total
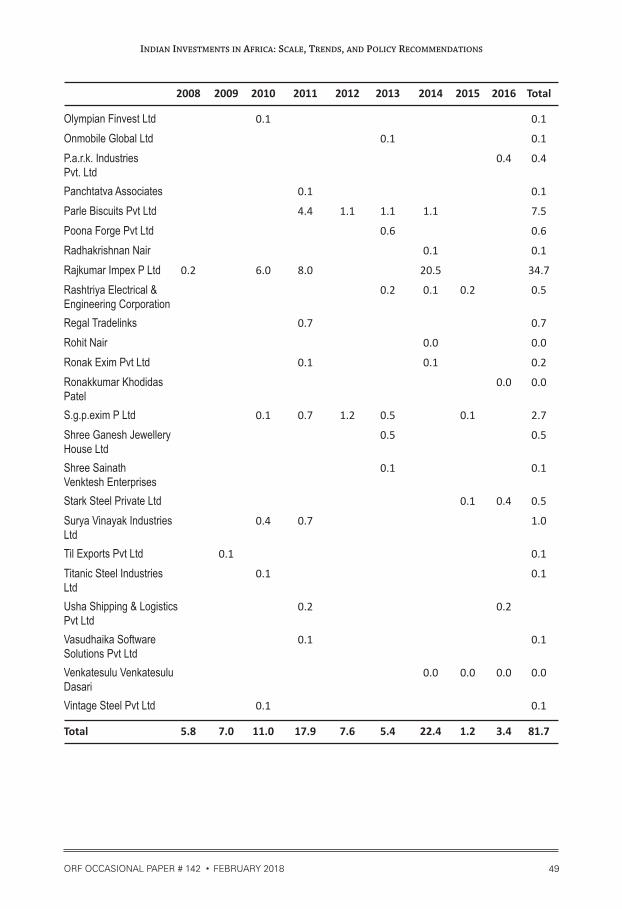
Olympian Finvest Ltd 0.1 0.1
Onmobile Global Ltd 0.1 0.1
P.a.r.k. Industries 0.4 0.4Pvt. Ltd
Panchtatva Associates 0.1 0.1
Parle Biscuits Pvt Ltd 4.4 1.1 1.1 1.1 7.5
Poona Forge Pvt Ltd 0.6 0.6
Radhakrishnan Nair 0.1 0.1
Rajkumar Impex P Ltd 0.2 6.0 8.0 20.5 34.7
Rashtriya Electrical & 0.2 0.1 0.2 0.5Engineering Corporation
Regal Tradelinks 0.7 0.7
Rohit Nair 0.0 0.0
Ronak Exim Pvt Ltd 0.1 0.1 0.2
Ronakkumar Khodidas 0.0 0.0Patel
S.g.p.exim P Ltd 0.1 0.7 1.2 0.5 0.1 2.7
Shree Ganesh Jewellery 0.5 0.5House Ltd
Shree Sainath 0.1 0.1Venktesh Enterprises
Stark Steel Private Ltd 0.1 0.4 0.5
Surya Vinayak Industries 0.4 0.7 1.0Ltd
Til Exports Pvt Ltd 0.1 0.1
Titanic Steel Industries 0.1 0.1Ltd
Usha Shipping & Logistics 0.2 0.2Pvt Ltd
Vasudhaika Software 0.1 0.1Solutions Pvt Ltd
Venkatesulu Venkatesulu 0.0 0.0 0.0 0.0Dasari
Vintage Steel Pvt Ltd 0.1 0.1
Total 5.8 7.0 11.0 17.9 7.6 5.4 22.4 1.2 3.4 81.7
49ORF OCCASIONAL PAPER # 142 FEBRUARY 2018
INDIAN INVESTMENTS IN AFRICA: SCALE, TRENDS, AND POLICY RECOMMENDATIONS

Table B2: Indian foreign direct investment flows to Liberia from 2008 to 2016
2008 2011 2012 2013 2014 2016 Total
Abg Fpso Private Limited 0.1 0.1
Four M Maritime Private Limited 0.2 0.4 0.2 0.8
Lindsay International Private Limited 0.4 0.4
Soiltech (India) Pvt Ltd 0.0 0.0
Tahir Tayeb Latiff 0.0 0.0
West Asia Maritime Ltd. 36.4 36.4
Total 36.4 0.2 0.5 0.2 0.4 0.0 37.7
Table B3: Indian foreign direct investment flows to Malawi from 2008 to 2016
2008 2009 2011 2013 2014 2015 2016 Total
Amita jaymin desai 0.1 0.1
Hi-tos liner agency p ltd 0.3 0.8 1.1
Nihilent technologies pvt.ltd 0.0 0.0
Onmobile global ltd 0.0 0.0
Ulka industries ltd. 0.1 1.3 1.4
Weizmann ltd 0.2 0.2
Total 0.5 0.8 0.0 0.0 0.1 0.1 1.3 2.8
50 ORF OCCASIONAL PAPER # 142 FEBRUARY 2018
INDIAN INVESTMENTS IN AFRICA: SCALE, TRENDS, AND POLICY RECOMMENDATIONS

Table B4: Indian foreign direct investment flows to Nigeria from 2008 to 2016
2008 2009 2010 2011 2012 2013 2014 2015 2016 Total
Ajanta Pharma Ltd 0.0 0.0 0.1
Anadariya Aadithya 0.0 0.0Agro Pvt Ltd
Ashiana Goods 0.5 0.5Pvt Ltd
Ashish Life Science 0.0 0.0 0.1Pvt. Ltd
Ashley Holdings 0.0 0.0Ltd
Ashley Investments 0.0 0.0Ltd
Ashok Leyland Ltd 0.0 0.0
Aster Infrastructure 0.1 0.1Pvt Ltd
Atlanta Mart Pvt Ltd 0.1 0.1
Bnr Consultancy 1.8 1.8Services Pvt Ltd
Bns Steel Trading 2.2 0.0 0.0 2.2Pvt Ltd
Bry - Air (asia) Pvt Ltd 0.1 0.1 0.1
Celogen Pharma 0.0 0.0Pvt Ltd
Centum Learning Ltd 0.1 0.1
Comviva Techno- 0.1 0.5 0.6logies Ltd
Crest Steel & Power 0.1 0.1 0.4 0.6Pvt Ltd
Dynamic Universal 2.8 2.8Ltd
East India Udyog Ltd 0.0 0.2 0.2
Eastern Software 0.1 0.1Systems Ltd
Edel Commodities 0.0 0.0Trading Ltd
Efsl Comtrade Ltd 0.1 0.1
Emcure Pharma Ltd 0.2 0.3 0.1 0.3 0.2 0.2 1.3
Cosmic Alloys and 0.1 0.1Metals Works Pvt Ltd
51ORF OCCASIONAL PAPER # 142 FEBRUARY 2018
INDIAN INVESTMENTS IN AFRICA: SCALE, TRENDS, AND POLICY RECOMMENDATIONS
2008 2009 2010 2011 2012 2013 2014 2015 2016 Total
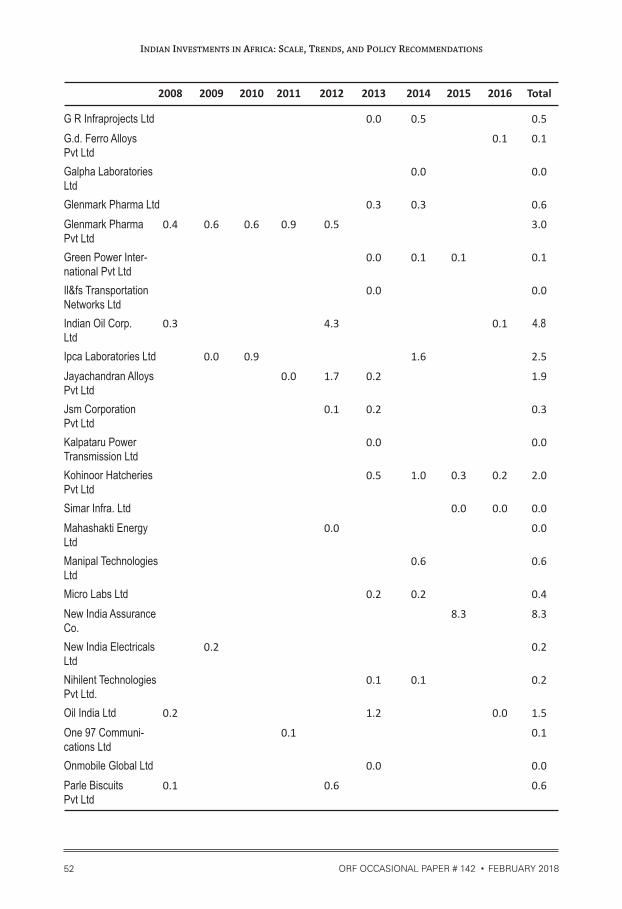
G R Infraprojects Ltd 0.0 0.5 0.5
G.d. Ferro Alloys 0.1 0.1Pvt Ltd
Galpha Laboratories 0.0 0.0Ltd
Glenmark Pharma Ltd 0.3 0.3 0.6
Glenmark Pharma 0.4 0.6 0.6 0.9 0.5 3.0Pvt Ltd
Green Power Inter- 0.0 0.1 0.1 0.1national Pvt Ltd
Il&fs Transportation 0.0 0.0Networks Ltd
Indian Oil Corp. 0.3 4.3 0.1 4.8Ltd
Ipca Laboratories Ltd 0.0 0.9 1.6 2.5
Jayachandran Alloys 0.0 1.7 0.2 1.9Pvt Ltd
Jsm Corporation 0.1 0.2 0.3Pvt Ltd
Kalpataru Power 0.0 0.0Transmission Ltd
Kohinoor Hatcheries 0.5 1.0 0.3 0.2 2.0Pvt Ltd
Simar Infra. Ltd 0.0 0.0 0.0
Mahashakti Energy 0.0 0.0Ltd
Manipal Technologies 0.6 0.6Ltd
Micro Labs Ltd 0.2 0.2 0.4
New India Assurance 8.3 8.3Co.
New India Electricals 0.2 0.2Ltd
Nihilent Technologies 0.1 0.1 0.2Pvt Ltd.
Oil India Ltd 0.2 1.2 0.0 1.5
One 97 Communi- 0.1 0.1cations Ltd
Onmobile Global Ltd 0.0 0.0
Parle Biscuits 0.1 0.6 0.6Pvt Ltd
52 ORF OCCASIONAL PAPER # 142 FEBRUARY 2018
INDIAN INVESTMENTS IN AFRICA: SCALE, TRENDS, AND POLICY RECOMMENDATIONS
2008 2009 2010 2011 2012 2013 2014 2015 2016 Total
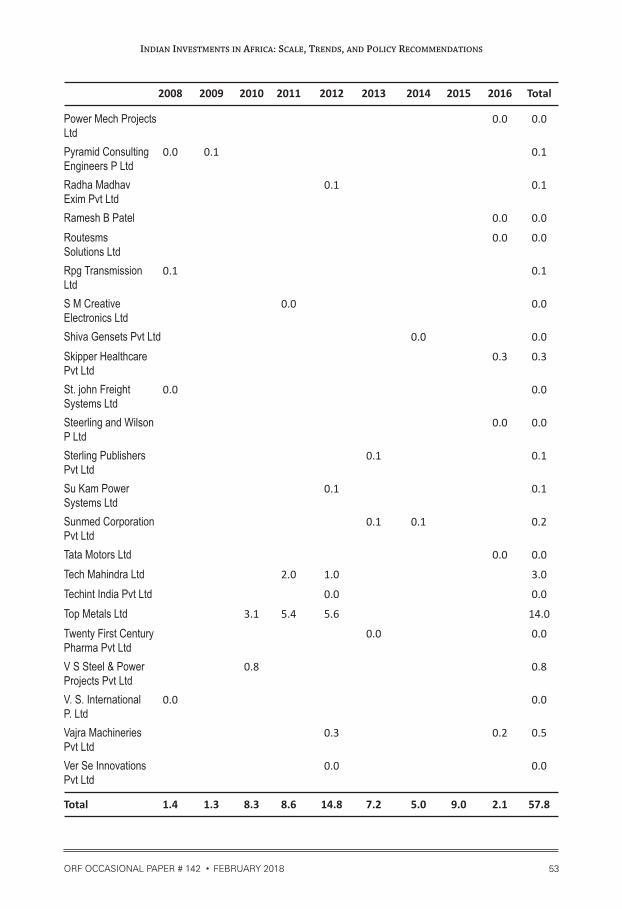
Power Mech Projects 0.0 0.0Ltd
Pyramid Consulting 0.0 0.1 0.1Engineers P Ltd
Radha Madhav 0.1 0.1Exim Pvt Ltd
Ramesh B Patel 0.0 0.0
Routesms 0.0 0.0Solutions Ltd
Rpg Transmission 0.1 0.1Ltd
S M Creative 0.0 0.0Electronics Ltd
Shiva Gensets Pvt Ltd 0.0 0.0
Skipper Healthcare 0.3 0.3Pvt Ltd
St. john Freight 0.0 0.0Systems Ltd
Steerling and Wilson 0.0 0.0P Ltd
Sterling Publishers 0.1 0.1Pvt Ltd
Su Kam Power 0.1 0.1Systems Ltd
Sunmed Corporation 0.1 0.1 0.2Pvt Ltd
Tata Motors Ltd 0.0 0.0
Tech Mahindra Ltd 2.0 1.0 3.0
Techint India Pvt Ltd 0.0 0.0
Top Metals Ltd 3.1 5.4 5.6 14.0
Twenty First Century 0.0 0.0Pharma Pvt Ltd
V S Steel & Power 0.8 0.8Projects Pvt Ltd
V. S. International 0.0 0.0P. Ltd
Vajra Machineries 0.3 0.2 0.5Pvt Ltd
Ver Se Innovations 0.0 0.0Pvt Ltd
Total 1.4 1.3 8.3 8.6 14.8 7.2 5.0 9.0 2.1 57.8
53ORF OCCASIONAL PAPER # 142 FEBRUARY 2018
INDIAN INVESTMENTS IN AFRICA: SCALE, TRENDS, AND POLICY RECOMMENDATIONS

Table B5: Indian foreign direct investment flows to Rwanda from 2008 to 2016
2008 2009 2012 2013 2014 2015 2016 Total
Gp Karthikeyan 0.0 0.0
Hicommands Tech India Ltd 0.0 0.0 0.1
Met Trade India Ltd 1.4 1.4
Nyagatare Agro Ventures Pvt Ltd 0.3 1.7 1.5 0.6 1.2 5.3
Onmobile Global Ltd 0.0 0.0 0.0
P Sureshkumar 0.0 0.0
Pitambra Books Pvt Ltd 0.0 0.0
Sahasra Electronics Pvt Ltd 0.2 0.2 0.2 0.6 0.1 1.2
Waterlife India Pvt Ltd 0.0 0.0
Total 1.4 0.0 0.5 2.0 1.7 1.2 1.3 8.0
Table B6: Indian foreign direct investment flows to Sierra Leone from 2008 to 2016
2013 Total
Onmobile Global Ltd 0.02 0.02
Total 0.02 0.02
54 ORF OCCASIONAL PAPER # 142 FEBRUARY 2018
INDIAN INVESTMENTS IN AFRICA: SCALE, TRENDS, AND POLICY RECOMMENDATIONS

Table B7: Indian foreign direct investment flows to Tanzania from 2008 to 2016
2008 2009 2010 2011 2012 2013 2014 2015 2016 Total
Alpha Nippon 0.8 0.8Innovatives Ltd
Anurag Handa 0.0 0.0
Arun Kumar Naval 0.0 0.0
Balaji Iron and Minerals 0.0 0.0 0.0Pvt Ltd
Banco Products 0.2 0.0 4.0 4.3(India) Ltd
Banco Products 0.5 0.9 11.1 12.5India Ltd
Baramati Agro Ltd 0.0 0.0
Bhrithi Mining Pvt Ltd 0.0 0.0 0.0
Dharma Theja Paruchuri 0.0 0.0
Diamond & Gem 0.0 0.0 0.0Development Corp. Ltd
Dr. Pva Mohandas 0.1 0.1
Dr.prithvi Mohandas 0.1 0.1
Excel Crop Care Ltd 0.0 0.1 0.1
Fair Deal Cars Pvt Ltd 0.4 2.4 2.4 2.4 7.6
Frigerio Conserva 0.2 0.1 0.3Allana Ltd
Grow-well Engin- 0.1 0.1 0.1eering Export P Ltd
Healthcare Global 0.0 0.0Enterprises Ltd
Il & Fs Maritime Infra- 0.0 0.0structure Co Ltd
Il&fs Energy Develop- 0.0 0.0ment Company Ltd
Indagro Foods Ltd 0.2 0.0 0.3
Indagro Foods Pvt Ltd 0.0 0.0
Kishore Thakurdas 0.1 0.1Raghani
Lovson Exports Ltd 0.0 0.0
Madhavi Potla 0.0 0.0
Mallika Mohandas 0.1 0.1
55ORF OCCASIONAL PAPER # 142 FEBRUARY 2018
INDIAN INVESTMENTS IN AFRICA: SCALE, TRENDS, AND POLICY RECOMMENDATIONS

2008 2009 2010 2011 2012 2013 2014 2015 2016 Total
Matchit Consultants 0.1 0.1Pvt Ltd
Mercury Industries Ltd 0.0 0.2 0.2
Nestor Pharma Ltd 0.1 0.1 0.1 0.3
Nihilent Technologies 0.0 0.0Pvt Ltd
Onmobile Global Ltd 0.0 0.01
Potla Nageswara Rao 0.0 0.0
Potla Nishanth 0.0 0.0
Potla Shanthi 0.0 0.0
Princeware International 0.3 0.3 0.6 1.2Pvt Ltd
Psi Hydraulics 20.0 0.1 20.1
R J Feeds Pvt Ltd 0.4 0.2 0.2 0.9
Rmn Infotech Pvt Ltd 0.0 0.0 0.0
Royal Orchid 2.0 0.1 0.0 2.1Hotels Ltd
S.S. Control Systems 0.0 0.0Pvt Ltd
Shashank Bhasker 0.0 0.0Trivedi
Sidhhartha Corporation 0.2 0.2Pvt Ltd
Sri Ganesh Forwarders 0.2 0.1 0.3Pvt Ltd
Tanworld International 0.9 0.9Pvt Ltd
Tata Petrodyne Ltd 6.7 0.5 7.3
Teleminex India Pvt Ltd 0.0 0.0
Unihealth Consul- 0.1 0.1tancy Pvt Ltd
Vasista Mines Pvt Ltd 0.2 0.1 0.3
Venkatrama Poultries 1.3 1.3Pvt Ltd
Webstar Vyapaar 0.1 0.1 0.2Pvt Ltd
Yogesh Aggrawal 0.0 0.0
Grand Total 2.11 20.86 1.38 13.08 0.68 7.19 4.23 11.61 0.75 61.90
56 ORF OCCASIONAL PAPER # 142 FEBRUARY 2018
INDIAN INVESTMENTS IN AFRICA: SCALE, TRENDS, AND POLICY RECOMMENDATIONS

Table B8: Indian foreign direct investment flows to Uganda from 2008 to 2016
2008 2010 2011 2012 2013 2014 2015 2016 Total
A2Z Maintenance & 0.0 0.0Engineering Services Ltd
Acacia Projects Pvt Ltd 0.2 0.0 0.3 0.1 0.7
Amit Nutanchandra Mehta 0.0 0.0 0.0
Aroma Realties Ltd 0.1 0.1
Arvind Premji Bhanusali 0.0 0.0
B Ravikumar 0.1 0.1
Bhola Shri Marketing 0.0 0.0Pvt Ltd
Bothra Variant Pvt Ltd 0.2 0.2
Cameo Corporate 0.2 0.0 0.1 0.3Services Ltd
Devyani International 1.0 23.3 24.3 Pvt Ltd
Eastern Software 0.0 0.0Systems Ltd.
Flowtech Industries Llp 0.0 0.1 0.1
Ghanshyam Vanmalidas 0.0 0.0Dudharejiya
Healthcare Global 0.1 0.1Enterprises Ltd
Intaz Agro Pvt Ltd 0.1 0.1 0.1
Jeph International Educare 0.5 0.5Pvt Ltd
Kgs Sugar And Infra Corp. Ltd 0.2 0.2
Majoris Trade And Exports 0.2 0.2 0.1 0.2 0.7Pvt Ltd
Marwar Impex Pvt Ltd 0.0 0.0
Medibios Laboratories 0.2 0.2Pvt Ltd
Onmobile Global Ltd 0.35 0.35
P Madheshwaran 0.1 0.1
Rajesh Valjibhai Vaghasia 0.0 0.0
Rohini Minerals Private 0.4 0.4
Roshni Seeds Pvt Ltd 0.1 0.1 0.1
57ORF OCCASIONAL PAPER # 142 FEBRUARY 2018
INDIAN INVESTMENTS IN AFRICA: SCALE, TRENDS, AND POLICY RECOMMENDATIONS

2008 2010 2011 2012 2013 2014 2015 2016 Total
Samruddhi Autoworld 0.0 0.0Pvt Ltd
Sea Deals Trade Pvt Ltd 0.1 0.1
Shree Balaji Goodearth 0.0 0.0 0.1
Sri Rajeshwara Hatcheries 0.2 0.2Pvt Ltd
Straina International 0.0 0.0Pvt Ltd
Svsvs Projects Pvt Ltd 0.0 0.0
Tirupati Sarjan Ltd 0.4 0.2 0.5
Unihealth Consultancy 0.4 0.4Pvt Ltd
Vir Alloys & Steel Co 0.0 0.0 0.0Pvt Ltd
Total 1.00 23.27 0.07 0.36 1.01 0.96 1.37 1.89 29.93
58 ORF OCCASIONAL PAPER # 142 FEBRUARY 2018
INDIAN INVESTMENTS IN AFRICA: SCALE, TRENDS, AND POLICY RECOMMENDATIONS
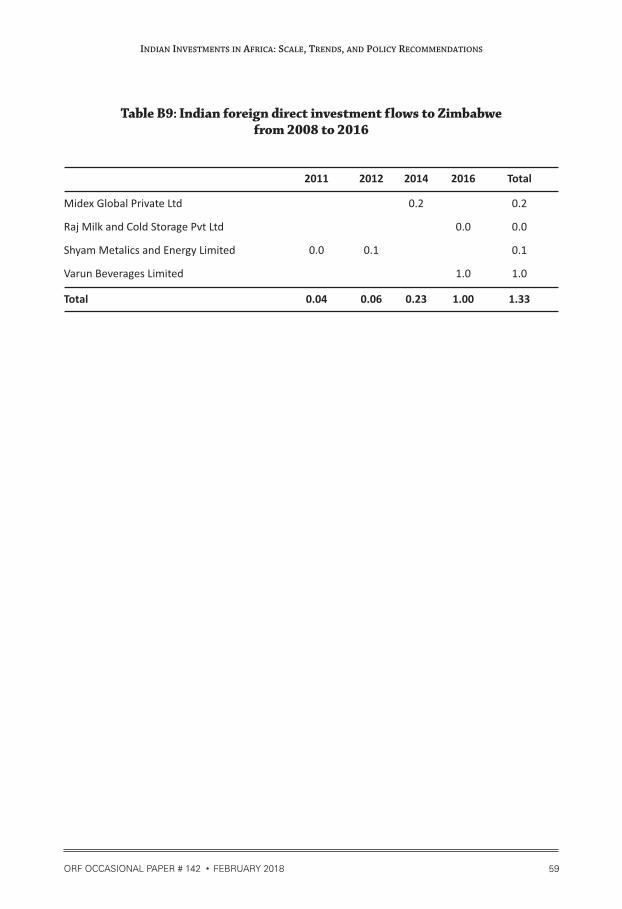
Table B9: Indian foreign direct investment flows to Zimbabwe from 2008 to 2016
2011 2012 2014 2016 Total
Midex Global Private Ltd 0.2 0.2
Raj Milk and Cold Storage Pvt Ltd 0.0 0.0
Shyam Metalics and Energy Limited 0.0 0.1 0.1
Varun Beverages Limited 1.0 1.0
Total 0.04 0.06 0.23 1.00 1.33
59ORF OCCASIONAL PAPER # 142 FEBRUARY 2018
INDIAN INVESTMENTS IN AFRICA: SCALE, TRENDS, AND POLICY RECOMMENDATIONS

ENDNOTES
1. Jørgen Dige Pedersen, “Is Indian FDI Developmental?” In Transnational
Corporations and Development Policy Critical Perspectives, Eds. Eric
Rugraff, Diego Sánchez-Ancochea and Andy Sumner (Palgrave Macmillan,
2009), 105-136.
2. Sanjay Kumar Pradhan, “India and Africa: Quest for Oil and Gas”, Indian
Foreign Affairs Journal 7, no 3 (2012), 284
3. “World Investment Report 2016,” (Geneva: United Nations, 2016)
4. Sanjay Kumar Pradhan, “India and Africa: Quest for Oil and Gas”, Indian
Foreign Affairs Journal 7, no 3 (2012), 284
5. “World Investment Report 2017,” (Geneva: United Nations, 2017)
6. Ibid.
7. “India-Africa: South-South Trade and Investment for Development”, (New
Delhi: CII), https://www.wto.org/english/tratop_e/devel_e/a4t_e/global_
review13prog_e/india_ africa_report.pdf
8. S Prahalathan et al, “Outward Direct Investment from India: Trends,
Objectives and Policy Perspectives”, Occasional Paper No. 165. Export-
Import Bank of India, 2014.
9. Sinate et al, “West Africa: A Study of India's Trade and Investment
Potential”, Occasional Paper No. 158. Export-Import Bank of India, 2013.
10. Chris Alden and Raj Verma, “India's Pursuit of Investment Opportunities in
Africa” In India and Africa's Partnership: A Vision for a New Future, Eds.
Ajay Kumar Dubey and Aparajita Biswas (New Delhi: Springer, 2016)
11. Lucey, Amanda et al, “India–Africa relations: The role of the private sector”,
ISS Paper 285. Institute for Security Studies, 2015.
12. “India-Africa: South-South Trade Investment for Development”, CII/WTO,
2013.
13. S Prahalathan et al, Outward Direct Investment from India: Trends,
Objectives and Policy Perspectives”, Occasional Paper No. 165. Export-
Import Bank of India, 2014.
14. David Rowlands, “FID on Mozambique LNG project expected in April – June
2018”, LNG Industry, April 6, 2017, https://www.lngindustry.com/
60 ORF OCCASIONAL PAPER # 142 FEBRUARY 2018
INDIAN INVESTMENTS IN AFRICA: SCALE, TRENDS, AND POLICY RECOMMENDATIONS

liquefaction/06042017/ fid-on-mozambique-lng-project-expected-in-april-
june-2018/
15. Rakhi Majumdar and Debjoy Sengupta, “Coal India Limited seeks alternative
coal blocks from Mozambique government”, Economic Times, September
26, 2016, http://economictimes.indiatimes.com/industry/indl-
goods/svs/metals-mining/coal-india-limited-seeks-alternative-coal-blocks-
from-mozambique-government/ articleshow/54515700.cms
16. Avinash Nair, “Surrender of 37 oil & gas blocks: GSPC rapped over its failure
to assess risks”, Indian Express, April 1, 2016, http://indianexpress.com/
article/cities/ ahmedabad/surrender-of-37-oil-gas-blocks-gspc-rapped-
over-its-failure-to-assess-risks/
17. Viswanath Pilla, “Coromandel's Tunisia phosphoric acid plant starts
operations”, Livemint, July 12, 2013,
18. Shantanu Guha Ray, “Some significant conversations in Tunisia”, Times of
India, March 2, 2017, http://blogs.timesofindia.indiatimes.com/
newshound-tales/some-significant-conversations-in-tunisia/
19. “Kanoria Chemicals' denim unit in Ethiopia goes on stream”, Hindu Business
Line, October 27, 2015, http://www.thehindubusinessline.com/
companies/ kanoria-chemicals-announces-completion-of-ethiopian-
denim-unit/ article7810066.ece
20. “India's Allana to Build Ethiopia Meat Processing Plant”, Addis Standard,
April 4, 2014, http://addisstandard.com/indias-allana-to-build-ethiopia-
meat-processing-plant/
21. “The Busan Partnership for Effective Development Cooperation”,
Organisation for Economic Co-operation and Development (OECD), July
2012, https://www.oecd.org/ dac/effectiveness/Busan%20partnership.pdf
22. Göran Eklöf, “The Future Role of the Private Sector in Development
Cooperation: an overview of key policy processes”, CONCORD Sweden,
June 2014, http://www.concord.se/wp-content/uploads/Kartlaggning-
privata-sektorn.pdf
23. Swedfund, http://www.swedfund.se/en/the-offer/
24. Prabodh Saxena, “India's credit lines: Instrument of economic diplomacy” In
India's Approach to Development Cooperation, Eds. Sachin Chaturvedi and
Anthea Mulakala (Routledge, 2016), 60-79.
61ORF OCCASIONAL PAPER # 142 FEBRUARY 2018
INDIAN INVESTMENTS IN AFRICA: SCALE, TRENDS, AND POLICY RECOMMENDATIONS

25. John Samuel and Abraham George, “Future of Development Cooperation:
Policy Priorities for an Emerging India”, Oxfam India, July 2016
26. Nawa Mutumweno“Zambia: Indian investment in Zambia grows”, SHOUT-
AFRICA, March 19, 2011,
27. Ibid.
28. David Sinate et al, “East African Community (EAC): A Study of India's Trade
and Investment Potential”, Occasional Paper No. 166. Export-Import Bank
of India. 2014.
29. S Prahalathan et al, “Outward Direct Investment from India: Trends,
Objectives and Policy Perspectives”, Occasional Paper No. 165. Export-
Import Bank of India, 2014.
30. Confederation of Indian Industries (CII), “India's Development Cooperation
with Africa: What Role for the Private Sector”, (New Delhi: CII)
31. Göran Eklöf, “The Future Role of the Private Sector in Development
Cooperation: an overview of key policy processes”, CONCORD Sweden, June
2014, http://www.concord.se/wp-content/uploads/Kartlaggning-privata-
sektorn.pdf
32. Chris Alden and Raj Verma, “India's Pursuit of Investment Opportunities in
Africa” In India and Africa's Partnership: A Vision for a New Future, Eds.
Ajay Kumar Dubey and Aparajita Biswas (New Delhi: Springer, 2016)
apr/22/drone-with-radiation-sign-lands-on-roof-of-japanese-prime-
ministers-office
62 ORF OCCASIONAL PAPER # 142 FEBRUARY 2018
INDIAN INVESTMENTS IN AFRICA: SCALE, TRENDS, AND POLICY RECOMMENDATIONS
