indian river county impact fee update … river county impact fee update workshop ... waste, public...
TRANSCRIPT

INDIAN RIVER COUNTY IMPACT FEE UPDATE WORKSHOP
Indian River County will be conducting an impact fee workshop at the date, time, and location shown below. The purpose of this workshop is to discuss a draft impact fee update report covering the following impact fee categories: Correctional Facilities, Solid Waste, Public Education, Libraries, Fire/Emergency Services, Law Enforcement, Public Buildings, Parks, and Traffic. All interested parties are welcome.
THURSDAY, MAY 24, 2007 1:30 P.M.
COMMISSION CHAMBERS COUNTY ADMINISTRATION BUILDING
1840 25TH STREET, VERO BEACH, FL 32960
The Impact Fee Update Report will be available after May 18, 2007. Please visit the County’s website at www.ircgov.com to download a copy or contact Rachel Clyne, Planner, Long Range Planning at 772-226-1923 or [email protected]. Anyone who needs a special accommodation for this meeting must contact the County’s Americans with Disabilities Act Coordinator at (772) 226-1223, at least 48 hours in advance of the meeting.

IImmppaacctt FFeeee UUppddaattee IInnddiiaann RRiivveerr CCoouunnttyy,, FFlloorriiddaa
TTeecchhnniiccaall MMeemmoorraanndduumm ##33 ((FFiinnaall))
in association with
Dr. James C. Nicholas Thomas G. Wright, Esq.
___________________________
April 30, 2007

Table of Contents EXECUTIVE SUMMARY................................................................................................................1 INTRODUCTION.............................................................................................................................3
Legal Framework .............................................................................................................................3 Level of Service................................................................................................................................6 Service Areas ....................................................................................................................................8
TRAFFIC ..............................................................................................................................................9 Major Roadway System.................................................................................................................10 Current Level of Service...............................................................................................................10 Cost per Service Unit ....................................................................................................................12 Revenue Credits .............................................................................................................................17 Travel Demand ..............................................................................................................................24 Updated Fee Schedule ..................................................................................................................27 Revenue Projections......................................................................................................................31
SCHOOLS..........................................................................................................................................32 Current Level of Service...............................................................................................................32 Cost Component ...........................................................................................................................37 Revenue Credits .............................................................................................................................40 Student Generation Rate ..............................................................................................................43 Updated Impact Fee Schedule.....................................................................................................46 Revenue Projections......................................................................................................................46
PARKS ................................................................................................................................................48 Current Level of Service...............................................................................................................49 Revenue Credits .............................................................................................................................53 Updated Impact Fee Schedule.....................................................................................................56 Revenue Projections......................................................................................................................57
LIBRARIES........................................................................................................................................58 Current Level of Service...............................................................................................................58 Revenue Credits .............................................................................................................................60 Updated Impact Fee Schedule.....................................................................................................64 Revenue Projections......................................................................................................................64
FIRE RESCUE ..................................................................................................................................65 Current Level of Service...............................................................................................................66 Revenue Credits .............................................................................................................................68 Updated Impact Fee Schedule.....................................................................................................71 Revenue Projections......................................................................................................................74
LAW ENFORCEMENT .................................................................................................................75 Current Level of Service...............................................................................................................75 Revenue Credits .............................................................................................................................77 Updated Impact Fee Schedule.....................................................................................................80 Revenue Projections......................................................................................................................84
CORRECTIONS...............................................................................................................................85 Current Level of Service...............................................................................................................85 Revenue Credits .............................................................................................................................87 Updated Impact Fee Schedule.....................................................................................................90 Revenue Projections......................................................................................................................93

PUBLIC BUILDINGS .....................................................................................................................94 Current Level of Service...............................................................................................................94 Current Level of Service...............................................................................................................95 Revenue Credits .............................................................................................................................96 Updated Impact Fee Schedule.....................................................................................................99 Revenue Projections....................................................................................................................102
SOLID WASTE...............................................................................................................................103 Service Unit ..................................................................................................................................104 Current Level of Service.............................................................................................................106 Revenue Credits ...........................................................................................................................112 Updated Impact Fee Schedule...................................................................................................113 Revenue Potential ........................................................................................................................116
APPENDIX A: POPULATION AND DEMOGRAPHICS..................................................117 APPENDIX B: FUNCTIONAL POPULATION....................................................................120 APPENDIX C: MAJOR ROADWAY INVENTORY ............................................................125 APPENDIX D: PARK INVENTORY.......................................................................................131 APPENDIX E: AVERAGE LAND COSTS .............................................................................135
List of Tables Table 1. Impact Fee Update Summary ............................................................................................2 Table 2. Existing Major Roadway System Level of Service........................................................11 Table 3. Planned Improvement Costs ...........................................................................................14 Table 4 Weighted Average Cost per Lane-Mile ...........................................................................15 Table 5. Capacity Added by Planned Road Improvements........................................................16 Table 6. Road Cost per Service Unit..............................................................................................17 Table 7. Fuel Tax Distribution per Penny per Gallon, FY 2006-07..........................................17 Table 8. Historic Local Option Gas Tax Funding, FY 2002-2007............................................18 Table 9. Historic Optional Sales Tax Funding, FY 2002-2007 ..................................................19 Table 10. Future Local Option Gas Tax Funding, FY 2008-2012 ............................................19 Table 11. Future Optional Sales Tax Funding, FY 2008-2012 ..................................................20 Table 12. Local Funding Credit per Gallon ..................................................................................20 Table 13. FDOT Work Program, FY 2001-2006.........................................................................21 Table 14. FDOT Work Program, FY 2007-2012.........................................................................22 Table 15. State Road Projects in 2030 LRTP, FY 2013 to 2030................................................22 Table 16. Federal/State Gas Tax Funding Credit per Gallon....................................................23 Table 17. Road Credit per Gallon ..................................................................................................23 Table 18. Vehicle-Miles of Travel on Major Roadway System ..................................................25 Table 19. Expected Local Vehicle-Miles of Travel ......................................................................26 Table 20. Trip Length Calibration Factor .....................................................................................26 Table 21. Updated Traffic Impact Fee Schedule..........................................................................28 Table 22. Comparison of Current and Updated Traffic Impact Fees.......................................29 Table 23. Traffic Impact Fee Revenue Estimates ........................................................................31 Table 24. Inventory of Public Schools, 2007................................................................................34 Table 25. Public School Enrollment and Capacity, 2007-2011..................................................35 Table 26. Recent School Construction Costs ...............................................................................37

Table 27. Estimated Local School Building Costs per Square Foot..........................................38 Table 28. School Bus Cost per Student .........................................................................................39 Table 29. School Capital Cost per Student ...................................................................................40 Table 30. Planned School Capital Expenditures and Revenues, 2007-2011 ............................41 Table 31. School State Revenue Credit..........................................................................................42 Table 32. School Capital Improvements Tax Revenue Credit ...................................................42 Table 33. School Past Property Tax Credit Percentage...............................................................43 Table 34. School Net Cost per Student .........................................................................................43 Table 35. Uncalibrated Student Generation Rates, 2000 ............................................................44 Table 36. Calibrated Student Generation Rates, 2007.................................................................44 Table 37. Comparison of Student Generation Rates...................................................................45 Table 38. Updated School Impact Fee Schedule..........................................................................46 Table 39. Comparative School Impact Fees .................................................................................46 Table 40. School Demand and Cost Analysis, 2007-2025 ..........................................................46 Table 41. School Impact Fee Revenue Estimates ........................................................................47 Table 42. Current Parks and Recreation Level of Service ..........................................................49 Table 43. Landscaping and Site Improvements Cost per Acre..................................................50 Table 44. Utilities and Paving Cost per Acre................................................................................50 Table 45. Total Land Cost per Developed Acre ..........................................................................51 Table 46. Parks Facility Replacement Cost ...................................................................................52 Table 47. Total Park Cost per Person............................................................................................53 Table 48. Historical Park Improvements, 2002-2007..................................................................54 Table 49. Planned Park Improvements, 2008-2012.....................................................................55 Table 50. Park Annual Revenue Credit per Person .....................................................................55 Table 51. Park Past Property Tax Percentage...............................................................................56 Table 52. Park Net Cost per Person ..............................................................................................56 Table 53. Updated Park Impact Fee Schedule..............................................................................57 Table 54. Comparative Park Impact Fees .....................................................................................57 Table 55. Park Impact Fee Revenue Estimates ............................................................................57 Table 56. Library Building and Land Replacement Cost ............................................................59 Table 57. Library Building Cost per Square Foot ........................................................................59 Table 58. Library Land Cost per Acre ...........................................................................................59 Table 59. Library Collections Replacement Cost .........................................................................60 Table 60. Library Cost per Person..................................................................................................60 Table 61. Historical Library Improvements, 2002-2007 .............................................................61 Table 62. Library Annual Revenue Credit per Person ................................................................62 Table 63. Library Past Property Tax Percentage ..........................................................................63 Table 64. Library Net Cost per Person..........................................................................................63 Table 65. Updated Library Impact Fee Schedule.........................................................................64 Table 66. Comparative Library Impact Fees.................................................................................64 Table 67. Library Impact Fee Revenue Estimates .......................................................................64 Table 68. Fire Rescue Building and Land Cost ............................................................................66 Table 69. Fire Rescue Vehicle Cost................................................................................................66 Table 70. Fire Rescue Capital Equipment Cost............................................................................67 Table 71. Fire Rescue Cost per Functional Population...............................................................67 Table 72. Historical Fire Rescue Improvements, 2002-2007 .....................................................69 Table 73. Planned Fire Rescue Improvements, 2008-2012 ........................................................70 Table 74. Fire Rescue Annual Credit per Functional Population..............................................70

Table 75. Fire Rescue Net Cost per Functional Population.......................................................71 Table 76. Updated Fire Rescue Net Cost Schedule .....................................................................71 Table 77. Comparative Fire Rescue Impact Fees.........................................................................73 Table 78. Fire Rescue Impact Fee Revenue Estimates ...............................................................74 Table 79. Law Enforcement Building and Land Cost.................................................................76 Table 80. Law Enforcement Cost per Building Square Foot .....................................................76 Table 81. Law Enforcement Vehicle and Equipment Cost........................................................77 Table 82. Law Enforcement Cost per Functional Population ...................................................77 Table 83. Historical Law Enforcement Improvements, 2002-2007..........................................78 Table 84. Law Enforcement Annual Credit per Functional Population ..................................79 Table 85. Law Enforcement Past Property Tax Percentage.......................................................79 Table 86. Law Enforcement Net Cost per Functional Population ...........................................80 Table 87. Updated Law Enforcement Impact Fee Schedule......................................................81 Table 88. Comparative Law Enforcement Impact Fees .............................................................83 Table 89. Law Enforcement Impact Fee Revenue Estimates ....................................................84 Table 90. Corrections Building and Land Cost ............................................................................86 Table 91. Corrections Vehicle and Equipment Cost ...................................................................86 Table 92. Corrections Cost per Functional Population...............................................................87 Table 93. Historical Corrections Improvements, 2002-2007 .....................................................88 Table 94. Corrections Annual Credit per Functional Population..............................................89 Table 95. Corrections Past Property Tax Percentage ..................................................................89 Table 96. Corrections Net Cost per Functional Population.......................................................90 Table 97. Updated Corrections Impact Fee Schedule.................................................................90 Table 98. Comparative Corrections Impact Fees.........................................................................92 Table 99. Corrections Impact Fee Revenue Estimates ...............................................................93 Table 100. Public Buildings Facility and Land Cost ....................................................................95 Table 101. Public Buildings Cost per Functional Population ....................................................96 Table 102. Historical Public Buildings Improvements, 2002-2007 ...........................................97 Table 103. Public Buildings Annual Credit per Functional Population....................................98 Table 104. Public Buildings Past Property Tax Percentage........................................................98 Table 105. Public Buildings Net Cost per Functional Population.............................................99 Table 106. Updated Public Buildings Impact Fee Schedule.......................................................99 Table 107. Comparative Public Buildings Impact Fees.............................................................101 Table 108. Public Buildings Impact Fee Revenue Estimates ...................................................102 Table 109. Waste Generation Units by Land Use Type............................................................104 Table 110. Total Existing Waste Generation Units ...................................................................106 Table 111. Convenience Center Cost per Residential WGU ...................................................107 Table 112. Recycling Cost per WGU...........................................................................................108 Table 113. Landfill Acreage and Capacity ...................................................................................110 Table 114. Landfill Land and Vehicle Cost.................................................................................111 Table 115. Landfill Class I Recoupment Cost per WGU .........................................................112 Table 116. Solid Waste Cost Summary per WGU .....................................................................112 Table 117. Updated Solid Waste Impact Fee Schedule.............................................................113 Table 118. Comparative Solid Waste Impact Fees ....................................................................115 Table 119. Solid Waste Impact Fee Revenue Estimates ...........................................................116 Table 120. Persons per Unit, 2000 ...............................................................................................117 Table 121. Person per Single-Family Unit by Size, U.S. 2003..................................................118 Table 122. Persons per Unit, with Single-Family Tiering .........................................................118

Table 123. Existing Housing Units and Population, 2007........................................................118 Table 124. Permanent, Year-Round Population, 2007-2025....................................................119 Table 125. Functional Population per Unit for Residential Land Uses ..................................121 Table 126. Functional Population per Unit for Nonresidential Land Uses ...........................122 Table 127. Total Functional Population by Service Area, 2007...............................................123 Table 128. Functional Population, 2007-2025............................................................................124 Table 129. Existing Major Roadway Inventory – Principal Arterial Roads ...........................125 Table 130. Existing Major Roadway Inventory – Minor Arterial Roads ................................126 Table 131. Existing Major Roadway Inventory – Collector Roads .........................................128 Table 132. Existing Park Inventory..............................................................................................131 Table 133. Average Land Cost, 40-to-160-Acre Parcels, 2006.................................................135 Table 134. Average Land Cost, 4-to-6-Acre Parcels, 2006.......................................................135
List of Figures Figure 1. Population Growth, 2000-2025........................................................................................3 Figure 2. Indian River County 2030 Planned Roadway Improvements ...................................13 Figure 3. Locations of Existing Public Schools............................................................................33 Figure 4. Location of Existing County Parks ...............................................................................48 Figure 5. Locations of Existing Library Facilities ........................................................................58 Figure 6. Fire Station Locations......................................................................................................65 Figure 7. Public Building Locations Map ......................................................................................94 Figure 8. Solid Waste Locations ...................................................................................................103 Figure 9. Layout of the Existing Landfill Site.............................................................................109 Figure 10. Nonresidential Functional Population Formula......................................................121

Impact Fee Update Technical Memorandum #3 (Final) Indian River County, Florida April 30, 2007 1
EXECUTIVE SUMMARY This report updates Indian River County’s traffic, schools, parks, libraries, fire rescue, law enforcement, corrections, public buildings and solid waste impact fees. With the exception of the traffic impact fee, which the County has had for some time and which was updated a year earlier, the current fees were adopted in 2005 based on Tindale-Oliver & Associates, Indian River County Impact Fee Study, May 2005 (referred to here as the “previous study”). The current traffic impact fee was adopted in 2004 based on Tindale-Oliver & Associates, Update of the Traffic Impact Fee Ordinance, February 2004. Several deviations from the methodology used in the previous study were made to simplify the impact fee system. The first major change was to base all of the updated fees at or below the existing level of service. The previous study had based several of the fees on the higher level of service anticipated to be provided in five years. In this study, the corrections and public buildings fees are based on a future level of service that is somewhat lower than the current level of service, in recognition of the fact that the current major jail and public building expansions to be completed this year will not be repeated in the near future. Another major deviation from the methodology employed in the previous study for four of the facilities addressed in this report (fire rescue, law enforcement, corrections and public buildings) is a significant simplification of the “functional population” calculations. For the most part, this change has little effect on the resulting impact fees. The one exception is the fee for public buildings. The previous study used an 11-hours-per-day, 5-days-per-week functional population for public buildings, rather than the 24-hours-per-day, 7-days-per-week functional population used for the other three facilities. This had the effect of putting most of the burden of public building costs on nonresidential development, since few people are home during the daylight weekday hours when public buildings are open. In this update, the 24-hours-per-day functional population approach has been used for all four facilities. This change results in higher public building impact fees for residential land uses and lower fees for nonresidential land uses, although overall revenues will increase significantly. Major changes are also proposed for the solid waste fee methodology. The previous study based the fees on the percent of the cost of incremental landfill improvements (such as creating new disposal cells) attributable to the disposal of waste from new development, and attributed convenience center costs to all development. This study recoups the cost of upfront landfill investments (land and heavy machinery) that will be consumed by new development, and allocates convenience center costs only to residential development. This latter change has the effect of significantly reducing solid waste fees for nonresidential land uses. In addition, overall fee revenues will decline somewhat, even if growth continues as in the recent past. In Table 1 below, the current and updated amounts for all of the County’s impact fees are shown for five typical land uses (2,000-square-foot single-family unit, multi-family unit, 1,000 square feet of retail in a 100,000 square-foot shopping center, 1,000 square feet of office in a 100,000 square-foot office building, and 1,000 square feet of industrial). Residential fees increase more than nonresidential fees, due primarily to significant increases in school and park fees, which are paid only by residential development

Impact Fee Update Technical Memorandum #3 (Final) Indian River County, Florida April 30, 2007 2
Table 1. Impact Fee Update Summary
Impact Fee/Land Use TypeImpact
Unit Proposed CurrentIncrease/Decrease
PercentChange
Traffic Dwelling $7,927 $5,202 $2,725 52%Schools Dwelling $4,411 $1,756 $2,655 151%Parks Dwelling $2,546 $1,463 $1,083 74%Libraries Dwelling $563 $483 $80 17%Fire/Rescue Dwelling $339 $278 $61 22%Law Enforcement Dwelling $362 $245 $117 48%Corrections Dwelling $223 $170 $53 31%Public Buildings Dwelling $467 $206 $261 127%Solid Waste Dwelling $82 $75 $7 9%Total, Single-Family (2,000 sf) Dwelling $16,838 $9,803 $7,035 72%
Traffic Dwelling $4,329 $2,842 $1,487 52%Schools Dwelling $1,079 $500 $579 116%Parks Dwelling $1,336 $884 $452 51%Libraries Dwelling $295 $285 $10 4%Fire/Rescue Dwelling $178 $176 $2 1%Law Enforcement Dwelling $190 $148 $42 28%Corrections Dwelling $117 $100 $17 17%Public Buildings Dwelling $245 $121 $124 102%Solid Waste Dwelling $62 $57 $5 9%Total, Multi-Family Dwelling $7,769 $5,056 $2,713 54%
Traffic 1,000 sf $12,005 $7,813 $4,192 54%Fire/Rescue 1,000 sf $626 $502 $124 25%Law Enforcement 1,000 sf $668 $439 $229 52%Corrections 1,000 sf $412 $312 $100 32%Public Buildings 1,000 sf $863 $1,527 -$664 -43%Solid Waste 1,000 sf $41 $236 -$195 -83%Total, Retail (100,000 sf) 1,000 sf $14,574 $10,593 $3,981 38%
Traffic 1,000 sf $8,115 $5,326 $2,789 52%Fire/Rescue 1,000 sf $162 $130 $32 25%Law Enforcement 1,000 sf $173 $114 $59 52%Corrections 1,000 sf $107 $81 $26 32%Public Buildings 1,000 sf $224 $555 -$331 -60%Solid Waste 1,000 sf $16 $94 -$78 -83%Total, Office (100,000 sf) 1,000 sf $8,557 $5,651 $2,575 51%
Traffic 1,000 sf $4,263 $2,797 $1,466 52%Fire/Rescue 1,000 sf $150 $120 $30 25%Law Enforcement 1,000 sf $160 $105 $55 52%Corrections 1,000 sf $99 $75 $24 32%Public Buildings 1,000 sf $207 $512 -$305 -60%Solid Waste 1,000 sf $41 $236 -$195 -83%Total, General Industrial 1,000 sf $4,879 $3,609 $1,270 35% Source: Traffic, schools, parks, libraries, fire rescue, law enforcement, corrections, public buildings, and solid waste fees from Table 21, Table 38, Table 53, Table 65, Table 76, Table 87, Table 97, Table 106 and Table 117, respectively; fees do not include administrative charge.

Impact Fee Update Technical Memorandum #3 (Final) Indian River County, Florida April 30, 2007 3
INTRODUCTION Figure 1. Population Growth, 2000-2025
Impact fees are most appropriate for jurisdictions experiencing rapid growth. Indian River County (IRC) has been experiencing significant growth over the past two decades, and this growth is projected to continue. The population of the county increased by 51 percent in the 1980s and by 24 percent in the 1990s. The population is projected to increase by another 70 percent from 2000 to 2025 (see Figure 1). This section provides a legal background, general information about impact fee principles and a description of the role of level of service in impact fee analysis. Assumptions and resulting population estimates for 2007 and projections through the year 2025 (in five-year increments) are presented and summarized in Appendix A for use, as appropriate, within each of the impact fee program areas. Functional population estimates and projections, as well as a discussion of what functional population is, are provided in Appendix B.
Legal Framework Impact fees are a way for local governments to require new developments to pay a proportionate share of the infrastructure costs they impose on the community. In contrast to traditional “negotiated” developer exactions, impact fees are charges that are assessed on new development using a standard formula based on objective characteristics, such as the number and type of dwelling units constructed. The fees are one-time, up-front charges, with the payment usually made at the time of building permit issuance. Essentially, impact fees require that each new development project pay its pro-rata share of the cost of new capital facilities required to serve that development. Since impact fees were pioneered in states like Florida that lacked specific enabling legislation, such fees have generally been legally defended as an exercise of local government’s broad “police power” to regulate land development in order to protect the health, safety and welfare of the community. The courts have developed guidelines for constitutionally-valid impact fees, based on “rational nexus” standards. The standards essentially require that the fees must be proportional to the need for additional infrastructure created by the new development, and must be spent in such a way as to provide that same type of infrastructure to benefit new development. A Florida district court of appeals described the dual rational nexus test in 1983 as follows, and this language was quoted and followed by the Florida Supreme Court in its 1991 St. Johns County decision:
In order to satisfy these requirements, the local government must demonstrate a reasonable connection, or rational nexus, between the need for additional capital facilities and the growth in population generated by the subdivision. In addition, the government must show a reasonable connection, or rational nexus, between the expenditures of the funds collected and the benefits

Impact Fee Update Technical Memorandum #3 (Final) Indian River County, Florida April 30, 2007 4
accruing to the subdivision. In order to satisfy this latter requirement, the ordinance must specifically earmark the funds collected for use in acquiring capital facilities to benefit the new residents.
Florida Statutes The 2006 Florida Legislature passed Senate Bill 1194, which establishes certain requirements for impact fees in Florida. The bill, which became effective on June 14, 2006, created a new Section 163.31801, Florida Statutes, which reads as follows: 163.31801 Impact fees; short title; intent; definitions; ordinances levying impact fees.-- (1) This section may be cited as the "Florida Impact Fee Act."
(2) The Legislature finds that impact fees are an important source of revenue for a local government to use in funding the infrastructure necessitated by new growth. The Legislature further finds that impact fees are an outgrowth of the home rule power of a local government to provide certain services within its jurisdiction. Due to the growth of impact fee collections and local governments' reliance on impact fees, it is the intent of the Legislature to ensure that, when a county or municipality adopts an impact fee by ordinance or a special district adopts an impact fee by resolution, the governing authority complies with this section.
(3) An impact fee adopted by ordinance of a county or municipality or by resolution of a special district must, at minimum:
(a) Require that the calculation of the impact fee be based on the most recent and localized data.
(b) Provide for accounting and reporting of impact fee collections and expenditures. If a local governmental entity imposes an impact fee to address its infrastructure needs, the entity shall account for the revenues and expenditures of such impact fee in a separate accounting fund.
(c) Limit administrative charges for the collection of impact fees to actual costs.
(d) Require that notice be provided no less than 90 days before the effective date of an ordinance or resolution imposing a new or amended impact fee.
(4) Audits of financial statements of local governmental entities and district school boards which are performed by a certified public accountant pursuant to s. 218.39 and submitted to the Auditor General must include an affidavit signed by the chief financial officer of the local governmental entity or district school board stating that the local governmental entity or district school board has complied with this section.
Other provisions relating to impact fees are scattered about in the Florida Statutes. Section 163.2517(3)(j) requires that urban infill and redevelopment area plans contain a package of financial incentives, one of which could be “lower transportation impact fees for development which encourages more use of public transit, pedestrian and bicycle modes of transportation.” School concurrency provisions in Section 163.3180(13)(e)2 state that if developers make proportionate-

Impact Fee Update Technical Memorandum #3 (Final) Indian River County, Florida April 30, 2007 5
share mitigation contributions, “the local government shall credit such a contribution, construction, expansion, or payment toward any other impact fee or exaction imposed by local ordinance for the same need, on a dollar-for-dollar basis at fair market value.” Transportation concurrency provisions relating to multi-modal transportation districts provide in Section 163.3180(15)(d) that “local governments may reduce impact fees or local access fees for development within multi-modal transportation districts based on the reduction of vehicle trips per household or vehicle miles of travel expected from the development pattern planned for the district.” Transportation concurrency management provisions provide in Section 163.3180(16)(b)2 that “proportionate fair-share mitigation shall be applied as a credit against impact fees to the extent that all or a portion of the proportionate fair-share mitigation is used to address the same capital infrastructure improvements contemplated by the local government's impact fee ordinance.” The boards of independent special fire control districts are authorized to establish fire impact fees in Section 191.009(4). Section 290.0057(1)(e) authorizes “impact fee abatement or reduction” as part of a package of incentives that must be put in place for enterprise zones. Developments of regional impact must be given credit for any capital contributions required as a condition of development approval, pursuant to Section 380.06(16). Local governments are encouraged to establish affordable housing incentive strategies, which may include the “modification of impact-fee requirements, including reduction or waiver of fees and alternative methods of fee payment for affordable housing,” according to Section 420.9076(4)(b). Public schools are exempted from the payment of impact fees in Section 1013.371(1)(a).
General Impact Fee Principles One of the most fundamental principles of impact fees, rooted in both case law and norms of equity, is that impact fees should not charge new development for a higher level of service than is provided to existing development. While impact fees can be based on a higher level of service than the one existing at the time of the adoption of the fees, two things are required if this is done. First, another source of funding other than impact fees must be identified and committed to fund the capacity deficiency created by the higher level of service. Second, the impact fees must generally be reduced to ensure that new development does not pay twice for the same level of service, once through impact fees and again through general taxes that are used to remedy the capacity deficiency for existing development. In order to avoid these complications, the general practice is to base the impact fees on the existing level of service. A corollary principle is that new development should not have to pay more than its proportionate share when multiple sources of payment are considered. As noted above, if impact fees are based on a higher-than-existing level of service, the fees should be reduced by a credit that accounts for the contribution of new development toward remedying the existing deficiencies. A similar situation arises when the existing level of service has not been fully paid for. Outstanding debt on existing facilities that are counted in the existing level of service will be retired, in part, by revenues generated from new development. Given that new development will pay impact fees to provide the existing level of service for itself, the fact that new development may also be paying for the facilities that provide that level of service for existing development could amount to paying for more than its proportionate share. Consequently, impact fees should be reduced to account for future payments that will retire outstanding debt on existing facilities. The issue is less clear-cut when it comes to other types of revenue that may be used to make capacity-expanding capital improvements of the same type being funded by impact fees. Arguably,

Impact Fee Update Technical Memorandum #3 (Final) Indian River County, Florida April 30, 2007 6
no credit is warranted in most cases, since, while new development may contribute toward such funding, so does existing development, and both existing and new development benefit from the higher level of service that the additional funding makes possible. Impact fee studies in Florida, however, have traditionally given credit for the portion of dedicated revenues, such as gasoline taxes, that are used for capacity-expanding improvements. This study will provide revenue credits for these types of dedicated revenues. Credit has also sometimes been provided for outstanding grants for capacity improvements that can reasonably be anticipated in the future. In addition to the argument presented above (i.e., grants raise the level of service and benefit new development as well as existing development), two additional arguments can be made against applying credit for grants. First, new development in a community does not directly pay for State and Federal grants in the same way they pay local gasoline and property taxes. Second, future grant funding is far more uncertain than dedicated revenue streams. On the other hand, local governments have less discretion about whether to spend grant funding on capacity-expanding capital improvements. In this study, credit will be provided for anticipated future Federal and State grant funding based on recent grant funding history. For the most part, impact fee studies in Florida do not give credit for past property tax payments from vacant land that is now being developed, or for future general fund expenditures for capacity-expanding improvements. However, the previous study did give credit for these types of expenditures, and this study will continue to provide such revenue credits.
Level of Service The role of level of service (LOS) in impact fee analysis is central, but often misunderstood. The previous discussion makes clear the fundamental importance of the concept of level of service in impact fee analysis. However, it is possible to address these issues without specifying a LOS standard in terms of an explicit ratio, such as acres of parkland per 1,000 residents. In reality, the LOS is a set of capital facilities, including land, buildings and equipment, that provides service to a given amount of development. Explicit LOS standards inevitably over-simplify this complex relationship by emphasizing one element of the capital facilities, such as acres of land for parks or square feet of library buildings (or, in some cases a characteristic that is not directly related to capital facilities, such as officers for law enforcement). An alternative is to calculate the level of service in terms of the replacement cost of the capital facilities provided per unit of development served. In fact, this is what impact fee calculations generally do. The choice of an explicit LOS standard to represent this relationship is generally unnecessary, and can create undesirable policy outcomes. For example, a parks and recreation system represents a capital investment in land, buildings and other improvements that provides service to residents. Reducing this relationship to a simple ratio of acres of land to population does provide a concrete, measurable indicator. However, it may unintentionally put undue emphasis on the acquisition of park land, at the expense of the provision of recreational facilities and improvements. The expansion of a park system may involve periods of extensive land acquisition, followed by periods that focus on the development of land with park improvements. Adoption of a LOS standard expressed in acres implies that only additional land acquisition can enhance the level of service. In reality, the level of service provided by a park system can be enhanced by improvements to existing land as well as by acquisition of additional land.

Impact Fee Update Technical Memorandum #3 (Final) Indian River County, Florida April 30, 2007 7
In this impact fee update, the fees are based, for the most part, on the existing levels of service. However, the levels of service do not need to be expressed in the form of simplistic ratios. Nor do explicit LOS standards need to be incorporated into the Comprehensive Plan in order for the impact fees to be consistent with the Plan. It is recommended that the specific LOS standards incorporated into the Comprehensive Plan after the previous impact fee study for non-concurrency facilities (fire rescue, law enforcement, corrections, public buildings and libraries) be replaced with a more general statement along the following lines:
Impact fees shall be based on a level of service for new development that does not exceed the level of service provided to existing development.
Of the facilities under consideration in this study, traffic, schools, parks and solid waste are subject to State concurrency requirements. The County’s adopted level of service for transportation concurrency purposes is set forth in the Capital Improvements Element of the 2020 Comprehensive Plan:
Level-of-Service “D” during peak hour, peak season, peak direction conditions, on all TRIP grant funded roads as well as all freeway, arterial, and collector roadways, with the exception of the following two, which will operate at level of service “E” plus 20%. 27th Ave – South County Line to SR 60 43rd Ave – Oslo Road to 16th Street For SIS/Florida Intrastate Highway System roadways, level of service “B” is adopted for rural areas, and level of service “C” is adopted for urban areas.
According to County staff, the two exception roads have been improved and the “E plus 20%” standard is no longer necessary. Otherwise, the concurrency LOS standard for roads should remain as it is. The traffic impact fees are based on a standard that is different from, but not inconsistent with, the adopted standard. The adopted concurrency standard is focused on individual roadway facilities and utilizes peak hour traffic. The impact fees are based on average daily traffic and focus on the system-wide ratio of capacity to demand. The County’s adopted level of service for schools is expressed in terms of building square feet per student station. These LOS standards were adopted to be consistent with the previous impact fee study, not for concurrency purposes (concurrency was not required for schools at the time). The draft interlocal agreement between the School District, the County and the municipalities for school concurrency, as approved by the School Board on February 13, 2007, establishes the following standard (the “School Service Areas” are defined as elementary, middle and high school attendance zones):
The adopted level of service for each year of the five year planning period and through the long term planning period for each School Service Area will be 100% of the FISH permanent capacity.
The proposed standard is consistent with the school impact fee analysis, which bases the fees on a district-wide ratio of one permanent FISH student capacity per enrolled regular (non-charter school) student.

Impact Fee Update Technical Memorandum #3 (Final) Indian River County, Florida April 30, 2007 8
The adopted concurrency level of service for parks is based on the previous impact fee study. The adopted LOS in the 2020 Comprehensive Plan is “6.61 recreation acres/1,000 permanent plus weighted peak seasonal population” county-wide. The County may wish to consider modifying its adopted LOS for concurrency purposes to base it on the ratio of developed park acres owned or operated by the County to the permanent population residing in unincorporated areas of the county. If the County wanted the concurrency standard to be consistent with the updated impact fees, the acreage would include State-owned land that is leased to the County on a long-term basis for a nominal rate, and would exclude enterprise facilities such as golf courses. On this basis, the current actual LOS for parks is 6.26 acres per 1,000 residents (see park impact fee analysis for detailed calculations). This LOS is based on regional, community and neighborhood parks that are currently available to residents in the unincorporated county. However, it might be prudent for the County to make the concurrency standard somewhat lower than the existing ratio. Regardless of what LOS is established for concurrency purposes, the updated park impact fees will be based on the current actual ratio of the replacement cost of existing park land and facilities to the unincorporated area residents served by these facilities. The adopted level of service for solid waste is also based on the previous impact fee study. The adopted LOS is “2.2 tons or 3.67 cubic yards per capita for permanent plus weighted peak seasonal population per year.” This update uses a “waste generation unit,” or WGU, which is equivalent to one ton per year (a single-family dwelling is estimated to generate 1.6 tons per year), as the service unit, rather than permanent plus weighted peak seasonal population. An alternative concurrency LOS service standard that is consistent with the updated impact fee service unit would be “0.77 cubic yards of class I solid waste per waste generation unit.”
Service Areas The nine types of facilities covered in this report provide service to three different service areas: county-wide, unincorporated areas only and county-wide with an exception. Traffic, schools, libraries, corrections, public buildings and solid waste facilities provide services county-wide. Parks and law enforcement (Sherriff’s Office patrol) facilities provide service to unincorporated areas only. County fire rescue service is provided to development county-wide, with the exception of Indian River Shores, which provides its own municipal fire rescue service.

Impact Fee Update Technical Memorandum #3 (Final) Indian River County, Florida April 30, 2007 9
TRAFFIC The purpose of this section of the report is to assist Indian River County in updating its existing traffic impact fee program. This traffic impact fee update maintains the current traffic impact fee (TIF) formula and local trip characteristics. The calculations in this report are based on the methodology utilized by Tindale-Oliver & Associates in their 2004 update of the traffic impact fee.1 However, one change from the methodology used in the previous study is that the trip lengths were calibrated to reflect actual travel on the major roadway system. The updated impact fee schedule is based on the most recent road cost data from the Metropolitan Planning Organization’s (MPO’s) Long Range Transportation Plan (LRTP) and the County’s adopted Capital Improvement Program (CIP), and the cost of providing additional roadway capacity on those projects. The resulting revised cost per lane-mile is then used to update the impact fee formula cost component and resulting impact fee rate schedule. The credit component update is based on an analysis of revenues that local governments and the Florida Department of Transportation (FDOT) use to construct new and expanded roads in Indian River County. This is determined by updating the number of pennies per gallon of gas tax that return to the community for non-Interstate capital improvements for State, County and municipal road improvements. The work activities accomplished as part of this effort are summarized below:
• Prepared an inventory of the major roadway system. The inventory is used to calibrate trip lengths by land use from the previous study to match existing vehicle-miles of travel (VMT) on the major roadway system. It is also used to demonstrate that there are no existing deficiencies on a system-wide basis.
• Reviewed Cost Feasible Plan of the MPO’s adopted 2030 Long Range Transportation Plan, the
five-year Transportation Improvement Program and the FDOT 2008-2012 Work Program to determine the status of which projects have been completed or are under construction.
• Updated the 2005 total cost estimates for the 2030 Cost Feasible Plan improvements based on
the construction cost inflation index published by Engineering News-Record, as well as updated cost estimates provided by the County Public Works Department.
• Calculated an updated average cost per lane-mile and per vehicle-mile of capacity (VMC)
added to the transportation network based on the adjusted cost of capacity-adding road projects in the 2030 Cost Feasible Plan.
• Identified and reviewed revenue sources used for transportation purposes; determined the
appropriate present value factor to use based on current Federal Reserve interest rate data for state and local bonds; assessed credit components of the current impact fee formula; and determined the credit amount to be applied in the impact fee formula.
1 Tindale-Oliver & Associates, Inc., Update of the Traffic Impact Fee Ordinance – Cost Estimate Variable, Indian River County, February, 2004.

Impact Fee Update Technical Memorandum #3 (Final) Indian River County, Florida April 30, 2007 10
• Prepared an updated impact fee schedule for Indian River County, based on the updated cost and credit components.
The remainder of this section reviews and summarizes the results of the work activities identified above.
Major Roadway System A traffic impact fee program should include a clear definition of the major roadway system that is to be funded with impact fees. The County’s current road impact fee system (i.e., the previous study and current ordinance) does not clearly define the major roadway system. In this update, a definition of the major road system is proposed that includes all collectors, minor arterials and major arterial roads in the county, except for I-95. The Interstate is excluded because a significant portion of the traffic on that facility is likely to be attributable to through traffic that is unrelated to new development in Indian River County. An inventory of the existing major roadway system was compiled from Table 4.7.1 of the Transportation Element of the 2020 Indian River County Comprehensive Plan. The inventory is presented in Table 129, Table 130 and Table 131 in Appendix C. The major purpose of the inventory is to ensure that the travel demand factors for individual land uses in the fee schedule are calibrated to the actual system-wide travel observed on the major roadway system. A secondary purpose is to ensure that the level of service (LOS) implicit in the standard consumption-based road impact fee methodology does not exceed the actual LOS on the major roadway system. The implicit LOS in the standard consumption-based methodology is a system-wide ratio of 1.0 between vehicle-miles of capacity (VMC) and vehicle-miles of travel (VMT) on the major roadway system.
Current Level of Service The secondary purpose for compiling the existing major roadway inventory is to determine the current level of service for impact fee purposes. Oftentimes this is taken to be a segment-specific level of service, such as “all roadway segments shall operate at LOS D or better.” This is in fact the type of level-of-service standard that Indian River County has adopted for concurrency purposes. According to the Capital Improvements Element of the 2020 Comprehensive Plan, the adopted traffic circulation level-of-service standard is:
Level-of-Service “D” during peak hour, peak season, peak direction conditions, on all TRIP grant funded roads as well as all freeway, arterial, and collector roadways, with the exception of the following two, which will operate at level of service “E” plus 20%. 27th Ave – South County Line to SR 60 43rd Ave – Oslo Road to 16th Street For SIS/Florida Intrastate Highway System roadways, level of service “B” is adopted for rural areas, and level of service “C” is adopted for urban areas.
According to the County, the two road segments that are currently allowed to function at LOS E plus 20 percent have been upgraded to four lanes and no longer require a special standard. The level

Impact Fee Update Technical Memorandum #3 (Final) Indian River County, Florida April 30, 2007 11
of service for concurrency purposes, however, is not necessarily appropriate as the level of service for impact fees. Most road impact fee systems in Florida are not really designed to provide sufficient funding to achieve or maintain such a segment-specific standard. Most road impact fees in Florida, including Indian River County’s, use the standard consumption-based methodology. This methodology essentially charges new development, for every VMT generated, the cost to add a VMC. In other words, the cost per VMT equals the cost per VMC, which implies a one-to-one ratio of VMC to VMT (cost/VMT = cost/VMC times VMC/VMT, where VMC/VMT = 1). This is conservative, because most roadway systems have more than one VMC for every VMT on a system-wide basis. However, even if capacity were to be measured using LOS D, and even if the system-wide level of service were to be set at the existing VMC/VMT ratio, and the fees were based on this level of service, it would still not necessarily be sufficient to ensure that every roadway segment would function at LOS D. A segment-specific level of service standard is simply not appropriate for impact fees calculated using a consumption-based methodology. Why then use a consumption-based methodology? One advantage is that one avoids the problem of segment-specific existing deficiencies. An improvements-based methodology based on all segments functioning at LOS D or better would inevitably create a number of existing deficiencies that could not be remedied with impact fee funds. In addition, some of the non-impact fee funds that are used to remedy the deficiency would be generated by new development, which would need to have its impact fees reduced by a deficiency credit to avoid double payment issues. With the consumption-based methodology, in contrast, there are no deficiencies as long as the system-wide ratio on which the fees are based is no higher than the actual existing VMC/VMT ratio. Another important advantage is the flexibility provided by a consumption-based system. An improvements-based methodology is tied to a specific list of planned improvements determined by a transportation plan to be needed to maintain segment-specific LOS in the face of anticipated growth. Revenues from a consumption-based fee, on the other hand, can be used on any capacity-expanding improvement. As in the prior impact fee study, capacities were based on average annual daily capacity at LOS D. There are no existing deficiencies on the existing major roadway system as a whole, as evidenced by a VMC/VMT ratio significantly greater than one.
Table 2. Existing Major Roadway System Level of Service Road Classification VMC Total VMT RatioPrincipal Arterial 1,660,554 1,116,356 1.49Minor Arterial 1,250,775 934,226 1.34Collector 1,809,904 935,285 1.94Total 4,721,233 2,985,867 1.58 Source: VMC from Table 129, Table 130 and Table 131 in Appendix C; VMT from Table 18.

Impact Fee Update Technical Memorandum #3 (Final) Indian River County, Florida April 30, 2007 12
Cost per Service Unit Expanding the capacity of the County’s major roadway system is primarily accomplished by widening existing roadway cross-sections to accommodate additional through lanes and by building new roads. The traffic impact fee is designed to cover the cost of adding capacity to the roadway system. All of the normal components of a roadway expansion project are eligible for impact fee funding, including engineering and design, right-of-way acquisition, construction of new lanes, reconstruction of existing lanes and relocation of utilities where necessary as part of a widening project, and installation of sidewalks, street lighting and landscaping as part of an improvement project.
Cost per Lane-Mile The previous impact fee update developed detailed road cost estimates for the County’s capacity-adding road projects in the 2025 Cost Feasible Plan. The road cost estimates included separate analysis of right-of-way acquisition costs for planned roads, construction cost estimates and design costs. This update is based on the local average cost to add roadway capacity to the County’s major roadway system based on the most recent cost data. The most recent and comprehensive road construction cost data were developed for Indian River County’s 2030 Cost Feasible Plan in 2005. The locations of these projects are illustrated in Figure 2. The current Cost Feasible Plan includes improvements to I-95, SR 60 and US 1. Including State road improvements in the impact fee calculation is reasonable, because the County increasingly participates in the cost of State road improvements and motor fuel tax credits are provided for the portion of gasoline taxes that are used to fund State road improvements. The improvements to I-95 are excluded from this update, since the County does not participate in construction of interstate highways, and much of the travel on such roads is through traffic unrelated to development in Indian River County. Given the array of projects in the 2030 Cost Feasible Plan and their locations throughout the County, these planned projects are representative of the current average cost to add capacity to the County’s major roadway system. For this study, the 2005 cost estimates have been inflated to 2007 values to reflect the total cost increase since the original estimates were developed. In addition, updated cost estimates have been provided for some projects by the County Public Works Department. The project costs included in Table 3 represent the updated cost of implementing all of the as-yet unconstructed 2030 Cost Feasible Plan roadway capacity improvements. The project costs utilized in updating the impact fee schedule exclude the interstate highway widening on I-95 in order to be consistent with the existing impact fee schedule and trip length methodology.

Impact Fee Update Technical Memorandum #3 (Final) Indian River County, Florida April 30, 2007 13
Figure 2. Indian River County 2030 Planned Roadway Improvements

Impact Fee Update Technical Memorandum #3 (Final) Indian River County, Florida April 30, 2007 14
Table 3. Planned Improvement Costs
Street From To82nd Ave 26th St CR 510 $28,174,165 1.056 $29,751,918 2 7.05 14.10SR 60 98th Ave I-95 $2,543,842 1.056 $2,686,297 2 0.66 1.32SR 60 I-95 82nd Ave $8,119,445 NA $21,289,000 2 1.34 2.68SR 60 82nd Ave 66th Ave - NA $33,344,000 2 2.00 4.00SR 60 6th Ave Indian River $1,864,758 NA $4,000,000 2 0.30 0.60US 1 S Co. Line Oslo Rd $12,064,823 NA $54,009,000 2 2.16 4.32US 1 Aviation Blvd Old Dixie Hwy $44,372,047 1.056 $46,856,882 2 6.70 13.40US 1 Roseland Rd N Co. Line $5,255,518 1.056 $5,549,827 2 1.00 2.00
$102,394,598 $197,486,924 21.21 42.42
12th St 90th Ave 82nd Ave $3,781,786 1.056 $3,993,566 2 1.00 2.0012th St 43rd Ave 27th Ave $2,854,618 1.056 $3,014,477 1* 1.00 1.0013th St SW 66th Ave 58th Ave $4,041,388 1.056 $4,267,706 2 1.00 2.0013th St SW 43rd Ave 34th Ave $1,560,899 1.056 $1,648,309 2 0.56 1.1213th St SW 34th Ave 27th Ave $3,359,684 1.056 $3,547,826 2 0.44 0.8813th St SW 27th Ave 20th Ave $1,922,225 1.056 $2,029,870 2 0.45 0.9017th St SW 66th Ave 58th Ave $4,019,519 1.056 $4,244,612 2 1.00 2.0026th St 66th Ave 43rd Ave $13,006,154 NA $16,006,154 2 2.00 4.0026th St 82nd Ave 74th Ave $3,850,481 1.056 $4,066,108 2 1.00 2.0027th Ave S Co. Line Oslo Rd $9,560,909 1.056 $10,096,320 2 2.00 4.0027th Ave Oslo Rd SR 60 $12,330,699 NA $24,000,000 2 3.50 7.0043rd Ave Oslo Rd 8th St $8,311,058 NA $13,000,000 2 2.00 4.0043rd Ave S Co. Line Oslo Rd $12,974,563 1.056 $13,701,139 2 2.00 4.004th St 98th Ave 66th Ave $16,262,035 1.056 $17,172,709 2 4.00 8.0053rd St 82nd Ave 66th Ave $9,599,620 1.056 $10,137,199 2 2.00 4.0066th Ave S Co. Line Oslo Rd $8,562,423 1.056 $9,041,919 2 2.00 4.0066th Ave Oslo Rd 4th St $8,887,466 1.056 $9,385,164 2 1.50 3.0066th Ave 4th St SR 60 $8,853,565 NA $15,886,425 2 2.03 4.0666th Ave SR 60 CR 510 $36,173,489 NA $84,385,664 2 7.53 15.0682nd Ave S Co. Line Oslo Rd $7,302,941 1.056 $7,711,906 2 2.00 4.008th St 82nd Ave 74th Ave $3,955,196 1.056 $4,176,687 2 1.00 2.00CR 510 CR 512 US 1 $36,369,280 NA $73,400,478 2 5.82 11.64CR 510 US 1 ICWW $3,718,539 1.056 $3,926,777 2 0.70 1.40CR 512 Fellsmere City I-95 $19,192,929 1.056 $20,267,733 2 3.10 6.20CR 512 I-95 CR 510 $13,317,010 1.056 $14,062,763 2 2.45 4.90CR 512 CR 510 Roseland $6,674,370 NA $15,100,000 2 1.30 2.60Indian Rvr Bvd Royal Palm 37th St $8,678,255 NA $11,000,000 2 1.00 2.00Laconia St CR 510 Concha Dr $11,076,344 1.056 $11,696,619 2 0.55 1.10Oslo Rd I-95 58th Ave $19,484,669 1.056 $20,575,810 2 3.25 6.50Roseland Rd CR 512 US 1 $12,847,897 1.056 $13,567,379 1* 4.70 4.70Schumann Dr CR 510 Barber St $3,974,335 1.056 $4,196,898 2 0.82 1.64
$316,504,346 $449,308,217 63.70 121.70
Aviation Blvd 43rd Ave US 1 $8,537,828 NA $18,000,000 2 1.93 3.86Aviation Blvd US 1 Indian River $14,387,771 NA $30,000,000 4 1.06 4.24Barber St Schumann Dr US 1 $3,621,587 1.056 $3,824,396 1* 1.30 1.30Barber St CR 512 Schumann Dr $7,596,306 1.056 $8,021,699 1* 2.70 2.70Fleming St Easy St US 1 $4,838,861 1.056 $5,109,837 2 1.20 2.40
$38,982,353 $64,955,932 8.19 14.50
Total $457,881,297 $711,751,073 93.10 178.62
Subtotal, FDOT Projects
Subtotal, County Projects
Subtotal, City Projects
Lane-miles
Project Limits Total Cost (2007)
Added Lanes Miles
Total Cost (2005)
Cost Factor
* No new traffic lanes (capacity enhanced by adding a median and turn lanes to an existing two-lane road) Source: Indian River County Metropolitan Planning Organization, 2006 Priority Projects Report, 2006, Table A-9; miles scaled by Duncan Associates; cost factor is Engineering News-Record Construction Cost Index, annual 2005 to April 2007 (NA indicates updated costs provided by IRC Public Works Department, February 28, March 9 and March 21, 2007).

Impact Fee Update Technical Memorandum #3 (Final) Indian River County, Florida April 30, 2007 15
One of the key inputs into the road impact fee formula is the cost per lane-mile to construct new roadway capacity. The current impact fee methodology is based on the consumption-based approach, in which roadway construction costs are entered into the formula as an average cost for providing new roadway capacity. This average unit cost reflects the relationship between the total project costs and the total number of lane-miles that is to be constructed. As shown in Table 4, the weighted average cost per lane-mile is approximately $4.0 million.
Table 4 Weighted Average Cost per Lane-Mile
Source Total CostLane-Mi.
AddedCost per
Lane-MileIndian River County Projects $449,308,217 121.70 $3,691,933FDOT Projects $197,486,924 42.42 $4,655,514City Projects $64,955,932 14.50 $4,479,719Total $711,751,073 178.62 $3,984,722 Source: Total cost and lane-miles from Table 3.
Roadway Capacity Cost In order to determine the cost of new capacity added by planned road improvements, the consultant reviewed existing and planned roadway characteristics and determined the amount of capacity added by each road project. As in the prior impact fee study, the analysis of the capacity of Indian River County’s road improvements is based on the generalized planning capacity estimates promulgated by the Florida Department of Transportation (FDOT). These capacity estimates are based on Highway Capacity Manual procedures and take into consideration roadway cross-sections, left turn bays at intersections, the spacing of signalized intersections and the characteristics of the area (i.e., rural, rural developed, transitioning to urban and urbanized). As in the prior impact fee study, capacities were based on average annual daily capacity at LOS D. The average capacity per new lane-mile is determined based on the same set of improvements used to determine the average cost per lane-mile. Table 5 shows the total vehicle-miles of capacity added by planned improvements. As noted earlier, these improvements exclude Interstate projects in Indian River County, such as the widening of I-95.

Impact Fee Update Technical Memorandum #3 (Final) Indian River County, Florida April 30, 2007 16
Table 5. Capacity Added by Planned Road Improvements
Street From To Before After NewSR 60 98th Ave I-95 0.66 2 1.32 35,700 53,500 17,800 11,748SR 60 I-95 82nd Ave 1.34 2 2.68 35,700 53,500 17,800 23,852SR 60 82nd Ave 66th Ave 2.00 2 4.00 35,700 53,500 17,800 35,600SR 60 6th Ave Indian River Blvd 0.30 2 0.60 32,700 49,200 16,500 4,950US 1 S. County Line Oslo Rd 2.16 2 4.32 35,700 53,500 17,800 38,448US 1 Aviation Blvd Old Dixie Hwy 6.70 2 13.40 32,700 49,200 16,500 110,550US 1 Roseland Rd N. County Line 1.00 2 2.00 35,700 53,500 17,800 17,800Subtotal, FDOT Projects 13.50 27.00 231,200
12th St 90th Ave 82nd Ave 1.00 2 2.00 0 14,600 14,600 14,60012th St 43rd Ave 27th Ave 1.00 1* 1.00 11,680 15,330 3,650 3,65013th St SW 66th Ave 58th Ave 1.00 2 2.00 0 14,600 14,600 14,60013th St SW 43rd Ave 34th Ave 0.56 2 1.12 0 14,600 14,600 8,17613th St SW 34th Ave 27th Ave 0.44 2 0.88 0 14,600 14,600 6,42413th St SW 27th Ave 20th Ave 0.45 2 0.90 0 14,600 14,600 6,57017th St SW 66th Ave 58th Ave 1.00 2 2.00 0 14,600 14,600 14,60026th St 66th Ave 43rd Ave 2.00 2 4.00 14,600 31,100 16,500 33,00026th St 82nd Ave 74th Ave 1.00 2 2.00 0 14,600 14,600 14,60027th Ave S. County Line Oslo Rd 2.00 2 4.00 11,680 31,100 19,420 38,84027th Ave Oslo Rd SR 60 3.50 2 7.00 14,600 31,100 16,500 57,75043rd Ave Oslo Rd 8th St 2.00 2 4.00 14,600 31,100 16,500 33,00043rd Ave S County Line Oslo Rd 2.00 2 4.00 11,680 31,100 19,420 38,8404th St 98th Ave 66th Ave 4.00 2 8.00 7,600 14,600 7,000 28,00053rd St 82nd Ave 66th Ave 2.00 2 4.00 0 14,600 14,600 29,20066th Ave S County Line Oslo Rd 2.00 2 4.00 0 14,600 14,600 29,20066th Ave Oslo Rd 4th St 1.50 2 3.00 11,680 31,100 19,420 29,13066th Ave 4th St SR 60 2.03 2 4.06 15,330 31,100 15,770 32,01366th Ave SR 60 CR 510 7.53 2 15.06 11,680 31,100 19,420 146,23382nd Ave S County Line Oslo Rd 2.00 2 4.00 0 14,600 14,600 29,20082nd Ave 26th St CR 510 7.05 2 14.10 7,600 14,600 7,000 49,3508th St 82nd Ave 74th Ave 1.00 2 2.00 7,600 14,600 7,000 7,000Aviation Blvd 43rd Ave US 1 1.93 2 3.86 14,600 31,100 16,500 31,845Aviation Blvd US 1 Indian River Blvd 1.06 4 4.24 0 31,100 31,100 32,966CR 510 CR 512 US 1 5.82 2 11.64 14,600 31,100 16,500 96,030CR 510 US 1 ICWW 0.70 2 1.40 14,600 31,100 16,500 11,550CR 512 Fellsmere City I-95 3.10 2 6.20 11,680 31,100 19,420 60,202CR 512 I-95 CR 510 2.45 2 4.90 31,100 46,800 15,700 38,465CR 512 CR 510 Roseland 1.30 2 2.60 31,100 46,800 15,700 20,410Indian River Blvd Royal Palm 37th St 1.00 2 2.00 31,100 46,800 15,700 15,700Laconia St CR 510 Concha Dr 0.55 2 1.10 0 14,600 14,600 8,030Oslo Rd I-95 58th Ave 3.25 2 6.50 11,680 31,100 19,420 63,115Roseland Rd CR 512 US 1 4.70 1* 4.70 11,680 15,330 3,650 17,155Schumann Dr CR 510 Barber St 0.82 2 1.64 11,680 31,100 19,420 15,924Subtotal, County 73.74 143.90 1,075,368
Barber St Schumann Dr US 1 1.30 1* 1.30 11,680 15,330 3,650 4,745Barber St CR 512 Schumann Dr 2.70 1* 2.70 11,680 15,330 3,650 9,855Fleming St Easy St US 1 1.20 2 2.40 0 14,600 14,600 17,520Subtotal, City 5.20 6.40 32,120
Total 92.44 177.30 1,338,688
New Daily VMC
Project Limits Average Daily CapacityMiles
New Lns
New Ln-Mi
* No new lanes added, capacity enhanced by creating a median and turn lanes on existing 2-lane road. Source: Project descriptions, segment lengths, added lanes from Table 3; average daily capacity based on LOS D, from Florida Department of Transportation, 2002 Quality/Level of Service Handbook, 2002, Table 4-1: Generalized Annual Average Daily Volumes for Florida’s Urbanized Area and Table 4-2: Generalized Annual Average Daily Volumes for Florida’s Areas Transitioning into Urbanized Areas.

Impact Fee Update Technical Memorandum #3 (Final) Indian River County, Florida April 30, 2007 17
The average cost per service unit is determined by dividing the total cost of planned improvements by the VMC added by the improvement, as shown in Table 6. The table also shows the average capacity per lane, although this is not an integral part of the impact fee calculations.
Table 6. Road Cost per Service Unit
SourceVMC
AddedLn-Mi.Added
Avg. Capacity per Lane Cost
Cost per VMC
FDOT Projects 231,200 27.00 8,563 $197,486,924 $854Indian River County Projects 1,075,368 143.90 7,473 $449,308,217 $418City Projects 32,120 6.40 5,019 $64,955,932 $2,022Total 1,338,688 177.30 7,550 $711,751,073 $532
Source: Project costs from Table 3; lane-miles added and vehicle-miles of capacity added from Table 5.
Revenue Credits This section of the report updates the credit calculation to account for revenue generated by new development that will be used to pay for capacity-related capital improvements through motor fuel taxes and sales taxes. To update this credit, the consultant reviewed Indian River County historical expenditures and future appropriations for roadway projects that expand the capacity of the road system. The County primarily utilizes the Local Optional Sales Tax and Local Option Gas Tax in funding road improvements. A credit for State and Federal funding recognizes the Florida Department of Transportation expenditures on State roads in Indian River County. FDOT funding sources include Federal and State gas tax and State general revenue in the form of legislative Transportation Regional Incentive Program (TRIP) appropriations.
Penny per Gallon Gas Tax Equivalent Since the total cost per unit for each land use is developed using vehicle-miles of travel, the credit calculation is also developed using vehicle-miles of travel. To make this calculation, it is necessary to convert the average annual sales tax into an equivalent number of pennies of gas tax. This is accomplished by determining how much revenue is generated from the one penny of the County’s six-cent 1st Local Option Gas Tax based the total revenue distributed to the County. Since all municipalities participate in the traffic impact fee and assess their impact fees based on the County’s impact fee schedule, this study bases the distribution per penny on the county-wide distribution of the 1st Local Option Gas Tax rather than on the amount distributed to the unincorporated area of the County. As shown in Table 7, the value per penny (per gallon of fuel) that is used to calculate the equivalent pennies for all credits is $882,753 per penny.
Table 7. Fuel Tax Distribution per Penny per Gallon, FY 2006-07
1st Local Option Tax (1-6 Cents) Revenue, FY 2007 $5,296,518Amount of Levy per Gallon $0.0600Distribution per Penny $882,753
Source: Total gas tax revenue for FY 2007 from Florida Legislative Committee on Intergovernmental Relations, http://www.floridalcir.gov/reports/ localoptfuel07.pdf.
Impact Fee Update Technical Memorandum #3 (Final) Indian River County, Florida April 30, 2007 18
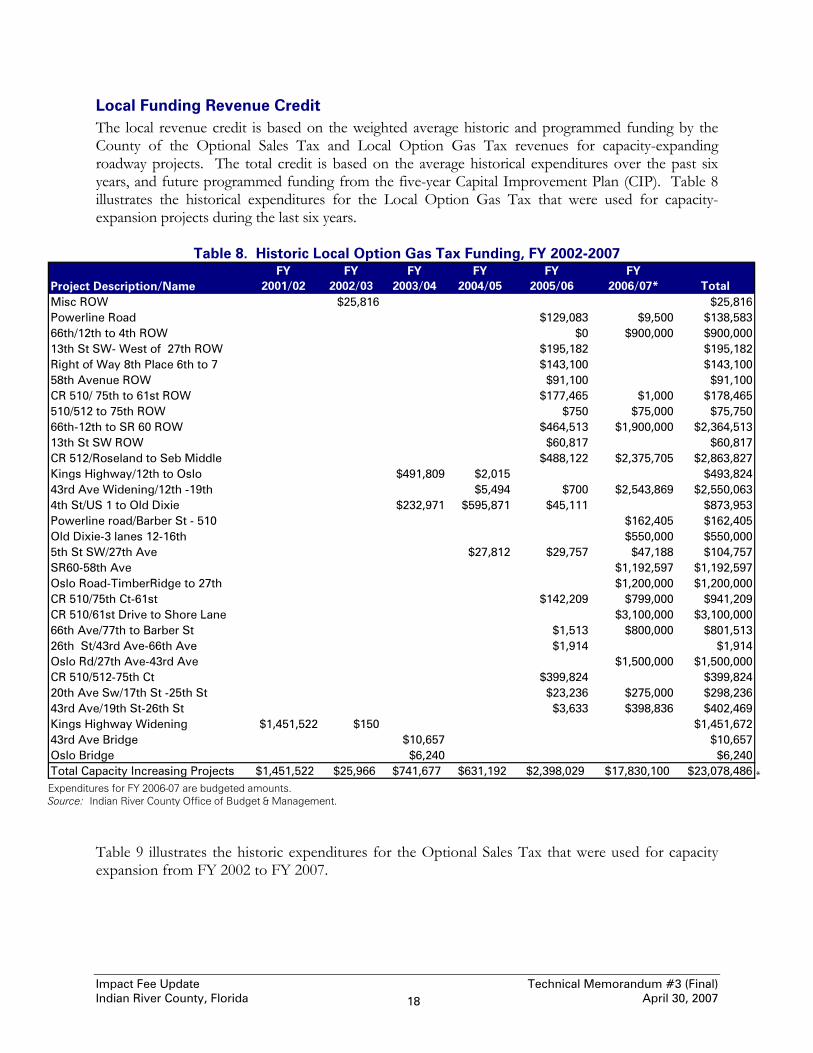
Local Funding Revenue Credit The local revenue credit is based on the weighted average historic and programmed funding by the County of the Optional Sales Tax and Local Option Gas Tax revenues for capacity-expanding roadway projects. The total credit is based on the average historical expenditures over the past six years, and future programmed funding from the five-year Capital Improvement Plan (CIP). Table 8 illustrates the historical expenditures for the Local Option Gas Tax that were used for capacity-expansion projects during the last six years.
Table 8. Historic Local Option Gas Tax Funding, FY 2002-2007
Project Description/NameFY
2001/02FY
2002/03FY
2003/04FY
2004/05FY
2005/06FY
2006/07* Total Misc ROW $25,816 $25,816Powerline Road $129,083 $9,500 $138,58366th/12th to 4th ROW $0 $900,000 $900,00013th St SW- West of 27th ROW $195,182 $195,182Right of Way 8th Place 6th to 7 $143,100 $143,10058th Avenue ROW $91,100 $91,100CR 510/ 75th to 61st ROW $177,465 $1,000 $178,465510/512 to 75th ROW $750 $75,000 $75,75066th-12th to SR 60 ROW $464,513 $1,900,000 $2,364,51313th St SW ROW $60,817 $60,817CR 512/Roseland to Seb Middle $488,122 $2,375,705 $2,863,827Kings Highway/12th to Oslo $491,809 $2,015 $493,82443rd Ave Widening/12th -19th $5,494 $700 $2,543,869 $2,550,0634th St/US 1 to Old Dixie $232,971 $595,871 $45,111 $873,953Powerline road/Barber St - 510 $162,405 $162,405Old Dixie-3 lanes 12-16th $550,000 $550,0005th St SW/27th Ave $27,812 $29,757 $47,188 $104,757SR60-58th Ave $1,192,597 $1,192,597Oslo Road-TimberRidge to 27th $1,200,000 $1,200,000CR 510/75th Ct-61st $142,209 $799,000 $941,209CR 510/61st Drive to Shore Lane $3,100,000 $3,100,00066th Ave/77th to Barber St $1,513 $800,000 $801,51326th St/43rd Ave-66th Ave $1,914 $1,914Oslo Rd/27th Ave-43rd Ave $1,500,000 $1,500,000CR 510/512-75th Ct $399,824 $399,82420th Ave Sw/17th St -25th St $23,236 $275,000 $298,23643rd Ave/19th St-26th St $3,633 $398,836 $402,469Kings Highway Widening $1,451,522 $150 $1,451,67243rd Ave Bridge $10,657 $10,657Oslo Bridge $6,240 $6,240Total Capacity Increasing Projects $1,451,522 $25,966 $741,677 $631,192 $2,398,029 $17,830,100 $23,078,486 * Expenditures for FY 2006-07 are budgeted amounts. Source: Indian River County Office of Budget & Management.
Table 9 illustrates the historic expenditures for the Optional Sales Tax that were used for capacity expansion from FY 2002 to FY 2007.

Impact Fee Update Technical Memorandum #3 (Final) Indian River County, Florida April 30, 2007 19
Table 9. Historic Optional Sales Tax Funding, FY 2002-2007
Project Description/NameFY
2001/02FY
2002/03FY
2003/04FY
2004/05FY
2005/06FY
2006/07*Total Six
YearsRight of Way $630,477 $465,748 $504,725 $870,414 $13,818 $394,896 $2,880,078King's Highway Widening $4,201,617 $150 $4,201,767Oslo Road Widening $1,074 $1,074ROW-Old Dixie/S.Relief Canal $1,500 $1,500Roads & Bridges $5,462 $47,657 $53,11943rd Ave Bridge over S.Relief Canal $10,657 $19,439 $36,475 $497,655 $564,226Old Dixie Bridge over S.Relief Canal $10,378 $28,775 $25,931 $508,665 $573,749Oslo Bridge Replace Lat J $6,240 $6,240Oslo -27th -Timber Ridge $110,866 $300 $731 $1,493,865 $1,605,762Oslo Road-43rd to 58th $900,000 $900,0001st St SW/27th Ave Intersection $100,000 $100,00017th Lane SW/27th Ave Intersection $150,000 $150,000CR 512/Seb Riv Mid-I-95 $2,978,520 $2,978,52066th Ave-SR60 to 59th St $100,000 $100,00043rd Ave-8th to Oslo 4 lanes $567,094 $567,094Total Road Projects $4,832,094 $466,972 $648,328 $918,928 $126,112 $7,690,695 $14,683,129* Expenditures for FY 2007 are budgeted amounts. Source: Indian River County Office of Budget & Management.
Table 10 illustrates the future appropriations for the Local Option Gas Tax that are projected to be used for capacity-expansion projects. Planned expenditures assume Commission approval of an additional six-cent local option gas tax, and the issuance of bonds to be repaid by those revenues that would be spent in FY 2010 and 2011.
Table 10. Future Local Option Gas Tax Funding, FY 2008-2012
Project DescriptionFY
2007/08FY
2008/09FY
2009/10FY
2010/11FY
2011/12 5-Yr TotalCR 510 , CR 512 to 75th Court 4 lanes $500,000 $1,200,000 $3,000,000 $3,000,000 $7,700,000Powerline Rd, Barber to CR 510 2 lane $300,000 $300,00016th St, 66th Av to 74th Av - 2 lanes $1,500,000 $1,500,00020th Ave SW, 17th St SW-25th St SW $400,000 $400,00026th St, 74th Ave to 82 Ave - 2 lanes $750,000 $750,00037th St, 58th to 66th Ave - 2 lanes $200,000 $200,00043rd Ave, 49th to 53rd St - 3 lanes $1,000,000 $1,000,00043rd Ave/SR 60, 19th Ave to 26th St $1,300,000 $2,200,000 $2,200,000 $5,700,00081st St, 66th to 58th Ave - 2 lanes $400,000 $400,000Misc ROW Acquisitions $500,000 $500,000 $1,000,000Highland Drive/Old Dixie $150,000 $150,000Total $3,800,000 $2,400,000 $2,500,000 $5,200,000 $5,200,000 $19,100,000
Source: Indian River County Office of Budget & Management, March 16, 2007.
Table 11 illustrates the future Optional Sales Tax funding based on the programmed funding over the next five years.

Impact Fee Update Technical Memorandum #3 (Final) Indian River County, Florida April 30, 2007 20
Table 11. Future Optional Sales Tax Funding, FY 2008-2012
Project DescriptionFY
2007/08FY
2008/09FY
2009/10FY
2010/11FY
2011/12 5-Yr TotalCR 512 Phase 4, Seb to I95 $500,000 $500,000Oslo Rd/43rd Ave to 58th $1,100,000 $1,100,00012 St, 82nd Ave to 58th $287,829 $1,000,000 $1,287,82916th St, 66th to 74th Ave - 2 lanes $1,000,000 $1,000,00043rd Ave /8th to Oslo 4 lanes $1,000,000 $1,000,00058th Ave/77th St-53rd 4 lanes $900,000 $900,00058th Ave/CR 510 to 77th St 4 lanes $3,500,000 $3,500,00066th Ave/59th St to SR 60 4 lanes $1,500,000 $1,300,000 $750,000 $3,550,00066th Ave/77th St to Barber St 4 lanes $2,000,000 $2,000,000 $4,000,000Misc Right of Way $1,000,000 $1,000,00082nd Ave over Lateral D $1,209,307 $1,209,307Misc Intersection Improvements $300,000 $1,050,000 $300,000 $1,650,000Total $5,509,307 $4,637,829 $5,050,000 $5,500,000 $0 $20,697,136
Source: Indian River County Office of Budget & Management, March 16, 2007.
The total local credit is based on the average historic and future funding for both the Local Option Gas Tax and Optional Sales Tax revenue sources that are used for capacity expanding road projects in Indian River County. The summary of the total local funding credit is shown in Table 12. The total average equivalent in terms of county gas tax is $0.0866 per gallon. As in the current impact fee calculation, the County component of the transportation impact fee credit is based on the weighted average of the historic and future funding for the Optional Sales Tax and Local Option Gas Tax revenues.
Table 12. Local Funding Credit per Gallon Historical Future Average
Optional Sales Tax (OST) FundingTotal-Capacity Increasing Expenditures/Appropriations $14,683,129 $20,697,136 NAAverage Annual Expenditures/Appropriations $2,447,188 $5,174,284 $3,810,736Average Gas Tax per Penny $882,753 $882,753 $882,753Optional Sales Tax Equivalent per Gallon $0.0277 $0.0586 $0.0432
Local Option Gas Tax (LOGT) FundingTotal-Capacity Increasing Expenditures/Appropriations $23,078,486 $19,100,000 NAAverage Annual Expenditures/Appropriations $3,846,414 $3,820,000 $3,833,207Average Gas Tax per Penny $882,753 $882,753 $882,753Local Option Gas Tax per Gallon $0.0436 $0.0433 $0.0434
Total Local Funding Gas Tax Credit $0.0713 $0.1019 $0.0866 Source: Historical and future optional sales tax funding from Table 9 and Table 11; historical and future local option gas tax funding from Table 8 and Table 10; gas tax revenue per penny per gallon from Table 7.
Federal/State Funding Revenue Credit The State roadway project revenue credit captures the amount of Federal and State motor fuel tax revenue applied toward funding capacity-expanding capital improvements. The equivalent number of pennies allocated to fund State projects was determined based on several different sources of information that covered past and future funding trends from 2001 to 2030. First, the amount of

Impact Fee Update Technical Memorandum #3 (Final) Indian River County, Florida April 30, 2007 21
Federal and State taxes were determined based on capacity-adding construction and right-of-way projects in the Florida Department of Transportation (FDOT) Work Program Six Year History report that covers the period from 2001 to 2006. Second, the current FDOT FY 2008 through 2012 Draft Tentative Work Program for District 4 was utilized to determine short-term planned funding programmed for capacity-enhancing projects. Finally, this study includes the long-range State projects from the County’s 2030 Long Range Transportation Plan in order to quantify the long-term commitment for capacity-enhancing State road projects in Indian River County. The use of all three sources helps smooth the effect of short-term spikes in funding related to large projects, such as the State Road 60 project. Federal and State gas tax funding, based on the historic FDOT expenditures for capacity-enhancing projects, is shown in Table 13.
Table 13. FDOT Work Program, FY 2001-2006 Project Description Improvement FY 2001 FY 2002 FY 2003 FY 2004 FY 2005 FY 2006SR-5, County Line to Highland Add Lanes $414,662 $153,704 $2,192,212 $102,977SR-5, Indian River Blvd Add Lanes $248,673 $446,911 $1,729,617 $7,104,722 $345,780SR-5, US-1 to Oslo Rd Add Lanes $154,608 $72,275 $999,673 $2,124,594SR-5, Oslo Rd to Indian River Add Lanes $35,945 $64,253 $195,811SR-60, MP 19.00 to MP 22.5 Add Lanes $239,264 $8,037,155 $561,963 $153,907 $646,238 $989,778SR-60, MP 14.634 to MP 19.00 Add Lanes $54,478 $11,660,244 $524,463 $437,294 $1,811,652 $668,638SR-60, MP 11.628 to MP 14.634 Add Lanes $62,674 $15,191,861 $2,224,542 $275,929 $139,146 $887,643SR-60, MP 7.74 to MP 11.80 Add Lanes $367,211 $213,069 $18,567,201 $2,722,260 $799,959 $1,437,303SR-60, MP 3.38 to MP 7.44 Add Lanes $250,567 $1,072,166 $11,811,666 $269,472 $194,815 $165,706SR-60, MP 3.00 to MP 6.00 Add Lanes $22,696 $259,976 $110,490 $196,126SR-60, MP 0.75 to MP 3.38 Add Lanes $98,243 $32,554 $8,132,253 $90,937 $9,104 $9,353SR-60, 27th Ave Vero Beach Intersection $536,079 $6,215 $120,935SR-60, 82nd Ave to 66th Ave Add Lanes $4,747 $116,467 $26,777 $93,047 $38,377 $1,814,627SR-60, I-95 to 82nd Ave Add Lanes $264 $991 $8,871 $174 $10916th/17th St, 14th Ave to SR-5 Add Lanes $1,448 $706,364 $12,750 $282,611 $174,661 $169,58782nd Ave, 26th St to CR-510 New Road $763,652 $42,059 $87,714 $1,568,702 $7,19166th Ave, 16th St to SR-60 New Road $1,233,200Total $1,637,671 $38,309,387 $43,160,151 $6,601,012 $15,743,514 $10,152,297 Source: Florida Department of Transportation, Work Program – Six Year History, 2001-2006 Adopted.
The State road projects from the current FDOT District Four Work Program are shown in Table 14. Much of the funding programmed over the next six years reflects the ongoing Highway 60 improvements, which are scheduled to continue through 2010.

Impact Fee Update Technical Memorandum #3 (Final) Indian River County, Florida April 30, 2007 22
Table 14. FDOT Work Program, FY 2007-2012
Project Description Improvement FY 2007 FY 2008 FY 2009 FY 2010 FY 2011 FY 2012SR-5, County Line to Highland Dr Add Lanes $3,591,712SR-5, Indian River Blvd Add Lanes $1,613,041SR-5/US-1, Highland Dr to Oslo Add Lanes $7,909,813 $3,600,000SR-5/US-1, Oslo to Indian River Add Lanes $8,142 $20,568,936 $795,000SR-60, MP 19.00 to MP 22.5 Add Lanes $1,866,819SR-60, MP 14.634 to MP 19.00 Add Lanes $1,622SR-60, MP 11.628 to MP 14.634 Add Lanes $345,303SR-60, MP 7.74 to MP 11.80 Add Lanes $1,953,678SR-60, MP 3.38 to MP 7.44 Add Lanes $677,126SR-60, MP 0.75 to MP 3.38 Add Lanes $199,512SR-60, 82nd Ave to 66th Ave* Add Lanes $1,311,850 $32,587,100 $1,282,000SR-60, I-95 to 82nd Ave** Add Lanes $39,659 $5,000,000SR-5/US-1 Add Lanes $2,94516/17th St, 14th Av-SR-5/US-1 Add Lanes $1,391,153 $6,366,227 $250,00082nd Ave, 26th St to CR-510 New Road $44,663Aviation, 43rd Ave to US 1 Add Lanes $800,000 $800,000CR-510/Wabasso Rd Study $62,147Indian River County Signal Traffic Control $9,772 $4,095,115Indian River County Signal Traffic Control $9,852 $5,067,073SR-60 @ 58th Ave Turn Lanes $7,678,720Total $21,838,809 $29,047,656 $16,323,415 $32,587,100 $1,532,000 $8,600,000
* FDOT Work Program shows $32,777,638 for FY 2008, but this is County advance, to be paid back with FY 2010 programmed funds ** FDOT Work Program shows $24,309,508 in FY 2009, but this is County advance; $5 million in FY 2012 is first installment of repayment Source: Florida Department of Transportation, FY 2008 – 2012 Draft Tentative Work Program, District 4. As mentioned earlier, State road projects in the County’s Long Range Transportation Plan are considered to reflect the long-term State funding forecast. The long-term funding averages out short-term funding spikes associated with one-time funding for major State road projects, such as the Highway 60 improvements in the current work program. The long-term credit calculation excludes State funding for improvements to Interstate 95 since the interstate is not included in either the cost or trip length variables used in the current County transportation impact fee schedule. As shown in Table 15, about $129 million in long-term gas tax funding related to non-interstate State road projects is planned over the remaining 2013-2030 period.
Table 15. State Road Projects in 2030 LRTP, FY 2013 to 2030
Project LRTP Cost2001-2012
Work Program2013-2030Remaining
SR 60, I-95 to 82nd Ave $21,289,000 $5,050,068 $16,238,932SR 60, 98th Ave to I-95 $2,686,297 $0 $2,686,297SR 60, 6th Ave to Indian River Blvd $4,000,000 $0 $4,000,000US 1, S. County Line to Oslo Rd $54,009,000 $0 $54,009,000US 1, Aviation Blvd to Old Dixie Hwy $46,856,882 $0 $46,856,882US 1, Roseland Rd to N. County Line $5,549,827 $0 $5,549,827Total $129,340,938
Source: Indian River County Metropolitan Planning Organization, 2006 Priority Projects Report, 2006; 2001 to 2012 FDOT Work Program costs from Table 13 and Table 14.
As in the current impact fee schedule, the Federal and State gas tax funding credit is based on the weighted average of historic, current and long-term funding for state road projects. The 29-year window of the combined FDOT Work Program and LRTP projects generates a long-term average funding in terms of equivalent gas tax funding per gallon, as shown in Table 16.
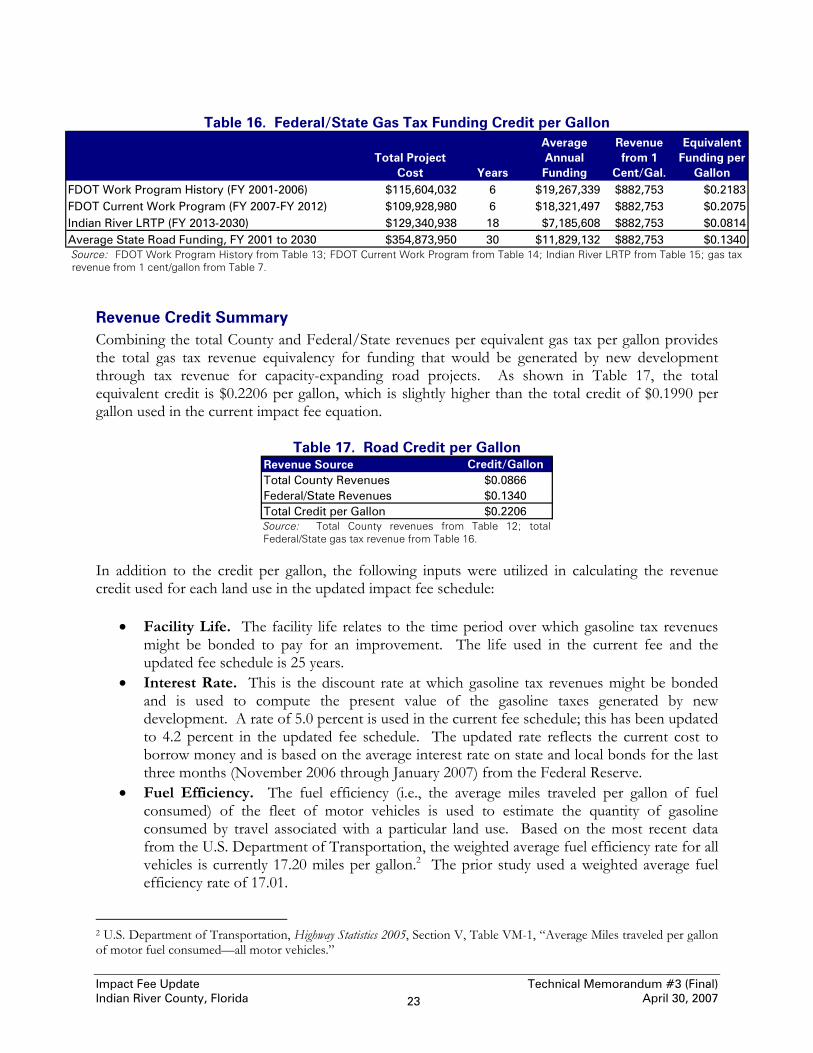
Impact Fee Update Technical Memorandum #3 (Final) Indian River County, Florida April 30, 2007 23
Table 16. Federal/State Gas Tax Funding Credit per Gallon
Total Project Cost Years
Average Annual Funding
Revenue from 1
Cent/Gal.
Equivalent Funding per
GallonFDOT Work Program History (FY 2001-2006) $115,604,032 6 $19,267,339 $882,753 $0.2183FDOT Current Work Program (FY 2007-FY 2012) $109,928,980 6 $18,321,497 $882,753 $0.2075Indian River LRTP (FY 2013-2030) $129,340,938 18 $7,185,608 $882,753 $0.0814Average State Road Funding, FY 2001 to 2030 $354,873,950 30 $11,829,132 $882,753 $0.1340 Source: FDOT Work Program History from Table 13; FDOT Current Work Program from Table 14; Indian River LRTP from Table 15; gas tax revenue from 1 cent/gallon from Table 7.
Revenue Credit Summary Combining the total County and Federal/State revenues per equivalent gas tax per gallon provides the total gas tax revenue equivalency for funding that would be generated by new development through tax revenue for capacity-expanding road projects. As shown in Table 17, the total equivalent credit is $0.2206 per gallon, which is slightly higher than the total credit of $0.1990 per gallon used in the current impact fee equation.
Table 17. Road Credit per Gallon Revenue Source Credit/GallonTotal County Revenues $0.0866Federal/State Revenues $0.1340Total Credit per Gallon $0.2206 Source: Total County revenues from Table 12; total Federal/State gas tax revenue from Table 16.
In addition to the credit per gallon, the following inputs were utilized in calculating the revenue credit used for each land use in the updated impact fee schedule:
• Facility Life. The facility life relates to the time period over which gasoline tax revenues might be bonded to pay for an improvement. The life used in the current fee and the updated fee schedule is 25 years.
• Interest Rate. This is the discount rate at which gasoline tax revenues might be bonded and is used to compute the present value of the gasoline taxes generated by new development. A rate of 5.0 percent is used in the current fee schedule; this has been updated to 4.2 percent in the updated fee schedule. The updated rate reflects the current cost to borrow money and is based on the average interest rate on state and local bonds for the last three months (November 2006 through January 2007) from the Federal Reserve.
• Fuel Efficiency. The fuel efficiency (i.e., the average miles traveled per gallon of fuel consumed) of the fleet of motor vehicles is used to estimate the quantity of gasoline consumed by travel associated with a particular land use. Based on the most recent data from the U.S. Department of Transportation, the weighted average fuel efficiency rate for all vehicles is currently 17.20 miles per gallon.2 The prior study used a weighted average fuel efficiency rate of 17.01.
2 U.S. Department of Transportation, Highway Statistics 2005, Section V, Table VM-1, “Average Miles traveled per gallon of motor fuel consumed—all motor vehicles.”

Impact Fee Update Technical Memorandum #3 (Final) Indian River County, Florida April 30, 2007 24
• Effective Days Per Year. An effective 365 days per year of operation was assumed for all land uses in the current fee. This, however, will not be the case for all land uses, since some uses operate only on weekdays (e.g., office buildings) and/or only seasonally (e.g., schools). The use of 365 days per year, therefore, provides a “conservative” element, ensuring that gasoline taxes are adequately credited against the fee. As a result, no changes to the effective days per year are proposed in this fee update.
• Across the Board Adjustment. This factor provides an “across-the-board” adjustment to the impact fee rates. In the current transportation impact fee program, Indian River County elected not to assess the full impact fee. Specifically, the County adopted a fee schedule that discounts all land uses by a uniform percentage of 15 percent. The updated impact fee schedule in this report maintains a similar across-the-board factor.
Travel Demand This section reviews the travel demand characteristics utilized in the current and updated impact fee formula. The travel demand generated by specific land use types is a product of three factors: 1) trip generation; 2) percent new trips; and 3) trip length.
Trip Generation Trip generation rates represent trip ends, or driveway crossings at the site of a land use. Thus, a single one-way trip from home to work counts as one trip end for the residence and one trip end for the work place, for a total of two trip ends. The trip generation rates utilized in the current impact fee schedule are based on several sources of information. Approximately one-third of the rates match the most current trip generation rate information published in the current Institute of Transportation Engineers’ (ITE), Trip Generation manual. The national data from ITE provide the most recent, uniform and widely-utilized source for trip generation rates. In addition, the national trip generation rates compiled by ITE are likely to be applicable to the mix of land uses and trip characteristics found in Indian River County. Source data for the remaining two-thirds of the land use trip generation rates were developed by Tindale-Oliver; these rates vary slightly from the ITE rates and are based on independent trip generation studies. This phase of the study maintains the trip generation rates utilized in the current County road impact fee schedule.
Percent New Trips The trip rates are also adjusted by a “new trip factor” to exclude pass-by and diverted-link trips. This adjustment reduces the possibility of over-counting trips by including only primary trips generated by the development. Pass-by trips are those trips that are already on a particular route for a different purpose and simply stop at a particular development on that route. For example, a stop at a convenience store on the way home from the office is a pass-by trip for the convenience store. A pass-by trip does not create an additional burden on the street system and therefore should not be counted in the assessment of impact fees. A diverted-link trip is similar to a pass-by trip, but a diversion is made from the regular route to make an interim stop. The new trip data utilized in the current schedule are based on a mix of ITE and Tindale-Oliver data from other Florida communities. The same new trip factors are used in this update.

Impact Fee Update Technical Memorandum #3 (Final) Indian River County, Florida April 30, 2007 25
Trip Length Trip length represents the average length of a trip on the local major roadway system. The current impact fee schedule is based on total and local trip length factors developed for Indian River County by Tindale-Oliver and Associates. The major roadway trip length includes travel on major municipal, County and State roads, but excludes travel on interstates. In addition to the major road trip length, the current schedule utilizes a total trip length, which includes an additional one-half mile to take into account travel on local (non-major) streets, which is utilized to calculate the revenue credit. The updated fees continue to be based on the trip lengths used in the previous study, but the major roadway trip lengths from that study have been multiplied by the calibration factor from Table 20 below. This reduction of the major roadway trip lengths is necessary to ensure that the total major roadway system VMT calculated by multiplying existing land uses by the travel demand factors included in the fee schedule does not over-estimate the actual VMT observed on the major roadway system. The total trip length used in the credit calculations is the major roadway trip length plus one-half mile, as in the previous study.
Calibration of Travel Demand Factors The travel demand factors used in the impact fee schedule can be calibrated to actual VMT on the major roadway system. This was not done in the previous study, but is best practice. The first step is to estimate the total VMT on the major roadway system that is generated by development in Indian River County. The County conducts trip counts annually for most but not all roads included in the major roadway system. The average daily trips (ADT) figures for 2006 (most recent counts) for each roadway segment are multiplied by the length of the segment in miles and summed to determine the total VMT on the major roadway system (see Appendix C). The results by roadway classification are summarized in Table 18 below. Current traffic counts were not available for all of the roadway segments. For segments without counts, VMT was estimated based on the average volume per lane for segments with counts (for collectors, average volumes were assumed to be only 75 percent of the volume for segments with counts). Total VMT is the sum of observed VMT on segments with counts and estimated VMT on segments without counts.
Table 18. Vehicle-Miles of Travel on Major Roadway System Road Classification VMT LM w/ct Avg ADT LM w/o ct est VMT* Ttl VMTPrincipal Arterial 1,086,181 182.86 5,940 5.08 30,175 1,116,356Minor Arterial 670,200 122.30 5,480 48.18 264,026 934,226Collector 713,648 213.10 3,349 88.24 221,637 935,285Total 2,470,029 518.26 141.50 515,838 2,985,867
Source: VMT, lane-miles with counts and lane-miles without counts from Appendix C Table 129, Table 130 and Table 131; average ADT is ratio of VMT to lane-miles with counts; estimated VMT is the product of the average volume on segments with counts and lane-miles without counts (estimated VMT on collectors reduced by 25%); total VMT is the sum of VMT and estimated VMT.
The next step is to multiply the existing quantities of each land use by the VMT per unit used in the previous study’s impact fee schedule to determine the locally-generated VMT that is expected to be present on the major roadway system. Table 19 presents the VMT one would expect to see based on existing land use and the previous study’s travel demand factors by land use.

Impact Fee Update Technical Memorandum #3 (Final) Indian River County, Florida April 30, 2007 26
Table 19. Expected Local Vehicle-Miles of Travel
Land Use Impact Unit 2007 UnitsVMT/
UnitExpected
VMTSingle-Family Dwelling 52,064 27.27 1,419,785Multi-Family Dwelling 18,053 14.94 269,712Mobile Home Dwelling 7,328 10.34 75,772Commercial 1,000 sf 23,272 64.49 1,500,811Institutional/Misc. 1,000 sf 6,166 37.44 230,855Government 1,000 sf 5,178 83.92 434,538Total 3,931,473 Source: 2007 residential units based on 2000 Census and April 1, 2000 through December 31, 2006 building permits from IRC Community Development Department, "Building Permit Information for New Construction: Permits Issued," February 8, 2007 draft; 2007 nonresidential units from IRC Property Appraiser, January 2007; VMT/unit is product of ½ trip rate, local trip length and percent new trips from Tindale-Oliver & Associates, Update of the Traffic Impact Fee Ordinance, 2004 (commercial is average of all retail, office and industrial categories expressed per 1,000 square feet, institutional is average of all institutional categories expressed per 1,000 square feet and government is average of all government categories).
The expected system-wide VMT based on existing county-wide land uses and the travel demand factors in the fee schedule is significantly higher than the total system-wide VMT actually observed on the County’s major roadways. Observed VMT is only 75.9 percent of expected VMT, as shown in Table 20. This calibration factor will be used to reduce the local trip lengths for individual land use categories used in the previous study (this will have the same effect as reducing total VMT per land use, and is appropriate because trip length is the most locally-variable travel demand factor).
Table 20. Trip Length Calibration Factor
Observed Local VMT 2,985,867Expected Local VMT 3,931,473Observed/Expected 75.9%
Source: Observed local VMT from Table 18; expected VMT from Table 19.
Travel Demand Schedule The result of combining trip generation rates, primary trip factors and average trip lengths is a travel demand schedule that establishes the VMT during the average weekday generated by various land use types per unit of development for Indian River County. Since all trips involve two trip ends, all trip rates are divided by two in generating the daily VMT. This places the burden of travel equally between the origin and destination of the trip and eliminates double-charging for any particular trip. The travel demand schedule is integrated into the following impact fee schedule.

Impact Fee Update Technical Memorandum #3 (Final) Indian River County, Florida April 30, 2007 27
Updated Fee Schedule The detailed impact fee calculations for each land use are included in Table 21. The updated fee schedule includes the addition of research facilities to the major land use categories, combines accessory single-family with multi-family land uses and removes the quality restaurant and government office building land use categories. The total impact cost calculation is the product of the daily VMT per land use on the major roadway system (one-half of trip rate times major roadway trip length times percent new trips) and the unit cost of a new road capacity (cost per VMC) calculated earlier in this report. The gas tax credit, which incorporates the sales tax credit in terms of equivalent credit per gallon, is based on total VMT (travel on local roads as well as major roads), the revenue credit per gallon calculated earlier in this report and average fuel economy. Table 21 includes the major land use categories and the impact fees for the individual land uses contained in each of the major categories. It should be noted that the net traffic impact fee includes an across-the-board reduction factor of 15 percent, which is the same factor that is included in the current road impact fee schedule. However, this reduction from the maximum fee is not required and is a policy issue to be decided by the governing body. It is included here only to be comparable to the fees derived from the 2004 study.

Impact Fee Update Technical Memorandum #3 (Final) Indian River County, Florida April 30, 2007 28
Table 21. Updated Traffic Impact Fee Schedule
Major Total % Total Annual Total NetITE Impact Trip Trip Trip New Impact Revenue Revenue Impact
Code Land Use Unit Rate Length Length Trips Cost Credit Credit FeeResidential
210 Single Family Less than 1,500 sf Dwelling 6.35 4.33 4.83 100% $7,314 $72 $1,101 $5,281 1,500 sf or more Dwelling 9.57 4.33 4.83 100% $11,023 $108 $1,655 $7,963
230 Multi-Family/Accessory Dwelling 5.86 3.87 4.37 100% $6,032 $60 $917 $4,348240 Mobile Home Dwelling 4.81 3.26 3.76 100% $4,171 $42 $648 $2,995310 Hotel room 8.23 4.78 5.28 66% $6,906 $67 $1,027 $4,997320 Motel room 5.63 3.26 3.76 77% $3,759 $38 $584 $2,699620 Nursing Home bed 2.61 1.97 2.47 89% $1,217 $13 $205 $860252 ACLF bed 2.15 2.35 2.85 72% $968 $10 $158 $689
Office and Financial720 Medical Office 1,000 sf 36.13 3.95 4.45 87% $33,027 $327 $5,008 $23,816911 Bank 1,000 sf 156.48 1.82 2.32 47% $35,605 $399 $6,109 $25,071912 Bank w/Drive-In 1,000 sf 265.21 1.82 2.32 47% $60,345 $677 $10,354 $42,492710 Office up to 50,000 sf 1,000 sf 18.31 3.49 3.99 92% $15,638 $157 $2,407 $11,247710 Office over 50,000 sf 1,000 sf 13.27 3.49 3.99 92% $11,334 $114 $1,744 $8,151730 Research Facilities 1,000 sf 8.11 3.49 3.99 92% $6,927 $70 $1,066 $4,982
Industiral140 Manufacturing 1,000 sf 3.82 3.49 3.99 92% $3,263 $33 $502 $2,347150 Warehouse 1,000 sf 4.88 3.49 3.99 92% $4,168 $42 $641 $2,998151 Mini-Warehouse 1,000 sf 2.50 3.49 3.99 92% $2,135 $21 $329 $1,535110 General Industrial 1,000 sf 6.97 3.49 3.99 92% $5,953 $60 $916 $4,281N/A Concrete Plant acre 15.60 3.49 3.99 92% $13,324 $134 $2,050 $9,583N/A Sand Mining acre 2.00 3.49 3.99 92% $1,708 $17 $263 $1,228
Retail820 Retail under 50,000 sf 1,000 sf 111.82 1.37 1.87 54% $22,005 $264 $4,043 $15,268820 Retail 50,001-100,000 sf 1,000 sf 70.70 1.44 1.94 64% $17,332 $205 $3,143 $12,061820 Retail 100,001-200,000 sf 1,000 sf 54.50 1.52 2.02 69% $15,204 $178 $2,720 $10,612820 Retail over 200,000 sf 1,000 sf 42.00 1.82 2.32 75% $15,250 $171 $2,617 $10,738944 Gas Station* fuel position 168.56 1.44 1.94 23% $14,850 $176 $2,693 $10,333841 New and Used Auto Sales 1,000 sf 37.50 3.57 4.07 79% $28,132 $282 $4,317 $20,243932 Restaurant 1,000 sf 130.34 2.28 2.78 73% $57,705 $619 $9,471 $40,999934 Fast Food Restaurant 1,000 sf 496.12 1.21 1.71 59% $94,212 $1,172 $17,922 $64,847850 Supermarket 1,000 sf 111.51 1.59 2.09 62% $29,240 $338 $5,174 $20,456947 Auto Repair 1,000 sf 37.60 2.73 3.23 72% $19,659 $205 $3,131 $14,049947 Car Wash stall 108.00 1.90 2.40 69% $37,662 $419 $6,404 $26,570853 Convenience Store 1,000 sf 636.30 1.21 1.71 29% $59,392 $739 $11,298 $40,880890 Furniture Store 1,000 sf 5.06 4.63 5.13 54% $3,365 $33 $502 $2,434
Recreational430 Golf Course hole 35.74 3.26 3.76 90% $27,893 $283 $4,330 $20,028492 Racquet/Health/Dance 1,000 sf 17.14 3.26 3.76 94% $13,971 $142 $2,169 $10,032412 County Park acres 2.10 3.26 3.76 90% $1,639 $17 $254 $1,177491 Tennis Court court 31.04 3.26 3.76 90% $24,225 $246 $3,761 $17,394420 Marina berth 2.96 3.26 3.76 94% $2,413 $24 $375 $1,733

Impact Fee Update Technical Memorandum #3 (Final) Indian River County, Florida April 30, 2007 29
Updated Traffic Impact Fee Schedule (Continued) Major Total % Total Annual Total Net
ITE Impact Trip Trip Trip New Impact Revenue Revenue ImpactCode Land Use Unit Rate Length Length Trips Cost Credit Credit Fee
Governmental732 Post Office 1,000 sf 108.19 3.49 3.99 35% $35,153 $354 $5,410 $25,282590 Library 1,000 sf 54.00 3.49 3.99 85% $42,611 $429 $6,557 $30,646733 Government Office 1,000 sf 27.92 3.49 3.99 92% $23,846 $240 $3,670 $17,150571 Jail bed 1.21 3.49 3.99 85% $955 $10 $147 $687
Miscellaneous565 Day Care Center 1,000 sf 79.26 1.52 2.02 73% $23,394 $274 $4,185 $16,328610 Hospital 1,000 sf 16.78 3.87 4.37 77% $13,301 $132 $2,022 $9,587N/A Veterinary Clinic 1,000 sf 32.80 1.52 2.02 70% $9,283 $109 $1,661 $6,479560 Church 1,000 sf 9.11 2.96 3.46 90% $6,456 $66 $1,016 $4,624443 Movie Theater 1,000 sf 78.06 1.67 2.17 87% $30,168 $345 $5,277 $21,158520 School (Elementary) 1,000 sf 14.49 1.44 1.94 80% $4,440 $53 $805 $3,090530 School (High) 1,000 sf 12.89 3.26 3.76 90% $10,060 $102 $1,562 $7,223540 School (College) 1,000 sf 27.49 5.54 6.04 90% $36,459 $350 $5,351 $26,442N/A Fire Station 1,000 sf 5.40 1.97 2.47 89% $2,518 $28 $425 $1,779
* Service station must have kiosk of less than 1000 square feet; otherwise it is classified as a convenience store. Source: Travel demand factors (trip rates, trip lengths and % new trips from Tindale-Oliver & Associates, Update of the Traffic Impact Fee Ordinance – Cost Estimate Variable, Indian River County, 2004, with exception that major roadway trip length has been multiplied by the calibration factor from Table 20 and the total trip length is major road trip length plus 0.5 miles; total impact cost is one-half of product of trip rate, major road trip length, % new trips and cost per VMC from Table 6; annual revenue credit is one-half of product of trip rate, total trip length, % new trips, credit per gallon from Table 17 and 365 days per year, divided by average miles per gallon for the U.S. motor vehicle fleet of 17.2 mille per gallon from U.S. Department of Transportation, Highway Statistics 2005, Section V, Table VM-1, “Average Miles traveled per gallon of motor fuel consumed—all motor vehicles;” total revenue credit is the net present value of the annual revenue credit over 25 years at a discount rate of 4.2%, which is the average interest rate on tax-free state and local bonds for the last three months (November 2006 through January 2007) from the Federal Reserve; net impact fee is total impact cost less total revenue credit, reduced by a 15% discount factor as in the 2004 study.
The updated fees and current fees are compared in Table 22. For administrative ease, the top two single-family size categories have been combined in this update, so that the same fee applies to all units 1,500 square feet or larger. Based on the updated cost and credit assumptions utilized in this report, the traffic impact fee would increase by 53% for most land uses.
Table 22. Comparison of Current and Updated Traffic Impact Fees Net
ITE Impact Impact Current PercentCode Land Use Unit Fee Fee DifferenceResidential
210 Single Family Less than 1,500 sf Dwelling $5,281 $3,452 53% 1,500 to 2,499 sf Dwelling $7,963 $5,202 53% 2,500 sf or more Dwelling $7,963 $5,838 36%
230 Multi-Family/Accessory Dwelling $4,348 $2,842 53%240 Mobile Home Dwelling $2,995 $1,957 53%310 Hotel room $4,997 $3,271 53%320 Motel room $2,699 $1,764 53%620 Nursing Home bed $860 $560 54%252 ACLF bed $689 $449 53%
Office and Financial720 Medical Office 1,000 sf $23,816 $15,553 53%911 Bank 1,000 sf $25,071 $16,289 54%912 Bank w/Drive-In 1,000 sf $42,492 $27,607 54%

Impact Fee Update Technical Memorandum #3 (Final) Indian River County, Florida April 30, 2007 30
Comparison of Current and Updated Traffic Impact Fees (Continued)
NetITE Impact Impact Current Percent
Code Land Use Unit Fee Fee Difference710 Office up to 50,000 sf 1,000 sf $11,247 $7,348 53%710 Office over 50,000 sf 1,000 sf $8,151 $5,326 53%730 Research Facility 1,000 sf $4,982 NA NA
Industrial140 Manufacturing 1,000 sf $2,347 $1,533 53%150 Warehouse 1,000 sf $2,998 $1,958 53%151 Mini-Warehouse 1,000 sf $1,535 $1,003 53%110 General Industrial 1,000 sf $4,281 $2,797 53%N/A Concrete Plant acre $9,583 $6,261 53%N/A Sand Mining acre $1,228 $803 53%
Retail820 Retail under 50,000 sf 1,000 sf $15,268 $9,837 55%820 Retail 50,001-100,000 sf 1,000 sf $12,061 $7,813 54%820 Retail 100,001-200,000 sf 1,000 sf $10,612 $6,860 55%820 Retail over 200,000 sf 1,000 sf $10,738 $6,977 54%944 Gas Station(2) fuel position $10,333 $6,694 54%841 New and Used Auto Sales 1,000 sf $20,243 $13,212 53%932 Restaurant 1,000 sf $40,999 $26,646 54%934 Fast Food Restaurant 1,000 sf $64,847 $41,971 55%850 Supermarket 1,000 sf $20,456 $13,288 54%947 Car Wash stall $26,570 $17,232 54%853 Convenience Store 1,000 sf $40,880 $26,459 55%890 Furniture Store 1,000 sf $2,434 $1,592 53%
Recreational430 Golf Course hole $20,028 $13,090 53%492 Racquet/Health/Dance 1,000 sf $10,032 $6,556 53%412 County Park acres $1,177 $769 53%491 Tennis Court court $17,394 $11,368 53%420 Marina berth $1,733 $1,132 53%
Governmental732 Post Office 1,000 sf $25,282 $16,518 53%590 Library 1,000 sf $30,646 $20,023 53%733 Government Office 1,000 sf $17,150 $11,205 53%571 Jail bed $687 $449 53%
Miscellaneous565 Day Care Center 1,000 sf $16,328 $10,555 55%610 Hospital 1,000 sf $9,587 $6,267 53%N/A Veterinary Clinic 1,000 sf $6,479 $4,189 55%560 Church 1,000 sf $4,624 $3,016 53%443 Movie Theater 1,000 sf $21,158 $13,715 54%520 School (Elementary) 1,000 sf $3,090 $2,003 54%530 School (High) 1,000 sf $7,223 $4,723 53%540 School (College) 1,000 sf $26,442 $17,319 53%N/A Fire Station 1,000 sf $1,779 $1,158 54%
Source: Updated impact fee from Table 21; current fee from Indian River County, Ordinance 2005-15.

Impact Fee Update Technical Memorandum #3 (Final) Indian River County, Florida April 30, 2007 31
Revenue Projections Based on the average annual amount of development experienced over the last six years, it is estimated that the updated traffic impact fees will generate about 51 percent more revenue than would be generated under the current fee schedule, as shown in Table 23.
Table 23. Traffic Impact Fee Revenue Estimates Avg. Annual Percent
Land Use Type Impact Units Current Updated Current Updated ChangeSingle-Family 476 $5,202 $7,963 $2,476,000 $3,790,000 53%Multi-Family 57 $2,842 $4,348 $162,000 $248,000 53%Mobile Home 2,917 $1,957 $2,995 $5,709,000 $8,736,000 53%Nonresidential (1000 sf) 782.4 $10,164 $15,230 $7,952,000 $11,916,000 50%Total $16,299,000 $24,690,000 51%
Impact Fee Rates Impact Fee Revenues
Source: Average annual impact units from 2001 to 2006 county-wide building permit data; impact fee rates from Table 22 (nonresidential fees are averages of all nonresidential land uses charged on a square footage basis).

Impact Fee Update Technical Memorandum #3 (Final) Indian River County, Florida April 30, 2007 32
SCHOOLS This section of the study updates school impact fee calculations. The Indian River County Board of County Commissioners adopted an ordinance imposing school impact fees in 2005. The county-wide ordinance requires all new residential development within Indian River County to pay applicable impact fees prior to the issuance of a building permit. Municipalities within the county collect the fees and turn them over to the County, which in turn transmits them to the School Board to be spent on growth-related improvements according to the terms of an interlocal agreement between the County and the School District. The School District operates 21 public school facilities. The locations of the schools are shown in Figure 3.
Current Level of Service A fundamental principle of impact fees is that new development should not be held to a higher standard than existing development. If the impact fees are based on a higher standard than currently exists, new development must not be required to pay both the impact fee and the taxes that are used to remedy the existing deficiency, unless credit against the fees is given for such tax payments.
School Capacity The Florida Department of Education (DOE) maintains an inventory of student capacity in schools. This inventory is referred to as the Florida Inventory of School Houses (FISH). There are two official measures of school capacity: FISH Satisfactory Student Stations and Actual FISH Capacity. FISH Satisfactory Student Stations are computed by multiplying the core-curriculum classrooms by the maximum students per class by grade level (different capacities are specified for specialized classrooms). In the November 2002 election, Florida voters approved the Classroom Size Reduction Amendment (Amendment 9) to the Florida Constitution. Section 1 of Article IX of the State Constitution establishes, by the beginning of the 2010/2011 school year, the following maximum number of students in core curricula courses assigned to a teacher: (1) Pre-kindergarten through grade 3: 18 students; (2) grades 4 through 8: 22 students; and (3) grades 9 through 12: 25 students. Actual FISH Capacity takes into account DOE adopted utilization rates. The official utilization rates are: 100 percent of Satisfactory Student Stations for elementary schools, 90 percent for middle schools and 95 percent for high schools. Utilization rates give districts some flexibility at middle and high school levels to accommodate reasonable inefficiencies created with multiple class changes, electives and other activities. For the purposes of this report, actual FISH capacity is used.

Impact Fee Update Technical Memorandum #3 (Final) Indian River County, Florida April 30, 2007 33
Figure 3. Locations of Existing Public Schools

Impact Fee Update Technical Memorandum #3 (Final) Indian River County, Florida April 30, 2007 34
Existing School Inventory To determine the current level of service for educational facilities in Indian River County, an inventory was prepared of existing schools for the 2006/2007 school year. Table 24 shows the existing school inventory, including the name of each school, grade level, site area in acres, building square feet (permanent and portable) and student capacity (permanent and portable). Charter schools are not included in the inventory, because the District is not responsible for funding the capital costs of serving these students. The School District of Indian River County operates 21 public education facilities serving pre-kindergarten through the 12th grade. These facilities total more than 2.1 million square feet and have a capacity of almost 20,000 students. However, the District is in the process of eliminating or at least significantly reducing the use of relocatable classrooms. Consequently, the existing level of service will be based exclusively on permanent capacity.
Table 24. Inventory of Public Schools, 2007
Educational Facility Acres Perm. Port. Total Perm. Port. TotalBeachland Elementary 26 63,488 840 64,328 555 22 577Citrus Elementary 20 74,775 5,096 79,871 573 108 681Dodgertown Elementary 20 69,392 11,558 80,950 608 207 815Fellsmere Elementary 10 66,147 9,584 75,731 543 198 741Glendale Elementary 21 62,023 6,048 68,071 623 154 777Highlands Elementary 18 59,945 1,664 61,609 602 37 639Pelican Island Elementary 32 64,812 4,376 69,188 583 102 685Rosewood Elementary 15 61,861 0 61,861 561 0 561Sebastian Elementary 20 73,307 1,728 75,035 637 40 677Thompson Elementary 15 62,391 0 62,391 557 0 557Treasure Coast Elementary 20 90,095 4,320 94,415 599 94 693Vero Beach Elementary 20 60,445 5,088 65,533 559 72 631Liberty Magnet 20 87,467 0 87,467 688 0 688Osceola Magnet School 15 66,928 5,156 72,084 558 43 601Subtotal, Elementary 272 963,076 55,458 1,018,534 8,246 1,077 9,323
Gifford Middle 15 123,215 13,480 136,695 1,122 344 1,591Oslo Middle 40 140,927 6,054 146,981 1,117 147 1,389Sebastian River Middle 40 118,685 22,067 140,752 1,083 536 1,739Subtotal, Middle School 95 382,827 41,601 424,428 3,322 1,027 4,719
Sebastian River Senior High 75 232,858 14,368 247,226 1,933 375 2,308Vero Beach Senior High 85 402,903 25,352 428,255 2,933 400 3,333Subtotal, High School 160 635,761 39,720 675,481 4,866 775 5,641
Alternative Education Center 14 33,718 0 33,718 178 0 178Wabasso School 8 19,445 0 19,445 60 0 60Subtotal, Alternative 22 53,163 0 53,163 238 0 238
Grand Total 549 2,034,827 136,779 2,171,606 16,672 2,879 19,921
Student CapacityBuilding Square Feet
Source: School District of Indian River County, January 2007 spreadsheet and February 12, 2007 teleconference.

Impact Fee Update Technical Memorandum #3 (Final) Indian River County, Florida April 30, 2007 35
It should be noted that the School District also operates a number of administrative and support facilities. However, sufficient information on such facilities was not provided in time to be included in this draft. The cost of administrative and support facilities may be added in subsequent drafts of the school impact fee update. The existing level of service will be measured as the ratio of current students to Actual FISH Capacity in permanent buildings. As shown in Table 25, Indian River County provides more than one unit of capacity per student at the system-wide level.
Table 25. Public School Enrollment and Capacity, 2007-2011
School Oct 2006 Oct 2011 2006/07 2011/12Beachland Elementary 548 605 555 555Citrus Elementary 517 532 573 573Dodgertown Elementary 580 519 608 608Fellsmere Elementary 564 547 543 543Glendale Elementary 623 611 623 623Highlands Elementary 593 492 602 602Liberty Magnet 541 550 688 688Osceola Magnet School 541 541 558 558Pelican Island Elementary 451 550 583 583Rosewood Elementary 542 550 561 561Sebastian Elementary 575 635 637 637Thompson Elementary 419 455 557 557Treasure Coast Elementary 672 464 599 599Vero Beach Elementary 509 556 559 559New Elementary School "C" 0 673 0 700New Elementary School "D" 0 574 0 700New Elementary School TBD 0 636 0 700Subtotal, Elementary 7,675 9,490 8,246 10,346
Gifford Middle 1,386 1,070 1,122 1,122Oslo Middle 1,120 1,107 1,117 1,117Sebastian River Middle 1,307 1,242 1,083 1,149New Middle School "BB" 0 1,128 0 1,050Subtotal, Middle School 3,813 4,547 3,322 4,438
Sebastian River Senior High 1,972 2,177 1,933 2,023Vero Beach Senior High 2,742 2,848 2,933 2,771Subtotal, High School 4,714 5,025 4,866 4,794
Alternative Education Center 111 171 178 178Wabasso School 57 87 60 60Subtotal, Alternative 168 258 238 238
Grand Total 16,370 19,320 16,672 19,816
Enrollment Perm. FISH Capacity
Source: School District of Indian River County, January 2007 spreadsheet and February 12, 2007 teleconference.

Impact Fee Update Technical Memorandum #3 (Final) Indian River County, Florida April 30, 2007 36
Level of Service Summary The County’s adopted level of service for schools is expressed in terms of building square feet per student station:3
County wide level-of-service standard for Elementary Schools of 144.71 building square feet per student station County wide level-of-service standard for Middle Schools of 117.26 building square feet per student station County wide level-of-service standard for High Schools of 147.57 building square feet per student station County wide weighted average level-of-service standard for all schools of 139.07 building square feet per student station
These level-of-service standards were adopted to be consistent with the previous impact fee study, not for concurrency purposes. The draft interlocal agreement between the School District, the County and the municipalities for school concurrency, as approved by the School Board on February 13, 2007, establishes the following standard (the “School Service Areas” are defined as elementary, middle and high school attendance zones):
The adopted level of service for each year of the five year planning period and through the long term planning period for each School Service Area will be 100% of the FISH permanent capacity.
Both the adopted standards in the Comprehensive Plan and the proposed concurrency standards apply at levels below the entire school system (grade level for the adopted non-concurrency standard and individual schools for the draft concurrency standard approved by the School Board). The adopted standard is more of a construction design standard (square feet per student station) than a ratio of demand (enrollment) to capacity. In the arena of school impact fees, the most appropriate level of service is expressed as the overall ratio of student enrollment to permanent school FISH capacity. As shown above, the School District currently provides one unit of permanent FISH capacity per enrolled student. The impact fees will be based on a one-to-one ratio of capacity to enrollment. This is not identical to the proposed concurrency standard, since it applies at the system-wide level and not to individual schools, but it is consistent with it.
3 Indian River County, 2020 Comprehensive Plan, Chapter 6: Capital Improvements Element, Policy 3.6 (non-concurrency management level-of-service standards), adopted December 12, 2006.

Impact Fee Update Technical Memorandum #3 (Final) Indian River County, Florida April 30, 2007 37
Cost Component In determining the cost of providing public school facilities in Indian River County, the first step is to calculate the facility cost per student capacity. Several cost components must be considered when calculating the total cost of constructing a school facility. These cost components include construction costs, design and engineering costs associated with construction, public utility connection costs, furniture, fixtures and equipment (FF&E) costs and the cost of land. The weighted average construction cost per square foot for each of type of school is developed based on these cost components. The School District of Indian River County completed four construction projects in 2006: an elementary school, an alternative center, a middle school gym and a multipurpose building (see Table 26). The building cost per square foot for the Liberty Magnet Elementary School is the most recent available, and provides a reasonable cost per square foot for elementary construction. While the Gifford projects are not necessarily directly representative of middle schools or high schools, they do show significantly higher costs per square foot than for elementary schools. The total project costs provide reasonable estimates of the percent of building cost for architectural/engineering fees, utilities, road improvements and site work and furniture and equipment.
Table 26. Recent School Construction Costs Liberty Magnet
Elementary
Gifford Alternative
Center
Gifford Middle Gym
Rosewood Multipurpose
Building Total
% of Building
CostBuilding Cost $13,692,597 $7,447,343 $4,855,268 $924,524 $26,919,732Architectural/Engin. Fees $671,796 $88,447 $240,794 $58,361 $1,059,398 3.9%Utilities/Roads/Site Work $1,563,896 $6,390 $23,769 $0 $1,594,055 5.9%Furniture and Equipment $1,756,373 $745,552 $63,443 $1,987 $2,567,355 9.5%Total Cost $17,684,662 $8,287,732 $5,183,274 $984,872 $32,140,540
Square Feet 91,667 33,718 19,589 2,180 147,154Student Stations 688 327 160 0 NAStudent Capacity 688 294 144 0 NA
Building Cost per Square Foot $149.37 $220.87 $247.86 $424.09 $182.94Total Cost per Square Foot $192.92 $245.80 $264.60 $451.78 $218.41
Cost per Student Capacity $25,704 $28,190 $35,995 NA NASquare Feet per Capacity 133.24 114.69 136.03 NA NA Source: School District of Indian River County, Report of Cost of Construction Forms submitted to Department of Education in 2006.
Recent school construction costs for middle and high schools are not available. However, the District recently received an architect’s construction cost estimate of $220 per square foot for a new middle school, excluding contingency, FF&E and professional fees and studies. While no recent local construction cost experience or estimate is available for high schools, it is reasonable to assume that the construction cost per square foot for high schools will be at least as high as the recent estimate for the new middle school.

Impact Fee Update Technical Memorandum #3 (Final) Indian River County, Florida April 30, 2007 38
State school construction cost guidelines can be used as a reference point for recent local costs. The most recent guidelines were established by statute in 2006 and are intended to be adjusted annually, using the Consumer Price Index (CPI). The guidelines are in terms of costs per student station, and must be adjusted to convert to costs per FISH capacity. Dividing the current State construction cost guidelines per FISH capacity by the average local square feet per student capacity yields the equivalent State guideline costs per square foot. As can be seen in Table 27, the recent local cost of the Liberty Magnet Elementary School as about five percent lower than the State guideline, while the current estimate for the new middle school is about 15 percent higher.
Table 27. Estimated Local School Building Costs per Square Foot Elem. Middle High
State Guidelines, January 2006 $17,952 $19,386 $25,181CPI Ratio, Jan. 2007 to Jan. 2006 1.0208 1.0208 1.0208Construction Cost per Student Station $18,325 $19,789 $25,705Student Stations per FISH Capacity 1.000 1.111 1.053Construction Cost per FISH Capacity $18,325 $21,986 $27,067Avg. Square Feet per Student Capacity 116.79 115.24 130.65State Cost Guidelines per Square Foot $156.91 $190.78 $207.17Recent or Planned Building Cost per Square Foot $149.37 $220.00 NARatio of Local Cost to State Guideline 0.952 1.153 NAEstimated Local Costs per Square Foot $149.37 $220.00 $220.00
Source: State legislative guidelines from Sec. 1013.64(6)(b)1; U.S. Consumer Price Index for All Items from Bureau of Labor Statistics, student stations per FISH capacity is inverse of DOE utilization rates of 1.00 for elementary, 0.90 for middle and 0.95 for high school; average square feet per student capacity derived from Table 24; recent or planned building cost is Liberty Elementary building cost per square foot from Table 26 and architect’s estimate for Middle School “BB” prepared by SchenkelShultz Architecture on February 26, 2007.
In addition to the actual cost of the school facility, design and engineering costs, public utility connection costs, FF&E costs and the cost of land are also determined for each type of school by taking a percentage of the total construction cost per facility. The various percentages used for each of these cost calculations are based on the costs of recently constructed school facilities in Indian River County. The cost of land must be considered. The land cost per student capacity for each school type is determined by using a cost per acre figure of $95,000, which is based on the District’s most recent acquisition (152.17-acre parcel for $14,456,150 in 2006). The cost of land per square foot of building by school type is determined by multiplying the per acre cost by the average number of acres for each type of school, then dividing by the average building square feet of that school type. Finally, ancillary facility costs should be considered. Information is available on the cost of buses used to transport students, and the bus fleet will need to be expanded as student enrollment increases. The replacement cost of the current bus fleet was not available. Based on original costs, bus costs amount to $366 per student, as shown in Table 28.

Impact Fee Update Technical Memorandum #3 (Final) Indian River County, Florida April 30, 2007 39
Table 28. School Bus Cost per Student Year Model Unit Cost Number Total Cost1992 Bluebird $71,194 3 $213,5821993 Bluebird $74,444 1 $74,4441993 International $38,252 8 $306,0161994 Bluebird $69,045 1 $69,0451995 International $42,487 21 $892,2271995 Thomas $42,487 1 $42,4871996 Thomas $43,321 2 $86,6421996 International $43,321 1 $43,3211996 Thomas $49,013 1 $49,0131996 International $49,013 2 $98,0261998 Thomas $72,086 1 $72,0861999 Thomas $51,329 2 $102,6581999 Thomas $55,267 2 $110,5342001 Thomas $48,745 1 $48,7452001 Freightliner $49,050 12 $588,6002001 Freightliner $68,562 1 $68,5622002 Freightliner $55,273 10 $552,7312002 Freightliner $72,955 1 $72,9552003 Freightliner $55,673 6 $334,0382003 Freightliner $68,207 1 $68,2072005 Thomas $52,494 4 $209,9762005 Thomas $71,793 1 $71,7932005 Thomas $56,399 6 $338,3942005 Thomas $75,950 1 $75,9502006 Thomas $58,700 6 $352,2002006 Thomas $77,731 1 $77,7312007 Bluebird $68,083 12 $816,9962007 Bluebird $77,269 2 $154,538
Total Cost $5,991,497Students 16,370Cost per Student $366 Source: Bus inventory and unit costs from School District of Indian River County, March 16, 2007 (costs are original historic costs, not replacement costs); current student enrollment from Table 25.
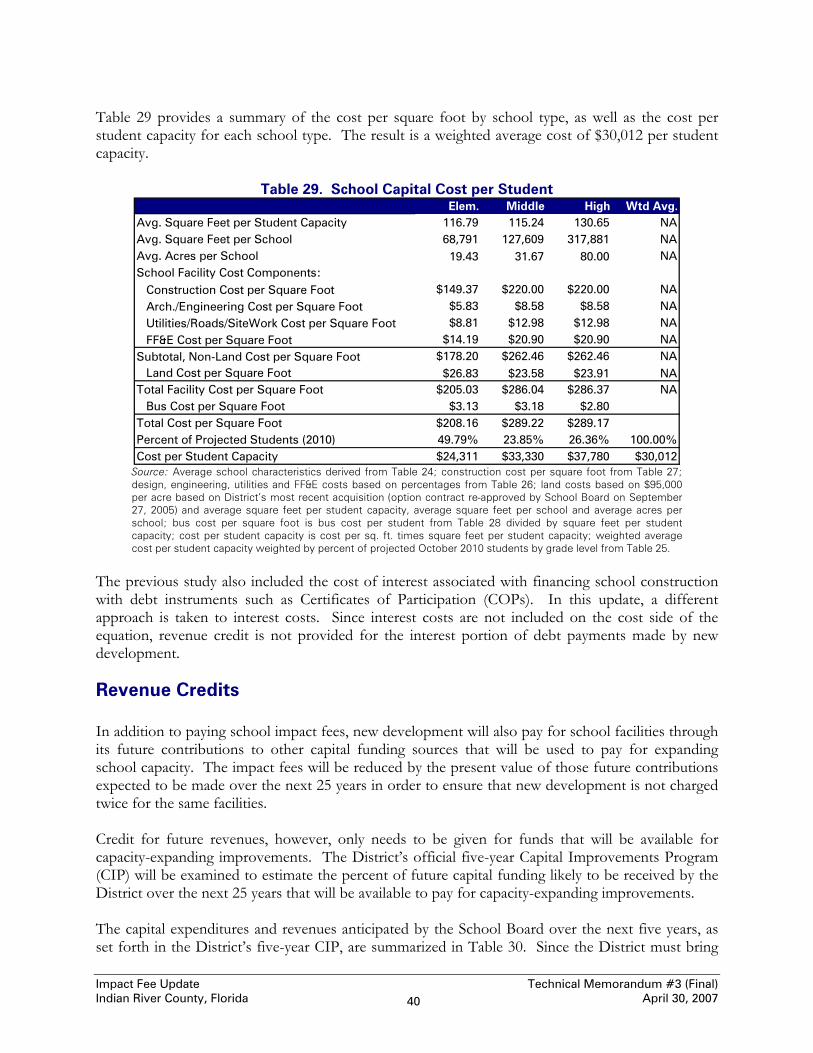
Impact Fee Update Technical Memorandum #3 (Final) Indian River County, Florida April 30, 2007 40
Table 29 provides a summary of the cost per square foot by school type, as well as the cost per student capacity for each school type. The result is a weighted average cost of $30,012 per student capacity.
Table 29. School Capital Cost per Student Elem. Middle High Wtd Avg.
Avg. Square Feet per Student Capacity 116.79 115.24 130.65 NAAvg. Square Feet per School 68,791 127,609 317,881 NAAvg. Acres per School 19.43 31.67 80.00 NASchool Facility Cost Components: Construction Cost per Square Foot $149.37 $220.00 $220.00 NA Arch./Engineering Cost per Square Foot $5.83 $8.58 $8.58 NA Utilities/Roads/SiteWork Cost per Square Foot $8.81 $12.98 $12.98 NA FF&E Cost per Square Foot $14.19 $20.90 $20.90 NASubtotal, Non-Land Cost per Square Foot $178.20 $262.46 $262.46 NA Land Cost per Square Foot $26.83 $23.58 $23.91 NATotal Facility Cost per Square Foot $205.03 $286.04 $286.37 NA Bus Cost per Square Foot $3.13 $3.18 $2.80Total Cost per Square Foot $208.16 $289.22 $289.17Percent of Projected Students (2010) 49.79% 23.85% 26.36% 100.00%Cost per Student Capacity $24,311 $33,330 $37,780 $30,012
Source: Average school characteristics derived from Table 24; construction cost per square foot from Table 27; design, engineering, utilities and FF&E costs based on percentages from Table 26; land costs based on $95,000 per acre based on District’s most recent acquisition (option contract re-approved by School Board on September 27, 2005) and average square feet per student capacity, average square feet per school and average acres per school; bus cost per square foot is bus cost per student from Table 28 divided by square feet per student capacity; cost per student capacity is cost per sq. ft. times square feet per student capacity; weighted average cost per student capacity weighted by percent of projected October 2010 students by grade level from Table 25.
The previous study also included the cost of interest associated with financing school construction with debt instruments such as Certificates of Participation (COPs). In this update, a different approach is taken to interest costs. Since interest costs are not included on the cost side of the equation, revenue credit is not provided for the interest portion of debt payments made by new development.
Revenue Credits In addition to paying school impact fees, new development will also pay for school facilities through its future contributions to other capital funding sources that will be used to pay for expanding school capacity. The impact fees will be reduced by the present value of those future contributions expected to be made over the next 25 years in order to ensure that new development is not charged twice for the same facilities. Credit for future revenues, however, only needs to be given for funds that will be available for capacity-expanding improvements. The District’s official five-year Capital Improvements Program (CIP) will be examined to estimate the percent of future capital funding likely to be received by the District over the next 25 years that will be available to pay for capacity-expanding improvements. The capital expenditures and revenues anticipated by the School Board over the next five years, as set forth in the District’s five-year CIP, are summarized in Table 30. Since the District must bring

Impact Fee Update Technical Memorandum #3 (Final) Indian River County, Florida April 30, 2007 41
existing schools up to Amendment 9 standards while also accommodating unprecedented growth, the five-year plan contemplates a massive program of new school construction. Most of capacity-related improvements will be paid either with school impact fees or non-recurring revenues, including fund balance and debt proceeds. Non-earmarked recurring revenues, which consist primarily of the District’s 2-mill Capital Improvements Tax, will be spent primarily on non-capacity improvements. Only 26.94% of non-earmarked recurring revenues will be spent on capacity improvements over the next five years.
Table 30. Planned School Capital Expenditures and Revenues, 2007-2011 Total Capacity Non-Capacity
New Schools $141,000,000 $141,000,000Additions $8,002,500 $8,002,500Simon Mall Facility $325,000 $325,000Site Acquisition $2,500,000 $2,500,000Modernizations/Replacements $39,591,581 $39,591,581Capital Maintenance $48,262,488 $48,262,488Safety/Security/Environmental $9,089,000 $9,089,000Relocatable Leasing/Renovation $10,450,000 $10,450,000Educational Technology $12,316,931 $12,316,931School Buses/Other Vehicles $8,824,000 $1,764,800 $7,059,200Ancillary Facilities and Equipment $437,139 $437,139COPs Debt Service $69,802,995 $19,028,296 $50,774,699Works in Progress Carryover $39,491,795 $39,491,795Total Expenditures $390,093,429 $224,866,461 $165,226,968Impact Fees $13,200,000 $13,200,000COPs Proceeds $100,838,434 $100,838,434PECO New Construction $2,033,204 $2,033,204PECO Maintenance $3,962,112 $3,962,112CO&DS $1,500,000 $1,500,000Classrooms for Kids $8,183,025 $8,183,025Other State Sources $150,000 $150,000Fund Transfer $39,491,795 $39,491,795Paid w/Non-Earmarked Recurring Revenue $220,734,859 $59,470,003 $161,264,856Percent 100.00% 26.94% 73.06% Source: School District of Indian River County, Capital Improvement Program, FY 2007-2011; 20% of bus costs attributed to capacity, as replacement buses have about 20% more seats than existing buses, and COPs proceeds for new middle and high school, per School District, February 12, 2007 teleconference; non-capacity debt service includes interest payments and share of principal attributable to non-capacity projects based on review of official statements for 2005 COPs and 2003 GO bonds.
The State of Florida provides limited funding for capital improvements. The two sources of regular annual State capital funding, Public Education Capital Outlay (PECO) and Capital Outlay and Debt Service (CO&DS), have diminished in recent years and are no longer significant sources of capital funding. PECO new construction revenues to school districts are actually the proceeds of bonds that are retired with revenue from a State surtax on telephone lines. Due to a decrease in phone lines caused by increased usage of cell phones and alternatives to dial-up internet access, among other trends, PECO funding is in decline. Based on budgeted revenues that will be available over the next five years, the total projected State revenues available for the expansion of student capacity is about $10.4 million. Thus, the annual PECO, CO&DS and “Classroom for Kids” funds are divided by the planned 4,395 new units of

Impact Fee Update Technical Memorandum #3 (Final) Indian River County, Florida April 30, 2007 42
student capacity that, according to the School District, are expected to be constructed over the next five years to calculate a State revenue credit of $2,359 per student, as summarized in Table 31.
Table 31. School State Revenue Credit
PECO New Construction $2,033,204Classrooms for Kids $8,183,025Misc. State Sources $150,000Total State Revenues $10,366,229Planned New Student Capacity 4,395State Revenue per New Student $2,359 Source: School District of Indian River County, Capital Improvements Program, FY 2007-2011; planned student capacity from School District, Tentative Facilities Work Program submitted to Department of Education prior to Oct. 1, 2006.
School districts in Florida are authorized to impose a maximum 2-mill property tax for capital improvements known as the Capital Improvement Tax (CIT). New residential developments that will send children to District schools will also pay the CIT. Therefore, it is necessary to calculate a credit to equitably reflect what new developments will pay toward their school capital needs through their CIT payments. The CIT millage rate assessed by the School District of Indian River County is at the maximum level of $2.00 per $1,000 of taxable value. As noted earlier, credit needs to be provided only for CIT revenue that will be used for capacity-expanding improvements. Applying the percentage of non-earmarked recurring capital funding available for capacity expansion to projected CIT revenues over the next five years, yields the CIT revenues available for capacity expansion. Dividing the annual CIT capacity funding by the average annual number of students during the period results in the annual capacity payment per student that can be expected from new development. The present value of this annual revenue per student over the next 25 years is determined based on current average long-term interest rates. This results in a present value credit of $10,421 per student, as shown in Table 32.
Table 32. School Capital Improvements Tax Revenue Credit
Total Five-Year Projected 2-Mill Revenues $216,424,770Percent of Recurring Revenue used for Capital Expansion 26.9%Five-Year Projected 2-Mill Revenues to Capital Expansion $58,304,833Years Projected 5Average Annual Five-Year 2-Mill Revenue Used for Capital Expansion $11,660,967Total Five-Year Average Annual Students 17,1202-Mill Annual Revenue Per Student $681.13Present Value Factor (25 years at 4.2% discount rate) 15.30Present Value of Annual 2-Mill Revenue $10,421 Source: Total five-year projected 2-mill revenues from the adopted Capital Improvements Plan, FY 2007-2011; percent of recurring, non-earmarked revenue for capacity from Table 30; average annual students for years 2006/07 to 2010/11 from page 8 of Tentative Facilities Work Program submitted to DOE prior to October 1, 2006; discount rate is average interest rate on tax-free municipal bonds for Nov. 2006 through Jan. 2007 from US Federal Reserve.
It is the School District’s intent to use impact fee revenues as the primary funding source for future capital expansion needs and to maintain or reduce the average annual dollar amount shown in this
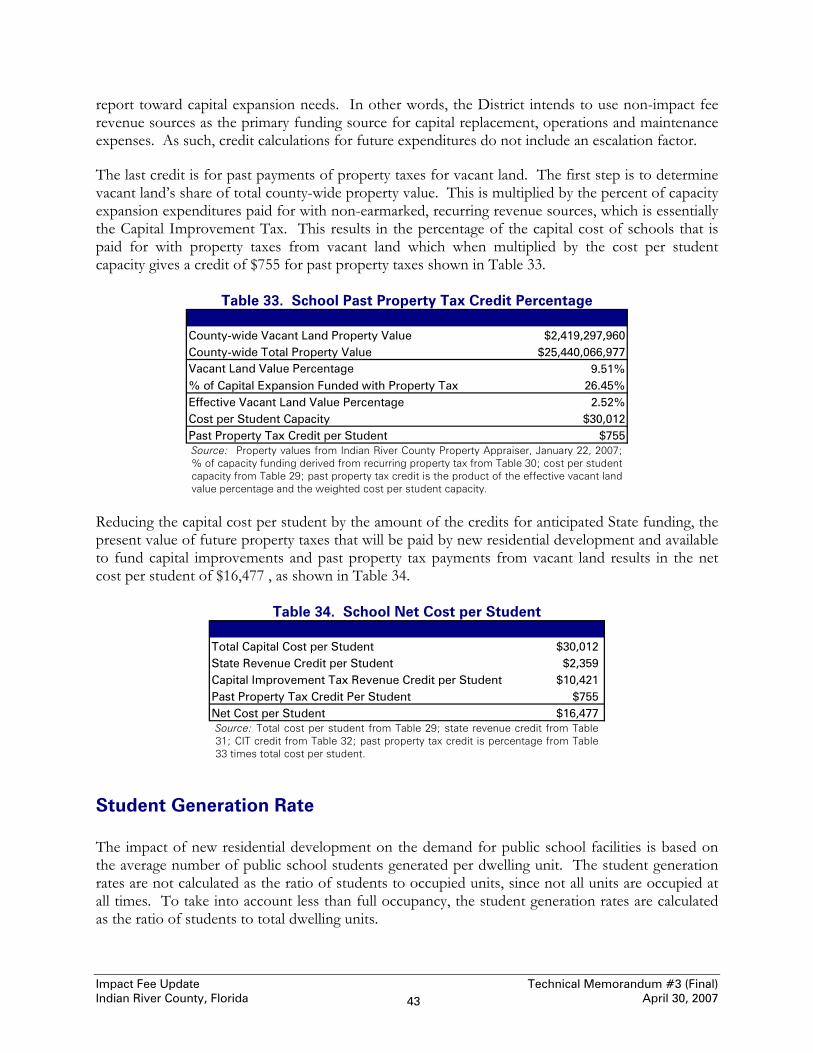
Impact Fee Update Technical Memorandum #3 (Final) Indian River County, Florida April 30, 2007 43
report toward capital expansion needs. In other words, the District intends to use non-impact fee revenue sources as the primary funding source for capital replacement, operations and maintenance expenses. As such, credit calculations for future expenditures do not include an escalation factor. The last credit is for past payments of property taxes for vacant land. The first step is to determine vacant land’s share of total county-wide property value. This is multiplied by the percent of capacity expansion expenditures paid for with non-earmarked, recurring revenue sources, which is essentially the Capital Improvement Tax. This results in the percentage of the capital cost of schools that is paid for with property taxes from vacant land which when multiplied by the cost per student capacity gives a credit of $755 for past property taxes shown in Table 33.
Table 33. School Past Property Tax Credit Percentage
County-wide Vacant Land Property Value $2,419,297,960County-wide Total Property Value $25,440,066,977Vacant Land Value Percentage 9.51%% of Capital Expansion Funded with Property Tax 26.45%Effective Vacant Land Value Percentage 2.52%Cost per Student Capacity $30,012Past Property Tax Credit per Student $755 Source: Property values from Indian River County Property Appraiser, January 22, 2007; % of capacity funding derived from recurring property tax from Table 30; cost per student capacity from Table 29; past property tax credit is the product of the effective vacant land value percentage and the weighted cost per student capacity.
Reducing the capital cost per student by the amount of the credits for anticipated State funding, the present value of future property taxes that will be paid by new residential development and available to fund capital improvements and past property tax payments from vacant land results in the net cost per student of $16,477 , as shown in Table 34.
Table 34. School Net Cost per Student
Total Capital Cost per Student $30,012State Revenue Credit per Student $2,359Capital Improvement Tax Revenue Credit per Student $10,421Past Property Tax Credit Per Student $755Net Cost per Student $16,477 Source: Total cost per student from Table 29; state revenue credit from Table 31; CIT credit from Table 32; past property tax credit is percentage from Table 33 times total cost per student.
Student Generation Rate The impact of new residential development on the demand for public school facilities is based on the average number of public school students generated per dwelling unit. The student generation rates are not calculated as the ratio of students to occupied units, since not all units are occupied at all times. To take into account less than full occupancy, the student generation rates are calculated as the ratio of students to total dwelling units.

Impact Fee Update Technical Memorandum #3 (Final) Indian River County, Florida April 30, 2007 44
The best available data source on student generation rates by type of dwelling unit is the 2000 U.S. Census 5-percent Public-Use Microdata Samples (PUMS). The 2000 PUMS data for Indian River County are combined with Okeechobee County, although Indian River County accounts for 76 percent of the population in the sample area. The sample data consist of census enumerations for 3,963 occupied and vacant housing units. In using the census sample data, public school students are defined as persons enrolled in public school and attending preschool through 12th grade. The student generation rates from the 2000 census sample data by housing type are shown in Table 35.
Table 35. Uncalibrated Student Generation Rates, 2000 Housing Type Students Units Students/Unit Single-Family* 16,337 40,796 0.4005Multi-Family 1,767 18,033 0.0980Mobile Home 3,661 14,353 0.2551Total 21,765 73,182 0.2974 * includes single-family detached and single-family attached Source: 2000 US Census, weighted PUMS 5% sample data for Indian River and Okeechobee counties (students defined as public school students below college level).
To ensure that the regional student generation rates derived from the 2000 sample data are representative of actual conditions in Indian River County in 2007, the expected total number of public school students based on the number of dwelling units estimated to exist in 2007 and the student generation rates derived from the 2000 census sample data is compared to the actual current public school enrollment in Indian River County. As Table 36 shows, the actual number of students enrolled in Indian River County Public Schools is only 66.8 percent of the expected number of students. It is difficult to know how much of this very large difference is due to sampling error, actual decline in student generation rates since 2000, or a temporary decline in housing occupancy rates since 2000. To be conservative, the rates for all housing types are reduced by this percentage to get the calibrated student generation rates shown in Table 36.
Table 36. Calibrated Student Generation Rates, 2007
Housing TypeUncalibrated
Students/Unit UnitsExpectedStudents
ActualStudents
Calibrated Students/Unit
Single-Family* 0.4005 52,064 20,852 13,939 0.268Multi-Family 0.0980 18,053 1,769 1,182 0.066Mobile Home 0.2551 7,328 1,869 1,249 0.170Total 0.2974 77,445 24,490 16,370 0.211 * includes single-family detached and single-family attached Source: Uncalibrated students per unit from Table 35; existing units from Table 123; expected students is product of uncalibrated rates and existing units; total actual students is Oct. 2006 enrollment from Table 25; actual students by grade level is expected students reduced by ratio of total actual to total expected students; calibrated students per unit is ratio of actual students to units.
In 2006, the School District commissioned a study of student generation rates.4 This study used GIS technology to assign the home address for every student enrolled in the School District in 2005 to the nearest residential parcel in the Property Appraiser’s data base. Each student was assigned one of three housing types: single-family, multi-family or mobile home (the single-family category included condominiums, which makes the results of this analysis not strictly comparable with the housing types used in this report). Then the number of students in each housing type was divided 4 Fishkind and Associates, Indian River County Student Generation Rates by Housing Type, May 2006.

Impact Fee Update Technical Memorandum #3 (Final) Indian River County, Florida April 30, 2007 45
by the existing number of dwelling units shown in the Property Appraiser data for that housing type, reduced by ten percent to reflect an average 90 percent vacancy rate. The student generation rates per occupied housing unit derived from the address-matching analysis are shown in Table 37. For impact fee purposes, however, it is not appropriate to assume that every unit will be occupied, since there is a need to account for normal turnover (periods of vacancy between when one household moves out and another moves in) as well as units held for seasonal use and not occupied on a permanent, year-round basis. Consequently, the students per occupied unit identified in the address-matching analysis have been reduced by ten percent to yield students per total unit. These are compared with the student generation rates derived from the 2000 US Census microdata and calibrated to October 2006 enrollment in the following table. The address-matching multiplier is higher for single-family, even though it includes condominium units, which have been classified as multi-family in the Census multipliers and would be expected to lower, not increase, the single-family rate. The address-matching multipliers are lower for multi-family and mobile home. The weighted average rate derived from the address-matching analysis is about 1.187 times the weighted average rated derived by dividing current enrollment by estimated total existing dwelling units. There are two major possibilities to account for this discrepancy -- either the Property Appraiser data under-estimate total units because of a lag between construction and entry onto the tax rolls, or the estimates calculated in this study based on 2000 U.S. Census counts and subsequent building permits over-estimate existing units by not accounting for demolitions or counting units that are under construction but not yet completed. Perhaps it is some combination of the two. In any case, the single-family rate derived from the address-matching process is not directly comparable to the one derived from the Census because it includes condominiums (the multi-family rates are also not comparable for the same reason). The problem with defining condominium as single-family is that condominium status is dependent on the type of ownership, which can change over time. In addition, condominiums are unlikely to have student generation rates similar to single-family detached or single-family attached (townhouse) structures, because they do not have private yards and tend to have fewer families with children. For these reasons, this study will rely on the student generation rates derived form the calibrated Census data.
Table 37. Comparison of Student Generation Rates Census Data
Housing TypeStudents/
Occupied UnitStudents/ Total Unit
Students/ Total Unit
Single-Family* 0.409 0.368 0.2677 1.375Multi-Family 0.066 0.059 0.0655 0.901Mobile Home 0.078 0.070 0.1704 0.411Total 0.279 0.251 0.2114 1.187
Address-Matching Analysis Ratio of Address-Matching
to Census
* includes condominiums in address-matching data, but not in census data Source: Address matching analysis results from Fishkind and Associates, Indian River County Student Generation Rates by Housing Type, May 2006; Census data results calibrated to October 2006 enrollment from Table 36.

Impact Fee Update Technical Memorandum #3 (Final) Indian River County, Florida April 30, 2007 46
Updated Impact Fee Schedule The net cost per dwelling unit is the product of the number of public school students that, on average, can be expected to be generated from the type of unit and the net cost per student calculated in this report. The resulting net costs, which represent the maximum school impact fees that can be justified based on the analysis contained in this study, are shown in Table 38.
Table 38. Updated School Impact Fee Schedule
Residential Land UseImpact
UnitNet Cost/ Student
Students per Unit
Net Cost/ Unit
Single-Family* Dwelling $16,477 0.268 $4,411Multi-Family/Accessory Dwelling $16,477 0.066 $1,079Mobile Home Dwelling $16,477 0.170 $2,808
* includes single-family detached and single-family attached Source: Net cost per student from Table 34; students per unit from Table 36.
The potential impact fees shown above represent a significant increase from the current fees, as shown in Table 39. The largest increase is for mobile homes, reflecting the relatively greater student generation rates documented in this study compared to the previous study.
Table 39. Comparative School Impact Fees
Residential Land UseImpact
UnitUpdated
FeeCurrent
FeePercentChange
Single Family Dwelling $4,411 $1,756 151.2%Multi-Family/Accessory Dwelling $1,079 $500 115.7%Mobile Home Dwelling $2,808 $623 351.0% Source: Updated fee from Table 38.
Revenue Projections Table 40 presents the school demand forecast and associated capital cost estimates (in 2007 dollars) to the year 2025. As shown below, the County will need to accommodate an additional 8,694 students by 2025. This would require an investment of $264 million over the next 18 years. Impact fees alone will not be sufficient to provide the capital funding needed.
Table 40. School Demand and Cost Analysis, 2007-2025 Elementary Middle High School All Schools
Projected Students By Year 2025 12,062 6,282 6,784 NACurrent FISH Capacity (2006/07) 8,246 3,322 4,866 NANew Student Capacity Needed by 2025 3,816 2,960 1,918 8,694Facility Cost per Student Capacity $24,311.00 $33,330.00 $37,780.00 NATotal Cost By School Type - Year 2025 $92,770,776 $98,656,800 $72,462,040 $263,889,616Projected School Impact Fee Revenue $143,251,873
Source: Projected students for 2025/2026 from Tentative Facilities Work Program submitted to DOE prior to October 1, 2006; current capacity from Table 25; costs per student capacity from Table 29; projected revenue based on new student capacity needed times net cost per student from Table 34.

Impact Fee Update Technical Memorandum #3 (Final) Indian River County, Florida April 30, 2007 47
Based on the average annual amount of development experienced over the last six years, it is estimated that the updated school impact fees will generate about 151 percent more revenue than would be generated under the current fee schedule, as shown in Table 41.
Table 41. School Impact Fee Revenue Estimates Avg. Annual Percent
Housing Type Impact Units Current Updated Current Updated ChangeSingle-Family 2,486 $1,756 $4,411 $4,365,000 $10,965,000 151%Multi-Family 470 $500 $1,079 $235,000 $507,000 116%Mobile Home 73 $623 $2,808 $45,000 $205,000 356%Total $4,645,000 $11,677,000 151%
Impact Fee Rates Impact Fee Revenues
Source: Average annual impact units from 2001 to 2006 county-wide building permit data; impact fee rates from Table 39.

Impact Fee Update Technical Memorandum #3 (Final) Indian River County, Florida April 30, 2007 48
PARKS Indian River County provides a number of park and recreational facilities for the benefit of unincorporated area residents (the municipalities in the county provide their own park facilities). The locations of existing County parks are illustrated in Figure 4. A detailed inventory of County parks, including name, park classification, acreage and improvements, is presented in Table 132 in Appendix D. Several of the park facilities operated by the County are on land that is owned by the State of Florida. In the previous study, these facilities were excluded in computing the existing level of service. However, the County has long-term, nominal leases (e.g., $1 per year) on these facilities, and for the purposes of this update, they will be treated the same as County-owned facilities.
Figure 4. Location of Existing County Parks

Impact Fee Update Technical Memorandum #3 (Final) Indian River County, Florida April 30, 2007 49
Current Level of Service The County provides parks and recreation facilities and services in the unincorporated areas of the county. The municipalities provide these facilities and services within their respective jurisdictions. As a result, the parks and recreation impact fee analysis will consider only unincorporated area population and parks and recreational facilities located within the unincorporated area. The adopted level of service in the 2020 Comprehensive Plan is “6.61 recreation acres/1,000 permanent plus weighted peak seasonal population” county-wide.5 The current impact fees are based on unincorporated population. Although the previous study purportedly used “permanent plus weighted peak seasonal population,” rather than the permanent population estimates used in this study, the permanent estimates used in this study are actually slightly higher for the unincorporated area.6 The County may wish to consider modifying its adopted level of service for concurrency purposes to base it on the ratio of developed park acres owned or operated by the County to the permanent population residing in unincorporated areas of the county. The acreage should include State-owned land that is leased to the County on a long-term basis for a nominal rate. On this basis, the current actual LOS for parks is 6.26 acres per 1,000 residents, as shown in Table 42. This LOS is based on regional, community and neighborhood parks that are currently available to residents in the unincorporated areas of the county. However, it might be prudent for the County to make the concurrency standard somewhat lower than the existing ratio.
Table 42. Current Parks and Recreation Level of Service
Developed Regional Parks Acres 598.06Developed Community Park Acres 1.00Developed Neighborhood Park Acres 22.93Total Developed Park Acres 621.99Unincorporated Area Population, 2007 99,357Total Developed Park LOS (Acres per 1,000 Residents) 6.26Possible Concurrency LOS (Developed Acres per 1,000 Residents) 6.00 Source: Regional, community and neighborhood parks acres from Table 132 in Appendix D; unincorporated area population from Table 123 in Appendix A.
Regardless of what LOS is established for concurrency purposes, the updated park impact fees will be based on the current actual ratio of the replacement cost of existing park land (developed and undeveloped) and facilities to the unincorporated area residents served by these facilities. The total cost per person for parks and recreation facilities consists of two components: the cost of land for the parks and the cost of improvements to the parks. The cost of land for parks and recreation facilities includes more than just the purchase cost of the land. Landscaping/site improvement and utilities/paving costs also are considered, along with the cost to purchase the land. 5 Indian River County, 2020 Comprehensive Plan, Chapter 6: Capital Improvements Element, Policy 3.5 (concurrency management level-of-service standards), adopted December 12, 2006. 6 For example, the 2005 Tindale-Oliver study used a permanent plus weighted peak seasonal population estimate of 88,710 in the unincorporated area for 2004, compared to a permanent population estimate of 95,361 for FY 2003/04 in this study (Table 50).

Impact Fee Update Technical Memorandum #3 (Final) Indian River County, Florida April 30, 2007 50
The landscaping and site improvement cost per acre is calculated using historical expenditures for the North County Regional Park, which was recently constructed in two phases and reflects typical costs for parks in Indian River County. Phase I includes the construction of the pool complex and related facilities, while Phase II includes construction of the multi-purpose ball fields and related facilities. The calculation of the landscaping and site improvements cost per acre is shown in Table 43.
Table 43. Landscaping and Site Improvements Cost per Acre
Landscaping and Site Improvement Costs - Phase I: Fencing $50,000 Landscaping, Mitigation, and Grassing $225,000 Irrigation $100,000Landscaping and Site Improvement Costs - Phase II: Fencing $125,000 Landscaping and Mitigation $100,000 Irrigation $100,000Total Landscaping and Site Improvements Cost $700,000North County Regional Park Acres 100Landscaping and Site Improvements Cost per Acre $7,000 Source: Improvement costs provided by the Parks and Recreation Department for the 2005 study.
The utilities and paving cost per acre figure is also calculated using historical expenditures for the North County Regional Park. This cost per acre is presented in Table 44.
Table 44. Utilities and Paving Cost per Acre
Utilities and Paving Costs - Phase I: Drainage $550,000 Water and Wastewater Improvements $300,000 Parking Lot Drives $750,000 ERU Connection Fee $4,776Utilities and Paving Costs - Phase II: Drainage $490,000 Water and Wastewater Improvements $25,000Total Utilities and Paving Cost $2,119,776North County Regional Park Acres 100Utilities and Paving Cost per Acre $21,198 Source: Improvement costs provided by the Parks and Recreation Department for the 2005 study.
The calculations from the two previous tables are combined with an average land acquisition cost to determine the total land cost per acre for parks and recreation facilities in unincorporated Indian River County. An average park land acquisition cost of $55,906 per acre is used. This figure is based on recent sales of vacant parcels in IRC of 40 to 160 acres, which can be found in Table 133 of Appendix D. As shown in Table 45, this results in a total land cost of $88,334 per developed park acre.

Impact Fee Update Technical Memorandum #3 (Final) Indian River County, Florida April 30, 2007 51
Table 45. Total Land Cost per Developed Acre
Land Acquisition Cost per Acre $55,906Landscaping and Site Improvements Cost per Acre $7,000Utilities and Paving Cost per Acre $21,198Architecture, Engineering, and Inspection Cost per Acre (@ 15%) $4,230Total Land Cost per Developed Acre $88,334 Source: Land acquisition cost per acre is the average cost per acre for vacant land parcels of 40 to 160 acres sold in Indian River County in 2006 from Table 133; landscaping and site improvements costs from Table 43; utilities and paving costs from Table 44; architecture, engineering and inspection costs are 15% of sum of landscaping/site improvements costs and utilities/paving costs per IRC Public Works Department, February 28, 2007.
The second component in determining the total cost per resident for parks and recreation facilities is to calculate the facility improvement cost per resident. Detailed facility replacement costs for various types of improvements are presented in Table 46. Golf courses often operate as enterprise funds and for this reason are excluded from the inventory.

Impact Fee Update Technical Memorandum #3 (Final) Indian River County, Florida April 30, 2007 52
Table 46. Parks Facility Replacement Cost Facility Number Unit Cost Total CostRestrooms 26 $150,000 $3,900,000Basketball Court 10 $55,000 $550,000Community Center (sf)* 24,981 $225 $5,620,725Jogging Trails (miles) 6.5 $150,000 $975,000Picnic Pavilion 48 $40,000 $1,920,000Playground 14 $90,000 $1,260,000Swimming Pool (Community) 1 $3,000,000 $3,000,000Olympic Aquatic Center 1 $5,800,000 $5,800,000Softball Field (lighted) 15 $515,892 $7,738,380Softball Field (not lighted) 1 $365,892 $365,892Tennis Courts 5 $50,000 $250,000Volleyball Court 3 $20,000 $60,000Soccer Field (lighted) 1 $400,000 $400,000Soccer Field (not lighted) 1 $250,000 $250,000Archery Range** 1 $0 $0Boat Ramp 12 $100,000 $1,200,000Canoe Launch 4 $188,000 $752,000Fairground - Indoor Expo Pavillion 1 $1,105,052 $1,105,052Fairground - Outdoor Expo Pavillion 2 $548,501 $1,097,002Dune Walkover 11 $43,067 $473,737Lifeguard Tower 5 $25,000 $125,000Fishing Pier 12 $12,500 $150,000Small Multi-Purpose Building (2,500 sf) 1 $562,500 $562,500Shooting Range 1 $1,400,000 $1,400,000Viewing Tower 1 $44,500 $44,500Historical Information Center (400 sf) 1 $90,000 $90,000Storage/Maintenance Facility (900 sf) 1 $202,500 $202,500Parks Division Maintenance Facility 1 $850,000 $850,000IRC Shooting Range Storage Building 1 $40,000 $40,000IRC Shooting Range Sporting Clay Course 1 $85,000 $85,000IRC Shooting Range Archery Course 1 $75,000 $75,000IRC Shooting Range Lighting 1 $70,000 $70,000Total $40,412,288
* excludes the square footage occupied by the Gifford Library **County owns land but not the equipment Source: Facilities and number from Table 132 in Appendix D; unit costs provided by IRC Recreation Department, January 18, 2007

Impact Fee Update Technical Memorandum #3 (Final) Indian River County, Florida April 30, 2007 53
Table 47 presents the total replacement costs of existing park facility improvements and existing park land. The total land and facility cost is divided by current population in the unincorporated area to determine the capital cost per person to maintain the existing park level of service.
Table 47. Total Park Cost per Person Developed Undev'd Total
Park Acres 621.99 503.80 1,125.79Land Cost per Acre $88,334 $55,906 NAPark Land Cost $54,942,865 $28,165,443 $83,108,308Park Facility Replacement Cost $40,412,288 $0 $40,412,288Total Park Land and Facility Cost $95,355,153 $28,165,443 $123,520,596Permanent Population in Unincorp. Area, 2007 99,357Total Park Cost per Person $1,243
Source: Park acres from Table 132, land cost per acre from Table 45; facility costs from Table 46.
Revenue Credits As noted in the introduction to this report, impact fees should be reduced to account for future funding that will be generated by new development and used to remedy existing deficiencies or to retire outstanding debt of existing facilities that help provide the existing level of service to existing development. Since the updated fees are based on the existing levels of service, there are no deficiencies. In addition, Indian River County has no outstanding debt for parks and recreation facilities. For these reasons, no revenue credits are absolutely required. The previous study, however, took a more expansive view of revenue credits, providing for a past property tax credit as well as future revenue credit for all types of historical or planned funding used for capacity-expanding capital improvements. While the current consultant team does not agree that such credits are necessarily required, this draft will continue the approach to revenue credits followed in the previous study. An analysis of the historical and future park capital expenditures for the eleven-year period from FY 2001/02 to FY 2011/12 was completed in order to determine a typical amount of annual funding for capacity-expanding improvements. In the past, the County has relied primarily on the general fund and the optional sales tax for parks and recreation capital improvements, with limited contributions from other funding sources, such as the municipal service taxing unit (MSTU) fund, the tree fine fund, the parks improvement fund and the Florida Boating Improvement Program. Table 48 summarizes the capital expenditures over the last six fiscal years. This table also specifies whether the capital expenditure was a replacement or expansion of the existing parks and recreation capital inventory.

Impact Fee Update Technical Memorandum #3 (Final) Indian River County, Florida April 30, 2007 54
Table 48. Historical Park Improvements, 2002-2007
Improvement Type 2001/02 2002/03 2003/04 2004/05 2005/06 2006/07 6-Year TotalStorage buildings - equipment Expansion $9,672 $9,672Maintenance Equipment Replacement $54,359 $68,484 $115,311 $104,744 $173,635 $144,995 $661,528Maintenance Equipment Expansion $2,164 $25,484 $27,648Round Island footbridge Replacement $45,235 $45,235Other Buildings Replacement $51,046 $73,596 $124,642Other Buildings Replacement $85,000 $85,000courts Replacement $50,000 $50,000Subtotal, General Fund $54,359 $78,156 $117,475 $181,274 $292,466 $279,995 $1,003,725
Gifford Aquatic Center - Lighting Expansion $3,950 $3,950North County Aquatic Center - Equip. Expansion $7,945 $7,945other equipment (vehicles, etc.) Expansion $36,547 $26,794 $1,400 $64,741other equipment (vehicles, etc.) Replacement $24,052 $12,579 $3,700 $40,331storage building Expansion $4,999 $4,999defibrillators Expansion $19,396 $5,090 $24,486Computer Equipment Expansion $1,797 $881 $1,650 $4,328Computer Equipment Replacement $1,360 $1,360Subtotal, M.S.T.U. Fund $48,447 $66,111 $1,797 $29,035 $6,750 $152,140
Shooting Range Improvements Expansion $91,665 $91,665Subtotal, Shooting Range Construction $0 $0 $91,665 $0 $0 $0 $91,665
Fairgrounds electronic sign Expansion $4,854 $14,445 $19,299Agricultural Pavilion #2 Expansion $34,030 $329,878 $184,593 $548,501North County Aquatic Center/ Park Expansion $5,073,929 $235,406 $5,309,335Gifford Aquatic Center Expansion $1,750 $1,750Soccer field water & sewer Expansion $134,946 -$100 $13,367 $148,213West Wabasso Park Improvements Replacement $11,113 $81,750 $92,863North County Park Phase II Expansion $1,391,936 $610,627 $2,002,563Gifford Park Security Building Expansion $5,759 $325 $73,916 $80,000Misc Parks Improvements Expansion $46,000 $35,064 $29,762 $110,826AC Replacement Fairgrounds Replacement $127,538 $127,538CR 510 Causeway Replacement $61,334 $61,334Gifford Park SR Ballfield Lighting Replacement $194,825 $194,825Hobart Park Ballfield Lighting Replacement $179,500 $179,500Helen Hanson Ballfield Lighting Replacement $131,200 $131,200Wabasso Beach Park Reconstruct Replacement $15,975 $15,975IRC Parks Maint Complex Replacement $37,796 $1,162,204 $1,200,000Playground Equipment Replacement $57,917 $57,917South County Park - Phase III Expansion $2,300,000 $2,300,000Tracking Station Replacement $48,972 $48,972Misc Repairs Replacement $42,392 $229,803 $272,195Subtotal, Optional Sales Tax $5,244,655 $570,038 $1,648,087 $1,576,878 $54,096 $3,809,052 $12,902,806
North County Aquatic Center Expansion $24,913 $24,913Subtotal, Tree Fine Fund $0 $24,913 $0 $0 $0 $0 $24,913
North County Aquatic Center Expansion $120,611 $120,611Subtotal, Park Improvement Fund $0 $120,611 $0 $0 $0 $0 $120,611
Sebastian Canoe Launch Expansion $74,398 $74,398Schumann Lake Boat Ramp Replacement $7,800 $7,800Misc Boating Facilities Expansion $15,000 $15,000Oslo Boat Ramp Replacement $750 $1,270 $400,000 $402,020Subtotal, FL Boating Impr. Program $82,198 $750 $0 $0 $1,270 $415,000 $499,218
Grand Total - Capital Expenditures $5,429,659 $860,579 $1,857,227 $1,759,949 $376,867 $4,510,797 $14,795,078Total Capital Expansion Expenditures $5,343,448 $778,766 $1,730,803 $678,731 $28,000 $135,095 $8,694,843Total Gen. Fund/MSTU Expansion $24,395 $63,204 $2,164 $27,281 $27,675 $3,050 $147,769% GF/MSTU Expansion Expenditures 0.46% 8.12% 0.13% 4.02% 98.84% 2.26% 1.70% Source: IRC Office of Management and Budget, January 22, 2007 and May 1, 2007.

Impact Fee Update Technical Memorandum #3 (Final) Indian River County, Florida April 30, 2007 55
Over the next five years, the County is planning to make improvements to West County Regional Park and the Oslo Boat Ramp, as well as to acquire land for future parks. Approximately half of this funding could come from park impact fees, based on the revenue projections contained in the previous study. Table 49 summarizes these planned capital expenditures.
Table 49. Planned Park Improvements, 2008-2012
2007/08 2008/09 2009/10 2010/11 2011/12 5-Year Total
West County Regional Park $500,000 $2,800,000 $0 $0 $0 $3,300,000Oslo Boat Ramp and Parking $1,400,000 $0 $0 $0 $0 $1,400,000Land for Future Parks $1,575,000 $1,575,000 $1,575,000 $1,575,000 $0 $6,300,000Total Capital Expenditures $3,475,000 $4,375,000 $1,575,000 $1,575,000 $0 $11,000,000
Total Expansion Expenditures $2,075,000 $4,375,000 $1,575,000 $1,575,000 $0 $9,600,000Projected Parks Impact Fees $902,580 $1,037,967 $1,193,662 $1,372,711 $1,578,618 $4,506,919Non-Impact Fee Expansion Funding $1,172,420 $3,337,033 $381,338 $202,289 -$1,578,618 $5,093,081
*$800,000 added to Oslo Boat Ramp and Parking per Public Works Department, February 28, 2007. Source: IRC Office of Management and Budget, January 22, 2007; projected revenues from IRC OMB, February 28, 2007.
The revenue credit per person for future capacity improvements is calculated using the average non-impact fee capital expansion expenditures during the last six years and the future planned projects budgeted during the next five-years. The average annual capacity expenditure amount is divided by the average population over this eleven-year time period resulting in an average non-impact fee capital expansion contribution of $11.17 per person. This information is presented in Table 50.
Table 50. Park Annual Revenue Credit per Person
Fiscal Year
Non-ImpactFee Expansion
ExpendituresUnincorp.
Population
AnnualExpend./
Person
2001/02 $5,343,448 92,697 $57.642002/03 $778,766 94,029 $8.282003/04 $1,730,803 95,361 $18.152004/05 $678,731 96,693 $7.022005/06 $28,000 98,025 $0.292006/07 $135,095 99,357 $1.362007/08 $1,172,420 100,689 $11.642008/09 $3,337,033 102,021 $32.712009/10 $381,338 103,353 $3.692010/11 $202,289 104,685 $1.932011/12 ($1,578,618) 106,017 -$14.89Total $12,209,306 1,092,927 $11.17
Source: Non-impact fee capacity expenditures from Table 48 and Table 49; unincorporated area population from Table 124 (years prior to 2006/07 interpolated).
It is the County’s intent to use impact fee revenues as the primary funding source for future capital expansion needs of the parks and recreation program and to maintain or reduce the average annual dollar amount shown in this report toward capital expansion needs. In other words, the County intends to use non-impact fee revenue sources as the primary funding source for capital replacement, operations and maintenance expenses. As such, credit calculations for future expenditures do not include an escalation factor.

Impact Fee Update Technical Memorandum #3 (Final) Indian River County, Florida April 30, 2007 56
A final credit component accounts for past payments of property taxes from vacant land. First, the share of total vacant land (residential, commercial and industrial) to total taxable value is determined. This percentage is adjusted to account for the portion of ad valorem taxes used toward capital expansion expenditures. Based on historical expenditures, 1.70% of park capital expansion was funded with ad valorem tax revenues over the past six years. Applying this percentage to the vacant land value percentage results in an effective vacant land value percentage of 0.19%, as shown in Table 51. This percentage is used to give credit for past property taxes paid by owners of vacant land.
Table 51. Park Past Property Tax Percentage
Unincorporated County Vacant Land Value $1,728,524,390Unincorporated County Total Property Value $15,561,808,237Vacant Land Value as a Percentage of Total Property Value 11.11%Percent of General Fund/MSTU Capital Expansion Projects 1.70%Effective Vacant Land Value Percentage 0.19%
Source: Unincorporated county vacant land value and unincorporated county total property value from IRC Property Appraiser, January 22, 2007; percent of general fund/MSTU capital expansion projects from Table 48.
The net present value of the annual revenue credit over the next 25 years is calculated in the following table. Reducing the cost per person by the future revenue credit and the past property tax credit leaves a park net cost of $1,070 per person, as shown in Table 52.
Table 52. Park Net Cost per Person
Average Annual Funding Credit per Person $11.17Net Present Value Factor (25 years at 4.2% discount rate) 15.30Future Revenue Credit per Person $171Past Property Tax Credit per Person $2Total Credit per Person $173Total Park Cost per Person $1,243Net Cost per Person $1,070
Source: Annual credit per person from Table 50; discount rate is average interest rate on state and local bonds in November 2006 through January 2007 from the Federal Reserve; future revenue credit is annual credit times net present value factor; past property tax credit is cost per person times vacant land percentage from Table 51; total cost per person from Table 47.
Updated Impact Fee Schedule The maximum park impact fees that can be adopted by the County based on this study are derived by multiplying the number of persons represented by each impact unit by the net cost per person, as shown in Table 53.

Impact Fee Update Technical Memorandum #3 (Final) Indian River County, Florida April 30, 2007 57
Table 53. Updated Park Impact Fee Schedule Persons per Unit
Net Cost/ Person Net Cost/ Unit
Single-Family*Less than 1,500 sf (under air) 2.069 $1,070 $2,2141,500 sf or more (under air) 2.379 $1,070 $2,546
Multi-Family/Accessory Unit 1.249 $1,070 $1,336Mobile Home 1.466 $1,070 $1,569
Housing Type
* includes single-family detached and single-family attached Source: Persons per unit from Table 122; net cost per person from Table 52.
The updated park impact fees are compared with current fees in Table 54. For administrative ease, the top two single-family size categories have been combined in this update, so that the same fee applies to all units 1,500 square feet or larger. For all housing types, the fees could increase by more than 50 percent.
Table 54. Comparative Park Impact Fees
Housing TypeImpact
UnitUpdated
FeeCurrent
FeePercentChange
Single-Family* Less than 1,500 sf (under air) Dwelling $2,214 $1,302 70% 1,500 to 2,499 sf (under air) Dwelling $2,546 $1,463 74% 2,500 sf or more (under air) Dwelling $2,546 $1,587 60%Multi-Family/Accessory Unit Dwelling $1,336 $884 51%Mobile Home Dwelling $1,569 $942 67% * includes single-family detached and single-family attached Source: Updated fees from Table 53.
Revenue Projections Based on the average annual amount of development experienced in the unincorporated area over the last six years, it is estimated that the updated park impact fees will generate about 72 percent more revenue than would be generated under the current fee schedule, as shown in Table 55.
Table 55. Park Impact Fee Revenue Estimates Avg. Annual Percent
Housing Type Impact Units Current Updated Current Updated ChangeSingle-Family 1,883 $1,463 $2,546 $2,755,000 $4,794,000 74%Multi-Family 329 $884 $1,336 $290,000 $439,000 51%Mobile Home 15 $942 $1,569 $14,000 $24,000 71%Total $3,059,000 $5,257,000 72%
Impact Fee Rates Impact Fee Revenues
Source: Average annual impact units from 2001 to 2006 unincorporated building permit data; impact fee rates from Table 54.

Impact Fee Update Technical Memorandum #3 (Final) Indian River County, Florida April 30, 2007 58
LIBRARIES Indian River County operates four libraries, which provide the only public library service within the county. The locations of the libraries are illustrated in Figure 5. The Main and North County Libraries are located on exclusive library sites. The Law Library is located in the County Courthouse. The Gifford Library is located in the Youth Activities Center in Gifford Park.
Figure 5. Locations of Existing Library Facilities
Current Level of Service The County’s four existing library facilities, summarized in Table 56, contain a total building floor area of 80,340 square feet. Building and land replacement costs for existing facilities are estimated based on current estimates of building cost per square foot for future branch libraries and historical land acquisition costs for library sites.

Impact Fee Update Technical Memorandum #3 (Final) Indian River County, Florida April 30, 2007 59
Table 56. Library Building and Land Replacement Cost Library Facility Address Acres Sq. Ft. Land Cost Bldg. CostMain Library 1600 21st St, Vero Beach 4.180 49,286 $948,743 $14,588,656North County Library 1001 CR 512, Sebastian 4.115 25,445 $933,990 $7,531,720Law Library 2000 16th Ave, Vero Beach NA 3,993 NA $1,181,928Gifford Youth Ctr Library 4875 43rd Ave, Vero Beach NA 1,616 NA $478,336Total 8.295 80,340 $1,882,733 $23,780,640
Source: IRC General Services Department, Division of Library Services, January 22, 2007; land cost based on cost/acre from Table 58; building cost based on cost/sq. ft. from Table 57.
The building replacement costs shown in the preceding table area based on current estimates to construct a new 30,000 square foot West County branch library. These cost estimates are detailed in Table 57.
Table 57. Library Building Cost per Square Foot
Construction $6,300,000 30,000 $210.00Furniture, Fixtures and Equipment $2,580,000 30,000 $86.00Total $8,880,000 30,000 $296.00
Facility AmountSquare
FeetCost/
Sq. Foot
Source: IRC General Services Department, Division of Library Services; estimated costs from Office of Management and Budget for future branch library, January 22, 2007.
The land replacement costs shown in the earlier table are based on historical acquisition costs for library sites. These are shown in Table 58.
Table 58. Library Land Cost per Acre
FacilityYear
Acquired Land Cost AcresCost per
AcreNorth County Library 1988 $351,175 3.125 $112,376North County Library 1997 $227,901 0.990 $230,203Main Library 1989 $1,303,660 4.180 $311,880Total $1,882,736 8.295 $226,972 Source: IRC Office of Management and Budget, January 22, 2007; original land costs escalated by U.S. Consumer Price Index to December 2006 dollars.
A major capital cost for library services is the cost of the library collections, including books and other circulating and non-circulating materials. The replacement costs for existing library collections are presented in Table 59.

Impact Fee Update Technical Memorandum #3 (Final) Indian River County, Florida April 30, 2007 60
Table 59. Library Collections Replacement Cost
Description ItemsUnitCost Total Cost
Gifford Youth Activities Center Library 3,523 $25 $88,075Law Library 16,600 $80 $1,328,000Main & North Reference, Genealogy, Non-Fiction Books 159,295 $80 $12,743,600 Adult Fiction Books 95,859 $25 $2,396,475 Juvenile/YA Reference Books 1,011 $80 $80,880 Juvenile/YA Non-Fiction Books 81,069 $25 $2,026,725 Juvenile/YA Fiction 48,094 $20 $961,880 Paperbacks 16,200 $9 $145,800 Books On Tape/CD 12,683 $75 $951,225 Electronic Books 28,812 $0 $0Subtotal, Books 463,146 $20,722,660
Music CDs 10,397 $15 $155,955DVDs 9,446 $20 $188,920 Videos 18,512 $15 $277,680Print Subscriptions 1,775 $39 $69,225Other Print Materials 21,677 $50 $1,083,850Subtotal, Other Materials 61,807 $1,775,630
Online Resource Subscriptions: 68 $4,094 $278,392
All Library Materials -- Total 525,021 $22,776,682 Source: IRC General Services Department, Division of Library Services, January 22, 2007.
The current actual library level of service, expressed in terms of the capital cost per person, is shown in Table 60. The updated library impact fees will be based on this per capita cost to maintain the current level of service.
Table 60. Library Cost per Person
Library Building and Land Costs $23,780,640Library Collections Costs $22,776,682Total Library Costs $46,557,322County-Wide Population, 2007 151,164Library Cost per Person $307.99 Source: Building and land costs and building square footage from Table 56, collections cost from Table 59, 2007 county-wide population from Table 123.
Revenue Credits As noted in the introduction to this report, impact fees should be reduced to account for future funding that will be generated by new development and used to remedy existing deficiencies or to retire outstanding debt of existing facilities that help provide the existing level of service to existing development. Since the updated fees are based on the existing levels of service, there are no

Impact Fee Update Technical Memorandum #3 (Final) Indian River County, Florida April 30, 2007 61
deficiencies. In addition, Indian River County has no outstanding debt for parks and recreation facilities. For these reasons, no revenue credits are absolutely required. The previous study, however, took a more expansive view of revenue credits, providing for a past property tax credit as well as future revenue credit for all types of historical or planned funding used for capacity-expanding capital improvements. While the current consultant team does not agree that such credits are necessarily required, this draft will continue the approach to revenue credits followed in the previous study. An analysis of the historical and future public buildings capital expenditures for the eleven-year period from FY 2001/02 to FY 2011/12 was completed in order to determine a typical amount of annual funding for capacity-expanding improvements. In the past, the County has relied primarily on impact fees and the optional sales tax for library capital improvements, with limited contributions from other funding sources, such as the general fund and library bequests. Table 61 summarizes the capital expenditures over the last six fiscal years. This table also specifies whether the capital expenditure was a replacement or expansion of the existing library capital inventory. Note that capital expansion expenditures paid from the general fund amount to less than one percent of total expansion expenditures during the six-year period.
Table 61. Historical Library Improvements, 2002-2007 Project Description Type 2001/02 2002/03 2003/04 2004/05 2005/06 2006/07 6-Year TotalMain-Office Furn & Equip Replacement $13,002 $2,136 $3,330 $10,770 $29,238Main-Office Furn & Equip Expansion $8,380 $8,380Main-Computer Equip Expansion $6,297 $922 $7,219Main-Computer Equip Replacement $6,753 $5,493 $13,154 $21,014 $46,414North-Office Furn & Equip Expansion $0North-Office Furn & Equip Replacement $3,830 $9,372 $3,000 $16,202North-Computer Equip Expansion $0North-Computer Equip Replacement $0North-Bldg Improvements Expansion $12,132 $12,132Subtotal, General Fund $31,431 $9,811 $8,823 $27,754 $38,766 $3,000 $119,585
North-Bldg Improvements Expansion $691,804 $691,804North-Computer Equip Expansion $10,844 $508 $11,352Subtotal, Library Bequests $702,648 $508 $0 $0 $0 $0 $703,156
Main-Additions & Upgrades Expansion $1,115,513 $3,518 $16,482 $40,000 $1,175,514North County Library Expansion $1,321,421 $23,478 $11,000 $1,355,899West County Library-IRCC Expansion $4,300,000 $200,000 $4,500,000Subtotal, Optional Sales Tax $2,436,935 $3,518 $16,482 $4,323,478 $0 $251,000 $2,531,413
West County Library-IRCC Expansion $1,485,000 $4,500,000Subtotal, Impact Fees $0 $0 $0 $0 $0 $1,485,000 $4,500,000
Total Capital Expenditures $3,171,014 $13,838 $25,305 $4,351,232 $38,766 $1,739,000 $7,854,155Total Capacity Expenditures $3,158,012 $4,948 $16,482 $4,323,478 $8,380 $1,736,000 $12,262,300Total Non-Impact Fee Expansion $3,158,012 $4,948 $16,482 $4,323,478 $8,380 $251,000 $7,762,300Total General Fund Expansion $18,429 $922 $0 $0 $8,380 $0 $27,731% General Fund Expansion 0.58% 18.63% 0.00% 0.00% 100.00% 0.00% 0.36%
Source: IRC Office of Management and Budget, January 22, 2007.

Impact Fee Update Technical Memorandum #3 (Final) Indian River County, Florida April 30, 2007 62
The County’s Capital Improvements Element does not contain any planned improvements over the next five years beyond the completion of the new West County branch library that is currently underway. The revenue credit per person for future capacity improvements is calculated using the average capital expansion expenditures during the last six years and the future planned projects budgeted during the next five-years. The average annual capacity expenditure amount is divided by the average population during this eleven-year time period resulting in an average capital expansion contribution per person. This information is presented in Table 62.
Table 62. Library Annual Revenue Credit per Person
Fiscal Year
Non-ImpactFee Expansion
ExpendituresCounty-Wide
Population
AnnualExpend./
Person
2001/02 $3,158,012 139,849 $22.582002/03 $4,948 142,112 $0.032003/04 $16,482 144,375 $0.112004/05 $4,323,478 146,638 $29.482005/06 $8,380 148,901 $0.062006/07 $251,000 151,164 $1.662007/08 $0 153,427 $0.002008/09 $0 155,690 $0.002009/10 $0 157,953 $0.002010/11 $0 160,216 $0.002011/12 $0 162,479 $0.00Total $7,762,300 1,662,804 $4.67
Source: Non-impact fee expansion expenditures from Table 61; county-wide population for 2007 through 2012 from Table 124 (prior years interpolated).
It should be noted that it is the County’s intent to use impact fee revenues as the primary funding source for future capital expansion needs of libraries and to maintain or reduce the average annual dollar amount from non-impact fee revenue sources shown in this study toward capital expansion needs. In other words, the County intends to use non-impact fee revenue sources as the primary funding source for capital replacement, operations and maintenance expenses. As such, credit calculations for optional sales tax and ad valorem tax do not include an escalation factor. According to the Office of Management and Budget, the use of ad valorem taxes toward library capital expansion is limited and typically is directed to the replacement and possibly the addition of equipment. To be conservative, however, credit for past payments of property taxes for vacant land is given. The calculation of the percentage of capacity expansion improvements paid for with property taxes from vacant land is presented in Table 63.

Impact Fee Update Technical Memorandum #3 (Final) Indian River County, Florida April 30, 2007 63
Table 63. Library Past Property Tax Percentage
County-Wide Vacant Land Property Value $2,419,297,960County-Wide Total Property Value $25,440,066,977Vacant Land Value as % of Total Value 9.51%Percent General Fund Expansion 0.36%Effective Vacant Land Value Percentage 0.03% Source: Property values IRC Property Appraiser, January 22, 2007; percent of expansion funding from general fund from Table 61.
The net present value of the annual revenue credit over the next 25 years is calculated in the following table. Reducing the cost per person by the future revenue credit and the past property tax credit leaves a library net cost of $236.45 per person, as shown in Table 64.
Table 64. Library Net Cost per Person
Average Annual Funding Credit per Person $4.67Net Present Value Factor (25 years at 4.2% discount rate) 15.30Future Revenue Credit per Person $71.45Past Property Tax Credit per Person $0.09Total Credit per Person $71.54Total Library Cost per Person $307.99Library Net Cost per Person $236.45
Source: Annual credit from Table 62; discount rate is average interest rate on state and local bonds in November 2006 through January 2007 from the Federal Reserve; past property tax credit is cost per person times vacant land percentage from Table 63; cost per person from Table 60.

Impact Fee Update Technical Memorandum #3 (Final) Indian River County, Florida April 30, 2007 64
Updated Impact Fee Schedule Table 65 presents the updated library impact fee schedule, which is based on the existing level of service.
Table 65. Updated Library Impact Fee Schedule
Housing TypePersons/
UnitNet Cost/
PersonNet Cost/
UnitSingle-Family* Less than 1,500 sf (under air) 2.069 $236 $489 1,500 sf or more (under air) 2.379 $236 $563Multi-Family/Accessory Unit 1.249 $236 $295Mobile Home 1.466 $236 $347
* includes single-family detached and single-family attached Source: Persons per unit from Table 122; net cost per person from Table 64.
The updated fees are compared with the current library impact fees in Table 66. For administrative ease, the top two single-family size categories have been combined in this update, so that the same fee applies to all units 1,500 square feet or larger. The fees would go up modestly for most housing types.
Table 66. Comparative Library Impact Fees
Housinhg TypeImpact
UnitUpdated
FeeCurrent
FeePercentChange
Single-Family Less than 1,500 sf (under air) Dwelling $489 $430 14% 1,500 to 2,499 sf (under air) Dwelling $563 $483 17% 2,500 sf or more (under air) Dwelling $563 $524 7%Multi-Family/Accessory Unit Dwelling $295 $285 4%Mobile Home Dwelling $347 $349 -1%
Source: Updated fees from Table 65.
Revenue Projections Based on the average annual amount of development experienced in the county over the last six years, it is estimated that the updated library impact fees will generate about 15 percent more revenue than would be generated under the current fee schedule, as shown in Table 67.
Table 67. Library Impact Fee Revenue Estimates Avg. Annual Percent
Housing Type Impact Units Current Updated Current Updated ChangeSingle-Family 2,486 $483 $563 $1,201,000 $1,400,000 17%Multi-Family 470 $285 $295 $134,000 $139,000 4%Mobile Home 73 $349 $347 $25,000 $25,000 0%Total $1,360,000 $1,564,000 15%
Impact Fee Rates Impact Fee Revenues
Source: Average annual impact units from 2001 to 2006 county-wide building permit data; impact fee rates from Table 66.

Impact Fee Update Technical Memorandum #3 (Final) Indian River County, Florida April 30, 2007 65
FIRE RESCUE The Fire Rescue Division of the Indian River County Emergency Services Department provides a wide range of services to development throughout the county, with the exception of Indian River Shores, which has its own fire department. These services include firefighting, basic life support and advanced life support medical response, special operations (marine firefighting, dive rescue, airport firefighting and rescue, high angle rescue, hazardous materials response and confined space rescue), fire prevention, arson investigation, pre-hospital emergency care and public education. The locations of existing fire stations are illustrated in Figure 6.
Figure 6. Fire Station Locations

Impact Fee Update Technical Memorandum #3 (Final) Indian River County, Florida April 30, 2007 66
Current Level of Service Indian River County currently has a total of eleven fire rescue stations. In addition, the County has funded two additional stations that are planned to be constructed in the next five years. Table 68 summarizes the County’s existing fire rescue building and land inventory. Figure 6 illustrates the locations of the existing fire rescue stations.
Table 68. Fire Rescue Building and Land Cost
Facility Location
Year Acquired/
Built Acres Building
Sq. Ft.LandCost
Building Cost
Station 1* 1500 Old Dixie Hwy, Vero Beach 1986 5.00 16,423 $921,155 $4,434,210Station 2* 3301 Bridge Plaza Dr, Vero Beach 2007 1.82 8,956 $335,300 $2,686,800Station 3* 2900 43rd Ave, Vero Beach 2006 2.72 10,152 $501,108 $2,741,040Station 4 1500 9th St SW, Vero Beach 2006 2.18 7,886 $401,624 $2,129,220Station 5 6585 US 1, Winter Beach 2006 2.32 7,886 $427,416 $2,129,220Station 6 101 South A1A, Vero Beach 1986 2.20 3,099 $405,308 $836,730Station 7 1215 82nd Ave, Vero Beach 1986 0.50 3,099 $92,116 $836,730Station 8** 1115 Barber St, Sebastian 1999 1.00 5,620 $184,231 $1,517,400Station 9 1640 US 1, Sebastian 1999/2007 7.01 7,880 $1,291,459 $2,127,600Station 10 62 North Broadway, Fellsmere, 1996 0.48 5,520 $88,431 $1,490,400Station 11 2555 93rd St, Vero Beach 2001 1.51 7,612 $278,189 $2,055,240Total 26.74 84,133 $4,926,337 $22,984,590 * Leased (acreage listed is based on estimated portion of the parcel occupied by the station) ** Sebastian Volunteer Fire Department operates out of Station 8. Source: IRC Emergency Services Department, January 22, 2007; land replacement cost based on average $184,231/acre of sales of four- to six-acre parcels in Indian River County in 2006 (see Appendix E); building replacement cost for Station 2 based on $300 cost per square foot from planned 2007 replacement cost of Station 2, all others based on $270 per square foot per Emergency Services Department, March 22, 2007.
In addition to land and buildings, the County’s fire rescue inventory includes the necessary vehicles to perform its fire rescue duties. The vehicle inventory replacement cost is summarized in Table 69.
Table 69. Fire Rescue Vehicle Cost Description Units Unit Cost Total CostLadder Truck 1 $771,000 $771,000Quint 1 $542,000 $542,000Brush Truck 8 $135,000 $1,080,000Dive Rescue Unit 1 $160,000 $160,000CFR Airport Truck 1 $800,000 $800,0003,000 Gallon Tanker Truck 1 $240,000 $240,000Airport Rescue Truck 1 $165,000 $165,000Hazardous Materials Vehicle 1 $150,000 $150,000Marine Fire Boat 1 $180,000 $180,000Rigid Hull Inflatable Boat 1 $40,000 $40,000Fire Engine 14 $351,000 $4,914,000Ambulance 14 $138,000 $1,932,000Total $10,974,000
Source: IRC Emergency Services Department, January 22, 2007 and Finance Department, March 29, 2007 (cost of vehicle only-does not include vehicle equipment costs).

Impact Fee Update Technical Memorandum #3 (Final) Indian River County, Florida April 30, 2007 67
In addition to vehicles, the equipment that goes on the vehicles, the equipment that goes in the stations and uniforms for fire rescue personnel are also capital costs related to growth. Replacement costs are not available for this equipment, so original costs are used. These costs are summarized in Table 70.
Table 70. Fire Rescue Capital Equipment Cost
Facility Description UniformsStation
EquipmentVehicle
EquipmentTotal
EquipmentFire/Rescue Station 1 $176,800 $139,600 $205,700 $522,100Fire/Rescue Station 2 $52,000 $77,100 $198,100 $327,200Fire/Rescue Station 3 $62,000 $87,100 $170,600 $319,700Fire/Rescue Station 4 $52,000 $77,100 $139,100 $268,200Fire/Rescue Station 5 $52,000 $77,100 $139,100 $268,200Fire/Rescue Station 6 $41,600 $57,100 $138,100 $236,800Fire/Rescue Station 7 $52,000 $57,100 $139,100 $248,200Fire/Rescue Station 8 $52,000 $67,100 $244,400 $363,500Fire/Rescue Station 9 $52,000 $77,100 $139,100 $268,200Fire/Rescue Station 10 $52,000 $47,100 $139,100 $238,200Fire/Rescue Station 11 $41,600 $57,100 $238,100 $336,800Total $686,000 $820,600 $1,890,500 $3,397,100 Source: IRC Emergency Services Department, January 22, 2007.
The total capital cost represented by existing fire rescue facilities and equipment is the sum of building, land, vehicle and capital equipment costs. This amounts to $42,282,027, as shown in Table 71. Dividing by existing service units in the fire rescue service area (entire county except for Indian River Shores) yields the cost per functional population.
Table 71. Fire Rescue Cost per Functional Population
Station Building Cost $22,984,590Station Land Cost $4,926,337Vehicle Cost $10,974,000Equipment Costs $3,397,100Total Replacement Cost $42,282,027Functional Population, County-Wide less Indian River Shores 159,147Cost per Functional Population $265.68 Source: Building and land costs from Table 68; vehicle cost from Table 69; equipment cost from Table 70; county-wide functional population less Indian River Shores from Table 127.

Impact Fee Update Technical Memorandum #3 (Final) Indian River County, Florida April 30, 2007 68
Revenue Credits As noted in the introduction, impact fees should be reduced to account for future funding that will be generated by new development and used to remedy existing deficiencies or to retire outstanding debt of existing facilities that help provide the existing level of service to existing development. Since the updated fees are based on the existing levels of service, there are no deficiencies. In addition, Indian River County has no outstanding debt for the types of facilities covered in this report. For these reasons, no revenue credits are absolutely required. The previous study, however, took a more expansive view of revenue credits, providing for a past property tax credit as well as future revenue credit for all types of historical or planned funding used for capacity-expanding capital improvements. While the current consultant team does not agree that such credits are necessarily required, this draft will continue the approach to revenue credits followed in the previous study. The Indian River County Fire Rescue Division has two primary sources for capital expenditures: emergency services district and optional sales tax (CDBG funding was used once to repair hurricane damage to Station 4). No general fund money has been spent on fire rescue capital improvements in recent years. An analysis of the historical and future fire rescue capital expenditures for the eleven-year period from FY 2001/02 to FY 2011/12 was completed in order to determine a typical amount of annual funding for capacity-expanding improvements. Table 72 summarizes the capital expenditures over the last six fiscal years. This table also specifies whether the capital expenditure was a replacement or expansion of the existing fire rescue capital inventory.

Impact Fee Update Technical Memorandum #3 (Final) Indian River County, Florida April 30, 2007 69
Table 72. Historical Fire Rescue Improvements, 2002-2007
Description Type 2001/02 2002/03 2003/04 2004/05 2005/06 2006/07 6-Year TotalLand - Sebastian Sta. Expansion $7,000 $7,000 $14,000Building Projects Replacement $31,579 $25,850 $3,370 $60,799Building Projects Expansion $12,393 $12,393Station 10 Sewer Replacement $7,504 $7,504Furn & Equipment Expansion $1,750 $23,000 $24,750Furn & Equipment Replacement $7,869 $5,288 $14,000 $27,157Fire Vehicles Replacement $35,548 $143,785 $1,627,024 $972,248 $715,839 $3,494,444Fire Vehicles Expansion $24,158 $24,158Fire Vehicles (Sta. 12) Expansion $616,820 $616,820Radios Expansion $15,714 $63,075 $27,500 $106,289Radios Replacement $1,677 $14,993 $12,781 $13,419 $33,290 $76,160Commun. Equip Replacement $125,159 $125,159Computer Equip Expansion $7,928 $19,335 $2,200 $26,545 $56,008Computer Equip Replacement $7,068 $32,679 $56,598 $14,916 $5,200 $116,461Misc. Equipment Expansion $47,449 $3,295 $10,205 $30,435 $44,838 $169,878 $306,100Misc. Equipment Replacement $25,207 $52,139 $95,798 $137,338 $131,483 $123,385 $565,350Ambulances Replacement $348,000 $116,218 $399,044 $119,897 $290,000 $1,273,159EMS Vehicles Replacement $37,165 $206,218 $243,383Fire Station #2 Replacement $107,231 $44,431 $2,792,812 $2,944,474Fire Station #3 Replacement $1,074,730 $717,981 $1,792,711Fire Station #4 Replacement $211,121 $274,624 $485,745Fire Station #5 Replacement $76 $903,741 $903,817Fire Station #6 Replacement $287,568 $173,089 $52,036 $512,693Fire Station #8 Replacement $191,307 $3,693 $195,000Fire Station #9 Replacement $2,300 $2,450,389 $2,452,689Fire Station #10 Replacement $24,047 $96,394 $120,441Repair Boat Lift Hurricane $14,480 $14,480Bldg Repairs/Equip Hurricane $42,061 $42,061Furn & Equip Hurricane $37,707 $37,707A/C Fire Station 1 Replacement $10,555 $10,555Boston Whaler Replacement $181,245 $181,245Intl Brush Truck Replacement $68,970 $129,610 $198,580Vehicles Replacement $63,524 $91,568 $155,092Training Tower Replacement $707,008 $707,008Subtotal, Emergency Services Dist. $572,640 $479,780 $1,986,380 $1,286,965 $3,572,609 $10,006,019 $17,904,392
Disaster Recovery Replacement $97,899 $906,552 $1,107,600 $2,112,051Subtotal, CDBG $97,899 $906,552 $1,107,600 $2,112,051
Fire Station 5 Replacement $87,328 $641,876 $327,653 $1,056,857Fire Station 3 Replacement $28,703 $284,230 $184,230 $497,163Fire Station 9 Replacement $3,115 $576,523 $579,638Fire Station 12 Expansion $79,329 $1,420,671 $1,500,000Subtotal, Optional Sales Tax $116,031 $1,008,550 $2,509,077 $3,633,658
Grand Total, Capital Expenditures $572,640 $479,780 $1,986,380 $1,500,895 $5,487,711 $13,622,696 $23,650,101Total Capacity Expansion $78,091 $24,438 $29,540 $56,793 $187,242 $2,284,414 $2,660,518Percent Capacity Expansion 13.64% 5.09% 1.49% 3.78% 3.41% 16.77% 11.25%Percent Capacity from Gen. Fund 0.00% 0.00% 0.00% 0.00% 0.00% 0.00% 0.00%
Source: IRC Office of Management and Budget, January 22, 2007 (FY 2006/07 amounts are budgeted, not actual).

Impact Fee Update Technical Memorandum #3 (Final) Indian River County, Florida April 30, 2007 70
The County is planning to construct two new stations over the next five years, as well as replace two of the existing stations. Table 73 summarizes these planned capital expenditures.
Table 73. Planned Fire Rescue Improvements, 2008-2012 Improvement Type 2007/08 2008/09 2009/10 2010/11 2011/12 5-Year TotalNew Station 13 Expansion $0 $1,144,705 $1,500,000 $0 $0 $2,644,705New Station 14 Expansion $0 $0 $0 $0 $2,800,000 $2,800,000Total Capital Expenditures $0 $1,144,705 $1,500,000 $0 $2,800,000 $5,444,705
Total Expansion Expenditures $0 $1,144,705 $1,500,000 $0 $2,800,000 $5,444,705Projected Fire/Rescue Impact Fees $0 $0 $0 $0 $2,800,000 $2,800,000Non-Impact Fee Expansion Funding $0 $1,144,705 $1,500,000 $0 $0 $2,644,705
Source: IRC Office of Management and Budget, February 22, 2007. The credit per functional population is calculated using the average capital expansion expenditures during the last six years and the future planned projects budgeted during the next five-years. The average annual capital expenditure amount is divided by the average functional population during this eleven-year time period, resulting in an average capital expansion contribution of $3.03 per functional resident. This information is presented in Table 74.
Table 74. Fire Rescue Annual Credit per Functional Population
Fiscal Year
Non-ImpactFee CapacityExpenditures
FunctionalPopulation
Annual Expend./ Func.
Pop.2001/02 $78,091 141,397 $0.552002/03 $24,438 144,947 $0.172003/04 $29,540 148,497 $0.202004/05 $56,793 152,047 $0.372005/06 $187,242 155,597 $1.202006/07 $2,284,414 159,147 $14.352007/08 $0 162,697 $0.002008/09 $1,144,705 166,247 $6.892009/10 $1,500,000 169,797 $8.832010/11 $0 173,347 $0.002011/12 $0 176,897 $0.00
Total/Average $5,305,223 1,750,617 $3.03 Source: Non-impact fee capacity expenditures from Table 72 and Table 73; functional population is county-wide less Indian River Shores from Table 128 (years prior to 2006/07 interpolated).
The net present value of the annual revenue credit over the next 25 years is calculated in the following table. Reducing the cost per functional population by the revenue credit leaves a fire rescue net cost of $219.32 per functional population, as shown in Table 75.

Impact Fee Update Technical Memorandum #3 (Final) Indian River County, Florida April 30, 2007 71
Table 75. Fire Rescue Net Cost per Functional Population
Source: Annual credit from Table 74; discount rate is average interest rate on state and local bonds in November 2006 through January 2007 from the Federal Reserve; cost per functional population from Table 71.
Updated Impact Fee Schedule The maximum fire rescue impact fees that can be adopted by the County based on this study are derived by multiplying the functional population represented by each impact unit by the net cost per functional population, as shown in Table 76.
Table 76. Updated Fire Rescue Net Cost Schedule
Land UseImpact
Unit
Functional Population Coefficient
Net Cost/ Func. Pop.
NetCost/
UnitResidential Single-Family Less than 1,500 sf (under air) Dwelling 1.345 $219.32 $295 1,500 sf or more (under air) Dwelling 1.546 $219.32 $339 Multi-Family/Accessory Unit Dwelling 0.812 $219.32 $178 Mobile Home Dwelling 0.953 $219.32 $209Transient, Assisted, Group Hotel/Motel Room 0.908 $219.32 $199 Nursing Home/ACLF Bed 0.979 $219.32 $215Office and Financial Medical Office 1,000 sf 1.702 $219.32 $373 Bank/Savings Walk-in 1,000 sf 1.941 $219.32 $426 Bank/Savings Drive-in 1,000 sf 1.591 $219.32 $349 Office 50,000 sf or less 1,000 sf 1.401 $219.32 $307 Office greater than 50,000 sf 1,000 sf 0.741 $219.32 $162 Research & Development 1,000 sf 0.726 $219.32 $159Industrial Manufacturing 1,000 sf 0.501 $219.32 $110 Warehouse 1,000 sf 0.385 $219.32 $84 Mini-Warehouse 1,000 sf 0.076 $219.32 $17 General Industrial 1,000 sf 0.684 $219.32 $150 Concrete Plant Acre 1.508 $219.32 $331 Sand Mining Acre 0.193 $219.32 $42
Average Annual Funding Credit per Functional Pop. $3.03Net Present Value Factor (25 years at 4.2% discount rate) 15.30Funding Credit per Functional Population $46.36Cost per Functional Population] $265.68Net Cost per Functional Population $219.32

Impact Fee Update Technical Memorandum #3 (Final) Indian River County, Florida April 30, 2007 72
Updated Fire Rescue Impact Fee Schedule (continued)
Land UseImpact
Unit
Functional Population Coefficient
Net Cost/ Func. Pop.
NetCost/
UnitRetail Retail 50,000 sf or less 1,000 sf 2.862 $219.32 $628 Retail 50,001 to 100,000 sf 1,000 sf 2.854 $219.32 $626 Retail 100,001 to 200,000 sf 1,000 sf 2.920 $219.32 $640 Retail over 200,000 sf 1,000 sf 1.995 $219.32 $438 Gas/Service Station Fuel pos 1.723 $219.32 $378 New and Used Car Sales 1,000 sf 1.706 $219.32 $374 Restaurant 1,000 sf 7.333 $219.32 $1,608 Fast Food Rest w/ Drive-Thru 1,000 sf 7.902 $219.32 $1,733 Supermarket 1,000 sf 2.031 $219.32 $445 Self Service Car Wash Bays 1.887 $219.32 $414 Convenience Store 1,000 sf 4.243 $219.32 $931 Furniture Store 1,000 sf 0.318 $219.32 $70Recreational Golf Course Hole 2.443 $219.32 $536 Racquet/Health Club/Dance 1,000 sf 2.374 $219.32 $521 County Park Acre 0.152 $219.32 $33 Tennis Court Court 2.321 $219.32 $509 Marina Berths 0.153 $219.32 $34Governmental Post Office 1,000 sf 1.773 $219.32 $389 Library 1,000 sf 1.718 $219.32 $377 Government Office Complex 1,000 sf 1.356 $219.32 $297 Jail Bed 0.871 $219.32 $191Miscellaneous Day Care Center 1,000 sf 1.009 $219.32 $221 Hospital 1,000 sf 1.566 $219.32 $343 Veterinary Clinic 1,000 sf 1.633 $219.32 $358 Church 1,000 sf 0.533 $219.32 $117 Movie Theater Screen 8.477 $219.32 $1,859 School (Elem. and Middle) Student 0.094 $219.32 $21 School (High) Student 0.120 $219.32 $26 School (College) Student 0.104 $219.32 $23 Fire Station* 1,000 sf 0.633 $0.00 $0 * Fire stations mitigate the need for fire rescue facilities. Source: Functional population coefficients from Table 125 and Table 126; net cost per functional population from Table 75.
The updated fire rescue impact fees are compared with current fees in Table 77. For administrative ease, the top two single-family size categories have been combined in this update, so that the same fee applies to all units 1,500 square feet or larger. For most land uses, the fees could go up around 25 percent. The slight decrease in fee for multi-family is due to the somewhat lower persons/unit multiplier than was used in the 2005 study.

Impact Fee Update Technical Memorandum #3 (Final) Indian River County, Florida April 30, 2007 73
Table 77. Comparative Fire Rescue Impact Fees
Land UseImpact
UnitUpdated
FeeCurrent
FeePercentChange
Residential Single-Family Less than 1,500 sf (under air) Dwelling $295 $247 19% 1,500 to 2,499 sf (under air) Dwelling $339 $278 22% 2,500 sf or more (under air) Dwelling $339 $301 13% Multi-Family/Accessory Unit Dwelling $178 $176 1% Mobile Home Dwelling $209 $182 15%Transient, Assisted, Group Hotel/Motel Room $199 $160 24% Nursing Home/ACLF Bed $215 $172 25%Office and Financial Medical Office 1,000 sf $373 $299 25% Bank/Savings Walk-in 1,000 sf $426 $341 25% Bank/Savings Drive-in 1,000 sf $349 $280 25% Office 50,000 GSF or less 1,000 sf $307 $246 25% Office greater than 50,000 GSF 1,000 sf $162 $130 25% Research & Development 1,000 sf $159 NA NAIndustrial Manufacturing 1,000 sf $110 $88 25% Warehouse 1,000 sf $84 $68 24% Mini-Warehouse 1,000 sf $17 $13 31% General Industrial 1,000 sf $150 $120 25% Concrete Plant Acre $331 $265 25% Sand Mining Acre $42 $34 24%Retail Retail 50,000 sf or less 1,000 sf $628 $503 25% Retail 50,001 to 100,000 sf 1,000 sf $626 $502 25% Retail 100,001 to 200,000 sf 1,000 sf $640 $513 25% Retail over 200,000 sf 1,000 sf $438 $351 25% Gas/Service Station Fuel pos $378 $303 25% New and Used Car Sales 1,000 sf $374 $300 25% Restaurant 1,000 sf $1,608 $1,289 25% Fast Food Rest w/ Drive-Thru 1,000 sf $1,733 $1,389 25% Supermarket 1,000 sf $445 $357 25% Self Service Car Wash Bays $414 $332 25% Convenience Store 1,000 sf $931 $746 25% Furniture Store 1,000 sf $70 $56 25%Recreational Golf Course hole $536 $429 25% Racquet/Health Club/Dance 1,000 sf $521 $417 25% County Park Acre $33 $27 22% Tennis Court Court $509 $408 25% Marina Berths $34 $27 26%Governmental Post Office 1,000 sf $389 $312 25% Library 1,000 sf $377 $302 25% Government Office Complex 1,000 sf $297 $239 24% Jail Bed $191 $153 25%Miscellaneous Day Care Center 1,000 sf $221 $177 25% Hospital 1,000 sf $343 $275 25% Veterinary Clinic 1,000 sf $358 $287 25% Church 1,000 sf $117 $94 24% Movie Theater Screen $1,859 $1,490 25% School (Elem. and Middle) Student $21 $17 24% School (High) Student $26 $21 24% School (College) Student $23 $18 28% Fire Station 1,000 sf $0 $0 NA Source: Updated fees from Table 76.

Impact Fee Update Technical Memorandum #3 (Final) Indian River County, Florida April 30, 2007 74
Revenue Projections Based on the average annual amount of development experienced over the last six years, it is estimated that the updated fire rescue impact fees will generate about 21 percent more revenue than would be generated under the current fee schedule, as shown in Table 78.
Table 78. Fire Rescue Impact Fee Revenue Estimates Avg. Annual Percent
Land Use Type Impact Units Current Updated Current Updated ChangeSingle-Family 2,338 $278 $339 $650,000 $793,000 22%Multi-Family 463 $176 $178 $81,000 $82,000 1%Mobile Home 57 $182 $209 $10,000 $12,000 20%Nonresidential (1000 sf) 782.4 $359 $448 $281,000 $351,000 25%Total $1,022,000 $1,238,000 21%
Impact Fee Rates Impact Fee Revenues
Source: Average annual impact units from 2001 to 2006 building permit data (county-wide less Indian River Shores); impact fee rates from Table 77 (nonresidential fees are averages of all nonresidential land uses charged on a square footage basis).

Impact Fee Update Technical Memorandum #3 (Final) Indian River County, Florida April 30, 2007 75
LAW ENFORCEMENT The Indian River County Sheriff’s Office provides law enforcement patrol in the unincorporated area of the county. Law enforcement patrol is provided by the Uniform Services Division, which includes the Uniform Deputies Unit, the Traffic Unit, Special Operations, Aviation Unit, K-9 Unit, Marine Unit and Ranch and Grove Unit and the Criminal Investigations Division, which includes the Detective Bureau and the Crime Scene Unit.
Current Level of Service The Sheriff’s Office performs a number of county-wide functions in addition to law enforcement patrol. These include corrections, judicial process and multi-agency dispatch. In addition, agency-wide functions, such as the Sheriff’s administrative, fiscal, legal and internal affairs staff, central records, information technology and human resources and training, support both county-wide and unincorporated county activities. Space in Sheriff’s Office buildings directly occupied by unincorporated area law enforcement patrol and county-wide functions are allocated to their respective areas. Two-thirds of the space occupied by agency-wide functions is allocated to the unincorporated area, reflecting the share of officers devoted to law enforcement patrol. The main Sheriff’s Office facility in Indian River County is the 19.62-acre site occupied by the Sheriff’s Administration Building and the Correctional Facility. The land is allocated between county-wide and unincorporated area functions based on the share of building square footage on the site devoted to them. In addition to the main complex, other Sheriff’s Office functions that are off-site include judicial process, which is housed in the County Courthouse, and the Aviation Unit, which is housed in the helicopter hangar. The current cost to replace existing law enforcement facilities is based on the estimated average cost per building square foot of future improvements, including expansion of the Administration Building and replacement of the fleet maintenance garage and training facilities (see Table 80). These improvements have been dropped from the most recent Capital Improvements Element, but the estimated costs for the improvements are still considered representative of current expansion costs. The replacement cost of acreage attributable to unincorporated area law enforcement patrol is estimated based on the average cost per acre of four-to-six acre parcels purchased in the county in 2006 (see Table 134 in Appendix E). These building and land replacement costs are summarized in Table 79.
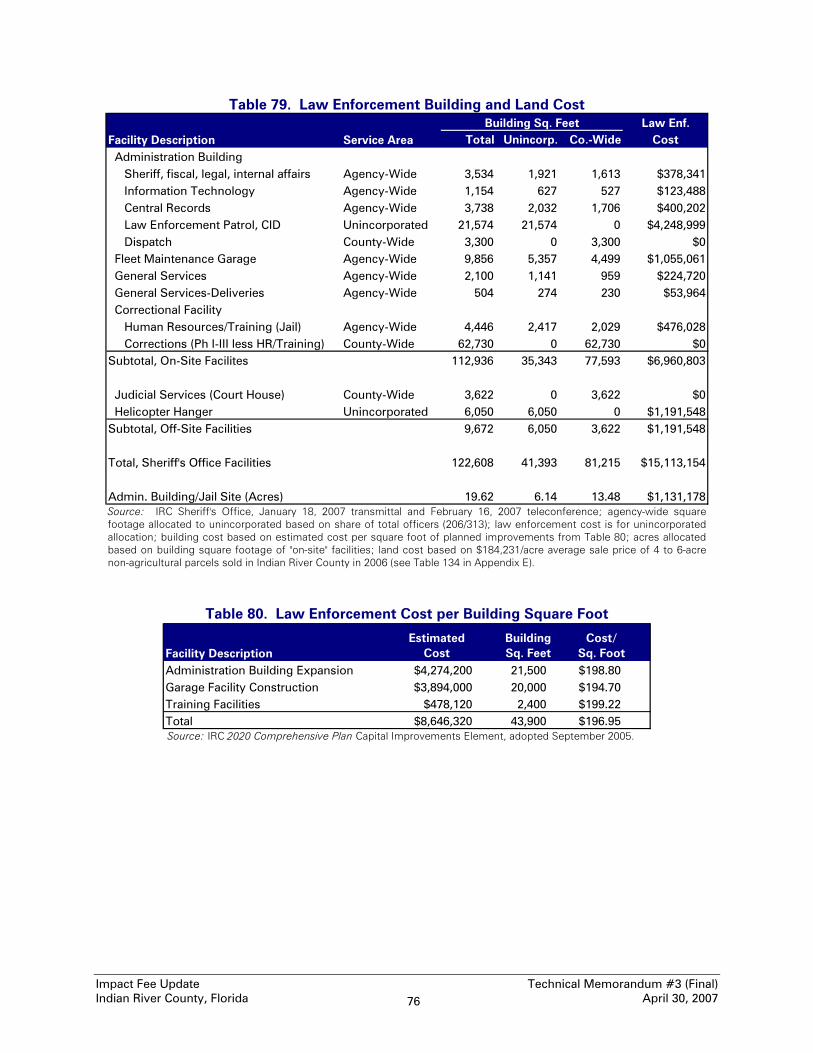
Impact Fee Update Technical Memorandum #3 (Final) Indian River County, Florida April 30, 2007 76
Table 79. Law Enforcement Building and Land Cost Law Enf.
Facility Description Service Area Total Unincorp. Co.-Wide Cost Administration Building Sheriff, fiscal, legal, internal affairs Agency-Wide 3,534 1,921 1,613 $378,341 Information Technology Agency-Wide 1,154 627 527 $123,488 Central Records Agency-Wide 3,738 2,032 1,706 $400,202 Law Enforcement Patrol, CID Unincorporated 21,574 21,574 0 $4,248,999 Dispatch County-Wide 3,300 0 3,300 $0 Fleet Maintenance Garage Agency-Wide 9,856 5,357 4,499 $1,055,061 General Services Agency-Wide 2,100 1,141 959 $224,720 General Services-Deliveries Agency-Wide 504 274 230 $53,964 Correctional Facility Human Resources/Training (Jail) Agency-Wide 4,446 2,417 2,029 $476,028 Corrections (Ph I-III less HR/Training) County-Wide 62,730 0 62,730 $0Subtotal, On-Site Facilites 112,936 35,343 77,593 $6,960,803
Judicial Services (Court House) County-Wide 3,622 0 3,622 $0 Helicopter Hanger Unincorporated 6,050 6,050 0 $1,191,548Subtotal, Off-Site Facilities 9,672 6,050 3,622 $1,191,548
Total, Sheriff's Office Facilities 122,608 41,393 81,215 $15,113,154
Admin. Building/Jail Site (Acres) 19.62 6.14 13.48 $1,131,178
Building Sq. Feet
Source: IRC Sheriff's Office, January 18, 2007 transmittal and February 16, 2007 teleconference; agency-wide square footage allocated to unincorporated based on share of total officers (206/313); law enforcement cost is for unincorporated allocation; building cost based on estimated cost per square foot of planned improvements from Table 80; acres allocated based on building square footage of "on-site" facilities; land cost based on $184,231/acre average sale price of 4 to 6-acre non-agricultural parcels sold in Indian River County in 2006 (see Table 134 in Appendix E).
Table 80. Law Enforcement Cost per Building Square Foot
Source: IRC 2020 Comprehensive Plan Capital Improvements Element, adopted September 2005.
Facility DescriptionEstimated
CostBuildingSq. Feet
Cost/ Sq. Foot
Administration Building Expansion $4,274,200 21,500 $198.80Garage Facility Construction $3,894,000 20,000 $194.70Training Facilities $478,120 2,400 $199.22Total $8,646,320 43,900 $196.95

Impact Fee Update Technical Memorandum #3 (Final) Indian River County, Florida April 30, 2007 77
In addition to land and buildings, a variety of vehicles and equipment is used for law enforcement. Current replacement costs for existing vehicles and equipment was not available. However, Sheriff’s Office staff reviewed fixed asset records to identify the original acquisition cost of existing vehicles and equipment utilized in support of the law enforcement patrol function. These costs are summarized in Table 81.
Table 81. Law Enforcement Vehicle and Equipment Cost
Source: IRC Sheriff’s Office, January 18, 2007.
The total capital cost represented by existing law enforcement facilities and equipment is the sum of building, land, vehicle and capital equipment costs. Dividing the total replacement cost by the existing number of service units in the unincorporated area results in the capital cost per functional population, shown in Table 82.
Table 82. Law Enforcement Cost per Functional Population
Building Replacement Cost $15,113,154Land Replacement Cost $1,131,178Vehicle and Equipment Cost $12,752,164Total Capital Cost, Law Enforcement Patrol $28,996,496Functional Population, Unincorporated Area, 2007 104,067Cost per Functional Population $278.63 Source: Building and land costs from Table 79; vehicle and equipment cost from Table 81; unincorporated area functional population from Table 127.
Revenue Credits As noted in the introduction, impact fees should be reduced to account for future funding that will be generated by new development and used to remedy existing deficiencies or to retire outstanding debt of existing facilities that help provide the existing level of service to existing development. Since the updated fees are based on the existing levels of service, there are no deficiencies. In addition, Indian River County has no outstanding debt for the types of facilities covered in this report. For these reasons, no revenue credits are absolutely required. The previous study, however, took a more expansive view of revenue credits, providing for a past property tax credit as well as future revenue credit for all types of historical or planned funding used for capacity-expanding capital improvements. While the current consultant team does not agree that
Vehicles $5,223,071Radio Equipment $1,510,755Vehicle Equipment $1,379,922Weapons $193,870Office Equipment $147,461Specialty Vehicles/Equipment $116,052Audio Equipment $149,092Computer Equipment $2,874,995Misc. Equipment $1,156,946Total Equipment Cost $12,752,164

Impact Fee Update Technical Memorandum #3 (Final) Indian River County, Florida April 30, 2007 78
such credits are necessarily required, this update will continue the approach to revenue credits followed in the previous study. An analysis of the historical and future law enforcement capital expenditures for the eleven-year period from FY 2001/02 to FY 2011/12 was completed in order to determine a typical amount of annual funding for capacity-expanding improvements. In the past, the County has relied primarily on the general fund and the optional sales tax for law enforcement capital improvements. Table 83 summarizes the capital expenditures over the last six fiscal years. This table also specifies whether the capital expenditure was a replacement or expansion of the existing law enforcement capital inventory.
Table 83. Historical Law Enforcement Improvements, 2002-2007
Source: IRC Office of Management and Budget, January 22, 2007 (FY 2006/07 amounts are budgeted, not actual). The County does not currently have any planned law enforcement improvements listed in the Capital Improvements Element. The credit per functional population was calculated using the average capital expansion expenditures during the last six years and the future planned projects budgeted during the next five-years. The average annual capital expenditure amount was divided by the average functional population during this eleven-year time period resulting in an average capital expansion contribution of $1.10 per functional resident. This information is presented in Table 84.
Description Type 2001/02 2002/03 2003/04 2004/05 2005/06 2006/07 6-Year TotalIRC Sheriff HVAC Replace Replacement $12,778 $18,822 $1,037,506 $278,323 $1,347,429Sheriff's Evidence Addition Expansion $132,486 $132,486Sheriff's Parking Paving Replacement $28,229 $28,229Subtotal, Optional Sales Tax Funding $132,486 $12,778 $47,051 $1,037,506 $278,323 $0 $1,508,144
Automobiles, Auto Equip Replacement $757,000 $504,000 $638,000 $523,000 $940,000 $3,362,000Boats, Airboat, Etc Expansion $47,000 $60,000 $107,000Radios, Radio Equip, Etc Replacement $342,000 $178,000 $200,000 $182,000 $71,000 $973,000Radios, Radio Equip, Etc Expansion $32,000 $32,000Computers, Laptops, In-Car Replacement $217,000 $255,000 $389,000 $249,000 $322,000 $1,432,000Cameras, Radar, etc Expansion $51,000 $49,000 $310,000 $101,000 $286,000 $797,000Communications Systems Replacement $951,927 $278,059 $1,229,986HVAC Generator Expansion $195,750 $195,750Subtotal, General Fund $1,414,000 $986,000 $1,537,000 $2,098,927 $1,897,059 $195,750 $8,128,736
Total Capital Expenditures $1,546,486 $998,778 $1,584,051 $3,136,433 $2,175,382 $195,750 $9,636,880Total Capacity Expenditures $230,486 $49,000 $310,000 $193,000 $286,000 $195,750 $1,264,236Capacity Expenditures with General Fund $98,000 $49,000 $310,000 $193,000 $286,000 $195,750 $1,131,750Gen. Fund % of Capacity Expenditures 42.52% 100.00% 100.00% 100.00% 100.00% 100.00% 89.52%

Impact Fee Update Technical Memorandum #3 (Final) Indian River County, Florida April 30, 2007 79
Table 84. Law Enforcement Annual Credit per Functional Population
Source: Non-impact fee capacity expenditures from Table 83; unincorporated area functional population from Table 128 (years prior to 2006/07 interpolated).
Another component of the credit accounts for past payments of property taxes from vacant land. Here, the share of total vacant land (residential, commercial and industrial) to total taxable value is reviewed to develop the percentage of the vacant land value to the total unincorporated county taxable value. Table 85 indicates that the vacant land taxable value is 11.11% of total taxable value. This percentage is adjusted to account for the portion of ad valorem taxes used toward capital expansion expenditures. Based on historical expenditures, 89.52% of law enforcement capital expansion expenditures were funded with ad valorem tax revenues over the past six years. Applying this percentage to the vacant land value percentage results in an effective vacant land value percentage of 9.95%, which is used to give credit for past property taxes paid by property owners of vacant land.
Table 85. Law Enforcement Past Property Tax Percentage
Unincorporated County Vacant Land Value $1,728,524,390Unincorporated County Total Property Value $15,561,808,237Vacant Land Percentage of Total Property Value 11.11%General Fund Percent of Capacity Expenditures 89.52%Effective Vacant Land Value Percentage 9.95%
Source: Indian River County Property Appraiser, January 2007; general fund percent of capacity expenditures from Table 83.
The net present value of the annual revenue credit over the next 25 years is calculated in the following table. Reducing the cost per functional population by the future revenue credit and the past property tax credit leaves a law enforcement net cost of $234.08 per functional population, as shown in Table 86.
Fiscal Year
Non-ImpactFee CapacityExpenditures
FunctionalPopulation
Annual Expend./
Func. Pop.2001/02 $230,486 92,457 $2.492002/03 $49,000 94,779 $0.522003/04 $310,000 97,101 $3.192004/05 $193,000 99,423 $1.942005/06 $286,000 101,745 $2.812006/07 $195,750 104,067 $1.882007/08 $0 106,389 $0.002008/09 $0 108,711 $0.002009/10 $0 111,033 $0.002010/11 $0 113,355 $0.002011/12 $0 115,677 $0.00
Total/Average $1,264,236 1,144,737 $1.10
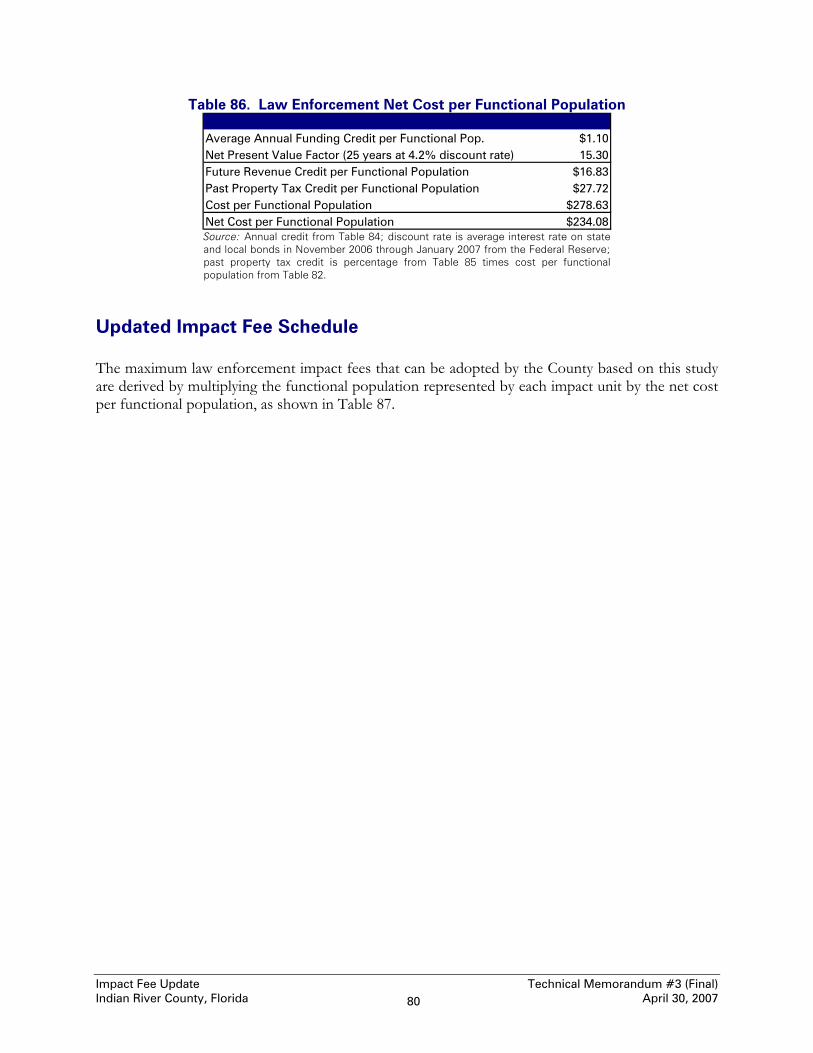
Impact Fee Update Technical Memorandum #3 (Final) Indian River County, Florida April 30, 2007 80
Table 86. Law Enforcement Net Cost per Functional Population
Average Annual Funding Credit per Functional Pop. $1.10Net Present Value Factor (25 years at 4.2% discount rate) 15.30Future Revenue Credit per Functional Population $16.83Past Property Tax Credit per Functional Population $27.72Cost per Functional Population $278.63Net Cost per Functional Population $234.08 Source: Annual credit from Table 84; discount rate is average interest rate on state and local bonds in November 2006 through January 2007 from the Federal Reserve; past property tax credit is percentage from Table 85 times cost per functional population from Table 82.
Updated Impact Fee Schedule The maximum law enforcement impact fees that can be adopted by the County based on this study are derived by multiplying the functional population represented by each impact unit by the net cost per functional population, as shown in Table 87.

Impact Fee Update Technical Memorandum #3 (Final) Indian River County, Florida April 30, 2007 81
Table 87. Updated Law Enforcement Impact Fee Schedule
Land UseImpact
Unit
Functional Population Coefficient
Net Cost/ Func. Pop.
NetCost/
UnitResidential Single-Family Less than 1,500 sf (under air) Dwelling 1.345 $234.08 $315 1,500 sf or more (under air) Dwelling 1.546 $234.08 $362 Multi-Family/Accessory Unit Dwelling 0.812 $234.08 $190 Mobile Home Dwelling 0.953 $234.08 $223Transient, Assisted, Group Hotel/Motel Room 0.908 $234.08 $213 Nursing Home/ACLF Bed 0.979 $234.08 $229Office and Financial Medical Office 1,000 sf 1.702 $234.08 $398 Bank/Savings Walk-in 1,000 sf 1.941 $234.08 $454 Bank/Savings Drive-in 1,000 sf 1.591 $234.08 $372 Office 50,000 sf or less 1,000 sf 1.401 $234.08 $328 Office greater than 50,000 sf 1,000 sf 0.741 $234.08 $173 Research & Development 1,000 sf 0.726 $234.08 $170Industrial Manufacturing 1,000 sf 0.501 $234.08 $117 Warehouse 1,000 sf 0.385 $234.08 $90 Mini-Warehouse 1,000 sf 0.076 $234.08 $18 General Industrial 1,000 sf 0.684 $234.08 $160 Concrete Plant Acre 1.508 $234.08 $353 Sand Mining Acre 0.193 $234.08 $45Retail Retail 50,000 sf or less 1,000 sf 2.862 $234.08 $670 Retail 50,001 to 100,000 sf 1,000 sf 2.854 $234.08 $668 Retail 100,001 to 200,000 sf 1,000 sf 2.920 $234.08 $684 Retail over 200,000 sf 1,000 sf 1.995 $234.08 $467 Gas/Service Station Fuel pos 1.723 $234.08 $403 New and Used Car Sales 1,000 sf 1.706 $234.08 $399 Restaurant 1,000 sf 7.333 $234.08 $1,717 Fast Food Rest w/ Drive-Thru 1,000 sf 7.902 $234.08 $1,850 Supermarket 1,000 sf 2.031 $234.08 $475 Self Service Car Wash Bays 1.887 $234.08 $442 Convenience Store 1,000 sf 4.243 $234.08 $993 Furniture Store 1,000 sf 0.318 $234.08 $74Recreational Golf Course hole 2.443 $234.08 $572 Racquet/Health Club/Dance 1,000 sf 2.374 $234.08 $556 County Park Acre 0.152 $234.08 $36 Tennis Court Court 2.321 $234.08 $543 Marina Berths 0.153 $234.08 $36Governmental Post Office 1,000 sf 1.773 $234.08 $415 Library 1,000 sf 1.718 $234.08 $402 Government Office Complex* 1,000 sf 1.356 $234.08 $317 Jail Bed 0.871 $234.08 $204

Impact Fee Update Technical Memorandum #3 (Final) Indian River County, Florida April 30, 2007 82
Updated Law Enforcement Impact Fee Schedule (continued)
Land UseImpact
Unit
Functional Population Coefficient
Net Cost/ Func. Pop.
NetCost/
UnitMiscellaneous Day Care Center 1,000 sf 1.009 $234.08 $236 Hospital 1,000 sf 1.566 $234.08 $366 Veterinary Clinic 1,000 sf 1.633 $234.08 $382 Church 1,000 sf 0.533 $234.08 $125 Movie Theater Screen 8.477 $234.08 $1,984 School (Elem. and Middle) Student 0.094 $234.08 $22 School (High) Student 0.120 $234.08 $28 School (College) Student 0.104 $234.08 $24 Fire Station 1,000 sf 0.633 $234.08 $148
* No fee for law enforcement buildings, which mitigate the need for law enforcement facilities. Source: Functional population coefficients from Table 125 and Table 126; net cost per functional population from Table 86.
The updated law enforcement impact fees are compared with current fees in Table 88. For administrative ease, the top two single-family size categories have been combined in this update, so that the same fee applies to all units 1,500 square feet or larger. For most land uses, the fees could go up by about 52 percent.

Impact Fee Update Technical Memorandum #3 (Final) Indian River County, Florida April 30, 2007 83
Table 88. Comparative Law Enforcement Impact Fees
Land UseImpact
UnitUpdated
FeeCurrent
FeePercentChange
Residential Single-Family Less than 1,500 sf (under air) Dwelling $315 $218 44% 1,500 to 2,499 sf (under air) Dwelling $362 $245 48% 2,500 sf or more (under air) Dwelling $362 $265 37% Multi-Family/Accessory Unit Dwelling $190 $148 28% Mobile Home Dwelling $223 $158 41%Transient, Assisted, Group Hotel/Motel Room $213 $140 52% Nursing Home/ACLF Bed $229 $151 52%Office and Financial Medical Office 1,000 sf $398 $262 52% Bank/Savings Walk-in 1,000 sf $454 $299 52% Bank/Savings Drive-in 1,000 sf $372 $245 52% Office 50,000 sf or less 1,000 sf $328 $216 52% Office greater than 50,000 sf 1,000 sf $173 $114 52% Research & Development 1,000 sf $170 NA NAIndustrial Manufacturing 1,000 sf $117 $77 52% Warehouse 1,000 sf $90 $59 53% Mini-Warehouse 1,000 sf $18 $12 50% General Industrial 1,000 sf $160 $105 52% Concrete Plant Acre $353 $232 52% Sand Mining Acre $45 $30 50%Retail Retail 50,000 sf or less 1,000 sf $670 $441 52% Retail 50,001 to 100,000 sf 1,000 sf $668 $439 52% Retail 100,001 to 200,000 sf 1,000 sf $684 $450 52% Retail over 200,000 sf 1,000 sf $467 $307 52% Gas/Service Station Fuel pos $403 $265 52% New and Used Car Sales 1,000 sf $399 $263 52% Restaurant 1,000 sf $1,717 $1,129 52% Fast Food Rest w/ Drive-Thru 1,000 sf $1,850 $1,217 52% Supermarket 1,000 sf $475 $313 52% Self Service Car Wash Bays $442 $291 52% Convenience Store 1,000 sf $993 $653 52% Furniture Store 1,000 sf $74 $49 51%Recreational Golf Course hole $572 $376 52% Racquet/Health Club/Dance 1,000 sf $556 $366 52% County Park Acre $36 $23 57% Tennis Court Court $543 $357 52% Marina Berths $36 $24 50%Governmental Post Office 1,000 sf $415 $273 52% Library 1,000 sf $402 $264 52% Government Office Complex 1,000 sf $317 $209 52% Jail Bed $204 $134 52%Miscellaneous Day Care Center 1,000 sf $236 $155 52% Hospital 1,000 sf $366 $241 52% Veterinary Clinic 1,000 sf $382 $251 52% Church 1,000 sf $125 $82 52% Movie Theater Screen $1,984 $1,305 52% School (Elem. and Middle) Student $22 $14 57% School (High) Student $28 $18 56% School (College) Student $24 $16 50% Fire Station 1,000 sf $148 $97 53% Source: Updated fees from Table 87.

Impact Fee Update Technical Memorandum #3 (Final) Indian River County, Florida April 30, 2007 84
Revenue Projections Based on the average annual amount of development experienced over the last six years, it is estimated that the updated law enforcement impact fees will generate about 47 percent more revenue than would be generated under the current fee schedule, as shown in Table 89.
Table 89. Law Enforcement Impact Fee Revenue Estimates Avg. Annual Percent
Land Use Type Impact Units Current Updated Current Updated ChangeSingle-Family 1,835 $245 $362 $450,000 $664,000 48%Multi-Family 346 $148 $190 $51,000 $66,000 29%Mobile Home 14 $158 $223 $2,000 $3,000 50%Nonresidential (1000 sf) 488.8 $307 $466 $150,000 $228,000 52%Total $653,000 $961,000 47%
Impact Fee Rates Impact Fee Revenues
Source: Average annual impact units from 2001 to 2006 building permit data (county-wide less Indian River Shores); impact fee rates from Table 88 (nonresidential fees are averages of all nonresidential land uses charged on a square footage basis).

Impact Fee Update Technical Memorandum #3 (Final) Indian River County, Florida April 30, 2007 85
CORRECTIONS Indian River County has one correctional facility, located at 4055 41st Avenue. This site has a total of 19.62 acres and is shared with the Sheriff’s Administration Building. The correctional facilities at this site include the first three phases of the correctional facility and two guardhouses. In 2003, the County purchased an additional 26.7 acres next to the existing correctional facility site to be used for a future jail expansion. The first phase of that expansion (Phase IV) is currently underway and anticipated to be completed this year. It will replace the Hobart Complex, which is being used temporarily to house prisoners until Phase VI is completed.
Current Level of Service The Sheriff’s Office performs a couple of other county-wide functions in addition to corrections. These include judicial process and multi-agency dispatch. In this update, facilities associated with those county-wide functions will be incorporated into the corrections fee. In some Florida counties, such a fee is referred to as a justice facilities impact fee. Because the Sheriff’s Office provides law enforcement services to the unincorporated area as well as county-wide functions and agency-wide support functions, it is necessary to allocate the building space and associated land between county-wide and unincorporated area. This analysis was presented in the Law Enforcement section. To recap, space in Sheriff’s Office buildings directly occupied by unincorporated area law enforcement patrol and county-wide functions are allocated to their respective areas. Two-thirds of the space occupied by agency-wide functions is allocated to the unincorporated area, reflecting the share of officers devoted to law enforcement patrol. The main Sheriff’s Office facility in Indian River County is the 19.62-acre site occupied by the Sheriff’s Administration Building and the Correctional Facility. The land is allocated between county-wide and unincorporated area functions based on the share of building square footage on the site devoted to them. In addition to the main complex, other Sheriff’s Office functions that are off-site include judicial process, which is housed in the County Courthouse, and the Aviation Unit, which is housed in the helicopter hangar. The current cost to replace existing correctional facilities is estimated based on the estimated cost per building square foot of the current Phase IV correctional facility expansion. The replacement cost of acreage attributable to corrections is estimated based on the average cost per acre of four-to-six acre non-agricultural parcels purchased in the county in 2006 (see Table 134 in Appendix E). These building and land replacement costs are summarized in Table 90.

Impact Fee Update Technical Memorandum #3 (Final) Indian River County, Florida April 30, 2007 86
Vehicles $424,110Telecommunications $284,671Vehicle Equipment $7,060Weapons $48,658Office Equipment $13,262Information Technology Equipment $87,452Audio Equipment $102,822Other Equipment $467,165Total Equipment Cost $1,435,200
Table 90. Corrections Building and Land Cost
Facility Description
Year Acquired/
Built Acres BuildingSq. Feet
Land Costs
Building Costs
Correctional Facility, Ph I, II, III* 1987-1991 64,759 $20,787,639Phase IV Expansion 2007 69,179 $22,187,436Sheriff's Office Admin Bldg (part) 1988 12,834 $4,119,714Road Crew Programs Building 1996 800 $256,800Guardhouse 1987 100 $32,100Guardhouse 1988 100 $32,100Share of Admin. Bldg/Jail Site 1983 13.48 $2,483,434Hammond Site for Jail Expansion 2003 25.90 $4,771,583Total 39.38 147,772 $7,255,017 $47,415,789 * excludes share of human resources/training facilities allocated to unincorporated area in Table 79 Source: IRC Sheriff's Office, January 18, 2007 transmittal and February 16, 2007 teleconference; share of square feet in Phase I-III, share of administrative building square feet and share of administrative building/jail site acres from Table 79; land cost based on $184,231/acre average sale price of 4 to 6-acre non-agricultural parcels sold in Indian River County in 2006 (see Table 134 in Appendix E).
In addition to land and buildings, a variety of vehicles and equipment is used for corrections. Current replacement costs for existing vehicles and equipment was not available. However, Sheriff’s Office staff reviewed fixed asset records to identify the original acquisition cost of existing vehicles and equipment utilized in support of the corrections function. These costs are summarized in Table 91.
Table 91. Corrections Vehicle and Equipment Cost
Source: IRC Sheriff’s Office, January 18, 2007.
The total capital cost represented by existing corrections facilities and equipment is the sum of building, land, vehicle and capital equipment costs. Given that the current expansion of correctional facilities is just being completed this year, basing the fees on the existing level of service would commit the County to maintaining what may be an unrealistically high level of service. In discussions with County staff, it was agreed that it would be more appropriate to base the fees on the average level of service that would be in place midway between expansion projects. The halfway point to the next major expansion may be approximately 2012. Consequently, the fees will be based on the ratio of current facility replacement costs to projected 2012 county-wide functional population, as shown in Table 92.

Impact Fee Update Technical Memorandum #3 (Final) Indian River County, Florida April 30, 2007 87
Table 92. Corrections Cost per Functional Population
Source: Building and land costs and building square feet from Table 90; vehicle and equipment cost from Table 91; 2012 county-wide functional population from Table 128.
Revenue Credits As noted in the introduction, impact fees should be reduced to account for future funding that will be generated by new development and used to remedy existing deficiencies or to retire outstanding debt of existing facilities that help provide the existing level of service to existing development. Since the updated fees are based on a level of service lower than the existing level of service, there are no deficiencies. In addition, Indian River County has no outstanding debt for the types of facilities covered in this report. For these reasons, no revenue credits are absolutely required. The previous study, however, took a more expansive view of revenue credits, providing for a past property tax credit as well as future revenue credit for all types of historical or planned funding used for capacity-expanding capital improvements. While the current consultant team does not agree that such credits are necessarily required, this draft will continue the approach to revenue credits followed in the previous study. An analysis of the historical and future corrections capital expenditures for the eleven-year period from FY 2001/02 to FY 2011/12 was completed in order to determine a typical amount of annual funding for capacity-expanding improvements. In the past, the County has relied primarily on the general fund and the optional sales tax for corrections capital improvements. Table 93 summarizes the capital expenditures over the last six fiscal years. This table also specifies whether the capital expenditure was a replacement or expansion of the existing corrections capital inventory.
Building Replacement Cost $47,415,789Land Replacement Cost $7,255,017Vehicle and Equipment Cost $1,435,200Total Capital Cost, Corrections $56,106,006County-Wide Functional Population, 2012 181,649Cost per Functional Population $308.87

Impact Fee Update Technical Memorandum #3 (Final) Indian River County, Florida April 30, 2007 88
Table 93. Historical Corrections Improvements, 2002-2007 Description Type 2001/02 2002/03 2003/04 2004/05 2005/06 2006/07 6-Yr TotalAutomobiles, Auto Equipment Expansion $19,000 $19,000Radios, Radio Equipment, etc. Expansion $10,000 $18,000 $28,000Computers, Surveillance, etc. Replacement $18,000 $63,000 $6,000 $8,000 $23,000 $118,000Computers, Surveillance, etc. Expansion $4,000 $19,000 $17,000 $40,000Misc. Jail/Kitchen Equip., etc. Replacement $34,689 $24,000 $6,000 $64,689Misc. Jail/Kitchen Equip., etc. Expansion $34,000 $62,000 $96,000Total General Fund $66,689 $121,000 $44,000 $8,000 $126,000 $0 $365,689
IRC Jail Retrofit Phase I Replacement $36,785 $36,785IRC Jail Re-roof Phase I Replacement $9,445 $185,401 $194,846IRC Jail Phase II & III Roof Replacement $6,206 $691,040 $37,442 $734,688IRC Jail Expansion Expansion $170,934 $7,568,231 $9,498,904 $17,238,069IRC Jail Expansion-Land Expansion $3,500 $989,741 $85,034 $1,078,275IRC Jail Intercom Replacement $134,145 $134,145IRC Jail Showers Replacement $58,966 $58,966IRC Jail Fire Sprinklers Replacement $60,000 $60,000IRC Jail-Replace Bioler Replacement $25,905 $25,905IRC Jail Roof/AC Replacement Replacement $127,159 $127,159Total Optional Sales Tax $49,730 $1,368,253 $6,206 $861,974 $7,631,578 $9,771,097 $19,688,838
IRC Jail Expansion Expansion $3,351,096 $3,351,096Subtotal, Impact Fees $3,351,096 $3,351,096
Video Visitation Expansion $800,000 $800,000Subtotal, Inmate Welfare Fund $800,000 $800,000
Total Capital Improvements $116,419 $1,489,253 $50,206 $869,974 $7,757,578 $10,571,097 $20,854,527Total Capacity Improvements $17,500 $1,023,741 $38,000 $170,934 $7,665,231 $13,735,034 $22,650,440Capacity Expenditures with Non-Impact Fees $17,500 $1,023,741 $38,000 $170,934 $7,665,231 $10,383,938 $19,299,344Capacity Expenditures with General Fund $14,000 $34,000 $38,000 $0 $97,000 $0 $183,000Percent Capacity with Gen. Fund 80.00% 3.32% 100.00% 0.00% 1.27% 0.00% 0.81%Source: IRC Office of Management and Budget, January 22, 2007 (FY 2006/07 amounts are budgeted, not actual).
The County does not currently have any planned corrections improvements listed in the Capital Improvements Element. The credit per functional population was calculated using the average capital expansion expenditures during the last six years and the future planned projects budgeted during the next five years. The average annual capital expenditure amount was divided by the average functional population during this eleven-year time period, resulting in an average capital expansion contribution of $10.74 per functional resident. This information is presented in Table 94.

Impact Fee Update Technical Memorandum #3 (Final) Indian River County, Florida April 30, 2007 89
Table 94. Corrections Annual Credit per Functional Population
Fiscal Year
Non-ImpactFee CapacityExpenditures
FunctionalPopulation
Annual Expend./
Func. Pop.2001/02 $17,500 145,189 $0.122002/03 $1,023,741 148,835 $6.882003/04 $38,000 152,481 $0.252004/05 $170,934 156,127 $1.092005/06 $7,665,231 159,773 $47.982006/07 $10,383,938 163,419 $63.542007/08 $0 167,065 $0.002008/09 $0 170,711 $0.002009/10 $0 174,357 $0.002010/11 $0 178,003 $0.002011/12 $0 181,649 $0.00
Total/Average $19,299,344 1,797,609 $10.74 Source: Non-impact fee capacity expenditures from Table 93; county-wide functional population from Table 128 (years prior to 2006/07 interpolated).
Another component of the credit accounts for past payments of property taxes from vacant land. Here, the share of total vacant land (residential, commercial and industrial) to total taxable value is reviewed to develop the percentage of the vacant land value to the total county-wide taxable value. Table 95 indicates that the vacant land taxable value is 9.51% of total taxable value county-wide. This percentage is adjusted to account for the portion of ad valorem taxes used toward capital expansion expenditures. Based on historical expenditures, 0.81% of corrections capital expansion expenditures were funded with ad valorem tax revenues over the past six years. Applying this percentage to the vacant land value percentage results in an effective vacant land value percentage of 0.08%, which is used to give credit for past property taxes paid by property owners of vacant land.
Table 95. Corrections Past Property Tax Percentage
County-Wide Vacant Land Value $2,419,297,960County-Wide Total Property Value $25,440,066,977Vacant Land Percentage of Total Property Value 9.51%General Fund Percent of Capacity Expenditures 0.81%Effective Vacant Land Value Percentage 0.08% Source: Indian River County Property Appraiser, January 2007; general fund percent of capacity expenditures from Table 93.
The net present value of the annual revenue credit over the next 25 years is calculated in the following table. Reducing the cost per functional population by the revenue credit leaves a corrections net cost of $144.30 per functional population, as shown in Table 96.

Impact Fee Update Technical Memorandum #3 (Final) Indian River County, Florida April 30, 2007 90
Table 96. Corrections Net Cost per Functional Population
Average Annual Funding Credit per Functional Pop. $10.74Net Present Value Factor (25 years at 4.2% discount rate) 15.30Future Revenue Credit per Functional Population $164.32Past Property Tax Credit per Functional Population $0.25Cost per Functional Population $308.87Net Cost per Functional Population $144.30 Source: Annual credit from Table 94; discount rate is average interest rate on state and local bonds in November 2006 through January 2007 from the Federal Reserve; past property tax credit is percentage from Table 95 times cost per functional population from Table 92.
Updated Impact Fee Schedule The maximum corrections impact fees that can be adopted by the County based on this study are derived by multiplying the functional population represented by each impact unit by the net cost per functional population, as shown in Table 97.
Table 97. Updated Corrections Impact Fee Schedule
Land UseImpact
Unit
Functional Population Coefficient
Net Cost/ Func. Pop.
NetCost/
UnitResidential Single-Family Less than 1,500 sf (under air) Dwelling 1.345 $144.30 $194 1,500 sf or more (under air) Dwelling 1.546 $144.30 $223 Multi-Family/Accessory Unit Dwelling 0.812 $144.30 $117 Mobile Home Dwelling 0.953 $144.30 $138Transient, Assisted, Group Hotel/Motel Room 0.908 $144.30 $131 Nursing Home/ACLF Bed 0.979 $144.30 $141Office and Financial Medical Office 1,000 sf 1.702 $144.30 $246 Bank/Savings Walk-in 1,000 sf 1.941 $144.30 $280 Bank/Savings Drive-in 1,000 sf 1.591 $144.30 $230 Office 50,000 sf or less 1,000 sf 1.401 $144.30 $202 Office greater than 50,000 sf 1,000 sf 0.741 $144.30 $107 Research & Development 1,000 sf 0.726 $144.30 $105Industrial Manufacturing 1,000 sf 0.501 $144.30 $72 Warehouse 1,000 sf 0.385 $144.30 $56 Mini-Warehouse 1,000 sf 0.076 $144.30 $11 General Industrial 1,000 sf 0.684 $144.30 $99 Concrete Plant Acre 1.508 $144.30 $218 Sand Mining Acre 0.193 $144.30 $28
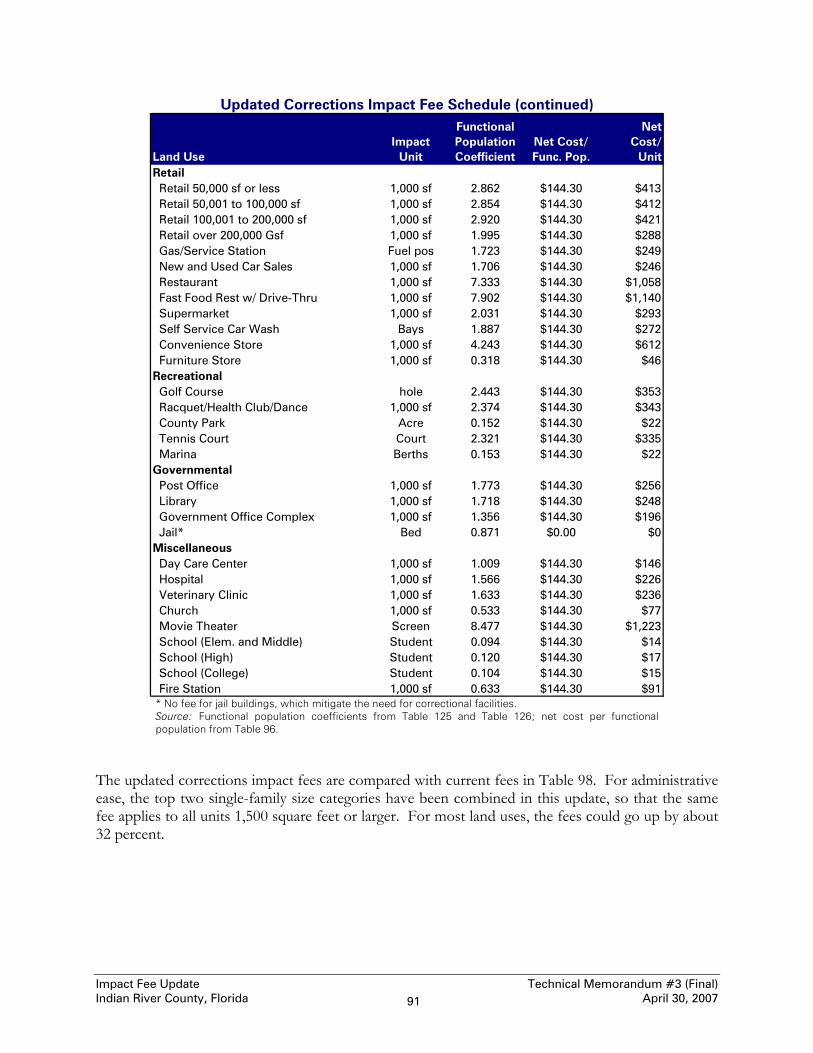
Impact Fee Update Technical Memorandum #3 (Final) Indian River County, Florida April 30, 2007 91
Updated Corrections Impact Fee Schedule (continued)
Land UseImpact
Unit
Functional Population Coefficient
Net Cost/ Func. Pop.
NetCost/
UnitRetail Retail 50,000 sf or less 1,000 sf 2.862 $144.30 $413 Retail 50,001 to 100,000 sf 1,000 sf 2.854 $144.30 $412 Retail 100,001 to 200,000 sf 1,000 sf 2.920 $144.30 $421 Retail over 200,000 Gsf 1,000 sf 1.995 $144.30 $288 Gas/Service Station Fuel pos 1.723 $144.30 $249 New and Used Car Sales 1,000 sf 1.706 $144.30 $246 Restaurant 1,000 sf 7.333 $144.30 $1,058 Fast Food Rest w/ Drive-Thru 1,000 sf 7.902 $144.30 $1,140 Supermarket 1,000 sf 2.031 $144.30 $293 Self Service Car Wash Bays 1.887 $144.30 $272 Convenience Store 1,000 sf 4.243 $144.30 $612 Furniture Store 1,000 sf 0.318 $144.30 $46Recreational Golf Course hole 2.443 $144.30 $353 Racquet/Health Club/Dance 1,000 sf 2.374 $144.30 $343 County Park Acre 0.152 $144.30 $22 Tennis Court Court 2.321 $144.30 $335 Marina Berths 0.153 $144.30 $22Governmental Post Office 1,000 sf 1.773 $144.30 $256 Library 1,000 sf 1.718 $144.30 $248 Government Office Complex 1,000 sf 1.356 $144.30 $196 Jail* Bed 0.871 $0.00 $0Miscellaneous Day Care Center 1,000 sf 1.009 $144.30 $146 Hospital 1,000 sf 1.566 $144.30 $226 Veterinary Clinic 1,000 sf 1.633 $144.30 $236 Church 1,000 sf 0.533 $144.30 $77 Movie Theater Screen 8.477 $144.30 $1,223 School (Elem. and Middle) Student 0.094 $144.30 $14 School (High) Student 0.120 $144.30 $17 School (College) Student 0.104 $144.30 $15 Fire Station 1,000 sf 0.633 $144.30 $91 * No fee for jail buildings, which mitigate the need for correctional facilities. Source: Functional population coefficients from Table 125 and Table 126; net cost per functional population from Table 96.
The updated corrections impact fees are compared with current fees in Table 98. For administrative ease, the top two single-family size categories have been combined in this update, so that the same fee applies to all units 1,500 square feet or larger. For most land uses, the fees could go up by about 32 percent.

Impact Fee Update Technical Memorandum #3 (Final) Indian River County, Florida April 30, 2007 92
Table 98. Comparative Corrections Impact Fees
Land UseImpact
UnitUpdated
FeeCurrent
FeePercentChange
Residential Single-Family Less than 1,500 sf (under air) Dwelling $194 $151 28% 1,500 to 2,499 sf (under air) Dwelling $223 $170 31% 2,500 sf or more (under air) Dwelling $223 $184 21% Multi-Family/Accessory Unit Dwelling $117 $100 17% Mobile Home Dwelling $138 $123 12%Transient, Assisted, Group Hotel/Motel Room $131 $99 32% Nursing Home/ACLF Bed $141 $107 32%Office and Financial Medical Office 1,000 sf $246 $186 32% Bank/Savings Walk-in 1,000 sf $280 $212 32% Bank/Savings Drive-in 1,000 sf $230 $174 32% Office 50,000 sf or less 1,000 sf $202 $153 32% Office greater than 50,000 sf 1,000 sf $107 $81 32% Research & Development 1,000 sf $105 NA NAIndustrial Manufacturing 1,000 sf $72 $55 31% Warehouse 1,000 sf $56 $42 33% Mini-Warehouse 1,000 sf $11 $8 38% General Industrial 1,000 sf $99 $75 32% Concrete Plant Acre $218 $165 32% Sand Mining Acre $28 $21 33%Retail Retail 50,000 sf or less 1,000 sf $413 $312 32% Retail 50,001 to 100,000 sf 1,000 sf $412 $312 32% Retail 100,001 to 200,000 sf 1,000 sf $421 $319 32% Retail over 200,000 sf 1,000 sf $288 $218 32% Gas/Service Station Fuel pos $249 $188 32% New and Used Car Sales 1,000 sf $246 $186 32% Restaurant 1,000 sf $1,058 $801 32% Fast Food Rest w/ Drive-Thru 1,000 sf $1,140 $863 32% Supermarket 1,000 sf $293 $222 32% Self Service Car Wash Bays $272 $206 32% Convenience Store 1,000 sf $612 $463 32% Furniture Store 1,000 sf $46 $35 31%Recreational Golf Course hole $353 $267 32% Racquet/Health Club/Dance 1,000 sf $343 $259 32% County Park Acre $22 $17 29% Tennis Court Court $335 $253 32% Marina Berths $22 $17 29%Governmental Post Office 1,000 sf $256 $194 32% Library 1,000 sf $248 $188 32% Government Office Complex 1,000 sf $196 $148 32% Jail Bed $0 $0 NAMiscellaneous Day Care Center 1,000 sf $146 $110 33% Hospital 1,000 sf $226 $171 32% Veterinary Clinic 1,000 sf $236 $178 33% Church 1,000 sf $77 $58 33% Movie Theater Screen $1,223 $925 32% School (Elem. and Middle) Student $14 $10 40% School (High) Student $17 $13 31% School (College) Student $15 $11 36% Fire Station 1,000 sf $91 $69 32% Source: Updated fees from Table 97.

Impact Fee Update Technical Memorandum #3 (Final) Indian River County, Florida April 30, 2007 93
Revenue Projections Based on the average annual amount of development experienced over the last six years, it is estimated that the updated corrections impact fees will generate about 30 percent more revenue than would be generated under the current fee schedule, as shown in Table 99.
Table 99. Corrections Impact Fee Revenue Estimates Avg. Annual Percent
Land Use Type Impact Units Current Updated Current Updated ChangeSingle-Family 2,384 $170 $223 $405,000 $532,000 31%Multi-Family 476 $100 $117 $48,000 $56,000 17%Mobile Home 57 $123 $138 $7,000 $8,000 14%Nonresidential (1000 sf) 782.4 $218 $288 $171,000 $225,000 32%Total $631,000 $821,000 30%
Impact Fee Rates Impact Fee Revenues
Source: Average annual impact units from 2001 to 2006 county-wide building permit data; impact fee rates from Table 98 (nonresidential fees are averages of all nonresidential land uses charged on a square footage basis).
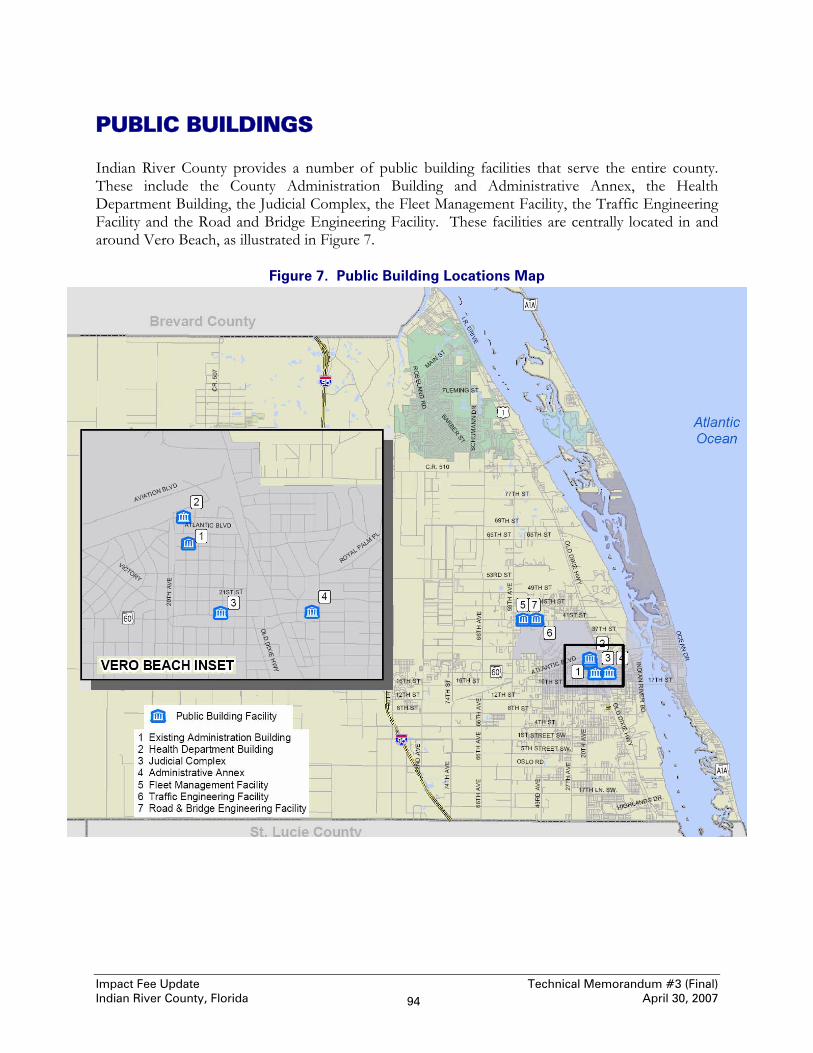
Impact Fee Update Technical Memorandum #3 (Final) Indian River County, Florida April 30, 2007 94
PUBLIC BUILDINGS Indian River County provides a number of public building facilities that serve the entire county. These include the County Administration Building and Administrative Annex, the Health Department Building, the Judicial Complex, the Fleet Management Facility, the Traffic Engineering Facility and the Road and Bridge Engineering Facility. These facilities are centrally located in and around Vero Beach, as illustrated in Figure 7.
Figure 7. Public Building Locations Map

Impact Fee Update Technical Memorandum #3 (Final) Indian River County, Florida April 30, 2007 95
Current Level of Service The inventory and replacement values of existing County-owned and occupied buildings that are currently providing public services are summarized in Table 100. In addition to the facilities included in the table, the County also owns 67,200 square feet of building space that is not included because these facilities, or portions thereof, are leased to various organizations that do not provide County services. The leased-out facilities are either not properly structured or not properly located for providing County services. In addition, the County occupies another 9,107 square feet that it does not own, and these leased facilities, which house the Tax Collector and the North County Offices, are not included. Nor are enterprise fund facilities, such as the Utilities Complex, included. Finally, no facilities that are included in any other type of impact fee are included in the public buildings fee calculations.
Table 100. Public Buildings Facility and Land Cost
FacilityBuildingSq. Feet
BuildingValue Acres
LandValue
New County Administration Building* 173,396 $39,158,019 16.61 $3,060,077Health Department Building 37,250 $8,412,168 3.17 $584,012Judicial Complex** 116,007 $26,197,861 2.17 $399,781Administration Annex 8,400 $1,896,972 0.81 $149,227Fleet Management Facility*** 15,400 $3,477,782 5.09 $937,736Road & Bridge/Traffic Facilities 18,350 $4,143,981 11.16 $2,056,018New Emergency Operations Center* 15,988 $3,610,570 10.81 $1,991,53743rd Avenue Sub-Complex 31,186 $7,042,734 4.15 $764,559Total 415,977 $93,940,087 53.97 $9,942,947
* scheduled to be completed early summer 2007 ** excludes square feet occupied by the Law Library *** portions occupied by County Source: IRC General Services Department, January 22, 2007; building value based on cost per square foot of $225.83, which is the weighted average cost per square foot of actual and projected expenses associated with ongoing construction of the New County Administration Building ($231.87/s.f.), the 43rd Avenue Sub-complex buildings ($124.42) and the New County Emergency Operations Center ($358.22), including site work, design, furniture, fixture and equipment (FF&E), architectural and engineering costs and fee and permit expenses; land cost based on $184,231/acre average sale price of 4 to 6-acre non-agricultural parcels sold in Indian River County in 2006 (see Table 134 in Appendix E).
The total capital cost represented by existing public buildings is the sum of building and land costs. Given that the new County administration building and Emergency Operations Center are just being completed this year, basing the fees on the existing level of service would commit the County to maintaining what may be an unrealistically high level of service. In discussions with County staff, it was agreed that it would be more appropriate to base the fees on the average level of service that would be in place midway between expansion projects. It is likely that it may be 2020 before the next major expansion project. The halfway point to the next major expansion, then, would be approximately 2014. Consequently, the fees will be based on the ratio of current facility replacement costs to projected 2014 county-wide functional population. Dividing the total replacement cost by projected county-wide service units in 2014 results in the capital cost per functional population, shown in Table 101.

Impact Fee Update Technical Memorandum #3 (Final) Indian River County, Florida April 30, 2007 96
Table 101. Public Buildings Cost per Functional Population
Source: Building and land costs and building square feet from Table 100; 2014 county-wide functional population from Table 128 in Appendix B.
Revenue Credits As noted in the introduction, impact fees should be reduced to account for future funding that will be generated by new development and used to remedy existing deficiencies or to retire outstanding debt of existing facilities that help provide the existing level of service to existing development. Since the updated fees are based on the existing levels of service, there are no deficiencies. In addition, Indian River County has no outstanding debt for the types of facilities covered in this report. For these reasons, no revenue credits are absolutely required. The previous study, however, took a more expansive view of revenue credits, providing for a past property tax credit as well as future revenue credit for all types of historical or planned funding used for capacity-expanding capital improvements. While the current consultant team does not agree that such credits are necessarily required, this draft will continue the approach to revenue credits followed in the previous study. An analysis of the historical and future public buildings capital expenditures for the eleven-year period from FY 2001/02 to FY 2011/12 was completed in order to determine a typical amount of annual funding for capacity-expanding improvements. In the past, the County has relied primarily on the general fund and the optional sales tax for public buildings capital improvements. Table 102 summarizes the capital expenditures over the last six fiscal years. This table also specifies whether the capital expenditure was a replacement or expansion of the existing public buildings capital inventory.
Building Replacement Cost $93,940,087Land Replacement Cost $9,942,947Total Capital Cost $103,883,034County-Wide Functional Population, 2014 188,941Cost per Functional Population $549.82

Impact Fee Update Technical Memorandum #3 (Final) Indian River County, Florida April 30, 2007 97
Table 102. Historical Public Buildings Improvements, 2002-2007
Description Type 2001/02 2002/03 2003/04 2004/05 2005/06 2006/07 6-Yr TotalNew County Admin. Building* Expansion $2,142,096 $2,142,096New County Admin. Building* Replacement $1,842,457 $1,842,457Health Department Roof Replacement $74,867 $9,830 $84,696Courthouse Washing/Painting Replacement $25,000 $25,000Tax Collector Air Conditioning Replacement $14,613 $14,613Courthouse Record Shelving Replacement $49,500 $49,500Daisy Hope Ctr-water connect Expansion $14,240 $14,240Courthouse X-Ray Machine Replacement $22,427 $22,427Subtotal, General Fund $138,980 $34,830 $0 $0 $36,667 $3,984,553 $4,195,029
New County Admin. Building* Expansion $20,536,970 $20,536,970New County Admin. Building* Replacement $17,664,239 $17,664,239Emergency Operations Ctr** Expansion $4,326,402 $4,326,402Fiber Optic Expansion $15,719 $180,911 $16,695 $102,786 $200,000 $516,110Fleet Management Facility Replacement $36,567 $3,274,855 $3,311,422Financial Software Replacement $530,099 $154,458 $684,557Health Dept Dental Clinic Expansion $358,569 $358,569New County Admin Building Replacement $7,422 $179,358 $185,413 $372,193Misc. Land Purchases Expansion $914,966 $914,966Misc. Building Alterations Replacement $58,426 $21,340 $60,166 $26,136 $180,752 $346,820Courthouse Security Upgrade Expansion $140,000 $140,000Other Machinery & Equipment Expansion $2,871 $50,453 $38,225 $50,392 $141,941Health Department Reroof Replacement $10,000 $10,000IRC Health Dept. Fire Alarms Replacement $25,000 $25,000Courthouse Cameras & Vent Replacement $17,367 $17,367Health Dept. HVAC Replacement $555,000 $555,000School Board Reroof Replacement $139,809 $139,809Subtotal, Optional Sales Tax & Other $1,006,802 $4,728,759 $296,032 $81,056 $102,786 $43,845,931 $50,061,366
New County Admin. Bldg Expansion $2,133,065 $2,133,065Emergency Operations Ctr Expansion $1,599,798 $1,599,798Subtotal, Impact Fees $0 $0 $0 $0 $0 $3,732,863 $3,732,863
Total Capital Improvements $1,145,782 $4,763,588 $296,032 $81,056 $139,453 $51,563,347 $57,989,258Total Capacity Improvements $374,288 $1,098,748 $50,453 $54,920 $117,026 $31,128,723 $32,824,158Non-Impact Fee Capacity Expenditures $374,288 $1,098,748 $50,453 $54,920 $117,026 $27,395,860 $29,091,295Capacity Expenditures with General Fund $0 $0 $0 $0 $14,240 $2,142,096 $2,156,336Percent Capacity with Gen. Fund 0.00% 0.00% 0.00% 0.00% 12.17% 6.88% 6.57%
* replacement percentage based on relative size of old versus new building (76,304 sf/173,396 sf = 44.01%), after deducting impact fee revenues, non-impact fee replacement share is 46.24% ** includes $2.5 million in State funding Source: IRC Office of Management and Budget, January 22, 2007 (FY 2006/07 amounts are budgeted, not actual).
The County does not currently have any planned public building improvements listed in the Capital Improvements Element. The credit per functional population was calculated using the average capital expansion expenditures during the last six years and the future planned projects budgeted during the next five-years. The average annual capital expenditure amount was divided by the average functional population during this eleven-year time period, resulting in an average capital expansion contribution of $16.18 per functional resident. This information is presented in Table 103.

Impact Fee Update Technical Memorandum #3 (Final) Indian River County, Florida April 30, 2007 98
Table 103. Public Buildings Annual Credit per Functional Population
Fiscal Year
Non-Impact Fee Capacity
ExpendituresFunctional Population
Annual Expend./
Func. Pop.2001/02 $374,288 145,189 $2.582002/03 $1,098,748 148,835 $7.382003/04 $50,453 152,481 $0.332004/05 $54,920 156,127 $0.352005/06 $117,026 159,773 $0.732006/07 $27,395,860 163,419 $167.642007/08 $0 167,065 $0.002008/09 $0 170,711 $0.002009/10 $0 174,357 $0.002010/11 $0 178,003 $0.002011/12 $0 181,649 $0.00
Total/Average $29,091,295 1,797,609 $16.18 Source: Non-impact fee capacity expenditures from Table 102; county-wide functional population from Table 128 (years prior to 2006/07 interpolated).
Another component of the credit accounts for past payments of property taxes from vacant land. Here, the share of total vacant land (residential, commercial and industrial) to total taxable value is reviewed to develop the percentage of the vacant land value to the total county-wide taxable value. Table 104 indicates that the vacant land taxable value is 9.51% of total taxable value county-wide. This percentage is adjusted to account for the portion of ad valorem taxes used toward capital expansion expenditures. Based on historical expenditures, 6.57% of public buildings capital expansion expenditures were funded with ad valorem tax revenues over the past six years. Applying this percentage to the vacant land value percentage results in an effective vacant land value percentage of 0.62%, which is used to give credit for past property taxes paid by property owners of vacant land.
Table 104. Public Buildings Past Property Tax Percentage
County-Wide Vacant Land Value $2,419,297,960County-Wide Total Property Value $25,440,066,977Vacant Land Percentage of Total Property Value 9.51%General Fund Percent of Capacity Expenditures 6.57%Effective Vacant Land Value Percentage 0.62% Source: Indian River County Property Appraiser, January 2007; general fund percent of capacity expenditures from Table 102.
The net present value of the annual revenue credit over the next 25 years is calculated in the following table. Reducing the cost per functional population by the revenue credit leaves a public buildings net cost of $302.26 per functional population, as shown in Table 105.

Impact Fee Update Technical Memorandum #3 (Final) Indian River County, Florida April 30, 2007 99
Table 105. Public Buildings Net Cost per Functional Population
Average Annual Funding Credit per Functional Pop. $16.18Net Present Value Factor (25 years at 4.2% discount rate) 15.30Future Revenue Credit per Functional Population $247.55Past Property Tax Credit per Functional Population $0.01Cost per Functional Population $549.82Net Cost per Functional Population $302.26 Source: Annual credit from Table 103; discount rate is average interest rate on state and local bonds in November 2006 through January 2007 from the Federal Reserve; past property tax credit is percentage from Table 104 times cost per functional population from Table 101.
Updated Impact Fee Schedule The maximum public buildings impact fees that can be adopted by the County based on this study are derived by multiplying the functional population represented by each impact unit by the net cost per functional population, as shown in Table 106.
Table 106. Updated Public Buildings Impact Fee Schedule
Land UseImpact
Unit
Functional Population Coefficient
Net Cost/ Func. Pop.
NetCost/
UnitResidential Single-Family Less than 1,500 sf (under air) Dwelling 1.345 $302.26 $407 1,500 sf or more (under air) Dwelling 1.546 $302.26 $467 Multi-Family/Accessory Unit Dwelling 0.812 $302.26 $245 Mobile Home Dwelling 0.953 $302.26 $288Transient, Assisted, Group Hotel/Motel Room 0.908 $302.26 $274 Nursing Home/ACLF Bed 0.979 $302.26 $296Office and Financial Medical Office 1,000 sf 1.702 $302.26 $514 Bank/Savings Walk-in 1,000 sf 1.941 $302.26 $587 Bank/Savings Drive-in 1,000 sf 1.591 $302.26 $481 Office 50,000 sf or less 1,000 sf 1.401 $302.26 $424 Office greater than 50,000 sf 1,000 sf 0.741 $302.26 $224 Research & Development 1,000 sf 0.726 $302.26 $220Industrial Manufacturing 1,000 sf 0.501 $302.26 $151 Warehouse 1,000 sf 0.385 $302.26 $116 Mini-Warehouse 1,000 sf 0.076 $302.26 $23 General Industrial 1,000 sf 0.684 $302.26 $207 Concrete Plant Acre 1.508 $302.26 $456 Sand Mining Acre 0.193 $302.26 $58

Impact Fee Update Technical Memorandum #3 (Final) Indian River County, Florida April 30, 2007 100
Updated Public Buildings Impact Fee Schedule (continued)
Land UseImpact
Unit
Functional Population Coefficient
Net Cost/ Func. Pop.
NetCost/
UnitRetail Retail 50,000 sf or less 1,000 sf 2.862 $302.26 $865 Retail 50,001 to 100,000 sf 1,000 sf 2.854 $302.26 $863 Retail 100,001 to 200,000 sf 1,000 sf 2.920 $302.26 $883 Retail over 200,000 sf 1,000 sf 1.995 $302.26 $603 Gas/Service Station Fuel pos 1.723 $302.26 $521 New and Used Car Sales 1,000 sf 1.706 $302.26 $516 Restaurant 1,000 sf 7.333 $302.26 $2,217 Fast Food Rest w/ Drive-Thru 1,000 sf 7.902 $302.26 $2,388 Supermarket 1,000 sf 2.031 $302.26 $614 Self Service Car Wash Bays 1.887 $302.26 $570 Convenience Store 1,000 sf 4.243 $302.26 $1,282 Furniture Store 1,000 sf 0.318 $302.26 $96Recreational Golf Course hole 2.443 $302.26 $738 Racquet/Health Club/Dance 1,000 sf 2.374 $302.26 $718 County Park Acre 0.152 $302.26 $46 Tennis Court Court 2.321 $302.26 $701 Marina Berths 0.153 $302.26 $46Governmental Post Office 1,000 sf 1.773 $302.26 $536 Library 1,000 sf 1.718 $302.26 $519 Government Office* 1,000 sf 1.356 $302.26 $410 Jail Bed 0.871 $302.26 $263Miscellaneous Day Care Center 1,000 sf 1.009 $302.26 $305 Hospital 1,000 sf 1.566 $302.26 $473 Veterinary Clinic 1,000 sf 1.633 $302.26 $494 Church 1,000 sf 0.533 $302.26 $161 Movie Theater Screen 8.477 $302.26 $2,562 School (Elem. and Middle) Student 0.094 $302.26 $28 School (High) Student 0.120 $302.26 $36 School (College) Student 0.104 $302.26 $32 Fire Station 1,000 sf 0.633 $302.26 $191
* No fee for government offices, which mitigate the need for public buildings facilities. Source: Functional population coefficients from Table 125 and Table 126; net cost per functional population from Table 105.
The updated public buildings impact fees are compared with current fees in Table 107. For administrative ease, the top two single-family size categories have been combined in this update, so that the same fee applies to all units 1,500 square feet or larger. For residential land uses, the fees more than double. For most nonresidential land uses, the fees decline by about one-fourth to one-half. The reason for the decline in nonresidential fees is due to the switch from the 11-hour-per-day functional population used in the previous study to the 24-hour-per-day functional population used in this update.

Impact Fee Update Technical Memorandum #3 (Final) Indian River County, Florida April 30, 2007 101
Table 107. Comparative Public Buildings Impact Fees
Land UseImpact
UnitUpdated
FeeCurrent
FeePercentChange
Residential Single-Family Less than 1,500 sf (under air) Dwelling $407 $183 122% 1,500 to 2,499 sf (under air) Dwelling $467 $206 127% 2,500 sf or more (under air) Dwelling $467 $223 109% Multi-Family/Accessory Unit Dwelling $245 $121 102% Mobile Home Dwelling $288 $149 93%Transient, Assisted, Group Hotel/Motel Room $274 $229 20% Nursing Home/ACLF Bed $296 $312 -5%Office and Financial Medical Office 1,000 sf $514 $1,275 -60% Bank/Savings Walk-in 1,000 sf $587 $1,454 -60% Bank/Savings Drive-in 1,000 sf $481 $1,191 -60% Office 50,000 sf or less 1,000 sf $424 $1,050 -60% Office greater than 50,000 sf 1,000 sf $224 $555 -60% Research & Development 1,000 sf $220 NA NAIndustrial Manufacturing 1,000 sf $151 $375 -60% Warehouse 1,000 sf $116 $288 -60% Mini-Warehouse 1,000 sf $23 $40 -43% General Industrial 1,000 sf $207 $512 -60% Concrete Plant Acre $456 $1,130 -60% Sand Mining Acre $58 $145 -60%Retail Retail 50,000 sf or less 1,000 sf $865 $1,531 -44% Retail 50,001 to 100,000 sf 1,000 sf $863 $1,527 -43% Retail 100,001 to 200,000 sf 1,000 sf $883 $1,562 -43% Retail over 200,000 sf 1,000 sf $603 $1,067 -43% Gas/Service Station Fuel pos $521 $921 -43% New and Used Car Sales 1,000 sf $516 $913 -43% Restaurant 1,000 sf $2,217 $3,923 -43% Fast Food Rest w/ Drive-Thru 1,000 sf $2,388 $4,227 -44% Supermarket 1,000 sf $614 $1,087 -44% Self Service Car Wash Bays $570 $1,009 -44% Convenience Store 1,000 sf $1,282 $2,270 -44% Furniture Store 1,000 sf $96 $170 -44%Recreational Golf Course hole $738 $1,307 -44% Racquet/Health Club/Dance 1,000 sf $718 $1,270 -43% County Park Acre $46 $81 -43% Tennis Court Court $701 $1,241 -44% Marina Berths $46 $82 -44%Governmental Post Office 1,000 sf $536 $1,107 -52% Library 1,000 sf $519 $919 -44% Government Office Complex 1,000 sf $410 $1,016 -60% Jail Bed $263 $466 -44%Miscellaneous Day Care Center 1,000 sf $305 $755 -60% Hospital 1,000 sf $473 $838 -44% Veterinary Clinic 1,000 sf $494 $1,223 -60% Church 1,000 sf $161 $285 -44% Movie Theater Screen $2,562 $4,535 -44% School (Elem. and Middle) Student $28 $70 -60% School (High) Student $36 $90 -60% School (College) Student $32 $78 -59% Fire Station 1,000 sf $191 $339 -44% Source: Updated fees from Table 106.
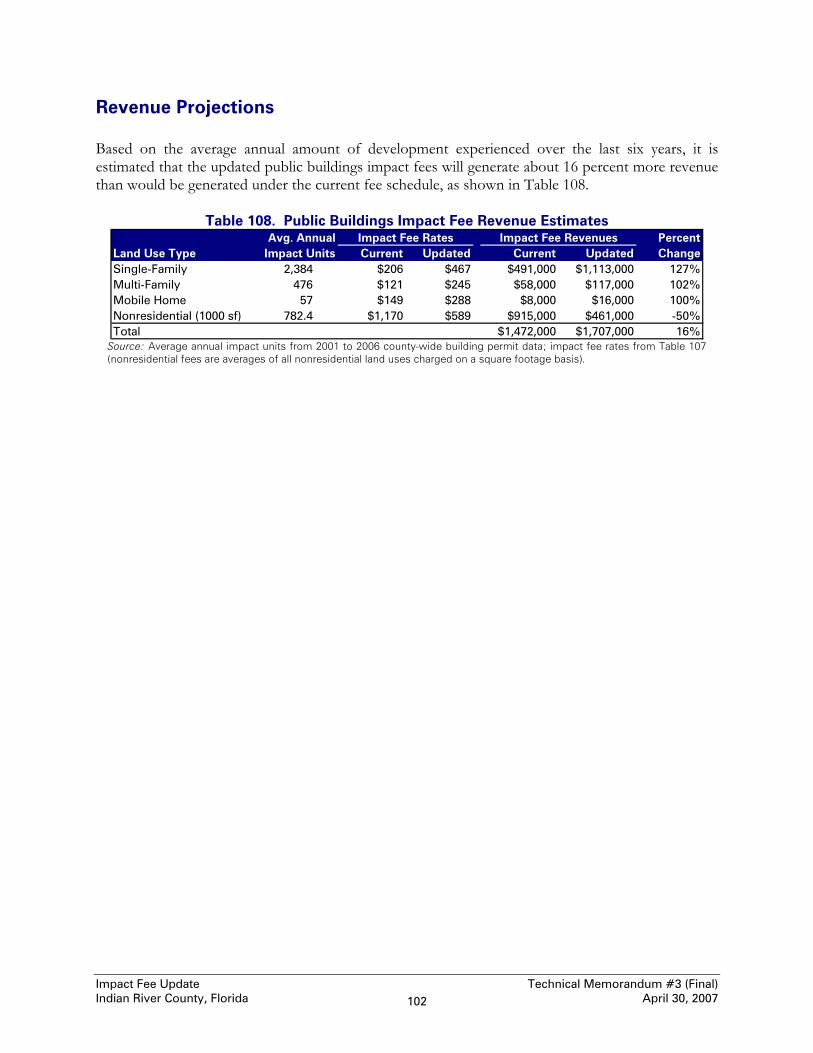
Impact Fee Update Technical Memorandum #3 (Final) Indian River County, Florida April 30, 2007 102
Revenue Projections Based on the average annual amount of development experienced over the last six years, it is estimated that the updated public buildings impact fees will generate about 16 percent more revenue than would be generated under the current fee schedule, as shown in Table 108.
Table 108. Public Buildings Impact Fee Revenue Estimates Avg. Annual Percent
Land Use Type Impact Units Current Updated Current Updated ChangeSingle-Family 2,384 $206 $467 $491,000 $1,113,000 127%Multi-Family 476 $121 $245 $58,000 $117,000 102%Mobile Home 57 $149 $288 $8,000 $16,000 100%Nonresidential (1000 sf) 782.4 $1,170 $589 $915,000 $461,000 -50%Total $1,472,000 $1,707,000 16%
Impact Fee Rates Impact Fee Revenues
Source: Average annual impact units from 2001 to 2006 county-wide building permit data; impact fee rates from Table 107 (nonresidential fees are averages of all nonresidential land uses charged on a square footage basis).

Impact Fee Update Technical Memorandum #3 (Final) Indian River County, Florida April 30, 2007 103
SOLID WASTE Indian River County provides solid waste disposal services to all residents and businesses in the county. These services are provided through a dependent special district, the Solid Waste Disposal District (SWDD). The physical assets of the SWDD include the landfill site located southeast of I-95 and Oslo Road and five Customer Convenience Centers (CCCs) located throughout the county, as illustrated in Figure 8.
Figure 8. Solid Waste Locations

Impact Fee Update Technical Memorandum #3 (Final) Indian River County, Florida April 30, 2007 104
The Solid Waste Disposal District is a self-supporting operation. Its revenues consist primarily of an annual non-ad valorem assessment on improved property throughout the county and tipping fees charged at the landfill for construction and demolition (C&D) and land clearing debris and tires. Since 2005, the County has also charged a solid waste impact fee on new development throughout the county that is used to fund some solid waste capital improvements. This section is intended to provide the basis for updating the solid waste impact fee. The SWDD does not provide solid waste collection services directly to homes and businesses. It does authorize private franchise operations that provide such services on a voluntary basis for a monthly fee. The franchise operators also provide recycling service to all residential improved properties, funded by the District’s non-ad valorem assessment. The franchise operators bring the solid waste and recycling materials to the landfill site, and are not charged a tipping fee. Residents who do not contract with the franchise operators for solid waste collection are responsible for bringing their solid waste to one of the five Customer Convenience Centers. Commercial solid waste is prohibited at the CCCs, although some is probably dropped off there. The District transports solid waste from the CCCs to the landfill. Residential and commercial recycling materials may be dropped off at the landfill. There are several distinct types of solid waste, including Class I (household garbage and similar), recyclable materials, hazardous materials, construction and demolition (C&D) debris, land clearing debris and yard waste. Of these, only Class I waste and C&D debris consume space in the landfill. The other types of waste are processed there and taken off-site for recycling, recovery or reuse. A tipping fee that nominally covers the cost of disposal is charged for C&D debris. That means that Class I waste is the only type of waste that consumes landfill capacity and is not paid for with a tipping fee.
Service Unit The updated impact fee schedule is based on the “Schedule of Waste Generation Units” (WGU) by land use type included in Chapter 3C: Solid Waste Sub-Element of the 2020 Comprehensive Plan. A WGU is defined as a basic unit of waste generation equivalent to 1.0 ton per year.
Table 109. Waste Generation Units by Land Use Type
Land UseImpact
UnitWGU Code
Waste Generation
UnitsResidential Single-Family Lower than 1,500 sf (under air) Dwelling 01 1.60 1,500 to 2,499 sf (under air) Dwelling 01 1.60 2,500 sf or greater (under air) Dwelling 01 1.60 Multi-Family/Accessory Unit Dwelling 08 1.20 Mobile Home Dwelling 02 1.60 Transient, Assisted, Group Hotel/Motel Room 39 0.45 Nursing Home/ACLF Bed 74 0.88

Impact Fee Update Technical Memorandum #3 (Final) Indian River County, Florida April 30, 2007 105
Land UseImpact
UnitWGU Code
Waste Generation
UnitsOffice and Financial Medical Office 1,000 sf 19 2.50 Bank/Savings Walk-in 1,000 sf 23 2.50 Bank/Savings Drive-in 1,000 sf 23 2.50 Office 50,000 GSF or less 1,000 sf 17 2.00 Office greater than 50,000 GSF 1,000 sf 17 2.00 Research & Development 1,000 sf 17 2.00Industrial Manufacturing 1,000 sf 42 5.00 Warehouse 1,000 sf 48.S 1.00 Mini-Warehouse 1,000 sf 48.C 0.40 General Industrial 1,000 sf 42 5.00 Concrete Plant Acre 47 4.00 Sand Mining Acre 47 4.00Retail, Gross Square Feet Retail 50,000 GSF or less 1,000 sf 16 5.00 Retail 50,001 to 100,000 GSF 1,000 sf 16 5.00 Retail 100,001 to 200,000 GSF 1,000 sf 16 5.00 Retail over 200,000 GSF 1,000 sf 16 5.00 Gas/Service Station Fuel pos 26 0.83 New and Used Car Sales 1,000 sf 27 2.50 Restaurant 1,000 sf 21 7.00 Fast Food Rest w/ Drive-Thru 1,000 sf 22 13.00 Supermarket 1,000 sf 14 9.00 Self Service Car Wash Bays 27.K 1.63 Convenience Store 1,000 sf 14 9.00 Furniture Store 1,000 sf 11 5.00Recreational Golf Course hole 38 0.80 Racquet/Health Club/Dance 1,000 sf 34 2.50 County Park Acre 82 1.80 Tennis Court Court 38 0.39 Marina Berths 20 0.96Governmental Post Office 1,000 sf 88 2.00 Library 1,000 sf 86 2.00 Government Office 1,000 sf 86 2.00 Jail Bed 86 0.33Miscellaneous Day Care Center 1,000 sf 25 5.00 Hospital 1,000 sf 85 1.76 Veterinary Clinic 1,000 sf 19 2.50 Church 1,000 sf 71.V 0.70 Movie Theater Screen 32 3.99 School (Elem. and Middle) Student 72 0.23 School (High) Student 72 0.26 School (College) Student 72 0.26 Fire Station 1,000 sf 86 2.00 Source: Indian River County, 2020 Comprehensive Plan, Solid Waste Sub-Element (impact unit conversions based on review of data for developments in Indian River County).

Impact Fee Update Technical Memorandum #3 (Final) Indian River County, Florida April 30, 2007 106
The total number of waste generation units in the county can be estimated by multiplying existing impact units by the WGU rate per impact unit identified in the Comprehensive Plan. The total number of WGUs are calculated in Table 110 below.
Table 110. Total Existing Waste Generation Units
Land UseImpact
Unit2007
UnitsWGUs/
Unit2007
WGUsSingle-Family Dwelling 51,451 1.60 82,322Multi-Family Dwelling 18,091 1.20 21,709Mobile Home Dwelling 7,232 1.60 11,571Subtotal, Residential 115,602
Commercial 1,000 sf 23,272 4.52 105,189Institutional/Misc. 1,000 sf 6,166 2.39 14,737Government 1,000 sf 5,178 2.00 10,356Total, County-Wide 245,884 Source: 2007 units from Table 127 in Appendix B; WGUs per unit from Table 109.
Current Level of Service The 2005 impact fee study based the solid waste impact fees on a level of service expressed in terms of tons per capita per year. All types of waste were included in determining the tonnage rate of 2.2 tons per capita per year. However, this kind of measure is really a demand generation rate, rather than a level of service. The relevant question, in terms of impact fee analysis, is what ratio of facilities to development has existing development paid for? New development can legitimately be asked to pay for that same level of service through impact fees. The Solid Waste Disposal District provides two types of infrastructure capacity. The convenience centers provide capacity to accommodate a flow of material. The portions of the landfill devoted to Class I and C&D disposal, on the other hand, provide the capacity to accommodate a finite volume of waste. These two types of capacity must be analyzed separately. The convenience centers are perhaps the clearest example of the County’s investment in infrastructure that provides throughput capacity. They serve only residential customers, and are supported by a non-ad valorem assessment on improved properties throughout the county. The centers are all at least 30 years old. With the exception of the 1.2-acre Fellsmere center, they are all located on the site of old closed landfills. The typical configuration is a raised oval access road that allows cars, pick-up trucks and trailers to be pulled up to a concrete tipping wall that is about three feet high to prevent falls. The grade is lower on the other side of the wall, where containers are located to receive the waste. At some of the centers, a grapple truck is used to transfer waste to a second row of containers during peak periods. The SWDD is in the process of replacing one of the existing convenience centers, for a total cost of about $2 million. In FY 2006, approximately 12.8 percent of the Class I waste stream was transferred through the Customer Convenience Centers.

Impact Fee Update Technical Memorandum #3 (Final) Indian River County, Florida April 30, 2007 107
The centers also accept yard waste and recyclable materials. The centers are at or close to capacity, and major improvements are being planned to increase their capacity. Some of the improvements are necessary to accommodate the switch from roll-off containers to larger walking-floor transfer trailers, which hold approximately 2.5 times the volume of a roll-off container. Other improvements involve lengthening the length of the tipping wall to accommodate additional containers or lengthening the access road to accommodate longer vehicle queues. The relevant level of service is the replacement cost of existing convenience center facilities and improvements to existing residential development in the county. The replacement cost of improvements at the five existing convenience centers is not available at this time. The cost of a current project to replace one of the existing centers is about $2 million. Until better cost estimates are available, one-fourth of this cost, or $500,000 per convenience center, will be used as an approximation of the replacement cost of existing improvements, including access roads, tipping walls, container pads, fencing and lighting. The total replacement cost of convenience center improvements and vehicles per residential Waste Generation Unit (WGU) is calculated in Table 111.
Table 111. Convenience Center Cost per Residential WGU Facility/Equipment Units Cost/Unit Total CostCustomer Convenience Center Improvements (each) 5 500,000 $2,500,000GMC 1-Ton sierra (Hazardous Waste) 1 $30,000 $30,000Roll-Off Container 8 $165,000 $1,320,000Ford 18-Foot Trash Dump 1 $180,000 $180,000Volvo Roll-Off Truck 1 $165,000 $165,0004x4 Pick-Up Truck 2 $30,000 $60,000Peterbilt Semi-Tractor 2 $110,000 $220,00053' Walking Floor Trailer 10 $53,000 $530,000Total Convenience Center Replacement Costs $5,005,000Current Residential Waste Generation Units (WGUs) 115,602Convenience Center Cost per WGU $43.30 Source: CCC improvement cost per center assumed; vehicle counts and replacement costs from Solid Waste Disposal District, March 12, 2007.
Recycling vehicles stationed at the landfill process recyclable materials dropped off at the convenience centers or directly at the landfill. While use of the convenience centers is restricted to residential customers and while free recycling pick-up is provided only for residential properties, nonresidential customers can drop off recyclable materials at the landfill. Consequently, the cost of recycling vehicles can be attributed to both residential and nonresidential development, as shown in Table 112.

Impact Fee Update Technical Memorandum #3 (Final) Indian River County, Florida April 30, 2007 108
Table 112. Recycling Cost per WGU
Vehicles Units Cost/Unit Total CostFord Explorer SUV 1 $32,000 $32,000Case 621C Wheel Loader 1 $200,000 $200,000Bobcat Loader 1 $30,000 $30,0003/4 Ton Pick-Up Truck 1 $30,000 $30,000Roll-Off Container 1 $165,000 $165,000Forklift 1 $27,000 $27,000Hydraulic Side-Shift Attachment 1 $6,000 $6,000Container Truck 1 $68,000 $68,000Skid Steer Loader 1 $35,000 $35,000Front End Loader 1 $200,000 $200,000Total, Recycling Department Vehicles $793,000Current Total Waste Generation Units (WGUs) 245,884Recycling Vehicle Cost per WGU $3.23 Source: Vehicle counts and replacement costs from Solid Waste Disposal District, March 12, 2007.
The landfill represents a different type of capacity, what might be called “consumable capacity.” The layout of the existing landfill site is illustrated in Figure 9. The consumable capacity consists of land that is designated for Class I or C&D waste disposal and has not reached maximum allowable height. The impact fee will be based on Class I capacity, since tipping fees charged for C&D debris should, at least in theory, cover the costs associated with C&D waste disposal. However, since the landfill contains both types of capacity, the total main landfill site must be analyzed. Class I disposal areas must be lined and must have a landfill gas emission system. Cells are constructed incrementally as they are needed. The major upfront investment is the acquisition of the land and heavy equipment. The analysis of landfill costs will be limited to the main 225-acre landfill site, since it is the only site that has been master planned. The District also owns 219 mostly-vacant acres north of the main site, 66 vacant acres south of the main site and 29 vacant acres west of I-95 that may eventually be used, in whole or in part, for Class I disposal. There is also a 37-acre C&D landfill located southeast of the main landfill site.

Impact Fee Update Technical Memorandum #3 (Final) Indian River County, Florida April 30, 2007 109
Figure 9. Layout of the Existing Landfill Site

Impact Fee Update Technical Memorandum #3 (Final) Indian River County, Florida April 30, 2007 110
The master-planned capacity (in cubic yards) of the primary 225-acre landfill site is summarized in Table 113.
Table 113. Landfill Acreage and Capacity Landfill Area Acres Capacity (CY) CY/AcreSegments 1 & 2 (used)* n/a 2,950,500 n/aSegments 1 & 2 (remaining) n/a 1,000,000 n/aSegments 1 & 2 (total) 59 3,950,500 n/aSegment 3A 22 2,400,000 n/aSegment 3B 22 2,400,000 n/aSegment 3/N C&D Infill n/a 2,300,000 n/aSegment 3/N C&D Infill n/a 1,300,000 n/aSubtotal, Class I 103 12,350,500 119,908
Cell 1 (used)* n/a 1,293,500 n/aCell 1/Segment 1 (remaining) n/a 600,000 n/aCell 2 (total) 22 1,893,500 n/aCell 2 33 3,500,000 n/aSubtotal, C&D 55 5,393,500 98,064
Total, Direct Landfill 158 17,744,000 112,304Stormwater Management 33 n/a n/aAdministrative/Support/Buffe 34 n/a n/aTotal 225 17,744,000 78,862
* estimate as of March 2006 based on aerial photography Source: Solid Waste Disposal District, November 2006.
The portion of the solid waste impact fee for the landfill will be in the nature of a recoupment fee, since the land and heavy equipment that constitute the upfront capital costs have already been incurred in anticipation of growth. In general, recoupment fees should be based on historical costs (adjusted to current dollars), rather than on replacement costs, because it is not necessary, at least in the short term, to acquire additional land or equipment. However, at this point, the available cost data are in terms of replacement costs. Until better information is available, one-fourth of replacement costs will be used as an approximation of historical costs. The cost of existing main landfill site and heavy equipment is summarized in Table 114 below.

Impact Fee Update Technical Memorandum #3 (Final) Indian River County, Florida April 30, 2007 111
Table 114. Landfill Land and Vehicle Cost Units Cost/Unit Total Cost
Main Landfill Site (acres) 225 $55,906 $12,578,850Utility Tractor w/Sweeper 1 $26,000 $26,000Grader 1 $163,000 $163,0004x4 Pick-Up Truck 1 $17,000 $17,000Disposal Tanker 3,000 Gallons 1 $6,000 $6,000Trailer 15 Foot 1 $2,500 $2,500Dump Truck 1 $90,000 $90,0001/2 Ton Pick-Up Truck 1 $20,000 $20,0001-Ton Flatbed Dump Truck 1 $30,000 $30,0003/4-Ton Diesel Pick-Up Truck 1 $23,000 $23,000Track-Type Excavator 1 $150,000 $150,000Offroad Dump Truck 1 $230,000 $230,000Commercial Mower 1 $8,000 $8,0003/4-Ton Pick-Up Truck 1 $23,000 $23,000Compactor 1 $650,000 $650,000Wastehandler Dozer 1 $560,000 $560,000Dump Trailer 2 $30,000 $60,000Lube Truck 1 $150,000 $150,000Loader 2 $200,000 $400,000Tractor 1 $28,000 $28,000Rotary Mower 1 $15,000 $15,0001-Ton Truck with Crane 1 $28,000 $28,000Track-Type Tractor 1 $140,000 $140,000Welder with Gun 1 $6,000 $6,000Track-Type Excavator 1 $240,000 $240,000Total Landfill Cost $15,644,350Landfill Acres 225Cost per Acre (Land and Vehicles) $69,530Historical Cost per Acre (assumed 1/4) $17,383
Source: Solid Waste Disposal District, March 12, 2007; land acquisition cost per acre is the average cost per acre for vacant land parcels of 40 to 160 acres sold in Indian River County in 2006; historical cost per acre assumed one-fourth of replacement cost.
The relevant level of service for impact fee purposes is the number of years that existing land can accommodate the projected waste stream from existing development. As shown in the following table, the current stream of Class I waste could be accommodated on the main landfill site for approximately 49 years if there was no additional growth. New development may reasonably be required to pay through impact fees the cost to provide the land needed to accommodate an equivalent number of years of the waste stream it will generate. In this way, new development would be placed on an equal footing with existing development, and would not be asked to pay for a higher level of service than existing development has already paid for. However, to be conservative, the landfill cost per service unit will be based on 29 years, which is the Class I disposal capacity of the main landfill site based on projected growth. In addition, given that additional land and equipment may not be needed for some years, this portion of the fee must be structured as a recoupment fee. Revenues from the recoupment fee could be put in the SWDD’s general fund and used to fund capital or operating costs. Multiplying the estimated historical cost of Class I capacity by the cubic yards of Class I waste expected to be generated by a new Waste Generation Unit (WGU) over the life expectancy of the present and

Impact Fee Update Technical Memorandum #3 (Final) Indian River County, Florida April 30, 2007 112
planned Class I disposal facilities yields the Class I recoupment cost per WGU, as shown in Table 115.
Table 115. Landfill Class I Recoupment Cost per WGU
Remaining Class I Capacity (Cubic Yards) 9,400,000Annual Class I Cubic Yards Generated 190,396Years of Capacity Remaining for Existing Dev't 49.37Years of Capacity for Existing and New Dev't 29
Est. Class I Cubic Yards Generated, 2007 190,396Estimated Waste Generation Units, 2007 245,884Annual Class I Cubic Yards per WGU 0.774
Existing LOS (Years of Class I Capacity) 29Annual Cubic Yards per WGU 0.774Total Cubic Yards per WGU 22.45
Total Class I Capacity (Cubic Yards) 12,350,500Average Cubic Yards per Acre 78,862Acres Atributable to Class I Capacity 156.61Historical Cost per Acre (Land and Vehicles) $17,383Recoupment Cost of Class I Capacity $2,722,352Total Class I Capacity (Cubic Yards) 12,350,500Cost per Cubic Yard of Class I Capacity $0.22Total Class I Cubic Yards per WGU 22.45Class I Disposal Cost per Waste Generation Unit $4.94 Source: Remaining and total Class I capacity and average cubic yards per acre from Table 113; annual cubic yards generated is estimate for 2007 from SWDD, November 2006; years of capacity for existing and new development from SWDD, November 2006; 2007 WGUs from Table 110; historical cost per acre from Table 114.
The solid waste costs per service unit are summarized in Table 116. Convenience center costs are attributed entirely to residential development, while recycling and landfill costs are attributed to both residential and nonresidential development.
Table 116. Solid Waste Cost Summary per WGU Residential Nonresidential
Convenience Center Cost per WGU $43.30 NARecycling Cost per WGU $3.23 $3.23Landfill Cost per WGU $4.94 $4.94Total Cost per WGU $51.47 $8.17
Source: Convenience center cost from Table 111; recycling cost from Table 112; landfill cost from Table 115.
Revenue Credits As discussed in the introduction to this study, impact fees should be reduced to account for future funding that will be generated by new development and used to remedy existing deficiencies or to retire outstanding debt of existing facilities that help provide the existing level of service to existing development. Since the updated fees are based on the existing levels of service, there are no deficiencies. In addition, the Indian River County Solid Waste Disposal District has no outstanding

Impact Fee Update Technical Memorandum #3 (Final) Indian River County, Florida April 30, 2007 113
debt for the types of facilities covered in this report. For these reasons, no revenue credits are absolutely required. The previous study, however, took a more expansive view of revenue credits, providing for a past property tax credit as well as future revenue credit for all types of historical or planned funding used for capacity-expanding capital improvements. A credit for past property taxes paid by vacant land is not appropriate for the solid waste fee, since the District’s main funding source is a non-ad valorem assessment on improved property. Similarly, no credit is warranted for the Class I landfill component, which is a recoupment fee. Some credit could be provided for non-ad valorem assessment revenues that might be used in the future for capacity-expanding improvements to the convenience centers. However, the intent in charging an impact fee is to put the burden of those costs on new development and to pay for such costs with impact fee revenues. Assessment revenues would be used only to the extent that impact fee revenues are insufficient to fully fund needed growth-related costs. In this context, no revenue credits are warranted, and the costs per WGU calculated earlier are the same as the net costs per WGU.
Updated Impact Fee Schedule The maximum solid waste impact fees that can be adopted by the County based on this study are derived by multiplying the Waste Generation Units (WGUs) represented by each impact unit by the net cost per WGU, as shown in Table 117.
Table 117. Updated Solid Waste Impact Fee Schedule
Land UseImpact
UnitWGUs/
UnitNet Cost/
WGUNet Cost/
UnitResidential Single-Family Dwelling 1.60 $51.47 $82 Multi-Family/Accessory Unit Dwelling 1.20 $51.47 $62 Mobile Home Dwelling 1.60 $51.47 $82Transient, Assisted, Group Hotel/Motel Room 0.45 $8.17 $4 Nursing Home/ACLF Bed 0.88 $8.17 $7Office and Financial Medical Office 1,000 sf 2.50 $8.17 $20 Bank/Savings Walk-in 1,000 sf 2.50 $8.17 $20 Bank/Savings Drive-in 1,000 sf 2.50 $8.17 $20 Office 50,000 sf or less 1,000 sf 2.00 $8.17 $16 Office greater than 50,000 sf 1,000 sf 2.00 $8.17 $16 Research & Development 1,000 sf 2.00 $8.17 $16Industrial Manufacturing 1,000 sf 5.00 $8.17 $41 Warehouse 1,000 sf 1.00 $8.17 $8 Mini-Warehouse 1,000 sf 0.40 $8.17 $3 General Industrial 1,000 sf 5.00 $8.17 $41 Concrete Plant Acre 4.00 $8.17 $33 Sand Mining Acre 4.00 $8.17 $33
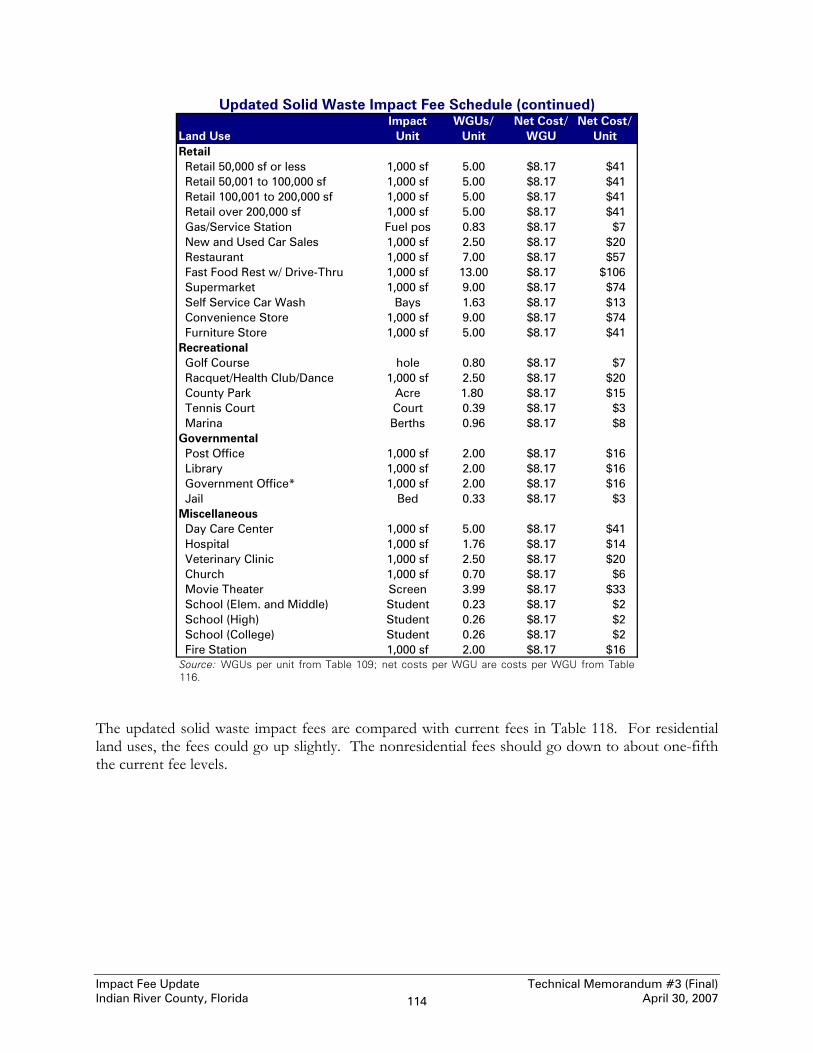
Impact Fee Update Technical Memorandum #3 (Final) Indian River County, Florida April 30, 2007 114
Updated Solid Waste Impact Fee Schedule (continued)
Land UseImpact
UnitWGUs/
UnitNet Cost/
WGUNet Cost/
UnitRetail Retail 50,000 sf or less 1,000 sf 5.00 $8.17 $41 Retail 50,001 to 100,000 sf 1,000 sf 5.00 $8.17 $41 Retail 100,001 to 200,000 sf 1,000 sf 5.00 $8.17 $41 Retail over 200,000 sf 1,000 sf 5.00 $8.17 $41 Gas/Service Station Fuel pos 0.83 $8.17 $7 New and Used Car Sales 1,000 sf 2.50 $8.17 $20 Restaurant 1,000 sf 7.00 $8.17 $57 Fast Food Rest w/ Drive-Thru 1,000 sf 13.00 $8.17 $106 Supermarket 1,000 sf 9.00 $8.17 $74 Self Service Car Wash Bays 1.63 $8.17 $13 Convenience Store 1,000 sf 9.00 $8.17 $74 Furniture Store 1,000 sf 5.00 $8.17 $41Recreational Golf Course hole 0.80 $8.17 $7 Racquet/Health Club/Dance 1,000 sf 2.50 $8.17 $20 County Park Acre 1.80 $8.17 $15 Tennis Court Court 0.39 $8.17 $3 Marina Berths 0.96 $8.17 $8Governmental Post Office 1,000 sf 2.00 $8.17 $16 Library 1,000 sf 2.00 $8.17 $16 Government Office* 1,000 sf 2.00 $8.17 $16 Jail Bed 0.33 $8.17 $3Miscellaneous Day Care Center 1,000 sf 5.00 $8.17 $41 Hospital 1,000 sf 1.76 $8.17 $14 Veterinary Clinic 1,000 sf 2.50 $8.17 $20 Church 1,000 sf 0.70 $8.17 $6 Movie Theater Screen 3.99 $8.17 $33 School (Elem. and Middle) Student 0.23 $8.17 $2 School (High) Student 0.26 $8.17 $2 School (College) Student 0.26 $8.17 $2 Fire Station 1,000 sf 2.00 $8.17 $16 Source: WGUs per unit from Table 109; net costs per WGU are costs per WGU from Table 116.
The updated solid waste impact fees are compared with current fees in Table 118. For residential land uses, the fees could go up slightly. The nonresidential fees should go down to about one-fifth the current fee levels.

Impact Fee Update Technical Memorandum #3 (Final) Indian River County, Florida April 30, 2007 115
Table 118. Comparative Solid Waste Impact Fees
Land UseImpact
UnitUpdated
FeeCurrent
FeePercentChange
Residential Single-Family Dwelling $82 $75 9% Multi-Family/Accessory Unit Dwelling $62 $57 9% Mobile Home Dwelling $82 $75 9%Transient, Assisted, Group Hotel/Motel Room $4 $21 -81% Nursing Home/ACLF Bed $7 $33 -79%Office and Financial Medical Office 1,000 sf $20 $118 -83% Bank/Savings Walk-in 1,000 sf $20 $118 -83% Bank/Savings Drive-in 1,000 sf $20 $118 -83% Office 50,000 sf or less 1,000 sf $16 $94 -83% Office greater than 50,000 sf 1,000 sf $16 $94 -83% Research & Development 1,000 sf $16 NA NAIndustrial Manufacturing 1,000 sf $41 $236 -83% Warehouse 1,000 sf $8 $47 -83% Mini-Warehouse 1,000 sf $3 $19 -84% General Industrial 1,000 sf $41 $236 -83% Concrete Plant Acre $33 $213 -85% Sand Mining Acre $33 $213 -85%Retail Retail 50,000 sf or less 1,000 sf $41 $236 -83% Retail 50,001 to 100,000 sf 1,000 sf $41 $236 -83% Retail 100,001 to 200,000 sf 1,000 sf $41 $236 -83% Retail over 200,000 sf 1,000 sf $41 $236 -83% Gas/Service Station Fuel pos $7 $39 -82% New and Used Car Sales 1,000 sf $20 $118 -83% Restaurant 1,000 sf $57 $330 -83% Fast Food Rest w/ Drive-Thru 1,000 sf $106 $330 -68% Supermarket 1,000 sf $74 $424 -83% Self Service Car Wash Bays $13 $77 -83% Convenience Store 1,000 sf $74 $424 -83% Furniture Store 1,000 sf $41 $236 -83%Recreational Golf Course hole $7 $38 -82% Racquet/Health Club/Dance 1,000 sf $20 $118 -83% County Park Acre $15 $85 -82% Tennis Court Court $3 $18 -83% Marina Berths $8 $45 -82%Governmental Post Office 1,000 sf $16 $94 -83% Library 1,000 sf $16 $94 -83% Government Office Complex 1,000 sf $16 $94 -83% Jail Bed $3 $16 -81%Miscellaneous Day Care Center 1,000 sf $41 $235 -83% Hospital 1,000 sf $14 $83 -83% Veterinary Clinic 1,000 sf $20 $118 -83% Church 1,000 sf $6 $33 -82% Movie Theater Screen $33 $188 -82% School (Elem. and Middle) Student $2 $12 -83% School (High) Student $2 $13 -85% School (College) Student $2 $13 -85% Fire Station 1,000 sf $16 $94 -83% Source: Updated fees from Table 117.

Impact Fee Update Technical Memorandum #3 (Final) Indian River County, Florida April 30, 2007 116
Revenue Potential Overall solid waste impact fee revenues would decline by about 26 percent from what they would otherwise be under the current fee schedule, as shown in Table 119.
Table 119. Solid Waste Impact Fee Revenue Estimates Avg. Annual Percent
Land Use Type Impact Units Current Updated Current Updated ChangeSingle-Family 2,384 $75 $82 $179,000 $195,000 9%Multi-Family 476 $57 $62 $27,000 $30,000 11%Mobile Home 57 $75 $82 $4,000 $5,000 25%Nonresidential (1000 sf) 782.4 $173 $31 $135,000 $24,000 -82%Total $345,000 $254,000 -26%
Impact Fee Rates Impact Fee Revenues
Source: Average annual impact units based on building permit data for 2001-2006; impact fee rates from Table 118 (nonresidential rate per 1,000 sq. ft. is average of all nonresidential categories with an impact unit of 1,000 sq. ft.)

Impact Fee Update Technical Memorandum #3 (Final) Indian River County, Florida April 30, 2007 117
APPENDIX A: POPULATION AND DEMOGRAPHICS For residential land uses, the impact of a dwelling unit on the need for capital facilities is generally proportional to the number of persons residing in the dwelling unit. This can be measured for different housing types in terms of either average household size (average number of persons per occupied dwelling unit) or persons per unit (average number of persons per dwelling unit, including vacant as well as occupied units). In this analysis, persons per unit is used. The housing types used in Indian River County’s impact fees are single-family, multi-family and mobile home. The single-family category includes single-family detached and single-family attached (or townhouse) units. The multi-family category includes duplexes, tri-plexes, four-plexes, apartments and condominiums. The mobile home category includes mobile homes, manufactured home and recreational vehicles located in a mobile home or recreational vehicle park (a manufactured home or mobile home located on a separate lot is treated as a single-family detached dwelling). Table 120 presents the total number of housing units, household population and average number of residents per housing unit for the residential categories identified above within the entire county. These county-wide average multipliers will be used for all of the impact fee facility updates. This is a change from the previous study, which used slightly different multipliers for fees that applied county-wide and in the unincorporated area. While the average persons per unit do vary slightly between these geographic areas, using a slightly different set of multipliers will not result in new development being over-charged, since the total populations of the respective service area used in the updated fee calculations are estimated based on the county-wide multipliers. In essence, it is not the absolute value of the person per unit multipliers that affects the fees, but rather the relative number of occupants in different types of housing. Since the relative differences are very similar for both service areas, the choice of multipliers to use makes little difference to the fee calculations. In sum, the use of county-wide multipliers for all service areas and impact fee types vastly simplifies the impact fee analysis with little or no loss of accuracy in the fee calculations.
Table 120. Persons per Unit, 2000 Housing Type Housing Units Population Persons/Unit
Single-Family* 36,240 82,056 2.264Multi-Family 14,792 18,480 1.249Mobile Home 6,786 9,949 1.466Total, County-Wide 57,818 110,485 1.911
* includes single-family detached and single-family attached Source: Total housing units and household population from 2000 U.S. Census for Indian River County (single-family includes single-family attached).
To develop single-family fees that vary by the size of the dwelling unit, national data were reviewed to determine the relative differences in persons per unit for various square footage categories. Data from the 2003 American Housing Survey is presented in Table 121 for two different house sizes.

Impact Fee Update Technical Memorandum #3 (Final) Indian River County, Florida April 30, 2007 118
Table 121. Person per Single-Family Unit by Size, U.S. 2003
Housing Unit Size PersonsHousing
UnitsPersons/
UnitRatio to
Avg. UnitLess than 1,500 sf 64,529 26,038 2.478 0.91371,500 sf or more 125,229 43,942 2.850 1.0509All Units 189,758 69,980 2.712 1.0000 Source: 2003 American Housing Survey for single-family detached units.
To calculate the tiering for the two different categories, national residents per unit ratios for each housing unit category were applied to the county’s total residents per housing unit ratios for single-family homes, as shown in Table 122.
Table 122. Persons per Unit, with Single-Family Tiering
Housing Type
Untiered Persons/
UnitRatio to
Avg. Unit
Tiered Persons/
UnitSingle-Family: 2.264 Less than 1,500 sf 0.9137 2.069 1,500 sf or more 1.0509 2.379Multi-Family 1.249 1.249Mobile Home 1.466 1.466Total, County-Wide 1.911 1.911 Source: Untiered persons/unit from Table 120; single-family ratios by unit size from Table 121.
In order to determine the existing levels of service for the various facilities, it is necessary to estimate the existing total population, both county-wide and in the unincorporated area. This is because schools and libraries provide service county-wide, while parks serve primarily the unincorporated area of the county. The existing population for each service area is estimated by multiplying the person-per-unit multipliers that will be used in the impact fee schedules by the estimated existing number of dwelling units. The resulting total population estimates are shown in Table 123.
Table 123. Existing Housing Units and Population, 2007
Housing Type2000
CensusNew
Units2007
UnitsPop./Unit
2007Est. Pop.
Single-Family Units* 22,384 11,919 34,303 2.264 77,662Multi-Family Units 8,536 2,371 10,907 1.249 13,623Mobile Homes 5,397 109 5,506 1.466 8,072Subtotal, Unincorporated 36,317 14,399 50,716 99,357
Single-Family Units* 36,240 15,824 52,064 2.264 117,873Multi-Family Units 14,792 3,261 18,053 1.249 22,548Mobile Homes 6,870 458 7,328 1.466 10,743Total, County-wide 57,902 19,543 77,445 151,164 * Single-family category includes single-family detached and attached. Source: New units are units permitted from April 1, 2000 through Dec. 31, 2006 from IRC, "Building Permit Information for New Construction: Permits Issued," February 8, 2007 draft; 2007 units are sum of “2000 Census” and “New Units;” persons per unit from Table 120.

Impact Fee Update Technical Memorandum #3 (Final) Indian River County, Florida April 30, 2007 119
This straight-forward approach to estimating total population ensures that there is a strong relationship between the population multipliers used in the impact fee schedules and the cost per person derived from the existing level of service (essentially by dividing the cost of existing facilities by the existing development served by those facilities, expressed in terms of total population). The previous study relied on a much more complex analysis that might come closer to approximating “true” population, but did not provide a strong relationship between the fee schedule multipliers and the fee per person. Since total population is simply an intervening variable that relates existing facilities to existing development served by the facilities, it is more important that the method of determining total population does not distort the relationship than that the population estimates accurately reflect the presence of people. For example, there may be higher vacancy rates today than there were in 2000, so that population estimates derived by multiplying 2007 units by 2000 persons per unit may overstate 2007 population. However, what is more important is the potential of those existing units to demand service in the future. When occupancy rates return to normal, there will be no opportunity to charge additional impact fees. In addition, using a “more accurate” population estimate could result in the fees being too high. For example, if the sum of the products of existing units and person-per-unit multipliers used in the fee schedules is higher than the total population estimate derived from other means, then use of the lower, “more accurate” population estimate would result in a higher fee (dividing existing facility value by a smaller population estimate, other things equal, will result in a higher cost per person). Population projections have been derived in this analysis simply by using the projected county-wide population growth rate. These projections are shown for each of the two service areas in Table 124.
Table 124. Permanent, Year-Round Population, 2007-2025
Year Co.-Wide Uninc. % Uninc.2007 151,164 99,357 65.73%2008 153,427 100,689 65.63%2009 155,690 102,021 65.53%2010 157,953 103,353 65.43%2011 160,216 104,685 65.34%2012 162,479 106,017 65.25%2013 164,742 107,349 65.16%2014 167,005 108,681 65.08%2015 169,268 110,013 64.99%2016 171,531 111,345 64.91%2017 173,794 112,677 64.83%2018 176,057 114,009 64.76%2019 178,320 115,341 64.68%2020 180,583 116,673 64.61%2021 182,846 118,005 64.54%2022 185,109 119,337 64.47%2023 187,372 120,669 64.40%2024 189,635 122,001 64.33%2025 191,900 123,334 64.27%
Source: 2007 estimates from Table 123; 2025 county-wide and unincorporated area projections from 2020 Comprehensive Plan (rest interpolated).

Impact Fee Update Technical Memorandum #3 (Final) Indian River County, Florida April 30, 2007 120
APPENDIX B: FUNCTIONAL POPULATION For four of the eight impact fee program areas (fire rescue, law enforcement, corrections and public buildings), it is appropriate to apply a concept referred to as “functional population” in the impact fee literature. It should be noted that Indian River County uses the term “functional population” in the 2020 Comprehensive Plan, but with a different definition (referring to permanent plus seasonal population). This concept, as used in the impact fee analysis, is a generally-accepted methodology for these impact fee areas and is based on the assumption that demand for certain facilities is generally proportional to the presence of people. To a large extent, the demand for general government services and public safety functions, including fire rescue, law enforcement, corrections and public buildings, is proportional to the presence of people. The functional population concept is analogous to the concept of “full-time equivalent” employees. It represents the number of “full-time equivalent” people present at the site of a land use. Functional population is the equivalent number of people occupying a building or land use site on a 24-hours-per-day, 7-days-per-week basis. The previous impact fee study used two kinds of functional population, one based on 24 hours per day, 7 days per week and the other based on 11 hours per day, 5 days per week. The rationale was that fire rescue, law enforcement and corrections impact fees are related to services that are provided around the clock, while most public buildings are only open during daylight weekday hours. While an argument can be made for this approach, it has the result of putting most of the responsibility for public buildings on nonresidential development, since few people are at home during the daylight hours on a weekday. Yet, intuitively, residential development would seem to be just as responsible for the need for public buildings as nonresidential development. In addition, use of another type of functional population seems unnecessarily complicated. For these reasons, this update uses the 24 hours per day, 7 days per week functional population for all four facility types. Determining residential functional population multipliers is considerably simpler than the nonresidential component. It is generally assumed that people spend one-half to two-thirds of their time at home and the rest of each 24-hour day away from their place of residence. In developing the residential component of 24-hour functional population, the previous study estimated that people, on average, spend 15.6 hours, or 65 percent, of each 24-hour day at their place of residence and the other 35 percent away from home. This estimate is also used in this update. For residential uses, then, functional population per unit is calculated by multiplying average household size by 65 percent. In addition to single family, multi-family and mobile home units, residential uses also include hotels, motels, nursing homes and adult congregate living facilities (ACLF). Assumptions and secondary sources, such as ITE’s Trip Generation manual, are used to develop functional population per unit for hotels, motels, nursing homes and ACLF land uses. The resulting functional population multipliers for residential land uses are presented in Table 125.

Impact Fee Update Technical Memorandum #3 (Final) Indian River County, Florida April 30, 2007 121
Table 125. Functional Population per Unit for Residential Land Uses
Residential Land UseImpact
Unit
Residents/ Occupants
Per UnitOccup.
Rate
Adjusted Pop. Per
Unit
Hours at
PlaceWorkers Per Unit
Work Day
Hours
Days Per
Week
Func. Pop./ Unit
Residential Single-Family (average) Dwelling 2.264 1.472 Less than 1,500 sf Dwelling 2.069 1.345 1,500 sf or more Dwelling 2.379 1.546 Multi-Family/Accessory Unit Dwelling 1.249 0.812 Mobile Home Dwelling 1.466 0.953Transient, Assisted, Group Hotel / Motel Room 1.800 80% 1.440 12 0.5 9 7 0.908 Nursing Home / ACLF Bed 1.250 95% 1.188 16 0.5 9 7 0.979Source: Residents per unit from Table 122 (hotel/motel and nursing home assumed); occupancy rate for hotel/motel based on 9 months of the peak season at 90% occupancy and 3 months off-peak season at 50% (nursing home assumed); hours at place assumed; workers per unit adapted from ITE Trip Generation, 7th Ed.; hours/day assumed; functional population per unit is 65% of persons/unit for residential, and for others = [(Residents/Occupants per Unit x Hours at Place x Days per Week) + (Workers x Work Hours per Day x Days Per Week)]/(24 Hours per Day x 7 Days per Week).
The functional population methodology for nonresidential uses is based on national trip generation data compiled by the Institute of Transportation Engineers (ITE). Functional population per 1,000 square feet is derived by dividing the total number of hours spent by employees and visitors during a week by 168 hours (24 hours/day times 7 days/week). Employees are assumed to spend nine hours per day at their place of employment, and visitors are assumed to spend 0.15 to 3.5 hours per visit depending on land use. The formula used to derive the nonresidential functional population estimates is summarized in Figure 10.
Figure 10. Nonresidential Functional Population Formula
Using this formula and information on trip generation rates from the ITE manual, vehicle occupancy rates from the National Household Travel Survey and other sources and assumptions, nonresidential functional population estimates per 1,000 square feet of gross floor area are calculated. Table 126 presents the results of these calculations for a number of nonresidential land use categories.
Functional population/1000 sf = (employee hours/1000 sf + visitor hours/1000 sf) x days/week ÷ 168 hours/week Where: Employee hours/1000 sf = employees/1000 sf x hours/day Visitor hours/1000 sf = visitors/1000 sf x hours/visit Visitors/1000 sf = weekday ADT/1000 sf x avg. vehicle occupancy employees/1000 sf Weekday ADT/1000 sf = one way average daily trips (total trip ends ÷ 2)

Impact Fee Update Technical Memorandum #3 (Final) Indian River County, Florida April 30, 2007 122
Table 126. Functional Population per Unit for Nonresidential Land Uses
Land UseImpact
Unit ITE
CodeTrips/
Unit1-Way
TripsTrips/Wrker
Wrkr/Unit
Wrkr Hrs/ Day
Occup/ Trip
Visits/Day
Hrs/ Visit
Days a Wk
Func. Pop./ Unit
Office and Financial Medical Office 1,000 sf 720 36.13 18.07 8.91 4.05 9 1.37 20.69 1.00 5 1.702 Bank/Savings Walk-in 1,000 sf 911 156.48 78.24 44.47 3.52 9 1.27 95.85 0.35 5 1.941 Bank/Savings Drive-in 1,000 sf 912 246.49 123.25 72.79 3.39 9 1.27 153.13 0.15 5 1.591 Office 50,000 sf or less 1,000 sf 710 15.65 7.82 3.32 4.71 9 1.20 4.68 1.00 5 1.401 Office greater than 50,000 sf 1,000 sf 710 8.27 4.13 3.32 2.49 9 1.20 2.47 1.00 5 0.741 Research & Dev't Center 1,000 sf 760 8.11 4.06 3.32 2.44 9 1.20 2.42 1.00 5 0.726Industrial Manufacturing 1,000 sf 140 3.82 1.91 2.13 1.79 9 1.30 0.69 1.00 5 0.501 Warehouse 1,000 sf 150 4.96 2.48 3.89 1.28 9 1.30 1.95 0.75 5 0.385 Mini-Warehouse 1,000 sf 151 2.50 1.25 56.28 0.04 9 1.55 1.89 0.75 7 0.076 General Industrial 1,000 sf 110 6.97 3.49 3.02 2.31 9 1.30 2.22 1.00 5 0.684 Concrete Plant Acre N/A 15.6 7.80 3.02 5.17 9 1.20 4.19 1.00 5 1.508 Sand Mining Acre N/A 2.00 1.00 3.02 0.66 9 1.20 0.54 1.00 5 0.193Retail, Gross Square Feet Retail 50,000 sf or less 1,000 sf 820 86.56 43.28 N/A 2.50 9 1.70 71.07 0.65 7 2.862 Retail 50,001 to 100,000 sf 1,000 sf 820 75.10 37.55 N/A 2.50 9 1.70 61.34 0.75 7 2.854 Retail 100,001 to 200,000 sf 1,000 sf 820 58.93 29.46 N/A 2.50 9 1.70 47.59 1.00 7 2.920 Retail over 200,000 sf 1,000 sf 820 32.80 16.40 N/A 2.50 9 1.70 25.38 1.00 7 1.995 Gas/Service Station Fuel pos 944 168.56 84.28 N/A 2.50 9 1.52 125.61 0.15 7 1.723 New and Used Car Sales 1,000 sf 841 33.34 16.67 21.14 1.58 9 1.70 26.76 1.00 7 1.706 High-Turnover Restaurant 1,000 sf 932 127.15 63.58 N/A 9.92 9 1.52 86.71 1.00 7 7.333 Fast Food Rest w/ Drive-Thru 1,000 sf 934 496.12 248.06 N/A 10.90 9 1.52 366.15 0.25 7 7.902 Supermarket 1,000 sf 850 102.24 51.12 87.82 1.16 9 1.52 76.54 0.50 7 2.031 Self Service Car Wash Bays 947 108.00 54.00 N/A 0.50 9 1.52 81.58 0.50 7 1.887 Convenience Store 1,000 sf 851 737.99 369.00 N/A 2.00 9 1.52 558.87 0.15 7 4.243 Furniture Store 1,000 sf 890 5.06 2.53 12.19 0.42 9 1.70 3.89 1.00 7 0.318Recreational Golf Course Hole 430 35.74 17.87 20.52 1.74 9 1.70 28.64 1.50 7 2.443 Racquet/Health/Dance Studio 1,000 sf 492 32.93 16.47 N/A 2.00 9 1.70 25.99 1.50 7 2.374 County Park Acre 412 2.28 1.14 N/A 0.10 9 1.70 1.84 1.50 7 0.152 Tennis Court court 491 38.70 19.35 45.71 0.85 9 1.70 32.05 1.50 7 2.321 Marina Berths 420 2.96 1.48 20.52 0.14 9 1.70 2.37 1.00 7 0.153Governmental Post Office 1,000 sf 732 108.19 54.10 28.32 3.82 9 1.20 61.09 0.25 6 1.773 Library 1,000 sf 590 54.00 27.00 48.85 1.11 9 1.20 31.29 1.00 7 1.718 Government Complex 1,000 sf 733 27.92 13.96 7.75 3.60 9 1.20 13.15 1.00 5 1.356 Jail Bed 571 5.50 2.75 2.50 2.20 9 1.20 1.10 1.00 7 0.871Miscellaneous Day Care Center 1,000 sf 565 79.26 39.63 28.13 2.82 9 1.50 56.90 0.15 5 1.009 Hospital 1,000 sf 610 17.57 8.79 5.20 3.38 9 1.20 7.16 1.00 7 1.566 Veterinary Clinic 1,000 sf N/A 32.8 16.40 4.05 9 1.37 18.42 1.00 5 1.633 Church 1,000 sf 560 9.11 4.56 N/A 0.63 9 1.70 7.11 1.00 7 0.533 Movie Theater with Matinee Screen 444 109.97 54.99 8.00 13.75 9 1.70 79.73 1.00 7 8.477 Elementary School Student 520 1.29 0.65 15.71 0.08 9 2.00 1.21 2.00 5 0.094 High School Student 530 1.71 0.86 19.74 0.09 9 2.00 1.62 2.00 5 0.120 Junior/Community College Student 540 1.20 0.60 15.55 0.08 9 2.00 1.12 2.50 5 0.104 Fire Station 1,000 sf N/A 5.40 2.70 N/A 0.70 9 1.20 2.54 3.50 7 0.633 Source: Trips per unit and per worker is trip ends on a weekday from Institute of Transportation Engineers (ITE), Trip Generation, 7th Ed., 2003; workers per unit is ratio of trips/unit to trips/worker, or is derived from ITE manual or other sources; 1-way factor and worker hours/day assumed; occupants per trip from Federal Highway Administration, Nationwide Household Travel Survey, 2001; visitors/day is 1-way trips times occupants/trip minus workers/unit; hours/week and days/week assumed; functional population per unit = (workers/unit x worker hours/day + visitors x hours/visit x days/week)/(24 hours/day x 7 days/week).

Impact Fee Update Technical Memorandum #3 (Final) Indian River County, Florida April 30, 2007 123
In order to determine the existing levels of service for the various facilities, it is necessary to estimate the existing total functional population in each of the service areas. As noted earlier, there are three different areas served by the facilities addressed in this report. The existing functional population for each service area is estimated by multiplying the functional population per unit multipliers that will be used in the impact fee schedules by the estimated existing number of dwelling units or nonresidential square feet (in thousands). The resulting total functional population estimates are shown in Table 127.
Table 127. Total Functional Population by Service Area, 2007
Source: 2007 residential units based on 2000 Census and April 1, 2000 through December 31, 2006 building permits from IRC Community Development Department, "Building Permit Information for New Construction: Permits Issued," February 8, 2007 draft; 2007 nonresidential units from IRC Property Appraiser, January 2007; residential functional population per unit from Table 125; nonresidential functional population per unit from Table 126 (commercial is average of all retail, office/financial and industrial categories, institutional/misc. is average of all miscellaneous categories and government is average of all government categories).
This straight-forward approach to estimating total functional population ensures that there is a strong relationship between the functional population multipliers used in the impact fee schedules and the cost per functional population derived by from the existing level of service (essentially by dividing the cost of existing facilities by the existing development served by those facilities, expressed in terms of total functional population). The previous study relied on a much more complex analysis that might come closer to approximating “true” functional population, but did not provide a strong relationship between the fee schedule multipliers and the fee per functional population. Since functional population is simply an intervening variable that relates existing facilities to existing development served by the facilities, it is more important that the method of
Land UseImpact
Unit2007
UnitsFunc. Pop./
Unit2007
Func. Pop.Single-Family Dwelling 51,451 1.472 75,736Multi-Family Dwelling 18,091 0.812 14,690Mobile Home Dwelling 7,232 0.953 6,892Commercial 1,000 sf 23,272 2.196 51,105Institutional/Misc. 1,000 sf 6,166 1.075 6,628Government 1,000 sf 5,178 1.616 8,368Total, County-Wide 163,419
Single-Family Dwelling 49,580 1.472 72,982Multi-Family Dwelling 16,721 0.812 13,577Mobile Home Dwelling 7,232 0.953 6,892Commercial 1,000 sf 23,152 2.196 50,842Institutional/Misc. 1,000 sf 6,070 1.075 6,525Government 1,000 sf 5,154 1.616 8,329Total, County-Wide less IR Shores 159,147
Single-Family Dwelling 34,015 1.472 50,070Multi-Family Dwelling 11,009 0.812 8,939Mobile Home Dwelling 5,500 0.953 5,242Commercial 1,000 sf 14,274 2.196 31,346Institutional/Misc. 1,000 sf 3,828 1.075 4,115Government 1,000 sf 2,695 1.616 4,355Total, Unincorporated 104,067

Impact Fee Update Technical Memorandum #3 (Final) Indian River County, Florida April 30, 2007 124
determining total functional population does not distort the relationship than that the functional population estimates accurately reflect the presence of people. For example, there may be higher vacancy rates today than there were in 2000, so that residential functional population estimates derived by multiplying 2007 units by 2000 persons per unit may overstate 2007 population. However, what is more important is the potential of those existing units to demand service in the future. When occupancy rates return to normal, there will be no opportunity to charge additional impact fees. On the other hand, if the sum of the products of existing units and functional population multipliers used in the fee schedules is higher than the total functional population estimate derived from population and employment estimates and assumptions, then arguably the resulting impact fees would be too high (dividing existing facility value by a larger functional population estimate, other things equal, will result in a lower fee). Functional population projections have been derived in this analysis simply by using the projected population growth rate. These projections are shown for each of the three service areas in Table 128.
Table 128. Functional Population, 2007-2025
Source: 2007 estimates from Table 127; 2025 county-wide and unincorporated area projections based on county-wide 2007-2025 population growth rate from 2020 Comprehensive Plan (other years interpolated).
YearCounty-
WideCo.-Wide less IRS Unincorp.
2007 163,419 159,147 104,0672008 167,065 162,697 106,3892009 170,711 166,247 108,7112010 174,357 169,797 111,0332011 178,003 173,347 113,3552012 181,649 176,897 115,6772013 185,295 180,447 117,9992014 188,941 183,997 120,3212015 192,587 187,547 122,6432016 196,233 191,097 124,9652017 199,879 194,647 127,2872018 203,525 198,197 129,6092019 207,171 201,747 131,9312020 210,817 205,297 134,2532021 214,463 208,847 136,5752022 218,109 212,397 138,8972023 221,755 215,947 141,2192024 225,401 219,497 143,5412025 229,041 223,054 145,856

Impact Fee Update Technical Memorandum #3 (Final) Indian River County, Florida April 30, 2007 125
APPENDIX C: MAJOR ROADWAY INVENTORY
Table 129. Existing Major Roadway Inventory – Principal Arterial Roads Roadway Segment Length Lns Type ADT Cap. LM LM w/ct VMT VMC U.S. 1 S. County Line to Oslo Rd 2.30 4 D 31,034 35,700 9.20 9.20 71,378 82,110 U.S. 1 Oslo Rd to 4th St @ IR Blvd 1.56 4 D 35,966 35,700 6.24 6.24 56,107 55,692 U.S. 1 4th St @ IR Blvd to 8th St 0.50 4 D 22,120 35,700 2.00 2.00 11,060 17,850 U.S. 1 8th St to 12th St 0.50 4 D 23,722 35,700 2.00 2.00 11,861 17,850 U.S. 1 12th St to S. VB City L 0.50 4 D 26,599 35,700 2.00 2.00 13,300 17,850 U.S. 1 S. VB City L to 17th St 0.50 4 D 26,518 35,700 2.00 2.00 13,259 17,850 U.S. 1 17th St to S.R. 60 0.50 4 D 25,947 35,700 2.00 2.00 12,974 17,850 U.S. 1 S.R. 60 to Royal Palm Pl 0.50 4 D 20,988 35,700 2.00 2.00 10,494 17,850 U.S. 1 Royal Palm Pl to Atlantic Blvd 0.50 4 D 21,663 35,700 2.00 2.00 10,832 17,850 U.S. 1 Atlantic Blvd to Aviation 0.42 4 D 27,469 35,700 1.68 1.68 11,537 14,994 U.S. 1 Aviation to 37th St 0.63 4 D 33,835 35,700 2.52 2.52 21,316 22,491 U.S. 1 37th St. to Old Dixie Hwy 0.50 4 D 28,834 35,700 2.00 2.00 14,417 17,850 U.S. 1 Old Dixie Hwy to 41st St 0.50 4 D 27,566 35,700 2.00 2.00 13,783 17,850 U.S. 1 41st St to 45th St 0.50 4 D 24,846 35,700 2.00 2.00 12,423 17,850 U.S. 1 45th St to 49th St 0.50 4 D 22,367 35,700 2.00 2.00 11,184 17,850 U.S. 1 49th St to 65th St 3.00 4 D 27,742 35,700 12.00 12.00 83,226 107,100 U.S. 1 65th St to 69th St 0.50 4 D 27,113 35,700 2.00 2.00 13,557 17,850 U.S. 1 69th St to Old Dixie Hwy 2.00 4 D 26,588 35,700 8.00 8.00 53,176 71,400 U.S. 1 Old Dixie Hwy to Schumann Dr 3.50 4 D 24,498 35,700 14.00 14.00 85,743 124,950 U.S. 1 Schumann Dr to C.R. 512 1.50 4 D 25,643 35,700 6.00 6.00 38,465 53,550 U.S. 1 C.R. 512 to N. Seb City L 2.00 4 D 28,503 35,700 8.00 8.00 57,006 71,400 U.S. 1 N. Seb City L to Roseland Rd 0.50 4 D 30,551 35,700 2.00 2.00 15,276 17,850 U.S. 1 Roseland Rd to N. County Line 1.00 4 D 24,044 35,700 4.00 4.00 24,044 35,700 S.R. 60 W. County Line to C.R. 512 14.00 2 U 6,033 16,400 28.00 28.00 84,462 229,600 S.R. 60 C.R. 512 to 98th Ave 6.52 2 U 6,602 16,400 13.04 13.04 43,045 106,928 S.R. 60 98th Ave to I-95 1.19 2 U 7,924 16,400 2.38 2.38 9,430 19,516 S.R. 60 I-95 to 82nd Ave 2.00 4 D 32,486 35,700 8.00 8.00 64,972 71,400 S.R. 60 82nd Ave to 66th Ave 2.00 4 D 33,860 35,700 8.00 8.00 67,720 71,400 S.R. 60 66th Ave to 58th Ave 1.00 6 D 39,840 53,500 6.00 6.00 39,840 53,500 S.R. 60 58th Ave to 43rd Ave 1.00 6 D 32,079 53,500 6.00 6.00 32,079 53,500 S.R. 60 43rd Ave to 27th Ave 1.00 6 D 31,939 53,500 6.00 6.00 31,939 53,500 S.R. 60 27th Ave to W. of 20th Ave. 0.50 6 D 27,654 53,500 3.00 3.00 13,827 26,750 S.R. 60 (EB) W. of 20th Ave to Old Dixie Hwy 0.50 3 O 25,724 32,100 1.50 1.50 12,862 16,050 S.R. 60 (EB) Old Dixie Hwy to 10th Ave 0.30 3 O 24,029 32,100 0.90 0.90 7,209 9,630 S.R. 60 (EB) 10th Ave to U.S. 1 0.30 3 O 19,559 32,100 0.90 0.90 5,868 9,630 S.R. 60 (EB) U.S. 1 to W. of 6th Ave 0.50 3 O 13,019 32,100 1.50 1.50 6,510 16,050 S.R. 60 (WB) W. of 20th Ave to Old Dixie Hwy 0.43 4 O N/A 40,680 1.72 0.00 17,492 S.R. 60 (WB) Old Dixie Hwy to 10th Ave 0.35 4 O N/A 40,680 1.40 0.00 14,238 S.R. 60 (WB) 10th Ave to U.S.1 0.25 4 O N/A 40,680 1.00 0.00 10,170 S.R. 60 (WB) U.S. 1 to W. of 6th Ave 0.24 4 O N/A 40,680 0.96 0.00 9,763Subtotal, Principal Arterials 187.94 182.86 1,086,181 1,660,554 Source: Roadway segments, lengths, number of lanes, roadway type and ADT from Table 4.7.1 of the Transportation Element of the 2020 Indian River County Comprehensive Plan; road types are divided (D), undivided (U) or one-way (O); capacities from Florida Department of Transportation, Highway Capacity Manual; lane-miles are the product of segment length and number of lanes; VMT is the product of length and ADT; VMC is the product of length and capacity.

Impact Fee Update Technical Memorandum #3 (Final) Indian River County, Florida April 30, 2007 126
Table 130. Existing Major Roadway Inventory – Minor Arterial Roads Roadway Segment Length Lns Type ADT Cap. LM LM w/ct VMT VMC S.R. A1A S. County Line to S. VB City L 4.70 2 U 7,999 16,400 9.40 9.40 37,595 77,080 S.R. A1A S. VB City L to 17th St 1.30 2 D 20,029 17,220 2.60 2.60 26,038 22,386 S.R. A1A 17th St to S.R. 60 1.50 2 D 13,960 17,220 3.00 3.00 20,940 25,830 S.R. A1A S.R. 60 to N. VB City L 1.50 2 D 19,887 17,220 3.00 3.00 29,831 25,830 S.R. A1A N. VB City L to Fred Tuerk Rd 1.00 2 D 19,887 17,220 2.00 2.00 19,887 17,220 S.R. A1A Fred Tuerk to Old Winter Bch Rd 3.00 2 U 11,142 16,400 6.00 6.00 33,426 49,200 S.R. A1A Old Winter Bch Rd to N. IRS L 1.00 2 U 10,117 16,400 2.00 2.00 10,117 16,400 S.R. A1A N. IRS L to C.R. 510 1.50 2 U 10,117 16,400 3.00 3.00 15,176 24,600 S.R. A1A C.R. 510 to N. County Line 7.30 2 U 7,727 16,400 14.60 14.60 56,407 119,720 S.R. 60 W of 6th Av to Indian Rvr Blvd 0.34 4 D N/A 35,700 1.36 0.00 12,138 S.R. 60 Indian River Blvd to ICWW 1.10 4 D 18,097 35,700 4.40 4.40 19,907 39,270 S.R. 60 ICWW to S.R. A1A 0.50 4 D 17,057 35,700 2.00 2.00 8,529 17,850 8th St 27th Ave to 20th Ave 0.50 2 U N/A 11,680 1.00 0.00 5,840 8th St 20th Ave to Old Dixie Hwy 1.00 2 U N/A 11,680 2.00 0.00 11,680 8th St Old Dixie Hwy to U.S. 1 0.30 2 U N/A 11,680 0.60 0.00 3,504 8th St U.S. 1 to Indian River Blvd 1.00 2 U N/A 11,680 2.00 0.00 11,680 16th St 58th Ave to 43rd Ave 1.00 2 U N/A 11,680 2.00 0.00 11,680 16th St 43rd Ave to 27th Ave 1.00 2 U N/A 11,680 2.00 0.00 11,680 16th St 27th Ave to 20th Ave 0.50 2 U N/A 11,680 1.00 0.00 5,840 16th St 20th Ave to Old Dixie Hwy 0.50 2 U N/A 11,680 1.00 0.00 5,840 16th/17th St Old Dixie Hwy to U.S. 1 0.50 4 D N/A 31,100 2.00 0.00 15,550 17th St U.S. 1 to Indian River Blvd 0.50 4 D 11,401 31,100 2.00 2.00 5,701 15,550 17th St Indian River Blvd to S.R. A1A 2.00 4 D 22,141 31,100 8.00 8.00 44,282 62,200 12th St 82nd Avenue to 58th Ave 3.00 2 U N/A 11,680 6.00 0.00 35,040 12th St 58th Ave to 43rd Ave 1.00 2 U N/A 11,680 2.00 0.00 11,680 12th St 43rd Ave to 27th Ave 1.00 2 U N/A 11,680 2.00 0.00 11,680 12th St 27th Ave to 20th Ave 0.50 2 U N/A 11,680 1.00 0.00 5,840 12th St 20th Ave to Old Dixie Hwy 1.00 2 U N/A 11,680 2.00 0.00 11,680 12th St Old Dixie Hwy to U.S. 1 0.50 4 U N/A 29,445 2.00 0.00 14,723 12th St U.S. 1 to IR Blvd 0.62 4 U N/A 29,445 2.48 0.00 18,256 26th St 66th Ave to 43rd Ave 2.00 2 U N/A 14,600 4.00 0.00 29,200 20th Ave 12th St to S. VB City L 0.50 4 D N/A 31,100 2.00 0.00 15,550 20th Ave S. VB City L to 16th St 0.50 4 D N/A 31,100 2.00 0.00 15,550 20th Ave 16th St to S.R. 60 0.50 4 D N/A 31,100 2.00 0.00 15,550 20th Ave S.R. 60 to Atlantic Blvd 0.50 2 U N/A 11,680 1.00 0.00 5,840 27th Ave Oslo Rd to 4th St 2.00 2 U 13,183 14,600 4.00 4.00 26,366 29,200 27th Ave 4th St to 8th St 0.50 2 U 13,086 14,600 1.00 1.00 6,543 7,300 27th Ave 8th St to 12th St 0.50 2 U 12,736 14,600 1.00 1.00 6,368 7,300 27th Ave 12th St to S. VB City L 0.30 2 U 13,183 14,600 0.60 0.60 3,955 4,380 27th Ave S. VB City L to 16th St 0.40 2 U 13,183 14,600 0.80 0.80 5,273 5,840 27th Ave 16th St to S.R. 60 0.50 2 U 10,910 14,600 1.00 1.00 5,455 7,300 27th Ave S.R. 60 to Atlantic Blvd 0.30 2 U 6,381 11,680 0.60 0.60 1,914 3,504 27th Ave Atlantic Blvd to Aviation Blvd 0.30 2 U 12,326 11,680 0.60 0.60 3,698 3,504 43rd Ave 12th St to 16th St 0.50 2 U 13,363 11,680 1.00 1.00 6,682 5,840 43rd Ave 16th St to S.R. 60 0.50 2 U 14,531 11,680 1.00 1.00 7,266 5,840 43rd Ave S.R. 60 to 26th St 0.50 2 U 10,557 11,680 1.00 1.00 5,279 5,840 58th Ave 16th St to S.R. 60 0.50 4 D 24,807 31,100 2.00 2.00 12,404 15,550 58th Ave S.R. 60 to 26th St 0.51 4 D 23,805 31,100 2.04 2.04 12,141 15,861 58th Ave 26th St to 41st St 1.50 2 U 15,498 11,680 3.00 3.00 23,247 17,520

Impact Fee Update Technical Memorandum #3 (Final) Indian River County, Florida April 30, 2007 127
Existing Major Roadway Inventory – Minor Arterial Roads (Continued)
Roadway Segment Length Lns Type ADT Cap. LM LM w/ct VMT VMC Indian River Bd. 4th St @ Us 1 to 12th St 1.00 4 D 23,124 31,100 4.00 4.00 23,124 31,100Indian River Bd. 12th St. to S. VB City L 0.34 4 D 26,556 31,100 1.36 1.36 9,029 10,574Indian River Bd. S. VB City L to 17th St. 0.32 4 D 26,556 31,100 1.28 1.28 8,498 9,952 Indian River Bd. 17th St to 20th St 0.39 4 D 27,876 31,100 1.56 1.56 10,872 12,129 Indian River Bd. 20th St to 21st St 0.19 4 D 26,868 31,100 0.76 0.76 5,105 5,909 Indian River Bd. 21st St to Royal Palm 0.37 4 D 34,983 31,100 1.48 1.48 12,944 11,507 Indian River Bd. Royal Palm to MB Bridge 0.46 4 D 34,161 31,100 1.84 1.84 15,714 14,306 Indian River Bd. MB Bridge to 37th St. 0.71 4 D 26,475 31,100 2.84 2.84 18,797 22,081 Indian River Bd. 37th St. to U.S. 1 @ 53rd St 2.60 4 D 16,153 31,100 10.40 10.40 41,998 80,860 Schumann Dr CR 510 at 66th Ave to Barber 0.82 2 U 10,133 11,680 1.64 1.64 8,309 9,578 Old Dixie Hwy Oslo Rd to 4th St 2.10 2 U 7,399 11,680 4.20 4.20 15,538 24,528 Old Dixie Hwy 4th St to 8th St 0.50 2 U 10,471 11,680 1.00 1.00 5,236 5,840 Old Dixie Hwy 8th St to 12th St 0.50 2 U 11,977 11,680 1.00 1.00 5,989 5,840 Old Dixie Hwy 12th St to S. VB City L 0.30 2 U 7,269 11,680 0.60 0.60 2,181 3,504 Old Dixie Hwy S. VB City L to 16th St 0.50 2 U 7,269 11,680 1.00 1.00 3,635 5,840 Old Dixie Hwy 16th St to S.R. 60 0.50 2 U 5,098 11,680 1.00 1.00 2,549 5,840 Old Dixie Hwy U.S. 1 to 41st Ave 0.35 2 U 3,500 11,680 0.70 0.70 1,225 4,088 Oslo Rd 27th Ave to 20th Ave 0.50 2 U N/A 11,680 1.00 0.00 5,840 Oslo Rd 20th Ave to Old Dixie Hwy 2.00 2 U 12,515 11,680 4.00 4.00 25,030 23,360 Oslo Rd Old Dixie Hwy to U.S. 1 0.30 4 D N/A 31,100 1.20 0.00 9,330 6th Ave 12th St to 17th St 0.64 2 U N/A 11,680 1.28 0.00 7,475 6th Ave 17th St to S. VB City L 0.13 2 U N/A 11,680 0.26 0.00 1,518 6th Ave S. VB City L to S.R. 60 0.50 2 U N/A 11,680 1.00 0.00 5,840Subtotal, Minor Arterials 170.48 122.30 670,200 1,250,775 Source: Roadway segments, lengths, number of lanes, roadway type and ADT from Table 4.7.1 of the Transportation Element of the 2020 Indian River County Comprehensive Plan; road types are divided (D), undivided (U) or one-way (O); capacities from Florida Department of Transportation, Highway Capacity Manual; lane-miles are the product of segment length and number of lanes; VMT is the product of length and ADT; VMC is the product of length and capacity.

Impact Fee Update Technical Memorandum #3 (Final) Indian River County, Florida April 30, 2007 128
Table 131. Existing Major Roadway Inventory – Collector Roads Roadway Segment Length . of Laoad Ty ADT Cap. LM LM w/ct VMT VMC Schumann Dr Barber St to Englar Dr 1.31 2 U 3,418 11,680 2.62 2.62 4,478 15,301 Schumann Dr Englar Dr to U.S. 1 1.18 2 U 2,087 11,680 2.36 2.36 2,463 13,782 Roseland Rd C.R. 512 to N. Seb City L 3.00 2 U 6,979 11,680 6.00 6.00 20,937 35,040 Roseland Rd N. Seb City L to U.S. 1 2.00 2 U 7,362 11,680 4.00 4.00 14,724 23,360 C.R. 512 Fellsmere City Limits to I-95 3.60 2 U 9,562 11,680 7.20 7.20 34,423 42,048 C.R. 512 I-95 to C.R. 510 3.00 2 U 15,388 11,680 6.00 6.00 46,164 35,040 C.R. 512 C.R. 510 to Roseland Rd. 1.25 2 U 15,207 11,680 2.50 2.50 19,009 14,600 C.R. 512 Roseland Rd to Barber St 0.39 4 D 10,942 31,100 1.56 1.56 4,267 12,129 C.R. 512 Barber St to Fleming St 0.72 4 D 13,777 31,100 2.88 2.88 9,919 22,392 C.R. 512 Fleming St to Easy St 0.60 4 D 13,754 31,100 2.40 2.40 8,252 18,660 C.R. 512 Easy St to Delaware St 0.21 4 D 20,669 31,100 0.84 0.84 4,340 6,531 C.R. 512 Delaware St to U.S. 1 0.86 4 D 14,077 31,100 3.44 3.44 12,106 26,746 C.R. 510 C.R. 512 to 87th St 1.73 2 U 11,892 14,600 3.46 3.46 20,573 25,258 C.R. 510 87th St to 66th Ave 2.51 2 U 11,287 14,600 5.02 5.02 28,330 36,646 C.R. 510 66th Ave to 58th Ave 1.00 2 U 11,368 14,600 2.00 2.00 11,368 14,600 C.R. 510 58th Ave to U.S. 1 0.50 2 U 13,597 14,600 1.00 1.00 6,799 7,300 C.R. 510 U.S. 1 to S.R. A1A 2.50 2 U 14,246 14,600 5.00 5.00 35,615 36,500 S.R. 60 S.R. A1A to Ocean Dr 0.24 4 D 10,963 31,100 0.96 0.96 2,631 7,464 Old Dixie Hwy S. County Line to Oslo Rd 2.20 2 U 7,790 11,680 4.40 4.40 17,138 25,696 Old Dixie Hwy 41st St to 45th St 0.52 2 U 4,300 11,680 1.04 1.04 2,236 6,074 Old Dixie Hwy 45th St to 49th St 0.50 2 U 2,445 11,680 1.00 1.00 1,223 5,840 Old Dixie Hwy 49th St to 65th St 2.00 2 U 2,756 11,680 4.00 4.00 5,512 23,360 Old Dixie Hwy 65th St to 69th St 0.50 2 U 2,133 11,680 1.00 1.00 1,067 5,840 Old Dixie Hwy 69th St to C.R. 510 2.50 2 U 1,318 11,680 5.00 5.00 3,295 29,200 27th Ave S. County Line to Oslo Rd 2.00 2 U 13,932 11,680 4.00 4.00 27,864 23,360 Oslo Rd I-95 to 82nd Ave 0.23 2 U N/A 11,680 0.46 0.00 2,686 Oslo Rd 82nd Ave to 58th Ave 2.00 2 U N/A 11,680 4.00 0.00 23,360 Oslo Rd 58th Ave to 43rd Ave 1.00 2 U 10,475 11,680 2.00 2.00 10,475 11,680 Oslo Rd 43rd Ave to 27th Ave 1.00 2 U 14,585 11,680 2.00 2.00 14,585 11,680 10th Ave 17th St to S.R. 60 0.43 2 U N/A 11,680 0.86 0.00 5,022 10th Ave S.R. 60 to Royal Palm Blvd 0.21 2 U N/A 11,680 0.42 0.00 2,453 43rd Ave S. County Line to Oslo Rd 2.00 2 U 6,874 11,680 4.00 4.00 13,748 23,360 43rd Ave Oslo Rd to 4th St 2.00 2 U 10,213 11,680 4.00 4.00 20,426 23,360 43rd Ave 4th St to 8th St 0.50 2 U 12,412 11,680 1.00 1.00 6,206 5,840 43rd Ave 8th St to 12th St 0.50 2 U 12,940 11,680 1.00 1.00 6,470 5,840 43rd Ave 26th St to 41st St 2.00 2 U 10,288 11,680 4.00 4.00 20,576 23,360 43rd Ave 41st St to 45th St 0.50 2 U 6,125 11,680 1.00 1.00 3,063 5,840 43rd Ave 45th St to 49th St 0.50 2 U 3,258 11,680 1.00 1.00 1,629 5,840 58th Ave Oslo Rd to 4th St 2.00 2 U 8,299 11,680 4.00 4.00 16,598 23,360 58th Ave 4th St to 8th St 0.50 2 U 15,076 11,680 1.00 1.00 7,538 5,840 58th Ave 8th St to 12th St 0.50 2 U 20,711 11,680 1.00 1.00 10,356 5,840 58th Ave 12th St to 16th St 0.50 2 U 21,768 11,680 1.00 1.00 10,884 5,840 58th Ave 41st St to 45th St 0.50 2 U 11,585 11,680 1.00 1.00 5,793 5,840 58th Ave 45th St to 49th St 0.50 2 U 10,390 11,680 1.00 1.00 5,195 5,840 58th Ave 49th St to 65th St 2.00 2 U 9,097 11,680 4.00 4.00 18,194 23,360 58th Ave 65th St to 69th St 0.50 2 U 8,040 11,680 1.00 1.00 4,020 5,840 58th Ave 69th St to C.R. 510 2.50 2 U 6,881 11,680 5.00 5.00 17,203 29,200 66th Ave Oslo Road to 4th St 1.51 2 U N/A 11,680 3.02 0.00 17,637 66th Ave S.R. 60 to 26th St 0.50 2 U 9,663 11,680 1.00 1.00 4,832 5,840 66th Ave 26th St to 41st St 1.50 2 U 9,717 11,680 3.00 3.00 14,576 17,520 66th Ave 41st St to 45th St 0.50 2 U 9,389 11,680 1.00 1.00 4,695 5,840 66th Ave 45th St to 65th St 2.50 2 U 8,682 11,680 5.00 5.00 21,705 29,200 66th Ave 65th St to 69th St 0.52 2 U 7,145 11,680 1.04 1.04 3,715 6,074 66th Ave 69th St to C.R. 510 2.00 2 U 8,503 11,680 4.00 4.00 17,006 23,360 82nd Ave Oslo Rd to 4th St 2.00 2 U N/A 11,680 4.00 0.00 23,360 82nd Ave 4th St to 12th St 1.00 2 U 3,989 11,680 2.00 2.00 3,989 11,680 82nd Ave 12th St to S.R. 60 0.50 2 U 3,894 11,680 1.00 1.00 1,947 5,840 82nd Ave S.R. 60 to 65th St 5.15 2 U 275 11,680 10.30 10.30 1,416 60,152 82nd Ave 65th St to 69th St 0.36 2 U 204 11,680 0.72 0.72 73 4,205

Impact Fee Update Technical Memorandum #3 (Final) Indian River County, Florida April 30, 2007 129
Existing Major Roadway Inventory – Collector Roads (Continued) Roadway Segment Length Lns Type ADT Cap. LM LM w/ct VMT VMC 98th Ave 26th St to S.R. 60 0.45 2 U 569 11,680 0.90 0.90 256 5,256 98th Ave S.R. 60 to 16th St 0.50 2 U 864 11,680 1.00 1.00 432 5,840 98th Ave 16th St to 12th St 0.50 2 U 867 11,680 1.00 1.00 434 5,840 98th Ave 12th St to 8th St 0.50 2 U 179 11,680 1.00 1.00 90 5,840 69th St 82nd Ave to 66th Ave 2.00 2 U 410 11,680 4.00 4.00 820 23,360 69th St 66th Ave to 58th Ave 1.00 2 U 829 11,680 2.00 2.00 829 11,680 69th St 58th Ave to Old Dixie Hwy 3.00 2 U 1,042 11,680 6.00 6.00 3,126 35,040 69th St Old Dixie Hwy to U.S. 1 0.50 2 U 885 11,680 1.00 1.00 443 5,840 45th St 66th Ave to 58th Ave 1.00 2 U 2,419 11,680 2.00 2.00 2,419 11,680 45th St 58th Ave to 43rd Ave 1.00 2 U 3,898 11,680 2.00 2.00 3,898 11,680 45th St 43rd Ave to Old Dixie Hwy 3.50 2 U 8,559 11,680 7.00 7.00 29,957 40,880 45th St Old Dixie Hwy to U.S. 1 0.09 2 U 4,783 11,680 0.18 0.18 430 1,051 45th St U.S. 1 to Indian River Blvd 0.24 2 U 4,266 11,680 0.48 0.48 1,024 2,803 41st St 66th Ave to 58th Ave 1.00 2 U 2,015 11,680 2.00 2.00 2,015 11,680 41st St 58th Ave to 43rd Ave 1.00 2 U 3,658 11,680 2.00 2.00 3,658 11,680 41st St 43rd Ave to Old Dixie Hwy 3.50 2 U 4,062 11,680 7.00 7.00 14,217 40,880 41st St Old Dixie Hwy to U.S. 1 0.07 2 U 1,994 11,680 0.14 0.14 140 818 41st St U.S. 1 to Indian River Blvd 0.55 2 U 1,329 11,680 1.10 1.10 731 6,424 37th St U.S. 1 to Indian River Blvd 1.10 2 U 10,423 11,680 2.20 2.20 11,465 12,848 4th St 82nd Ave to 58th Ave 1.00 2 U N/A 11,680 2.00 0.00 11,680 4th St 58th Ave to 43rd Ave 1.00 2 U N/A 11,680 2.00 0.00 11,680 4th St 43rd Ave to 27th Ave 1.00 2 U N/A 11,680 2.00 0.00 11,680 4th St 27th Ave to 20th Ave 0.50 2 U N/A 11,680 1.00 0.00 5,840 4th St 20th Ave to Old Dixie Hwy 1.00 2 U N/A 11,680 2.00 0.00 11,680 4th St Old Dixie Hwy to U.S. 1 0.50 4 U N/A 23,330 2.00 0.00 11,665 Fred Tuerk Dr A1A to W of Coconut Dr 1.00 2 U N/A 11,680 2.00 0.00 11,680 Winter Beach Rd A1A to Jungle Trail 0.50 2 U N/A 11,680 1.00 0.00 5,840 Atlantic Blvd S.R. 60 to 27th Ave 1.07 2 U 2,061 11,680 2.14 2.14 2,205 12,498 Atlantic Blvd 27th Ave to 20th Ave 0.50 2 U 3,003 11,680 1.00 1.00 1,502 5,840 Atlantic Blvd 20th Ave to U.S. 1 0.50 2 U 2,832 11,680 1.00 1.00 1,416 5,840 Aviation Blvd U.S. 1 to 27th Ave 0.91 2 U N/A 14,600 1.82 0.00 13,286 Royal Palm Blvd Royal Palm Pl to Indian River Blv 1.00 2 U N/A 11,680 2.00 0.00 11,680 Royal Palm Pl U.S. 1 to Indian River Blvd 1.00 2 U N/A 11,680 2.00 0.00 11,680 53rd St U.S. 1 to Old Dixie Hwy 0.06 2 U N/A 11,680 0.12 0.00 701 90th Ave S.R. 60 to 8th St 1.54 2 U N/A 11,680 3.08 0.00 17,987 C.R. 507 S. Carolina to County Line 4.20 2 U N/A 11,680 8.40 0.00 49,056 5th Street SW 27th Ave to 43rd Ave 1.02 2 U N/A 11,680 2.04 0.00 11,914 5th Street SW 20th Ave to 27th Ave 0.50 2 U N/A 11,680 1.00 0.00 5,840 Highlands Dr. 6th Ave SW to Old Dixie 0.65 2 U N/A 11,680 1.30 0.00 7,592 Highlands Dr. Old Dixie to U.S. 1 0.08 2 U N/A 11,680 0.16 0.00 934 C.R. 512 S.R. 60 to Fellsmere City Limits 9.59 2 U N/A 11,680 19.18 0.00 112,011 I.R. Drive North U.S.1 to Main Street 2.62 2 U 1,937 11,680 5.24 5.24 5,075 30,602 I.R. Drive South U.S.1 to Main Street 1.44 2 U 1,605 11,680 2.88 2.88 2,311 16,819 Englar Dr Barber St to George St 0.40 2 U 1,942 11,680 0.80 0.80 777 4,672 Englar Dr George St to Schumann Dr 0.83 2 U 3,361 11,680 1.66 1.66 2,790 9,694 Fleming St Easy St to C.R. 512 0.61 2 U 1,257 11,680 1.22 1.22 767 7,125 Fleming St C.R. 512 to Main St 1.21 2 U 2,060 11,680 2.42 2.42 2,493 14,133 Main St Fleming St to Wimbrow 0.67 2 U 1,248 11,680 1.34 1.34 836 7,826 Main St U.S. 1 to Fleming St 1.33 2 U 4,095 11,680 2.66 2.66 5,446 15,534 Barber St U.S. 1 to Schumann Dr 1.36 2 U N/A 11,680 2.72 0.00 15,885 Barber St Schumann Dr to Englar Dr 1.93 2 U N/A 11,680 3.86 0.00 22,542 Barber St Englar Dr to C.R. 512 0.81 2 U N/A 11,680 1.62 0.00 9,461 Barber St C.R. 512 to Wimbrow 1.25 2 U N/A 11,680 2.50 0.00 14,600 Ocean Dr Greytwig to Beachland 0.44 2 U N/A 11,680 0.88 0.00 5,139 Ocean Dr Beachland to Riomar 0.63 2 U N/A 11,680 1.26 0.00 7,358 21st St Indian River Blvd to U.S. 1 0.52 2 U N/A 11,680 1.04 0.00 6,074 21st St U.S. 1 to 20th Ave 0.54 2 U N/A 11,680 1.08 0.00 6,307 23rd St 20th Ave to U.S. 1 0.47 2 U N/A 11,680 0.94 0.00 5,490 23rd St U.S. 1 to Royal Palm Blvd 0.38 2 U N/A 11,680 0.76 0.00 4,438

Impact Fee Update Technical Memorandum #3 (Final) Indian River County, Florida April 30, 2007 130
Existing Major Roadway Inventory – Collector Roads (Continued) Roadway Segment Length Lns Type ADT Cap. LM LM w/ct VMT VMC 14th Ave Old Dixie Hwy to 16th St 0.31 2 U N/A 11,680 0.62 0.00 3,621 14th Ave 16th St to S.R. 60 0.51 2 U N/A 11,680 1.02 0.00 5,957 14th Ave S.R. 60 to U.S. 1 0.48 2 U N/A 11,680 0.96 0.00 5,606 Victory Atlantic to Cordova 0.30 2 U N/A 11,680 0.60 0.00 3,504 Victory Cordova to 20th Ave 0.26 2 U N/A 11,680 0.52 0.00 3,037Subtotal, Collectors 301.34 213.10 713,648 1,809,904
Source: Roadway segments, lengths, number of lanes, roadway type and ADT from Table 4.7.1 of the Transportation Element of the 2020 Indian River County Comprehensive Plan; road types are divided (D), undivided (U) or one-way (O); capacities from Florida Department of Transportation, Highway Capacity Manual; lane-miles are the product of segment length and number of lanes; VMT is the product of length and ADT; VMC is the product of length and capacity.

Impact Fee Update Technical Memorandum #3 (Final) Indian River County, Florida April 30, 2007 131
APPENDIX D: PARK INVENTORY
Table 132. Existing Park Inventory
Facility NameDev'dAcres
TotalAcres Owner Class
Rest-rooms
Basket-ball
Court
Com-munity Center
Jog-ging Trail
Picnic Pavilion
Play- grnd
Ambersand Beach Park 0.50 3.38 County RBoat Island 5.00 12.00 FIND R 1Blue Cypress Lake Park 10.00 10.00 County R 1 1Dale Wimbrow Park 10.00 20.00 County R 1 0.50 3 1Donald MacDonald Park 25.00 54.00 County R 1 0.5 1IRC Fairgrounds 77.00 139.18 County R 2 0.316th Street Complex 11.76 11.76 County R 1Gifford Park 35.00 40.00 County R 3 2 1 1.0 3 1Golden Sands Park 11.00 13.84 County R 1 4 1Grovenor Estates Park 0.00 4.65 County NHelen Hanson Park 1.93 1.93 County N 1 1Hosie-Schumann Park 0.50 2.00 County N 1 1IRC Shooting Range 80.00 318.00 State R 1Joe S. Earman Park 1.00 4.00 County R 2Kiwanis-Hobart Park 95.00 125.96 County R 3 1 1.0 7 1MLK Park 2.00 2.00 County N 1Moore's Point 2.00 2.00 County N 2North County Regional Park 100.00 115.00 State R 1 0.5 1Oslo Road Boat Ramp 0.30 0.30 County RPine Hill (Lone Pine) 0.50 0.50 County N 1 1Roseland Community Center 1.00 7.00 County N 1 1 1Round Island Beach Park 12.00 24.22 County R 1 0.3 6 1Round Island Park West 45.00 69.94 County R 1 0.3 1 1Seagrape Beach Access 0.50 0.50 County RSebastian Canoe Launch Park 1.00 1.03 County C 1South County Regional Park 40.00 75.11 County R 1 2 1.0 4 1Tracking Station Beach Park 5.50 5.50 County R 1Turtle Trail Beach Access 0.50 0.50 County RTreasure Shores Park 27.00 37.91 County R 1 0.3 1Wabasso Beach Park 1.00 1.00 County R 1 2West Wabasso Park 10.00 10.00 County N 1 2 1.0 2 1Wabasso School Park 5.00 7.36 County N 1 1Wabasso Causeway Park 5.00 5.00 County R 1 745th Street Dock 0.00 0.22 County R
Neighborhood Parks 22.93 37.44 4 5 1 1 5 5Community Parks 1.00 1.03 0 0 0 0 1 0Regional Parks 598.06 1,087.32 22 5 1 6 42 9Total 621.99 1,125.79 26 10 2 6.5 48 14
Source: IRC Recreation Department, January 18, 2007 (FIND stands for Florida Inland Navigation District).

Impact Fee Update Technical Memorandum #3 (Final) Indian River County, Florida April 30, 2007 132
Existing Park Inventory (continued)
Facility NameSwim Pool
Olympic Aquatic Center
Softball Field
Tennis Courts
Volley-ball
CourtSoccer Field
Archery Range
Ambersand Beach ParkBoat IslandBlue Cypress Lake ParkDale Wimbrow ParkDonald MacDonald ParkIRC Fairgrounds 1 116th Street Complex 2Gifford Park 1 2 2 1Golden Sands ParkGrovenor Estates ParkHelen Hanson Park 1Hosie-Schumann ParkIRC Shooting RangeJoe S. Earman ParkKiwanis-Hobart Park 2 2MLK ParkMoore's PointNorth County Regional Park 1 4Oslo Road Boat RampPine Hill (Lone Pine)Roseland Community CenterRound Island Beach ParkRound Island Park WestSeagrape Beach AccessSebastian Canoe Launch ParkSouth County Regional Park 4 2 1Tracking Station Beach ParkTurtle Trail Beach AccessTreasure Shores ParkWabasso Beach ParkWest Wabasso Park 1 1Wabasso School ParkWabasso Causeway Park45th Street Dock
Neighborhood Parks 0 0 2 1 0 0 0Community Parks 0 0 0 0 0 0 0Regional Parks 1 1 14 4 3 2 1Total 1 1 16 5 3 2 1

Impact Fee Update Technical Memorandum #3 (Final) Indian River County, Florida April 30, 2007 133
Existing Park Inventory (continued)
Facility NameBoat Ramp
Golf Course
Canoe Launch
Fair- ground
Dune Walk-over
Life-guard Tower
Ambersand Beach Park 1Boat IslandBlue Cypress Lake Park 2Dale Wimbrow Park 1Donald MacDonald Park 1IRC Fairgrounds 116th Street ComplexGifford ParkGolden Sands Park 1 1Grovenor Estates ParkHelen Hanson ParkHosie-Schumann ParkIRC Shooting RangeJoe S. Earman ParkKiwanis-Hobart ParkMLK ParkMoore's PointNorth County Regional ParkOslo Road Boat Ramp 1Pine Hill (Lone Pine)Roseland Community CenterRound Island Beach Park 1 1Round Island Park West 4 1Seagrape Beach Access 1Sebastian Canoe Launch Park 1South County Regional ParkTracking Station Beach Park 3 1Turtle Trail Beach Access 1Treasure Shores Park 1 1Wabasso Beach Park 2 1West Wabasso ParkWabasso School ParkWabasso Causeway Park 3 245th Street Dock
Neighborhood Parks 0 0 0 0 0 0Community Parks 0 0 1 0 0 0Regional Parks 12 0 3 1 11 5Total 12 0 4 1 11 5

Impact Fee Update Technical Memorandum #3 (Final) Indian River County, Florida April 30, 2007 134
Existing Park Inventory (continued)
Facility NameFishing
PierClay
RangeArchery Course
Rifle Range
Pistol Range
Multi-Purpose Building
Ambersand Beach ParkBoat Island 4Blue Cypress Lake Park 1Dale Wimbrow ParkDonald MacDonald Park 1 2,500IRC Fairgrounds 60,00016th Street ComplexGifford ParkGolden Sands ParkGrovenor Estates ParkHelen Hanson ParkHosie-Schumann ParkIRC Shooting Range 1 1 1 1 1,500Joe S. Earman Park 1Kiwanis-Hobart ParkMLK ParkMoore's PointNorth County Regional Park 400Oslo Road Boat RampPine Hill (Lone Pine)Roseland Community Center 1Round Island Beach ParkRound Island Park West 1Seagrape Beach AccessSebastian Canoe Launch ParkSouth County Regional Park 900Tracking Station Beach ParkTurtle Trail Beach AccessTreasure Shores ParkWabasso Beach ParkWest Wabasso ParkWabasso School ParkWabasso Causeway Park 245th Street Dock 1
Neighborhood Parks 1 0 0 0 0 0Community Parks 0 0 0 0 0 0Regional Parks 11 1 1 1 1 65,300Total 12 1 1 1 1 65,300

Impact Fee Update Technical Memorandum #3 (Final) Indian River County, Florida April 30, 2007 135
APPENDIX E: AVERAGE LAND COSTS
Table 133. Average Land Cost, 40-to-160-Acre Parcels, 2006 Parcel Identification No. City Sale Date Sale Price Acres Cost/Acre33381000001009000001.0 Vero Beach 2/200633381000001009000007.0 Vero Beach 2/200633381000001009000009.0 Vero Beach 2/200633381000001010000001.0 Vero Beach 2/200633381000001015000001.0 Vero Beach 2/200631382600000500000001.0 Vero Beach 3/2006 $6,500,000 127.67 $50,91331382600000500000001.1 Vero Beach 3/2006 $6,500,000 127.67 $50,91331382600000500000001.2 Vero Beach 3/2006 $6,500,000 127.67 $50,913Total $25,971,000 464.55 $55,906
$6,471,000 81.54 $79,360
Source: IRC Property Appraiser, February 26, 2007
Table 134. Average Land Cost, 4-to-6-Acre Parcels, 2006 Parcel Identification No. City Sale Date Sale Price Acres Cost/Acre31392900000500000045.0 Sebastian 5/2006 $800,000 4.09 $195,59933381100001014000002.2 Vero Beach 11/2006 $412,000 4.77 $86,37333381100004000000009.0 Vero Beach 6/2006 $180,000 4.60 $39,13033380300008000000006.0 Vero Beach 1/200633380300008000000007.0 Vero Beach 1/200633380300008000000008.0 Vero Beach 1/200633380300008000000010.0 Vero Beach 1/2006Total $3,283,000 17.82 $184,231
$1,891,000 4.36 $433,716
Source: IRC Property Appraiser, February 26, 2007