indian sundarbans deltaawsassets.wwfindia.org/downloads/indian_sundarbans_delta__a_visi… · 1.1...
TRANSCRIPT
1961+100
+5M +
WWF was founded in 1961
WWF has over 5 million supporters WWF has over 5,000
staff worldwide
WWF is in over 100 countries, on 5 continents
WWF in numbers
Why we are here.
www.panda.org
To stop the degradation of the planet ’s natural environment and
to build a future in which humans live in harmony with nature.
This report was printed on 100% recycled paper, in order to
reduce the ecological impact and minimise paper wastage.
WWF India, 172 B Lodhi Estate, New Delhi 110 003, India
Tel. +91 11 4361 6248 Fax +91 11 4150 4779. For contact
details and further information, please visit our website at
www.wwfindia.org
IND
5,000
ww
findia.org
100%RECYCLED
INDIAN SUNDARBANS DELTA: A VISION
Indian Sundarbans Delta A Vision
ANNUALREVIEW
2009INT
POLICY DOCUMENT
IND
2011
Anamitra Anurag Danda, Gayathri SriskanthanMarch 2011
Expert contributionsAsish Ghosh, Jayanta Bandyopadhyay, Sugata Hazra
ReviewerGertrud Denzau
This document may be cited as:Danda, Anamitra Anurag, Gayathri Sriskanthan,Asish Ghosh, Jayanta Bandyopadhyay and Sugata Hazra (2011)Indian Sundarbans Delta: A Vision (New Delhi, World Wide Fund for Nature-India)
© WWF-India, 2011All rights reserved. No part of this publication may be reproduced in anyForm or by any means without prior permission of WWF-India.
Indian Sundarbans Delta: A Vision
References
Allison, M. A., Khan, S. R., Goodbred, S. L. and Kuehl, S. A. (2003). Stratigraphic evolution of the late Holocene Ganges-Brahmaputra lower delta plain. Sedimentary Geology, 155 (3-4) pp. 317-342.
Barlow, A.C.D. (2009). The Sundarbans tiger: Adaptation, population status, and conflict management. PhD thesis. University of Minnesota.
Beaumont, L.J., Pitman, A., Perkins, S., Zimmermann, N.E. and Yoccoz N.G. (2011). Impacts of climate change on the world's most exceptional ecoregions. Proceedings of the National Academy of Sciences, 108(6) pp. 2306-2311.
Bhandari, G. (2005). Probable causes of failure of existing embankments at Sundarbans and its remedial measures. In: Workshop-cum-seminar on embankments of Sundarbans and related issues: A commemorative volume. Ed. Jana, D. Sundarbans Affairs Department, Science and Technology Department, Irrigation and Waterways Department, Government of West Bengal, pp. 62-76.
Binelli, A., Sarkar, S.K., Chatterjee, M., Riva, C., Parolini, M., Bhattacharya, B.D., Bhattacharya, A. and Satpathy, K.K. (2007). Concentration of polybrominated diphenyl ethers (PBDEs) in Sundarban mangrove wetland, north eastern part of Bay of Bengal (India). Mar Pollut Bull, 54 pp.1220-1229.
Chatterjee, S. (2004). Bird status survey of Sundarban Tiger Reserve. Naturalist, Journal of Prakriti Samsad. Vol 3 pp. 51-68.
Chaudhuri, A.B. and Choudhury, A. (1994). Mangroves of the Sundarbans, Volume 1: India. IUCN, Bangkok.
Danda, A.A. (2007). Surviving in the Sundarbans: Threats and responses. PhD thesis. University of Twente, Netherlands.
Das, A.K. and Nandi, N.C. (1999). Fauna of the Indian Sundarbans Mangal and their role in the ecosystem. In: Sundarbans Mangal. Guha Bakshi, D.N., Sanyal, P. and Naskar, K.R. (eds). Naya Prakash, Calcutta, India, pp. 417-427.
Department of Disaster Management (2005). West Bengal state disaster management policy and framework. Department of Disaster Management (DDM), Government of West Bengal.
DPD (2004). West Bengal Human Development Report. Development and Planning Department (DPD), Government of West Bengal. pp. 232.
Fisheries Department (2008). Annual report 2007-2008. Fisheries Department, Government of West Bengal.
Ghosh, M., Saha, U., Roy, S. and Talukdar, B.K. (1992). Subrecent remains of great one-horned rhinoceros from southern West Bengal, India. Current Science, 62 (8) pp. 577-580.
Gledtisch, N.P., Nords, R. and Salehyan, I. (2007). Climate Change and Conflict: The Migration Link. Coping with Crisis Working Paper Series. International Peace Academy.
Gopinath, G., and Seralathan, P. (2005). Rapid erosion of the coast of Sagar island, West Bengal –India. Environ Geol, 48 pp. 1058-1067.
Guzzella, L., Vigano, L., Sarkar, S.K., Saha, M., and Bhattacharya, A. (2005). Distribution of HCH., DDT, HCB and PAH in the sediments of coastal environments of West Bengal, northeast part of India. Environ Int, 31pp.523-534.
Hazra, S., Ghosh, T., Das Gupta, R. and Sen, G. (2002). Sea level and associated changes in the Sundarbans. Science and Culture, 68(9-12) pp. 309-321.
Hazra, S. (2010). Temporal change detection (2001-2008) of the Sundarban. Unpublished report. WWF-India.
IPCC (2007). Climate Change 2007: Synthesis report. In: Fourth Assessment Report of the Intergovernmental Panel on Climate Change. Cambridge University Press, Cambridge, United Kingdom and New York, NY, USA.
Kathiresan, K. and Rajendran, N. (2005). Grow mangroves for protecting coral reefs. SDMRI Research Publication, 9 pp. 41-48.
Kawser Ahmed, MD., Yousuf Mehedi, MD., Rezaul Haque, MD. and Ghosh, R. K. (2003). Concentration of heavy metals in two upstream rivers sediment of the Sundarbans mangrove forest, Bangladesh . Asian Jr. of Microbiol Biotech. Env Sc, 5(1) pp. 41-47.
Majumder, S.C. (2007). Pictorial Handbook on spiders of Sunderbans, West Bengal. Zoological Survey of India.
Nandy, S. and Bandyopadhyay, S. (2008). Trend of sea level change in the Hugli Estuary, West Bengal. Souvenir and Abstracts Volume, 21st Conference of Indian Institute of Geomorphology, Tripura University, 2008 pp. 83-84.
Naskar, K.R., Sharma, A.P. (2010). Coastal zone vegetation in India with reference to mangroves and need for their conservation. In: Sundarbans issues and threats. Central Inland Fisheries Research Institute and West Bengal Biodiversity Board.
Olson, D. M. and Dinerstein, E. (2002). The Global 200: Priority Ecoregions for Global Conservation. Ann Mo Bot Gar, 89 pp.199-224.
Reza, A. H. M. A., Chowdhury, M.M. and Santiapillai, C. (2000). Tiger conservation in Bangladesh. Tigerpaper, 27(1).
Sanyal, P. (1999). Sundarbans-the largest mangrove diversity on the globe. In: Sundarbans Mangal. Guha Bakshi, D.N., Sanyal, P. and Naskar, K.R. (eds). Naya Prakash, Calcutta, India, pp. 428-427.
Sanyal, P. (2005). Mangroves and the embankments. In: Workshop-cum-seminar on embankments of Sundarbans and related issues: A commemorative volume. Ed. Jana, D. Sundarbans Affairs Department, Science and Technology Department, Irrigation and Waterways Department, Government of West Bengal, pp. 88-90.
Sarkar, S. K., Saha, M., Takada, H., Bhattacharya, A., Mishra, P., and Bhattacharya, B. (2007). Water quality management in the lower stretch of the river Ganges, east coast of India: An approach through environmental education. Journal for Cleaner Production, 15(16) pp. 1459-1467.
Singh, O.P. (2002). Interannual variability and predictability of sea level along the Indian coast. Theoretical and Applied Climatology, 72(1-2) pp. 11-28.
Singh, O.P. (2007). Long-term trends in the frequency of severe cyclones of Bay of Bengal: Observations and simulations. Mausam, 58(1) pp. 59-66.
Sinha Ray, S.P. (2010). Status of Ground Water Condition in Sundarban area, West Bengal. Commissioned report. WWF-India.
Spalding, M., Kainuma, M.,Collins, L. (2010). World Mangrove Atlas. Earthscan.
State Planning Board (2007a). Eleventh Five Year Plan for West Bengal: 2007-2008 to 2011-2012. Planning Commission, Government of India.
State Planning Board (2007b). Approach to the Eleventh Five-Year Plan (2007-08 to 2011-12) for West Bengal. Planning Commission, Government of India.
IllustrationsArnab Roy
MapsAbhijit Choudhury
Processing & PrintingYES
Preface
The Vision Document has been created in response to a priority action
point identified at a multi-stakeholder workshop held in Kolkata, in March
2009, on Sundarbans: Climate Change Impacts and Adaptation.
The priority action point was identified because of consensus among the
participants that highly informed policy decisions are necessary to guide
action to cope with pressures of predicted changes in the Sundarbans
ecoregion. The mere fact that population is growing means that regardless
of climate change, more people will be put in harm's way. With climate
change, new adaptive solutions are needed to prevent exposing the
population to these impacts and to reduce their vulnerability.
So far, the pattern of governance in the Indian Sundarbans Delta has
struggled to keep up with the management and development challenges
posed by this complex system. In the absence of the needed new adaptive
solutions this environmentally and economically important area is rapidly
heading towards an uncertain future. In view of the grave situation facing
the Indian Sundarbans Delta, WWF, in the course of conservation work in
the region, is suggesting an alternative scenario to the “business as usual”
informed by the best available current knowledge and research. The aim of
this alternative scenario is to stimulate reasoned public discussion.
This is an abridged version of the base document that captured the current
available knowledge which was thoroughly reviewed and commented upon
by Graham Chapman, Nico Schulte Nordholt and Rabindra Nath
Bhattacharya.
A limited circulation of the base document among technocrats resulted in
the demand for an abridged version. To accommodate this demand, the
core group of advisors went beyond their original remit and time
commitment to help produce this document.
Academicians, technocrats and bureaucrats, too large a number to mention
individually, readily shared their knowledge and experience, as well as
literature. The Sundarban Development Board and the School of
Oceanographic Studies, Jadavpur University hosted consultative sessions.
A complete list will be appended to the base document. The base document
will be a useful reference material for researchers interested in the Indian
Sundarbans Delta, and will be published at a later date.
WWF-India received generous financial, technical, and human resource
support from WWF offices in the Netherlands and UK for developing this
Vision Document.
Table of contents
1. Indian Sundarbans Delta: A profile 1
1.1 Ecological profile 1
1.2 Socio-economic profile 11
2. Governance and policies 15
3. Drivers of change 27
3.1 Climate 27
3.1.1 Sea level rise 27
3.1.2 Temperature change 28
3.1.3 Changes in precipitation and cyclone activity 28
3.2 Population 29
3.3 Market 29
4. Impacts of drivers 31
4.1 Natural environment 31
4.2 Socio-economic 32
5. Indian Sundarbans Delta in 2050: A vision 35
5.1 Background 35
5.2 Delta Vision 37
5.3 Analysis 40
5.4 Public consultation 40
1.1 Ecological profile
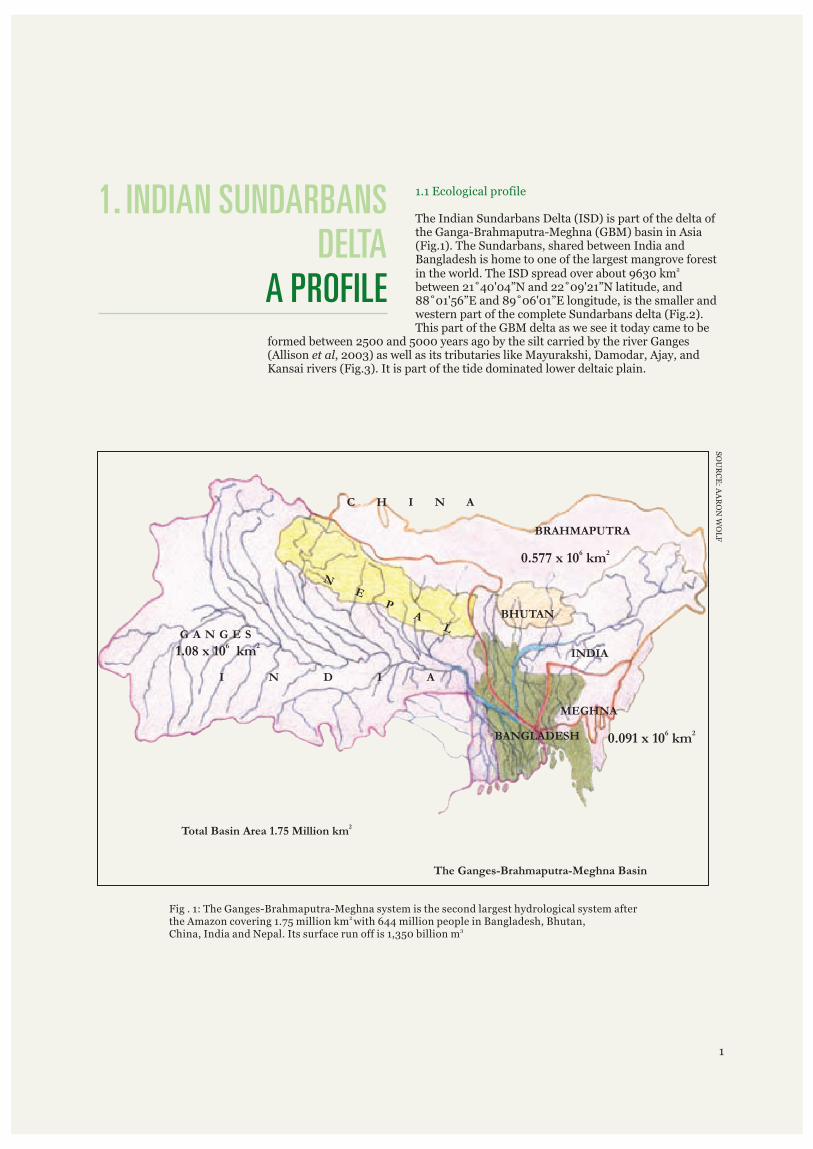
The Indian Sundarbans Delta (ISD) is part of the delta of the Ganga-Brahmaputra-Meghna (GBM) basin in Asia (Fig.1). The Sundarbans, shared between India and Bangladesh is home to one of the largest mangrove forest in the world. The ISD spread over about 9630 between 21˚40'04”N and 22˚09'21”N latitude, and 88˚01'56”E and 89˚06'01”E longitude, is the smaller and western part of the complete Sundarbans delta (Fig.2). This part of the GBM delta as we see it today came to be
formed between 2500 and 5000 years ago by the silt carried by the river Ganges (Allison et al, 2003) as well as its tributaries like Mayurakshi, Damodar, Ajay, and Kansai rivers (Fig.3). It is part of the tide dominated lower deltaic plain.
2km
1. INDIAN SUNDARBANS DELTA
A PROFILE
1
Fig . 1: The Ganges-Brahmaputra-Meghna system is the second largest hydrological system after 2 the Amazon covering 1.75 million km with 644 million people in Bangladesh, Bhutan,
3China, India and Nepal. Its surface run off is 1,350 billion m
The Ganges-Brahmaputra-Meghna Basin
2Total Basin Area 1.75 Million km
BANGLADESH 6 20.091 x 10 km
SO
UR
CE
: AA
RO
N W
OL
F
C H I N A
BRAHMAPUTRA
NE
PA
LBHUTAN
6 20.577 x 10 km
G A N G E S
INDIA
I N D I A
MEGHNA
6 21.08 x 10 km
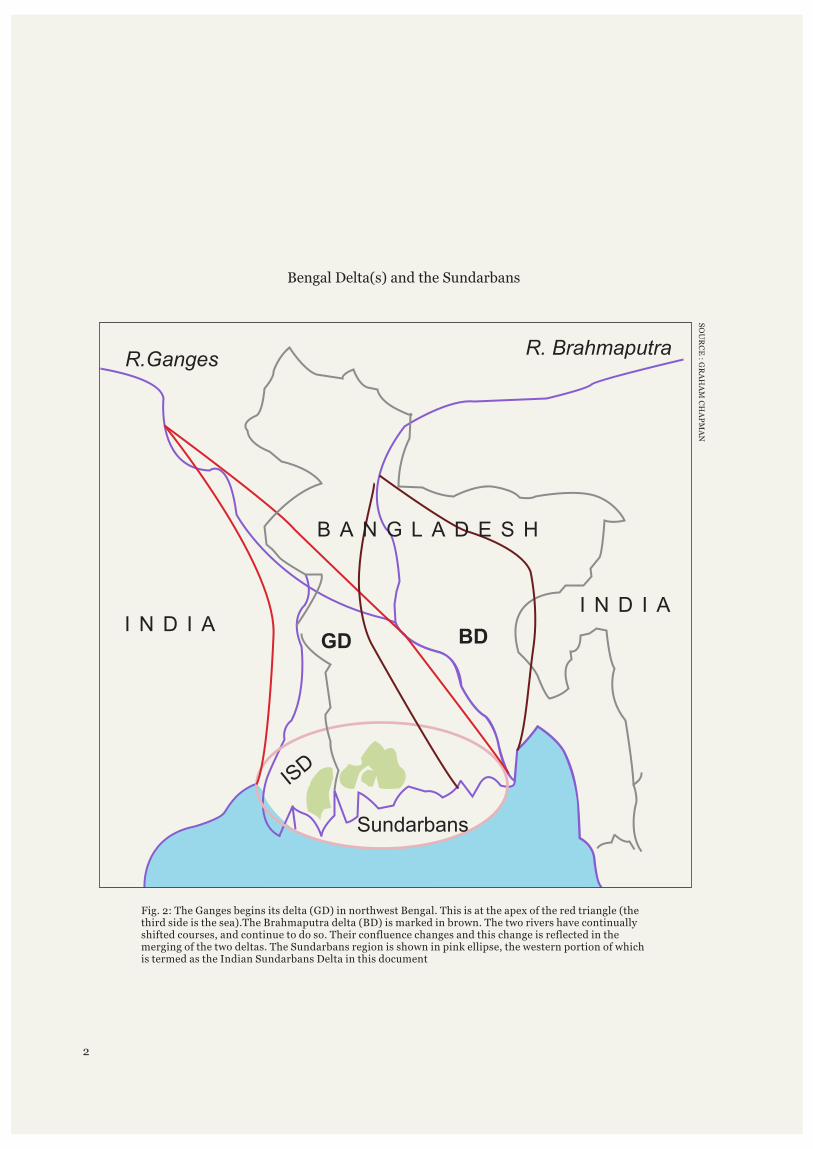
Fig. 2: The Ganges begins its delta (GD) in northwest Bengal. This is at the apex of the red triangle (the third side is the sea).The Brahmaputra delta (BD) is marked in brown. The two rivers have continually shifted courses, and continue to do so. Their confluence changes and this change is reflected in the merging of the two deltas. The Sundarbans region is shown in pink ellipse, the western portion of which is termed as the Indian Sundarbans Delta in this document
2
Bengal Delta(s) and the Sundarbans
SO
UR
CE
: GR
AH
AM
CH
AP
MA
N
GD BD
Sundarbans
ISD
R.GangesR. Brahmaputra
B A N G L A D E S H
I N D I AI N D I A
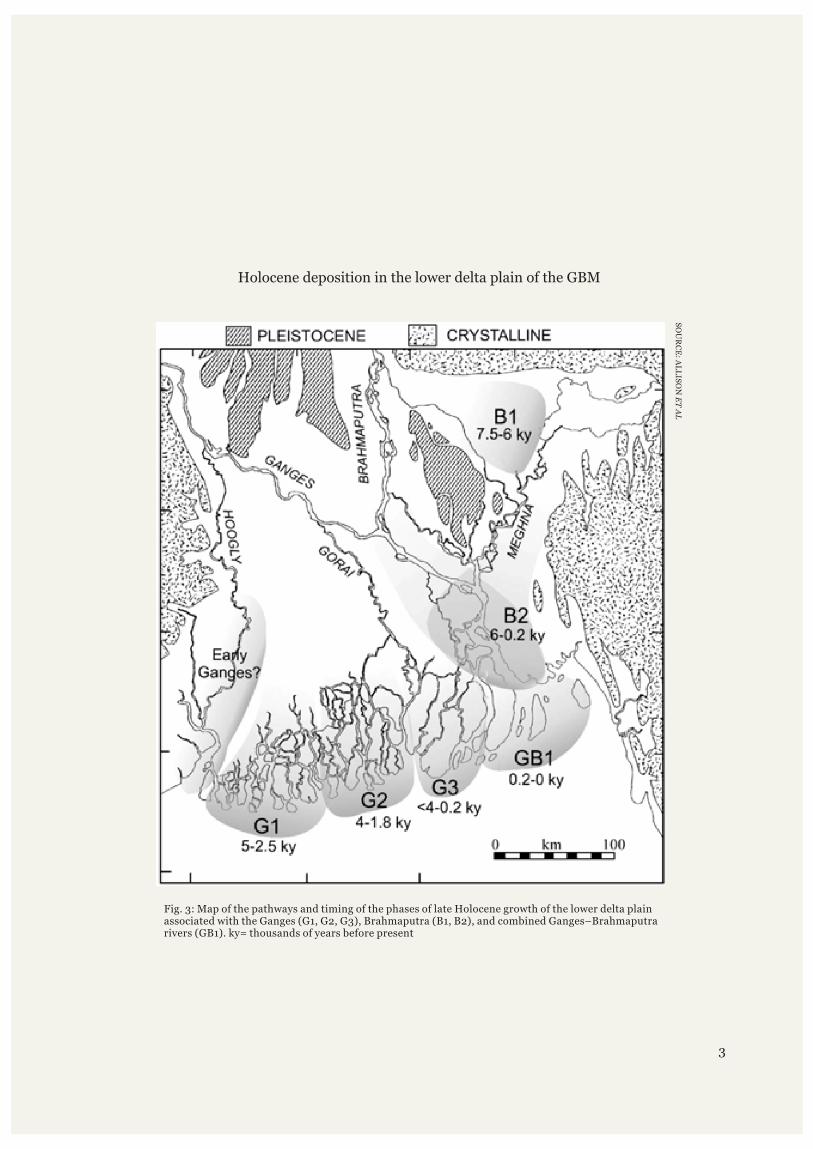
Fig. 3: Map of the pathways and timing of the phases of late Holocene growth of the lower delta plain associated with the Ganges (G1, G2, G3), Brahmaputra (B1, B2), and combined Ganges–Brahmaputra rivers (GB1). ky= thousands of years before present
Holocene deposition in the lower delta plain of the GBM
3
SO
UR
CE
: AL
LIS
ON
ET
AL
4
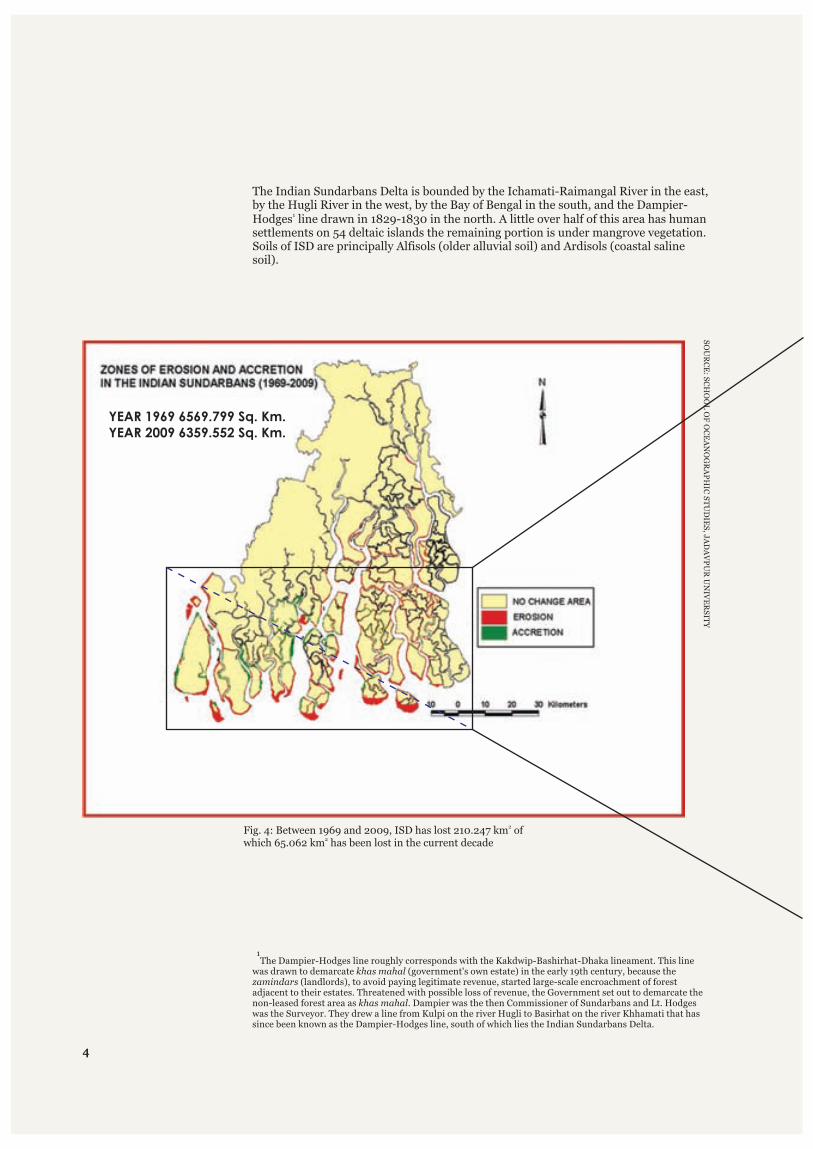
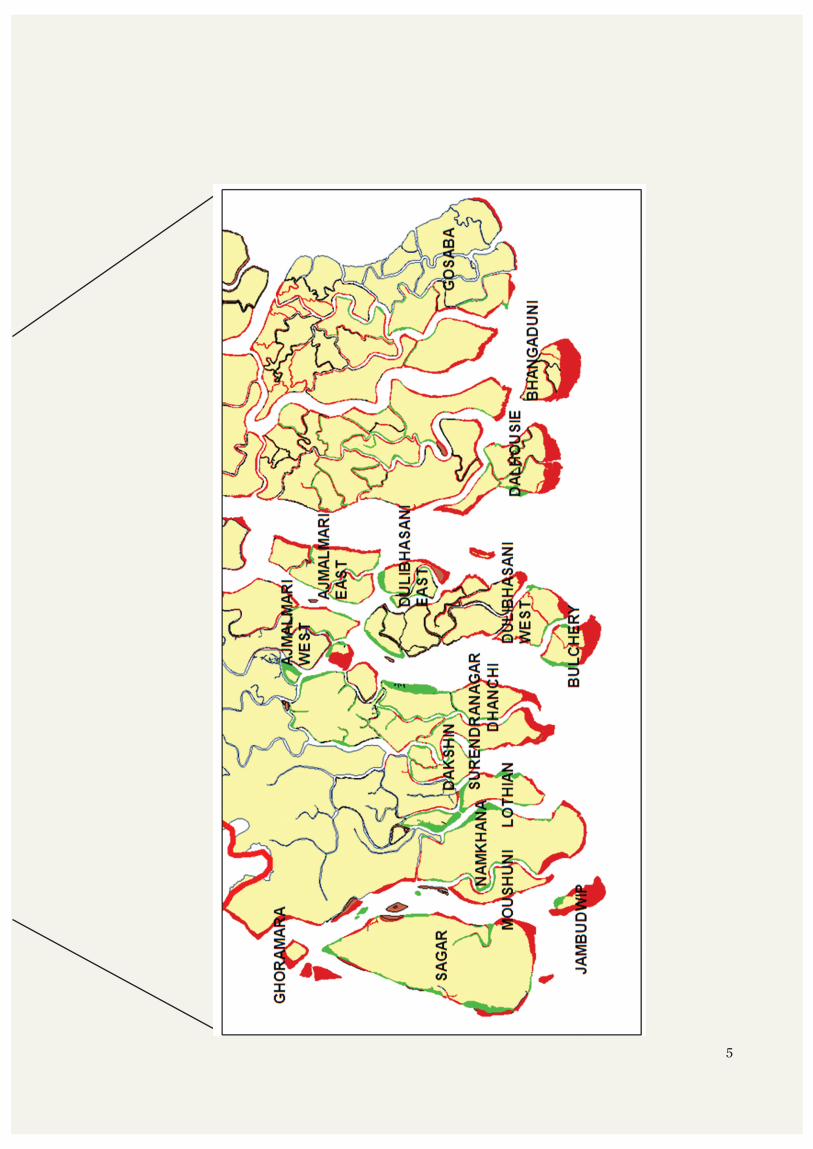
2Fig. 4: Between 1969 and 2009, ISD has lost 210.247 km of 2which 65.062 km has been lost in the current decade
SO
UR
CE
: SC
HO
OL
OF
OC
EA
NO
GR
AP
HIC
ST
UD
IES
, JA
DA
VP
UR
UN
IVE
RS
ITY
1 The Dampier-Hodges line roughly corresponds with the Kakdwip-Bashirhat-Dhaka lineament. This line was drawn to demarcate khas mahal (government's own estate) in the early 19th century, because the zamindars (landlords), to avoid paying legitimate revenue, started large-scale encroachment of forest adjacent to their estates. Threatened with possible loss of revenue, the Government set out to demarcate the non-leased forest area as khas mahal. Dampier was the then Commissioner of Sundarbans and Lt. Hodges was the Surveyor. They drew a line from Kulpi on the river Hugli to Basirhat on the river Khhamati that has since been known as the Dampier-Hodges line, south of which lies the Indian Sundarbans Delta.
The Indian Sundarbans Delta is bounded by the Ichamati-Raimangal River in the east, by the Hugli River in the west, by the Bay of Bengal in the south, and the Dampier-
1Hodges line drawn in 1829-1830 in the north. A little over half of this area has human settlements on 54 deltaic islands the remaining portion is under mangrove vegetation. Soils of ISD are principally Alfisols (older alluvial soil) and Ardisols (coastal saline soil).
4
YEAR 1969 6569.799 Sq. Km.YEAR 2009 6359.552 Sq. Km.
5
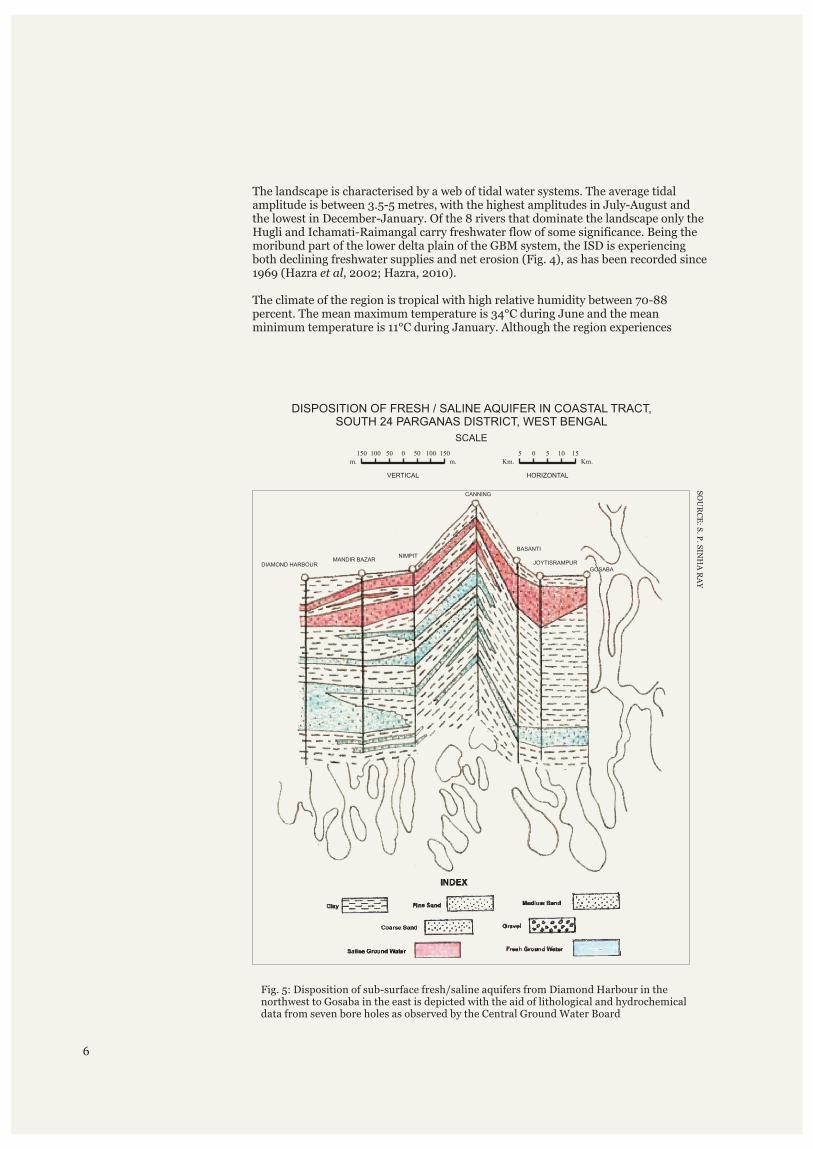
Fig. 5: Disposition of sub-surface fresh/saline aquifers from Diamond Harbour in the northwest to Gosaba in the east is depicted with the aid of lithological and hydrochemical data from seven bore holes as observed by the Central Ground Water Board
DISPOSITION OF FRESH / SALINE AQUIFER IN COASTAL TRACT,SOUTH 24 PARGANAS DISTRICT, WEST BENGAL
SCALE
150 100 50 0 50 100 150m. m.
5 0 5 10 15 Km. Km.
VERTICAL HORIZONTAL
The landscape is characterised by a web of tidal water systems. The average tidal amplitude is between 3.5-5 metres, with the highest amplitudes in July-August and the lowest in December-January. Of the 8 rivers that dominate the landscape only the Hugli and Ichamati-Raimangal carry freshwater flow of some significance. Being the moribund part of the lower delta plain of the GBM system, the ISD is experiencing both declining freshwater supplies and net erosion (Fig. 4), as has been recorded since 1969 (Hazra et al, 2002; Hazra, 2010).
The climate of the region is tropical with high relative humidity between 70-88 percent. The mean maximum temperature is 34°C during June and the mean minimum temperature is 11°C during January. Although the region experiences
6
CANNING
MANDIR BAZAR NIMPIT
BASANTI
JOYTISRAMPUR GOSABA
DIAMOND HARBOUR
SO
UR
CE
: S. P
. SIN
HA
RA
Y
occasional rains through most of the year barring January and February (Chaudhuri and Choudhury 1994), the monsoon period, which occurs between June and October accounts for about 80 percent of the annual precipitation. The ISD is prone to extreme storm events which are frequent during the pre-monsoon period, and from September through November. Historical records indicate a high frequency of extreme weather events, such as severe storms or cyclones.
There are three aquifer zones in the ISD (Fig.5), the shallower one occurs within 60m below ground level (bgl) which is mostly brackish. The second zone occurring between 70-160m bgl is also brackish. The third aquifer zone, fresh in nature (sweet water), occurs in the 160 m to 400m zone. The saline water aquifers at the top are separated from the underlying freshwater group of aquifers by a thick clay layer varying in thickness from 4m at Gangasagar to 120m at Kultali; the general thickness of the intervening clay blanket is between 20-50m (Sinha Ray, 2010).
A pronounced ecological change is evolving in this delta due to huge discharges of untreated domestic and industrial effluents carried by tributary rivers as well as the disposal of contaminated mud from harbour dredging and resulting from the rapid emergence of the Haldia Port Complex, a major oil disembarkment terminal in eastern India. The Sundarbans delta has become susceptible to chemical pollutants such as heavy metals, organochlorine pesticides, polychlorinated biphenyls and polycyclic aromatic hydrocarbons which may have changed the estuary's geochemistry and affected the local coastal environment (Sarkar et al, 2007; Guzzella et al, 2005; Binelli et al, 2007). Due to a diversity of inputs such as agricultural runoffs, wastewater and sewage discharges, and agricultural wastes, maximum concentrations of organochlorine pesticide residues were recorded at sites located along the main stream of the Hugli (Ganges) estuary. Among the hexachlorocyclohexane isomers (HCHs) and dichlorodiphenyltrichloroethane DDTs, β-HCH and DDE predominate. From an eco-toxicological point of view, the impacts of DDT and HCH are much pronounced.
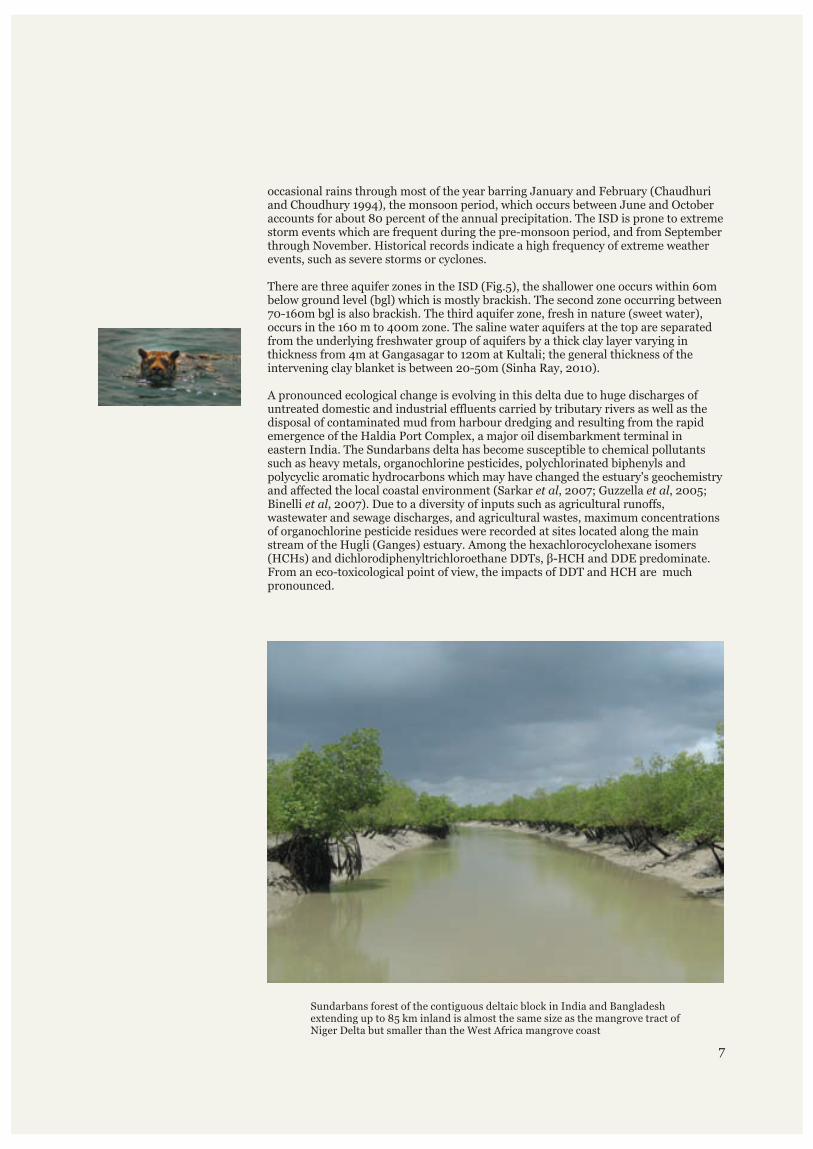
Sundarbans forest of the contiguous deltaic block in India and Bangladeshextending up to 85 km inland is almost the same size as the mangrove tract of Niger Delta but smaller than the West Africa mangrove coast
7
8
Groups/common name Scientific name IUCN Red List Status
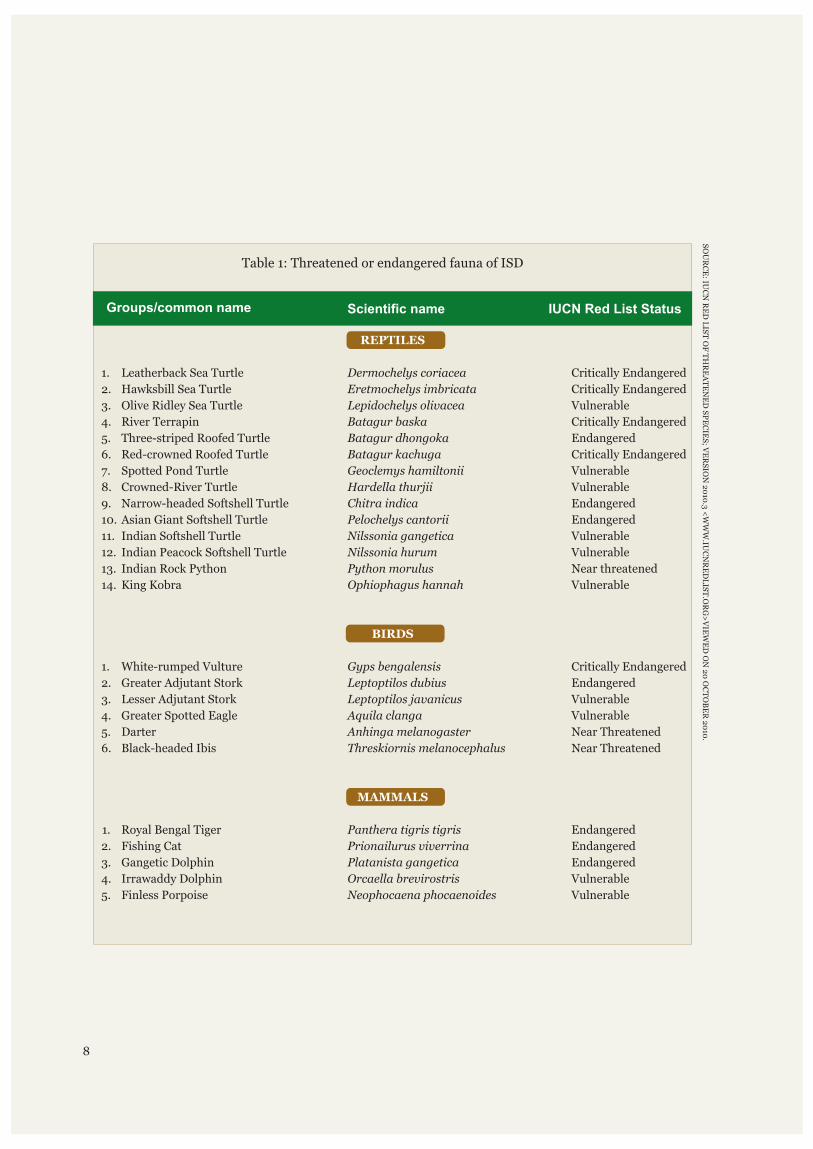
Table 1: Threatened or endangered fauna of ISD
REPTILES
BIRDS
MAMMALS
1. Leatherback Sea Turtle Dermochelys coriacea Critically Endangered
2. Hawksbill Sea Turtle Eretmochelys imbricata Critically Endangered
3. Olive Ridley Sea Turtle Lepidochelys olivacea Vulnerable
4. River Terrapin Batagur baska Critically Endangered
5. Three-striped Roofed Turtle Batagur dhongoka Endangered
6. Red-crowned Roofed Turtle Batagur kachuga Critically Endangered
7. Spotted Pond Turtle Geoclemys hamiltonii Vulnerable
8. Crowned-River Turtle Hardella thurjii Vulnerable
9. Narrow-headed Softshell Turtle Chitra indica Endangered
10. Asian Giant Softshell Turtle Pelochelys cantorii Endangered
11. Indian Softshell Turtle Nilssonia gangetica Vulnerable
12. Indian Peacock Softshell Turtle Nilssonia hurum Vulnerable
13. Indian Rock Python Python morulus Near threatened
14. King Kobra Ophiophagus hannah Vulnerable
1. White-rumped Vulture Gyps bengalensis Critically Endangered
2. Greater Adjutant Stork Leptoptilos dubius Endangered
3. Lesser Adjutant Stork Leptoptilos javanicus Vulnerable
4. Greater Spotted Eagle Aquila clanga Vulnerable
5. Darter Anhinga melanogaster Near Threatened
6. Black-headed Ibis Threskiornis melanocephalus Near Threatened
1. Royal Bengal Tiger Panthera tigris tigris Endangered
2. Fishing Cat Prionailurus viverrina Endangered
3. Gangetic Dolphin Platanista gangetica Endangered
4. Irrawaddy Dolphin Orcaella brevirostris Vulnerable
5. Finless Porpoise Neophocaena phocaenoides Vulnerable
SO
UR
CE
: IUC
N R
ED
LIS
T O
F T
HR
EA
TE
NE
D S
PE
CIE
S; V
ER
SIO
N 2
010
.3 <
WW
W.IU
CN
RE
DL
IST
.OR
G>
VIE
WE
D O
N 2
0 O
CT
OB
ER
20
10.
Although resource estimation of ground water has not been carried out, utilising Darcy's Law, it has been calculated that rate of ground water flow across the southern boundary of Sundarbans is around 68MCM/year. The strata below 170m bgl can therefore be tapped in a number of Community Development (CD) Blocks. The quality of ground water in deeper aquifers occurring between 160-400m depth is generally within permissible limits of drinking water standards set by the Bureau of Indian Standards and is arsenic free; pH ranges between 7.8 and 8.2 indicating slight alkalinity (ibid).
As home to a significant portion of one of the world's largest contiguous block of mangrove forests, the portion under natural vegetation in ISD holds a prominent global place and a part of it has been designated as UNESCO World Heritage site in 1987 in recognition of its high biodiversity as well as the occurrence of endangered and highly threatened species, including the only population of tigers found in a coastal mangrove habitat.
The most prominent feature of the ISD is the ubiquitous mangrove ecosystem that dominates the landscape. The ISD accounts for 85 per cent of all mangrove habitats found in India; 63 of the 69 mangrove plant species found in the country exist in the ISD (Kathiresan and Rajendran, 2005). More recent research suggests that the area may hold up to 140 mangrove, mangrove associates, back mangrove and coastal zone flora (Naskar, 2010). At least, seven of these mangrove species or species group are threatened and require immediate conservation measures, viz., Aegiceras corniculatum, Heritiera fomes, Kandelia kandel, Nypa fruticans, Rhizophora spp., S. apetala and S. caseolaris (Chaudhuri and Choudhury, 1994).
Although records for most faunal groups are fragmented and different estimates for species numbers exist, Das and Nandi (1999) provide a total of 1434 recorded species. However, recent estimates for certain phyla and orders illustrate that this is a continually shifting tally; for instance, more recent studies have more than tripled the number of recorded arachnids from ISD (Majumder, 2007).
The mangroves of the ISD perform a variety of ecosystem services. They release about 6,000 tonnes/ha of litter over the course of a year, contributing vast amounts of organic nutrients that support a range of ecosystem functions, including estuarine and coastal fisheries for ecologically and commercially important species. They also act as a barrier to the cyclones and storm surges, a role that is very important for the protection of human settlements to the north. Alterations to and removal of mangrove vegetation over time have led to a number of extirpations (local extinctions) as well as the contraction of habitat for a number of species. Six species are known to now be extirpated from ISD, namely: the water buffalo (Bubalus bubalis); the swamp deer (Cervus duvaucelli); the Javan rhinoceros (Rhinoceros sondaicus); the great Indian one-horned rhinoceros (Rhinoceros unicornis); the gharial (Gavialis gangeticus); and the chitra turtle (Chitra indica) (Chaudhuri and Choudhury 1994, Sanyal 1999). Although there is no agreement among experts about past occurrence of R. Unicornis in the region, there are published accounts claiming its historical presence in the region (Ghosh, 1992; Reza et al, 2000). The barking deer (Muntiacus muntjak) is also possibly locally extinct as it was last sighted in the 1970s (Sanyal 1999, Chatterjee 2004). A list of faunal species that are currently classified as threatened or endangered is given in Table 1. The majority of these find place in the schedules of Indian Wildlife (Protection) Act, 1972, amended to date and/or IUCN Red Data Book.
Amongst the rich biodiversity of Indian Sundarbans Delta, at
least 13 reptiles, 6 birds and 5 mammals are
currently classified as threatened or endangered
9
Blue fiddler crab
White-bellied sea eagle
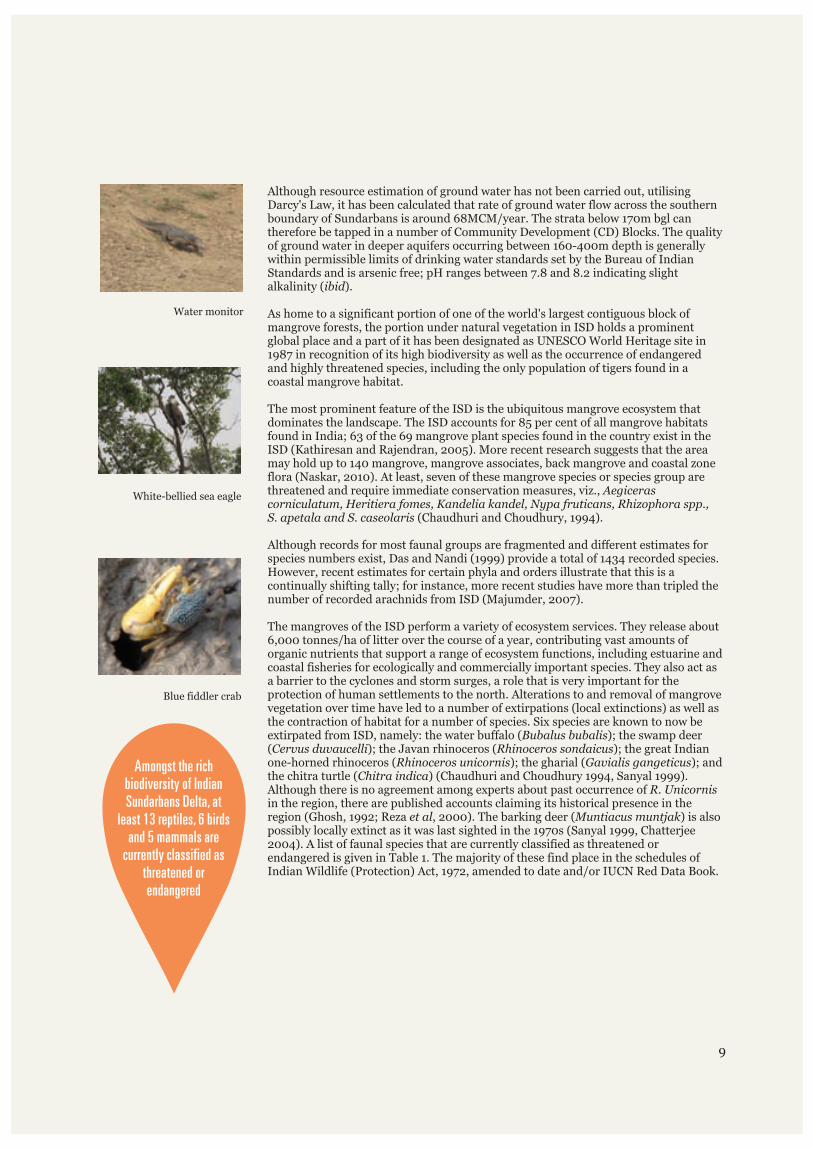
Water monitor
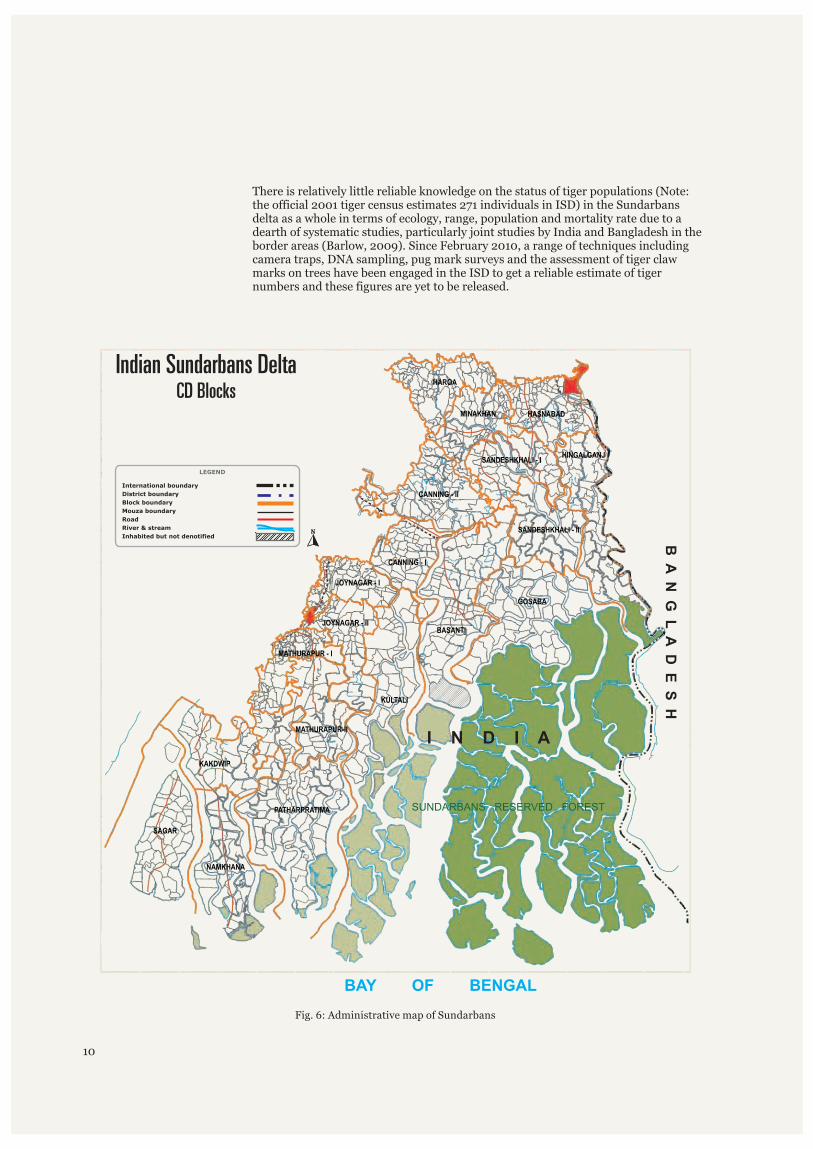
There is relatively little reliable knowledge on the status of tiger populations (Note: the official 2001 tiger census estimates 271 individuals in ISD) in the Sundarbans delta as a whole in terms of ecology, range, population and mortality rate due to a dearth of systematic studies, particularly joint studies by India and Bangladesh in the border areas (Barlow, 2009). Since February 2010, a range of techniques including camera traps, DNA sampling, pug mark surveys and the assessment of tiger claw marks on trees have been engaged in the ISD to get a reliable estimate of tiger numbers and these figures are yet to be released.
10
I N D I A
B A
N G
L A
D E
S H
SUNDARBANS RESERVED FOREST
BAY OF BENGAL
Indian Sundarbans DeltaCD Blocks
International boundary
District boundary
Block boundary
Mouza boundary
Road
River & stream
Inhabited but not denotified
LEGEND
HINGALGANJ
GOSABA
SANDESHKHALI - II
BASANTI
KULTALI
PATHARPRATIMA
MATHURAPUR-II
KAKDWIP
SAGAR
NAMKHANA
HAROA
HASNABADMINAKHAN
SANDESHKHALI - I
CANNING - II
CANNING - I
JOYNAGAR - I
JOYNAGAR - II
MATHURAPUR - I
Fig. 6: Administrative map of Sundarbans
1.2 Socio-economic profile
Although rain fed agriculture is the mainstay of the economy in the ISD, the socio-economic profile is not uniform throughout the inhabited part of the ISD. This differentiation is due to geographical characteristics, population composition and their background, access to different sets of resources and subsequent occupational specialisation, and the non-uniform pace of socio-economic transformation through the region.
The main economic activity in the ISD, rain-fed paddy agriculture, is made possible by the construction of earthen embankments to keep brackish tidal water at bay. Historically, in the Sundarbans salt-tolerant paddy varieties such as Matla and Hamilton could be cultivated on raised sections of the islands without embankments. However, while searching for the six locally recalled salt-tolerant farmers' paddy varieties, NBPGR informed availability of only two varieties; others developed over centuries are believed to have been lost under the onslaught of “green revolution”
2(Pers. comm. to Asish Ghosh, National Bureau of Plant Genetic Resources, 2010) .Administratively, the inhabited part of the ISD is composed of 19 CD Blocks (sub-districts) (Fig. 6). Two out of the 19 CD Blocks viz. Sagar and Gosaba have no road connection with other islands, which makes these Blocks rather isolated and remote. However, these two Blocks have a number of other positive attributes that compensate for some of the disadvantages due to remoteness. Sagar Island is culturally considered to be the end of the river Ganga and the island is known to the Hindu pilgrims as “Ganga Sagar”. Around the middle of January every year on the day of Makar Sankranti, the southern tip of Sagar attracts pilgrims from all over India, in hundreds of thousands. A huge infrastructural set up is in place to cater to this large influx which the local population can take advantage of through the year. This includes a large rural hospital and a wide all-weather road running through the length of the island. Similarly, the main entry point to the Sundarban Tiger Reserve adjoins the otherwise remote Gosaba CD Block and therefore, income from tourism is the highest here compared to other Blocks adjoining forest in the ISD. However, the forest fringe villages in the four CD Blocks of Kultali, Basanti, Gosaba and Hingulganj are witness to intensifying human-wildlife conflict with the ISD's tiger population that has resulted in considerable loss of human life.
The CD Blocks that are closer and better connected to Kolkata and the district headquarters enjoy greater advantages in terms of opportunities and access to services such as grid electricity.
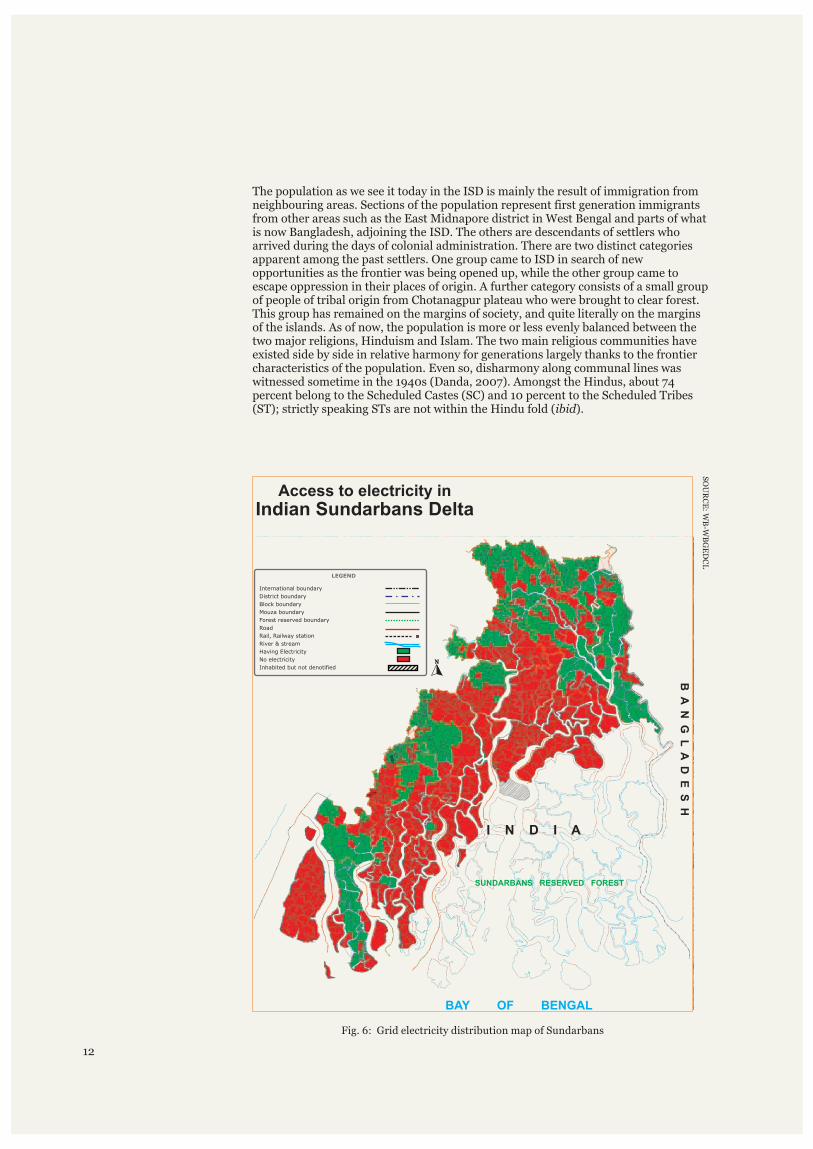
Lack of access to modern energy services (Fig. 7) limits opportunities in the more remote islands of the ISD. For instance, perishables such as fish and vegetables fetch smaller profits in the absence of facilities for storage and/or value addition. Poor access to energy services and the consequent lack of opportunities is further compounded by very high population density and poverty in the ISD; an extremely high proportion of the population (about 34 percent) subsists below the poverty line. This is accompanied by a high dependence on the natural system for biomass and other terrestrial and aquatic resources leading to further degradation of the natural ecosystem.
11
2 In July 2010, WWF-India was informed by Dr. Asish Ghosh about the possibility of accessing seeds of 'Hamilton' paddy from Department of Agricultural Sciences, University of Calcutta. Only 25 grains of Hamilton paddy could be obtained from the Calcutta University farm in Baruipur, a little south of Kolkata. While 15 of these grains were passed on to Dr. Debal Deb, noted rice scientist, other 10 grains were passed on to Umapati Sarkar, a farmer from Sandeshkhali II CD Block for further propagation. Both Dr. Deb and Mr. Sarkar were successful in multiplying the number of seeds. Dr. Deb informed that tests showed that Hamilton can withstand 14 ppt salinity. If ultimately re-introduced into the region, it could significantly enhance adaptive capacity of the farmers against recurrent salt water inundation.
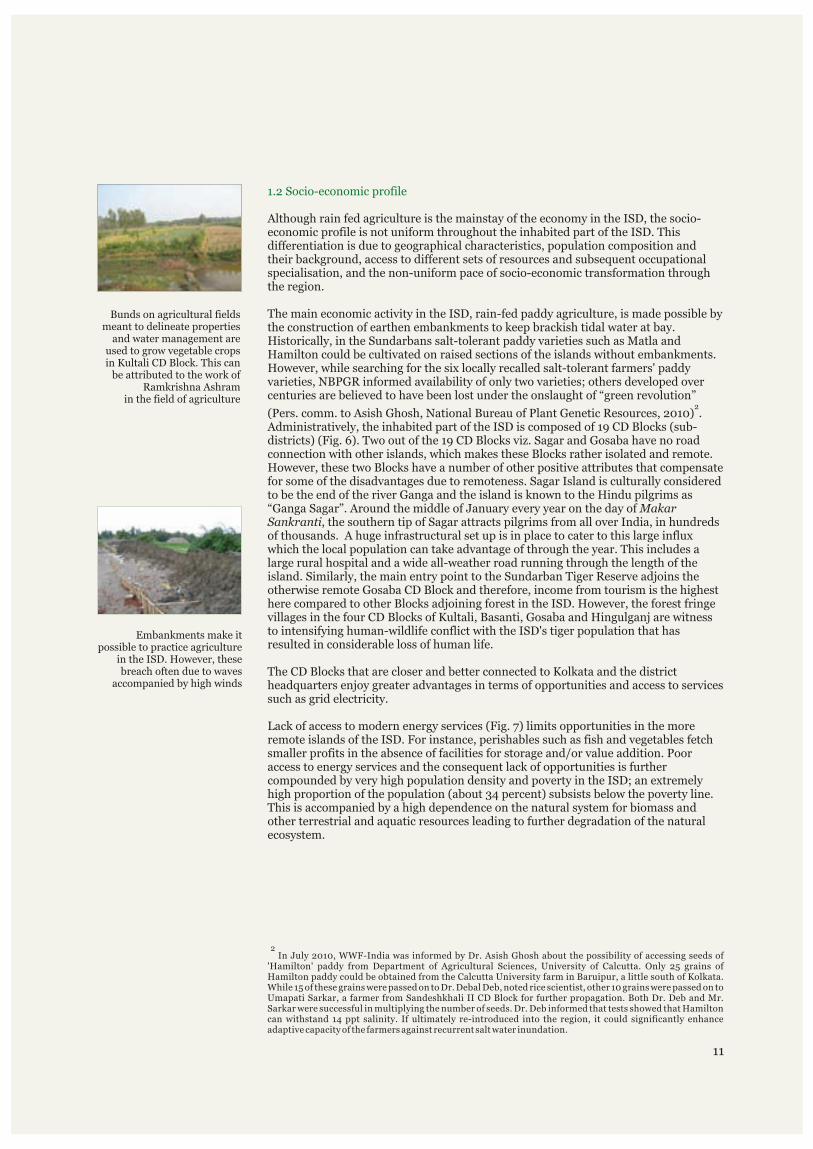
Embankments make it possible to practice agriculture
in the ISD. However, these breach often due to waves
accompanied by high winds
Bunds on agricultural fields meant to delineate properties
and water management are used to grow vegetable crops in Kultali CD Block. This can
be attributed to the work of Ramkrishna Ashram
in the field of agriculture
The population as we see it today in the ISD is mainly the result of immigration from neighbouring areas. Sections of the population represent first generation immigrants from other areas such as the East Midnapore district in West Bengal and parts of what is now Bangladesh, adjoining the ISD. The others are descendants of settlers who arrived during the days of colonial administration. There are two distinct categories apparent among the past settlers. One group came to ISD in search of new opportunities as the frontier was being opened up, while the other group came to escape oppression in their places of origin. A further category consists of a small group of people of tribal origin from Chotanagpur plateau who were brought to clear forest. This group has remained on the margins of society, and quite literally on the margins of the islands. As of now, the population is more or less evenly balanced between the two major religions, Hinduism and Islam. The two main religious communities have existed side by side in relative harmony for generations largely thanks to the frontier characteristics of the population. Even so, disharmony along communal lines was witnessed sometime in the 1940s (Danda, 2007). Amongst the Hindus, about 74 percent belong to the Scheduled Castes (SC) and 10 percent to the Scheduled Tribes (ST); strictly speaking STs are not within the Hindu fold (ibid).
12
International boundary
District boundary
Block boundary
Mouza boundary
Forest reserved boundary
Road
Rail, Railway station
River & stream
Having Electricity
No electricity
Inhabited but not denotified
LEGEND
Access to electricity inIndian Sundarbans Delta
I N D I A
B A
N G
L A
D E
S H
SUNDARBANS RESERVED FOREST
BAY OF BENGAL
SO
UR
CE
: WB
-WB
GE
DC
L
Fig. 6: Grid electricity distribution map of Sundarbans
In the ISD caste and religious identities are not found to be a strong determining factor of access to opportunities possibly for two reasons, (i) land reforms and land distribution undertaken by the state government, and (ii) rapid physical changes along the edges of the islands. It is common to find caste fishermen to be marginal farmers and caste farmers to be fishermen. Access to resources is also determined by geographical location. For example, moving west to east, in decreasing order, we find significant sections of population engaged in coastal fishery in Kakdwip, Namkhana, Patharpratima, Kultali and Mathurapur II blocks but not further east whereas further east, we find sections of population again in decreasing order, engaged in the extraction of resources such as biomass, honey, fish etc, from forests and water courses within forest area. Here, it is important to note that while coastal fisheries are open-access, forest access is regulated.
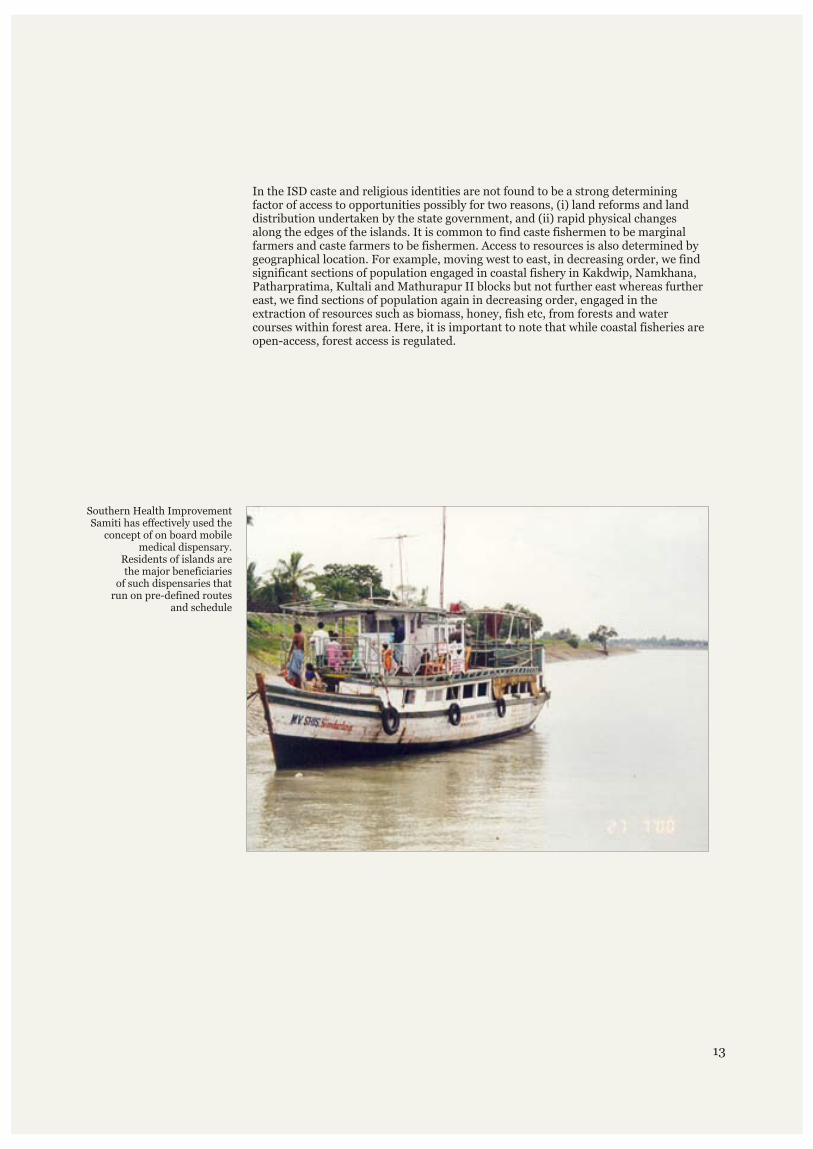
Southern Health ImprovementSamiti has effectively used the
concept of on board mobile medical dispensary.
Residents of islands are the major beneficiaries
of such dispensaries that run on pre-defined routes
and schedule
13
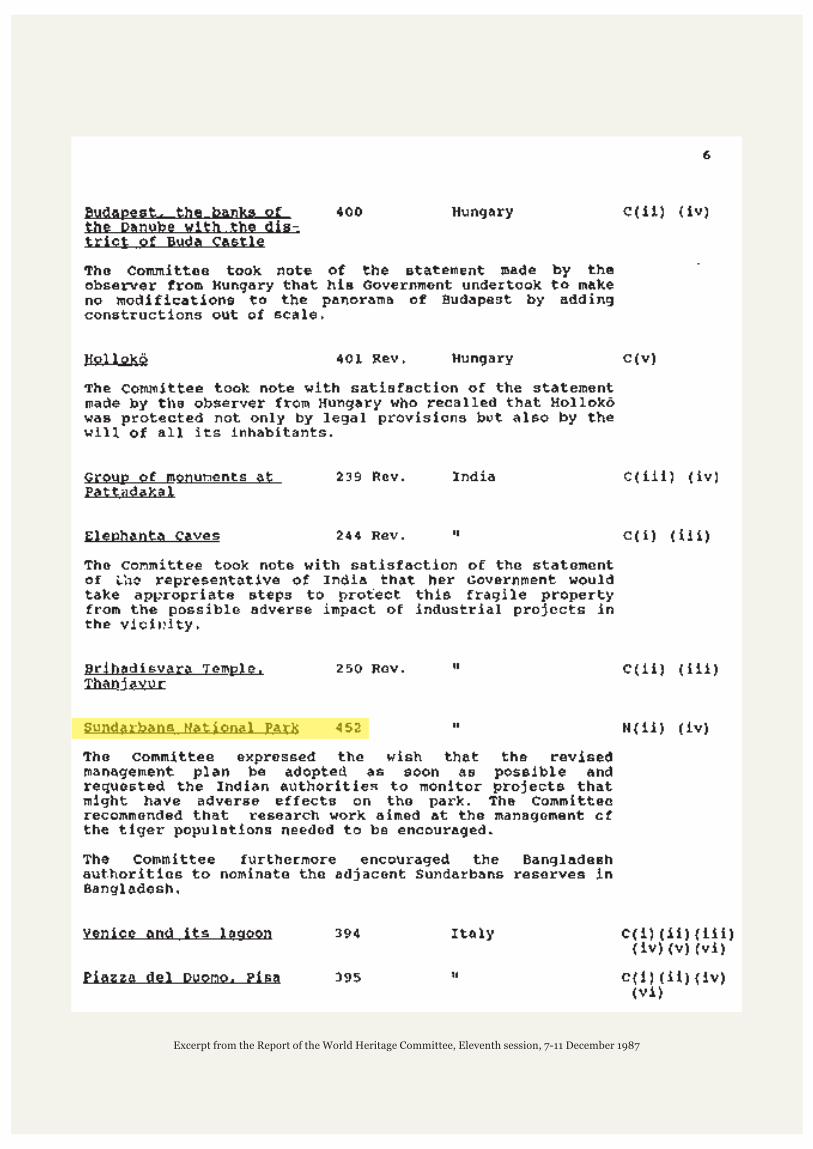
Excerpt from the Report of the World Heritage Committee, Eleventh session, 7-11 December 1987
Of the 9,630 km of land that comprises the ISD, about 4,260 km is classified as reserved forest under the exclusive jurisdiction of the state Forest Department. In December 1878, the colonial administration notified the Sundarbans forest as 'Protected Forest'. These were lands that could be opened for reclamation/conversion to agriculture with the consent of the Forest Department. By designating the 24-Parganas tidal forests
as 'Protected' rather than 'Reserved' forests, the Forest Department left itself an option: it could either lease these lands for clearing and conversion to farming, or it could transfer them to timber production and management as reserved forests. By May 1943, all residual 'Protected' forest was reclassified as 'Reserved' forest to forestall any further reclamation/conversion. This forested part of ISD as we see it today is overseen by the Director of the Sundarban Biosphere Reserve (SBR) through the Divisional Forest Officer of 24-Parganas (South) Forest Divisions and the Field Director of the Sundarban Tiger Reserve which came into being through a notification in December 1973. All of the ISD was declared as Biosphere Reserve in March 1989 but the human inhabited part is de jure not under the jurisdiction of the Director of Biosphere Reserve.
The Sundarban National Park within the Tiger Reserve was declared a World Heritage Site in 1987 and is provided with the highest level of official protection, classified as a Category Ia (Strict Nature Reserve) Protected Area under the IUCN classification system. Despite the categorisation, the Forest Department is rather constrained by the lack of adequate staff and infrastructure in its regular activity of protection, and this fact also constrains opportunities for research regarding ecosystem functioning and health.
In order to improve consideration of environmental sustainability issues, conservation, and social and economic values of forests, the National Forest Policy was redrafted in 1988, which subsequently led to the Joint Forest Management Resolution of 1990. In accordance with this policy shift, the Government of West Bengal issued two specific guidelines in 1991 and 1996, both of which have a bearing on the management of Sundarbans forest. These are (1) Mangrove forest areas of Sundarbans, and (2) National Parks and Sanctuaries of the State respectively.
Based on these notifications community based committees, devised to increase community involvement in ecosystem management as well as to redistribute the benefits of appropriate management more fairly were developed. Accordingly, 51 Forest Protection Committees (FPCs) and 14 Eco Development Committees (EDCs) associated more specifically with National Parks and Sanctuaries, were constituted in Sundarban Biosphere Reserve between 1993 and 1998 in 46 forest fringe villages across seven CD Blocks. The EDCs, which were formed in villages adjoining sanctuaries, are entitled to 25 percent of tourism receipts. However, due to the discontinuation of coupe operations in the ISD's forest in accordance with a Supreme Court directive in 1996, the share of forestry revenue that FPCs would have ordinarily received is no longer available. This has created an unequal situation amongst the committees in forest fringe villages which not only poses difficulties while seeking community cooperation for management of forested region in ISD but also leaves scope for corruption. The situation is under review so as to bring EDCs and FPCs at par in terms of entitlement to tourism revenue. Nevertheless, despite these difficulties, through positive engagement with the local population through EDCs and FPCs, the Forest Department, since 2001, has been able to achieve zero mortality of strayed tigers due to retaliation by villagers.
The 19 CD Blocks of the ISD fall within two separate districts of North 24 Parganas and 24 Parganas (South). The highest unit of elected local self-government at the district level is the Zilla Parishad followed by Panchayat Samiti at the block level, and Gram Panchayat at the village cluster level. Parallel to this is the civil administration headed by civil servants (Block Development Officers and others); direct governance of the state government ends at the block level. Up to the block level, administration of different spheres of governance is overseen by various departments assigned with sectoral responsibilities.
²²2. GOVERNANCE AND
POLICIES
15
© D
AV
ID W
OO
DFA
LL
MURIGANGA-I 3211 18261
MURIGANGA-II 3110 18725
DAS PARA SUMATINAGAR-I 3226 19588
DAS PARA SUMATINAGAR-II 3080 18093
RUDRA NAGAR 4340 25124
RAMKAR CHAR 4553 26984
GANGA SAGAR 4642 27602
DHABLAT 4400 26031
GHORAMARA 899 5236
C.D Block SAGAR
Name of GP Household No. Population
NARAYANI TALA 3368 16362
KHAKUR DAHA 2045 10381
JANGALIA 3244 16515
CHALTA BERIA 119 670
BAMAN GACHI 6599 37363
DAKSHIN BARASAT 4923 24345
HARI NARAYANPUR 3422 18682
SRIPUR 3161 16738
UTTAR DURGAPUR 2065 12351
BAHARU 2909 15657
DHOSA CHANDANESWAR 4520 25546
RAJAPUR KORABEG 3503 19416
C.D Block JAYNAGAR - I
Name of GP Household No. Population
FUTIGODA 3695 19041
SAHAJADAPUR 3313 18320
MOYDAH 2678 15217
MAYAHOWRI 3180 17400
BELEDURGANAGAR 3897 22735
GORDWANI 3720 22802
BAISHATA 4392 26825
MONIRHAT 2995 17956
NALGORA 1757 9214
CHUPRIJHARA 6653 39635
C.D Block JAYNAGAR - II
Name of GP Household No. Population
SURJANAGAR 2998 16289
MADHUSUDANPUR 3206 17388
SRINAGAR 2472 13139
SRI SRI RAMKRISHNA 5621 30186
PRATAPADITYA NAGAR 5780 29390
BAPUJI 3768 20847
NETAJI 3596 20162
RABINDRA 3916 21559
SWAMI VIVEKANANDA 5870 30237
RISHIBANKIM CHANDRA 4594 24030
RAMGOPALPUR 2975 16099
C.D Block KAKDWIP
Name of GP Household No. Population
MERIGUNJ-I 3051 18337
MERIGUNJ-II 2853 17143
KUNDAKHALI GODABAR 3559 21307
JALABERIA-I 2943 16318
JALABERIA-II 2691 16491
DEULBARI DEBIPUR 3789 21903
GOPALGANJ 4872 28572
GURGURIA BHUBANESWARI 4484 24924
MAIPITH BAIKUNTHAPUR 3755 22994
C.D Block KULTALI
Name of GP Household No. Population
BUDHAKHALI 4475 23290
NARAYANPUR 4193 22078
NAMKHANA 5422 28354
HARIPUR 4150 21765
SHIBRAMPUR 4843 26124
MOUSHUNI 3340 20013
FRASERGANJ 3419 18504
C.D Block NAMKHANA
Name of GP Household No. Population
DAKSHIN - 3875 22620
GANGADHARPUR
DAKSHIN ROYPUR 2500 13828
DIGAMBARPUR 4090 23325
RAMGANGA 3058 18007
GOPALNAGAR 2595 14445
DURBACHATI 2883 16655
PATHAR PRATIMA 4652 26604
BRAJABALLAVPUR 3683 20404
G PLOT 4488 25601
SRIDHARNAGAR 2847 16353
ACHINTYANAGAR 3826 22577
LAXMIJANARDANPUR 3129 17210
HERAMBAGOPALPUR 3518 19521
BANASHYAMNAGAR 2880 16402
SRINARAYANPUR - 2740 14842
PURNACHANDRAPUR
C.D Block PATHARPRATIMA
Name of GP Household No. Population
MATHURAPUR-
PASCHIM
DABIPUR 6375 33087
LALPUR 2399 14402
KRISHNACHANDRAPUR 1670 8379
NALUA 4170 22849
LAKSHMI-NARAYANPUR 2344 12096
UTTAR
LAKSHMI-NARAYANPUR 4626 25841
DAKSHIN
ABID BHAGABANPUR 2996 16827
SANKARPUR 2464 15131
3183 16350
C.D Block MATHURAPUR - I
Name of GP Household No. Population
GILARCHHAT 8050 43047
KASHINAGAR 2170 11366
KAUTALA 2436 12822
RADHAKANTAPUR 1381 7151
DIGHPAR BAKULTALA 3134 16332
RAIDIGHI 4555 24957
KUMRAPARA 2857 15332
KANKANDIGHI 3954 21824
NAGENDRAPUR 3713 21355
NANDAKUMARPUR 4112 24095
C.D Block MATHURAPUR - II
Name of GP Household No. Population
BOYERMARI-I 2438 14570
BOYERMARI-II 2993 16361
SARBERIA AGARHATI 3598 20172
HATGACHHI 3202 17285
NAZAT-I 1631 9072
NAZAT-II 4731 24546
KALINAGAR 4195 21160
SEHARA RADHANAGAR 3404 17310
C.D Block SANDESHKHALI - I
Name of GP Household No. Population
BERMAJUR-I 1938 10895
BERMAJUR-II 2892 15932
SANDESHKHALI 3207 15771
KHULNA 3326 16196
JELIAKHALI 3439 18736
KORAKATI 4050 20120
DURGAMANDAP 4138 21224
MONIPUR 3414 17444
C.D Block SANDESHKHALI - II
Name of GP Household No. Population
BISHPUR 3681 18034
HINGALGANJ 3390 15952
SANDELER BILL 4502 20831
RUPAMARI 2648 12827
DULDULI 3768 17503
SAHEBKHALI 4185 19537
GOBINDAKATI 3120 15107
JOGESHGANJ 4131 19927
KALITALA 3366 16682
C.D Block HINGALGANJ
Name of GP Household No. Population
MATLA-I 5493 26286
TALDI 7527 37673
DARIA 3673 19733
HATPUKURIA 3558 20402
DIGHIRPAR 5580 27861
NIKARIGHATA 5031 27276
ITKHOLA 3832 22403
GOPALPUR 4332 25880
BANSRA 7660 37113
C.D Block CANNING - I
Name of GP Household No. Population
DEULI-I 2860 16519
DEULI-II 2810 16159
SARANGABAD 6183 37051
TAMBULDAH-I 4039 24021
TAMBULDAH-II 2843 16212
NARAYANPUR 4799 25307
MOTHERDIGHI 3952 22415
KALIKATALA 2192 13238
ATHAROBANKI 4077 25045
C.D Block CANNING - II
Name of GP Household No. Population
RADHANAGAR-
TARANAGAR
AMTOLI 2975 15304
CHOTOMOLLAKHALI 3746 18430
KUMIRMARI 3336 16192
SAMBHUNAGAR 2686 13953
PATHANKHALI 2467 13503
BIPRADASPUR 3113 16064
KACHUKHALI 2462 11977
RANGABELIA 2721 13801
SATJELIA 3390 16693
LAHIRIPUR 4371 20752
GOSABA 3499 17169
BALLY-I 2332 11640
BALLY-II 3184 16274
4196 21070
C.D Block GOSABA
Name of GP Household No. Population
MURARISHA 5327 28276
BHEBIA 5462 27836
MAKHALGACHHA 4131 22149
AMLANI 4108 20260
HASNABAD 2932 14300
PATLIKHANPUR 3813 19299
BARUNHAT- 4305 20903
RAMESWARPUR
BHOWANIPUR-I 2061 10143
BHOWANIPUR-II 2820 14355
C.D Block HASNABAD
Name of GP Household No. Population
SALIPUR 4242 23186
BORJURI 4036 23088
SONAPUKURSANKARPUR 4106 22260
KULTI 4642 25843
KHASBALANDA 4450 23474
HAROA 5752 29896
GOPALPUR-I 6663 34775
C.D Block HAROA
Name of GP Household No. Population
CHARAVIDYA 3687 21138
CHUNAKHALI 4020 21642
FUL MALANCHA 5452 29883
KANTHAL BERIYA 3858 22905
AMJHARA 4104 23084
UTTAR MOKAMBERIYA 3384 18118
R C KHALI 4639 26652
MASJID BATI 2543 13459
BASANTI 4648 25387
JYOTISHPUR 3150 16645
BHARATGARH 4675 26416
NAFARGANJ 2839 14767
JHARKHALI 1148 5848
C.D Block BASANTI
Name of GP Household No. Population
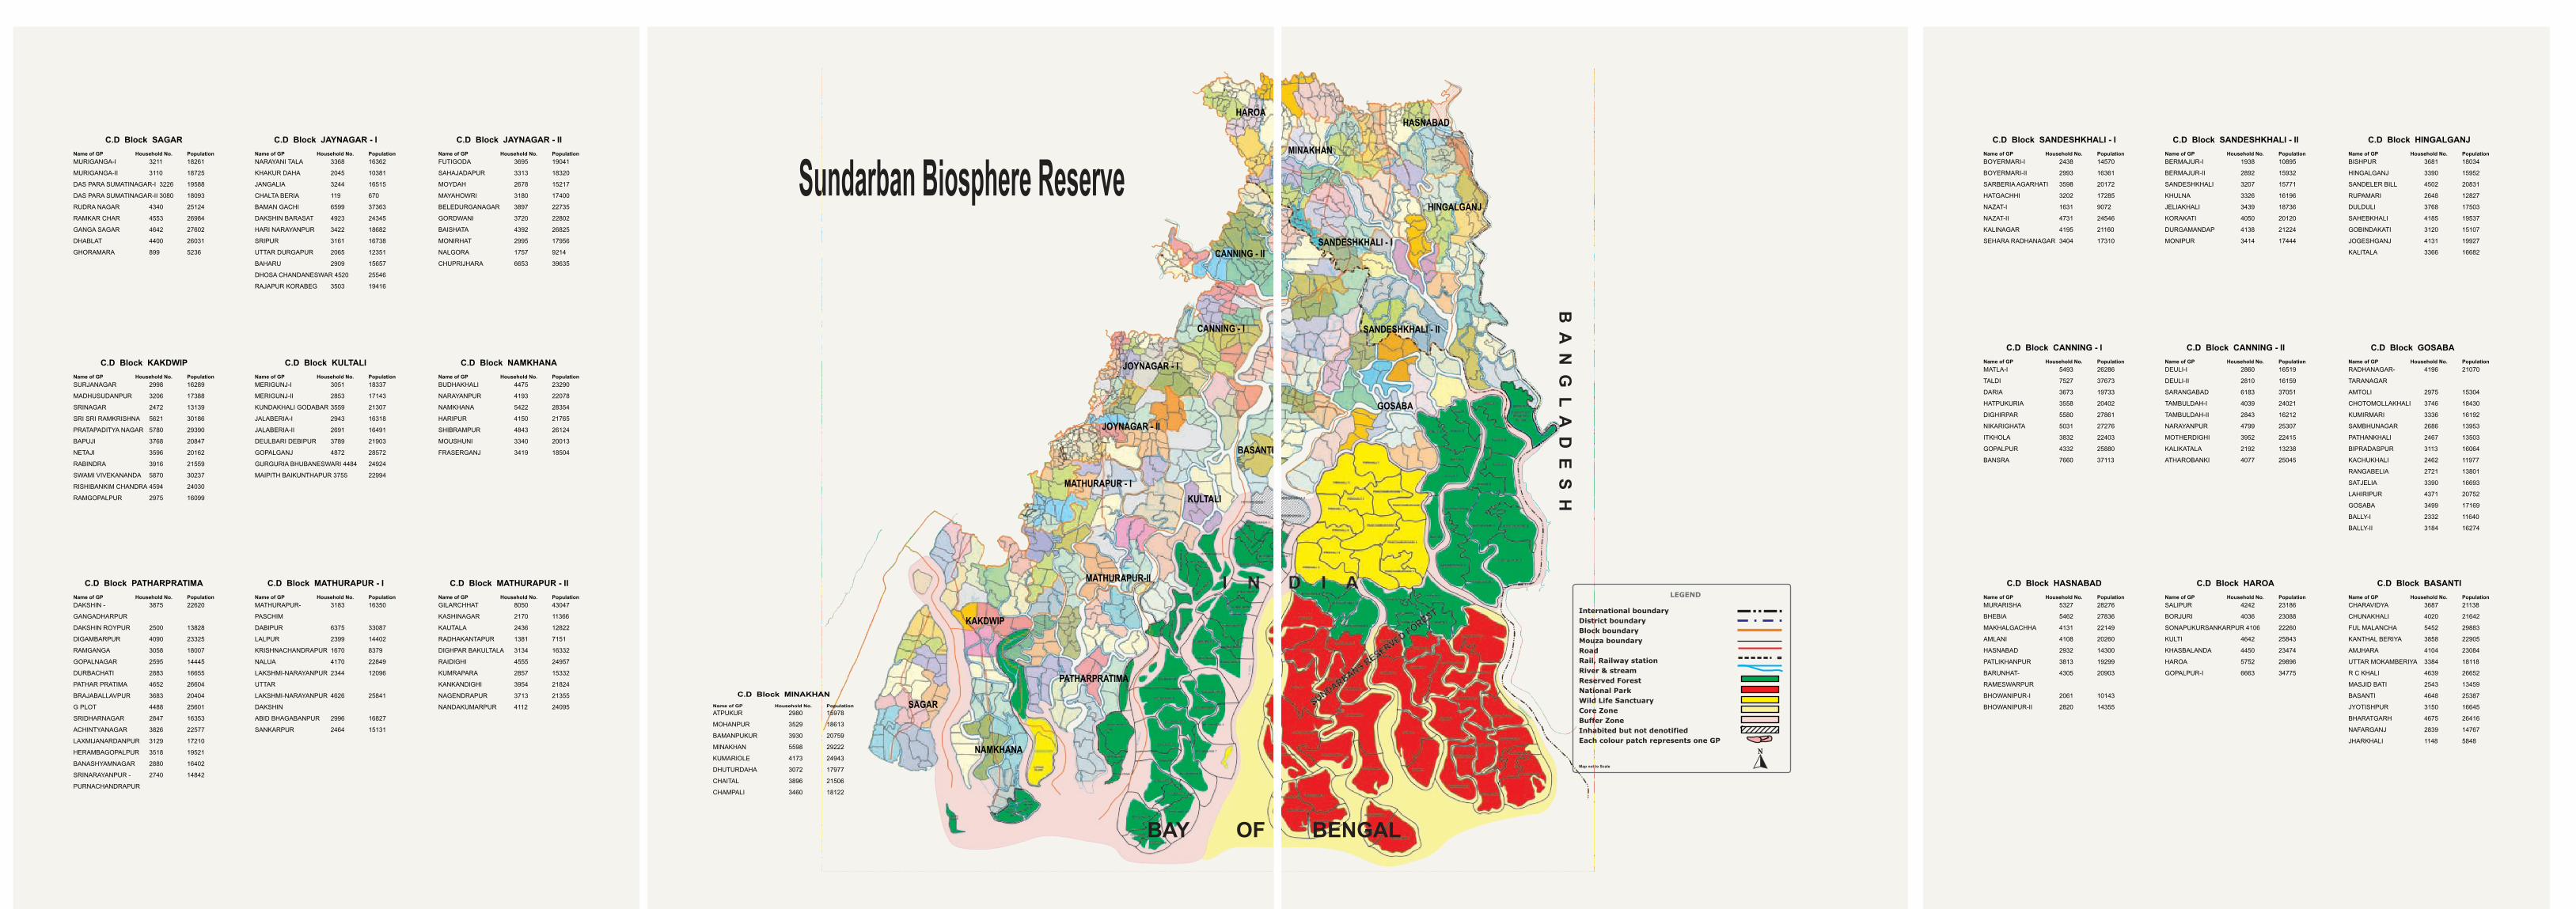
Sundarban Biosphere Reserve
BASANTI
KULTALI
PATHARPRATIMA
MATHURAPUR-II
KAKDWIP
SAGAR
NAMKHANA
HAROA
CANNING - II
CANNING - I
JOYNAGAR - I
JOYNAGAR - II
MATHURAPUR - I
B A
N G
L A
D E
S H
GOSABA
HINGALGANJ
SANDESHKHALI - II
HASNABAD
MINAKHAN
SANDESHKHALI - I
BAY OF BENGAL
International boundary
District boundary
Block boundary
Mouza boundary
Road
Rail, Railway station
River & stream
Reserved Forest
National Park
Wild Life Sanctuary
Core Zone
Buffer Zone
Inhabited but not denotified
Each colour patch represents one GP
LEGEND
Map not to Scale
ATPUKUR 2980 15978
MOHANPUR 3529 18613
BAMANPUKUR 3930 20759
MINAKHAN 5598 29222
KUMARIOLE 4173 24943
DHUTURDAHA 3072 17977
CHAITAL 3896 21506
CHAMPALI 3460 18122
C.D Block MINAKHAN
Name of GP Household No. Population
The two departments that have the broadest administrative influence over the ISD are the Sundarbans Affairs Department (SAD) and the Forest Department. The Sundarban Development Board (SDB) was created in 1973 in order to address the socio-economic backwardness of the region. In 1994, the SAD was developed as a dedicated department under which the SDB was subsumed. The original mandate of SDB was to coordinate activities of the various sectoral departments operating in the ecoregion. However, the SDB has since morphed into a parallel implementation agency with a range of divisions mirroring the departmental mandates of different state departments (e.g., Agriculture, Fisheries, Social Forestry, and Civil Engineering).
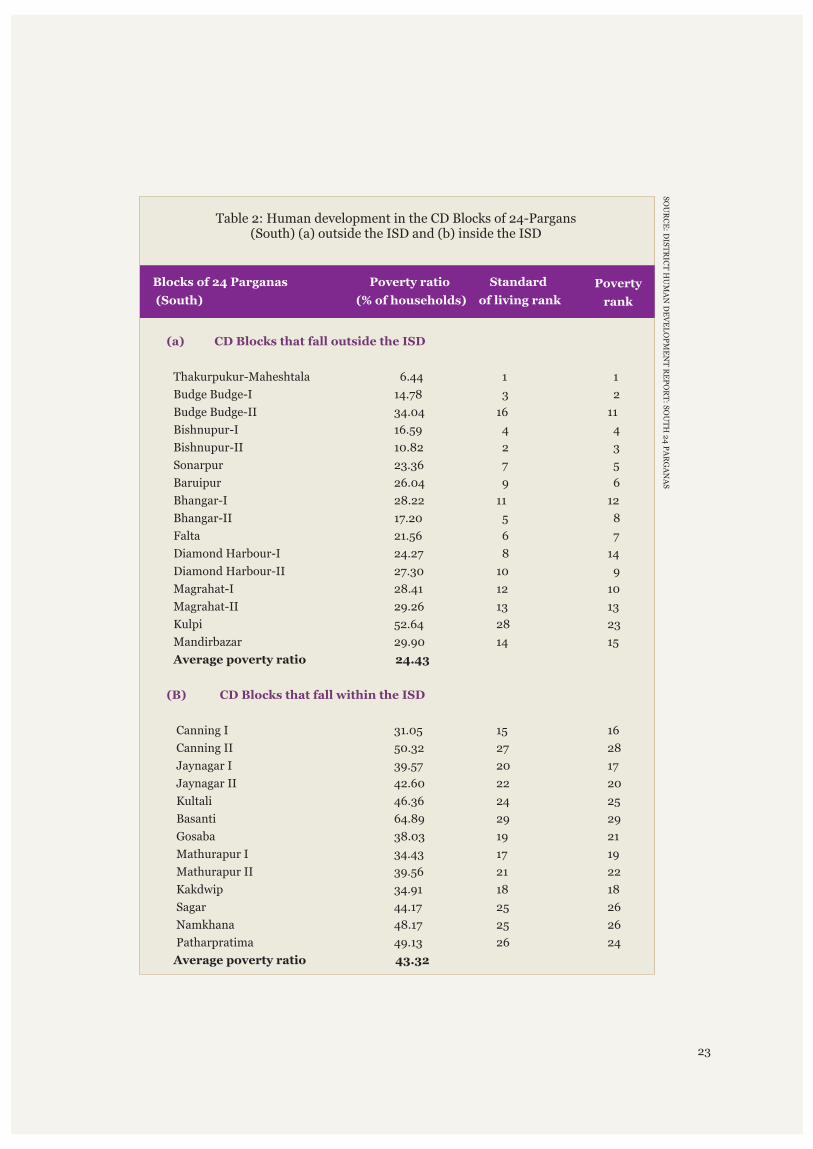
Currently India is in its 11th Five-year Plan period, which spans from 2007 to 2012. West Bengal has prepared its own state-level plan for the same period that reflects specific state concerns and issues with a total budget for the five-year period. Under the 11th Five-year Plan the state has specific provisions for the ISD. The Plan highlights problems such as: limited livelihood opportunities; high proportion of people belonging to backward communities; low levels of irrigation and cropping; 63 per cent unemployment rate; and a high dependency on natural resources that threaten natural systems and protected areas (State Planning Board 2007b). It is difficult to present CD Block-level income levels in the 19 CD Blocks as the Human Development Reports of the two districts are not in the same format, making direct comparison difficult. However, the data available clearly indicates that the CD Blocks within ISD suffer greater levels of poverty than other CD Blocks in the same district. This is illustrated in Table 2, which shows poverty levels in all the CD Blocks of 24-Pargans (South), separating CD Blocks that (a) fall within the ISD, and (b) are located outside the ISD. This shows how the average poverty ratio in the ISD is close to twice as much as compared to CD Blocks located outside the ISD.
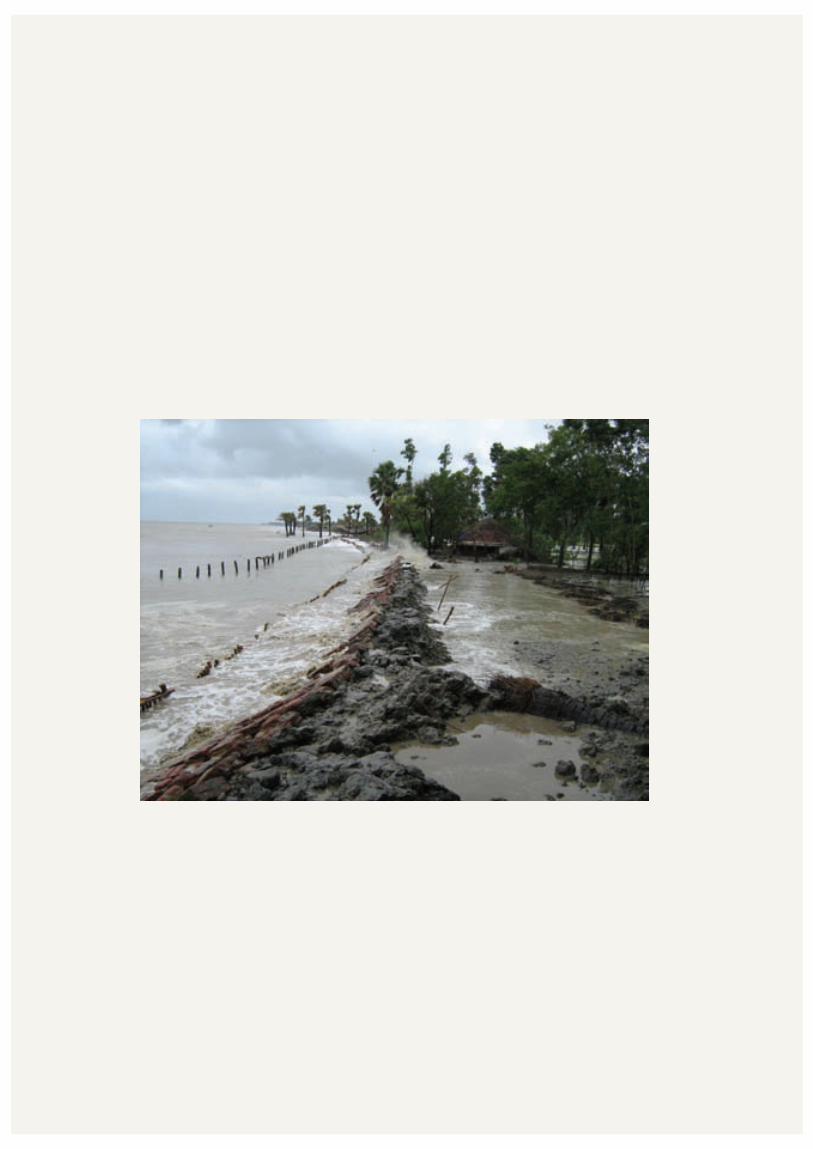
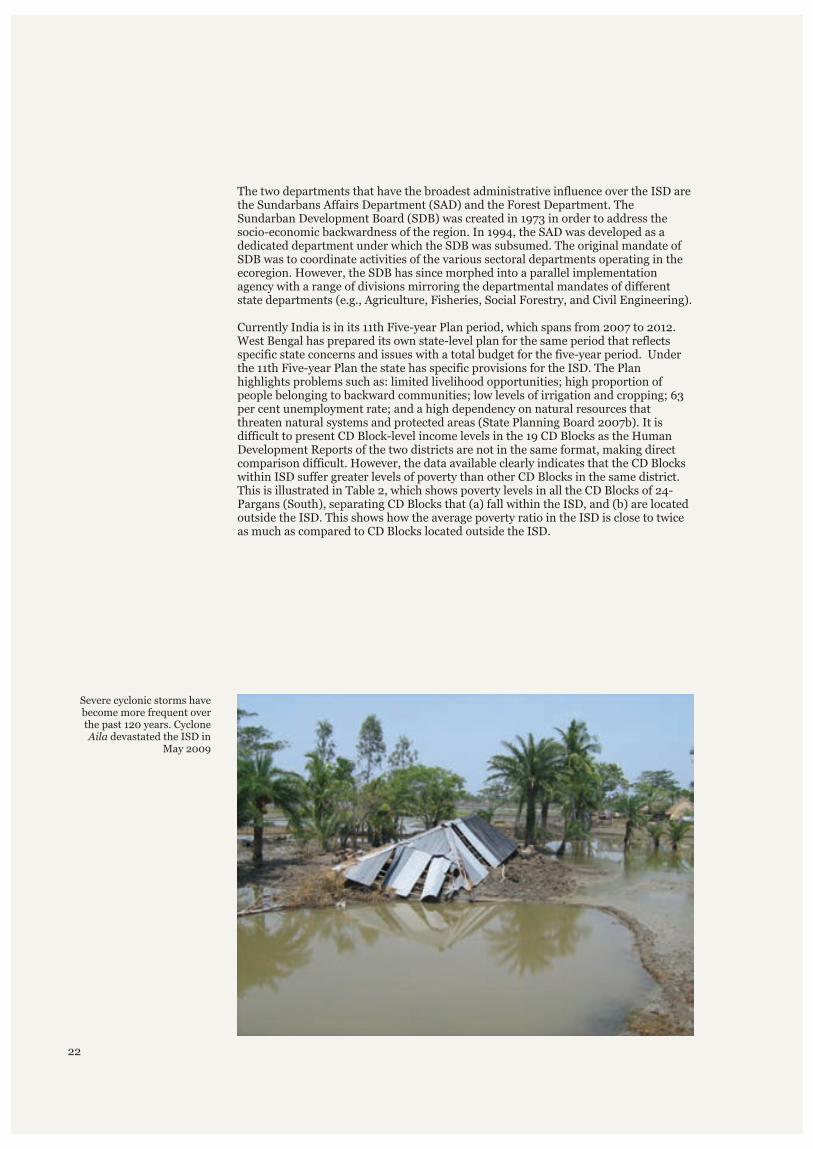
Severe cyclonic storms have become more frequent over the past 120 years. Cyclone Aila devastated the ISD in
May 2009
22
23
Blocks of 24 Parganas
(South)
Poverty ratio
(% of households)
Poverty
rank
Standard
of living rank
SO
UR
CE
: DIS
TR
ICT
HU
MA
N D
EV
EL
OP
ME
NT
RE
PO
RT
: SO
UT
H 2
4 P
AR
GA
NA
S
(a) CD Blocks that fall outside the ISD
(B) CD Blocks that fall within the ISD
Thakurpukur-Maheshtala 6.44 1 1
Budge Budge-I 14.78 3 2
Budge Budge-II 34.04 16 11
Bishnupur-I 16.59 4 4
Bishnupur-II 10.82 2 3
Sonarpur 23.36 7 5
Baruipur 26.04 9 6
Bhangar-I 28.22 11 12
Bhangar-II 17.20 5 8
Falta 21.56 6 7
Diamond Harbour-I 24.27 8 14
Diamond Harbour-II 27.30 10 9
Magrahat-I 28.41 12 10
Magrahat-II 29.26 13 13
Kulpi 52.64 28 23
Mandirbazar 29.90 14 15
Average poverty ratio 24.43
Canning I 31.05 15 16
Canning II 50.32 27 28
Jaynagar I 39.57 20 17
Jaynagar II 42.60 22 20
Kultali 46.36 24 25
Basanti 64.89 29 29
Gosaba 38.03 19 21
Mathurapur I 34.43 17 19
Mathurapur II 39.56 21 22
Kakdwip 34.91 18 18
Sagar 44.17 25 26
Namkhana 48.17 25 26
Patharpratima 49.13 26 24
Average poverty ratio 43.32
Table 2: Human development in the CD Blocks of 24-Pargans (South) (a) outside the ISD and (b) inside the ISD
Specific policy objectives outlined include (State Planning Board 2007a; State Planning Board 2007b):
Extending irrigation systems through water harvesting or other appropriate means to allow for the cultivation of second crops and investigating possibilities of horticultural expansionConstructing and maintaining embankments Improving connectivity (e.g., roads, bridges, culverts)Extending the provision of services such as drinking water and electricity, particularly to scheduled caste (SC) and scheduled tribe (ST) communitiesImproving marketing infrastructureDeveloping skills to improve the scope of non-agricultural employmentSupporting pisciculture activitiesImproving education facilities with a focus on women as well as SC and ST communitiesPursuing afforestation with community involvementEnsuring community participation in local governance.
In India, special provisions for coastal management are provided under the 1991 Coastal Regulation Zone (CRZ) notification number S.O. 114(E) amended till date, of the Ministry of Environment and Forests. This covers all areas within 500m of the high tide line and provides guidance and stipulates restrictions governing development of industries, management of waste, processing standards, mining of coastal resources, construction, and groundwater extraction (within 200m of the high tide line). This notification covers the whole of the ISD under different CRZ categories. The CRZ I category is applied to: all the forested areas of the ISD; all sand dunes; all land that lies within 100m of a tidal creek; all uninhabited islands, and Sagar Island. The rest of the ISD is under CRZ III category.
Although the provisions of CRZ have not yet been implemented in West Bengal, in 1997, West Bengal was the first state in India to submit a Coastal Zone Management Plan (CZMP). A new state-level Integrated Coastal Management Plan is being developed by the government with support from the World Bank and it is expected to be released by the end of 2010 (Pers. comm. to Gayathri Sriskanthan, Bhattacharya 2010).
*
***
****
**
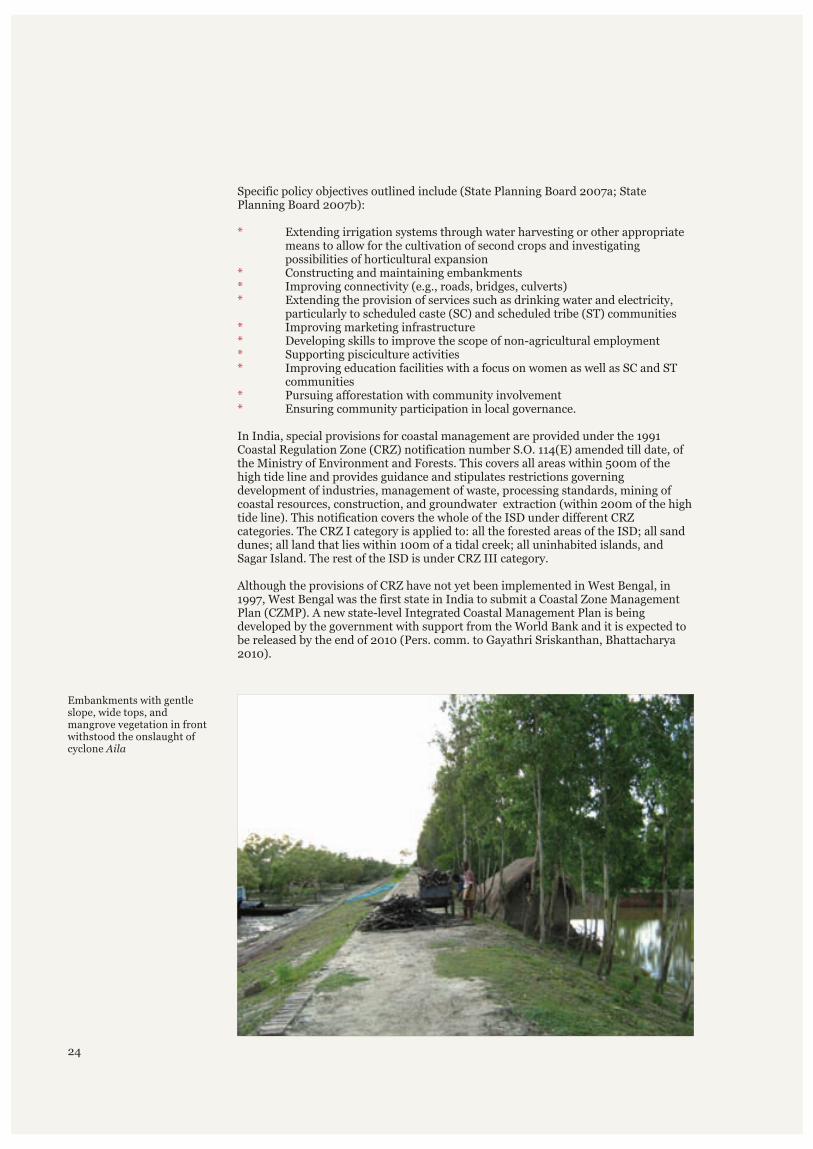
Embankments with gentle slope, wide tops, and mangrove vegetation in front withstood the onslaught of cyclone Aila
24
West Bengal initiated a state disaster management policy and framework in 2005 that outlined a strategy for: (a) pre-disaster, (b) disaster phase, and (c) post-disaster response (Department of Disaster Management, 2005). This document outlines an implementation framework that includes the development of institutional mechanisms for implementation; a broad mitigation and prevention strategy that includes targets to develop a land-use planning framework; and disaster management planning down to the district and block levels including the ISD. However, this does not seem to have been operationalised as was evident in the inadquacy of the response to cyclone Aila that devastated the ISD in May 2009.
The management of the embankment system is vital for the protection and maintenance of agrarian land use and human habitation in the ISD. During the colonial administration, embankment management was governed by the Bengal Embankment Act, 1882. In independent India, responsibility for maintaining the embankment systems of the ISD was passed on to the Drainage Wing of the Irrigation Department, Government of West Bengal. This department has considerable experience in riverine flood embankment management but there is a lack of expertise in the design, construction and maintenance of embankments in the very specific and different conditions of a macro-tidal regime like the ISD. The Embankment Act was last amended in 1967 and there is considerable scope to update and improve both the management arrangements and legislation that currently oversees the ISD's embankment system.
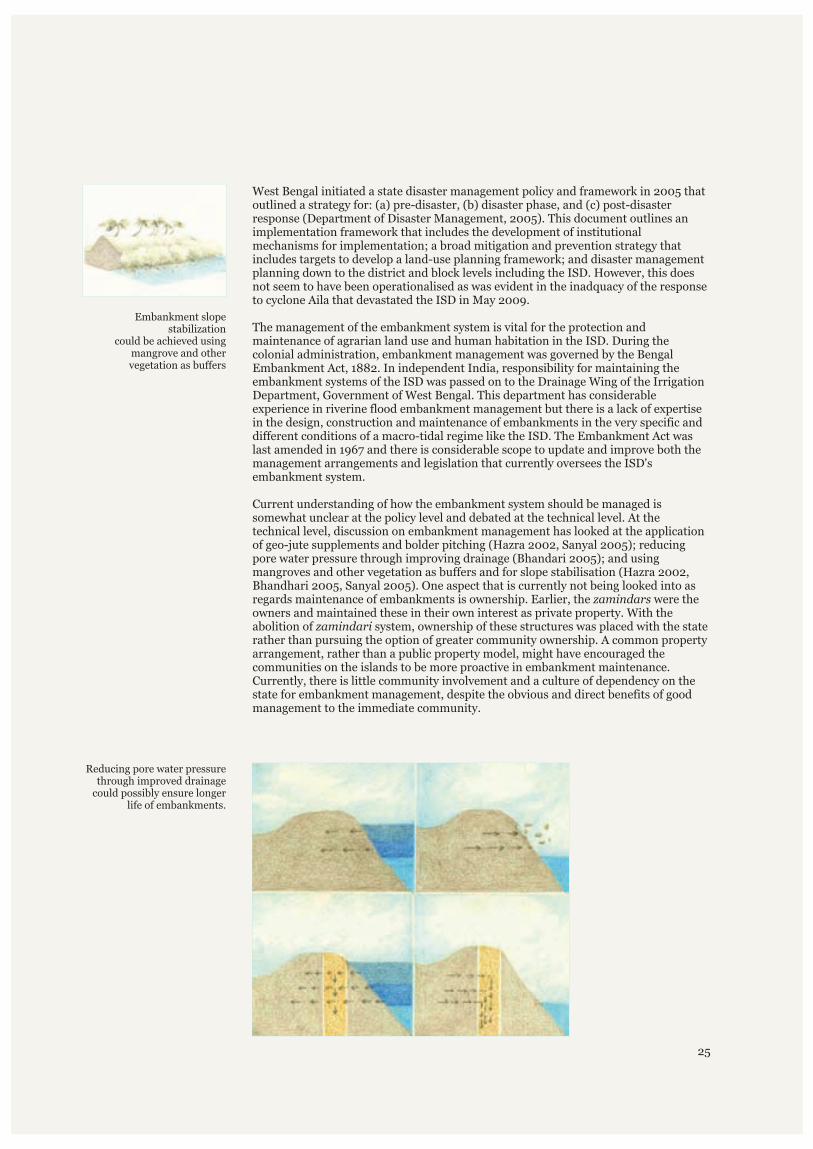
Current understanding of how the embankment system should be managed is somewhat unclear at the policy level and debated at the technical level. At the technical level, discussion on embankment management has looked at the application of geo-jute supplements and bolder pitching (Hazra 2002, Sanyal 2005); reducing pore water pressure through improving drainage (Bhandari 2005); and using mangroves and other vegetation as buffers and for slope stabilisation (Hazra 2002, Bhandhari 2005, Sanyal 2005). One aspect that is currently not being looked into as regards maintenance of embankments is ownership. Earlier, the were the owners and maintained these in their own interest as private property. With the abolition of system, ownership of these structures was placed with the state rather than pursuing the option of greater community ownership. A common property arrangement, rather than a public property model, might have encouraged the communities on the islands to be more proactive in embankment maintenance. Currently, there is little community involvement and a culture of dependency on the state for embankment management, despite the obvious and direct benefits of good management to the immediate community.
zamindars
zamindari
Embankment slope stabilization
could be achieved using mangrove and other vegetation as buffers
Reducing pore water pressure through improved drainage
could possibly ensure longer life of embankments.
25
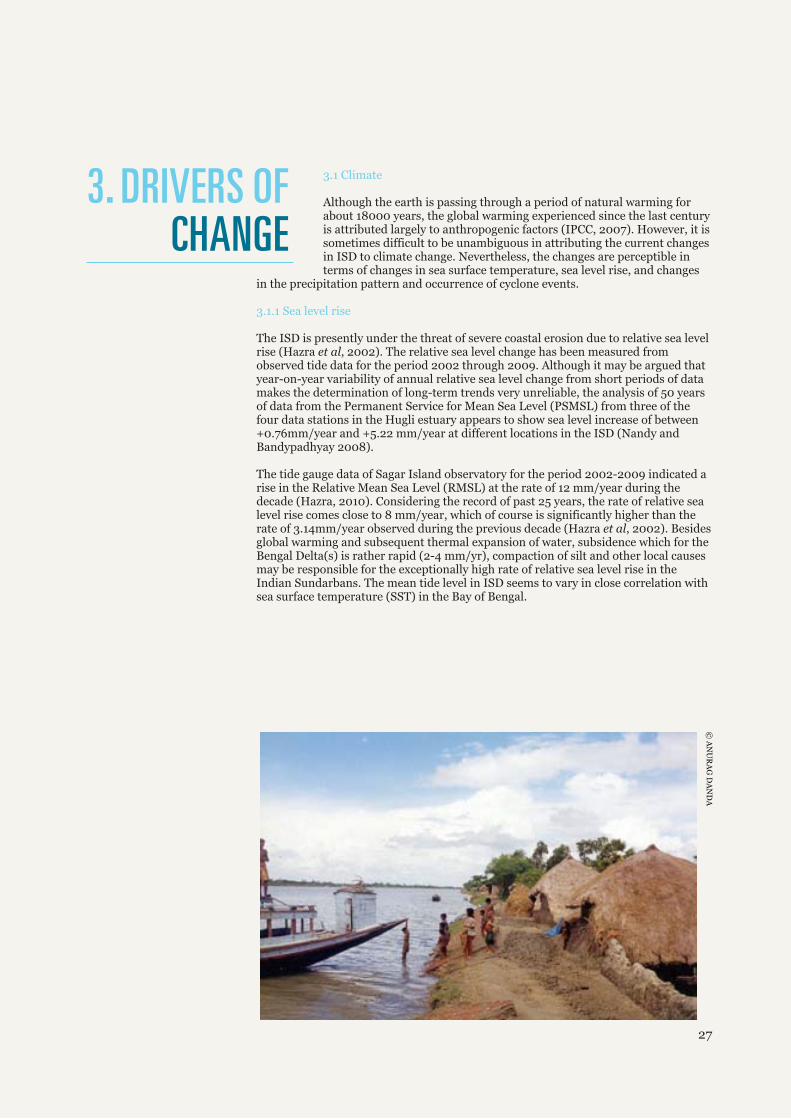
3.1 Climate
3.1.1 Sea level rise
Although the earth is passing through a period of natural warming for about 18000 years, the global warming experienced since the last century is attributed largely to anthropogenic factors (IPCC, 2007). However, it is sometimes difficult to be unambiguous in attributing the current changes in ISD to climate change. Nevertheless, the changes are perceptible in terms of changes in sea surface temperature, sea level rise, and changes
in the precipitation pattern and occurrence of cyclone events.
The ISD is presently under the threat of severe coastal erosion due to relative sea level rise (Hazra , 2002). The relative sea level change has been measured from observed tide data for the period 2002 through 2009. Although it may be argued that year-on-year variability of annual relative sea level change from short periods of data makes the determination of long-term trends very unreliable, the analysis of 50 years of data from the Permanent Service for Mean Sea Level (PSMSL) from three of the four data stations in the Hugli estuary appears to show sea level increase of between +0.76mm/year and +5.22 mm/year at different locations in the ISD (Nandy and Bandypadhyay 2008).
The tide gauge data of Sagar Island observatory for the period 2002-2009 indicated a rise in the Relative Mean Sea Level (RMSL) at the rate of 12 mm/year during the decade (Hazra, 2010). Considering the record of past 25 years, the rate of relative sea level rise comes close to 8 mm/year, which of course is significantly higher than the rate of 3.14mm/year observed during the previous decade (Hazra , 2002). Besides global warming and subsequent thermal expansion of water, subsidence which for the Bengal Delta(s) is rather rapid (2-4 mm/yr), compaction of silt and other local causes may be responsible for the exceptionally high rate of relative sea level rise in the Indian Sundarbans. The mean tide level in ISD seems to vary in close correlation with sea surface temperature (SST) in the Bay of Bengal.
et al
et al
3. DRIVERS OF CHANGE
27
© A
NU
RA
G D
AN
DA
3.1.2 Temperature change
3.1.3 Changes in precipitation and cyclone activity
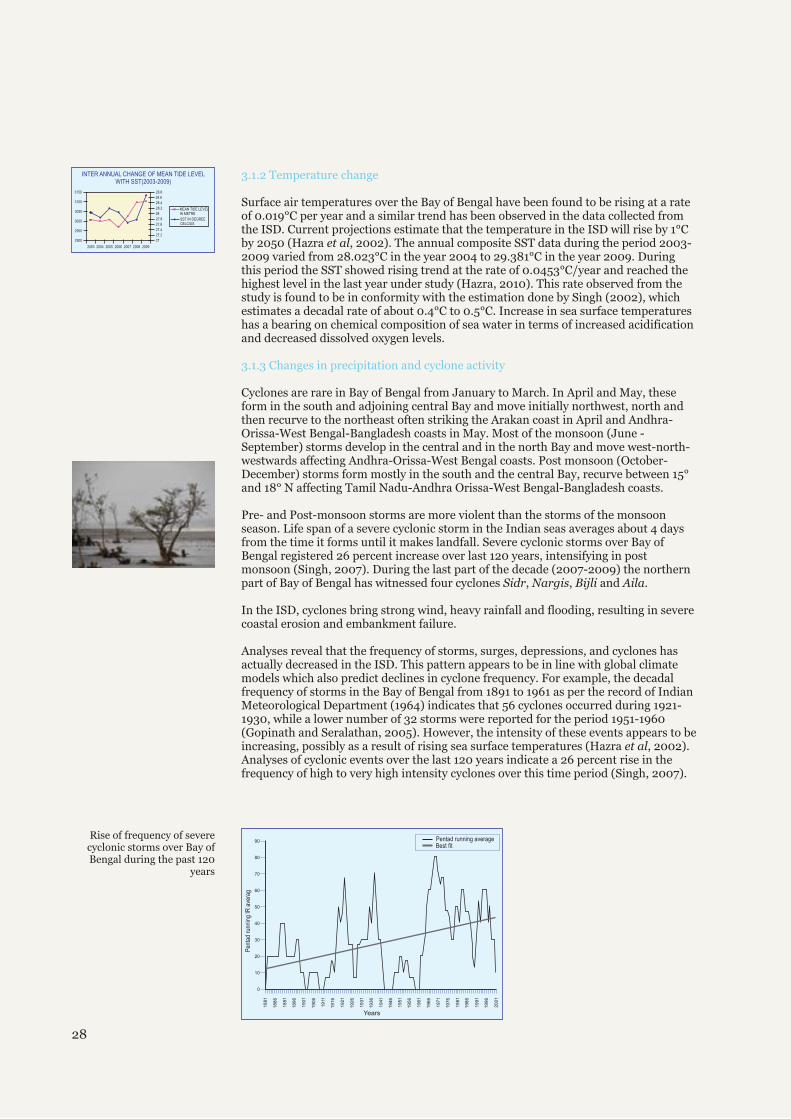
Surface air temperatures over the Bay of Bengal have been found to be rising at a rate of 0.019°C per year and a similar trend has been observed in the data collected from the ISD. Current projections estimate that the temperature in the ISD will rise by 1°C by 2050 (Hazra et al, 2002). The annual composite SST data during the period 2003-2009 varied from 28.023°C in the year 2004 to 29.381°C in the year 2009. During this period the SST showed rising trend at the rate of 0.0453°C/year and reached the highest level in the last year under study (Hazra, 2010). This rate observed from the study is found to be in conformity with the estimation done by Singh (2002), which estimates a decadal rate of about 0.4°C to 0.5°C. Increase in sea surface temperatures has a bearing on chemical composition of sea water in terms of increased acidification and decreased dissolved oxygen levels.
Cyclones are rare in Bay of Bengal from January to March. In April and May, these form in the south and adjoining central Bay and move initially northwest, north and then recurve to the northeast often striking the Arakan coast in April and Andhra-Orissa-West Bengal-Bangladesh coasts in May. Most of the monsoon (June - September) storms develop in the central and in the north Bay and move west-north-westwards affecting Andhra-Orissa-West Bengal coasts. Post monsoon (October-December) storms form mostly in the south and the central Bay, recurve between 15° and 18° N affecting Tamil Nadu-Andhra Orissa-West Bengal-Bangladesh coasts.
Pre- and Post-monsoon storms are more violent than the storms of the monsoon season. Life span of a severe cyclonic storm in the Indian seas averages about 4 days from the time it forms until it makes landfall. Severe cyclonic storms over Bay of Bengal registered 26 percent increase over last 120 years, intensifying in post monsoon (Singh, 2007). During the last part of the decade (2007-2009) the northern part of Bay of Bengal has witnessed four cyclones .
In the ISD, cyclones bring strong wind, heavy rainfall and flooding, resulting in severe coastal erosion and embankment failure.
Analyses reveal that the frequency of storms, surges, depressions, and cyclones has actually decreased in the ISD. This pattern appears to be in line with global climate models which also predict declines in cyclone frequency. For example, the decadal frequency of storms in the Bay of Bengal from 1891 to 1961 as per the record of Indian Meteorological Department (1964) indicates that 56 cyclones occurred during 1921-1930, while a lower number of 32 storms were reported for the period 1951-1960 (Gopinath and Seralathan, 2005). However, the intensity of these events appears to be increasing, possibly as a result of rising sea surface temperatures (Hazra et al, 2002). Analyses of cyclonic events over the last 120 years indicate a 26 percent rise in the frequency of high to very high intensity cyclones over this time period (Singh, 2007).
Sidr, Nargis, Bijli and Aila
28
Rise of frequency of severe cyclonic storms over Bay of Bengal during the past 120
years
INTER ANNUAL CHANGE OF MEAN TIDE LEVELWITH SST(2003-2009)
28.6
3150 28.8
28.4
28.2
28
27.8
27.6
27.4
27.2
27
3100
3050
3000
2950
2900
2003 2004 2005 2006 2007 2008 2009
MEAN TIDE LEVELIN METRE
SST IN DEGREECELCIUS
1881
1886
1891
1896
1901
1906
1911
1916
1921
1926
1931
1936
1941
1946
1951
1956
1961
1966
1971
1976
1981
1986
1991
1996
2001
Years
90
80
70
60
50
40
30
20
10
0
Pen
tad
runn
ing
IR a
vera
g
Pentad running averageBest fit
3.2 Population
3.3 Market
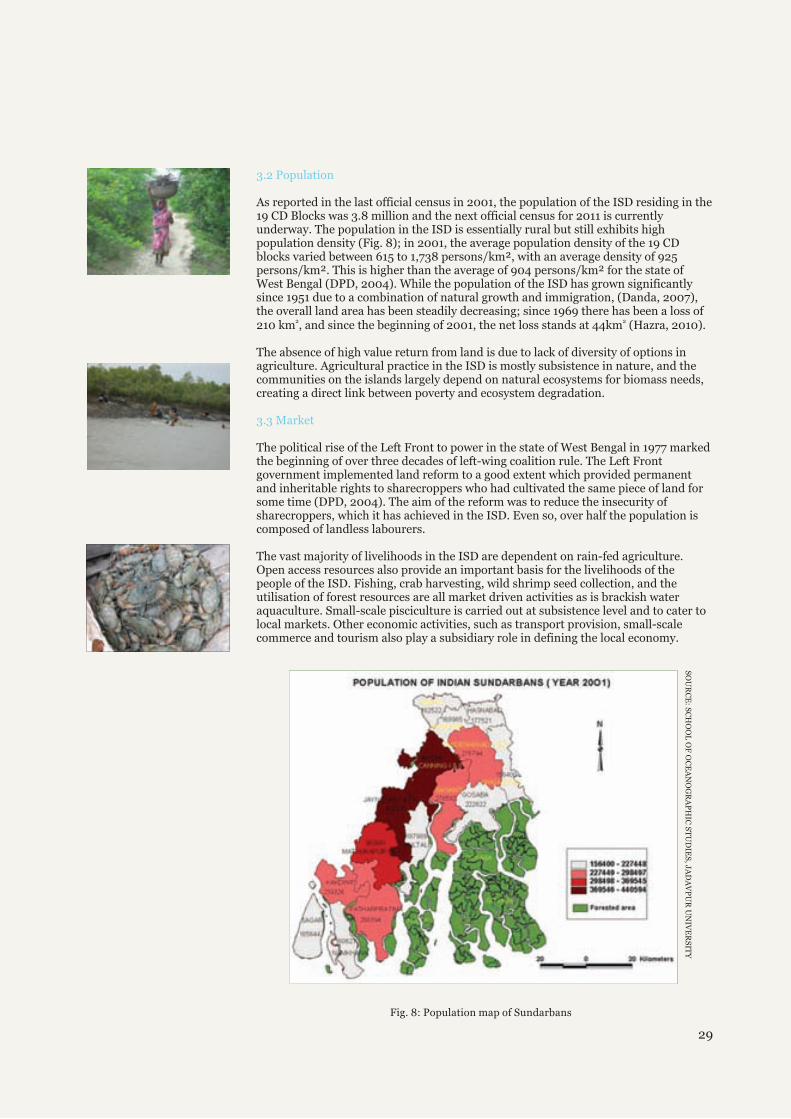
As reported in the last official census in 2001, the population of the ISD residing in the 19 CD Blocks was 3.8 million and the next official census for 2011 is currently underway. The population in the ISD is essentially rural but still exhibits high population density (Fig. 8); in 2001, the average population density of the 19 CD blocks varied between 615 to 1,738 persons/km
(Hazra, 2010).
The absence of high value return from land is due to lack of diversity of options in agriculture. Agricultural practice in the ISD is mostly subsistence in nature, and the communities on the islands largely depend on natural ecosystems for biomass needs, creating a direct link between poverty and ecosystem degradation.
The political rise of the Left Front to power in the state of West Bengal in 1977 marked the beginning of over three decades of left-wing coalition rule. The Left Front government implemented land reform to a good extent which provided permanent and inheritable rights to sharecroppers who had cultivated the same piece of land for some time (DPD, 2004). The aim of the reform was to reduce the insecurity of sharecroppers, which it has achieved in the ISD. Even so, over half the population is composed of landless labourers.
The vast majority of livelihoods in the ISD are dependent on rain-fed agriculture. Open access resources also provide an important basis for the livelihoods of the people of the ISD. Fishing, crab harvesting, wild shrimp seed collection, and the utilisation of forest resources are all market driven activities as is brackish water aquaculture. Small-scale pisciculture is carried out at subsistence level and to cater to local markets. Other economic activities, such as transport provision, small-scale commerce and tourism also play a subsidiary role in defining the local economy.
², with an average density of 925
persons/km². This is higher than the average of 904 persons/km² for the state of West Bengal (DPD, 2004). While the population of the ISD has grown significantly since 1951 due to a combination of natural growth and immigration, (Danda, 2007), the overall land area has been steadily decreasing; since 1969 there has been a loss of
2 2210 km , and since the beginning of 2001, the net loss stands at 44km
29
SO
UR
CE
: SC
HO
OL
OF
OC
EA
NO
GR
AP
HIC
ST
UD
IES
, JA
DA
VP
UR
UN
IVE
RS
ITY
Fig. 8: Population map of Sundarbans
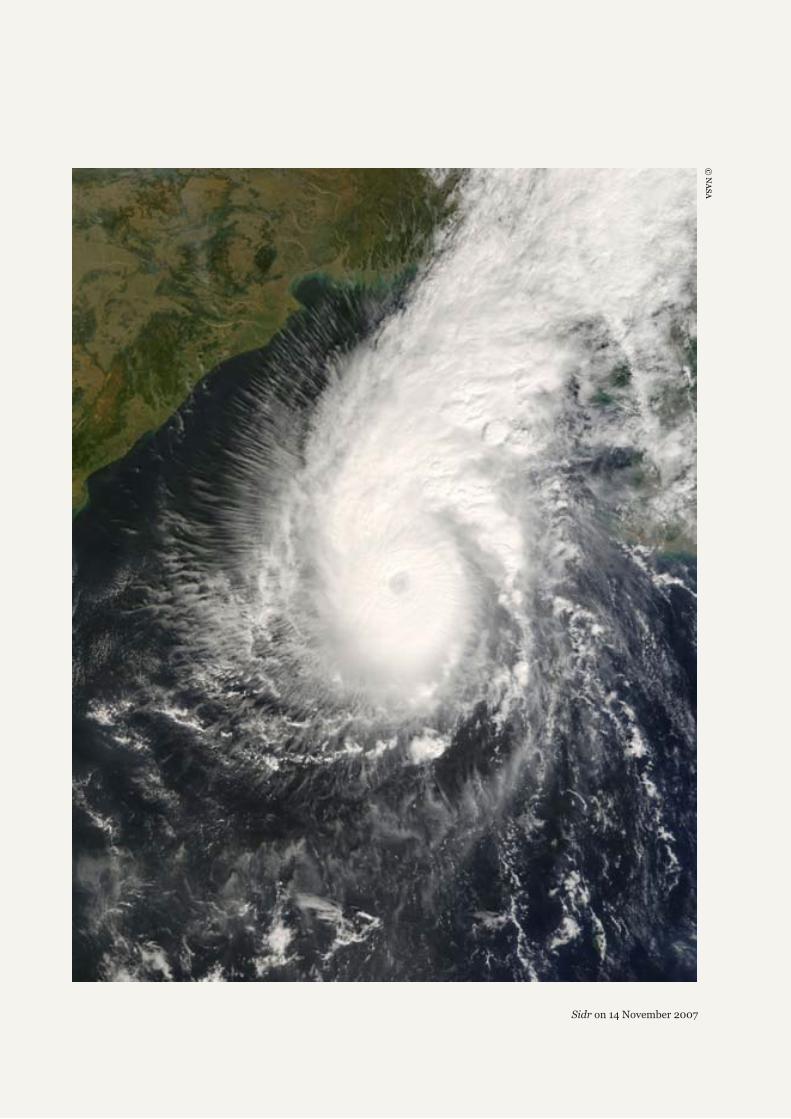
Sidr on 14 November 2007
© N
AS
A
4.1 Natural environment
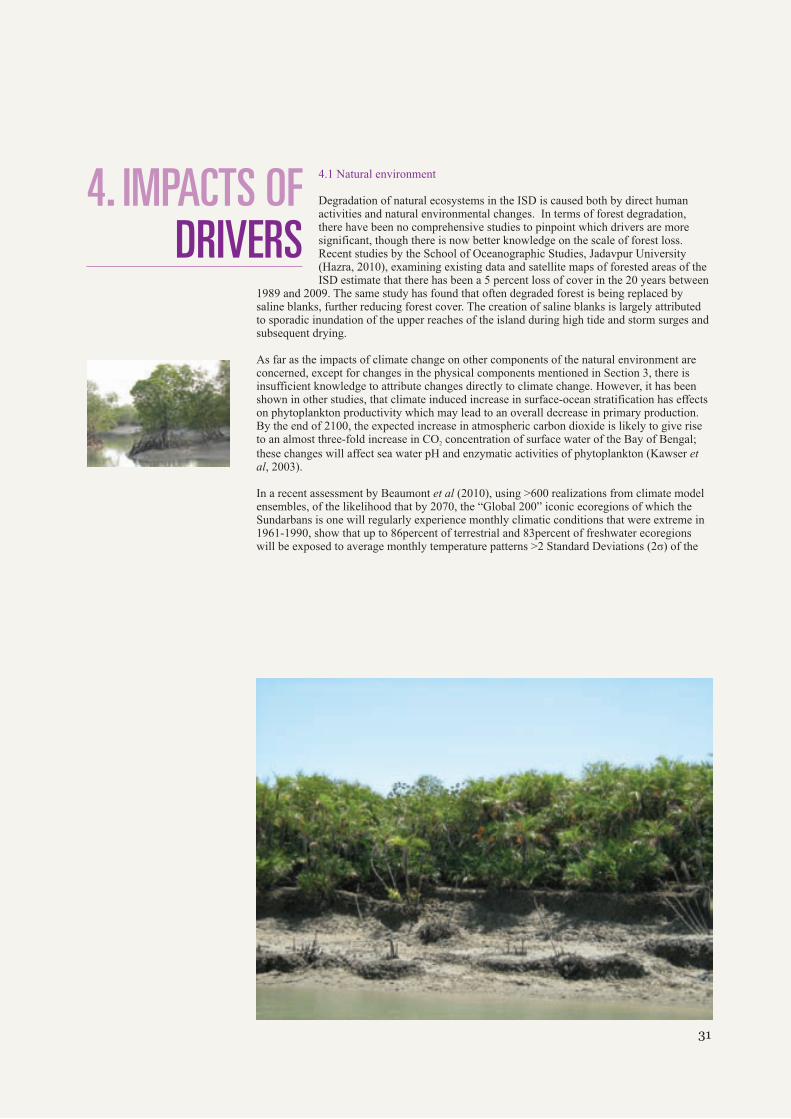
Degradation of natural ecosystems in the ISD is caused both by direct human activities and natural environmental changes. In terms of forest degradation, there have been no comprehensive studies to pinpoint which drivers are more significant, though there is now better knowledge on the scale of forest loss. Recent studies by the School of Oceanographic Studies, Jadavpur University (Hazra, 2010), examining existing data and satellite maps of forested areas of the ISD estimate that there has been a 5 percent loss of cover in the 20 years between
1989 and 2009. The same study has found that often degraded forest is being replaced by saline blanks, further reducing forest cover. The creation of saline blanks is largely attributed to sporadic inundation of the upper reaches of the island during high tide and storm surges and subsequent drying.
As far as the impacts of climate change on other components of the natural environment are concerned, except for changes in the physical components mentioned in Section 3, there is insufficient knowledge to attribute changes directly to climate change. However, it has been shown in other studies, that climate induced increase in surface-ocean stratification has effects on phytoplankton productivity which may lead to an overall decrease in primary production. By the end of 2100, the expected increase in atmospheric carbon dioxide is likely to give rise to an almost three-fold increase i
00 realizations from climate model ensembles, of the likelihood that by 2070, the “Global 200” iconic ecoregions of which the Sundarbans is one will regularly experience monthly climatic conditions that were extreme in 1961-1990, show that up to 86percent of terrestrial and 83percent of freshwater ecoregions will be exposed to average monthly temperature patterns >2 Standard Deviations (2σ) of the
n CO concentration of surface water of the Bay of Bengal; 2
these changes will affect sea water pH and enzymatic activities of phytoplankton (Kawser et al, 2003).
In a recent assessment by Beaumont et al (2010), using >6
4. IMPACTS OF DRIVERS
31
1961-1990 baseline. Tropical and subtropical ecoregions, and mangroves, face extreme 1
conditions earliest, some with <1 °C warming. These results suggest many Global 200ecoregions may be under substantial climatic stress by 2100.
One can more confidently identify perceived changes in the ISD that are due to population rise and market forces. For example, declining fish catch per effort is due to the extraction of near shore biological resources at unsustainable levels (Fisheries Department, 2008). A number of harvesting practices such as ring seining, mini-trawling and purse seining are known for their decimating impacts on the juvenile populations. As elsewhere, fishing operations are not only becoming more mechanised, more people in absolute numbers have also become engaged in this activity in the ISD
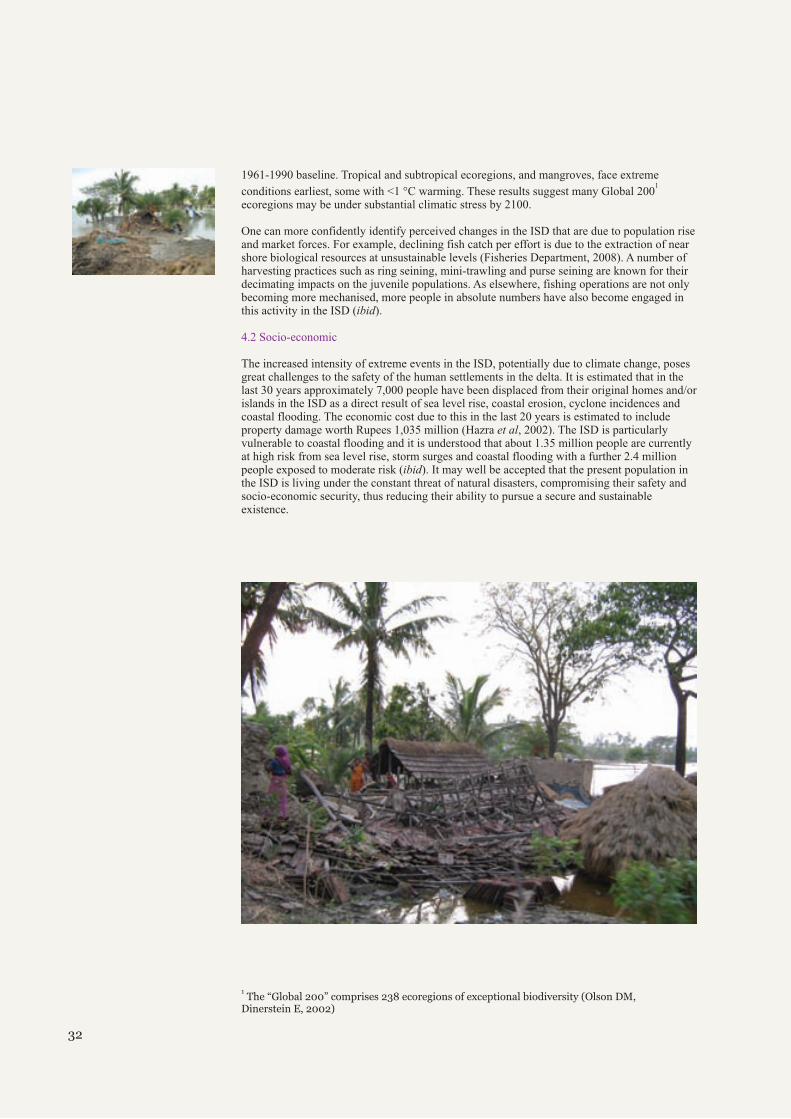
The increased intensity of extreme events in the ISD, potentially due to climate change, poses great challenges to the safety of the human settlements in the delta. It is estimated that in the last 30 years approximately 7,000 people have been displaced from their original homes and/or islands in the ISD as a direct result of sea level rise, coastal erosion, cyclone incidences and coastal flooding. The economic cost due to this in the last 20 years is estimated to include property damage worth Rupees 1,035 million (Hazra
epted that the present population in the ISD is living under the constant threat of natural disasters, compromising their safety and socio-economic security, thus reducing their ability to pursue a secure and sustainable existence.
(ibid).
et al, 2002). The ISD is particularly vulnerable to coastal flooding and it is understood that about 1.35 million people are currently at high risk from sea level rise, storm surges and coastal flooding with a further 2.4 million people exposed to moderate risk (ibid). It may well be acc
4.2 Socio-economic
32
1 The “Global 200” comprises 238 ecoregions of exceptional biodiversity (Olson DM,
Dinerstein E, 2002)
33
Human health issues in the ISD are undoubtedly shaped by the underlying characteristics of the area. A high population density, lower availability of health care facilities and problems with the provision of adequate sanitation all contribute to an increased vulnerability to health risks. Poverty and gender inequity issues are manifested in the fact that West Bengal sits well below the national average in terms of rates of chronic nutritional energy deficiency and anaemia in women, the prevalence of which is ever greater in rural areas such as the ISD. Similarly, children between the ages of 1-3 constitute a particularly nutritionally deprived group. Decreased food security may result in a magnification of these patterns (DPD, 2004).
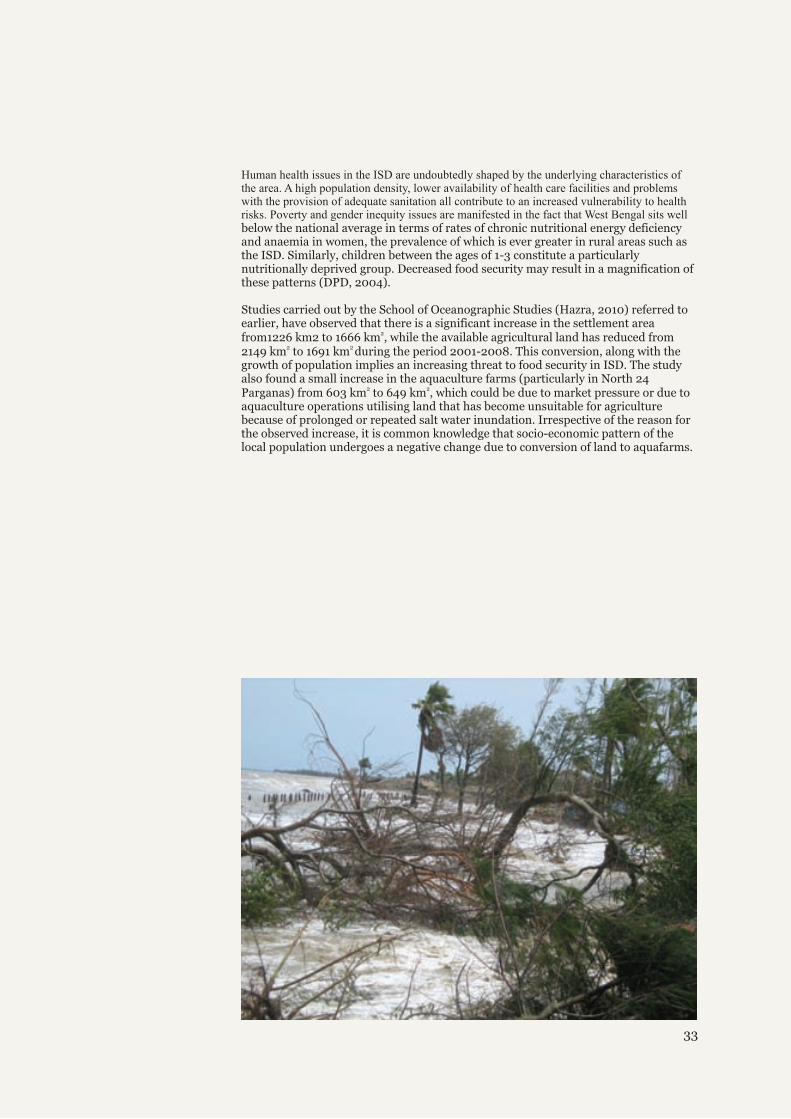
espective of the reason for the observed increase, it is common knowledge that socio-economic pattern of the local population undergoes a negative change due to conversion of land to aquafarms.
Studies carried out by the School of Oceanographic Studies (Hazra, 2010) referred to earlier, have observed that there is a significant increase in the settlement area
2from1226 km2 to 1666 km , while the available agricultural land has reduced from 2 2 2149 km to 1691 km during the period 2001-2008. This conversion, along with the
growth of population implies an increasing threat to food security in ISD. The study also found a small increase in the aquaculture farms (particularly in North 24
2 2Parganas) from 603 km to 649 km , which could be due to market pressure or due to aquaculture operations utilising land that has become unsuitable for agriculture because of prolonged or repeated salt water inundation. Irr
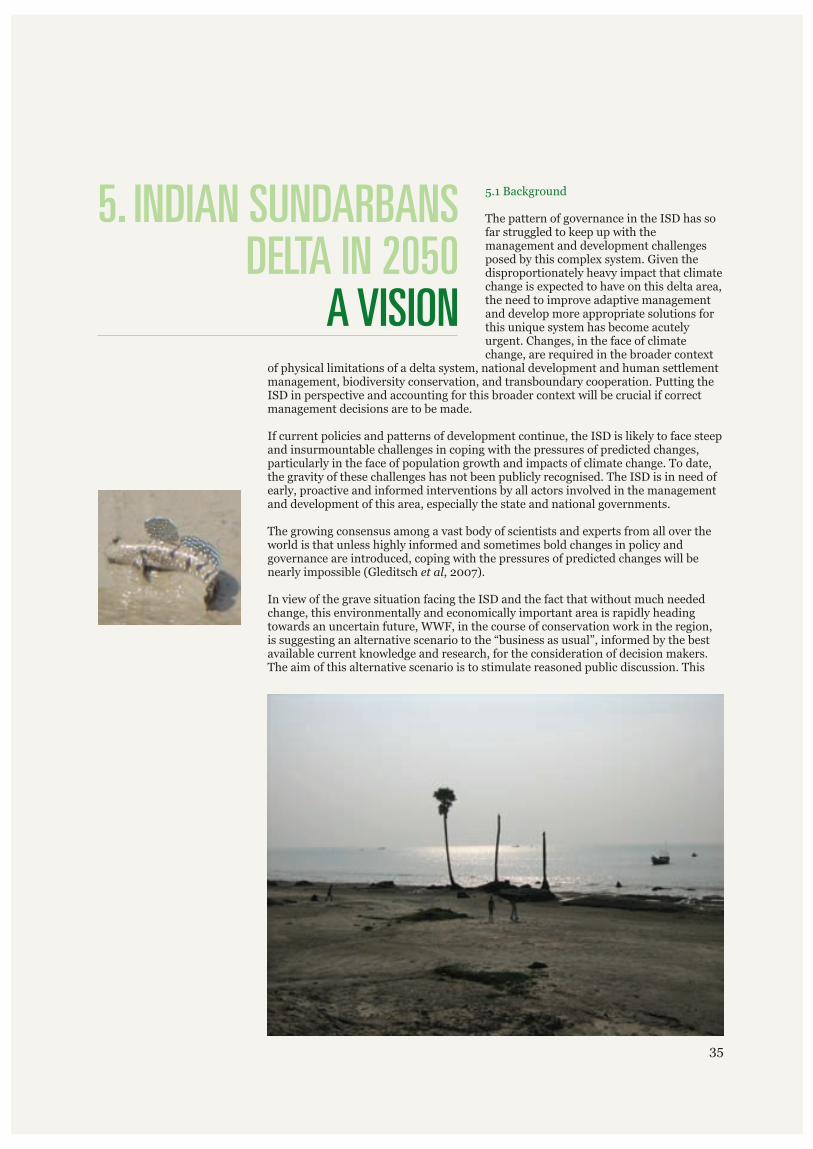
5.1 Background
The pattern of governance in the ISD has so far struggled to keep up with the management and development challenges posed by this complex system. Given the disproportionately heavy impact that climate change is expected to have on this delta area, the need to improve adaptive management and develop more appropriate solutions for this unique system has become acutely urgent. Changes, in the face of climate change, are required in the broader context
of physical limitations of a delta system, national development and human settlement management, biodiversity conservation, and transboundary cooperation. Putting the ISD in perspective and accounting for this broader context will be crucial if correct management decisions are to be made.
If current policies and patterns of development continue, the ISD is likely to face steep and insurmountable challenges in coping with the pressures of predicted changes, particularly in the face of population growth and impacts of climate change. To date, the gravity of these challenges has not been publicly recognised. The ISD is in need of early, proactive and informed interventions by all actors involved in the management and development of this area, especially the state and national governments.
The growing consensus among a vast body of scientists and experts from all over the world is that unless highly informed and sometimes bold changes in policy and governance are introduced, coping with the pressures of predicted changes will be nearly impossible (Gleditsch , 2007).
In view of the grave situation facing the ISD and the fact that without much needed change, this environmentally and economically important area is rapidly heading towards an uncertain future, WWF, in the course of conservation work in the region, is suggesting an alternative scenario to the “business as usual”, informed by the best available current knowledge and research, for the consideration of decision makers. The aim of this alternative scenario is to stimulate reasoned public discussion. This
et al
5. INDIAN SUNDARBANSDELTA IN 2050
A VISION
35
Vision document takes a long-term perspective of 40 years into the future. Where do we want to be by 2050 in terms of the status of the ISD's economy, culture, communities, social and economic indicators, sustainability of the delta's ecosystems, water availability and security from climate change and extreme events?
The Vision 2050 scenario that follows is merely indicative and, within the limits of this short study, cannot by any means be exhaustive. Moreover, the scenario also needs to be put through rigorous economic and social analysis to arrive at benefits that would accrue and the costs involved vis-à-vis the cost of inaction or maintaining status quo. The scenario operates within the boundary conditions laid by the present freshwater flow in River Hugli. It is assumed that freshwater flow in the river will remain at the present levels. The scenario is simultaneously aimed at continued human development with reduced threats from extreme events, and restoration of the mangrove ecosystem and related ecosystem services in the long run. At present, the aim of developing a specific scenario is to stimulate reasoned public discussion and action to consider some of the ideas presented. The scenario can be made operational in a phased manner. WWF, in collaboration with other organisations, will in the immediate future take up economic and social analysis of the scenario to take the vision development process further.
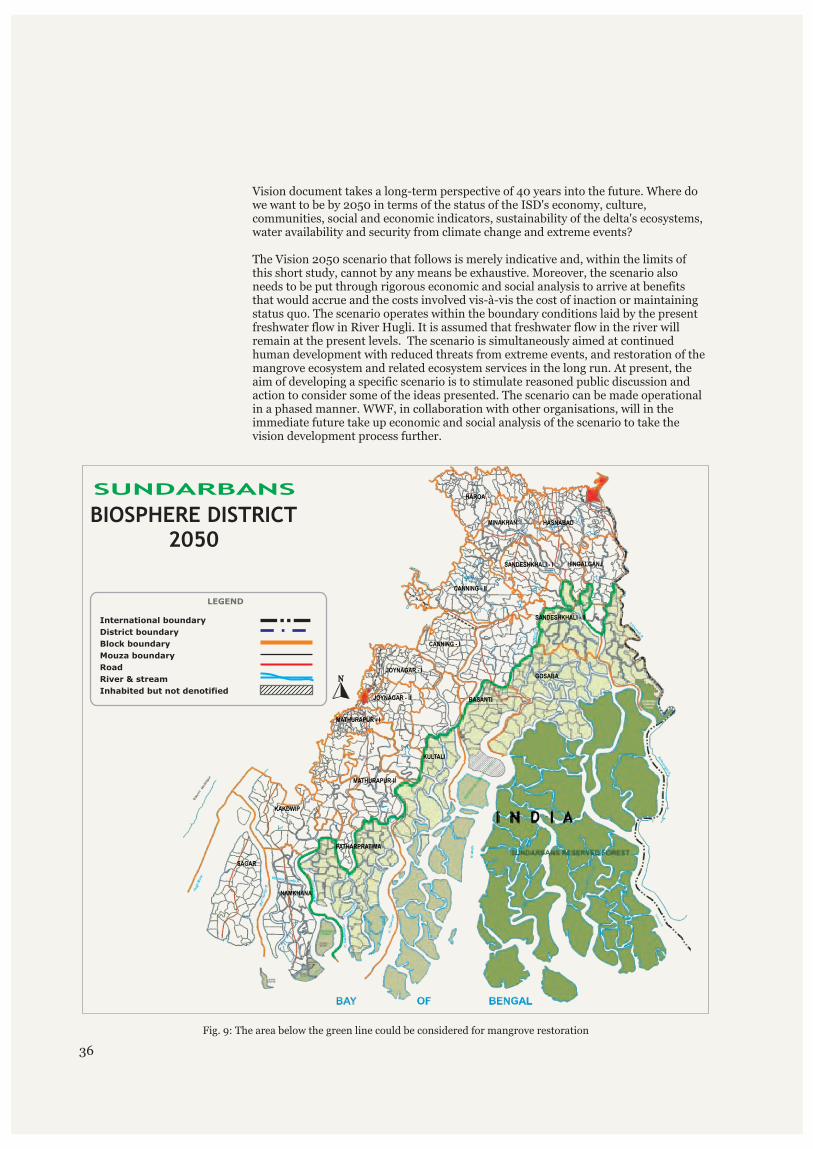
Fig. 9: The area below the green line could be considered for mangrove restoration
36
BIOSPHERE DISTRICT2050
SUNDARBANS
International boundary
District boundary
Block boundary
Mouza boundary
Road
River & stream
Inhabited but not denotified
LEGEND
HINGALGANJ
GOSABA
SANDESHKHALI - II
BASANTI
KULTALI
PATHARPRATIMA
MATHURAPUR-II
KAKDWIP
SAGAR
NAMKHANA
HAROA
HASNABADMINAKHAN
SANDESHKHALI - I
CANNING - II
CANNING - I
JOYNAGAR - I
JOYNAGAR - II
MATHURAPUR - I
5.2 Delta Vision
The Vision: Enhanced protection for human economic activities together with restoration of mangrove forests, and encouragement of phased and systematic outmigration.
In order to provide a safer place for the people to live in as well as to restore the mangrove forests to conserve ecosystems and ensure ecosystem services, including biodiversity, serious alterations in the strategy for the management of the ISD are needed. Decision makers and managers of the ISD will hardly have any control over extraneous drivers of change such as the climate and, to a large extent, market forces. However, they can alter present policies and pattern of governance.
Furthermore, restoration of the mangrove forests and their ecosystem services would expectedly generate good economic returns in the long run. The local as well as global institutions would be jointly responsible for raising the finances for the realisation of this vision. The following scenario is suggested from this background.
However, if the vision is to be realised, the whole process needs to be based on new and interdisciplinary knowledge of science and policy. Therefore, at the very outset, establishment of an independent research institution for taking up interdisciplinary research is suggested as part of the vision. This research institution should have the autonomy to undertake research and create a knowledge centre on the ISD. In this, it should collaborate with national and international centres of research.
Phase I:For making the scenario operational, to begin with, the area of the ISD (19 CD Blocks) should be identified as a single administrative unit instead of being part of two separate districts. Furthermore, the area currently demarcated as the Sundarban Biosphere Reserve (SBR) should be reconstituted as a 'Biosphere District' with “scheduled area” status. The governance structure in the 'Biosphere District' would have to take into account the roles of state Forest Department, especially the Sundarban Biosphere Directorate; Sundarban Affairs Department; and the three-tier local self-government mechanism; all similarly important stakeholders. Additionally, the Fisheries Department, which as of now remains at the margins so far as management of the ISD is concerned, would have to be made an equal stakeholder.
The 'Biosphere District' with “scheduled area” status should institutionalise restriction of outsiders from acquiring land and obtaining permanent residence in the area so as to check population growth through immigration. This would not only help check runaway population growth, but also constrict the land market. This is necessary for two reasons. Firstly, development indicators of the island CD Blocks compare poorly with other CD Blocks of the ISD and the rest of the two 24-Parganas Districts. Secondly, as per its own admission in the District Human Development Reports of 2010, it is going to be an extremely uphill task for the Government to bring the indicators at par with the best in the state and therefore, the population in these CD Blocks (marked by the green line in Fig. 9) need to be provided appropriate mobility and opportunity within the 'Biosphere District' as well as the neighbouring areas. Development of facilities and infrastructure for enhanced opportunities need to precede any encouragement towards mobility, both physical and occupational.
The green line is also approximately the limit of tidally active creeks, indicating the ecological appropriateness of these areas for the restoration of the mangrove forests. This line demarcates 45 Gram Panchayats within six island CD Blocks (Sagar and Namkhana have been left out for reasons that will be explained below) comprising of 207 (revenue villages) which within the 'Biosphere District' would need special support and finances in terms of developing the capacity of the population to make a living from non-farm/secondary or tertiary production activities. Planning for capacity building of this population should be a major activity in Phase I for the implementation of the Vision. Such planning should necessarily be preceded by an exhaustive social audit not only in the area demarcated by the green line on Map 5.1 but also in neighbouring areas.
mouzas
37
connectednessnetworks
Social
exchanges trust
role in decision making
Political
well organised communities
credit wages
Financial
SavingsAssets
Capital
Physical
technologies
producer goodsinfrastructure
knowledge
Humanskills
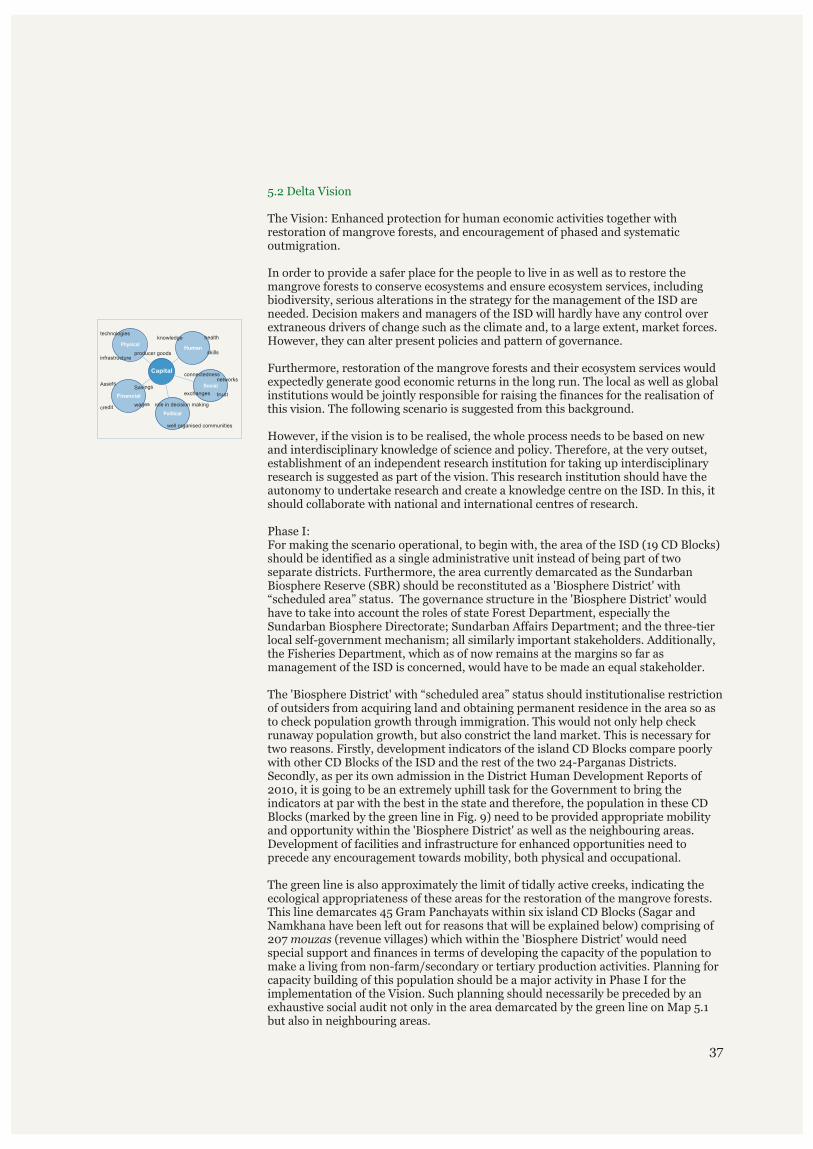
health
ISD in 2050
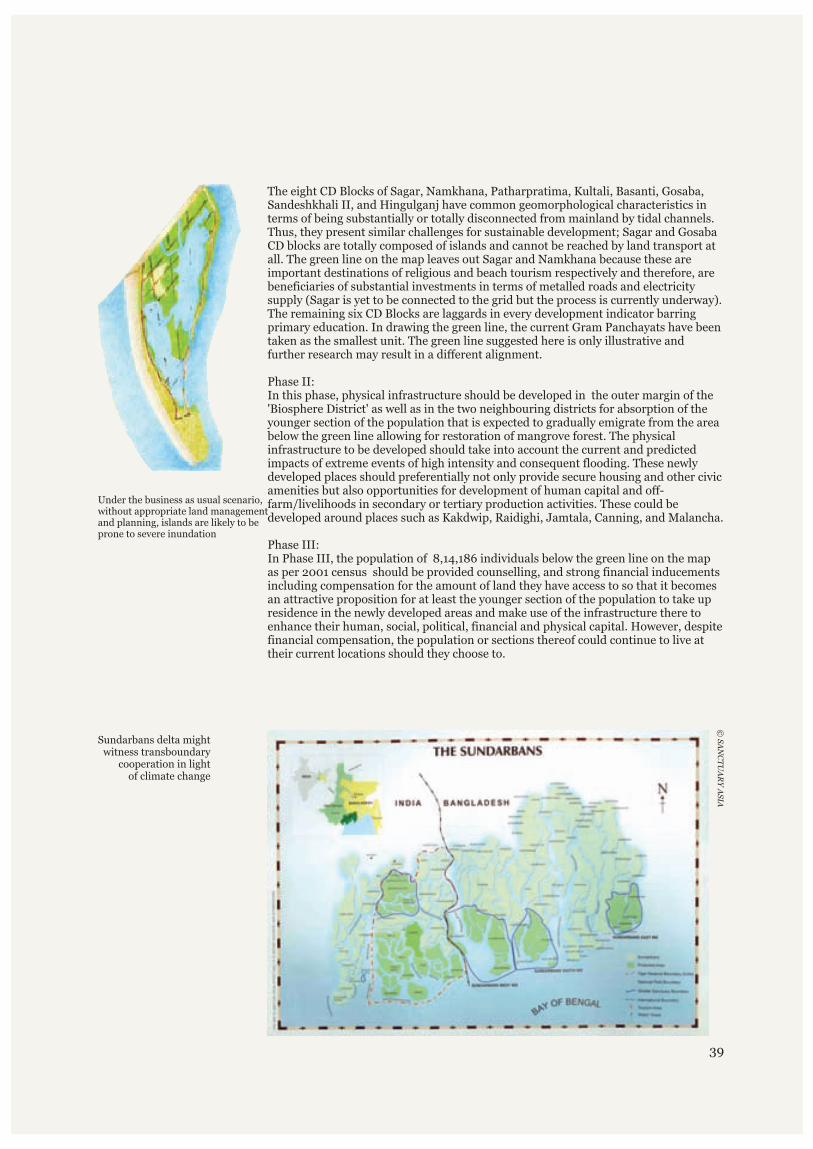
The eight CD Blocks of Sagar, Namkhana, Patharpratima, Kultali, Basanti, Gosaba, Sandeshkhali II, and Hingulganj have common geomorphological characteristics in terms of being substantially or totally disconnected from mainland by tidal channels. Thus, they present similar challenges for sustainable development; Sagar and Gosaba CD blocks are totally composed of islands and cannot be reached by land transport at all. The green line on the map leaves out Sagar and Namkhana because these are important destinations of religious and beach tourism respectively and therefore, are beneficiaries of substantial investments in terms of metalled roads and electricity supply (Sagar is yet to be connected to the grid but the process is currently underway). The remaining six CD Blocks are laggards in every development indicator barring primary education. In drawing the green line, the current Gram Panchayats have been taken as the smallest unit. The green line suggested here is only illustrative and further research may result in a different alignment.
Phase II:In this phase, physical infrastructure should be developed in the outer margin of the 'Biosphere District' as well as in the two neighbouring districts for absorption of the younger section of the population that is expected to gradually emigrate from the area below the green line allowing for restoration of mangrove forest. The physical infrastructure to be developed should take into account the current and predicted impacts of extreme events of high intensity and consequent flooding. These newly developed places should preferentially not only provide secure housing and other civic amenities but also opportunities for development of human capital and off-farm/livelihoods in secondary or tertiary production activities. These could be developed around places such as Kakdwip, Raidighi, Jamtala, Canning, and Malancha.
Phase III:In Phase III, the population of 8,14,186 individuals below the green line on the map as per 2001 census should be provided counselling, and strong financial inducements including compensation for the amount of land they have access to so that it becomes an attractive proposition for at least the younger section of the population to take up residence in the newly developed areas and make use of the infrastructure there to enhance their human, social, political, financial and physical capital. However, despite financial compensation, the population or sections thereof could continue to live at their current locations should they choose to.
Sundarbans delta might witness transboundary
cooperation in light of climate change
Under the business as usual scenario,without appropriate land managementand planning, islands are likely to beprone to severe inundation
© S
AN
CT
UA
RY
AS
IA
39
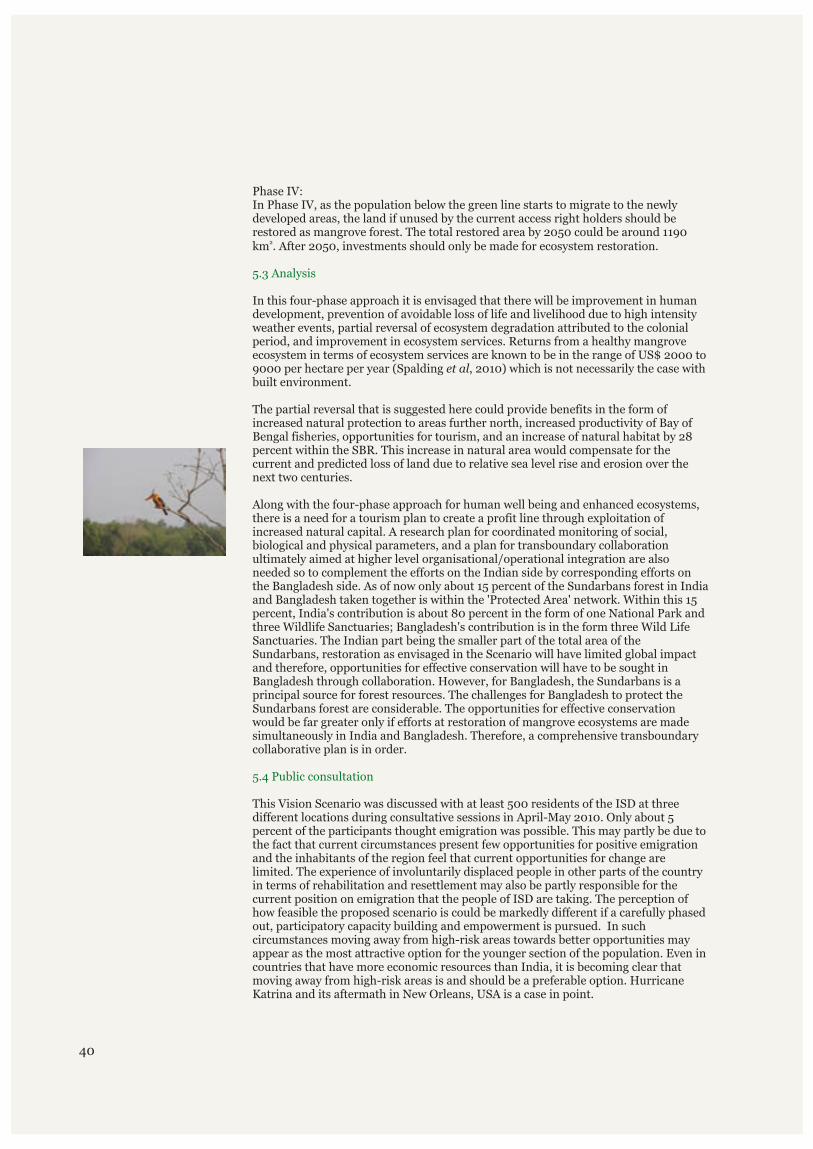
Phase IV:In Phase IV, as the population below the green line starts to migrate to the newly developed areas, the land if unused by the current access right holders should be restored as mangrove forest. The total restored area by 2050 could be around 1190
. After 2050, investments should only be made for ecosystem restoration.
In this four-phase approach it is envisaged that there will be improvement in human development, prevention of avoidable loss of life and livelihood due to high intensity weather events, partial reversal of ecosystem degradation attributed to the colonial period, and improvement in ecosystem services. Returns from a healthy mangrove ecosystem in terms of ecosystem services are known to be in the range of US$ 2000 to 9000 per hectare per year (Spalding , 2010) which is not necessarily the case with built environment.
The partial reversal that is suggested here could provide benefits in the form of increased natural protection to areas further north, increased productivity of Bay of Bengal fisheries, opportunities for tourism, and an increase of natural habitat by 28 percent within the SBR. This increase in natural area would compensate for the current and predicted loss of land due to relative sea level rise and erosion over the next two centuries.
Along with the four-phase approach for human well being and enhanced ecosystems, there is a need for a tourism plan to create a profit line through exploitation of increased natural capital. A research plan for coordinated monitoring of social, biological and physical parameters, and a plan for transboundary collaboration ultimately aimed at higher level organisational/operational integration are also needed so to complement the efforts on the Indian side by corresponding efforts on the Bangladesh side. As of now only about 15 percent of the Sundarbans forest in India and Bangladesh taken together is within the 'Protected Area' network. Within this 15 percent, India's contribution is about 80 percent in the form of one National Park and three Wildlife Sanctuaries; Bangladesh's contribution is in the form three Wild Life Sanctuaries. The Indian part being the smaller part of the total area of the Sundarbans, restoration as envisaged in the Scenario will have limited global impact and therefore, opportunities for effective conservation will have to be sought in Bangladesh through collaboration. However, for Bangladesh, the Sundarbans is a principal source for forest resources. The challenges for Bangladesh to protect the Sundarbans forest are considerable. The opportunities for effective conservation would be far greater only if efforts at restoration of mangrove ecosystems are made simultaneously in India and Bangladesh. Therefore, a comprehensive transboundary collaborative plan is in order.
This Vision Scenario was discussed with at least 500 residents of the ISD at three different locations during consultative sessions in April-May 2010. Only about 5 percent of the participants thought emigration was possible. This may partly be due to the fact that current circumstances present few opportunities for positive emigration and the inhabitants of the region feel that current opportunities for change are limited. The experience of involuntarily displaced people in other parts of the country in terms of rehabilitation and resettlement may also be partly responsible for the current position on emigration that the people of ISD are taking. The perception of how feasible the proposed scenario is could be markedly different if a carefully phased out, participatory capacity building and empowerment is pursued. In such circumstances moving away from high-risk areas towards better opportunities may appear as the most attractive option for the younger section of the population. Even in countries that have more economic resources than India, it is becoming clear that moving away from high-risk areas is and should be a preferable option. Hurricane Katrina and its aftermath in New Orleans, USA is a case in point.
2km
et al
5.3 Analysis
5.4 Public consultation
40