india’s agrarian sector - iim bangalore sector 2013.pdf · –pressure governments to waive...
TRANSCRIPT

India’s Agrarian Sector
http://www.indiapicks.com/stamps/Gallery/1965-69/542_Jai_Kisan.jpg

The Idyllic Vision
• http://www.youtube.com/watch?v=vpqYjAHQtvI
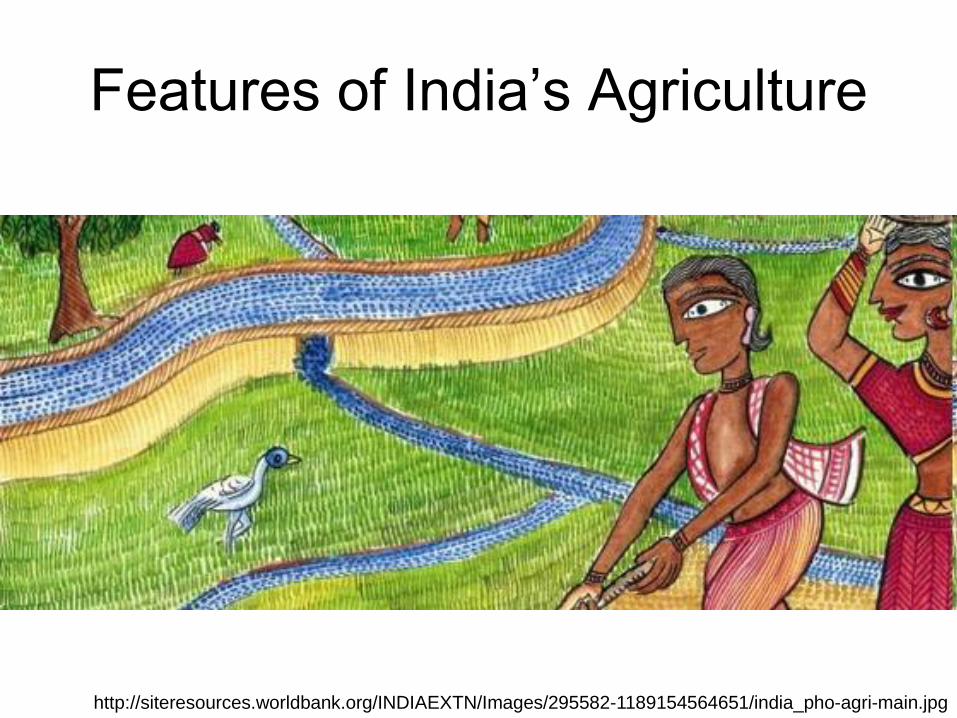
Features of India’s Agriculture
http://siteresources.worldbank.org/INDIAEXTN/Images/295582-1189154564651/india_pho-agri-main.jpg

Still Dependent on the Monsoon
http://3.bp.blogspot.com/_dzRWBihCORo/SELuT7ZjqQI/AAAAAAAAAqs/4T3SbpSNWlE/s1600/530px-India_southwest_summer_monsoon_onset_map_en.svg.png

Abundant Rain
http://tbn1.google.com/images?q=tbn:m-U5Ui1B1DNaxM:http://java.nationalgeographic.com/studentatlas/clickup/images/monsoons.jpg
http://img.timeinc.net/time/photoessays/2007/india_monsoon/india_monsoon_01.jpg

Rampant Drought
http://www.the-south-asian.com/Feb2001/drought_in_rajasthan-pradeep_bhatia.jpg

Labour-intensive Agriculture
http://www.greatmirror.com/images/big/002441.jpg

Traditional Wisdom
http://drh.edm.bosai.go.jp/files/a59443168535ea48a217fc288c6dfb6c688fbd99/TIK7_2.jpg
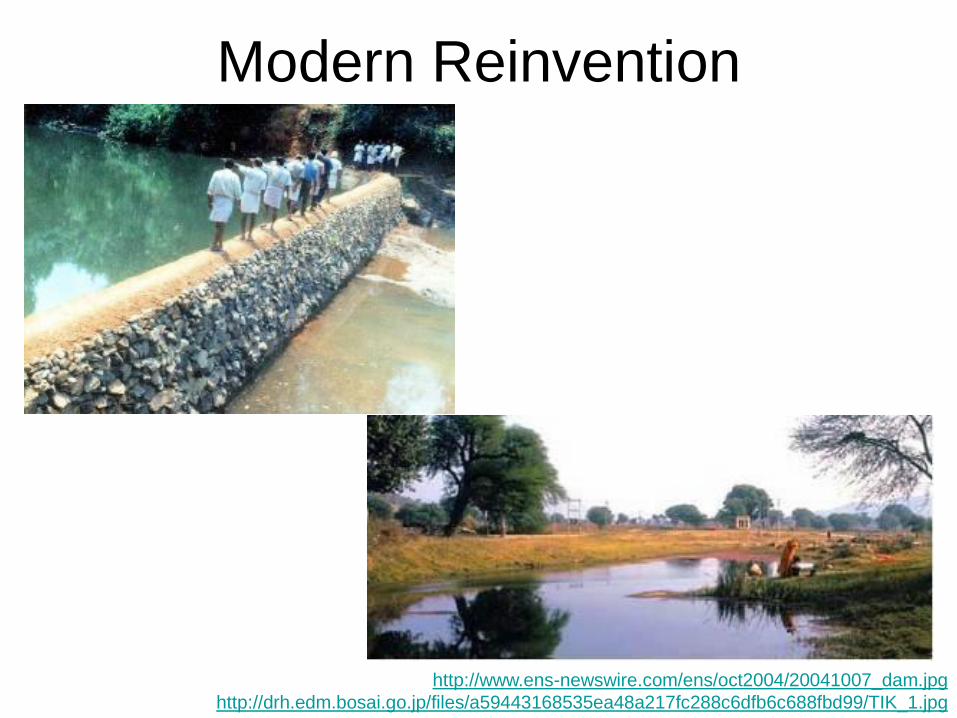
Modern Reinvention
http://www.ens-newswire.com/ens/oct2004/20041007_dam.jpg
http://drh.edm.bosai.go.jp/files/a59443168535ea48a217fc288c6dfb6c688fbd99/TIK_1.jpg

The Changing Composition of India’s
Gross Domestic Product
http://capitalstock.wordpress.com/category/indian-gdp/

Comparing India’s GDP Sectoral
Composition with Other Countries
http://capitalstock.wordpress.com/category/indian-economy/

The Challenge
• The Agricultural Sector in India is still the
source of livelihood to over half of India’s
workforce (58.2% as of 2009-10) (Ministry
of Finance, 2012).
• Targeted growth rate for agrarian sector in
the current Five Year plan is 4%
http://indiabudget.nic.in/es2011-12/echap-08.pdf

The Rural-Urban Divide
Source: The Next Billion Customers, Janamejaya Sinha and Arvind Subramanian, Boston Consulting Group, 2007, www.bcg.com
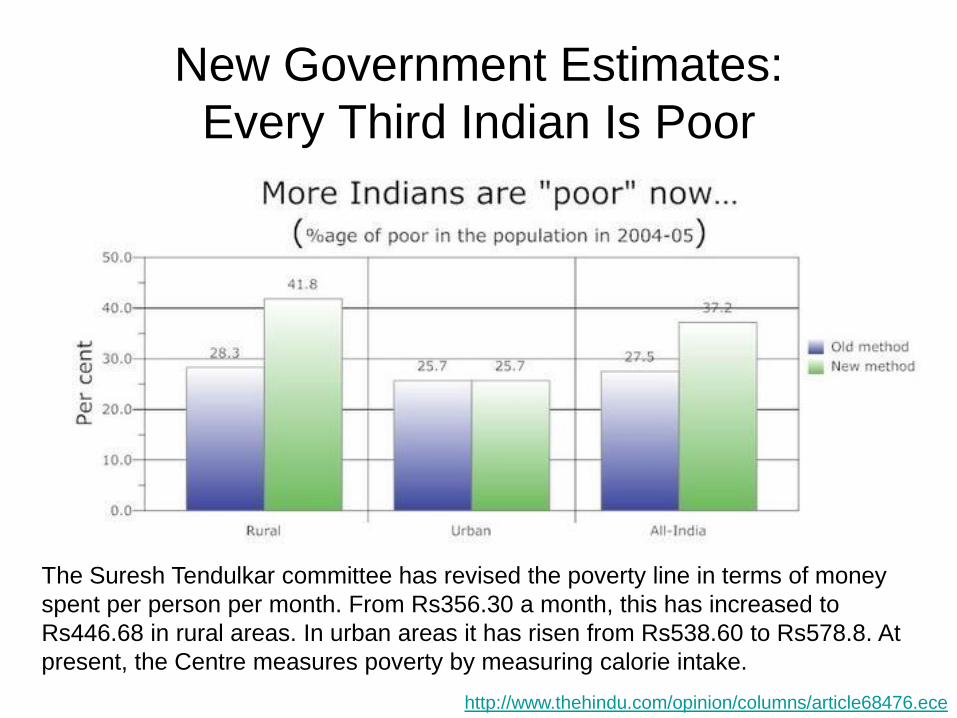
New Government Estimates:
Every Third Indian Is Poor
The Suresh Tendulkar committee has revised the poverty line in terms of money
spent per person per month. From Rs356.30 a month, this has increased to
Rs446.68 in rural areas. In urban areas it has risen from Rs538.60 to Rs578.8. At
present, the Centre measures poverty by measuring calorie intake.
http://www.thehindu.com/opinion/columns/article68476.ece
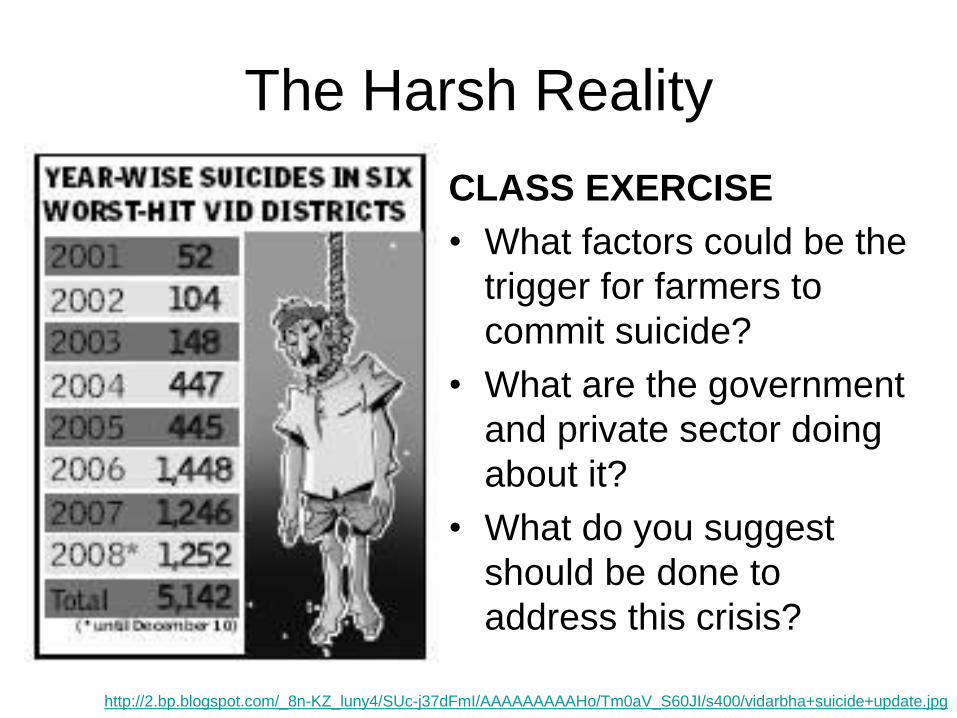
The Harsh Reality
CLASS EXERCISE
• What factors could be the
trigger for farmers to
commit suicide?
• What are the government
and private sector doing
about it?
• What do you suggest
should be done to
address this crisis?
http://2.bp.blogspot.com/_8n-KZ_luny4/SUc-j37dFmI/AAAAAAAAAHo/Tm0aV_S60JI/s400/vidarbha+suicide+update.jpg

Farmers’ Suicides in India:In India, there have been 156,562 farmer suicides during 1995-2004
Of these, more than four-fifths are males
Socio-economic risk factors identified for suicides: Indebtedness (87 per cent) Deterioration of economic status (74 per cent) Conflict with other members in the family (55 per cent) Crop failure (41 per cent) Decline in social position (36 per cent), Burden of daughter’s/sister’s marriage (34 per cent) Suicide in a nearby village (32 per cent) Addictions (28 per cent) Change in behaviour of deceased (26 per cent)
In 79 per cent of the cases, suicide was committed by consuming pesticides
Srijit Mishra: Agrarian Scenario in Post-Reform India: A Story of Distress, Despair and Death, Indira Gandhi Institute for Development
Research, WP-2007-001.

Sainath: A Left Critique• Close to 2/3rds of these suicides have occurred in Maharashtra,
Karnataka, Andhra Pradesh, Madhya Pradesh and Chattisgarh
• They account for just about a third of the country’s population but
two-thirds of farmers’ suicides.
• The rate at which farmers are killing themselves in these states
is far higher than suicide rates among non-farmers.
• Suicides are rising even as the numbers of farmers diminishes.
As many as 8 million people quit farming between the two
censuses of 1991 and 2001.
• The spate of farm suicides – the largest sustained wave of
such deaths recorded in history – accompanies India’s
embrace of the brave new world of neoliberalism.
http://vidarbhacrisis.blogspot.com/2009/02/february-12-2009-neo-liberal-terrorism.html

Government Response
• UPA government announced a Rs. 60,000 Crore Farm Loan Waiver
• Finance Minister P. Chidambaram stated that four crore farmers would have their loans worth Rs.60,000 crore waived.
• The waiver is only for farmers who own less than two hectares of land.
• RELIEF ONLY APPLIES TO BANK LOANS … NOT TO LOANS FROM MONEYLENDERS!
http://3.bp.blogspot.com/-syFkuAHheKQ/UHdkRlrC4AI/AAAAAAAABWs/BWYxGoPHWMI/s200/FarmerLoan.jpg

• BUT– “Only around 35 per cent of
the farmers here have land
below two hectares. Of
them, we don’t yet know the
number that will be eligible
for loan waiver. Very few
farmers in Vidarbha will
actually benefit,”
– “Mostly, the big landholders
will benefit. They have
already divided their
landholdings amongst the
brothers. The poorer
farmers have not.
http://www.thehindu.com/fline/fl2506/stories/20080328250601800.htm

What Typically Happens to Relief Funds?
http://image07.webshots.com/7/4/4/79/85440479lsOast_ph.jpg

Types of Drought• Droughts can be of three kinds:-
• (i) Meteorological drought: – This happens when the actual rainfall in an area is significantly less
than the climatological mean of that area. The country as a whole may have a normal monsoon, but different meteorological districts and sub-divisions can have below normal rainfall.
• (ii) Hydrological drought: – A marked depletion of surface water causing very low stream flow and
drying of lakes, rivers and reservoirs
• (iii) Agricultural drought: – Inadequate soil moisture resulting in acute crop stress and fall in
agricultural productivity
• But droughts often become the excuse for a massive diversion of resources to less deserving areas …
www.rainwaterharvesting.org/Crisis/Drought.htm

Everybody Loves a Good Drought:
P. Sainath• Well-intentioned programs get diverted to private
pockets or undeserving areas
• Underlying causes of drought or long term remedies forsaken for short term drought relief
• Creates industry of contractors and fund users
• Creates incentive to be declared drought-hit
• Opens up huge flow of relief projects & funds
• Maharashtra: 73% sugar is grown in areas officially declared as drought hit!
• Lion’s share of funds/water goes to rich farmers
• Drought relief becomes the “Teesri Fasal” (third crop)

Credit and the Poor
http://faculty.chicagobooth.edu/raghuram.rajan/research/papers/India%20financial%20sector%20reform%20talk.pdf

Rates of Interest Paid for Credit
http://faculty.chicagobooth.edu/raghuram.rajan/research/papers/India%20financial%20sector%20reform%20talk.pdf

True Cost of Making a Small Loan
However, governments mandate that public sector
banks lend 40% of their credit to the Priority Sector, i.e.,
the poor, at the prime lending rate, i.e., around 10-12%

True Cost of Obtaining Loans

Addressing Systemic Issues:
Rural Credit• Problems with Formal Banking System• Inadequate
• Constraints on timely availability
• High cost
• Neglect of small and marginal farmers
• Continued presence of informal markets.
• Commercial banks focused on improving efficiency and
profitability, so give less priority to rural credit.
• Regional Rural Banks (RRBs) and Co-operatives face serious
problems of governance as well as operational efficiency.
• Co-operative Credit structure is multi-layered, under
capitalized, over-staffed and under-skilled, often with
mounting non-performing assets

What Farmers Need, Creditwise
• Timely credit
• Risk mitigation– Crop insurance
– Forward, Futures and Options markets
• Instead, farm loan waivers and relief packages, while well-intentioned and compassionate, affect the creation of a sound credit culture
• Introduce moral hazard and gaming– Pressure governments to waive loans, crisis or not
• Act as disincentive for the formal banking sector to venture farmwards

Instead, Farmers Turn To Traditional
and Ready Sources of Capital:
The Moneylender
A Chettiar Moneylender
Quentin Metsys, The
Moneylender and his
Wife, 1514
http://4.bp.blogspot.com/_E3u6VPiHJy4/SRmRAZNbc2I/AAAAAAAAB6E/j5uOvgBSjyg/s320/MoneyLender.jpg
http://thestar.com.my/archives/2009/7/18/lifefocus/f_04chettiar1.jpg

An Example of How Rural
Moneylending (Usury?) Works
• For a loan amount of Rs 5,000, Rs 3,750 is actually handed over; the remaining Rs 1,250 is kept as advance-interest.
• The amount would be collected in 10-weekly installments of Rs 500 each. The disbursal and collection are compressed into a two-and-a-half month cycle.
• Though there may be no penal interest for weekly default, the rates still remain atrociously high.
• When Rs 1,250 is charged for an actual loan of Rs 3,750, the rate of interest works out to 33.33 per cent (even if we overlook the fact that the interest is front-loaded).
• Collected in 10-weekly instalments, the outgo works out to 3.33 per cent a week.
• On an annual basis, the cumulative interest works out to a staggering 170-plus per cent.
http://www.thehindubusinessline.com/todays-paper/tp-opinion/the-moneylenders-of-meloor/article1618718.ece?ref=archive

Why Turn to Moneylenders?
• Money often needed for consumption … to
survive from harvest to harvest
• Money required to buy seeds for planting
• Collateral offered by rural people usually not
“marketable”
• Rural credit has highly personalized character—
creditors often of higher social status and power
than borrowers; can also be wealthy landowners
• Access to formal credit alternatives limited

Alternatives:
Microfinance
http://a3.vox.com/6a00c2251e3f928e1d00e398b4edb30004-320pi
http://famousquoteshomepage.com/Images/Muhammad_Yunus_Banker_Entrepreneur_To_Poor_People.png
Grameen Bank—Bangladesh
• Muhammad Yunus’s Discoveries– Banks won’t lend to poor, despite them maybe being good risks
– Poor require only micro amounts to transform economic power
• Owned entirely by the poor– Began in one village in 1976
– 97% of equity owned by (women) borrowers, rest by government
– 2.6 million borrowers (95% women), over 1,000 branches in over 42,000 villages. 12,000 staff.
• Has loaned more than US$3.9B since inception– Over US$3.5B repaid with interest (98.75% recovery rate); $290M
loaned in the last 12 months.
• Has never accepted any charity—has always been run as a profitable social enterprise
• 46.5% of Grameen borrowers have crossed the poverty line

Grameen Bank
• Small loans to very poor people giving them the
means to generate income & work their way out of
poverty
• Create a new culture of confidence and self-dignity
by building businesses that are not at the mercy of
anybody
• High rates of repayment because of social pressure
and cooperation within the self-help group
• Recipients of loans are mainly women

Grameen’s Social Enterprises
• Grameen Network
– Dairy, Telecom,
Energy
– Education,
Aquaculture
– Grameen ‘check’
(fashion!)
• Successes
– Grameen Shakti
– Grameen Danone
– Village Phone
Source: A different entrepreneur: Iqbal Z. Quadir, GrameenPhone

Raging Debates
• Is microcredit really alleviating poverty?
• Is microcredit the right tool for development?
• High interest rates and perpetual debt trap– Are mfi’s just formal ‘moneylenders’?
• Profit motives and orientation– Commercial or charity?
– “Poor people should not be considered an opportunity to make yourself rich” – Muhammad Yunus

SKS Microfinance’s IPO
• India’s largest MFI; operational model: McDonalds and Starbucks.
• 28 percent interest rate; Value of loan outstanding CAGR of 147.7%
• Net profit CAGR of 221% to Rs1.7 billion in fiscal 2010, based on a revenue of Rs9.6 billion.
• IPO oversubscribed by institutional investors; Akula made ~$55 m
Vikram Akula
Muhammad Yunus:
"Vikram is a very capable young
man. But he took a wrong turn
when he decided to use
microcredit for making money."
http://www.microfinancefocus.com/news/2010/08/02/tepid-retail-response-to-sks-microfinance-ipo/
http://in.reuters.com/article/idINIndia-49800220100701
http://online.wsj.com/article/NA_WSJ_PUB:SB10001424052748703609004575355460120599280.html
Current Trends
• Moving from microcredit to microfinance
• Increasing private sector participation
– Capital, Consulting
• Building on microcredit to go beyond
– Livelihoods, Healthcare, Education, Production, Savings
and Asset Building
• Too much microcredit chasing too few people
• Andhra Pradesh crackdown on microfinance sector
loan collection practices has created a default crisis
Photo: Unitus

The Changing Rural Context
http://www.internationalsteam.co.uk/mills/pics06/india06060.jpg
http://www.dlcache.indiatimes.com/imageserve/03nd1EB6NidXS/x160.jpg
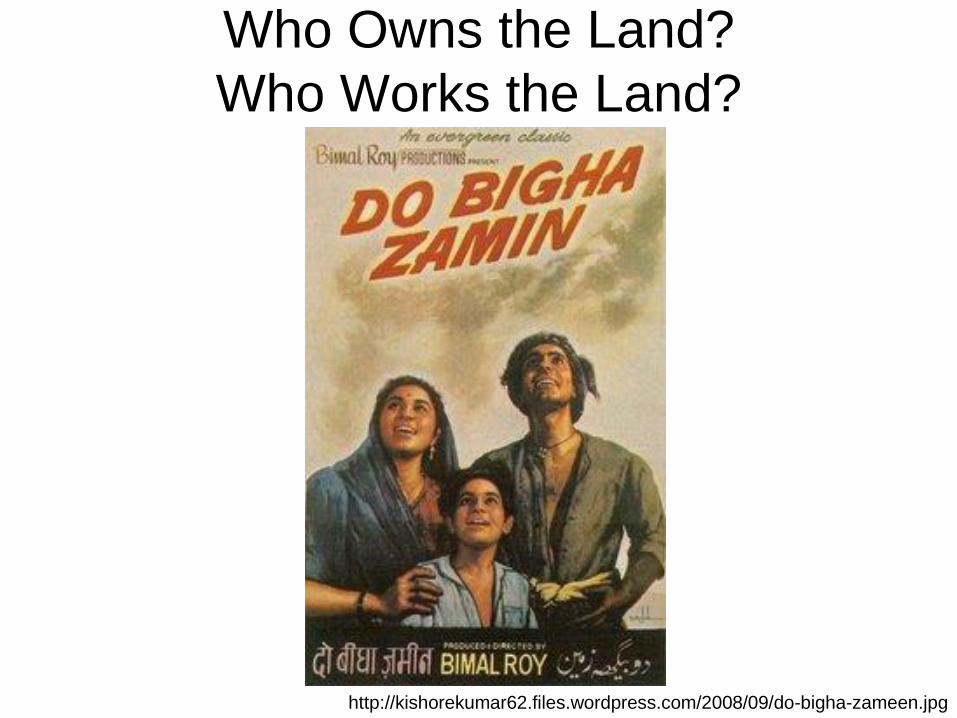
Who Owns the Land?
Who Works the Land?
http://kishorekumar62.files.wordpress.com/2008/09/do-bigha-zameen.jpg
Land Reforms
• Institutional Reforms (1947-60s)—relative success– Abolition of intermediaries (zamindars)
– Tenancy reforms—security of tenure for tenants or ownership to tenants
– Ceilings on landholdings
– Cooperativization—fails, opposed strongly in Congress
• Alternative Approaches: Bhoodan Movement– Vinoba Bhave succeeds in getting voluntary contributions
of land—ultimately less impact
• Family size increase over generations is naturally resulting in equitable ownership of land– Smaller holding may not be that viable economically

Land Title: Bhoomi Project
• Karnataka pioneers computerization of land records
• Aim is to ensure that records are not tampered
with—require biometric verification before changes
• Checks corruption at village accountant level
• Improves transparency and access to records—
kiosks now available where land record printouts
can be obtained for a nominal fee, immediately
• Improved land records and titles can help farmers
use their land as collateral for loans etc.

The Green Revolution
http://gallery.photo.net/photo/5720147-lg.jpg

• Improved varieties of rice and wheat, combined with the expanded
use of fertilizers, other chemical inputs, and irrigation, led to
dramatic yield increases
• In Asia, between 1970 and 1995, agricultural yield doubled while
population only grew 60%
• Instead of widespread famine, cereal and calorie availability per
person increased by nearly 30%
• Wheat and rice became cheaper.
• Sizable increases in returns to land; multiple crops now possible
• Increase in farmers’ incomes, new needs for farm inputs, milling
and marketing services, stimulated the rural nonfarm economy
• Rural nonfarm economy, in turn, grew and generated significant
new income and employment of its own.
http://www.ifpri.org/pubs/ib/ib11.pdf

• Real per capita incomes doubled in Asia between 1970 & 1995
• Poverty declined from nearly three out of every five Asians in
1975 to less than one in three by 1995.
• Absolute number of poor people fell from 1.15 billion in 1975 to
825 million in 1995 despite a 60 % population increase.
• In India, the percentage of the rural population living below the
poverty line fluctuated between 50 and 65 percent before the
mid-1960s but then declined steadily to about one-third of the
rural population by 1993.
• Research show that much of decline in poverty is attributable to
agricultural growth and associated declines in food prices.
• In India the government procured and stored large amounts of
foodgrains; famines became history; poor were provided
foodgrains through public distribution systemhttp://www.ifpri.org/pubs/ib/ib11.pdf

• Green Revolution created wide regional & interstate disparities.
• Worked well in areas with assured supplies of water and where
farmers used large amount of fertilizers, & had adequate farm credit.
• Worked well in Punjab, Haryana, western Uttar Pradesh
• Increased income disparities: higher income growth and reduced
incidence of poverty only in above states; little change elsewhere.
• Green Revolution has also been criticized as unsustainable.
– It requires immense amounts of capital each year to purchase equipment and
fertilizers. This may lead to a cycle of debt if a farmer is unable to pay off the
loans required each year.
– Also, the crops require so much water that water tables in some regions of India
have dropped dramatically (excess groundwater extraction; free electricity).
– If this drop continues, it is possible lead to desertification.
– Already, the low water table is starting the process of salinization.
– If it continues, this would leave the land infertile, spelling disaster for India.http://en.wikipedia.org/wiki/Green_Revolution_in_India

MS Swaminathan’s Assessment• In 2008 we harvested nearly 80 million tons of wheat.
• Ordinarily, that would require 100 million hectares of land, but we
were able to produce this amount from 26 million hectares.
• So Green Revolution is land-and-forest-saving agriculture.
• Now we see a move "from the green to the greed revolution,"
where you apply more fertilizer and pesticides.
• Unsustainable!
• What we need is an Evergreen Revolution—the means to improve
productivity in perpetuity without ecological harm.
• Practice mainstream ecology in technology development and
change attitude from a purely commodity-centered approach.
• For example, shift from sole production of wheat or rice or
sorghum, to a farming systems approach with crop rotation. So
don't only grow wheat all the time, bring in a legume or so.
http://foodtank.org/resource-database-files/33/=Swaminathan.pdf

Subsidies & Their Distortions
• Fertilizer Subsidy
– Goes partly to fertilizer firms in an inefficiency-
encouraging way (cost-plus)
– Encourages excessive use of chemical fertilizers
• Free Electricity and Water
– Regressive: bigger the farmer, more power and water
he uses
– Distortionary: lead to wasteful use of canal water =>
waterlogging and excessive groundwater mining
– End result: Power neither of good quality or quantity in
rural India

Farm Incomes Can Improve If
Value Chain is ReconfiguredNeed a new agriculture
supply chain that removes non-value adding intermediaries
Partnership with value adding intermediaries of the supply chain
• Technology transfer
• Streamline processes
• Maintain Quality

Case Study:
Bangalore Fruit & Vegetable Markets
http://aycu10.webshots.com/image/28489/2002841372151354354_rs.jpgSource: D. Ashok & S. Raghunath, IIM Bangalore

Field Study : Scope
• Cultivation area covered
– Hosakote & Kolar taluks of Bangalore region
• Wholesale markets covered
– New Kalasipalyam Market, Bangalore – Vegetables
– Binnypet market, Bangalore– exclusively for Banana
– Yeshwantpur APMC, Bangalore
• Vegetables and fruits selected for study
– Tomato, Potato, Cabbage, Cauliflower and Banana

The Context of Indian Fresh Fruit and
Vegetables industry
• Second largest producer of vegetables in the world
– Second only to China
– Accounts for about 15% of the world’s production of vegetables
• Largest producer of fruits in the world
– Accounts for about 8% of the world’s production of fruits
• Constitute around 10% of the total agricultural production of
the country (Approximate size Rs 25,000 crores)
• Expected size of food industry : Rs 500,000 crores
– Expected size by 2005
(FAIDA Revisited – Realising the potential, January, 2004 by
McKinsey & Company prepared for CII)
… F&V production in India is high, and opportunities in the field are large

Yet… The Efficiency Of The Agri Produce
Supply Chain Is Not Even A Patch On The
Indian Manufacturing Supply Chain
Numerous intermediaries
High Level of Wastages
Lack of transparency – prices, availability, demand,
customer preferences
Poor Infrastructure – Storage, Packaging,
transportation / no cold chain
Poor linkages in the marketing channel

Numerous Intermediaries
Farmer
Consolidator
Wholesaler
Semi-wholesaler
Retailer

Tomato Potato Cabbage Cauliflower Banana
Price paid by end
consumer (Rs. Per kg)
8.20 12.00 9.00 9.50 12.00
Price received by
farmer (Rs. Per kg)
2.00 6.60 5.00 5.50 4.00
Price realization by
farmer as % of end
consumer price
24% 55% 56% 58% 33%
Mark up (price paid by
end consumer to the
price received by
farmer
310% 82% 80% 73% 200%
•Price received by farmer varies from 24% to 58% of end consumer
price for different produces
Field Study Findings : Price

Description Cumulative Wastage
Potato 24%
Cauliflower 24%
Banana 30%
Cabbage 36%
Tomato 40%
High cumulative wastages across the supply chain varied from 24% (for potato) to 40% (for tomato)

• Poor and multiple handling
• Improper bagging without crating
• Lack of temperature controlled vehicles and storage facilities
• Poor roads, warehouses and market yards
•No cold chain
It is estimated that post harvest losses
in India are typically around 30%
- i.e. ~ Rs 30,000 Crores per year!
Poor Handling & Infrastructure

Improvements in Distribution System
Adopt global best practices
• Storage– Post harvest storage facilities
– Collection centers
– Cold chain
• Packaging– Special purpose containers to prevent transportation damages
– Protection from contamination
– Not imparting any toxic substance
• Handling– Specialty handling tools and equipments
• Transportation– Freighters
– Multi modal transport services
• Logistics service provider– Storage, warehousing and material handling services

Improvements in Distribution System
Adopt global best practices which are
present in developed countries
• Value added services– Grading, sorting and packaging facilities leading to
standardization
– Ripening and primary processing facilities
… adoption of good post harvest practices can result in
significant cost savings due to wastage reduction and
economies of scale


Case Study: ITC’s E-Choupal
• http://www.youtube.com/watch?v=qkHWd
hobgiM
http://archives.digitaltoday.in/businesstoday/20070225/grfx/garden.jpg

Transaction Costs in Mandi ChainSoybeans Example
Farmer Incurs
Trolley Freight to Mandi = 120
Labour = 50
Kacchha Adat = 150
Handling Loss = 50
Rs per MT
370
Processor
Incurs
Commission to Agent = 100
Cost of Gunny Bags (net) = 75
Freight to Factory = 120
Handling at Mandi = 40
335
Total Chain 705

Transaction Costs in Choupal ChainSoybeans Example
Farmer Incurs
Trolley Freight to ITC Hub = 120
Labour = 50
Kacchha Adat = 150
Handling Loss = 50
Rs per MT
370
Processor
Incurs
Commission to Sanchalak = 100
Cost of Gunny Bags (net) = 75
Freight to Factory = 120
Storage & Handling at Hub = 40
335
Total Chain 705
120
50
Cash Disbursement Costs = 50
215
335

Spinoffs: Rural Malls
ITC’s Warehouse Hubs have transformed into Rural Malls
called Chaupal Sagars that serve as a sales channel for
other companies’ products & a hub for medical services, etc.
http://www.itcportal.com/newsroom/images/itc-04.jpg

Gandhi’s Talisman
• "I will give you a talisman. Whenever you are in doubt, or when the self becomes too much with you, apply the following test. Recall the face of the poorest and the weakest man [woman] whom you may have seen, and ask yourself, if the step you contemplate is going to be of any use to him [her]. Will he [she] gain anything by it? Will it restore him [her] to a control over his [her] own life and destiny? In other words, will it lead to swaraj[freedom] for the hungry and spiritually starving millions?Then you will find your doubts and your self melt away."
UPA Government Initiatives:
Their Philosophy
Image sourced from: http://www.boloji.com/plainspeak/050.jpg


National Rural Employment Guarantee Act
(NREGA)

Chronology of Employment Programmes In
India1970-80 Twenty Point Program
Food for Work Program
Training rural youth for Self-employment TRYSEM
1980-90 National Rural Development Program
Rural landless Employment Guarantee Program
Jawahar Rozgar Yojna (JRY) (employment to the rural unemployed)
Nehru Rozgar Yojna (NRY) (employment to urban unemployed)
Employment Assurance Scheme
Swaran Jayanti Gram Swarajgar Yojna/Jawahar Gram Samriddhi Yojna
1990-00 Employment Assurance Scheme
Swaran Jayanti Gram Swarajgar Yojna/Jawahar Gram Samriddhi Yojna
2000- Sampoorana Grameen Rozgar Yojna
National Food for Work Program
National Rural Employment Guarantee Scheme
(Jawahar Rozgar Yojna+ Employment Assurance Scheme
+ National Food for Work Program + Sampoorna Grameen
Rojgar yojna merged with NREGA)

Key features of NREGA
The Act The Mahatma Gandhi National Rural Employment Guarantee Act aims
at enhancing the livelihood security of people in rural areas by
guaranteeing hundred days of wage-employment in a financial year to
a rural household whose adult members volunteer to do unskilled
manual work.
Other
Provisions
Employment within 15 days of application.
Unemployment allowance.
Work within 5 kilometres.
Minimum wages.
Payment within 15 days.
No gender discrimination.
Basic worksite facilities.
What kind
of work is
provided?
Twin objectives of Rural development and employment.
water conservation and harvesting, afforestation,
rural connectivity,
flood control
digging of new tanks/ponds, percolation tanks and construction of
small check dams, land leveling, tree plantation
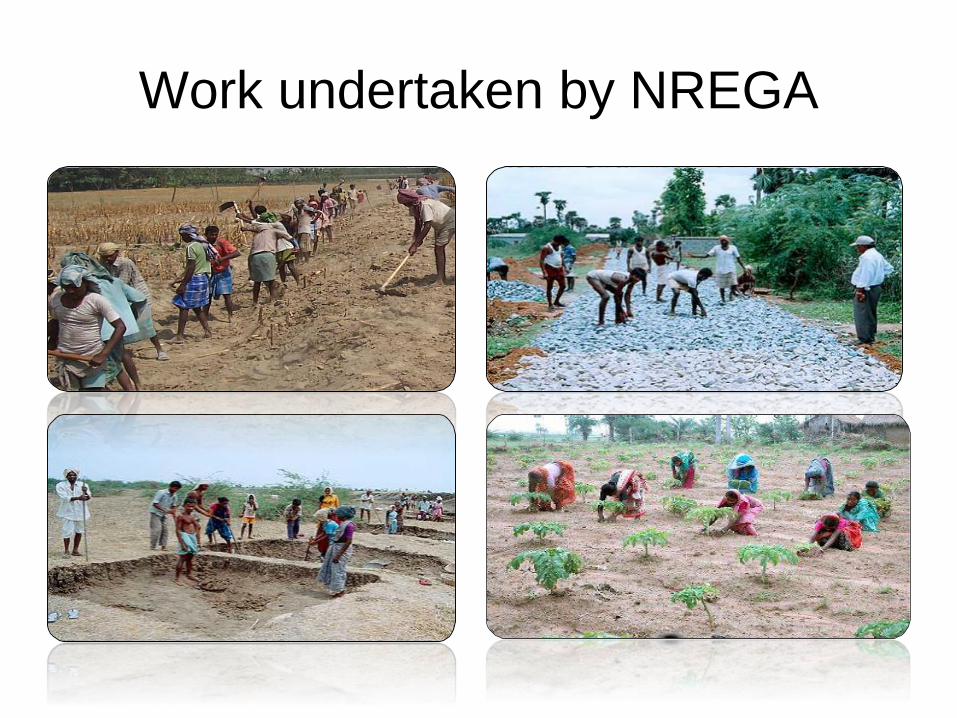
Work undertaken by NREGA


Advantages
• Self selecting and voluntary participation
• Does not distort local market as people will
choose higher paid work when available
compared to minimum wage here
• Social audit by community, (on the lines of Right
to Information) ensures transparency
• Crucial rural infrastructure is created
• Relevant projects are chosen by locals
• Prevents disruptive, forced migration
• Provides crucial safety net for poorest of poor

NREGA: Country-wide performance 2010-11
119824438
55756087
54947068
Households issued jobcards
Households who have demandedemployment
Households provided employment
Country summary for 2010-11
•Total govt. expenditure was around 39377 crores of rupees for a total
of 25715 lakhs of person-days employment provided
Men52%
Women
48%
Break-up of Persondays
SCs31%
STs21%
Others
48%
Break-up of Persondays

The Challenges Ahead
• Fake Job Cards and irregularities with entering the wage
hours!
• Timely wage payments.
• Could adversely affect overall wage rate
• Delays in work application process.
• Implementation of transparency safeguards
• Women’s participation has to be sustained
• Institutional systems for grievance redressal

Can Demand from Growth & Urban
Sectors Benefit Agriculture?
Challenge: Financing diversification; cash crops

The White Revolution
http://www.imagesofasia.com/html/india/images/large/buffalo.jpg
Painted postcard by M. V. Dhurandhar
http://www.unicef.org/india/white-revolution1.jpg
http://expresions.files.wordpress.com/2007/08/amul.jpg

History
• 1946 Anand, Gujarat– Farmers, keen to free themselves from intermediaries
and gain direct access to markets to ensure maximum returns, set up Kaira District Milk Cooperative Union.
• Inspiration: Vallabhai Patel; Push: Morarji Desai
• Organizer: Tribhuvandas Patel, a local farmer and a freedom fighter.
• It was only a chance meeting between Tribhuvandas Patel and a US-returned dairy engineer Verghese Kurien that changed the course of India’s dairy industry and made Anand a big success story.
http://business.outlookindia.com/inner.aspx?articleid=1295&editionid=3&catgid=82&subcatgid=780

• What began as a collection and processing
centre for milk brought everyday by farmers for
further sale to the Bombay Milk Scheme, soon
expanded to include a host of support services
for the farmers.
• From helping them avoid disasters such as the
death of their cattle to providing vet care, it also
included supplying good quality cattle feed and
facilities for artificial insemination.

Key Features
• Decentralized milk production by the
small milk producers
• Milk procurement by the village-level
dairy cooperative societies
• Centralized milk processing by the
district-level unions
• Marketing of milk and milk products by
the state-level federations

Farmer-owned and Run
Cooperatives• The most striking feature of the three-tiered Anand model
is the farmers’ participation in each and every activity.
• From the village co-operative to the district level and finally at the state-level, it is the fiat of the farmers that runs the whole system.
• It is only at the state level that there is a federation of marketing professionals like the Gujarat Co-operative Milk Marketing Federation (GCMMF) in Gujarat to market the products, but again selected by state dairies.
• It is this body of trained marketing professionals that plans what products to sell, where and in what quantity.
• It is not guided by the objective of maximising profit but to provide the best price to farmers.

GCMMF & Amul
• Amul, the flagship for a host of dairy products marketed by GCMMF has become Asia’s largest milk brand and now aims to become the No 1 in the world.
• The facts:
– milk collection has jumped from 10,908 lakh litres in 1995-96 to 22,826 lakh litres in 2005-06;
– the number of producer-members (read farmers), too, has grown from 17,94,919 in 1995-96 to 24,88,232 today; and
– the number of village societies has increased from 9,413 to 11,962.
– Amul is clearly a market leader in the milk category in Gujarat and Kolkata. It has 35% of the ice cream market, 88% of butter, 65% of milk powder, 70% of condensed milk and around 50% of shrikhand.

Marketing Muscle
• Despite its co-operative status, it is neither a marketing minnow nor a laggard in terms of promotion campaigns.
• With 47 sales offices, more than 3,000 dealers and 5 lakh retailers, GCMMF’s marketing network allows it to easily flood the market creating a strong entry barrier.
• In August 2001, when Nestle wanted to introduce its brand of butter, it found countrywide refrigerators stocked with Amul butter.
• Similarly, its topical, witty and humourous advertisements, especially hoardings and memorable slogans—"Utterly Butterly Delicious" for butter—-have all served the cause of high recall, powerful appeal and a sustained awareness of the product.

Achievements of Indian Dairy
Cooperatives, 2003-04• Reach
– Dairy network owned by 12 million farmer members
– Grouped in 108,500 village cooperatives
– Grouped further into 170 district-level unions spanning 338 districts
– 22 state-level marketing federations
– Market to 200 cities and 550 smaller towns
• Milk Production– Increased from 21.2 million metric tons in 1968-69 to
88.1 million metric tons in 2003-04
– Per capita availability of milk has grown from 112 grams per day in 1968-69 to 231 g.p.d in 2003-04
– Annual value of milk production ~Rs. 880 billion, generating employment for 12 million farm families

Empowering
• More equitable than green revolution– People can own cattle without owning land
– Women active in dairy farming
• Socially empowering– All sections of society involved as equals
– Provides practical science lessons
• Economically empowering– Provides diversification of income
• Politically empowering– Schools of democracy
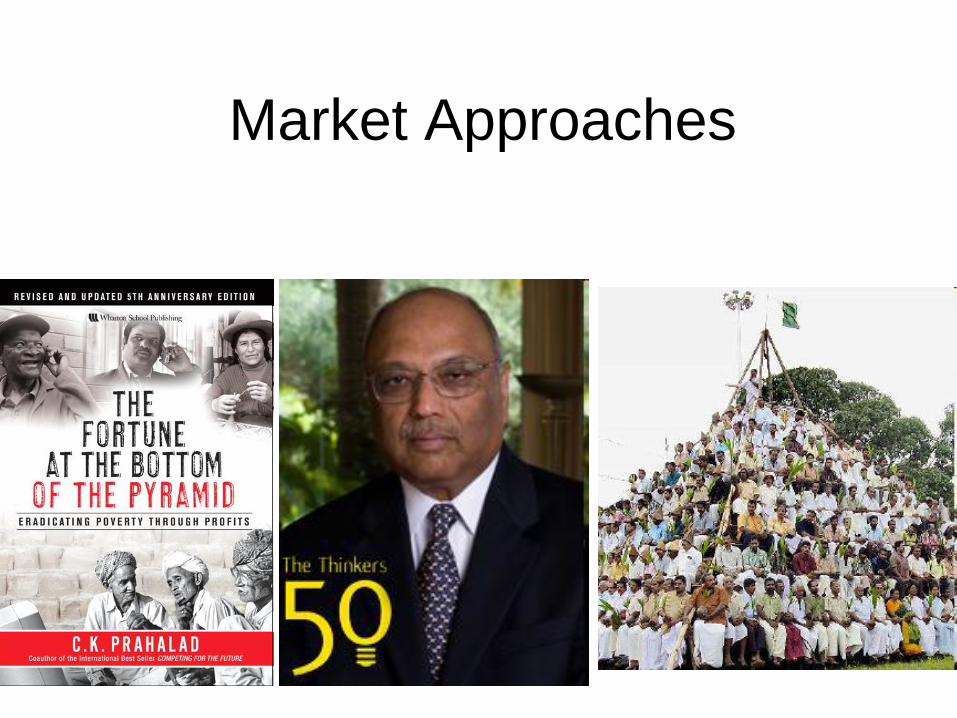
Market Approaches

4 Billion People
Earning less than $2,000/year
< $2,000 4,000
‘The Bottom of the Pyramid’
Middle Class
in developing
countries
$2,000—$20,000 2,000
Wealthy
Nations
Annual PPP in $US
> $20,000
Population
In Millions
100
Source: Prahalad & Hammond, Harvard Business Review, Vol. 80, Issue 9 (Sep. 2002), pp48-58
emerging
‘mass’ markets
adjacent
markets

>
20,000
Less than
5,000
5,000 to
10,000
Purchasing Power Parity
in US dollars
China
2
60
330
800
India
7
63
125
700
Brazil
9
15
27
105
Population in millions
The Market Pyramid in China,
India, and Brazil
Source: Prahalad & Lieberthal, 1998
10,000 to
20,000
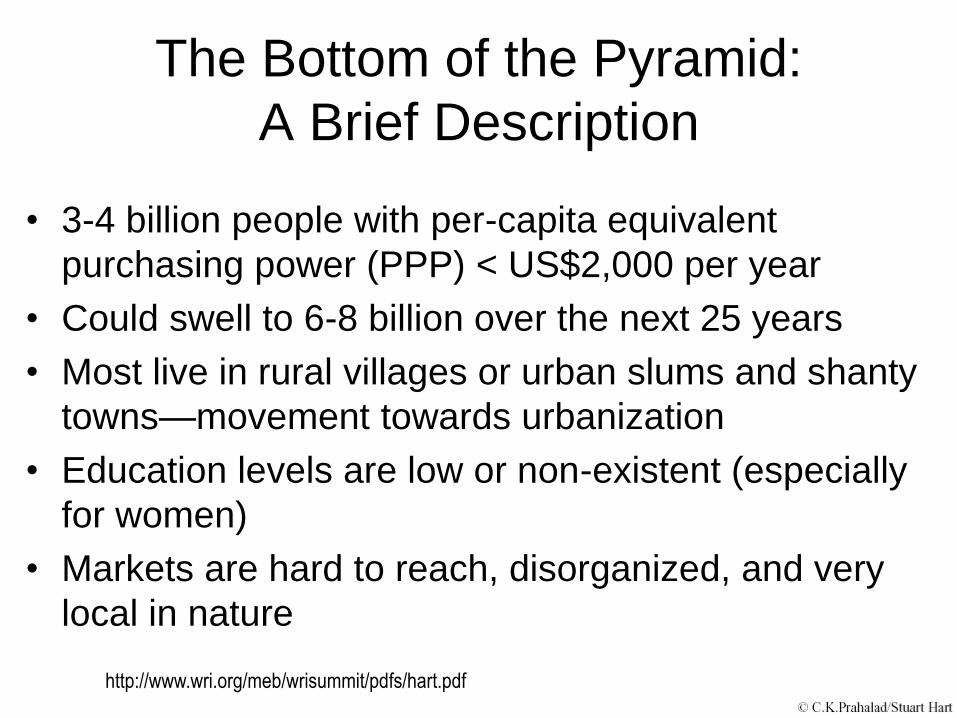
The Bottom of the Pyramid:
A Brief Description
• 3-4 billion people with per-capita equivalent
purchasing power (PPP) < US$2,000 per year
• Could swell to 6-8 billion over the next 25 years
• Most live in rural villages or urban slums and shanty
towns—movement towards urbanization
• Education levels are low or non-existent (especially
for women)
• Markets are hard to reach, disorganized, and very
local in nature
http://www.wri.org/meb/wrisummit/pdfs/hart.pdf
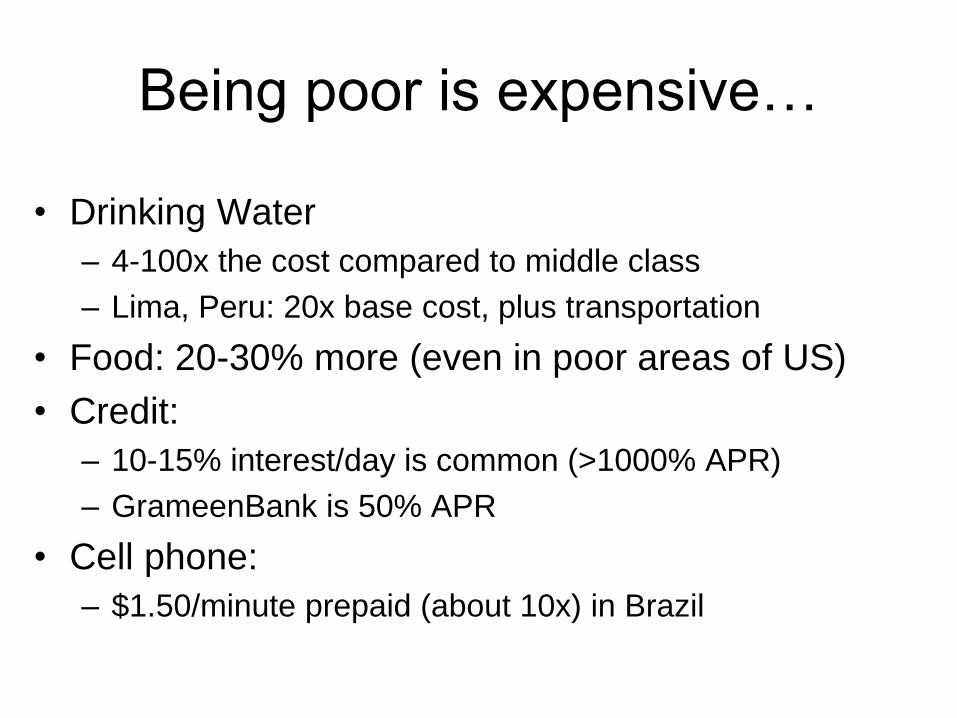
Being poor is expensive…
• Drinking Water
– 4-100x the cost compared to middle class
– Lima, Peru: 20x base cost, plus transportation
• Food: 20-30% more (even in poor areas of US)
• Credit:
– 10-15% interest/day is common (>1000% APR)
– GrameenBank is 50% APR
• Cell phone:
– $1.50/minute prepaid (about 10x) in Brazil

Consider Dharavi
• Represents urban poor
– 1300 cities with >1M people
– Urban ICT could reach 2B people by 2015
• Dense: 44,000 people per square mile
– Berkeley: 9700 Pittsburgh: 6000
• 6 churches, 27 temples, 11 mosques
• About $450M in manufacturing revenue
• Lots of small inefficient businesses already…

Even the Very Poor Spend
• Dharavi, one of the poorest localities in India:
– 85% have a TV
– 50% have a pressure cooker
– 21% have a telephone
– … but can’t afford a house
• Even the poorest of the poor in Bangladesh:
– devote 7 percent of income to communications services
(GrameenPhone)
– (and probably will spend equal amount on education for their
children)
• These are valid markets…

Misperceptions about doing
business with the poor
• “The poor have no money”
– Aggregate buying power of poor communities is large
• “Poor are too concerned with survival to waste
money on ‘non-essentials’”
– High TV penetration in Dharavi
• “Goods sold to poor are priced too low to make a
profit”
– Poor pay higher prices than the middle class
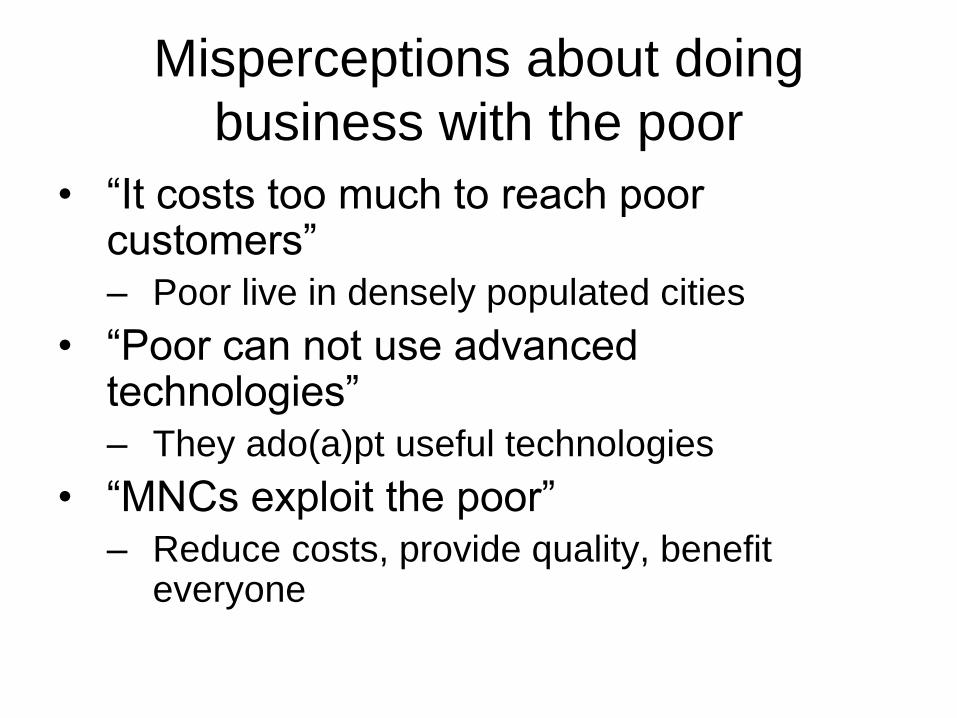
Misperceptions about doing
business with the poor
• “It costs too much to reach poor customers”
– Poor live in densely populated cities
• “Poor can not use advanced technologies”
– They ado(a)pt useful technologies
• “MNCs exploit the poor”
– Reduce costs, provide quality, benefit everyone
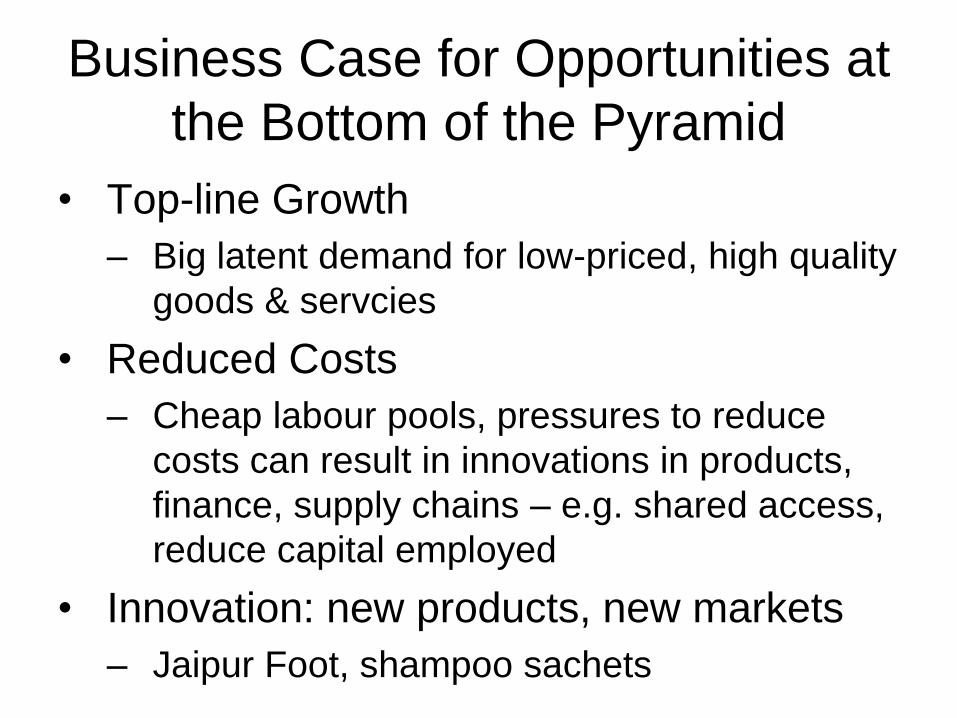
Business Case for Opportunities at
the Bottom of the Pyramid
• Top-line Growth
– Big latent demand for low-priced, high quality
goods & servcies
• Reduced Costs
– Cheap labour pools, pressures to reduce
costs can result in innovations in products,
finance, supply chains – e.g. shared access,
reduce capital employed
• Innovation: new products, new markets
– Jaipur Foot, shampoo sachets

Strategies for Serving
Poor Customers
• Change mindset
– Education, develop a cadre of people
comfortable with these markets
• Structural changes
– R&D units in developing countries
– Venture funds to seed entrepreneurial efforts
– Business development task force
• Partnerships
– Established businesses, NGOs, entrepreneurs
• Technology to overcome other barriers

Critique: Poor Should Be Made
Entrepreneurs, Not Consumers!

Base of Pyramid Case Study:
Hindustan Unilever’s Project Shakti


Positioning of Project Shakti

Impact of Project Shakti
Genetically Modified Crops and
India
Bt Cotton
• Bt Cotton is produced by inserting a synthetic version of a gene from the naturally occurring soil bacterium Bacillus thuringiensis, into cotton.
• The primary reason this is done is to induce the plant to produce its own Bt toxin to destroy the bollworm, a major cotton pest.
• The gene causes the production of Bt toxin in all parts of the cotton plant throughout its entire life span.
• When the bollworm ingests any part of the plant, the Bt cotton toxin pierces its small intestine and kills the insect.
Source: http://www.greenpeace.org/india/campaigns/say-no-to-genetic-engineering/ge-crops-in-india-the-story

Why use genetically engineered cotton
when pesticides exist?
• When cotton farming was introduced as a lucrative alternative to food crops in the 1980s, farmers invested in expensive varieties of seeds and pesticides. When crops failed, small farmers found themselves severely indebted.
• Indebtedness triggered a spate of suicides.
• Crop failure was caused basically by the resistance the American bollworm insect developed to all kinds of pesticides and pesticide cocktails.
• Farmers found themselves on a “pesticide treadmill' where higher pesticide use led to greater resistance which in turn led to even higher pesticide use, …
• Manufacturers of Bt cotton argued that the genetically engineered plants would be resistant to pests at low costs

Risks of Bt Cotton
• Economic risks:– Crop failure possible even with the use of this technology
• Ecological risks:
– Increased Pest Resistivity:As the insects feeding on the Bt crops are exposed to the toxin regularly, they can develop quicker resistance. If this happens, both the genes in transgenic plants and Bt sprays will be rendered ineffective.
– Gene flow to wild relatives=>Super Weeds:As Bt crops are grown close to their wild relatives, it is possible that the Bt gene can spread to them through pollen transfer. The new genes in the wild plants may produce enough toxins to ward off insects that normally feed on them. Some of the wild plants could grow hardier and act as weeds. This technology can also contaminate other species, as transgenic plants displace other plants.
• Political risks:– NGOs active in opposing Bt cotton; taking direct action


NGO Opposition to Bt
Cotton & GM Crops

So when Monsanto applied for
permission to sell Bt cotton seeds,
government decided to regulate
• Regulatory Response relied on hierarchy
– Expertise driven—led by scientific establishment
– Multiple ministries involved—Biotechnology, Environment;
some less so (eg, Agriculture)
– Top down—driven by Delhi; states less involved, even
though they have to implement
– Field level science not well integrated—agricultural
university scientists not fully involved
– Non-formal voices kept out—NGOs, Farmers

Rational vs Hybrid Regulation:
Scoones (2005)• Professed Ideal
– Rational, science-based process, whereby guidelines developed centrally by experts are enshrined in law and implemented by bureaucrats with assent of politicians
• Actual Reality– Regulations emerge through a political process of negotiation
among a wide range of actors in multiple sites … an uneven compromise based on technical, social, political and sometimes moral considerations
• Thus– There is a process of ‘co-construction’ of regulatory policy,
operating in a hybrid world that straddles science, business, and government interests

Regulatory Process for Monsanto-
MAHYCO
• Elaborate scientific tests of Bt Cotton seeds
– Monsanto-MAHYCO goes through long testing period before field trials
– Testing process highly contentious on ground with NGO protests, e.g., destroying test beds
– Various protection measures insisted upon—refuges of non-Bt cotton
– Process may have been significantly long and arduous because applying party was Monsanto
– Process subject to significant NGO scrutiny, particularly using courts

The Regulatory Assumptions versus The
Ground Reality
• Regulators grant approval based on safety measures, e.g., refuges– Small farmers unable to provide environmental refuges of
non-Bt cotton
• Regulators assume that state and district administrations can police Bt cotton use– State and district administrations not up to task
– Seed market fragmented, unorganized, non-formal
• Regulators assume scientists inspect correctly– Scientific teams feel process inadequate
• Attention entirely focused on Monsanto

Meanwhile, back on the farm …
• Farmers in Gujarat found to be planting seeds with Bt
• Seeds obtained from Navbharat, which claims its their own hybrid
• Legal action against Navbharat initiated by government and MAHYCO
• Central government orders destruction of Bt cotton crop
• Gujarat state government balks—says it is unable to compensate growers for cotton destruction
• Uneasy regulatory stalemate prevails
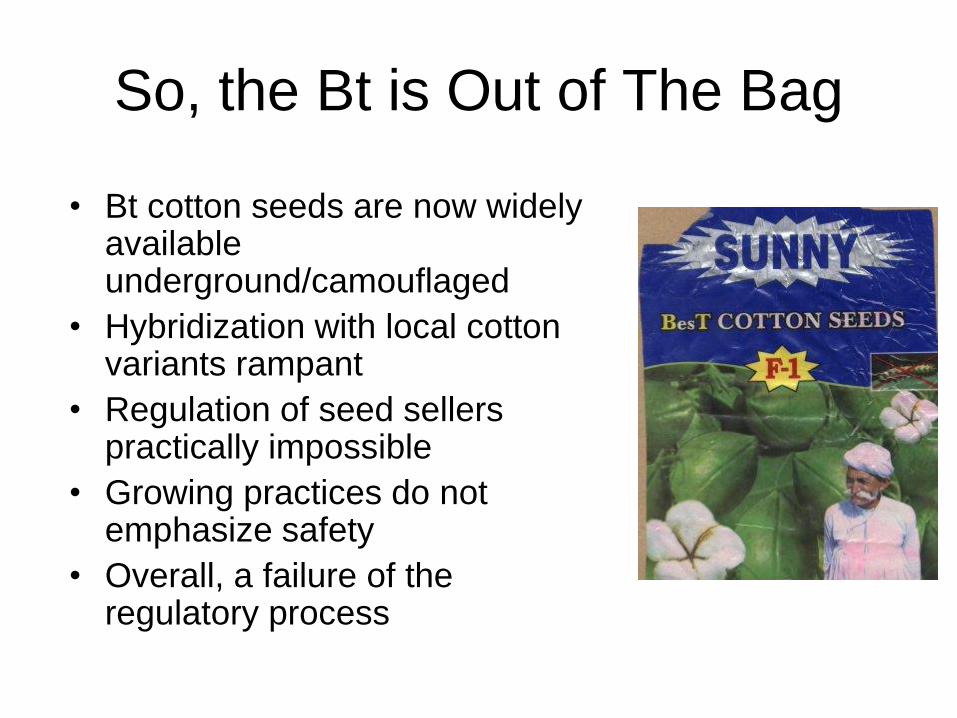
So, the Bt is Out of The Bag
• Bt cotton seeds are now widely available underground/camouflaged
• Hybridization with local cotton variants rampant
• Regulation of seed sellers practically impossible
• Growing practices do not emphasize safety
• Overall, a failure of the regulatory process
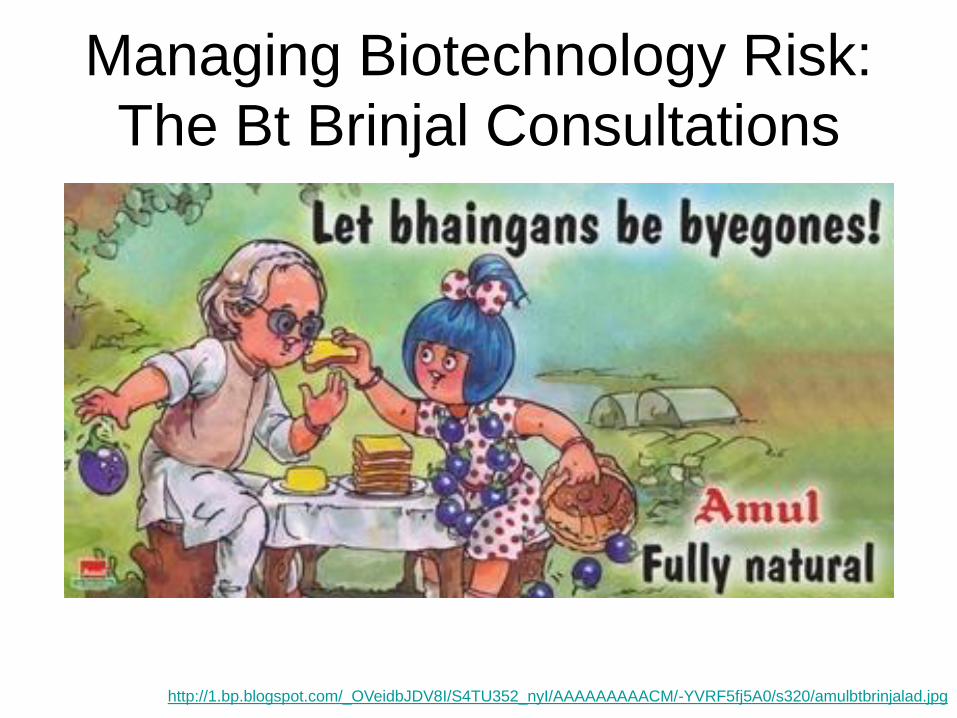
Managing Biotechnology Risk:
The Bt Brinjal Consultations
http://1.bp.blogspot.com/_OVeidbJDV8I/S4TU352_nyI/AAAAAAAAACM/-YVRF5fj5A0/s320/amulbtbrinjalad.jpg
Precautionary Principle?
• http://www.youtube.com/watch?v=7MPEX
oIMXkw
• Further study needed before allowing Bt
Brinjal

June 30th, 2013 – Technical Expert
Committee Report on GM crops
• The TEC set up by Supreme Court noted that the
regulatory system “has major gaps and these will require
rethinking, investment and relearning to fix”, and these
need to be addressed before conducting more field trials
• Rejected the proposal to release GMs crops on the
grounds that there are no “compelling” reasons for
allowing the release of Bt for food.
• Unlike the situation in the 1960s [when there was a
shortage of foodgrains], there is no desperate shortage of
food [now] and, in fact, India is in a reasonably secure
position
http://www.frontline.in/social-issues/general-issues/no-to-gm-crops/article5037750.ece
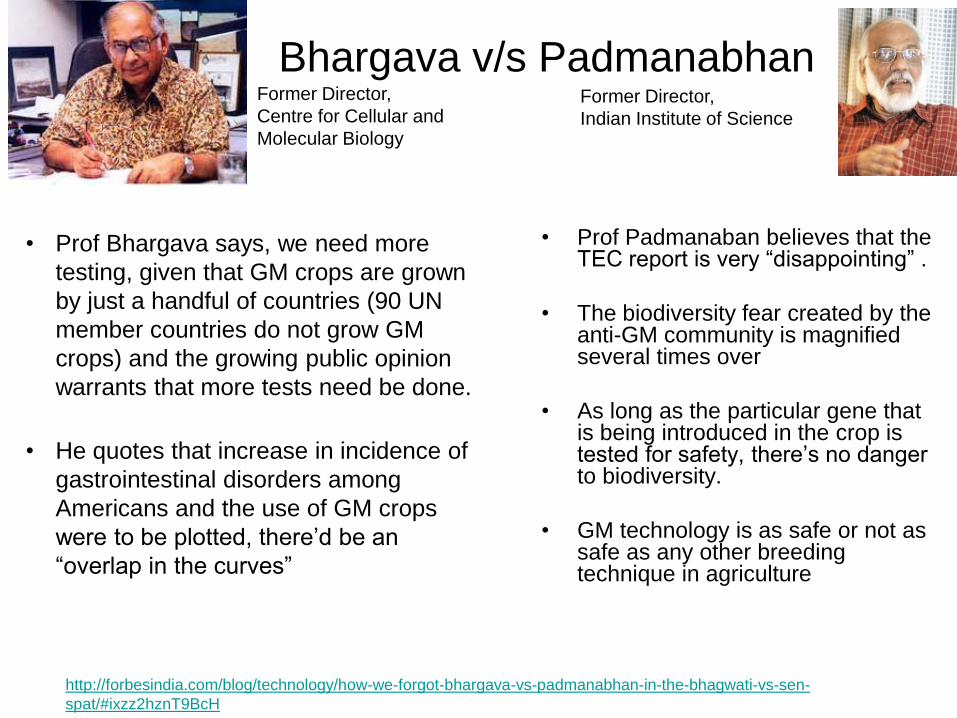
Bhargava v/s Padmanabhan
• Prof Padmanaban believes that the TEC report is very “disappointing” .
• The biodiversity fear created by the anti-GM community is magnified several times over
• As long as the particular gene that is being introduced in the crop is tested for safety, there’s no danger to biodiversity.
• GM technology is as safe or not as safe as any other breeding technique in agriculture
• Prof Bhargava says, we need more
testing, given that GM crops are grown
by just a handful of countries (90 UN
member countries do not grow GM
crops) and the growing public opinion
warrants that more tests need be done.
http://forbesindia.com/blog/technology/how-we-forgot-bhargava-vs-padmanabhan-in-the-bhagwati-vs-sen-
spat/#ixzz2hznT9BcH
• He quotes that increase in incidence of
gastrointestinal disorders among
Americans and the use of GM crops
were to be plotted, there’d be an
“overlap in the curves”
Former Director,
Indian Institute of Science
Former Director,
Centre for Cellular and
Molecular Biology

Recent Trends:
Credit Suisse Report
• The transition away from agriculture has accelerated. The
drop in male employment in agriculture over the past five
years is equal to the shift away over the previous 27 years.
• Agriculture is the prime driver for the rural economy – this
assumption is increasingly becoming invalid. A decade ago
agriculture was about half of rural GDP, but it is now only
about one-fourth The transition from agriculture to industry and
services has been rapid in rural India over the past decade.
Source: http://www.firstpost.com/india/rural-india-is-in-transition-but-why-bother-its-not-about-
politics-963401.html?utm_source=ref_article based on Credit Suisse: The Great Indian
Equalization by Neelkanth Mishra and Ravi Shankar, 2012. https://doc.research-and-
analytics.csfb.com/docView?sourceid=em&document_id=x445552&serialid=5XzPLT%2BPjYA
kZmLwiiOtD1oiYtk0XMiiZn1eVA9Tx%2Fc%3D

• Almost 75% of the new factories during the last decade
came up in rural India, contributing to 70% of all new
manufacturing jobs created. As a result, manufacturing
GDP in rural India witnessed an 18% compound annual
growth rate (CAGR) during 1999-09, and is now 55% of
India’s manufacturing GDP. Growth in services
employment is equally robust.
• Net value added (comparable to GDP) by manufacturing
in rural India saw an 18% CAGR over the ten-year
period of 1999-09, much faster than urban
manufacturing growth, and is now around 55% of the
national total.

• Urbanisation in India is progressing along a path very
different from the conventional migration from villages to
large cities… Instead, the number of census towns
(habitats with population more than 5,000 where less
than 25% of working males are in agriculture) grew
three-fold, and is now half of the total number of towns.
• Consumption trends in rural India have been shifting
sharply towards a more urban consumption pattern
• A large part of the rural dynamism is not coming from the traditional dominant agricultural sector but from the non-agricultural sector.
• While the shift from agriculture to non-agriculture was already there in income terms, the employment pattern with acceleration in shift towards non-farm employment in rural areas.
• The shift is significant not only because it allows the ever increasing workforce to find avenues in the more productive non-farm sector but also because it creates the synergy between the primary engine of growth of the economy and the rural areas.
Source: http://forbesindia.com/article/special/himanshu-there%EF%BF%BDs-a-newfound-dynamism-in-rural-areas/35825/1#ixzz2hzsNM7MR
Recent Trends – A rural working
class

• But this shift to non-farm is not only helpful in generating incomes in rural areas, it has also changed the dynamics of income generation in these areas.
• First, the movement away from agriculture has meant that traditional bottlenecks of rural revival such as agriculture and land are less relevant.
• Second, the fact that non-farm employment is less driven by traditional institutions such as caste has also meant that the deprived castes are now enjoying a significant share of the benefit of the growth of income in rural areas.
Source: http://forbesindia.com/article/special/himanshu-there%EF%BF%BDs-a-newfound-dynamism-in-rural-areas/35825/1#ixzz2hzsNM7MR
Recent Trends – A rural working class

• The indirect effect of the diversification towards non-farm has also been responsible for pulling up wages in rural areas which is now growing at an average of 5 percent per annum
• A result of the increased agricultural productivity and the shift in terms of trade in favour of agriculture which has made rural cultivators realize better incomes for their agricultural produce.
• The other significant change as far as rural demand is concerned is the increased flow of funds to rural areas as part of government expenditure.
• This not only includes big ticket-expenditure such as National Rural Employment Guarantee Act and increased spending on Public Distribution System (led by state governments & now Central Govt), but also various other expenditures including Prime Minister’s Gram Sadak Yojana.
Source: http://forbesindia.com/article/special/himanshu-there%EF%BF%BDs-a-newfound-dynamism-in-rural-areas/35825/1#ixzz2hzsNM7MR
Recent Trends – A new found dynamism

Infrastructure expansion - electricity, roads, markets and communication infrastructure, but also financial infrastructure such as banking facilities. Even with an increase in penetration of small and medium enterprises in rural areas, their share in total bank credit is low compared to their urban and corporate counterparts.
With an explosive growth in education and skill endowments, rural areas are waiting to be tapped.
An enabling environment to encourage small and medium enterprises is not only crucial to rural revival, it is also the key to manufacturing being the engine of growth for the country. This, in fact, is the only recipe for a sustainable and inclusive model of growth.
Read more: http://forbesindia.com/article/special/himanshu-there%EF%BF%BDs-a-newfound-dynamism-in-rural-areas/35825/1#ixzz2hzsNM7MR
Opportunities
The Monsoon Bonanza• As per the India Meteorological Department, India’s
monsoon rainfall in 2013 has been 5% above normal
• The Prime Minister’s Economic Advisory council expects
FY14 agriculture GDP to rise by 4.8%
• The area sown is up seven per cent year-on-year and
foodgrain production could reach a record 259 million
tonnes in FY14.
• Area sown under autumn Kharif crop is currently 5%
higher on a yoy basis.
• Horticulture crop which yields significantly higher
margins than foodgrains should also benefit immensely
leading to higher farm incomes.
http://www.business-standard.com/article/opinion/agriculture-growth-likely-to-be-5-in-2013-14
http://www.financialexpress.com/news/rainfed-growth-for-india/1179533/0

The Monsoon Bonanza• Despite the low direct share of agriculture in India’s
GDP, rural prosperity has been a key driver of the overall
economy.
• DB Global Markets Research - Years of above-average
monsoon rainfall are marked by strong growth in
agriculture GDP and correspondingly rising aggregate
demand in the rural economy, evidenced by high growth
in demand for tractors/two-wheelers and four wheelers.
• The multiplier impact of rural prosperity to be higher in
the current year relative to previous years of strong
monsoons
• Indian companies increasing their reach in rural areas,
rural prosperity will improve the fortunes of corporate
Indiahttp://www.business-standard.com/article/opinion/agriculture-growth-likely-to-be-5-in-2013-14-113092601259_1.html
http://www.financialexpress.com/news/rainfed-growth-for-india/1179533/0

To Conclude, Some Global Perspective
Grant Wood: American Gothic
Globally, Farm Markets are Distorted
• Subsidies to European farmers and fisheries account for ~40% of the EU budget
• The US also spends billions of dollars on agricultural subsidies
• Subsidies cause over-supply of agricultural products and affect producers in developing countries adversely due to depressed prices
• “It is the extraordinary distortion of global trade, where the West spends $ 360 billion a year on protecting its agriculture with a network of subsidies and tariffs that costs developing countries about US$ 50 billion in potential lost agricultural exports. Fifty billion dollars is the equivalent of today's level of development assistance.” – Mark Malloch Brown, former head, UNDP

The Face of Agriculture Changes As A
Country Develops …
• In the US:– 1930s: 25% of the
population lived on 6m small farms
– Today: Agriculture accounts for only 0.9% of GDP
• 0.6% of population is employed on farms & fisheries
• 2% of the populations lives on farms
• 157,000 large farms account for 72% of sales
http://www.personal.kent.edu/~areischu/American%20Gothic%20Parody.gif

• Shift from farm to factory is an integral part of the economic development process
• Then does the Indian effort to keep people on farms make sense?
• Or should we be seeking more aggressive non-farm employment and industrialisation?

END