indigenous community engineering guidelines (iceg) · indigenous community engineering guidelines...
TRANSCRIPT
DEPARTMENT OF HOUSING AND COMMUNITY DEVELOPMENT
Compiled by the Northern Territory Department of Housing and Community Development in consultation with stakeholders
Indigenous Community Engineering Guidelines (ICEG)
for
Remote Communities in the NT Updated 14 December 2017

2 Indigenous Community Engineering Guidelines (ICEG 2014) for Remote Communities in
the NT
COPYRIGHT This document remains the property of the Northern Territory (NT) Government. The NT Government, represented by the Department of Housing and Community Development, supports and encourages the dissemination and exchange of the information contained in the publication. This publication may be used or reproduced without having to seek permission provided that the NT Government is attributed as the source.
Indigenous Community Engineering Guidelines (ICEG) – updated 14 December 2017 3
Foreword
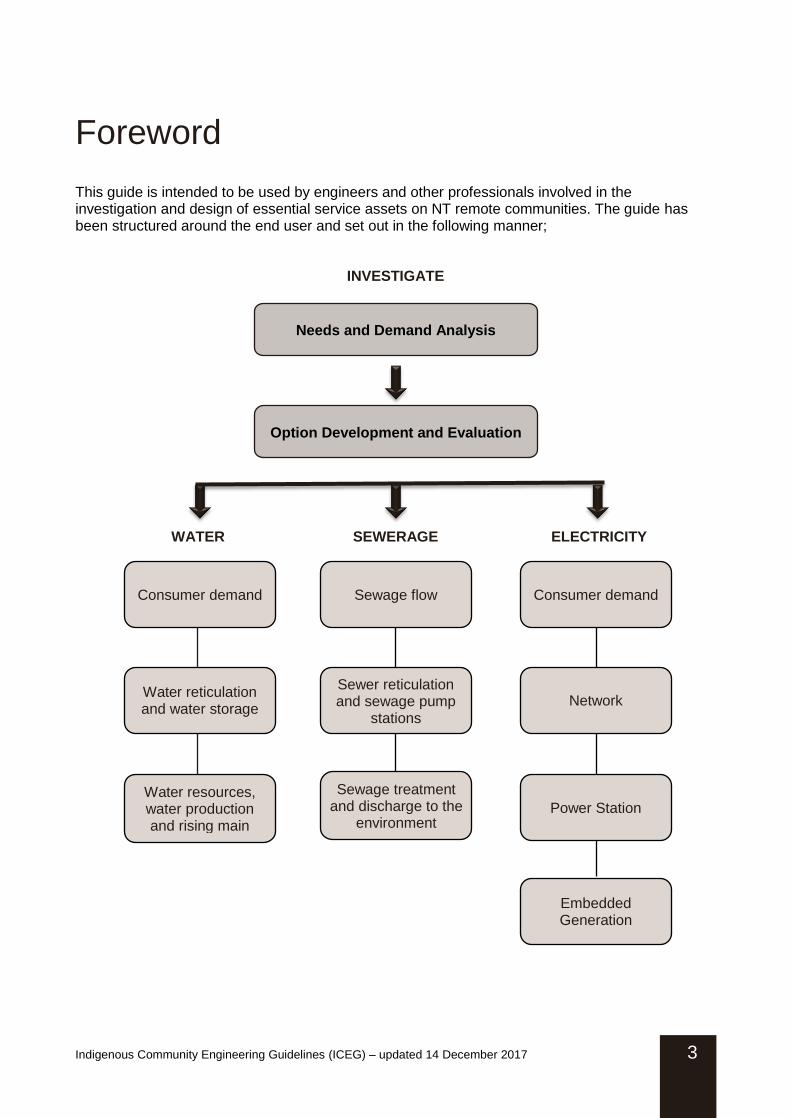
This guide is intended to be used by engineers and other professionals involved in the investigation and design of essential service assets on NT remote communities. The guide has been structured around the end user and set out in the following manner;
INVESTIGATE
Needs and Demand Analysis
Option Development and Evaluation
Sewage flow
WATER
Consumer demand
SEWERAGE ELECTRICITY
Water reticulation and water storage
Water resources, water production and rising main
Sewer reticulation and sewage pump
stations
Consumer demand
Network
Power Station
Embedded Generation
Sewage treatment and discharge to the
environment
4 Indigenous Community Engineering Guidelines (ICEG) – updated 14 December 2017
Table of Contents
1 Introduction .............................................................................................................................. 5
1.1 Background ....................................................................................................................... 5 1.2 Aim .................................................................................................................................... 5 1.3 Scope of document ........................................................................................................... 5 1.4 Information sources ........................................................................................................... 6 1.5 How to use the guide ......................................................................................................... 6 1.6 Glossary of terms (for other terms refer to WSAA or PWC Remote Operations) ............... 8
2 INVESTIGATION GUIDELINES ............................................................................................... 10
2.1 Needs and Demand Analysis .......................................................................................... 10 2.2 Option Development and Evaluation ............................................................................... 13
3 WATER GUIDELINES ............................................................................................................. 17
3.1 Consumer Demand ......................................................................................................... 17 3.2 Water reticulation and ground water storage ................................................................... 23 3.3 Water resources, water production and rising main ......................................................... 26
4 SEWERAGE GUIDELINES ...................................................................................................... 28
4.1 Sewage flow .................................................................................................................... 28 4.2 Sewer reticulation and sewage pump stations ................................................................. 32 4.3 Sewage treatment and discharge to environment ............................................................ 35
5 ELECTRICITY GUIDELINES ................................................................................................... 38
5.1 Consumer demand .......................................................................................................... 39 5.2 Network ........................................................................................................................... 40 5.3 Power station .................................................................................................................. 42 5.4 Embedded generation systems ....................................................................................... 44
APPENDICES .............................................................................................................................. 45
Appendix A. Population and water data for (72) NT remote (Abridged) communities .. 45 Appendix B. NT remote communities (72) map ................................................................. 46 Appendix C. IES program cost break up ............................................................................ 47 Appendix D. Equivalent tenement figures for NT remote communities ........................... 48 Appendix E. Comparison of residential water use patterns ............................................. 52 Appendix F. Locations to be provided with fire hydrants ................................................. 53 Appendix G. Design maximum flow and design minimum grade .................................... 54 Appendix H. Common Effluent Disposal (CED) information sheet .................................. 55 Appendix I. Discharge environment and notional treatment levels ................................ 56 Appendix J. Bibliography .................................................................................................... 57
Indigenous Community Engineering Guidelines (ICEG) – updated 14 December 2017 5
1 Introduction
1.1 Background
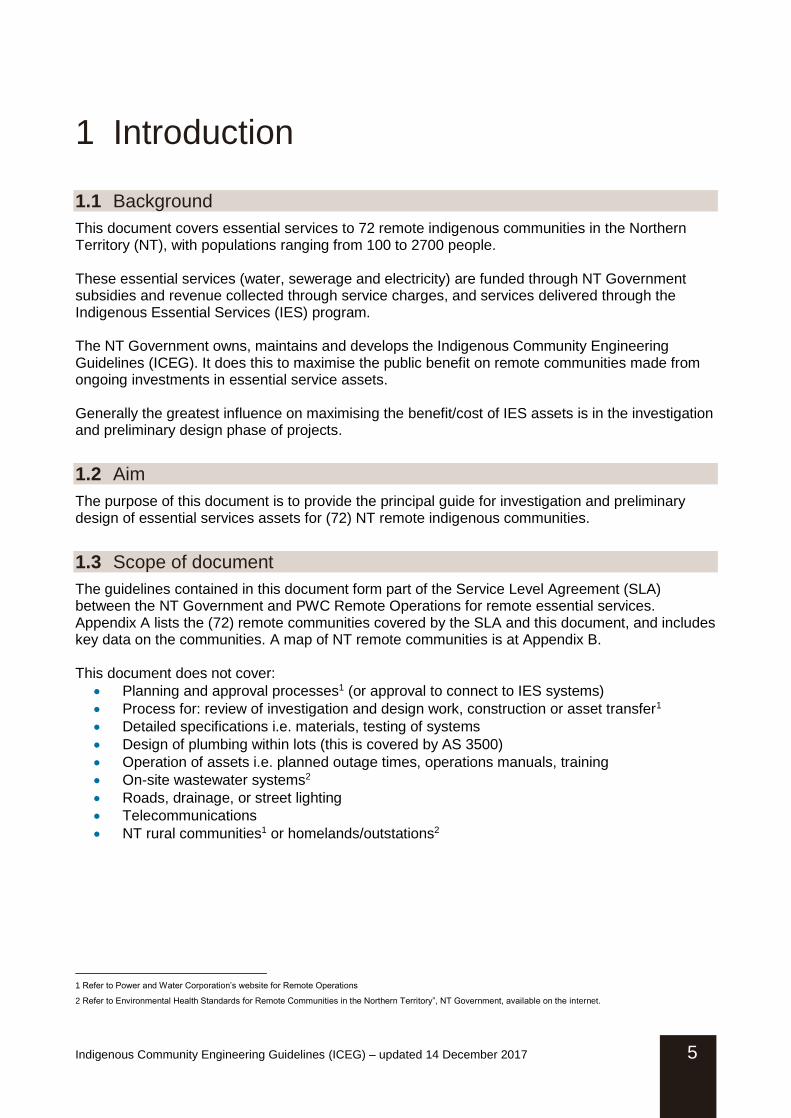
This document covers essential services to 72 remote indigenous communities in the Northern Territory (NT), with populations ranging from 100 to 2700 people. These essential services (water, sewerage and electricity) are funded through NT Government subsidies and revenue collected through service charges, and services delivered through the Indigenous Essential Services (IES) program. The NT Government owns, maintains and develops the Indigenous Community Engineering Guidelines (ICEG). It does this to maximise the public benefit on remote communities made from ongoing investments in essential service assets. Generally the greatest influence on maximising the benefit/cost of IES assets is in the investigation and preliminary design phase of projects.
1.2 Aim
The purpose of this document is to provide the principal guide for investigation and preliminary design of essential services assets for (72) NT remote indigenous communities.
1.3 Scope of document
The guidelines contained in this document form part of the Service Level Agreement (SLA) between the NT Government and PWC Remote Operations for remote essential services. Appendix A lists the (72) remote communities covered by the SLA and this document, and includes key data on the communities. A map of NT remote communities is at Appendix B. This document does not cover:
Planning and approval processes1 (or approval to connect to IES systems)
Process for: review of investigation and design work, construction or asset transfer1
Detailed specifications i.e. materials, testing of systems
Design of plumbing within lots (this is covered by AS 3500)
Operation of assets i.e. planned outage times, operations manuals, training
On-site wastewater systems2
Roads, drainage, or street lighting
Telecommunications
NT rural communities1 or homelands/outstations2
1 Refer to Power and Water Corporation’s website for Remote Operations
2 Refer to Environmental Health Standards for Remote Communities in the Northern Territory”, NT Government, available on the internet.

6 Indigenous Community Engineering Guidelines (ICEG) – updated 14 December 2017
1.4 Information sources
Recent investments in remote flow monitoring by NT Government and PWC Remote Operations has led to a better knowledge of remote water and sewerage system performance. It should be noted however that the availability of reliable flow monitoring information is still quite limited, and some of the infrastructure being monitored is over 40 years old. The flow measured may not be representative of newer systems with lower leakage rates. These guidelines are to be refined over time as additional information becomes available. A bibliography of references is listed at Appendix I, with each reference cross-referenced in the guidelines as (Ref x).
1.5 How to use the guide
This document is to be used in conjunction with other guidelines/standards as set out on the Remote Community section of Power and Water Corporation’s website, refer: https://www.powerwater.com.au/ Each guideline contained in Section 2 to 5 is linked to an explanatory section with the same title. The guidelines must be complied with. Guidelines are given first, followed by Explanatory Information.
2.1.2 Demand growth and population estimates
i. In the absence of better information, growth in demand is to be taken the same as the long term population growth.
ii. Population and growth estimates are given in Appendix A.
Explanatory Information
2.1.2 Demand growth and population estimates Demand on remote communities has been mainly driven by the housing sector and it is difficult to predict the number of new houses that will be built in the planning horizon. Long term demand growth is assumed to be the same as population growth.
The NT Government establishes population figures based on ABS census figures (Ref 3). Some of the smaller remote community populations were not found in the ABS census data and had to be established by other means.

Indigenous Community Engineering Guidelines (ICEG) – updated 14 December 2017 7
The ICEG guidelines are to be used to assess asset capacity, and proposed developments and designs up to 30% stage. Where another guideline (or standard) conflicts with ICEG, ICEG will take precedence (except where such standard is mandated by regulation). Use of a different guideline will need to be justified to the Department of Housing and Community Development and PWC Remote Operations setting out the particular circumstances and reasons why the different guideline is appropriate. General principles adopted in this document require that IES assets are to be:
i. Capable of providing a safe, effective and affordable service. ii. Assessed on actual system performance and forecast demands iii. Sized on forecast demand iv. Designed on a whole of life least cost basis v. Developed wherever possible and appropriate to support regional development and
Indigenous employment.
8 Indigenous Community Engineering Guidelines (ICEG) – updated 14 December 2017
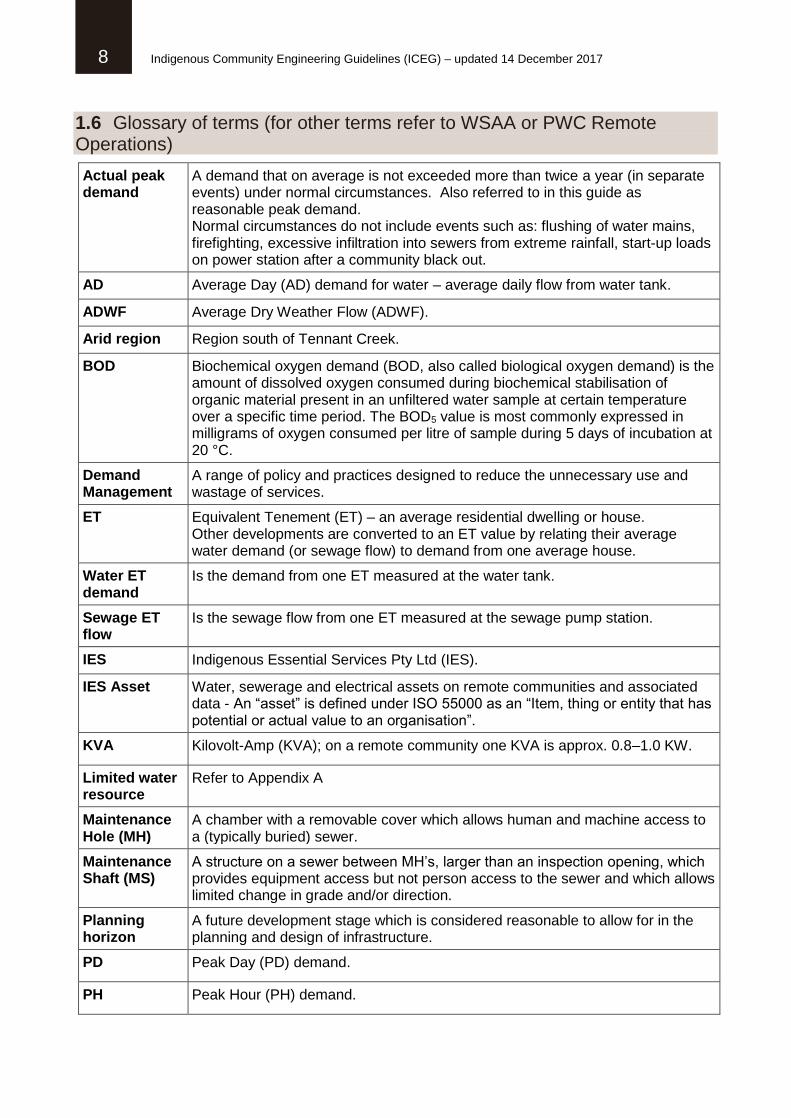
1.6 Glossary of terms (for other terms refer to WSAA or PWC Remote Operations)
Actual peak demand
A demand that on average is not exceeded more than twice a year (in separate events) under normal circumstances. Also referred to in this guide as reasonable peak demand. Normal circumstances do not include events such as: flushing of water mains, firefighting, excessive infiltration into sewers from extreme rainfall, start-up loads on power station after a community black out.
AD Average Day (AD) demand for water – average daily flow from water tank.
ADWF Average Dry Weather Flow (ADWF).
Arid region Region south of Tennant Creek.
BOD Biochemical oxygen demand (BOD, also called biological oxygen demand) is the amount of dissolved oxygen consumed during biochemical stabilisation of organic material present in an unfiltered water sample at certain temperature over a specific time period. The BOD5 value is most commonly expressed in milligrams of oxygen consumed per litre of sample during 5 days of incubation at 20 °C.
Demand Management
A range of policy and practices designed to reduce the unnecessary use and wastage of services.
ET Equivalent Tenement (ET) – an average residential dwelling or house. Other developments are converted to an ET value by relating their average water demand (or sewage flow) to demand from one average house.
Water ET demand
Is the demand from one ET measured at the water tank.
Sewage ET flow
Is the sewage flow from one ET measured at the sewage pump station.
IES Indigenous Essential Services Pty Ltd (IES).
IES Asset Water, sewerage and electrical assets on remote communities and associated data - An “asset” is defined under ISO 55000 as an “Item, thing or entity that has potential or actual value to an organisation”.
KVA Kilovolt-Amp (KVA); on a remote community one KVA is approx. 0.8–1.0 KW.
Limited water resource
Refer to Appendix A
Maintenance Hole (MH)
A chamber with a removable cover which allows human and machine access to a (typically buried) sewer.
Maintenance Shaft (MS)
A structure on a sewer between MH’s, larger than an inspection opening, which provides equipment access but not person access to the sewer and which allows limited change in grade and/or direction.
Planning horizon
A future development stage which is considered reasonable to allow for in the planning and design of infrastructure.
PD Peak Day (PD) demand.
PH Peak Hour (PH) demand.

Indigenous Community Engineering Guidelines (ICEG) – updated 14 December 2017 9
PDWF Peak Dry Weather Flow (PDWF) – peak sanitary flow during a normal day
PWWF Peak Wet Weather Flow (PWWF).
PWC Remote Operations
Power and Water Corporation group managing IES assets.
Rising main A pipe which is pressurised by a pump to transfer matter.
SPS Sewage pump station.
Whole of Life (WOL) cost
Cost associated with: investigation, design, construction, operation and maintenance, and replacement of an asset over a defined period.
WSAA Water Services Association of Australia (WSAA).

10 Indigenous Community Engineering Guidelines (ICEG) – updated 14 December 2017
2 INVESTIGATION GUIDELINES
This section provides the principal guide for the investigation of remote community water, sewerage and electricity systems. It consists of these sub sections; 2.1 Needs and Demand Analysis 2.2 Option development and evaluation
2.1 Needs and Demand Analysis
PLANNING HORIZON AND DEMAND GROWTH AND POPULATION ESTIMATES
2.1.1 Planning horizon
i. Planning horizons for remote communities are given in Appendix A.
2.1.2 Demand growth and population estimates
i. In the absence of better information, growth in demand is to be taken the same as the long term population growth.
ii. Population and growth estimates are given in Appendix A.
Explanatory Information
2.1.1 Planning horizon The planning horizon represents a future development stage which is considered reasonable to allow for in the planning and design of infrastructure. There is always a degree of uncertainty with planning horizons, and they can change over time due to economic initiatives and other factors.
A planning horizon does not refer to the anticipated life of an asset on a community.
Larger remote communities (populations over 600 people) have been given a 30 year planning horizon and smaller remote communities 20 years.
2.1.2 Demand growth and population estimates Demand on remote communities has been mainly driven by the housing sector and it is difficult to predict the number of new houses that will be built in the planning horizon. Long term demand growth is assumed to be the same as population growth.
The NT Government establishes population figures based on ABS census figures (Ref 3). Some of the smaller remote community populations were not found in the ABS census data and had to be established by other means.

Indigenous Community Engineering Guidelines (ICEG) – updated 14 December 2017 11
DEMAND ESTIMATES
2.1.3 Forecast demand estimates
i. Water forecast demand is to be based on Section 3.1 and data given in Appendix A.
ii. Sewage forecast demand is to be based on Section 4.1 of this guide and measured system performance.
iii. Electrical forecast demand is to be based on Section 5.1 of this guide and measured system performance.
2.1.4 Actual demand estimates
i. Demand is to be based on measured system performance. ii. Actual demand figures are to be confirmed with PWC Remote Operations.
2.1.5 Use of demand estimates
i. The lesser of forecast demand and actual demand is to be used to check capacity of existing infrastructure.
ii. Forecast demand, with demand growth, is to be used to design new infrastructure.
Explanatory Information
Demand estimates are to be made by appropriately qualified engineering personnel. Further information on demand estimates (additional to that given below) is in the relevant sections.
2.1.3 Forecast demand estimates Forecast demand has a direct influence on the size of water, sewerage and electrical infrastructure.
i. For water; forecast demand is based on actual demand in the arid and non-arid regions, and consideration of water resource availability.
ii. For sewerage; forecast sewage flows have been based on actual flows and rainfall regions (for infiltration).
iii. For electricity; forecast demand is based on actual demands plus consideration of future demand pattern changes.
The arid region tends to have the highest unit costs for water, sewerage and electricity due to the high number of small communities in the region. Water production costs in the arid region are also affected by deep bore settings.
2.1.4 Actual demand estimates Actual demand estimates are required to assess whether or not the infrastructure is meeting the capacity requirements set out in this document. These estimates also help provide information on whether or not additional demand management work is required.
Actual peak demand (refer to Glossary) can be determined by selecting weeks (with good data) in a high demand period, and choosing the highest value. Actual demand figures should be checked with PWC Remote Operations to ensure figures are representative, and demand has not been influenced by unusual circumstances or constrained due to

12 Indigenous Community Engineering Guidelines (ICEG) – updated 14 December 2017
infrastructure problems.
Ideally reliable metering should be installed several years in advance of proposed infrastructure works to allow sufficient data to be collected to allow a proper understanding of current actual demand.
2.1.5 Use of demand estimates In the longer term a remote community should be operating near the forecast demand level, and new infrastructure needs to be sized to this level.
Where actual demand levels are lower than forecast demand levels and no obvious problems are being experienced; actual demand is to be used for the infrastructure capacity assessment and future planning. This is to avoid premature infrastructure upgrades.
Alternatively if actual demand exceeds forecast demand but is deemed to be excessive, forecast demand is to be used for the infrastructure capacity assessment. This is to avoid premature upgrades due to excessive demand. In this case, the reason for the excessive demand should be determined and action taken to ensure it is reduced. If there is no reasonable possibility of reducing demand to the forecast value then consideration may be given to updating the forecast.
Process for assessment and design Demand value for assessment; choose the lesser of Actual and Forecast demand for existing developments, plus new development (on Forecast demand)
If demand value > capacity of infrastructure; an upgrade is required
Design upgrade on Forecast demand (for community) to the appropriate planning horizon.
For limited water resources it may not be possible to increase water production, and the Forecast water demand estimate needs to be confirmed with PWC Remote Operations.
Indigenous Community Engineering Guidelines (ICEG) – updated 14 December 2017 13
2.2 Option Development and Evaluation
OPTION DEVELOPMENT
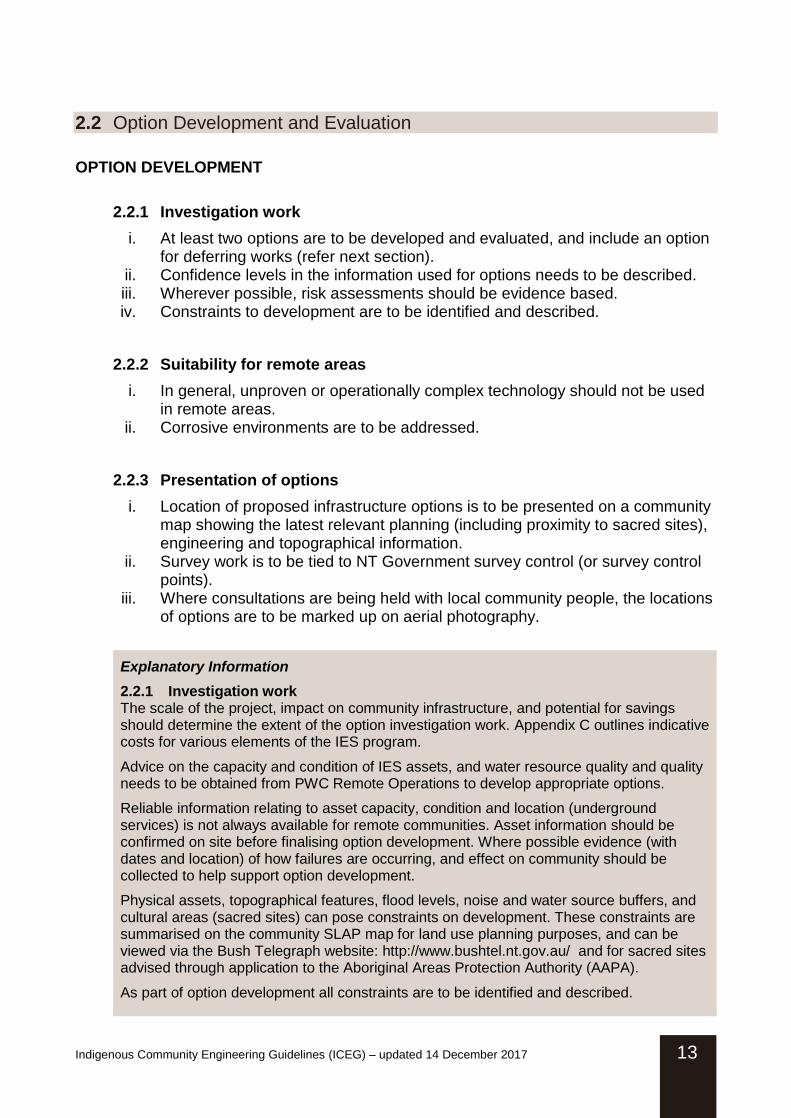
2.2.1 Investigation work
i. At least two options are to be developed and evaluated, and include an option for deferring works (refer next section).
ii. Confidence levels in the information used for options needs to be described. iii. Wherever possible, risk assessments should be evidence based. iv. Constraints to development are to be identified and described.
2.2.2 Suitability for remote areas
i. In general, unproven or operationally complex technology should not be used in remote areas.
ii. Corrosive environments are to be addressed.
2.2.3 Presentation of options
i. Location of proposed infrastructure options is to be presented on a community map showing the latest relevant planning (including proximity to sacred sites), engineering and topographical information.
ii. Survey work is to be tied to NT Government survey control (or survey control points).
iii. Where consultations are being held with local community people, the locations of options are to be marked up on aerial photography.
Explanatory Information
2.2.1 Investigation work The scale of the project, impact on community infrastructure, and potential for savings should determine the extent of the option investigation work. Appendix C outlines indicative costs for various elements of the IES program.
Advice on the capacity and condition of IES assets, and water resource quality and quality needs to be obtained from PWC Remote Operations to develop appropriate options.
Reliable information relating to asset capacity, condition and location (underground services) is not always available for remote communities. Asset information should be confirmed on site before finalising option development. Where possible evidence (with dates and location) of how failures are occurring, and effect on community should be collected to help support option development.
Physical assets, topographical features, flood levels, noise and water source buffers, and cultural areas (sacred sites) can pose constraints on development. These constraints are summarised on the community SLAP map for land use planning purposes, and can be viewed via the Bush Telegraph website: http://www.bushtel.nt.gov.au/ and for sacred sites advised through application to the Aboriginal Areas Protection Authority (AAPA).
As part of option development all constraints are to be identified and described.

14 Indigenous Community Engineering Guidelines (ICEG) – updated 14 December 2017
2.2.2 Suitability for remote areas
People maintaining essential services in remote areas assets turn over frequently.
i. Asset management systems should be simple robust, well documented and easily understood, to assist new personnel starting work.
ii. Only proven technology and industry accepted materials should be used, and the PWC Approved Product Manual is to be used as the main reference.
iii. There should be a degree of standardisation across a region to avoid carrying a large number of spares at each community and to simplify training.
iv. The information systems should allow fast easy access to key information, be user friendly and simple to update.
Locating IES assets in corrosive environments* adds to their WOL cost. In many instances this added cost cannot be avoided only mitigated.
v. Corrosive ground water sources exist generally within 100km of the NT coast and intermittently in other areas.
vi. Corrosive atmospheres (from salt air and humidity) exist within three km of the NT coast (high tide mark).
*For guidelines refer to NT Government’s “Environmental Health Standards for Remote Communities in the Northern Territory” (Ref 4) available on the internet.
2.2.3 Presentation of options Location of proposed IES assets should be presented on community maps containing the latest relevant planning, engineering and topographical information.
Source for latest information is:
i. Engineering; available from PWC Remote Operations ii. Planning and Topographical: available from the Department of Infrastructure,
Planning and Logistics.
To allow options to be accurately located on NT Government maps; survey/preliminary design work is to be properly referenced to NT Government survey control or survey control points (accurately mapped power poles).
Many key local people from remote communities have flown by light aircraft and have a good knowledge of what features look like from the air. Where consultations are being carried out with local community people, proposed layouts should also be marked up on an aerial photograph to overcome language difficulties.

Indigenous Community Engineering Guidelines (ICEG) – updated 14 December 2017 15
OPTIONS FOR STAGING OR DEFERRING MAJOR WORK
2.2.4 Options for staging or deferring major works
Options are to include: i. Staging ii. Demand management iii. Minor upgrade/replacement.
Explanatory Information
Staging or deferring works has a benefit in that funds can be directed into areas of most need and allows more time to better develop infrastructure projects to match need.
2.2.4 Options for staging or deferring major works Staging option can provide:
i. Flexibility to adjust for changes in projected growth. ii. For progressive improvement in levels of service. iii. For areas of greatest need to be met first where funds are not available for the
entire project.
Demand management option can:
i. Allow the deferral of major works by reducing demands. Demand management measures are best implemented several years in advance of the need for major augmentation works to allow the verification of demand reductions achieved and obtain realistic demand estimates.
Minor upgrade/replacement option can:
i. Provide a reduction in risk and unplanned maintenance costs.
Staging benefits are significantly reduced for remote communities due to the high mobilisation costs. Generally staging capital works under $2m is not warranted.

16 Indigenous Community Engineering Guidelines (ICEG) – updated 14 December 2017
EVALUATION OF OPTIONS
2.2.5 Small projects (up to $1M)
i. A basic Life Cycle Cost (LCC) or Net Present Value (NPV) assessment of each option is to be undertaken.
2.2.6 Medium projects ($1M - $5M)
i. All options, including options for staging and deferring major works, is to be evaluated in terms of NPV and risk.
2.2.7 Large projects (over $5M)
i. Same as medium projects plus: a) Preferred options are to be included in a business case with benefit/cost
analysis. b) A recognised evaluation method is to be used to compare options.
Explanatory Information
The scale of the project, and potential for savings should determine the extent of the evaluation. Risk can be considered as a cost for this purpose.
Where an option is likely to have significant operating costs, the type of model and range of input parameters should be agreed with relevant stakeholders before modelling work is undertaken.
2.2.5 Small projects (up to $1M) The option of a minor upgrade or “doing nothing” needs to be evaluated. This option should describe past failures, likelihood of failure, how asset fails, effect on community, cost to address failure and interim solutions (after failure) plus ongoing risks.
A life cycle cost (LCC) approach can be used to compare options for smaller projects.
Life cycle costs = acquisition costs + sustaining costs per year.
A Net Present Value (NPV) comparison of options including current capital works stages in operating costs.
2.2.6 Medium projects ($1M - $5M) A LCC or Net Present Value (NPV) analysis, including options for deferring works.
2.2.7 Large projects (over $5M) A sensitivity analysis is to be undertaken on all large projects. Discount rates of 3% and 7% are to be used, with 5% being the preferred rate.
The remaining useful life is to be considered in the evaluations. Demand management options (over normal measures) are to be evaluated in a similar manner as other options.
Community benefits are difficult to cost accurately but are integral to every benefit/cost evaluation. A willingness to pay is one way of determining benefits. A “Balanced Scorecard” approach is one recognised evaluation method, and can be used to compare options from four perspectives; financial, customer, innovation and learning, and reputation.

Indigenous Community Engineering Guidelines (ICEG) – updated 14 December 2017 17
Consumer Storage and water
treatment
Reticulation Water resource & production
3 WATER GUIDELINES
This section provides the principal guide for the design of remote water systems. It consists of these sub sections: 3.1 Consumer demand 3.2 Water reticulation and ground water storage 3.3 Water resources, water production and rising main
3.1 Consumer Demand
DEMAND ESTIMATION
3.1.1 Use of water demand estimates
i. The lesser of forecast demand and actual demand is to be used to check capacity of existing infrastructure. Forecast demand is to be used first for the initial check.
ii. Forecast demand is to be used to design new infrastructure.
3.1.2 Water ET estimation method
i. One Equivalent Tenement (ET) demand = demand related to one housing lot. ii. Actual Water ET demand = Actual AD/ Total Water ET. iii. Forecast Water ET demand is to be obtained from Appendix A. iv. Water ET values for different land uses are listed at Appendix D.
3.1.3 Average day demand (AD)
i. Forecast AD = Forecast Water ET demand x total Water ET. ii. Actual AD = Volume from water tank in year / 365 days.
3.1.4 Peak day demand (PD)
i. Forecast PD = 1.5 x Forecast AD. ii. Estimated Actual PD = 1.5 x Actual AD, where actual data is not available.
3.1.5 Peak hour demand (PH)
i. Forecast PH pop >500 = 2.0 x Forecast PD.
Rising main
18 Indigenous Community Engineering Guidelines (ICEG) – updated 14 December 2017
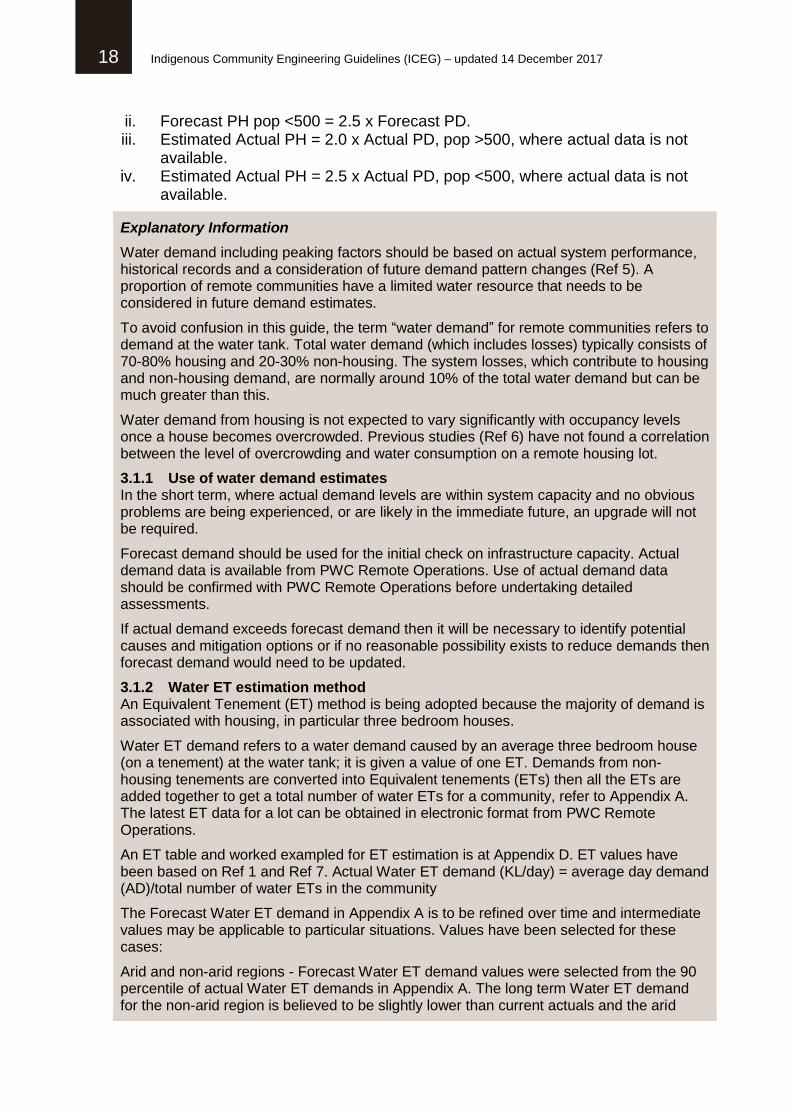
ii. Forecast PH pop <500 = 2.5 x Forecast PD. iii. Estimated Actual PH = 2.0 x Actual PD, pop >500, where actual data is not
available. iv. Estimated Actual PH = 2.5 x Actual PD, pop <500, where actual data is not
available.
Explanatory Information
Water demand including peaking factors should be based on actual system performance, historical records and a consideration of future demand pattern changes (Ref 5). A proportion of remote communities have a limited water resource that needs to be considered in future demand estimates.
To avoid confusion in this guide, the term “water demand” for remote communities refers to demand at the water tank. Total water demand (which includes losses) typically consists of 70-80% housing and 20-30% non-housing. The system losses, which contribute to housing and non-housing demand, are normally around 10% of the total water demand but can be much greater than this.
Water demand from housing is not expected to vary significantly with occupancy levels once a house becomes overcrowded. Previous studies (Ref 6) have not found a correlation between the level of overcrowding and water consumption on a remote housing lot.
3.1.1 Use of water demand estimates In the short term, where actual demand levels are within system capacity and no obvious problems are being experienced, or are likely in the immediate future, an upgrade will not be required.
Forecast demand should be used for the initial check on infrastructure capacity. Actual demand data is available from PWC Remote Operations. Use of actual demand data should be confirmed with PWC Remote Operations before undertaking detailed assessments.
If actual demand exceeds forecast demand then it will be necessary to identify potential causes and mitigation options or if no reasonable possibility exists to reduce demands then forecast demand would need to be updated.
3.1.2 Water ET estimation method An Equivalent Tenement (ET) method is being adopted because the majority of demand is associated with housing, in particular three bedroom houses.
Water ET demand refers to a water demand caused by an average three bedroom house (on a tenement) at the water tank; it is given a value of one ET. Demands from non-housing tenements are converted into Equivalent tenements (ETs) then all the ETs are added together to get a total number of water ETs for a community, refer to Appendix A. The latest ET data for a lot can be obtained in electronic format from PWC Remote Operations.
An ET table and worked exampled for ET estimation is at Appendix D. ET values have been based on Ref 1 and Ref 7. Actual Water ET demand (KL/day) = average day demand (AD)/total number of water ETs in the community
The Forecast Water ET demand in Appendix A is to be refined over time and intermediate values may be applicable to particular situations. Values have been selected for these cases:
Arid and non-arid regions - Forecast Water ET demand values were selected from the 90 percentile of actual Water ET demands in Appendix A. The long term Water ET demand for the non-arid region is believed to be slightly lower than current actuals and the arid

Indigenous Community Engineering Guidelines (ICEG) – updated 14 December 2017 19
region slightly higher, values were selected accordingly.
Limited water resource – A value was selected above the actual average for the arid region (because actual use is considered to be low) and below average for the non-arid region (actual use considered to be high).
Where water resources (for drinking) are very limited the Forecast Water ET demand will need to be dealt with on a case by case basis in consultation with the Department of Health.
3.1.3 Average day demand (AD) Average day demand (AD) relates to the volume of water that passed through the water tank meter divided by the number of days in a year.
Actual AD should be established from at least three years of recent reliable records.
3.1.4 Peak day demand (PD) Peak day is used to size ground storages and water production infrastructure.
Peak day demand (PD) = AD x flow factor PD flow factor = PD /AD
PD (or reasonable peak day demand) does not include additional demand from fire hydrants or flushing, or the impact of special demand management measures (refer to water resource section for more detail).
An analysis in 2011, based on weekly data (Ref 4), on (20) of the larger remote communities gave PD flow factors ranging between 1.3 to 1.6 for populations greater than 1000 people, and 1.4 to 1.7 for populations less than 1000 people. In 2013, PD flow factors were assessed on six large northern remote communities with good daily data (Ref 6), and the PD flow factor ranged between 1.3 - 1.8.
The estimated Actual PD flow factor can be assumed to be 1.5 for all communities where better information does not exist.
3.1.5 Peak hour demand (PH) Peak hour is used to size water mains and elevated storage.
Peak hour demand (PH) = PD x flow factor PH flow factor = PH / PD
The actual PH (peak hour demand) does not include additional demand from fire hydrants or flushing.
Actual PH flow factors were assessed on six major northern remote communities with good hourly data in 2013, (Ref 8). Actual PH flow factor ranged between 1.2 - 1.4, which differed significantly from typical urban diurnal curves, refer Appendix E. There is currently no data to consider from the southern areas.
Forecast PH flow factors were increased from actual PH flow factor of 1.2 -1.4 to 2.0 – 2.5 due to the limited number of communities studied, and in recognition that corresponding actual NT urban PH flow factors (much larger areas) are believed to be under 2.0. The estimated Actual PH flow factor can be assumed to be the same as the Forecast figures where better information does not exist.
20 Indigenous Community Engineering Guidelines (ICEG) – updated 14 December 2017
FLOW MEASUREMENT AND DATA COLLECTION
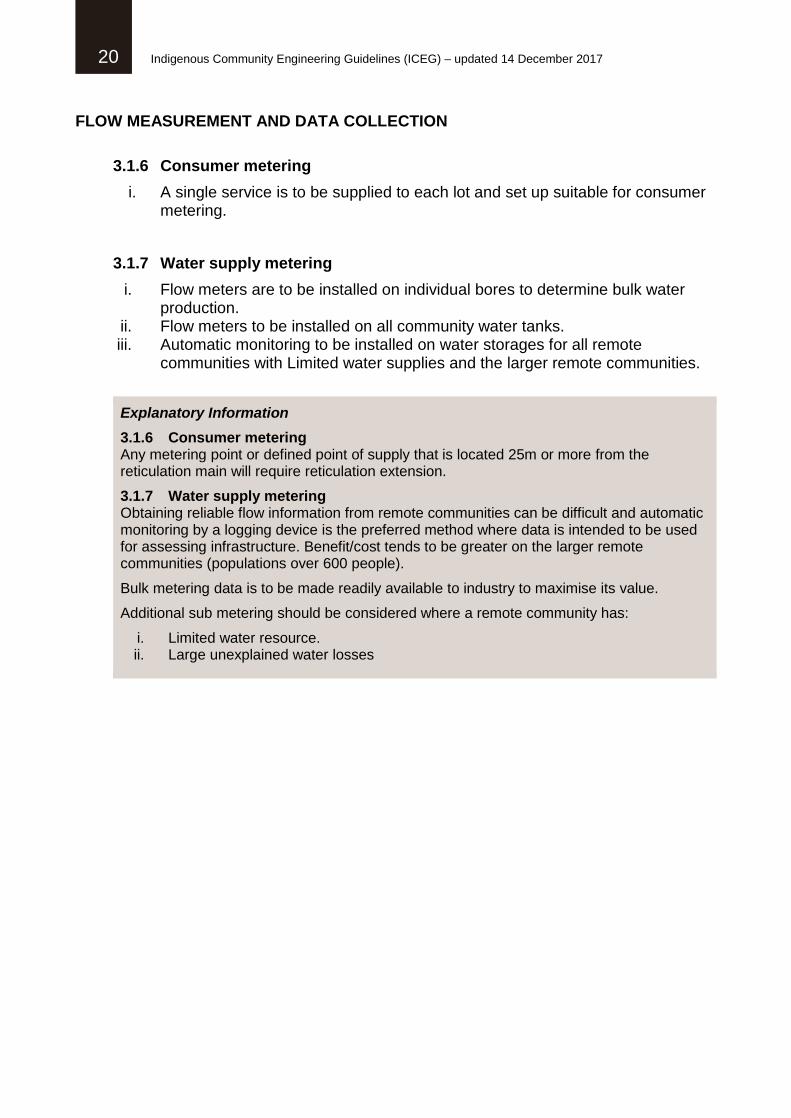
3.1.6 Consumer metering
i. A single service is to be supplied to each lot and set up suitable for consumer metering.
3.1.7 Water supply metering
i. Flow meters are to be installed on individual bores to determine bulk water production.
ii. Flow meters to be installed on all community water tanks. iii. Automatic monitoring to be installed on water storages for all remote
communities with Limited water supplies and the larger remote communities.
Explanatory Information
3.1.6 Consumer metering Any metering point or defined point of supply that is located 25m or more from the reticulation main will require reticulation extension.
3.1.7 Water supply metering Obtaining reliable flow information from remote communities can be difficult and automatic monitoring by a logging device is the preferred method where data is intended to be used for assessing infrastructure. Benefit/cost tends to be greater on the larger remote communities (populations over 600 people).
Bulk metering data is to be made readily available to industry to maximise its value.
Additional sub metering should be considered where a remote community has:
i. Limited water resource. ii. Large unexplained water losses
Indigenous Community Engineering Guidelines (ICEG) – updated 14 December 2017 21
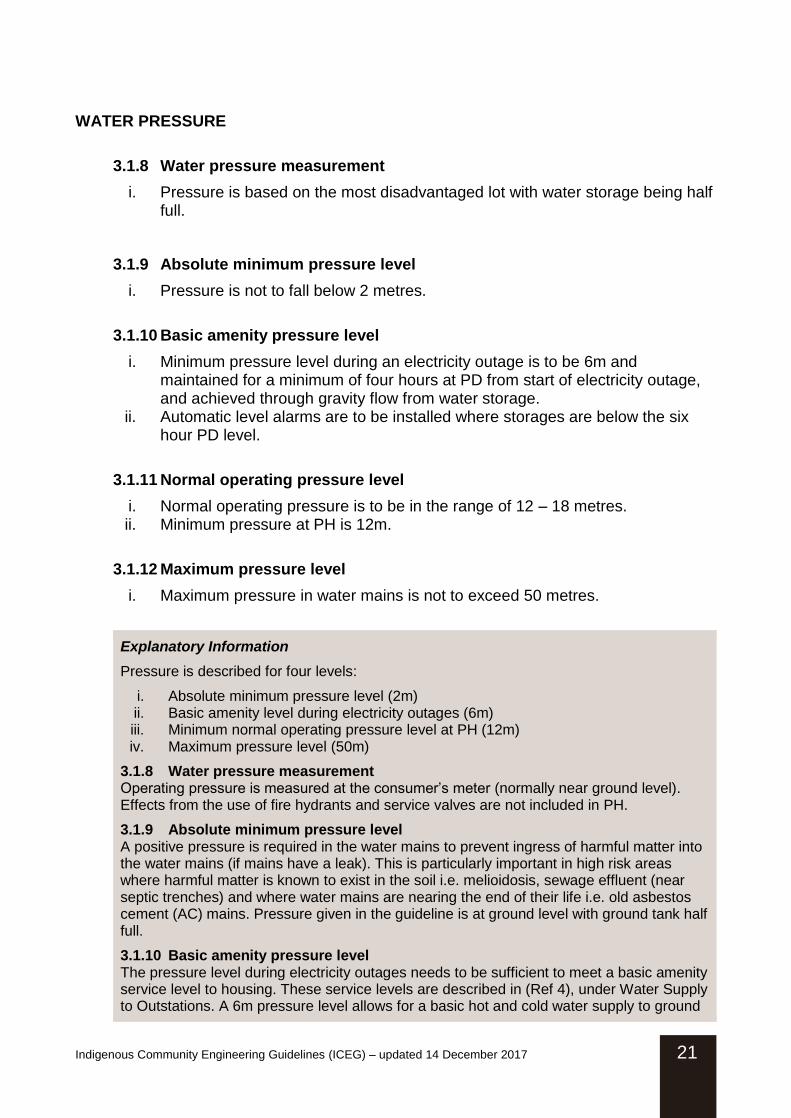
WATER PRESSURE
3.1.8 Water pressure measurement
i. Pressure is based on the most disadvantaged lot with water storage being half full.
3.1.9 Absolute minimum pressure level
i. Pressure is not to fall below 2 metres.
3.1.10 Basic amenity pressure level
i. Minimum pressure level during an electricity outage is to be 6m and maintained for a minimum of four hours at PD from start of electricity outage, and achieved through gravity flow from water storage.
ii. Automatic level alarms are to be installed where storages are below the six hour PD level.
3.1.11 Normal operating pressure level
i. Normal operating pressure is to be in the range of 12 – 18 metres. ii. Minimum pressure at PH is 12m.
3.1.12 Maximum pressure level
i. Maximum pressure in water mains is not to exceed 50 metres.
Explanatory Information
Pressure is described for four levels:
i. Absolute minimum pressure level (2m) ii. Basic amenity level during electricity outages (6m) iii. Minimum normal operating pressure level at PH (12m) iv. Maximum pressure level (50m)
3.1.8 Water pressure measurement Operating pressure is measured at the consumer’s meter (normally near ground level). Effects from the use of fire hydrants and service valves are not included in PH.
3.1.9 Absolute minimum pressure level A positive pressure is required in the water mains to prevent ingress of harmful matter into the water mains (if mains have a leak). This is particularly important in high risk areas where harmful matter is known to exist in the soil i.e. melioidosis, sewage effluent (near septic trenches) and where water mains are nearing the end of their life i.e. old asbestos cement (AC) mains. Pressure given in the guideline is at ground level with ground tank half full.
3.1.10 Basic amenity pressure level The pressure level during electricity outages needs to be sufficient to meet a basic amenity service level to housing. These service levels are described in (Ref 4), under Water Supply to Outstations. A 6m pressure level allows for a basic hot and cold water supply to ground

22 Indigenous Community Engineering Guidelines (ICEG) – updated 14 December 2017
level housing and a cold water supply to elevated housing. The majority of houses on remote communities are ground level.
Electricity outages are believed to be the main cause for loss of water pressure. Planned electricity outages are typically up to four hours long for routine line maintenance. Unplanned electricity outages are generally caused by trees and branches falling on power lines and fuses being blown. Fuses are normally replaced within two hours of the fault occurring.
Gravity flow from water storage is regarded as the most reliable way to provide the basic amenity pressure level, and a minimum storage (four hours at PD) has been adopted for the guideline.
Ideally the basic amenity pressure level can be maintained significantly longer than four hours without grid electricity; however the added cost (over four hours PD) is to be justified through a benefit/cost analysis (refer to Clause 2.2.5 to 2.2.7).
Automatic level alarms offer improved response times and are important where storage is near the minimum storage level.
3.1.11 Normal operating pressure level A minimum pressure of 12m at PH has been set around water appliances. Appliances such as automatic washing machines (and other pressure dependent solenoid operated equipment) tend not to operate satisfactorily on pressures less than 10m. These appliances do not operate without electricity and as such the normal operating pressure level is not required during electricity interruptions.
Large communities with adequate water resources and suitable topography should consider a minimum of 14 metres. The normal upper pressure level (18m) refers to communities situated on level ground and should be increased where hills are present.
Normal operating pressure level can be achieved by either gravity flow from water storage or pressure pumping. The choice of system to boost pressure from 6m (basic amenity level) to 12-18m (normal operating pressure) is to be based on a benefit/cost analysis and subject to a quality review by PWC Remote Operations and Department of Housing and Community Development.
Elevated high level water storage (includes tank stand) are typically used in areas with flat topography. The high level water storage option needs to consider topography and environment ie. cyclones and corrosion from salt air and humidity. The pressure pumping option needs to consider the reliability of electricity supplies, pump redundancy and the need for permanently installed auto back-up generators or diesel powered stand-by pressure pumps.
3.1.12 Maximum pressure level A maximum operating pressure has been set in consideration of the older pipes, in particular old asbestos cement (AC) mains that are unlikely to meet a Class 12 rating (120m pressure).

Indigenous Community Engineering Guidelines (ICEG) – updated 14 December 2017 23
3.2 Water reticulation and ground water storage
WATER MAINS AND FIRE FLOWS
3.2.1 Water mains and isolation systems
i. Water mains are to be sized on the greater of Forecast PH or fire flow requirements.
ii. Water mains are to be ringed except where the cost is excessive, and able to be effectively flushed.
iii. Minimum pipe pressure rating is to be Class 12. iv. Water isolation valves are to be clearly marked in the field and capable of
limiting an interruption (e.g. isolation of a broken water main) to less than 25 lots.
v. Locally available bedding material should be researched where transport costs are high.
3.2.2 Fire flows and fire hydrants
i. Remote communities listed at Appendix F are to be provided with fire flows and fire hydrants.
ii. Minimum pressure in the water main adjacent to the most disadvantaged hydrant is to be 75kPa with hydrant flow of six l/sec in combination with network at 2/3 of forecast PH flow.
iii. Minimum pipe size is to be DN 150 where fire flows are being provided.
3.2.3 Fast fill points
i. A community fast fill point is to be provided where hydrants are not being provided.
Explanatory Information
3.2.1 Water mains and isolation systems Water mains are sized on peak flows both for normal peak hour demands and for fire flows. Fire flows tend to determine the design peak flows in small communities or in local areas of larger communities. If fire flows are not required, then water main size is determined solely by PH and smaller water main sizes are possible.
Generally mains should be ringed to improve pressure and water quality (remove dead ends).
The mains need to include flushing points/scour valves to allow sediment and other contaminates to be easily flushed from the network. The location and number of flushing points/scour valves is to be done in consultation with PWC Remote Operations and account for local water quality.
A minimum pressure pipe rating of 120 metres (PN12) is being adopted for pipes (even though pressure should not exceed 50 metres) to deal with temperatures and fatigue damage and allow for minor damage that can occur when transporting and installing pipes
24 Indigenous Community Engineering Guidelines (ICEG) – updated 14 December 2017
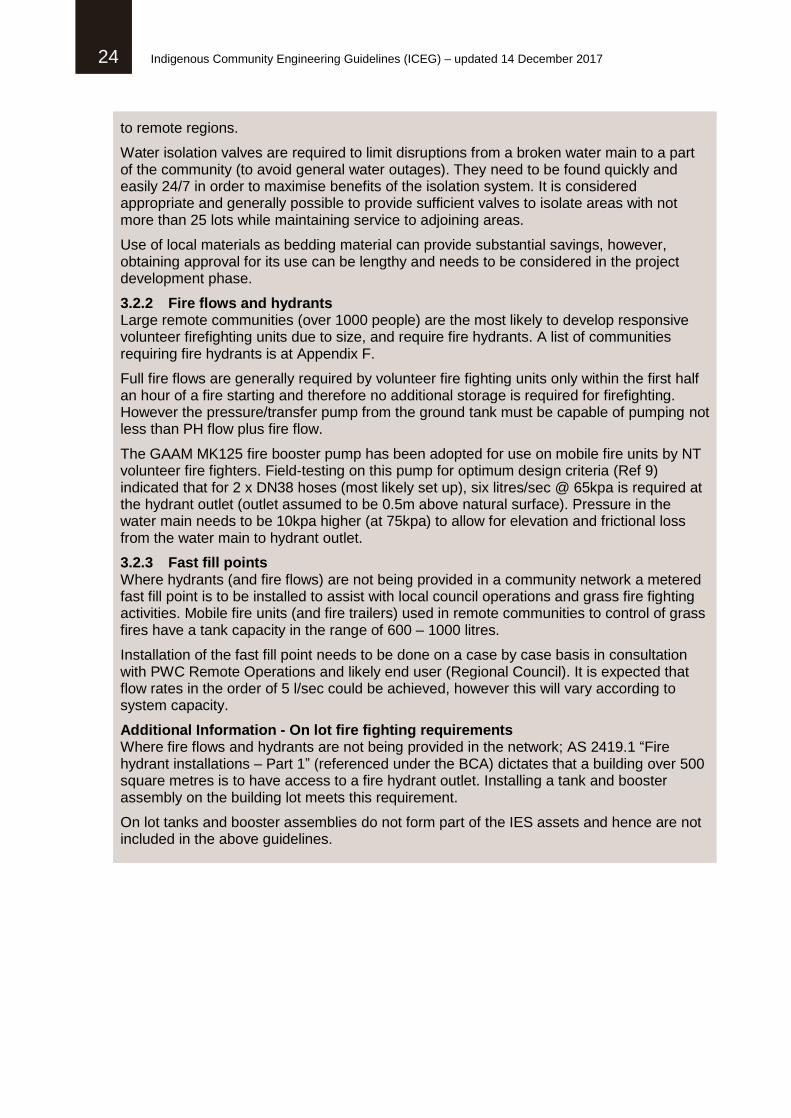
to remote regions.
Water isolation valves are required to limit disruptions from a broken water main to a part of the community (to avoid general water outages). They need to be found quickly and easily 24/7 in order to maximise benefits of the isolation system. It is considered appropriate and generally possible to provide sufficient valves to isolate areas with not more than 25 lots while maintaining service to adjoining areas.
Use of local materials as bedding material can provide substantial savings, however, obtaining approval for its use can be lengthy and needs to be considered in the project development phase.
3.2.2 Fire flows and hydrants Large remote communities (over 1000 people) are the most likely to develop responsive volunteer firefighting units due to size, and require fire hydrants. A list of communities requiring fire hydrants is at Appendix F.
Full fire flows are generally required by volunteer fire fighting units only within the first half an hour of a fire starting and therefore no additional storage is required for firefighting. However the pressure/transfer pump from the ground tank must be capable of pumping not less than PH flow plus fire flow.
The GAAM MK125 fire booster pump has been adopted for use on mobile fire units by NT volunteer fire fighters. Field-testing on this pump for optimum design criteria (Ref 9) indicated that for 2 x DN38 hoses (most likely set up), six litres/sec @ 65kpa is required at the hydrant outlet (outlet assumed to be 0.5m above natural surface). Pressure in the water main needs to be 10kpa higher (at 75kpa) to allow for elevation and frictional loss from the water main to hydrant outlet.
3.2.3 Fast fill points Where hydrants (and fire flows) are not being provided in a community network a metered fast fill point is to be installed to assist with local council operations and grass fire fighting activities. Mobile fire units (and fire trailers) used in remote communities to control of grass fires have a tank capacity in the range of 600 – 1000 litres.
Installation of the fast fill point needs to be done on a case by case basis in consultation with PWC Remote Operations and likely end user (Regional Council). It is expected that flow rates in the order of 5 l/sec could be achieved, however this will vary according to system capacity.
Additional Information - On lot fire fighting requirements Where fire flows and hydrants are not being provided in the network; AS 2419.1 “Fire hydrant installations – Part 1” (referenced under the BCA) dictates that a building over 500 square metres is to have access to a fire hydrant outlet. Installing a tank and booster assembly on the building lot meets this requirement.
On lot tanks and booster assemblies do not form part of the IES assets and hence are not included in the above guidelines.
Indigenous Community Engineering Guidelines (ICEG) – updated 14 December 2017 25
GROUND STORAGE AND WATER TREATMENT
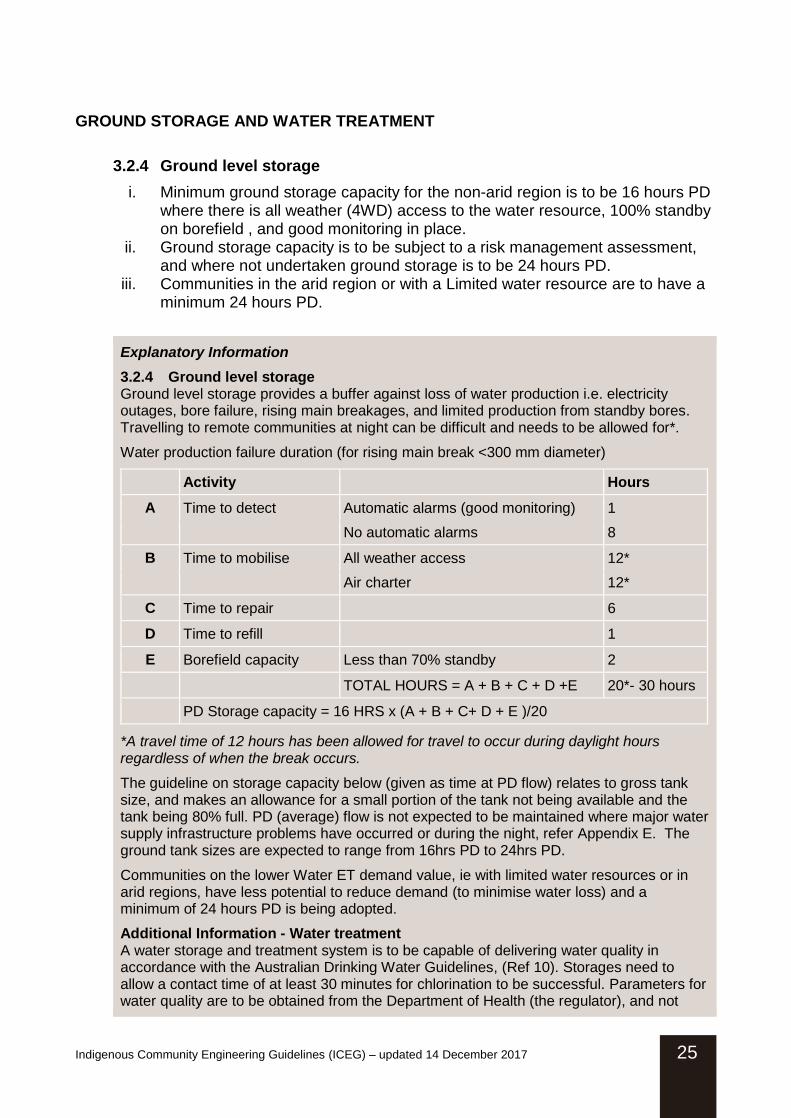
3.2.4 Ground level storage
i. Minimum ground storage capacity for the non-arid region is to be 16 hours PD where there is all weather (4WD) access to the water resource, 100% standby on borefield , and good monitoring in place.
ii. Ground storage capacity is to be subject to a risk management assessment, and where not undertaken ground storage is to be 24 hours PD.
iii. Communities in the arid region or with a Limited water resource are to have a minimum 24 hours PD.
Explanatory Information
3.2.4 Ground level storage Ground level storage provides a buffer against loss of water production i.e. electricity outages, bore failure, rising main breakages, and limited production from standby bores. Travelling to remote communities at night can be difficult and needs to be allowed for*.
Water production failure duration (for rising main break <300 mm diameter)
Activity Hours
A Time to detect Automatic alarms (good monitoring) 1
No automatic alarms 8
B Time to mobilise All weather access 12*
Air charter 12*
C Time to repair 6
D Time to refill 1
E Borefield capacity Less than 70% standby 2
TOTAL HOURS = A + B + C + D +E 20*- 30 hours
PD Storage capacity = 16 HRS x (A + B + C+ D + E )/20
*A travel time of 12 hours has been allowed for travel to occur during daylight hours regardless of when the break occurs.
The guideline on storage capacity below (given as time at PD flow) relates to gross tank size, and makes an allowance for a small portion of the tank not being available and the tank being 80% full. PD (average) flow is not expected to be maintained where major water supply infrastructure problems have occurred or during the night, refer Appendix E. The ground tank sizes are expected to range from 16hrs PD to 24hrs PD.
Communities on the lower Water ET demand value, ie with limited water resources or in arid regions, have less potential to reduce demand (to minimise water loss) and a minimum of 24 hours PD is being adopted.
Additional Information - Water treatment A water storage and treatment system is to be capable of delivering water quality in accordance with the Australian Drinking Water Guidelines, (Ref 10). Storages need to allow a contact time of at least 30 minutes for chlorination to be successful. Parameters for water quality are to be obtained from the Department of Health (the regulator), and not
26 Indigenous Community Engineering Guidelines (ICEG) – updated 14 December 2017
included in this guide.
3.3 Water resources, water production and rising main
3.3.1 Water resource monitoring and investigation
i. Monitoring equipment is to be installed to monitor water levels on water resources that may not be able to meet long-term community water demands or be subject to over extraction.
ii. Demand management options are to be explored first before the investigation of new water resources.
3.3.2 Borefield
i. In the absence of a detailed analysis, all bores are to be protected from contamination by a buffer zone of at least 200 metres.
ii. For an adequate water resource, bores are to be capable of meeting AD with the largest production bore out of service.
iii. For a Limited water resource; the borefield is to be developed in accordance with an agreed borefield management plan.
3.3.3 Rising main
i. Minimum velocity of water with significant sediment is to be 0.9 m/s. ii. Rising main is to be sized based on the WOL costs of the rising main and bore
pumps.
Explanatory Information
Water resources have been assessed and classed into three categories; Adequate, Limited, and Undefined, refer to Appendix A. The assessments in Appendix A were provided by PWC Remote Operations.
The current status of water resources should be confirmed with PWC Remote Operations prior to undertaking any major planning work that may ultimately result in a significant increase in water demand.
3.3.1 Water resource monitoring and investigation Water levels and quality need to be monitored to ensure the water resource (normally an aquifer) can meet the future needs of the community. The monitoring regime should relate to targets and water level triggers and appropriate action should the triggers be attained. Extra monitoring may be required during periods of low rainfall and where the water resource is very limited.
Before increasing water production or undertaking investigative drilling for new water resources, existing water demand needs to be assessed to determine whether demand is reasonable or not.
Providing affordable water supplies requires some flexibility to deal with limited water resources during periods of prolonged low rainfall. Additional measures to deal with water resource problems include:
Indigenous Community Engineering Guidelines (ICEG) – updated 14 December 2017 27
i. Pressure reduction to 12 metres to reduce demand (via pressure reducing valves) ii. Frequency of water restrictions should not exceed once in three years on average. iii. Duration of restrictions should not exceed 10 per cent of the time. iv. With regard to peak day supply, restrictions on the use of fixed hoses or sprinklers
are considered reasonable for about 10 days per year. v. Restriction to not less than 70% of normal demand.
Treating water from poor quality water resources should be avoided where possible due the high cost of treatment and risk of ineffectively treated water entering the system.
Water resources that are very limited in terms of quality and quantity will need to be dealt with on a case by case basis with the Department of Health.
3.3.2 Borefield Borefield buffers are required to ensure that the water resource recharge areas and the bore site is separated from activities that could contaminate the water resource.
The loss of the main production bore and running on backup bores (N-1 production) is not a common occurrence. For an adequate water resource, AD (instead of PD) has been adopted on the basis of a minimum water storage capacity (refer Clause 3.2.4) being available to mitigate service problems. Where this is not the case, PD should be adopted for N-1 production.
Where the water resource is limited, it may not be possible to achieve an N-1 production capacity for the borefield. Any or all of the available bores may have limitations. In these cases, a borefield management plan is to be developed in conjunction with NTG defining the pattern of bore usage to preserve the long-term availability of the water resource.
For areas affected by severe tropical cyclones, a back-up pumping system for the borefield, which does not require grid electricity, needs to be considered.
3.3.3 Rising main Optimum sizing of rising mains will vary according to energy costs and should be assessed on a case-by-case basis. The design needs to consider the borefield management plan and include different combinations of bores operating. Use of variable speed drives for pumps may be considered to reduce energy consumption in long rising mains.
The minimum velocity of water in a rising main is associated with self-cleaning flows. Water with significant sediment needs to have a minimum velocity equal or greater than 0.9 m/sec to reduce maintenance requirements. For water with no sediment there is no minimum velocity and sizing of rising main is based on least WOL costs.
28 Indigenous Community Engineering Guidelines (ICEG) – updated 14 December 2017
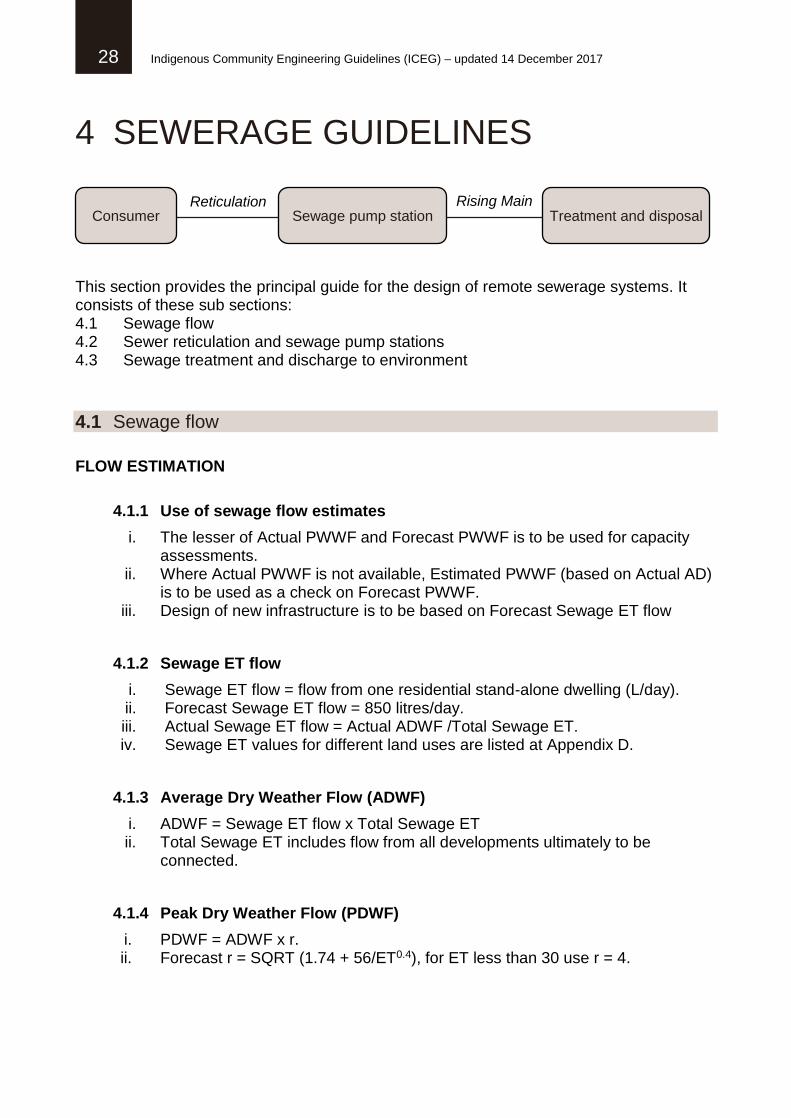
Consumer Sewage pump station Treatment and disposal
4 SEWERAGE GUIDELINES
This section provides the principal guide for the design of remote sewerage systems. It consists of these sub sections: 4.1 Sewage flow 4.2 Sewer reticulation and sewage pump stations 4.3 Sewage treatment and discharge to environment
4.1 Sewage flow
FLOW ESTIMATION
4.1.1 Use of sewage flow estimates
i. The lesser of Actual PWWF and Forecast PWWF is to be used for capacity assessments.
ii. Where Actual PWWF is not available, Estimated PWWF (based on Actual AD) is to be used as a check on Forecast PWWF.
iii. Design of new infrastructure is to be based on Forecast Sewage ET flow
4.1.2 Sewage ET flow
i. Sewage ET flow = flow from one residential stand-alone dwelling (L/day). ii. Forecast Sewage ET flow = 850 litres/day. iii. Actual Sewage ET flow = Actual ADWF /Total Sewage ET. iv. Sewage ET values for different land uses are listed at Appendix D.
4.1.3 Average Dry Weather Flow (ADWF)
i. ADWF = Sewage ET flow x Total Sewage ET ii. Total Sewage ET includes flow from all developments ultimately to be
connected.
4.1.4 Peak Dry Weather Flow (PDWF)
i. PDWF = ADWF x r. ii. Forecast r = SQRT (1.74 + 56/ET0.4), for ET less than 30 use r = 4.
Reticulation Rising Main

Indigenous Community Engineering Guidelines (ICEG) – updated 14 December 2017 29
4.1.5 Peak Wet Weather Flow (PWWF)
i. PWWF = ADWF x Flow Factor. ii. Forecast Flow Factor
= 6 for tropical northern region. = 5 for Victoria/Daly and Roper/Gulf region. = 4 for arid region.
Explanatory Information
This section describes how sewage flows were estimated for these guidelines.
Description of flows:
The flow in a sewer comprises domestic sewage, industrial wastes, groundwater infiltration and storm inflows and rainfall dependant infiltration. Rainfall dependant infiltration and stormwater inflows generally make up most of the peak wet weather flow.
An analysis of 14 sewage pump stations (SPS) was undertaken during 2011-14 to improve the knowledge of sewage flows on remote communities, (Ref 11). The majority of the SPS analysed were in the northern coastal areas.
Methods for estimating sewage flows have been based on this analysis and Ref 1 and Ref 2.
4.1.1 Use of sewage flow estimates Currently there is limited flow data on most of the remote SPS. For this reason an estimate of actual Peak Wet Weather Flow (PWWF) may need to be used as a check in assessing infrastructure capacity.
i. Forecast PWWF ii. Actual PWWF (plus added forecast PWWF from new development) or Estimated
PWWF (based on Actual AD).
Where actual PWWF is lower than Forecast PWWF and no obvious problems are being experienced, an upgrade will not be required. Use of actual flow data should be confirmed with PWC Remote Operations before undertaking detailed assessments.
Where Actual PWWF for existing sewers is not available, a check on Forecast PWWF is to be made using an Estimated PWWF based on actual water demand – refer to “4.1.3 Average Dry Weather Flow (ADWF)” section. Large differences between Forecast PWWF and Estimated PWWF (based on Actual AD) need to be explained. If differences cannot be explained advice should be sought from PWC Remote Operations.
4.1.2 Sewage ET flow Most of the dry weather flow in a remote community is attributed to housing. For this reason the flow from a standard house, equivalent tenement flow “Sewage ET flow”, is being used. One standard house = one Sewage ET. Other land uses i.e., schools, clinic, stores get converted into Sewage ET’s (standard houses). The “Sewage ET flow” refers to a flow at the SPS.
An ET table and worked example for ET determination is at Appendix D. ET values have been based on Ref 1 and Ref 7. The Forecast Sewage ET flow was based on seven sewerage catchments from Ref 1 and Ref 11. The Forecast Sewage ET flow was based on seven non-arid catchments from Ref 1 and Ref 11. The arid region (below Tennant Creek) Forecast sewer ET flow may be lower than the non-arid region. Relevant flow data still needs to be collected and analysed to establish an arid flow figure.
30 Indigenous Community Engineering Guidelines (ICEG) – updated 14 December 2017
4.1.3 Average Dry Weather Flow (ADWF) ADWF is the combined average daily sanitary flow into a sewer from domestic, commercial and industrial sources during a dry period. Actual ADWF is measured at the SPS.
Actual ADWF = Volume of sewage pumped during a dry period/number of dry period days.
Where actual sewage flow data is not available to determine Actual ADWF, an Estimated ADWF based on Actual AD (water) is to be made. Previous studies (Ref 1) indicate that Actual ADWF is in the range of 20% - 40% of Actual AD.
4.1.4 Peak Dry Weather Flow (PDWF)
The Peak Dry Weather Flow (PDWF) is defined as the peak sanitary flow during a normal day.
Forecast PDWF = ADWF x peak diurnal factor “r”.
The actual “r” at 14 SPS (Ref 11) was considered to be lower than normal at most sites and was affected by base flows. The Forecast “r” value from (Ref 2) was found to provide a reasonable approximation of PDWF in northern remote communities compared with actual values, albeit with consistent overestimation. The guideline adopts the formulae from Ref 1 and Ref 2, and is based on pumped hourly volumes from SPS’s.
For low flows (less than 120 sewer ET); Forecast PDWF (average flow over an hour) will underestimate the instantaneous peak flow in a sewer due to discontinuous nature of the flow. To account for this; Ref (12) estimated the instantaneous peak flow (or daily peak flow) to be PDWF + 1 litre/sec (flow from normal domestic toilet). The Instantaneous PDWF if large enough has the potential to transport small solids, such as grit, along the sewer and achieve self-cleansing.
Self-cleansing flows from shear stress values and Manning’s “n” (using Camps method) can be obtained from the WSAA sewer pipe sizing calculator, available on WSAA website; results from any modelling should be read in conjunction with Ref (14). For further information on self-cleansing flows refer to section 4.2 Explanatory Information.
4.1.5 Peak Wet Weather Flow (PWWF) Actual PWWF (in this guide) is a flow that does not have an Average Recurrence Interval (ARI) less than six months (under separate events). Ref 14 should be referred to for more information on ARI and flow estimation.
To simplify design, the effect of surcharging (increased flows from MHs filling) is ignored. In reality, surcharging allows for a significant increase in peak flow and an added factor of safety. Overflows (if they occur) are most likely to occur at the SPS or lowest MH (usually near SPS).
PWWF = ADWF x Flow Factor.
While ADWF is not proportional to PWWF, using ADWF (with a multiplier) provides an acceptable forecast of PWWF given the amount of actual flow data available. WSAA (Ref 14) defines PWWF = PDWF + groundwater (non-rainfall dependant) infiltration + peak (rainfall dependant) inflow and infiltration.
Rainfall is the main driver behind PWWF, and the following rainfall regions have been chosen to allocate flow factors, refer map at Appendix B.
i. Tropical northern region – latitude north of Adelaide River, annual rainfall generally above 1500 mm per year.
ii. Victoria/Daly River region plus Roper/Gulf region – latitudes between Tennant Creek and Adelaide River, annual rainfall generally between 500 mm and 1500 mm.
iii. Arid region – latitude south of Tennant Creek, annual rainfall generally less than 500

Indigenous Community Engineering Guidelines (ICEG) – updated 14 December 2017 31
mm per year.
While the analysis on northern SPS (Ref 11) did not show a flow factor greater than 5, a higher flow factor of 6 has been chosen for the high rainfall areas to safeguard against overflows. The lower flow factor of 4 has been selected for the arid region because of its low rainfall.
METERING AND FLOW DATA COLLECTION
4.1.6 Flow meters
i. Flow meters with automatic monitoring are to be installed on all sewage pump stations.
Explanatory Information
4.1.6 Flow meters The accuracy of metering and collection of data needs to reflect the purpose for which the data is to be used. Sewage pump stations need to be assessed on PWWF, which involves recording flows in time steps of an hour or less during high rainfall periods. Obtaining reliable flow information from remote communities can be difficult and automatic monitoring is the preferred method.
32 Indigenous Community Engineering Guidelines (ICEG) – updated 14 December 2017
4.2 Sewer reticulation and sewage pump stations
SEWER RETICULATION
4.2.1 Minimum sewer grade
i. Minimum grade on sewer sections is to be obtained from Appendix G. ii. Minimum grade of 1% is to be achieved for the first length at the upstream
end. iii. Where there is a reasonable expectation for extension to serve further
development the sewer is to be graded to achieve maximum practical depth with capacity and self-cleansing grades allowing for the likely contributing flow.
4.2.2 Location and depth of sewers
i. Different sewer locations are to be explored to optimise trenching costs. ii. Sewer depths should not exceed six metres with preference not more than
4.5m. iii. Sewers are to be located in road reserves where location options have similar
WOL costs.
4.2.3 Maintenance Hole (MH) and Maintenance Shaft (MS) for sewers less than DN300
i. Where MS’s are not being used between MH’s: distance between MH’s is not to exceed 100m.
ii. Where MS’s are being used between MH’s; distance between MH’s is not to exceed 200m and distance between MH and MS is not to exceed 100m.
4.2.4 Sewer pipe bedding and cover
i. Locally available bedding material should be researched where transport costs are high.
ii. A minimum cover of 0.7m within road reserves and 0.6m elsewhere is to be provided.
Explanatory Information
Pipe size and grade is to be such as to contain the design flow (PWWF) and achieve a self-cleansing flow at least once a day. Sewer design generally aims to provide sufficient capacity for maximum design flows as a primary requirement and self-cleansing as a secondary requirement.
Minimising the depth of sewer trenching through the use of minimum grades (for self- cleansing) is an important factor in achieving affordable sewerage systems.
The transition to design minimum grade on 150mm diameter sewers can form a significant part of remote sewerage systems. For this transition (with low flows from sewer ET less than 120); daily flows will not be continuous but display an intermittent pulsing pattern. Self-cleansing is generally achieved via the mechanism of successive “impulse-shunting” jolts that transport grit and debri along the sewer to sections of continuous flow.

Indigenous Community Engineering Guidelines (ICEG) – updated 14 December 2017 33
4.2.1 Minimum sewer grade Design maximum flows and design minimum grades given in Appendix G are based on WSAA guidelines (Ref 14) and a review of self-cleansing grades (Ref 12). 4.2.2 Location and depth of sewers Some flexibility in sewer location is to be given to reduce trenching costs. A trench deeper than 1.5m either requires shoring or benching, both of which greatly add to the cost of trenching.
Sewer connections and access for maintenance to the sewer needs to be considered in sewer location assessments. NTG have secure tenure over a number of Remote Community Housing and NTG Infrastructure lots in remote communities. There are clauses within the leases/subleases that allow NTG (the lessee) to undertake repairs and maintenance works on these lots. Repairs and maintenance work (on leased lots) can be carried out by any officers authorised by the NTG, which includes PWC Remote Operations (where access to sewers is required).
Remote community housing lots tend to be larger than urban lots, which helps reduce access problems, and sewers may be placed at the front or back of lots. Where trenching costs are high, only the likely building area of the lot needs to be serviced by the sewer.
4.2.3 Maintenance hole (MH) and Maintenance Shafts (MS) A lower MH spacing (than in Ref 14) is adopted because of the limited availability of sewer cleaning equipment/expertise in remote areas. MH spacing on DN 300 and larger sewers is not specified here; values given in (Ref 14) are to be used as a reference and MH spacing is to be approved by PWC Remote Operations.
A MS can be used to replace a MH on straight sections and may be used on change in direction up to 45 degrees. (Ref 14) is to be used as a reference on MS and MS location is to be approved by PWC Remote Operations.
4.2.4 Sewer pipe bedding and cover The purpose of bedding material is to provide a sound, flexible foundation for the pipe with good lateral support and protect the pipe from contact with rocks. Use of local materials can provide substantial savings; however obtaining approval for its use can be lengthy and needs to be considered in the project development phase.
Additional Information - Common Effluent Disposal (CED) systems (this section not linked to a specific ICEG guideline)
No specific guidelines are given on CED systems here. An information sheet on CED system based on (Ref 13) is given at Appendix H.
CED systems allow septic effluent (from septic tanks) to be collected and transported for further treatment or disposal (absorption beds or ponds) away from housing lots. Given the removal of solids in septics, CED can operate with flatter grades than full water borne systems. These systems have not been as effective as full water borne systems on remote communities partly because of poor maintenance of septics. However they become much more cost effective as the size of communities decrease, or for areas of very flat terrain, or rocky areas (high trenching costs), and are worth consideration for community populations less than 150 people.
34 Indigenous Community Engineering Guidelines (ICEG) – updated 14 December 2017
SEWAGE PUMP STATION AND RISING MAIN
4.2.5 Sewage pump station
i. A minimum of two sewage pumps are to be provided with either pump being capable of meeting PWWF.
ii. Maximum number of pump starts is to be 10 per hour. iii. In general, depth of inlet should be limited to six metres. iv. A risk based approach is to be used for mitigating SPS overflows into sensitive
areas.
4.2.6 Rising main
i. Minimum velocity in rising main is 0.9 m/s. ii. Maximum velocity in rising main is 2.5 m/s.
Explanatory Information
4.2.5 Sewage pump station The sewage pump station (SPS) provides a small storage (buffer) and pumping system to lift sewage to a higher location i.e. reticulation, another SPS or sewage ponds.
Overflow during the dry season is the main environmental concern, because the dry weather sewage effluent (undiluted by stormwater/infiltration) is unlikely to be flushed away and has a much greater impact on the environment. A standby pump is included on all sewage pump stations for this reason.
Where the (potential) overflow is into an environmentally sensitive area or an area likely to affect people’s health, a risk management approach needs to be adopted and improvements to SPS reliability considered. Sewers and MHs act as additional overflow storage, particularly in flat terrain, and this storage needs to be assessed first. Possible SPS reliability improvements to mitigate overflows include; permanent back up generation (or provision for connection to an emergency power supply) and overflow storage (in addition to sewers and manholes).
SPS wet well and each pump is sized to meet PWWF. PWWF only happens on average twice a year (by definition). Peak flows generally do not last much longer than one hour due to relatively small catchment areas. Having two pumps available provides additional pumping capacity above the PWWF.
Historically concrete has been used for the SPS wet well. Fibre reinforced plastic (FRP) is an acceptable material option (as part of a package SPS) provided that the design and manufacture is approved by an Australian registered composites engineer.
4.2.6 Rising main Rising mains should be sized based on capital and operating costs of the rising main and SPS together with requirements for self-cleansing velocity and passage of solids. To avoid the release of odours and leakage, the main should be graded to minimise high points.

Indigenous Community Engineering Guidelines (ICEG) – updated 14 December 2017 35
4.3 Sewerage treatment and discharge to environment
SEWAGE TREATMENT AND DISCHARGE TO ENVIRONMENT
4.3.1 Sewage treatment
i. Sewage from reticulated sewerage systems is to be treated in sewage treatment ponds.
ii. Level of treatment is to reflect the actual or potential value of the receiving environment and to adequately protect public health.
4.3.2 Siting of sewage treatment ponds
i. Site is to: a. Preferably be lower than the area to be drained to save on pumping costs. b. Have suitable topography, soil conditions and be located away from
floodplains and storm surge area. c. Have sufficient buffer to allow for odour, noise and visual screening as well
as discourage unauthorised access and avoid aerosol drift and mosquitoes.
d. Provide space for on-site expansion where required. e. Allow discharges (effluent, gases or sludge) to happen in an
environmentally acceptable manner.
Explanatory Information
For remote sewage treatment ponds (STP); sewage treatment and effluent disposal needs to be prioritised around health aspects and possible impact on water bodies, particularly where discharge is happening outside the lease area. Effluent disposal may be on-site via evaporation from ponds, evapotranspiration and infiltration from irrigated disposal areas or a licensed discharge off site. Reuse of treated effluent is not normally adopted on remote communities due to small discharge volumes and the added complexity/cost of treatment, which makes reuse unviable. The main public health concern (from using remote STP) is exposure to pathogens and mosquitos. Exposure to pathogens (outside the lease) can happen through contact with inadequately treated sewage or the accumulation of pathogens within the food chain ie. shellfish and other food consumed raw. Mosquito breeding outside the treatment ponds can be prevented by reducing the ponding of discharged treated sewage effluent (which is nutrient rich) to less than seven days. Within the treatment ponds, mosquito numbers are limited through the use of concrete on STP walls. The concrete reduces mosquito breeding areas and exposes mosquito larvae to predators (that occur naturally in STP). The main environmental concern are discharges in the dry season (May – October), and should be avoided to sensitive environments such as creeks and billabongs. Most remote STP do not discharge (outside their lease) during the dry season. Sewage can be classed as “domestic sewage” given the low levels of industrial activity on IES communities. For domestic sewage, the concentrations of biological oxygen demand (BOD), suspended solids (SS) and pathogens are significant and these pollutants are expected to have the greatest impact on environmental and public health. BOD consumes the dissolved oxygen
36 Indigenous Community Engineering Guidelines (ICEG) – updated 14 December 2017
within water and can lead to fish kills and increased toxicity of other pollutants. High SS concentrations can lead to sludge deposits, covering of aquatic plants, reduced sunlight penetration, adsorption of other pollutants and the harbouring of pathogens. Pathogens can result in waterborne disease and may also accumulate within the food chain over time, and are of particular concern where reuse is employed, where there is public access to the discharge area or where the discharge area impacts on agricultural or fishing areas. 4.3.1 Sewage treatment (This section covers domestic sewage treatment without reuse) Sewage treatment ponds (STP) have provided a reliable and effective means of treating domestic sewage on (57) NT remote communities.
Specific sewage treatment levels for remote STPs in relation to the discharge environment have yet to be established. Information relevant to remote STP treatment levels is provided at Appendix I plus a summary of the literature review on discharge effluent quality guidelines (Ref 15) is given below;
Several Australian jurisdictions have adopted a risk management approach which considers the value of the receiving environment. The NT EPA waste discharge licences help identify environmental values. Treatment levels from (6) selected overseas countries with warm climates typically ranged from BOD5 20-50 mg/L and SS 50-100 mg/L, with the treatment level depending on volume of discharge and importance of receiving environment. Pathogen levels were only given in some instances. The US EPA has STP treatment levels at BOD5 45 mg/L and SS 45 mg/L.
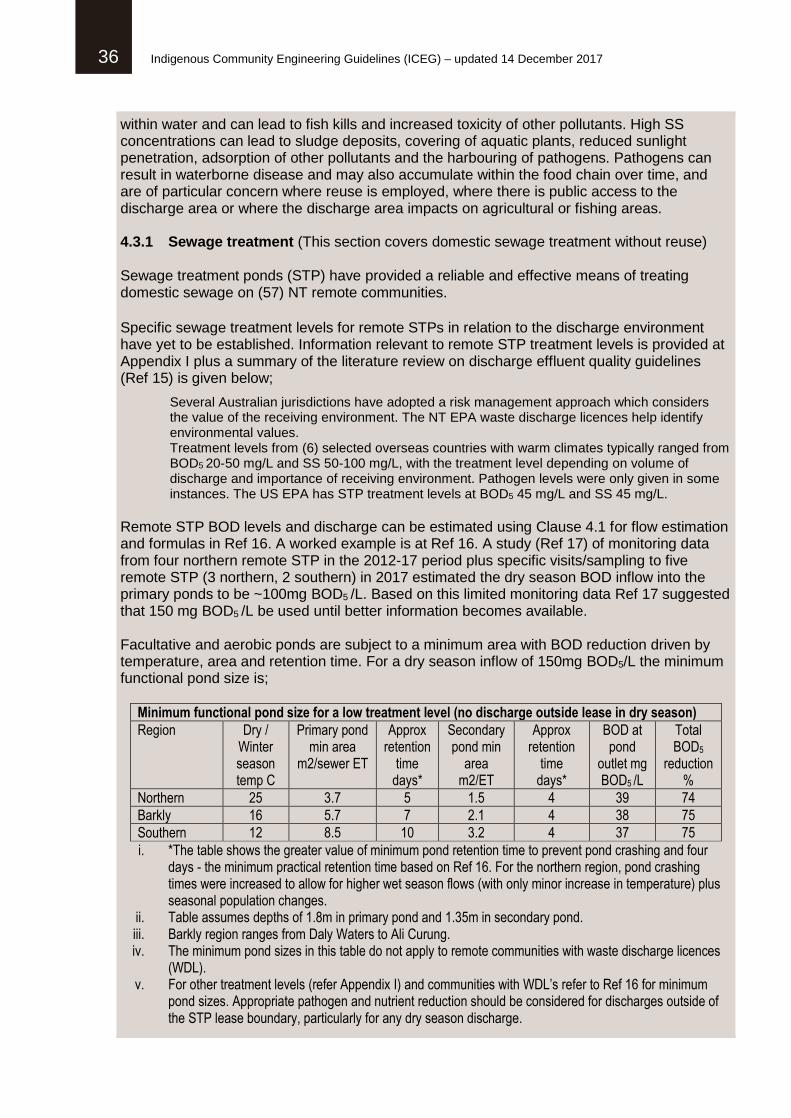
Remote STP BOD levels and discharge can be estimated using Clause 4.1 for flow estimation and formulas in Ref 16. A worked example is at Ref 16. A study (Ref 17) of monitoring data from four northern remote STP in the 2012-17 period plus specific visits/sampling to five remote STP (3 northern, 2 southern) in 2017 estimated the dry season BOD inflow into the primary ponds to be ~100mg BOD5 /L. Based on this limited monitoring data Ref 17 suggested that 150 mg BOD5 /L be used until better information becomes available. Facultative and aerobic ponds are subject to a minimum area with BOD reduction driven by temperature, area and retention time. For a dry season inflow of 150mg BOD5/L the minimum functional pond size is;
Minimum functional pond size for a low treatment level (no discharge outside lease in dry season)
Region Dry / Winter season temp C
Primary pond min area
m2/sewer ET
Approx retention
time days*
Secondary pond min
area m2/ET
Approx retention
time days*
BOD at pond
outlet mg BOD5 /L
Total BOD5
reduction %
Northern 25 3.7 5 1.5 4 39 74
Barkly 16 5.7 7 2.1 4 38 75
Southern 12 8.5 10 3.2 4 37 75
i. *The table shows the greater value of minimum pond retention time to prevent pond crashing and four days - the minimum practical retention time based on Ref 16. For the northern region, pond crashing times were increased to allow for higher wet season flows (with only minor increase in temperature) plus seasonal population changes.
ii. Table assumes depths of 1.8m in primary pond and 1.35m in secondary pond. iii. Barkly region ranges from Daly Waters to Ali Curung. iv. The minimum pond sizes in this table do not apply to remote communities with waste discharge licences
(WDL). v. For other treatment levels (refer Appendix I) and communities with WDL’s refer to Ref 16 for minimum
pond sizes. Appropriate pathogen and nutrient reduction should be considered for discharges outside of the STP lease boundary, particularly for any dry season discharge.
Indigenous Community Engineering Guidelines (ICEG) – updated 14 December 2017 37
Remote STP detailed designs will need to consider EPA Waste Discharge License (WDL) requirements, Environmental Risk Assessments and Performance Improvements Plans.
4.3.2 Siting of sewage treatment ponds There are no set guidelines on buffer distances from a community; however a buffer of at least 500m from housing areas should be sought with a preferred buffer of 2 km. STP should not be located upstream of housing, borefields, campsites, swimming holes, established fishing areas or surface water sources.
Dry season discharges from ponds or associated on-site effluent disposal areas are the main environmental concern and should be avoided where possible. It may not be economically feasible to have zero discharge from the STP site during periods of high rainfall, and the ponds need to be sited to allow for this possibility.
Additional Information (this section is not linked to an ICEG guideline) The NT Department of Health guideline relevant to remote STP is; Mosquito breeding and sewage pond treatment in the Northern Territory.
Licensing of off-site discharges is required where the discharged sewage effluent is likely to move outside the lease area and pollute a water body. Waste discharge licences (WDL) have been issued for approximately half of the IES communities, and published on the NT EPA website.
Ref 16 and Ref 18 has further information on sewage treatment.
Septic systems do not form part of the IES assets and are not included in this guide.

38 Indigenous Community Engineering Guidelines (ICEG) – updated 14 December 2017
Consumer LV Distribution
Transformer Power Station HV Distribution
Embedded Generation
5 ELECTRICITY GUIDELINES
This section provides the principal guide for the design of remote electricity systems. It consists of these sub sections: 5.1 Consumer demand 5.2 Network 5.3 Power station 5.4 Embedded generation systems
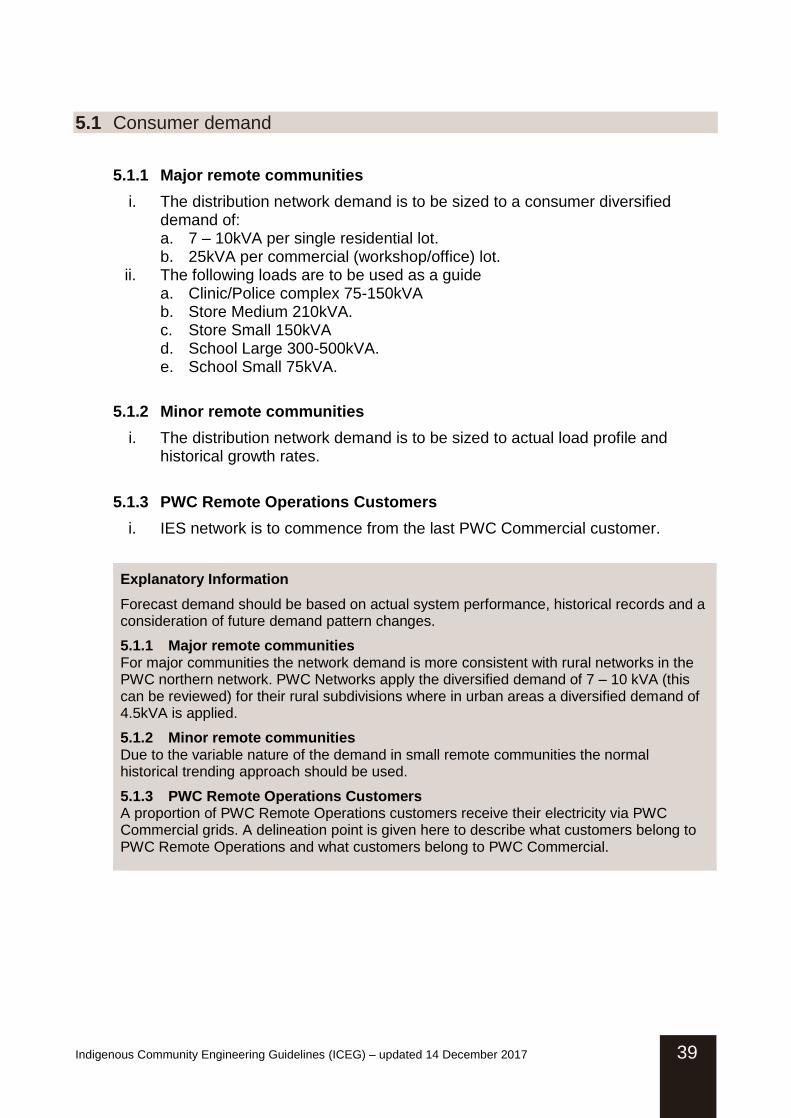
Indigenous Community Engineering Guidelines (ICEG) – updated 14 December 2017 39
5.1 Consumer demand
5.1.1 Major remote communities
i. The distribution network demand is to be sized to a consumer diversified demand of: a. 7 – 10kVA per single residential lot. b. 25kVA per commercial (workshop/office) lot.
ii. The following loads are to be used as a guide a. Clinic/Police complex 75-150kVA b. Store Medium 210kVA. c. Store Small 150kVA d. School Large 300-500kVA. e. School Small 75kVA.
5.1.2 Minor remote communities
i. The distribution network demand is to be sized to actual load profile and historical growth rates.
5.1.3 PWC Remote Operations Customers
i. IES network is to commence from the last PWC Commercial customer.
Explanatory Information
Forecast demand should be based on actual system performance, historical records and a consideration of future demand pattern changes.
5.1.1 Major remote communities For major communities the network demand is more consistent with rural networks in the PWC northern network. PWC Networks apply the diversified demand of 7 – 10 kVA (this can be reviewed) for their rural subdivisions where in urban areas a diversified demand of 4.5kVA is applied.
5.1.2 Minor remote communities Due to the variable nature of the demand in small remote communities the normal historical trending approach should be used.
5.1.3 PWC Remote Operations Customers A proportion of PWC Remote Operations customers receive their electricity via PWC Commercial grids. A delineation point is given here to describe what customers belong to PWC Remote Operations and what customers belong to PWC Commercial.

40 Indigenous Community Engineering Guidelines (ICEG) – updated 14 December 2017
5.2 Network
QUALITY AND RELIABILITY
5.2.1 Quality
i. LV Voltage 230 V, with variation at point of connection, steady state within +10% to -6%.
ii. Frequency 50 Hz, with frequency variation range to be within 5%.
5.2.2 Reliability
i. The network (without external influences) is to be capable of achieving a good level of reliability.
ii. Trees are to be removed where ever possible and appropriate to improve future reliability.
Explanatory Information
5.2.1 Quality Electrical appliances are designed around national standards for electricity and operating appliances outside these standards can shorten their life.
For this reason the key electrical parameters used on remote communities need to be consistent with national electricity standards. Key parameters include voltage and frequency at the customer’s terminal.
5.2.2 Reliability A good reliability would be classed as similar to an urban area.
The remote network reliability is largely affected by external influences, the main cause being trees/branches falling on power lines. Other external factors; lightning strikes, bats and high winds also affect reliability; and reliability can vary significantly from community to community. Where a good reliability is required for a remote community, customers will need to consider having their own back up generation or energy storage.
Without external influences, small remote networks are expected to have a good reliability. Tree removal needs to be discussed with stakeholders in the investigation phase to help improve long term reliability of networks.
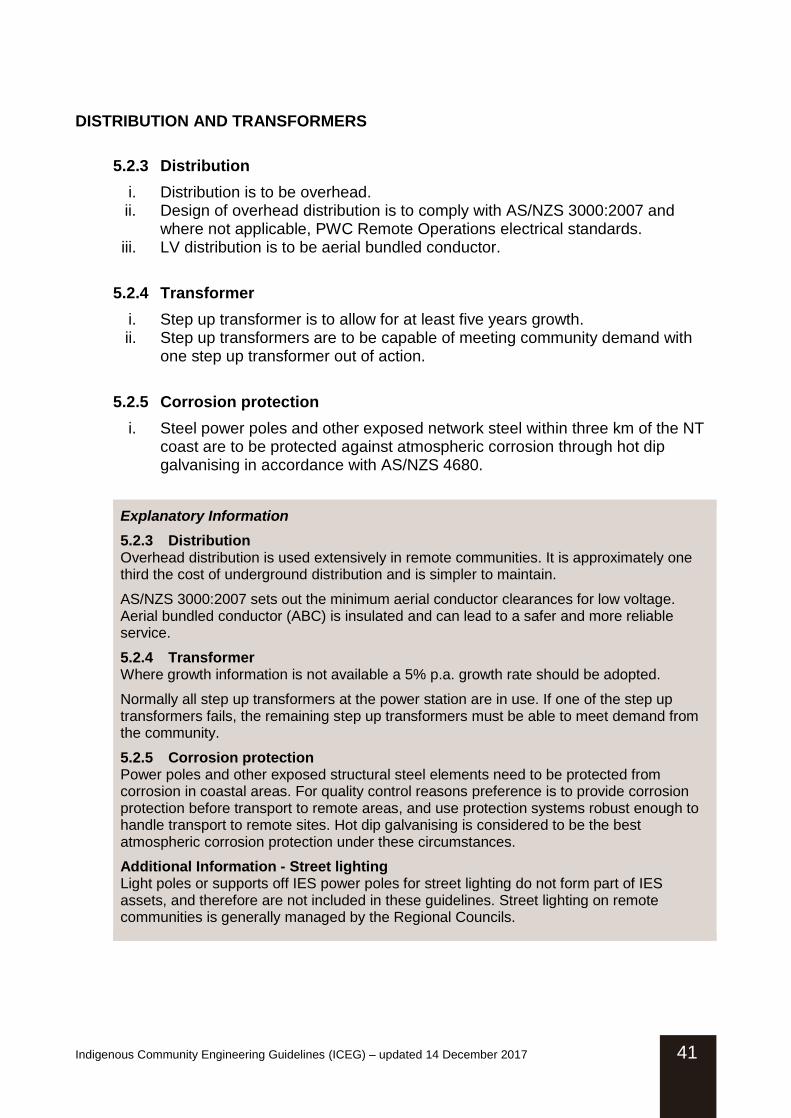
Indigenous Community Engineering Guidelines (ICEG) – updated 14 December 2017 41
DISTRIBUTION AND TRANSFORMERS
5.2.3 Distribution
i. Distribution is to be overhead. ii. Design of overhead distribution is to comply with AS/NZS 3000:2007 and
where not applicable, PWC Remote Operations electrical standards. iii. LV distribution is to be aerial bundled conductor.
5.2.4 Transformer
i. Step up transformer is to allow for at least five years growth. ii. Step up transformers are to be capable of meeting community demand with
one step up transformer out of action.
5.2.5 Corrosion protection
i. Steel power poles and other exposed network steel within three km of the NT coast are to be protected against atmospheric corrosion through hot dip galvanising in accordance with AS/NZS 4680.
Explanatory Information
5.2.3 Distribution Overhead distribution is used extensively in remote communities. It is approximately one third the cost of underground distribution and is simpler to maintain.
AS/NZS 3000:2007 sets out the minimum aerial conductor clearances for low voltage. Aerial bundled conductor (ABC) is insulated and can lead to a safer and more reliable service.
5.2.4 Transformer Where growth information is not available a 5% p.a. growth rate should be adopted.
Normally all step up transformers at the power station are in use. If one of the step up transformers fails, the remaining step up transformers must be able to meet demand from the community.
5.2.5 Corrosion protection Power poles and other exposed structural steel elements need to be protected from corrosion in coastal areas. For quality control reasons preference is to provide corrosion protection before transport to remote areas, and use protection systems robust enough to handle transport to remote sites. Hot dip galvanising is considered to be the best atmospheric corrosion protection under these circumstances.
Additional Information - Street lighting Light poles or supports off IES power poles for street lighting do not form part of IES assets, and therefore are not included in these guidelines. Street lighting on remote communities is generally managed by the Regional Councils.
42 Indigenous Community Engineering Guidelines (ICEG) – updated 14 December 2017
5.3 Power station
LOCATION
5.3.1 Siting of power station
i. Site is to have: a. Protection from flooding, local ponding and sea storms surge, with an
average recurrence interval of less than 1% in a year. b. All weather 4WD access for the local operator. c. Access for fuel delivery with less than 1 year in 50 probability of
interruption for longer than reserve fuel supply period. d. Prevailing winds carry power station noise away from housing areas.
Explanatory Information
5.3.1 Siting of power station Approval to siting new power stations will need to come from relevant NT Government planning agency. These guidelines form part of the process for getting that approval.
New power stations should be sited at least 500m and preferably 1500m from the nearest planned residential development.
For existing installations: with careful attention to noise reduction, the development buffer zone may be reduced to 250m if cost savings to IES are significant. The reduced noise buffer would only be considered where decisions between upgrading a power station on an existing site or relocation of a power station are being made.
METERING AND DATA COLLECTION
5.3.2 Electricity and fuel metering
i. Data is to be automatically collected for: a. Electricity generated (kWh). b. Electricity energy consumed by station (kWh). c. Energy sent out by feeder, and total station (kWh). d. Peak demand and minimum demand (Kw). e. Volume of fuel burnt (litres).
Explanatory Information
5.3.2 Electricity and fuel metering Electricity generated, volume of fuel burnt and fuel heat content needs to be measured within 1% of their true value to allow an accurate assessment of thermal efficiency.
For stations with solar PV and other augmentation, the cost and energy provision needs to be recorded as an export, import and net energy (kWh).
Indigenous Community Engineering Guidelines (ICEG) – updated 14 December 2017 43
GENERATION
5.3.3 Major generation upgrades
i. Connection to existing electricity grids (where feasible) is to be evaluated prior to committing to major remote power station works.
5.3.4 Thermal efficiency
i. Remote power stations are to be capable of achieving an average thermal efficiency rating of 36% (or greater) over a year.
5.3.5 Reliability
i. Remote power stations are to be capable of meeting peak demand without the use of the largest engine (N-1 methodology).
5.3.6 Fuel storage
i. Fuel storage facilities are to be capable of coping with supply chain problems, and cover periods of poor or no access to remote communities.
Explanatory Information
5.3.3 Major generation upgrades Major generation upgrade options need to be considered with connection to other larger electricity grids on a WOL basis, especially where lower cost generation is available i.e. gas fired generation.
5.3.4 Thermal efficiency For remote diesel power stations, WOL cost is mainly determined the cost of fuel and thermal efficiency. Thermal efficiency rating = Electrical energy / (Volume of fuel burnt x heat content of fuel)
The largest cost item of the IES program is fuel for electricity generation, and represents at least 20% of the total cost of the IES program. The higher the thermal efficiency rating the less fuel that needs to be transported and burnt at a remote power station.
Operating one engine (at one time) within its optimum load range (60-90% capacity) will achieve the best thermal efficiency rating. For remote communities a range of engine sizes (normally three engines of unequal size) is required to achieve this. An automatic control system is also required to ensure the right engine is matched to load 24/7 in order to achieve a good thermal efficiency rating (36% or better).
5.3.5 Reliability Power stations need to be able to meet (reasonable) peak demand if the largest generation set is being serviced or out of action. Reasonable peak demand can be taken as the peak demand occurring during a week in a high demand period (with reliable data). It does not include start up demand on the station after a community black out.
5.3.6 Fuel storage At least four weeks should be allowed for supply chain problems. Some remote communities get cut off for many months during the wet season and each remote

44 Indigenous Community Engineering Guidelines (ICEG) – updated 14 December 2017
community differs in the amount of fuel storage needed. For information on access refer to NT Government’s Bush Telegraph’s website: www.bushtel.nt.gov.au/, and PWC Remote Operations.
5.4 Embedded generation systems
INTERMITTENT GENERATION SYSTEMS
5.4.1 Reliability
i. Intermittent generation systems when combined with the main generation system are to offer an equal or reduced WOL cost for the total electricity system while meeting reliability and quality guidelines.
5.4.2 Development cost
i. Cost of interface and network upgrades caused by adding intermittent electricity to the IES network, including all assessment costs, is to be met by the developer.
Explanatory Information
An embedded Intermittent generation system, such Solar PV, removes load from the network when generating and “returns” load to the network when generation ceases.
5.4.1 Reliability To cater for sudden significant changes of load on a remote community network, an energy buffer is required to maintain quality of supply. This energy buffer can come from an additional spinning reserve (stored kinetic energy) of the operating generating set or batteries (stored chemical energy), or a combination of both.
Unless the “operator” of the main generator system has agreed to carry an additional “spinning reserve”, the intermittent generator needs to be responsible for providing suitable energy storage to allow the main generation system to operate efficiently and reliably.
Load transfer rate on the network has to be agreed with the “operator” of the main generation system. For significant load increase; a minimum one minute warning is needed to allow a larger generating set to be brought on line.
5.4.2 Development cost An embedded Intermittent generation system has the potential to trigger upgrades in the network that would otherwise not be required.
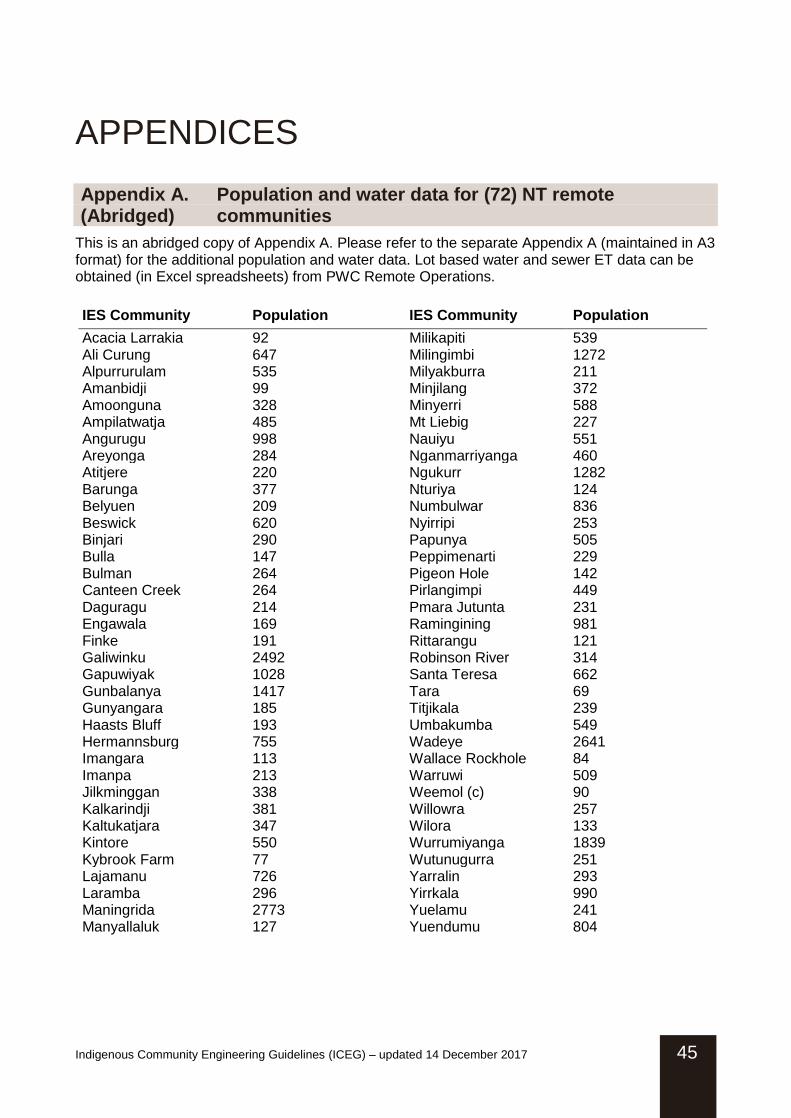
Indigenous Community Engineering Guidelines (ICEG) – updated 14 December 2017 45
APPENDICES
Appendix A. Population and water data for (72) NT remote (Abridged) communities
This is an abridged copy of Appendix A. Please refer to the separate Appendix A (maintained in A3 format) for the additional population and water data. Lot based water and sewer ET data can be obtained (in Excel spreadsheets) from PWC Remote Operations.
IES Community Population IES Community Population
Acacia Larrakia 92 Milikapiti 539 Ali Curung 647 Milingimbi 1272 Alpurrurulam 535 Milyakburra 211 Amanbidji 99 Minjilang 372 Amoonguna 328 Minyerri 588 Ampilatwatja 485 Mt Liebig 227 Angurugu 998 Nauiyu 551 Areyonga 284 Nganmarriyanga 460 Atitjere 220 Ngukurr 1282 Barunga 377 Nturiya 124 Belyuen 209 Numbulwar 836 Beswick 620 Nyirripi 253 Binjari 290 Papunya 505 Bulla 147 Peppimenarti 229 Bulman 264 Pigeon Hole 142 Canteen Creek 264 Pirlangimpi 449 Daguragu 214 Pmara Jutunta 231 Engawala 169 Ramingining 981 Finke 191 Rittarangu 121 Galiwinku 2492 Robinson River 314 Gapuwiyak 1028 Santa Teresa 662 Gunbalanya 1417 Tara 69 Gunyangara 185 Titjikala 239 Haasts Bluff 193 Umbakumba 549 Hermannsburg 755 Wadeye 2641 Imangara 113 Wallace Rockhole 84 Imanpa 213 Warruwi 509 Jilkminggan 338 Weemol (c) 90 Kalkarindji 381 Willowra 257 Kaltukatjara 347 Wilora 133 Kintore 550 Wurrumiyanga 1839 Kybrook Farm 77 Wutunugurra 251 Lajamanu 726 Yarralin 293 Laramba 296 Yirrkala 990 Maningrida 2773 Yuelamu 241 Manyallaluk 127 Yuendumu 804

46 Indigenous Community Engineering Guidelines (ICEG) – updated 14 December 2017
Appendix B. NT remote communities (72) map
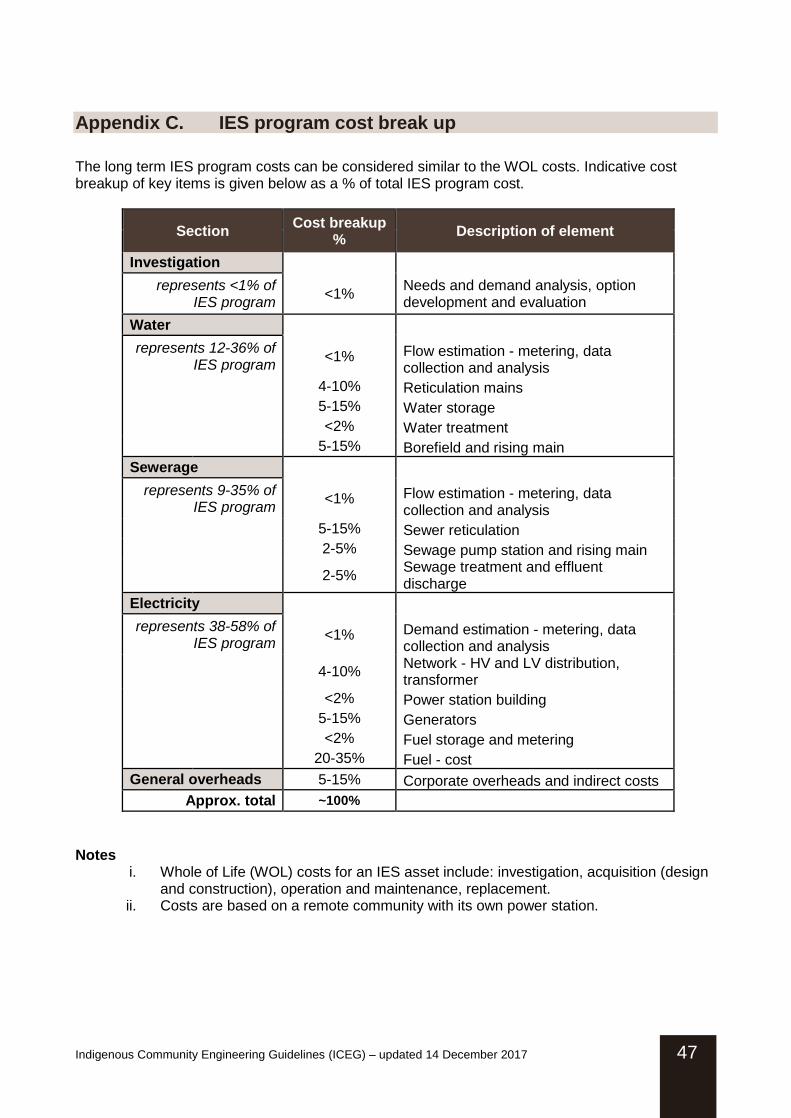
Indigenous Community Engineering Guidelines (ICEG) – updated 14 December 2017 47
Appendix C. IES program cost break up
The long term IES program costs can be considered similar to the WOL costs. Indicative cost breakup of key items is given below as a % of total IES program cost.
Section Cost breakup
% Description of element
Investigation
represents <1% of IES program
<1% Needs and demand analysis, option development and evaluation
Water
represents 12-36% of IES program
<1% Flow estimation - metering, data collection and analysis
4-10% Reticulation mains
5-15% Water storage
<2% Water treatment
5-15% Borefield and rising main
Sewerage
represents 9-35% of IES program
<1% Flow estimation - metering, data collection and analysis
5-15% Sewer reticulation
2-5% Sewage pump station and rising main
2-5%
Sewage treatment and effluent discharge
Electricity
represents 38-58% of IES program
<1% Demand estimation - metering, data collection and analysis
4-10%
Network - HV and LV distribution, transformer
<2% Power station building
5-15% Generators
<2% Fuel storage and metering
20-35% Fuel - cost
General overheads 5-15% Corporate overheads and indirect costs
Approx. total ~100%
Notes
i. Whole of Life (WOL) costs for an IES asset include: investigation, acquisition (design and construction), operation and maintenance, replacement.
ii. Costs are based on a remote community with its own power station.

48 Indigenous Community Engineering Guidelines (ICEG) – updated 14 December 2017
Appendix D. Equivalent tenement figures for NT remote communities
EQUIVALENT TENEMENT (ET) FIGURES FOR NT REMOTE COMMUNITIES Table 1: ET Figures – Residential User Categories
Category Unit Type Standard ET
Water ET Sewer ET
Small Residential Lot (< 450m2) Lot Use Duplex ET’s
Standard Residential Lot (450m2 – 2000m2) Lot 1.00 1.00
Large Residential Lot (> 2000m2) Lot 1.20 1.00
Duplex – 1 bedroom* Dwelling 0.40 0.50
Duplex – 2 bedroom* Dwelling 0.60 0.75
Duplex – 3 bedroom* Dwelling 0.80 1.00
*Use standard Residential Lot where duplex is located on Lot >450m2. Use duplexes for units that are not part of multi storey apartments.
Table 2: ET Figures – Non-Residential Categories
Category Unit Type Standard ET
Water ET Sewer ET Notes
Nursing Home / Special Care Bed 0.500 0.750 Limited medical facilities, communal kitchen / laundry
Boarding House Bed 0.330 0.500 Communal kitchen / laundry
Caravan Park (temporary sites) Site 0.500 0.600
Motel / Hotel / Resort Room Room 0.300 0.450 Consider food preparation separately
Single Retail Shop Floor Area m2 0.002 0.003
Supermarket Floor Area m2 0.002 0.003 Includes minor food preparation
Offices Floor Area m2 0.004 0.006
Health Centre Floor Area m2 0.0008 0.0012 Minimum water ET is 3, and sewer ET is 4.5.
Police Station Still to be properly assessed, assume water ET is 3 and sewer ET is 3.
Take Away / Fast Food (no amenities)
Floor Area m2 0.015 0.024 Also use for general food preparation
Pub / Bar Floor Area m2 0.030 0.048 Consider food preparation separately
Public Amenities Block (toilets) Wc 0.400 0.600
Child Care Centre / Pre-School Person 0.060 0.100
Education – School (primary & secondary)
Person 0.030 0.050 Minimum water ET is 3, and sewer ET is 3.
Swimming Pool – Outdoor Pool area m2 0.02 Remote community pools are expected to be between 6 and 9 ET.
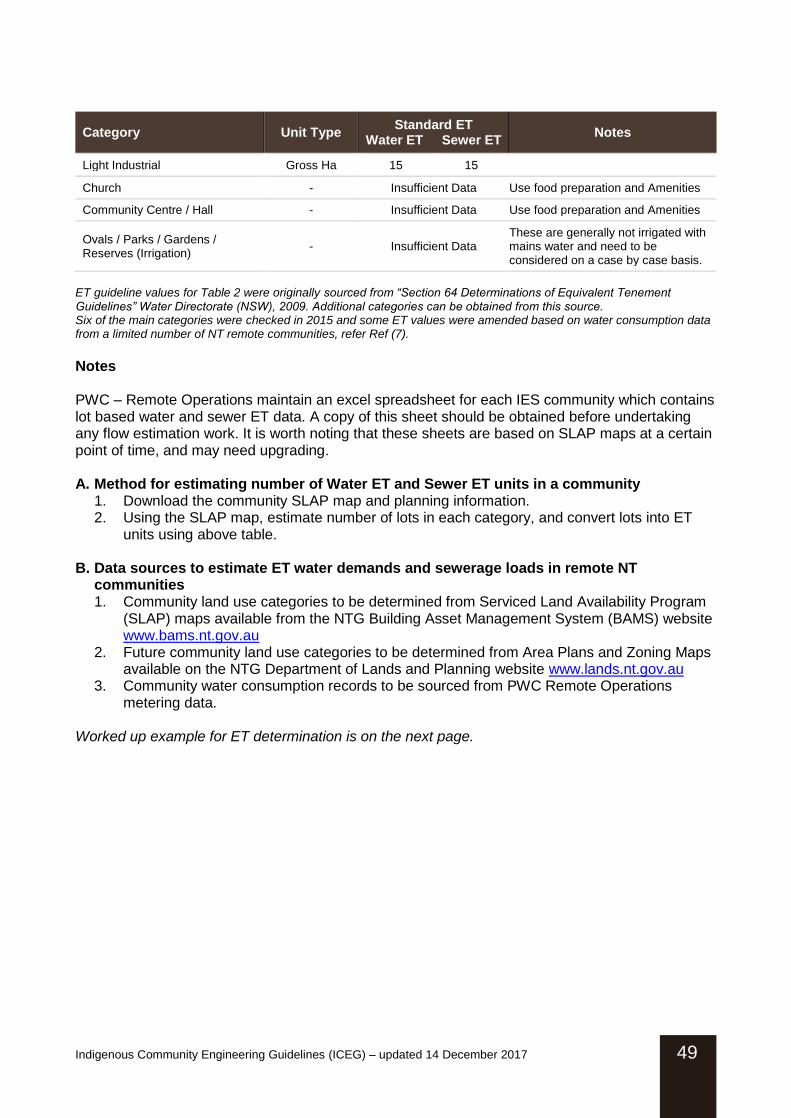
Indigenous Community Engineering Guidelines (ICEG) – updated 14 December 2017 49
Category Unit Type Standard ET
Water ET Sewer ET Notes
Light Industrial Gross Ha 15 15
Church - Insufficient Data Use food preparation and Amenities
Community Centre / Hall - Insufficient Data Use food preparation and Amenities
Ovals / Parks / Gardens / Reserves (Irrigation)
- Insufficient Data These are generally not irrigated with mains water and need to be considered on a case by case basis.
ET guideline values for Table 2 were originally sourced from “Section 64 Determinations of Equivalent Tenement Guidelines” Water Directorate (NSW), 2009. Additional categories can be obtained from this source. Six of the main categories were checked in 2015 and some ET values were amended based on water consumption data from a limited number of NT remote communities, refer Ref (7).
Notes PWC – Remote Operations maintain an excel spreadsheet for each IES community which contains lot based water and sewer ET data. A copy of this sheet should be obtained before undertaking any flow estimation work. It is worth noting that these sheets are based on SLAP maps at a certain point of time, and may need upgrading. A. Method for estimating number of Water ET and Sewer ET units in a community
1. Download the community SLAP map and planning information. 2. Using the SLAP map, estimate number of lots in each category, and convert lots into ET
units using above table.
B. Data sources to estimate ET water demands and sewerage loads in remote NT communities 1. Community land use categories to be determined from Serviced Land Availability Program
(SLAP) maps available from the NTG Building Asset Management System (BAMS) website www.bams.nt.gov.au
2. Future community land use categories to be determined from Area Plans and Zoning Maps available on the NTG Department of Lands and Planning website www.lands.nt.gov.au
3. Community water consumption records to be sourced from PWC Remote Operations metering data.
Worked up example for ET determination is on the next page.
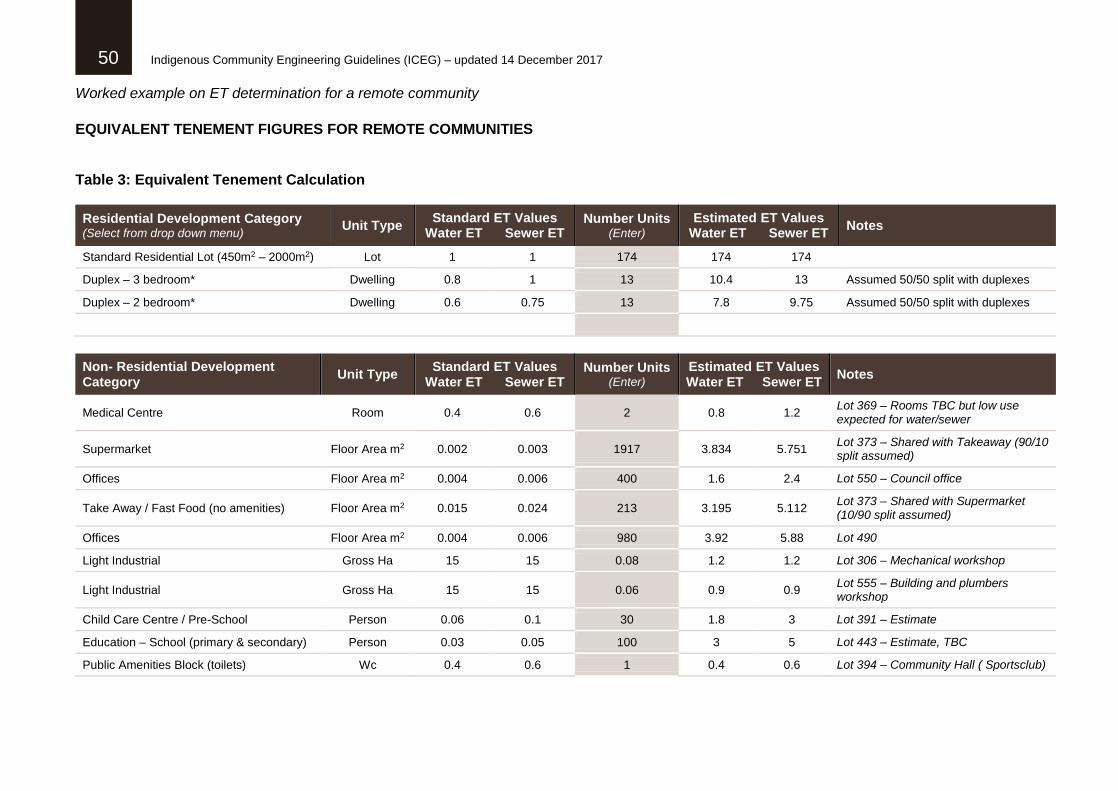
50 Indigenous Community Engineering Guidelines (ICEG) – updated 14 December 2017
Worked example on ET determination for a remote community
EQUIVALENT TENEMENT FIGURES FOR REMOTE COMMUNITIES Table 3: Equivalent Tenement Calculation
Residential Development Category (Select from drop down menu)
Unit Type Standard ET Values
Water ET Sewer ET Number Units
(Enter) Estimated ET Values
Water ET Sewer ET Notes
Standard Residential Lot (450m2 – 2000m2) Lot 1 1 174 174 174
Duplex – 3 bedroom* Dwelling 0.8 1 13 10.4 13 Assumed 50/50 split with duplexes
Duplex – 2 bedroom* Dwelling 0.6 0.75 13 7.8 9.75 Assumed 50/50 split with duplexes
Non- Residential Development Category
Unit Type Standard ET Values
Water ET Sewer ET Number Units
(Enter) Estimated ET Values Water ET Sewer ET
Notes
Medical Centre Room 0.4 0.6 2 0.8 1.2 Lot 369 – Rooms TBC but low use expected for water/sewer
Supermarket Floor Area m2 0.002 0.003 1917 3.834 5.751 Lot 373 – Shared with Takeaway (90/10 split assumed)
Offices Floor Area m2 0.004 0.006 400 1.6 2.4 Lot 550 – Council office
Take Away / Fast Food (no amenities) Floor Area m2 0.015 0.024 213 3.195 5.112 Lot 373 – Shared with Supermarket (10/90 split assumed)
Offices Floor Area m2 0.004 0.006 980 3.92 5.88 Lot 490
Light Industrial Gross Ha 15 15 0.08 1.2 1.2 Lot 306 – Mechanical workshop
Light Industrial Gross Ha 15 15 0.06 0.9 0.9 Lot 555 – Building and plumbers workshop
Child Care Centre / Pre-School Person 0.06 0.1 30 1.8 3 Lot 391 – Estimate
Education – School (primary & secondary) Person 0.03 0.05 100 3 5 Lot 443 – Estimate, TBC
Public Amenities Block (toilets) Wc 0.4 0.6 1 0.4 0.6 Lot 394 – Community Hall ( Sportsclub)
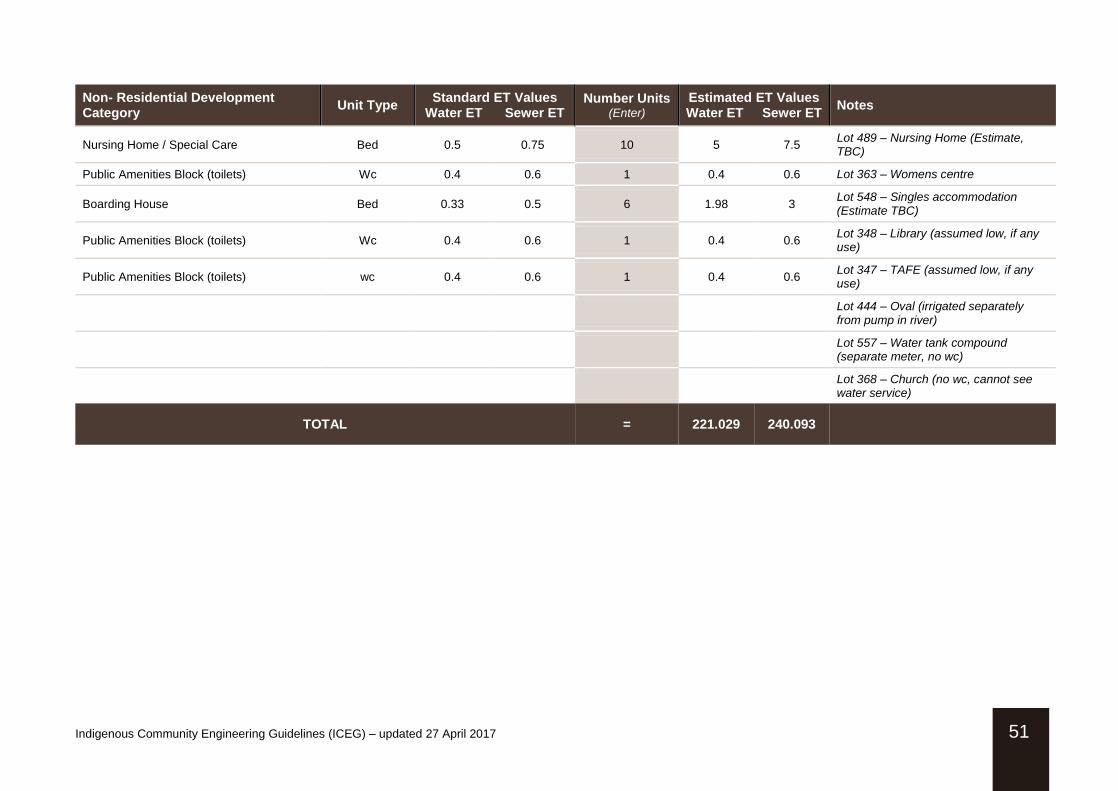
Indigenous Community Engineering Guidelines (ICEG) – updated 27 April 2017 51
Non- Residential Development Category
Unit Type Standard ET Values
Water ET Sewer ET Number Units
(Enter) Estimated ET Values Water ET Sewer ET
Notes
Nursing Home / Special Care Bed 0.5 0.75 10 5 7.5 Lot 489 – Nursing Home (Estimate, TBC)
Public Amenities Block (toilets) Wc 0.4 0.6 1 0.4 0.6 Lot 363 – Womens centre
Boarding House Bed 0.33 0.5 6 1.98 3 Lot 548 – Singles accommodation (Estimate TBC)
Public Amenities Block (toilets) Wc 0.4 0.6 1 0.4 0.6 Lot 348 – Library (assumed low, if any use)
Public Amenities Block (toilets) wc 0.4 0.6 1 0.4 0.6 Lot 347 – TAFE (assumed low, if any use)
Lot 444 – Oval (irrigated separately from pump in river)
Lot 557 – Water tank compound (separate meter, no wc)
Lot 368 – Church (no wc, cannot see water service)
TOTAL = 221.029 240.093
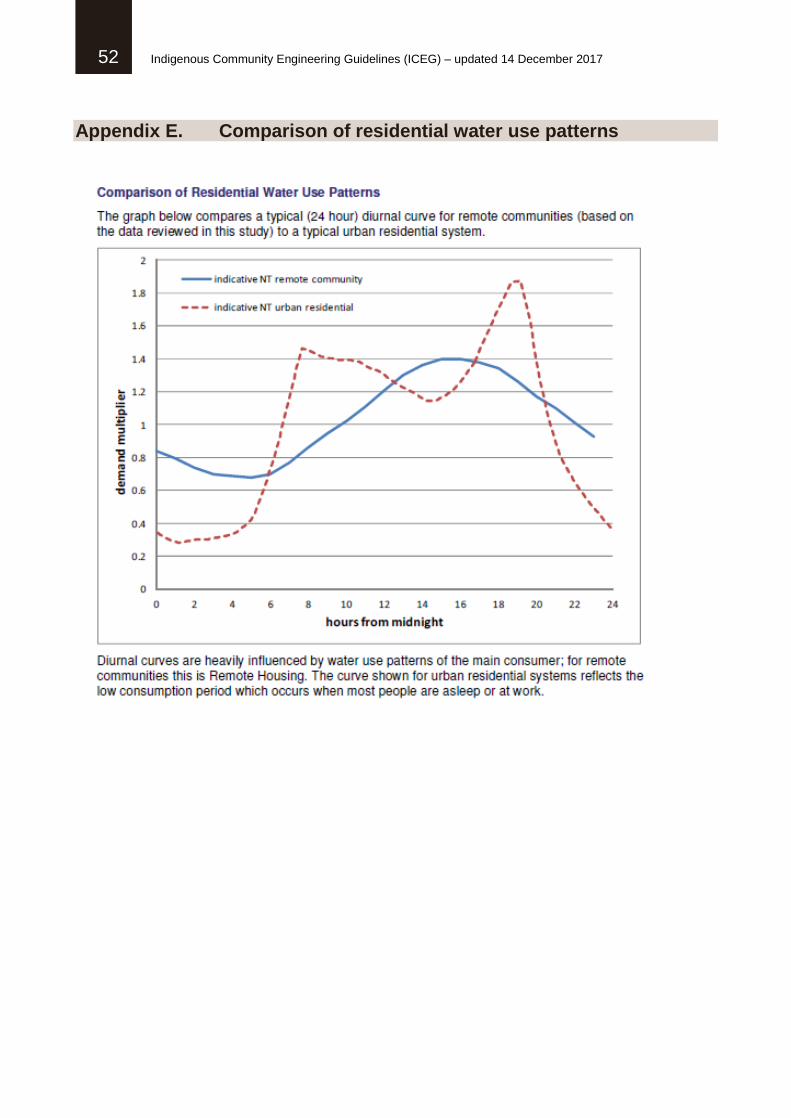
52 Indigenous Community Engineering Guidelines (ICEG) – updated 14 December 2017
Appendix E. Comparison of residential water use patterns

Indigenous Community Engineering Guidelines (ICEG) – updated 14 December 2017 53
Appendix F. Locations to be provided with fire hydrants
The below locations (remote communities) have or are expected to have responsive volunteer fire fighting units operating by 2020.
Notes:
i. These locations have been selected by NT Police Fire and Emergency Services in order of priority. Order of priority is subject to change.
ii. Other communities as a minimum is to be provided with a fast fill point, suitable for filling mobile fire appliances.
Community Current status
Wurrumiyanga Gazetted fire district
Yirrkala Gazetted fire district
Maningrida Not yet gazetted
Gapuwiyak Not yet gazetted
Gunbalanya Not yet gazetted
Galiwinku Not yet gazetted
Lajamanu Not yet gazetted
Kalkarindji Not yet gazetted
Hermannsburg Not yet gazetted
Yuendumu Not yet gazetted
Wadeye Not yet gazetted
Ngukurr Not yet gazetted
Angurugu Not yet gazetted
Milingimbi Not yet gazetted
Ramingining Not yet gazetted

54 Indigenous Community Engineering Guidelines (ICEG) – updated 14 December 2017
Appendix G. Design maximum flow and design minimum grade
Design maximum flows (litres/sec) for selected grade
Diameter 1.00% 0.80% 0.70% 0.60% 0.55% 0.50% 0.45% 0.40% 0.35% 0.33%
150 mm 15.5 13.8 12.9 12.0 11.5
225 mm 50.7 45.3 42.3 39.2 37.5 35.8 33.9 32.0 29.9 29.2
Design Minimum Grades
Description DN 150 DN 225 DN 300
Property connection sewers (from sewer main to boundary) 1%
End of line sewers – permanent upstream ends of sewer in residential areas
1%
Sewers 0.55% 0.33% 0.25%
Transition from 1% to 0.55% design minimum grade for a 150mm diameter sewer Up to 6 ET
After 6 ET
After 12 ET
After 24 ET
Comments
1% 0.7% 0.6% 0.55% Preferred minimum transition. Applies to sewers less than 2.5m deep.
1% 0.55% Minimum transition – applies in areas of sewer constraint, or reduces depth where excavation is difficult or greater than 2.5m.
Explanatory information WSAA does not prescribe the transition from 1% to 0.55% design minimum grade. However, this transition can have a significant cost impact on the small sewerage systems used in remote communities. The transition above was considered from three aspects; theoretical shear stress model (using 1.4 Pa and 1.6 Pa), guidelines from other Australian jurisdictions, and performance of flat graded sewers on NT remote communities; refer to (Ref 12) for more information. 6 ET refers to six 3 bedroom houses that would generate a similar regular daily peak flow. Having sewers less than 2.5 metres deep allows the use of local backhoe equipment. For self-cleansing reasons, sewers larger than the minimum 150mm sewer should only be used where required for hydraulic reasons. Additional information – House drains (this section is not linked to an ICEG guideline). Sanitary house drains are not part of IES assets but influence sewer design. AS3500 prescribes: Sanitary house drain diameter: 100mm Normal minimum grade: 1 in 60 Reduced minimum grade: 1 in 80; subject to achieving 18 fixture units (as per AS3500). While 3 bedroom houses on remote communities typically achieve the 18 fixture unit rating, for maintenance reasons only critical lots affecting the main sewer depth should be considered for the reduced minimum grade of 1 in 80 (1.25%).
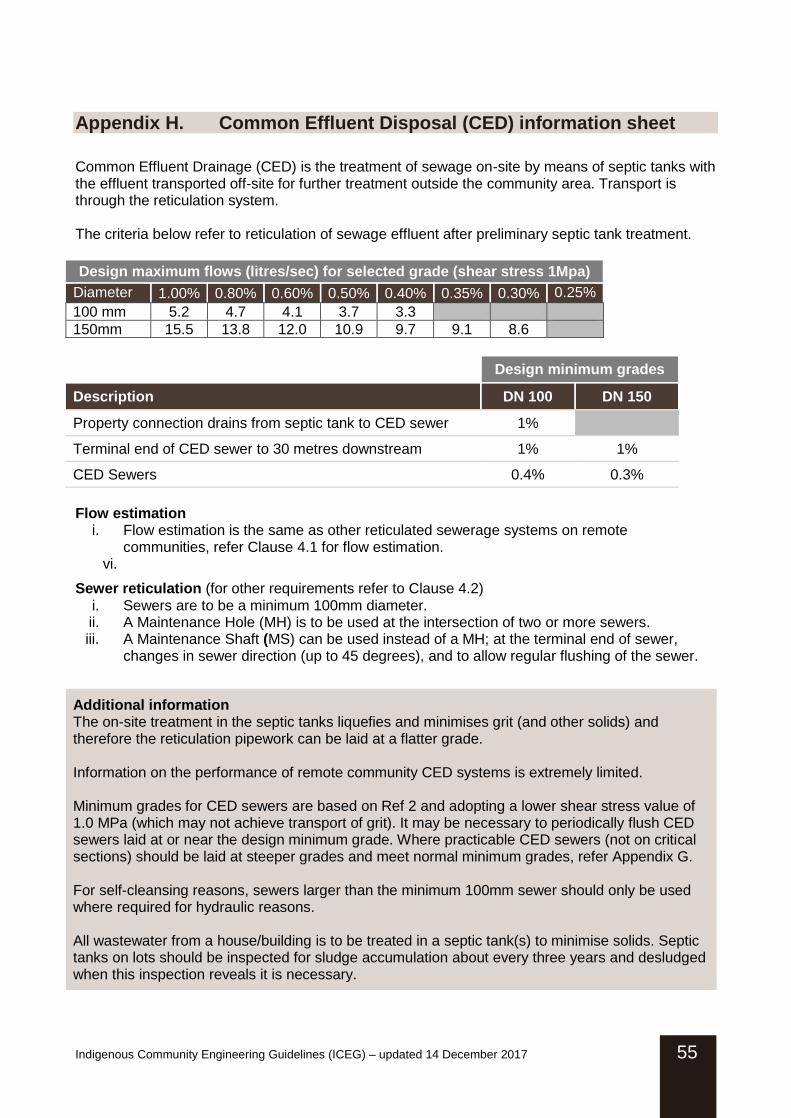
Indigenous Community Engineering Guidelines (ICEG) – updated 14 December 2017 55
Appendix H. Common Effluent Disposal (CED) information sheet
Common Effluent Drainage (CED) is the treatment of sewage on-site by means of septic tanks with the effluent transported off-site for further treatment outside the community area. Transport is through the reticulation system. The criteria below refer to reticulation of sewage effluent after preliminary septic tank treatment.
Design maximum flows (litres/sec) for selected grade (shear stress 1Mpa)
Diameter 1.00% 0.80% 0.60% 0.50% 0.40% 0.35% 0.30% 0.25%
100 mm 5.2 4.7 4.1 3.7 3.3
150mm 15.5 13.8 12.0 10.9 9.7 9.1 8.6
Design minimum grades
Description DN 100 DN 150
Property connection drains from septic tank to CED sewer 1%
Terminal end of CED sewer to 30 metres downstream 1% 1%
CED Sewers 0.4% 0.3%
Flow estimation
i. Flow estimation is the same as other reticulated sewerage systems on remote communities, refer Clause 4.1 for flow estimation.
vi.
Sewer reticulation (for other requirements refer to Clause 4.2) i. Sewers are to be a minimum 100mm diameter. ii. A Maintenance Hole (MH) is to be used at the intersection of two or more sewers. iii. A Maintenance Shaft (MS) can be used instead of a MH; at the terminal end of sewer,
changes in sewer direction (up to 45 degrees), and to allow regular flushing of the sewer.
Additional information The on-site treatment in the septic tanks liquefies and minimises grit (and other solids) and therefore the reticulation pipework can be laid at a flatter grade. Information on the performance of remote community CED systems is extremely limited. Minimum grades for CED sewers are based on Ref 2 and adopting a lower shear stress value of 1.0 MPa (which may not achieve transport of grit). It may be necessary to periodically flush CED sewers laid at or near the design minimum grade. Where practicable CED sewers (not on critical sections) should be laid at steeper grades and meet normal minimum grades, refer Appendix G. For self-cleansing reasons, sewers larger than the minimum 100mm sewer should only be used where required for hydraulic reasons. All wastewater from a house/building is to be treated in a septic tank(s) to minimise solids. Septic tanks on lots should be inspected for sludge accumulation about every three years and desludged when this inspection reveals it is necessary.

56 Indigenous Community Engineering Guidelines (ICEG) – updated 14 December 2017
Appendix I. Discharge environment and notional treatment levels
Explanatory information (links to section 4.3.1 explanatory information) Sewage treatment levels are affected by the discharge environment and when the discharge occurs.
NT DISCHARGE ENVIRONMENT NOTIONAL TREATMENT LEVEL*
COMMENTS
Water body Discharge period (outside lease)
Sea Dry season continuous M-H Depends on marine area, mixing zone and human access / use.
Wet season intermittent L Relates to large wet season storm events
Tidal, mangroves
Dry season continuous M-H Depends on discharge flow, mixing zone and human access / use.
Wet season intermittent L
Creek, river Dry season continuous M-H Depends on discharge flow, creek or river flow and human access / use.
Wet season intermittent L-M Depends on creek or river flow in wet season and human access / use.
Billabong, swamp
Dry season continuous H
Wet season intermittent M
Other areas (not a water body)
Bushland Dry season continuous M
Wet season intermittent L Relates to large wet season storm events
Dry creek bed
Dry season continuous M Depends on where the creek flows (when flowing) and human access / use.
Wet season intermittent L
Notional Treatment level (for ICEG assessment)
Key parameters assuming no public access to discharge area
H High Estimated BOD, plus actual BOD, SS, E. Coli if available
M Medium Estimated BOD, plus actual BOD, SS, E. Coli if available
L Low Dry season retention time
For no wet season discharge, the key parameter is dry season retention time.
Notes:
1. *Consideration must be given to the discharge location, proximity to ground water resources and potential impact on community use of the receiving environment and likely public health implications.
2. If available, Environmental Risk Assessments (ERA) should be used to classify the discharge environment and discharge period.
3. BOD can be estimated using the worked example in Ref 16.

Indigenous Community Engineering Guidelines (ICEG) – updated 14 December 2017 57
Appendix J. Bibliography
1. Review of Indigenous Community Guidelines for NT Remote Communities for Department
of Community Services – Version 2.1, Nov 2014, GHD Consultants.
2. Affordable Water Supply and Sewerage for Small Communities – Draft - Investigation, Design and Management Handbook, 1996. Urban Water Research Assoc of Australia (UWRAA) and Agriculture and Resource Management Council of Australia and New Zealand (ARMCANZ)
3. Australian Bureau of Statistics, customised report, 2014.
4. Environmental Health Standards for Remote Communities in the Northern Territory.
Northern Territory Government, 2001, http://www.health.nt.gov.au/Environmental_Health/Aboriginal_Environmental_Health/index.aspx
5. Planning Guidelines for Water Supply and Sewerage. Qld Department of Energy and Water
Supply. http://www.dews.qld.gov.au/__data/assets/pdf_file/0016/80053/water-sewerage-planning-guidelines.pdf
6. Water Demand Analysis for Territory Growth Towns 2002-2010, Dept of Housing, Local
Government and Regional Services, April 2011.
7. "Section 64 Determinations of Equivalent Tenement Guidelines" Water Directorate (NSW), 2009, plus Remote Community Water Reference Water Demand Data, Tonkin Consulting for NT Department of Local Government and Community Services, June 2015.
8. Remote Community Water Demand Monitoring. Tonkin Consulting for NT Department of
Community Services, Nov 2013.
9. Growth Town Fire Fighting Options, Cost/Benefit Study. GHD Consultants, 2011.
10. Australian Drinking Water Guidelines. National Health and Medical Research Council, 2011 (updated Dec 2014).
11. Sewer Flow Analysis for NT Remote Communities in the Top End 2011-13. NT Department
of Community Services – Tonkin Consulting, Sept 2013.
12. Review of sewer design for self-cleansing in NT remote communities, Tonkin Consulting for NT Department of Local Government and Community Services, September 2015.
13. Indigenous Community Engineering Guidelines, Power and Water Corporation, 2008.
14. Gravity Sewerage Code of Australia, Part 1 Planning and Design, Water Services
Association of Australia, WSA 02-2014-3.
15. Galiwinku Infrastructure Study – Treated Wastewater Quality Literature Review, Tonkin Consulting for NT Department of Housing and Community Services, May 2017.
16. Waste Stabilisation Pond Design Guidelines for Remote Communities, Power and Water
Corporation - Remote Operations, December 2017.

58 Indigenous Community Engineering Guidelines (ICEG) – updated 14 December 2017
17. Sewerage Treatment Pond Model Validation Study - Tonkin Consulting for NT Department
of Housing and Community Development, December 2017.
18. Domestic Wastewater Treatment in Developing Countries, Duncan Mara 2003.

Indigenous Community Engineering Guidelines (ICEG) – updated 14 December 2017 59
