indonesia coal industry update 2016
TRANSCRIPT
Indonesia Coal Industry Update 2016
JOGMEC Coal Investment SeminarTokyo, 27 January 2016

CONTENTS
Indonesia Coal Industry1
Coal as Key to Increase Electrification Ratio2
Future Energy Mix3

CONTENTS
Indonesia Coal Industry1
Coal as Key to Increase Electrification Ratio2
Future Energy Mix3

Coal Contribution to Indonesia Economy
Sources: Badan Pusat Statistik
Other then being the most economical source of energy for electricity, coal mining industry plays an important role in supporting Indonesia’s economy
65105
131160
195
254
333
398
462483 480
3.1%
4.3%4.4%
4.5%4.4%
4.9%
5.2%
5.4%
5.6%
5.3%
4.8%
2.0%
2.5%
3.0%
3.5%
4.0%
4.5%
5.0%
5.5%
6.0%
0
50
100
150
200
250
300
350
400
450
500
2004 2005 2006 2007 2008 2009 2010 2011 2012 2013 2014
Trillion Rp.
GDP from Non Oil & Gas Mining
PDB Tambang Non-Migas % dari Total PDB
2.74.3
6.1 6.7
10.5
13.8
18.5
27.2 26.224.5
20.8
3.8%
5.1%
6.0%5.8%
7.6%
11.9%11.7%
13.4%13.8%
13.4%
11.8%
0.0%
2.0%
4.0%
6.0%
8.0%
10.0%
12.0%
14.0%
16.0%
0
5
10
15
20
25
30
2004 2005 2006 2007 2008 2009 2010 2011 2012 2013 2014
Billion US$Coal Export
Export batubara (US$ Billion) % dari Total Ekspor

Historical Indonesian Coal Production 2009 – Oct 2015
Sources: Directorate General Mineral & Coal, MEMR
254 275
353
412
474 458
322.5
198210
287
345
402382
215
56 65 66 67 72 76 62
0.00
20.00
40.00
60.00
80.00
100.00
120.00
140.00
0
50
100
150
200
250
300
350
400
450
500
2009 2010 2011 2012 2013 2014 2015Production (Million Tons) as Per October 2015
Export (Million Tons) as Per October 2015
Domestic Sales (Million Tons) as Per October 2015
Average of Coal Price based on HBA USD/MT as Per December 2015

Estimated Domestic Coal Consumption - 2016
81%
2%
2% 12%
2% 1% 0%
2016 DMO Composition (%)
Coal fired power plant Metallurgy
Fertilizer Cement
Textile Paper
Briquette
Domestic Consumption (MT)
Coal fired power plant 82
Metallurgy 2
Fertilizer 2
Cement 12
Textile 2
Paper 1
Briquette 0
TOTAL 101
Sources: Directorate General Mineral & Coal, MEMR
Currently, Indonesia is still dependent on coal exports as domestic consumption can only absorb a small portion of total coal production.

Depressed Coal Price has affected CAPEX Coal Mining
Company
*source: Bloomberg, internal analysis
Companies included: ABMM, ADRO, ARII, BORN, BRAU, BSSR, BUMI, BYAN, GEMS, GTBO, HRUM, INDY, ITMG, KKGI, MBAP, PTBA, TKGA, TOBA
• CAPEX of publicly listed coal mining company has been down significantly by 80% since 2012 as a result of significant lower coal price
• Most of the Companies cutting back on expansion and exploration. Low investment made will result no new reserves identified over last three years
• Total accumulated CAPEX for the last 5 years reach US$5.6 bn
0
0.5
1
1.5
2
2.5
2011 2012 2013 2014 Ann. 2015
in billion USD
CAPEX Coal Mining Listed Co –Last 5 Years
1.931.83
0.93
0.52
0.40
Total
CAPEX:
US$5.6 bln
20
40
60
80
100
120
140
01 J
an 2
011
01 A
pr
2011
01 J
ul 2011
01 O
ct 2011
01 J
an 2
012
01 A
pr
2012
01 J
ul 2012
01 O
ct 2012
01 J
an 2
013
01 A
pr
2013
01 J
ul 2013
01 O
ct 2013
01 J
an 2
014
01 A
pr
2014
01 J
ul 2014
01 O
ct 2014
01 J
an 2
015
01 A
pr
2015
01 J
ul 2015
01 O
ct 2015
NEWC Evolution 2011 – Jan 2016 (6,322 GAR)
Jan 2011
US$130/ton
Jan 2016
US$49/ton
• Global Coal Index NEWC declined by 62% fromthe highest level US$130/ton in January 2011 toUS$49/ton di January 2016

APBI-ICMA INTERNAL SURVEY
*Survey result as of May 6th, 2015
43%
18%
39%
Coal Price Forecast
Decrease
Increase
Flat
10%
69%
21%
CapEx Policy
Increase
Decrease
Flat
29%
26%
45%
Production Volume Policy
Increase
Decrease
Flat51%
24%
24%
Employee Rationalization
Not rationalizing
<10%
>10%

CHALLENGES: GOVERNMENT POLICIES
1. Significant rate increase
2. Upfront payment upon permit approval instead of upon usage
1. Additional costs during distressed coal market condition
2. Potential cash flow management disruption
3. Creating confusion due to lack of technical guidelines
1. Additional costs related to logistics and infrastructure use
2. Ports designation may not be transparent
1. Increasing unemployment because of mine closures
2. Not necessarily increasing government revenue
3. Potential disruption in government’s 35 GW plan
Letter of Credit requirement for export activities
Non-tax state revenue from land use of forest areas
Plan of limiting coal shipment from 14 designated ports
Royalty increase plan
1. Supplies and contractor rates are already in US$
2. Potential hedging costs
Requirement of Rupiah as the only currency for domestic transactions
CONTENTS
Indonesia Coal Industry1
Coal as Key to Increase Indonesia Electrification Ratio2
Future Energy Mix3

6.0% 4.6% 6.2% 6.5% 6.3% 5.7% 5.1%
129.0 134.2147.3
158.0174.0
187.5197.3
0
50
100
150
200
250
0.0%
1.0%
2.0%
3.0%
4.0%
5.0%
6.0%
7.0%
2008 2009 2010 2011 2012 2013* 2014**
TW
hGDP Growth (%) Electricity Sales (TWh)
Economic growth needs to be supported by sufficient Electrification Ratio (ER)
Installed Capacity in Indonesia is always below the energy demand
Current Economic and Electricity Condition
Indonesia Economic & Electricity Growth
Sources: PLN, IEA World Energy Outlook 2014 (for ER), Badan Pusat Statistik, RUPTL 2015, MEMR Presentation Sept 2014**Estimated by PLN & BPS
CAGR 7.3%
0
200
400
600
800
1,000
1,200
0
50
100
150
200
250
300
20
12
20
13
20
14
20
15
20
16
20
17
20
18
20
19
20
20
20
21
20
22
20
23
20
24
20
25
20
26
20
27
20
28
20
29
20
30
20
31
Existing Capacity (GW) Additional Power Needs (GW)
Peak Load (GW) Electricity Needs (TWh)
GW TWh
Installed Capacity vs Electricity Needs

Indonesia Electricity Overview
22 GW
13 GW
4 GW
3 GW
1 GW
- 5 10 15 20 25
Coal-fired
Gas-fired
Hydro
Diesel
Others
Installed Capacity* 43 GW
Coal and gas are the largest sources of energy for electricity generation with highest total
installed capacity and at the most economical price
Power plant investments must be focused towards developing Coal-fired and Gas-fired Power Plants
Sources: RUPTL 2015-2024, Buku Statistik PLN 2014
Coal is still the cheapest and most abundant energy source for power
generation
* Per December 2014, excluding rental from 3rd party sources ~4 GW
Energy Source Costs (per KWh)
0
0.05
0.1
0.15
0.2
0.25
0.3
0
500
1,000
1,500
2,000
2,500
3,000
3,500
Cost (Rp/KWh) Cost (US$/KWh)*
* Exchange rate Rp 13,500/USD

3841
4548
5155
6064
0
10
20
30
40
50
60
70
2015 2016 2017 2018 2019 2020 2021 2022
in G
W
Peak Load (in GW)
Sources: PLN Investor Presentation May 2015, RUPTL 2015-2024, MEMR, World Bank
Projected Growth in Peak LoadTarget 2019: >95%
Growing Power Demand
ASEAN Electrification Ratio Comparable
As government pushes for infrastructure & industrial development, low electricity
consumption and installed capacity levels create significant increase in electricity demand
Government aims to achieve >95% electrification rate by 2019, hence PLN Programs such as Fast Track and IPP are enforced to attract Private Sector to enter into Electricity Sector

Power Generation Overview
2639
57 60 6
8
3344
2010 2014 2019 2024
PLN IPP
Indonesia projected additional 50-60 GW until 2024 to achieve electrification ratio of >95%
To accelerate the needs of Electricity, Government of Indonesia initiated 35 GW
Program from 2015-2019 and to follow up on several delayed projects from FTP 1 & 2 to
increase Electrification Ratio to >95%
PLN IPP
Size: 25 GWTransmission: 360 kms
Size: 18 GWTransmission: 50k kmsSubstation: 743 loc.
32 GW
47 GW
90 GW
104 GW
Projected Installed Capacity
Sources: PLN Investor Presentation 2015, RUPTL 2015-2024

GOVERNMENT 35 GW PROGRAM
*source: Internal calculations; RUPTL 2015-2024
35 GW Power Project
Coal Fired Power Plant
Gas & Steam Power Others
~20 GW ~12GW ~3GW
PLN
2 GW
IPP
18 GW
Project CostsUS$28 – 35 bln
57% 34% 9%
DEBT (Proj. Financing)
US$20 – 25 bln
EQUITYUS$8 – 11 bln
Sources: RUPTL 2015-2024, APBI CEO Gathering
Administration under President Jokowi has committed to add 35 GW power to existing installed capacity of 47 GW (until Dec 2014)
55-60% of total 35 GW power projects will come from coal-fired power plants and require significant participation from private (IPP)
Total project cost to be borne by private sector / IPP : US$ 28 – 35 bln

Total IPP Projects
TenderedIPP Projects
Soon to be Tendered
IPP Projects
Existing IPP Projects*
35.59 GW
Capacity Project CostMax
Potential Revenue p.a.
Max EBITDA p.a.**
16.92 GW
11.04 GW
7.63 GW
US$ 68.5 Bn
US$ 31.1 Bn
US$ 19.3 Bn
US$ 18.1 Bn
US$ 18.3 Bn US$ 8.2-9.2 Bn
US$ 8.1 bn US$ 3.6-4.1 Bn
US$ 5.5 Bn US$ 2.5-2.7 Bn
US$ 4.7 Bn US$ 2.1-2.4 Bn
*Per Dec 2014, using the same assumptions as new IPP Projects** EBITDA = 45-50% of Revenues
IPP market of 36 GW is projected to be approximately US$ 70 billion market opportunity Out of 70 GW, ~60% will come from coal-based Wide-open opportunities to becoming main player in non-coal energy segment
Sources: RUPTL 2015-2024, PLN Market Sounding 2015, US EIA Report 2013, internal data analysis, APLSI
35 GW Program Open Participation of Private
Sector

35 GW Electricity Program and Industrial Development
Will Increase Electricity Demand dan Domestic Coal
Consumption
• As the government pushes infrastructure and industrial development, the demand for electricity will increase and subsequently domestic coal consumption for electricity generation will increase.
• Assuming 5%-6% economic growth in 2015-2017, and 7% onward, coal consumption for electricity will increase by 10% CAGR in 2015-2024.
56 65 66 67 72 76 87 101 118 133 178
198215
287345
402 382295 248 214 199
154
254280
353
412
474458
382 349
332 332 332
0
50
100
150
200
250
300
350
400
450
500
2009 2010 2011 2012 2013 2014 2015 2016E 2017E 2018E 2019E
Export (MT) Domestic (MT) Production (MT)
APBI’s Forecasts
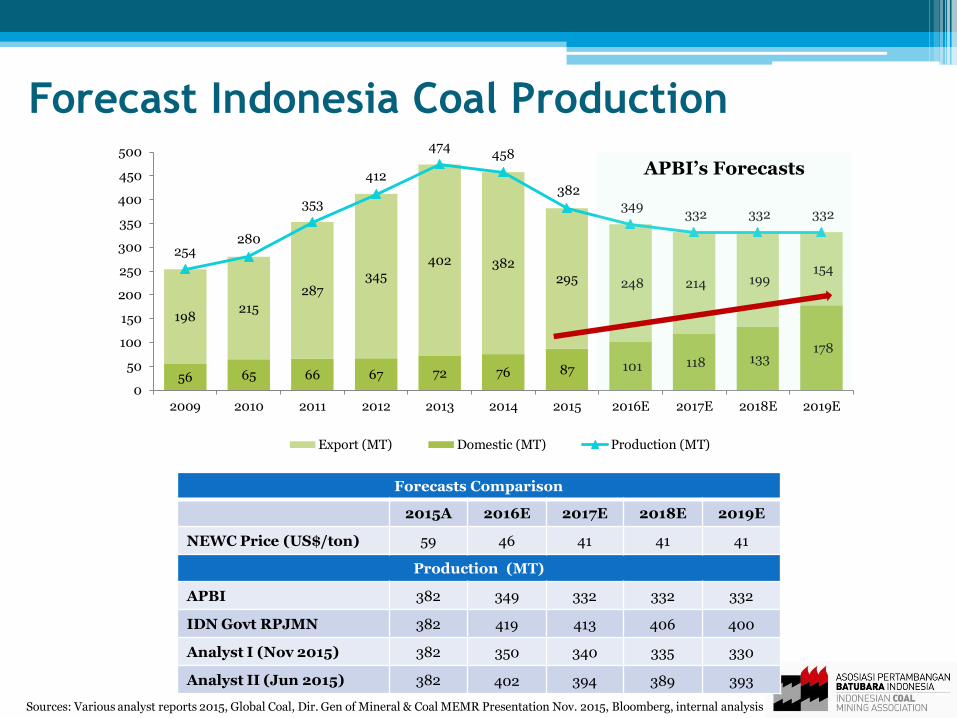
Forecast Indonesia Coal Production
Sources: Various analyst reports 2015, Global Coal, Dir. Gen of Mineral & Coal MEMR Presentation Nov. 2015, Bloomberg, internal analysis
Forecasts Comparison
2015A 2016E 2017E 2018E 2019E
NEWC Price (US$/ton) 59 46 41 41 41
Production (MT)
APBI 382 349 332 332 332
IDN Govt RPJMN 382 419 413 406 400
Analyst I (Nov 2015) 382 350 340 335 330
Analyst II (Jun 2015) 382 402 394 389 393

Coal Requirements post Realization of 35 GW
Existing Coal Fired
PP (30 Sept 2014)
Estimated Under 35
GW
Total
22 MW
20 MW
42 MW
CapacityCoal
Cons p.a
76 mln
~75 mln
~150 mln
Coal TypeReserves
(billion ton)
Low 9.5
Medium 20.1
High 1.8
Total 31.4
1 Jan 2013 Now
NEWC
PriceUS$ 94/MT US$ 52/MT
Reserve 31 bln MT-25 ~ 30
%
As of 1 January 2013
Coal Requirement – Next 5 years Coal Reserves
Domestic
Export 300 – 350 mln ton
Total 456 – 506 mln ton
WITH COAL PRICE KEEP GOING DOWN, THE AMOUNT OF RESERVE WE HAVE IS GETTING SMALLER.
Sources: Bloomberg, APBI internal calculation, Handbook of Energy and statistics of Indonesia 2014

CONTENTS
Indonesia Coal Industry1
Coal as Key to Increase Electrification Ratio2
Future Energy Mix3

Coal61%
Gas16%
New and Renewable
Energy22%
2025
ENERGY MIX LANDSCAPE
Sources: PLN Investor Presentation, May 2015; Indonesia’s National Energy Council’s Energy Outlook 2014; RUPTL 2015-2024
Coal50%
Gas27%
Hydro8%
Geothermal3%
Oil12%
2014
Coal66%
Gas 18%
New and Renewable
Energy16%
2050Government Initial Energy Mix Target
• By 2025, Indonesia plans to no longer use oil as power generation source and convert to other renewable energy sources
• Renewable energy such as solar and hydro power technology is rapidly developing, resulting in falling cost curves and more competitive investment costs
• Renewables as energy source were initially planned to rise from ~11% in 2014 to ~ 22% in 2025

CONCLUSION
Continued decreasing coal demand from China still causes market oversupply and therefore, further weakens coal prices, which affects production outputs of Indonesian miners
From 2014 to 2015, domestic coal demands increased 14% y-o-y from 76 MT to 87 MT and is expected to continue to increase. Though currently, Indonesia still needs to rely on exports as domestic usage of coal only absorbs a small portion of total Indonesia production
The 35 GW Program provides investment opportunities and is expected to revive the coal industry through their high installed capacity projections of coal fired power plants. In 2019, Indonesian domestic consumption of coal is expected to more than double 2015 consumption and overpass exports
In addition to utilizing the country’s cheapest energy source (coal), the government also increases opportunities towards growing renewable energy portion for power generation sources
