indonesia java-bali transmission line/substation ... indonesia java-bali transmission...
TRANSCRIPT
1
Indonesia
Java-Bali Transmission Line/Substation Development Project (East Java) (I & II) Report Date: January 2003
Field Survey: November 2002
1. Project Profile and Japan’s ODA Loan
Project site Substation installed via the project
1.1 Background The province of East Java is one of Indonesia’s centers of commerce and industry, both mining and
manufacturing, and is home to the country’s second largest city of Surabaya. During the 1990s, East Java’s
population accounted for approximately 20% of the nation’s total and the province was responsible for
around 20% of total regional production. The decade also saw development of the region’s manufacturing
and mining industries. In preparation for predicted increases in economic activity during the 1990s,
Indonesia’s electric energy authority (P.T. PLN) was calculating on average annual increases of 18.5% in
power demand in East Java during 1991-98.
In order to meet this growth in demand plans were laid to develop generation facilities and the
transmission and distribution grid within the region, which called for an additional 6,078MW of generating
capacity and 4,250MVA of medium voltage transformer capacity by the end of the Sixth Five-year
Development Plan (1998). The current project was allied to the “East Java Electric Power Transmission and
Distribution Network Project”, which commenced in 1971 under funding from ODA loan, and targeted the
expansion and improvement of transmission and transformer facilities within the region.
1.2 Objectives Phase I: To improve the reliability of power supplies by meeting increases in demand from regions
already linked to the grid, supplying power to new customers and enhancing the reliability of the
transmission system. Phase II: To improve the stability and reliability of power supplies in East Java via a combination of

2
investment in the region’s two large-scale power stations, Gresik combined cycle power plant and Paiton
thermal power plant, and improvement/expansion of secondary power distribution system facilities.
1.3 Project Scope The outline of the initial plans for the project was as follows:
Phase I: 1) Expansion of existing substations
Transformers: 70/20kV × 7 sites = total capacity of 150MVA 150/20kV × 16 sites = total capacity of 820MVA 2) Consulting services
Phase II: 1) Expansion of existing substations
a) Transformers: 150/20kV × 10 sites (10 transformers) = total capacity of 410MVA b) Construction of transmission line outlet (1 site)
2) Construction of substations: 150/20kV × 3 sites (4 transformers) = total capacity of 150MVA 3) Construction of transmission lines: 150kV-2CCT × 3 lines = total length of 25 km 4) Consulting services
1.4. Borrower/Executing Agency Government of the Republic of Indonesia/P.T. PLN
1.5 Outline of Loan Agreement Loan Amount / Loan Disbursed Amount Phase I: 7,671 million yen / 3,223 million yen
Phase II: 6,862 million yen / 3,236 million yen Exchange of Notes / Loan Agreement Phase I: September 1991 / September 1991
Phase II: September 1992 / October 1992 Terms and Conditions -Interest Rate
-Repayment Period (Grace Period) -Procurement
2.6%
30 years(10 years)
General untied (Consultant service is procured as partially untied
aid) Final Disbursement Date Phase I: October 1997
Phase II: February 2001
2. Results and Evaluation
2.1 Relevance The National Fifth Five-year Development Plan (1989-93: REPELITA V) outlined the following goals
for the power sector: 1) Guarantee supply capacity in line with increases in power demand, primarily in industrial

3
sectors, as a means of sustaining economic development. 2) Boost development of power resources in line with non-oil policies. 3) Build up the foundations of regional development by promoting rural electrification. 4) Improve the reliability of power supplies by developing the transmission and distribution grid. 5) Effectuate cost reductions via decreases in transmission and distribution loss, improvements in
thermal heating efficiency and the power load ratio and efficient management of demand and supply.
The current project involved the development of the power transmission grid in East Java with a focus
on metropolitan Surabaya, with the aim of meeting forecast annual increases in demand for power of
around 18.5% and improving the stability and reliability of power supplies in the region. At the time of
project appraisal, plans to develop an industrial park on reclaimed land were stimulating active investment
in industry within Surabaya and the province, however the majority of substations were either overloaded
or forecast to become overloaded within the near future.
The PLN plan to develop additional supply capacity envisaged the installation of an additional
6,078MW in East Java by 1998 and included plans for new capacity installation at the Gresik combined
cycle power plant (526MW × 3) and the Paiton thermal power plant (400MW × 2) at an early date. There
was thus a need to develop the entire Java transmission and distribution grid, inclusive of East Java, in
order to link the newly generated reserve margin with demand.
As stated above, the objectives of this project were consistent with the direction of the five-year
development plan that was current at appraisal. Moreover, when this evaluation was conducted, population
density in the province and the city of Surabaya continued to be high as compared to the rest of the country,
and the region remains a center for the commercial, mining and manufacturing industries. The impact of
the currency crisis and PLN’s phased increases in electricity tariffs have served to depress growth in
consumption when contrasted with that at appraisal, nevertheless, annual growth of around 7.5% has been
recorded in recent years.
There are indications that supply capacity and the transmission and distribution network remain
deficient, and discussions are focused on the potential for an energy crisis within the Java-Bali system,
which includes the East Java region1. Enhancing the stability and reliability of supplies continues to be an
issue that requires resolution, particularly given the need to develop and sustain robust industrial activity,
and in this respect, the objectives of this project are considered to have retained their relevancy. Although
some delays occurred in the start of on-grid generation at both Gresik and Paiton, the two plants are
essentially operating as planned at the present time.
2.2 Efficiency
2.2.1 Project Scope According to the Project Completion Report (PCR) submitted by the executing agency the only
4
modification or revision made to initial plans concerned the positioning of the transformers. A number of
substations that were initially targeted for capacity expansion/extension were dropped and the supplied
transformers installed at other substations within the East Java province. At the start of the project a
comparative study was made of predicted demand and existing capacity for each of the substations. This
study yielded data on the number and capacity of transformers required at specific substations, which was
used to modify the initial plans on transformer positioning.
The demand forecasts for individual substations were based on past demand increase ratios as well as
the current demand-supply gap and prospects for new large-scale demand from industrial parks, etc.
According to the Distribution and Load Control Center for Java-Bali (P3B), the PLN unit responsible for
transmission and transformer facilities, the revisions to initial plans were based on the need to prioritize
certain substations requiring urgent capacity additions as identified from demand prediction results.
2.2.2 Implementation Schedule The implementation schedules for Phases I and II of the project were subject to delays totaling
approximately 15 months. According to the PCR, these delays were generated by the additional time
required to negotiate and conclude the contract with the supplier (contractor). In order to minimize the
impact of these delays on demand-supply conditions, the executing agency instructed the scheduled
contractor to initiate preparation of the construction sites and arrangements to procure supplies in tandem
with contract negotiations. In consequence of which the delays to the implementation schedule were
confined to the delays in the contract negotiation process.
2.2.3 Project Cost A cost underrun was reported for both Phase I and Phase II (yen-based). This is attributed to reductions
in the amount of ODA loan funding required for items procured in both foreign and local currency resulting
from international competitive bidding for transformer equipment, which accounted for the bulk of project
costs, and the substantial devaluation of the Indonesian rupiah.
2.3 Effectiveness (1) Project contributions to increased substation capacity
Table 1 indicates the extent to which the expansions to substation facilities implemented via this project
bolstered total medium voltage transformer capacity. As of 2001, medium voltage transformer capacity was
9,100MVA, with project facilities accounting for approximately 16% of cumulative capacity. Moreover,
whilst the addition of 4,250MVA of medium voltage transformer capacity was scheduled during the sixth
National Five-year Development Plan (1994-98), capacity was in fact increased by 4,871MVA. The
additional capacity secured via this project accounts for approximately 30% of medium voltage transformer
capacity expansions effectuated within the region during the implementation period.
1 Source: PLN white paper, “Immediate and Critical Issues for Decision”, October 2000.

5
Table 1: Fluctuations in cumulative transformer capacity in the target region (Unit: MVA)
1991 1993 1998 1999 2000 2001 500 / 150 kV (high voltage: excluded) 0 2,000 3,000 3,000 3,000 3,000 150 / 20 kV 1,398 2,408 6,264 6,279 6,484 6,176 70 / 20 kV 901 1,015 1,555 1,635 1,556 1,581 Other 150/70kV, etc. 544 829 1,304 1,354 1,304 1,344 Total for East Java (medium voltage) 2,843 4,252 9,123 9,268 9,344 9,101 Project capacity additions 1,470 (equivalent to 16.2% as of 2001)
Source: PLN Unit Business P3B
(2) Transmissions from project transformers Transitions in the volume of power supplied from medium voltage substations (all medium voltage
transformers) in East Java to the region’s transmission grid are shown in Table 2. According to the
executing agency, transmissions from almost all substations are on the increase. As Table 3 indicates,
roughly 21% of generated power is transmitted from transformers covered by the project.
Table 2: Transitions in transmission volumes from all substations in the target region (Unit: GWh)
1993 1997 1998 1999 2000 2001 Transmissions from all East Java substations 7,601 11,656 11,775 13,047 14,395 15,611
Source: PLN Unit Business P3B
Table 3: Contribution to total of transmissions from project transformers (January & October 2001)
Transmissions from project transformers
Transmissions from all transformers in the target region Degree of contribution
January 2002 (MWh) 321,104 1,499,402 21.4% October 2002 (MWh) 338,355 1,588,172 21.3%
Source: PLN Unit Business P3B
All transformers installed via this project are operational, which, given that project equipment accounts
for approximately 20% (40/197) of all currently operational medium voltage transformers in the region,
provides evidence that operating conditions are appropriate.
(3) Meeting demand for power in the target region As shown in the following table, customer numbers and contract demand (MVA) in East Java have been
on the increase during the past ten years. Industrial demand, which was most severely affected by the
currency crisis, dropped in terms of both customer numbers and contract demand in 1998, however, general
residential and commercial demand have posted remarkable increases, and total contract demand has been
increasing continuously.

6
Table 4: Transitions in customer numbers and contract demand in the target region (Unit: MVA/customer)
1991 1996 1997 1998 1999 2000 2001 Residential 1,167 2,324 2,642 2,918 3,127 3,443 3,710 (customer numbers) 2,064,714 4,002,311 4,506,729 4,935,027 5,090,348 5,236,232 5,391,876 Commercial 227 449 534 574 644 704 774 (customer numbers) 52,921 83,498 97,539 106,083 162,368 192,092 241,759 Industrial 1,310 2,131 2,381 2,165 2,254 2,321 2,395 (customer numbers) 5,962 8,742 9,860 9,321 9,325 9,794 10,181 Public and other 181 258 282 302 317 335 352 (customer numbers) 51,437 103,346 117,637 128,521 133,836 138,782 144,565
Total MVA 2,885 5,162 5,839 5,959 6,342 6,803 7,231 Source: PLN Unit Business Distribusi Jawa Timur
In response to this growth in contract demand, the executing agency has been expanding transformer
facilities to effectuate improvements on its medium voltage transformer capacity (Table 1) well in excess of
annual cumulative total contract demand. As of 2001, it was providing medium voltage transmissions of
9,100MVA against total contract demand of 7,231MVA. The expansions to transformer facilities covered
by this project were thus crucial in this respect also.
The outcome has been annual growth in electricity consumption exceeding 10% and an increase in peak
demand in the region of 7-8% during the past ten years (Table 5). Consumption growth came to a brief
standstill after the currency crisis of 1997, but has been posting rapid increases in recent years. The
expansions to transformer facilities effectuated via this project (accounting for some 30% of additions to
medium voltage capacity in East Java during implementation) have increased the capacity and volume of
transmissions to customers connected to the grid, and have made certain, limited contributions to
supporting increases in demand.
Table 5: Transitions in power consumption by customer and peak demand on the system in the target region (Unit: GWh/MW)
1991 1996 1997 1998 1999 2000 2001 Annual
growth rate pre 1998
Annual growth rate post 1998
Residential 1,536 2,948 3,370 3,778 4,182 4,829 5,280 14.0% 11.9% Commercial 266 583 641 779 854 1,097 1,178 16.0% 16.8% Industrial 3,721 5,497 5,992 5,517 6,292 6,629 6,844 8.3% 3.9% Public and other 280 435 459 507 521 579 640 8.7% 8.8%
Total 5,803 9,462 10,462 10,581 11,849 13,135 13,942 10.4% 7.5%
Average demand 1,103 1,818 2,092 2,273 2,231 - 2,481 10.9% 3.1% Peak demand - 2,162 2,359 2,482 2,794 2,942 3,129 7.2% 8.1%
Source: PLN Unit Business Distribusi Jawa Timur
However, it is necessary to heed the fact that peak demand, predicted at appraisal (1998) to increase to
3,628MW, has in fact leveled off at 3,129MW (2001). There has been some deviation in growth rates for
peak demand, which was forecast to increase by around 18.5% per year but is only actually increasing in
the region of 10% a year. Despite the absence of any notable problems with the total installed capacity of
the medium voltage transformer facilities covered by the project (there are some substations that are forced
to operate in overload), the executing agency has acknowledged that this deviation was the result of

7
problems with the accuracy of its predictions per se, and because insufficient expansions were made to the
transformer capacity of high and low voltage facilities (500/150kV transformer equipment and distribution-
use transformer equipment not covered by the project). In consequence, overload operation of grid facilities
has resulted in service interruptions, industrial consumers choosing to operate privately owned generators,
and the continued existence of customers who have applied for but have yet to be connected.
(4) Transitions in the demand-supply gap
The expansions to the medium voltage transformer facilities covered by this project have not, per se,
had a direct link with a reduction in the demand-supply gap, aside from demand from certain industrial
consumers receiving power of medium and higher voltage. Combined with expansions to the distribution
grid, they have indirectly contributed to eliminating the demand-supply gap.
Table 6: Transitions in the demand-supply gap
1989 2000 2001 Residential (MVA) 21 46 69 No. of applicants awaiting connection n.a 79,369 127,324 Commercial (MVA) 13 3 4 No. of applicants awaiting connection n.a 1,102 3,655 Industrial (MVA) 65 6 48 No. of applicants awaiting connection n.a 87 165 Public and other (MVA) 8 5 3 No. of applicants awaiting connection n.a 767 911 Total (MVA) 107 60 124
Source: Audit data, PLN Unit Business Distribusi Jawa Timur
According to figures for recent years, the demand-supply gap is on the increase. This is considered to
be due to a renewed surge in demand for power in East Java, a region where latent demand for power was
high to begin with, and where the economy is now on course for recovery after the currency crisis. Under
such circumstances, installed capacity, primarily of transmission and distribution facilities handling high
and low voltage power, is proving unable to keep pace with demand, and capacity expansions have
virtually ground to a halt due to critical financial conditions at PLN in the wake of the currency crisis.
Even at the medium voltage level, there is a need to beef up transformer capacity at certain overloaded
substations. Although the executing agency is monitoring the demand-supply balance at all substations,
current circumstances preclude facilities investment forcing it to focus its response on the repositioning of
existing transformers and leaving it incapable of sufficiently meeting new applications for supply.
Current PLN head office policy is to prioritize new off-peak customers (primarily commercial and
industrial demand for daytime use). This “selective new connection” policy may in fact be termed a
demand control policy and will not ultimately facilitate the process of supplying power to all potential
customers.
(5) Easing of the transformer capacity operating ratios
Easing the capacity operating ratios of transformers has become an issue for the entire Java-Bali grid
system. The same is true for the East Java region, where data for October (2002), a season marked by a
surge in power demand as industrial production activities intensify in the run up to the Islamic New Year

8
when consumption flourishes, reveal high capacity operating ratios for approximately 83% of high voltage
transformers (500/150kV: not covered) (Table 7).
Table 7: Number of medium/high voltage transformers working at different peak capacity operating ratios (Oct. 2002)
500/150 kV 150/20 kV 70/20 kV Capacity operating ratio
(%) No. of units
(ratio) MVA No. of units (ratio) MVA No. of units
(ratio) MVA
91 ~ 100 3 (50.0%) 1,500 3 ( 2.1%) 65 5 ( 9.6%) 60 81 ~ 90 2 (33.3%) 1,000 11 ( 7.6%) 350 9 (17.3%) 210 71 ~ 80 - - 14 ( 9.7%) 520 7 (13.5%) 150 51 ~ 70 1 (17.7%) 500 67 (46.2%) 2,340 20 (38.5%) 372 31 ~ 50 - - 35 (24.1%) 1,521 5 ( 9.6%) 130 0 ~ 30 - - 15 (10.3%) 740 6 (11.5%) 65 Total 6 (100.0%) 3,000 145 (100.0%) 5,536 52 (100.0%) 987
Source: PLN Unit Business P3B
However, approximately 14% of the medium voltage transformers covered by the project record peak
capacity operating ratios of 80% or more, with the majority being operated without constraint within a 31%
- 70% range even at peak capacity operating ratios. The additional medium voltage transformers provided
via this project are evaluated as having distributed and eased the load on existing facilities and of making it
easier to operate substations without overburdening the equipment.
As indicated in Table 8, the average peak capacity operating ratio for all medium voltage substations for
the month of October, when power demand is comparatively high, had decreased from their level at
appraisal in 1991 (59.2%) to around 57% in fiscal 2002. The percentage of transformers recording peak
period capacity operating ratios in excess of 80% has also dropped from 17.8% in 1991 to 14.2% in
October 2002.
Table 8: Average capacity operating ratio (COR) for all medium voltage transformers & percentage recording peak operating ratios in excess of 80%
1991 2001 May
2002 May
2002 October
a) Total number of medium voltage transformers (in operation) 81 197 196 197
b) Average peak period COR for all transformers 59.2%*1 55.3% 50.2% 56.8% c) Percentage recording peak period COR of 80%+ 17.8%*1 13.7% 2.0% 14.2% d) Number of project transformers - 40 40 40 e) Average peak period COR for project transformers - 56.4% 55.1% 60.1%
Source: Audit data, PLN Unit Business P3B Note: Data are for 150/20kV and 70/20kV medium voltage transformers only. Note 1: Value for each substation.
When only project transformers are considered, the same figure increases slightly to around 60%. This
is thought to be because consideration was given to urgency when positioning project transformers, thus the
equipment was installed in regions predicted to see considerable growth in latent demand.

9
(6) Decreases in the frequency/duration of service interruptions
SAIFI and SAIDI2 are cited as the indexes for examining changes in the frequency and duration of
service interruptions. Service interruptions are primarily due to overloads on transformers and the
transmission and distribution grid. Overload conditions are monitored by power supply personnel within
the executing agency and if the facilities are operating close to capacity limit then supplies are interrupted
(load shedding). Blackouts have also been caused by equipment failure (lightning damage to 70kV
transmission lines, etc.)
Figure 1: Transitions in SAIFI/SAIDI and outage frequency (transmission system: caused by transformers/transmission lines)
Source: PLN Unit Business P3B Note: The number of failures per facility is the total for three transmission operation districts within East Java Province
(i.e. Madiun, Surabaya and Malang).
As Figure 1 illustrates, the SAIFI and SAIDI indexes have improved remarkably during the past ten
years, which may be partially attributed to the medium voltage transformer capacity expansions and easing
of overload operation effected via this project. The frequency of service interruptions has similarly been on
a downward trend and there have been marked improvements in the number of outages caused by
transformers thanks to the work carried out through this project. According to the executing agency, service
interruptions caused by transmission transformers of 20kV or less and capacity shortages on low voltage
distribution lines currently account for 60% of all outages.
(7) Decreases in transmission losses
This project mainly covered transformer facilities, thus although it was not anticipated to have much
effect on reducing transmission losses, it was hoped that indirect improvements would result. As illustrated
in Table 9, results show that the loss ratio had improved by 0.32 points in 2000 as compared to the figure
for 1996.
2 SAIFI (System Average Interruption Frequency Index): The average number of times each customer within an area experiences
interruption during a year). SAIDI (System Average Interruption Duration Index): The cumulative length of power interruption, in hours, that a customer within a certain area experiences during a year, on average.
0
10
20
30
40
50
60
1992 1996 1997 1998 1999 2000 2001
Supp
ly in
terr
uptio
n fr
eque
ncy
0
50
100
150
200
SAIF
I/SA
IDI i
ndex
SA IFI
SA IDI
Tran s fo rmerin du cedTran s mis s ionlin e in du ced

10
Table 9: Transitions in transmission loss (Unit: GWh)
1996 1997 1998 1999 2000 P3B system receiving volume 52,782 59,677 59,570 65,386 72,196 Volume used by substations within P3B system 44 48 58 55 56 Transmissions to Java-Bali distribution system 52,738 59,629 59,512 65,331 72,134
1,504 1,456 1,376 1,704 1,826 Transmission loss on Java-Bali system (1) 2.85% 2.44% 2.31% 2.61% 2.53% Of which, transmission loss within East Java region (2) 306 291 278 349 372 Transmission loss ratio for East Java region (2)/(1) 20.3% 20.0% 20.2% 20.5% 20.4% Java-Bali distribution system receiving volume 51,234 58,172 58,136 63,627 70,306 (East Java distribution system receiving volume) 10,444 11,656 11,775 13,047 14,395 Source: Audit data, PLN Unit Business P3B
(8) Overall project effects
As evidenced above, the medium voltage transformer facilities provided via this project are operating
favorably and account for approximately 16% of medium voltage transformer capacity and approximately
20% of all transformers currently operating in the East Java region. The provision of these transformers is
evaluated as having increased power demand and improved supply reliability within the region, thanks to
increased supply volumes and the eased overload operation situation. However, inadequate expansions to
other supply facilities (low/high voltage, etc.) and PLN’s inability to continue shoring up some of the
medium voltage substations since project completion mean that there is still room for improvement in terms
of meeting latent demand and further stabilizing supplies.
2.4 Impact (1) Contributions to industry sector development
Although affected by the currency crisis, economic activity in the East Java region has been growing at
an annual rate of 3.9%, on average, during the period spanning the early 1990s through 2001. The average
growth rate for the manufacturing industry reached 6.4% per year during the same period. The currency
crisis of 1997-98 inflicted enormous damage on East Java’s industrial sector, even causing it to post
negative growth, however, it has since shown modest recovery.
Table 10: Growth in East Java’s manufacturing sector (Unit: million Rp)
1993 1996 1997 1998 1999 2000 2001 Total regional production (at current prices) 44,629 77,004 88,772 135,753 150,556 169,681 196,499
Of which, manufacturing industry 10,202 22,454 26,344 38,258 41,158 45,616 51,617 Of which, commercial/service industry 10,252 16,050 19,027 32,069 34,478 39,166 46,476 Total regional production (1993 fixed) 44,629 61,794 64,854 54,399 55,059 56,857 58,758 Average 1-year growth rate - 11.5% 5.0% -16.1% 1.2% 3.3% 3.3% Of which, manufacturing industry 10,202 17,815 19,410 15,104 15,096 15,358 15,538 Average 1-year growth rate - 20.4% 9.0% -22.2% 0.0% 1.7% 1.2% Of which, commercial/service industry 10,252 12,906 13,828 11,369 11,404 11,908 12,838 Average 1-year growth rate - 8.0% 7.1% -17.8% 3.1% 4.4% 7.8%
Source: BPS Propinsi Jawa Timur
Output and the amount of value-added have also posted remarkable growth in the manufacturing
industry (Table 11), however, this is largely due to price increases, and performance is on a par with total

11
regional production. Although the currency crisis has caused increases in company numbers and investment
totals to stagnate in recent years, there has been verifiable growth in the entire economy and in the
manufacturing sector during the ten-year period since the early 1990s, with the percentage of total regional
production occupied by the manufacturing industry increasing from 22.9% in 1993 to 27.0% in 2000 and
industrialization accelerating.
Table 11: Transitions in manufacturing industry (medium-scale and above) performance in East Java (Unit: million Rp.)
1992 1995 1998 2000 No. of medium & large-scale companies 3,997 4,742 5,004 4,999 Output 21,328 36,013 79,396 162,482 Value-added 8,733 17,393 34,516 98,256 Investment (incl. small-scale companies) n.a 15,287 17,857 10,913
Source: BPS Propinsi Jawa Timur
It should be noted that the promotion of industrial sector development within the East Java region and
metropolitan Surabaya in particular, was being focused on at the time of project appraisal. REPELITA V
(the Fifth National Five-year Development Plan: 1989-93) envisioned sustainable growth in industrial
investment in Surabaya city, and the districts of Sidoarjo and Gresik, whilst REPELITA VI (1994-98)
envisioned accelerated investment in the Gresik district; moreover, it was acknowledged that the
development plans were predicated on the development of power and communications infrastructure.
As a result, the districts that have seen the most conspicuous industrialization during the last ten years
(excluding Surabaya) are Sidoarjo, Gresik and Pasuruan. As is clearly evidenced in Table 12, among these
three, it is manufacturing industries in Gresik that have been most successful in overcoming the effects of
the currency crisis to achieve sustainable growth.
In 1997, the ratio of manufacturing industries in each of the municipalities/districts had increased to
36.3% in Surabaya, 48.6% in Sidoarjo, and 46.5% in Gresik. These high growth rates have been sustained,
reaching 31.9%, 46.2%, and 45.7%, respectively as of 2000, and the regions are developing as industrial
centers. These municipalities/districts are favored by good access to ports, airports and highways, plans to
build numerous industrial estates are being executed, and the region is the focus for a string of ODA loan
funded projects, such as this one, targeting the development of power and communications infrastructure.
12
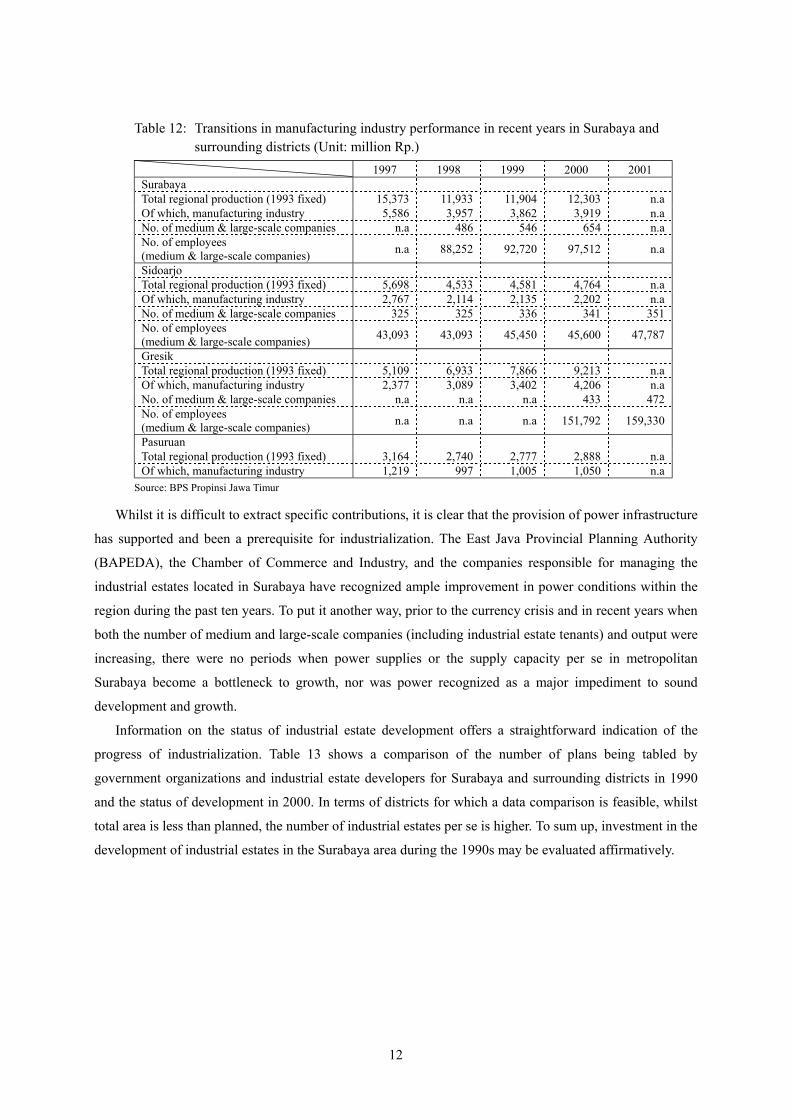
Table 12: Transitions in manufacturing industry performance in recent years in Surabaya and surrounding districts (Unit: million Rp.)
1997 1998 1999 2000 2001 Surabaya Total regional production (1993 fixed) 15,373 11,933 11,904 12,303 n.a Of which, manufacturing industry 5,586 3,957 3,862 3,919 n.a No. of medium & large-scale companies n.a 486 546 654 n.a No. of employees (medium & large-scale companies) n.a 88,252 92,720 97,512 n.a
Sidoarjo Total regional production (1993 fixed) 5,698 4,533 4,581 4,764 n.a Of which, manufacturing industry 2,767 2,114 2,135 2,202 n.a No. of medium & large-scale companies 325 325 336 341 351 No. of employees (medium & large-scale companies) 43,093 43,093 45,450 45,600 47,787
Gresik Total regional production (1993 fixed) 5,109 6,933 7,866 9,213 n.a Of which, manufacturing industry 2,377 3,089 3,402 4,206 n.a No. of medium & large-scale companies n.a n.a n.a 433 472 No. of employees (medium & large-scale companies) n.a n.a n.a 151,792 159,330
Pasuruan Total regional production (1993 fixed) 3,164 2,740 2,777 2,888 n.a Of which, manufacturing industry 1,219 997 1,005 1,050 n.a
Source: BPS Propinsi Jawa Timur
Whilst it is difficult to extract specific contributions, it is clear that the provision of power infrastructure
has supported and been a prerequisite for industrialization. The East Java Provincial Planning Authority
(BAPEDA), the Chamber of Commerce and Industry, and the companies responsible for managing the
industrial estates located in Surabaya have recognized ample improvement in power conditions within the
region during the past ten years. To put it another way, prior to the currency crisis and in recent years when
both the number of medium and large-scale companies (including industrial estate tenants) and output were
increasing, there were no periods when power supplies or the supply capacity per se in metropolitan
Surabaya become a bottleneck to growth, nor was power recognized as a major impediment to sound
development and growth.
Information on the status of industrial estate development offers a straightforward indication of the
progress of industrialization. Table 13 shows a comparison of the number of plans being tabled by
government organizations and industrial estate developers for Surabaya and surrounding districts in 1990
and the status of development in 2000. In terms of districts for which a data comparison is feasible, whilst
total area is less than planned, the number of industrial estates per se is higher. To sum up, investment in the
development of industrial estates in the Surabaya area during the 1990s may be evaluated affirmatively.

13
Table 13: Progress in new industrial estate development in Surabaya and surrounding districts Planned figures (1990) Actual figures (2000) Difference
No. of industrial estates Area (Ha) No. of industrial
estates Area (Ha) No. of industrial estates Area (Ha)
Surabaya 8 2,373 12 1,653 4 -720 Sidoarjo n.a n.a 6 813 n.a n.a Gresik 6 1,900 11 1,148 5 -752 Mojokerto 1 200 2 500 1 300 Bankalan 1 1,350 1 900 0 -450 Pasuruan - - 3 1,445 3 1,445
Total 16 5,823 35 6,459 13 -177 Source: BPS Propinsi Jawa Timur, BAPEDA Jawa Timur
According to a company3 that manages one of the industrial estates, visited independently, capacity
expansions to power infrastructure have, in combination with industrial estate development progress and
increases in tenant company numbers, been the result of appropriate developments by PLN. Development
of this industrial estate commenced in 1990, and since numbers of tenant companies (including tenancy
inquiries) increased dramatically between 1996-97 (approximately 120 companies had moved in as of
2002) thus overlapping with the implementation of this project, it is possible to form a connection between
the two. Capacity at the Rungkut substation that supplies power to this industrial estate was expanded under
this project, and whilst this is merely one example, it may be inferred that it has appropriately met forecast
demand increases.
Rungkut substation
Located to the south of Surabaya, it mainly supplies power to large-scale industrial estates, such as the comparatively long-
established Waru Industrial Estate and the recently established SIER Industrial Estate, it also transmits power to a number
of 20kV+ industrial consumers. The project anticipated the plans to develop the industrial estate and connection
applications from the managerial company and added three 50MVA transformers to the existing two, plus accessory
equipment.
At the time of evaluation, Unit 2, Unit 4 and Unit 5, the transformers provided via the project, were respectively using
21MW, 36MW, and 33MW against a rated capacity of 50MVA (= approx. 40MW) during morning hours which see
concentrated industrial activity, with similar levels after 7 p.m. when demand for household lighting increases. As a result,
some transformers record capacity operating ratios of 90% during peak periods. The original plan was to add two
transformers to the Rungkut substation, however, after the plans were reviewed, one of the transformers, originally
scheduled for installation at another substation, was repositioned and measures were taken to further expand capacity,
which given peak operating usage ratios in excess of 90%, more than justifies the revisions to positioning plans.
According to the management of this industrial estate, tenancy rates at other industrial estates in
Surabaya and surrounding districts also apparently increased during 1996-97. Whilst the company has
equipped the industrial estate with private generation facilities it has not experienced any problems with the
status of power infrastructure since it began managing the industrial estate.
3 P.T. SIER Industrial Estate located in Rungkut district in southern Surabaya; 90% of tenant companies are Japanese
affiliates.

14
(2) Power-related problems vis-à-vis industrial sector development
If the effects of the 1997 currency crisis are discounted, manufacturing and production industry
development in the East Java region, and metropolitan Surabaya in particular, has tended to be quite rapid
during the past ten years. Based on the this growth trend and the results from a hearing with a commerce
and industry association, it would appear that supply capacity conditions have not caused a bottleneck at
any time.
However, it is also true that supply to the industrial sector was not at a level that would sufficiently
satisfy businesses in Surabaya and its environs. With supply interruptions inevitable at transformer facilities
that become overloaded during peak periods and the demand-supply gap on the increase, the quantitative
supply issue remains to be resolved. At the same time, further improvements must be made to the reliability
of supplies. Power outages are an almost weekly occurrence during the rainy season and some businesses
have been forced to shut down production for two days at a time. In addition, in the case of PLN there are
instances when applications to increase contract capacity require a month to process.
In consequence, private generation facilities (captive power) continue to be an indispensable investment
for businesses as a standby for peak periods and for use in emergencies. There are two types of industrial
consumers owning private generation facilities. Those that use in-house generators as their main supply
source and only rely on the grid for lighting demand, and those that use the grid as their main supply source
and have private generators as a standby for peak periods and for use in emergencies. In terms of installed
capacity of private generators, the latter group is dominant.
As illustrated in Table 14, until the mid 1990s, there was a progressive decrease in private generation
capacity aimed at meeting main demand. The continuous development support provided by the ODA loan
funded “East Java Electric Power Transmission and Distribution Network Project” was instrumental to
these decreases. However, notwithstanding that a certain level of installed capacity is an essential
emergency countermeasure for industrial production, the installed capacity of private generators used as the
main supply source and for peak standby has been increasing since the mid 1990s. The East Java Chamber
of Commerce and Industry has recognized recent increases in new private generation facilities and capacity
expansions to existing generators due to higher electricity tariffs and fears of an energy crisis.
Table 14: Transitions in the installed capacity of private generation facilities (Unit: MVA)
1992 1994 1995 1996 1997 1998 1999 Main Installed captive capacity 197 201 150 142 126 122 188 Peak standby Installed captive capacity 327 463 357 593 589 618 657
Emergency Installed captive capacity 301 391 617 507 650 657 947
Total Installed captive capacity 825 1,055 1,124 1,243 1,365 1,397 1,492 Source: PLN Unit Business Distribusi Jawa Timur
There are indications that, should electricity tariffs continue to rise, supplies from private generators
will end up being cheaper and more efficient. According to the executing agency, grid supplies continue to
be cheap and efficient, however, they are aware of the need to improve supply conditions so as to prevent

15
any further increase in the burden on industrial consumers to install, operate and maintain captive power
facilities. Businesses have been highly vocal regarding the need for the executing agency to improve its
management policies (particularly in terms of the private-sector commissioning of its distribution business).
Many industrial estate tenants own captive power facilities. According to the industrial estate
management company we visited, whilst all its tenant companies are grid contractors they have captive
power facilities as a standby for peak periods. Power outages in the early stages of the rainy season are
frequently accompanied by supply disruptions, and use of captive power is particularly heavy during this
season.
(3) Changes in village and household electrification rates
As shown in Figure 2, both village (the percentage of all villages that have been electrified) and
household (the percentage increase in contracted households) electrification rates in East Java increased by
a wide margin during the 1990s. The village electrification rate has almost reached 100%, whilst the
household electrification rate evidences that over half the households have been electrified.
Figure 2: Fluctuations in village and household electrification rates in East Java
Source: PLN Unit Business Distribusi Jawa Timur Note: The number of electrified villages refers, albeit in part, to those villages (Desa) that have been reached by the power grid.
The expansions to transformer facilities implemented via this project have been partially responsible for
facilitating increases in the supply of power to general consumers and have contributed to per customer
increases in power consumption and the improvements in the village and household electrification rates. At
appraisal, this project was targeted toward improving power conditions with a view to facilitating industrial
growth, however, the additional transformers and appropriate operations that were implemented
conjunctively are evaluated as having been contributory in terms of supporting the increases in numbers of
contracts for general consumers.
(4) Other impacts (land acquisition)
Some privately owned land was acquired for the construction of new substations, however, the process
was conducted in accordance with government guidelines, including financial compensation, and did not
result in any delays to the implementation schedule or affect the outcome of the project. It should be noted
that the land acquisition did not entail the relocation of any residents.
0
3,000
6,000
9,000
1992 1996 1997 1998 1999 2000 20010%
20%
40%
60%
80%
100%
No. of villages electrifiedVillage electrification rateHousehold electrification rate

16
2.5 Sustainability
2.5.1 Operation and Maintenance
(1) Organization and personnel systems
In 1994, PLN, the project’s executing agency, was transformed from a state-owned enterprise into a
public corporation (PERSERO) with all of its stock is held by government. In recent years, the Java-Bali
system has also felt the current of structural reforms in the power sector and has been promoting
organizational reform. PLN has positioned its transmission and distribution department as a strategic
business unit and is pushing ahead with a view towards spinning off the department as a separate business
in the future. The operation and maintenance of the transmission and transfer facilities provided via this
project has been conducted by the Distribution and Load Control Center for Java-Bali (P3B), one of PLN’s
strategic business units, since it was established in 1995.
500kV facilities within the Java-Bali system are managed by the P3B head office, however, all 150kV
and 70kV transformer facilities are administered by P3B Area Control Centers (ACC4). These ACC
transmit power to the distribution units in their area, which are also strategic business units.
Figure 3: Organizational chart of P3B
The East Java-Bali ACC of P3B operates in suburban Surabaya and has further divided its operations
into four areas (Madiun, Surabaya, Malang and Denpasar) in order to manage the substations and
transmission lines under its control. As of the end of 2000, the East Java area had 1,266 employees. The
P3B East Java area manager has not recognized any specific issues with the technical abilities of personnel
but is aware that there are surplus numbers.
In recent years, personnel numbers in PLN have been decreasing rapidly thanks to its early retirement
program and a non-recruit policy. The payroll in 1995 numbered 54,790 employees but had dropped to
4 The main functions of ACC are 1) 150kV and 70kV system operation targeting supply and voltage management, and 2) maintenance of
supply security within the region.
General Manager
Planning department
Technology department
Financial accounting department
Transmission department
Personnel department
General affairs department
System operation department
Auditor
Jakarta-Banten Area (ACCⅠ)
West Java Area (ACCⅡ)
Central Java-Yogya Area
(ACC Ⅲ) East Java-Bali Area
(ACC Ⅳ)
Technology department

17
46,016 by the end of 2000, and the company has introduced a system of contract labor covering engineers
and technicians.
(2) Business operations
P3B, which is positioned as one of PLN’s strategic business units, is a business organization that is
exclusively involved in the transmission and transformer operations that will form the groundwork for
achieving the total spin-off of the business, i.e. the future vision for structural reorganization of the power
sector, and for realizing the multi-seller/multi-buyer model5, however, at the time of evaluation it is still no
more than an internal division of PLN. Decisions on business plans and fund procurement are made by the
PLN head office, and whilst P3B drafts plans for investment and the recruitment and allocation of
personnel, these matters require head office approval. Accordingly, P3B is responsible for facilities
operation and maintenance and for procuring resources.
It should be noted that the business operations of P3B are subject to performance targets set by PLN
head office. P3B operations involve the monitoring of the duration and frequency of system faults as well
as transmission loss. It also establishes the selling price for the Distribution Business Units and targets for
the asset turnover ratio, etc. As explained in section 2.3, although it has been possible to confirm a certain
level of improvement in the duration and frequency of system failures and in transmission loss, in terms of
financial targets, the nature of P3B’s organization means that the unit is not sufficiently motivated to
effectuate improvements.
Operations at each of the substations in the East Java region are conducted by four groups in three daily
shifts under the control of the East Java ACC. The operational setup of transmission and transformer
facilities has a direct impact on the reliability of supply (particularly the occurrence of disruptions). The
causes of supply interruptions for each substation are as shown in Table 15. In terms of P3B-wide
transmission operations, the overwhelming majority of disruptions are caused by external factors, such as
lightning, as opposed to human factors relating to operational skills or facilities-related factors; however,
the opposite is true for transformer operations. Thus it may be inferred that there is a pressing need for P3B
to improve its facilities operation and maintenance techniques.
5 One form of supplying power, which involves multiple generation operators selling power to transmission and transformer operators
which is then bought by multiple distributors and supplied to consumers.

18
Table 15: Causes (and number) of supply disruptions: FY 2000
Transmission line Transformer
1996 2000 1996 2000 Internal causes Facilities-related problem 43 27 140 56 Operational problem 8 0 16 1 Faulty protective transmitter 8 2 47 2 Faulty feeder 0 0 133 101 External causes Lightning 144 55 33 2 Kites 15 5 1 2 Falling tree 3 2 - - Animals 7 1 24 4 Other cause beyond PLN control 32 7 55 19
Source: PLN Unit Business P3B Note: Causes are based on executing agency classifications
(3) Maintenance and Management
Servicing and maintenance management involves the periodic implementation of preventative
maintenance in addition to follow-up maintenance, work that is carried out using the operation and
maintenance manual provided by the equipment supplier and the guidebook compiled by the executing
agency. These activities are executed regardless of the financial status of the organization as a minimal
responsibility of the executing agency.
In terms of spare parts for transmission and transformer facilities, efforts are made to maintain a stock
equivalent to around 2-3% of the parts necessary for all installed facilities. In order to maintain stocks,
supply requisitions are periodically dispatched to PLN head office, however, their delivery is dependant on
the head office budget, and excluding emergency requests for breakdowns and so forth, parts are only
supplied when budgetary measures permit. Accordingly, it is difficult to ensure a sufficient volume and
variety of spare parts. Moreover, according to the executing agency, the depreciation of the local currency
is making it difficult to procure a sufficient stock of those parts necessary for communications equipment,
etc., that have to be procured overseas.
2.5.2 Technical Capacity PLN is actively working to expand the opportunities for staff training. In fiscal 2000, 51,763 staff
members participated in various training courses. PLN offers the following training courses in connection
with this project:
・Substation/transmission line operation and maintenance management ・High voltage transmission line maintenance management ・Communications and SCADA6 system operation
The executing agency has indicated a need to improve the technical abilities of its workers in respect of
protective transmitter management and SCADA system operation, and is endeavoring to effectuate this by
6 The Supervisory Control and Data Acquisition (SCADA) system refers to a communications system that is used to remotely control a
power supply system. It allows operators to ascertain transformer load conditions and transmission line current from the Supply Command Center and to perform remote load switching operations in response to demand.
19
providing more training opportunities.
The employee evaluation standards used when promoting or reallocating staff are based on years of
experience, however, the results of various technical examinations (whether the staff member has any in-
house technical qualifications), participation in training courses, educational history and attitudes towards
work are also considered. The manager of the P3B East Java area has recognized a strong desire among
personnel to improve their technical skills. All personnel involved in operation and maintenance activities
attend weekly meetings during which the week’s duties and responsibilities are clarified and tasks assigned.
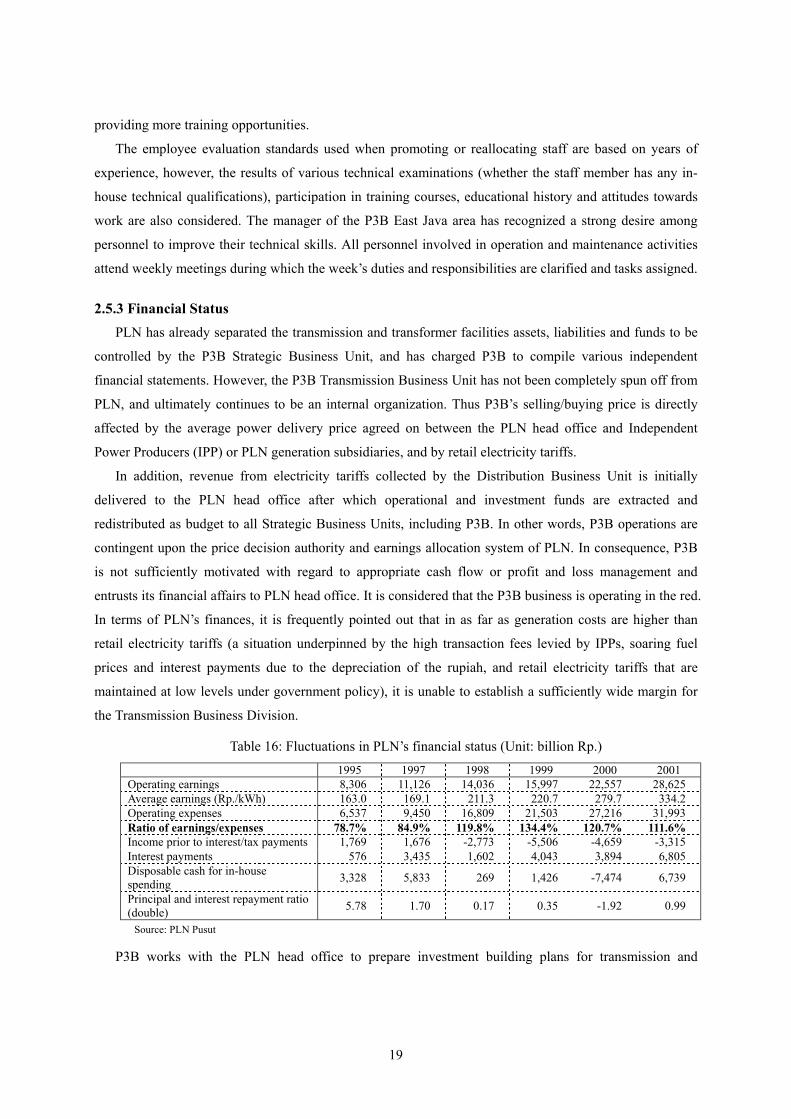
2.5.3 Financial Status PLN has already separated the transmission and transformer facilities assets, liabilities and funds to be
controlled by the P3B Strategic Business Unit, and has charged P3B to compile various independent
financial statements. However, the P3B Transmission Business Unit has not been completely spun off from
PLN, and ultimately continues to be an internal organization. Thus P3B’s selling/buying price is directly
affected by the average power delivery price agreed on between the PLN head office and Independent
Power Producers (IPP) or PLN generation subsidiaries, and by retail electricity tariffs.
In addition, revenue from electricity tariffs collected by the Distribution Business Unit is initially
delivered to the PLN head office after which operational and investment funds are extracted and
redistributed as budget to all Strategic Business Units, including P3B. In other words, P3B operations are
contingent upon the price decision authority and earnings allocation system of PLN. In consequence, P3B
is not sufficiently motivated with regard to appropriate cash flow or profit and loss management and
entrusts its financial affairs to PLN head office. It is considered that the P3B business is operating in the red.
In terms of PLN’s finances, it is frequently pointed out that in as far as generation costs are higher than
retail electricity tariffs (a situation underpinned by the high transaction fees levied by IPPs, soaring fuel
prices and interest payments due to the depreciation of the rupiah, and retail electricity tariffs that are
maintained at low levels under government policy), it is unable to establish a sufficiently wide margin for
the Transmission Business Division.
Table 16: Fluctuations in PLN’s financial status (Unit: billion Rp.)
1995 1997 1998 1999 2000 2001 Operating earnings 8,306 11,126 14,036 15,997 22,557 28,625 Average earnings (Rp./kWh) 163.0 169.1 211.3 220.7 279.7 334.2 Operating expenses 6,537 9,450 16,809 21,503 27,216 31,993 Ratio of earnings/expenses 78.7% 84.9% 119.8% 134.4% 120.7% 111.6% Income prior to interest/tax payments 1,769 1,676 -2,773 -5,506 -4,659 -3,315 Interest payments 576 3,435 1,602 4,043 3,894 6,805 Disposable cash for in-house spending 3,328 5,833 269 1,426 -7,474 6,739
Principal and interest repayment ratio (double) 5.78 1.70 0.17 0.35 -1.92 0.99
Source: PLN Pusut
P3B works with the PLN head office to prepare investment building plans for transmission and

20
transformer facilities, formulating three scenarios7: a limited, low and high case, based on fundraising
constraints. P3B has indicated that it will be necessary to continuously expand installed capacity in order to
meet future increases in demand, but unless PLN’s finances recover it will be no easy matter to procure the
necessary funds to improve and replace equipment. At present, since it is virtually impossible to invest in
transformer capacity expansion, P3B is forced to reject applications for connection in areas serviced by
overloaded substations. If PLN’s financial status fails to improve, it is predicted that it will eventually
become difficult even to find the funds to cover operation and maintenance costs.
Post-decentralization changes to the system have not seemingly had any particular impact on the
operation and maintenance activities of the executing agency. In addition to decentralization, the
Indonesian parliament approved a new electricity bill in September 2002, under which licenses identical to
that issued to PLN are to be issued to private sector operators in each of the different power businesses
(generation, transmission, distribution, facilities operation and retail sales), and PLN’s monopolistic
“special license” is to be revoked. Provincial and district governors will have the authority to issue these
licenses, and it is expected that, in the distant future, activities to establish privately owned power
businesses handling the distribution and retail sales for a certain district or municipality will begin to take
place.
3. Feedback
3.1 Lessons Learned Although the current project promoted the capacity expansion of medium voltage transformer facilities,
since the expansions were not continued after project completion and insufficient expansions have been
made to other supply facilities (low/high voltage, etc.), there is still room to achieve results in terms of
meeting latent demand and supply stability. The significant revisions to project plans are considered to have
been an inevitable consequence of the currency crisis, however, a more in-depth study of facilities
infrastructure not covered by the project and of the financial status of the executing agency would have
been beneficial in terms of deriving greater effect from the project.
7 Under the high scenario there are no financing constraints and it covers “all planned improvement projects in line with predicted
demand”; under the low scenario a partial injection of funds is possible but some constraints remain and it covers “in-progress improvement projects and those to which funds have been committed, as well as those additional facilities investment funding projects for which positive funds can be allocated”; under the limited scenario there is no injection of new funds and “only in-progress improvement projects and those to which funds have been committed” are covered.

21
Comparison of Original and Actual Scope Item Plan Actual
1. Project Scope Phase I 1. Expansion of existing substations
Transformers: 70/20kV 150/20kV
7 sites; total capacity 150MVA 16 sites; total capacity 820MVA
7 sites; total capacity 150MVA 16 sites; total capacity 820MVA
2. Consulting services Foreign: 80 M/M Domestic: 92 M/M
n.a n.a
Phase II 1. Expansion of existing substations
a. Transformers: 150/20kV b. Transmission line outlet construction
10 sites; total capacity 410MVA 1 site
10 sites; total capacity 410MVA 1 site
2. Substation construction: 150/20kV 3 sites: total capacity 150MVA 3 sites: total capacity 150MVA 3. Transmission line construction: 150kV-2CCT 3 lines: total length 25km 3 lines: total length 25km 4. Consulting services Foreign: 92 M/M
Domestic: 93 M/M Foreign: 58 M/M
Domestic: 93 M/M 2. Implementation Schedule Phase I:
1. L/A conclusion 2. Consultant selection 3. Feasibility study 4. Preparation of tender documents 5. Tender & contract closing 6. Design/manufacture 7. Procurement 8. Installation & set up
Sep. 1991 Nov. 1991 - Oct. 1992 Oct. 1991 – Dec. 1991 Dec. 1991 – Jan. 1992 Feb. 1992 - Oct. 1992
Nov. 1992 – Nov. 1993 Jun. 1993 – Jun. 1994 Jan. 1993 – Oct. 1995
Sep. 1991 Mar. 1992 - Oct. 1992
Jul. 1992 Jun. 1992 – Aug. 1992 Jul. 1992 - Oct. 1992
Dec. 1993 – Apr. 1996 Dec. 1994 – Jan. 1996 Nov. 1994 – Jan. 1997
Phase II: 1. L/A conclusion 2. Consultant selection 3. Feasibility study 4. Preparation of tender documents 5. Tender & contract closing 6. Land acquisition 7. Design/manufacture 8. Procurement 9. Installation & set up
Sep. 1992 Sep. 1992 – Aug. 1993 Apr. 1992 – Jun. 1992 May 1992 – Jul. 1992 Aug. 1992 – Sep. 1993 Jul. 1992 – Sep. 1994 Oct. 1993 – Mar. 1995 Oct. 1994 – Jun. 1995 May 1994 – Sep. 1995
Oct. 1992 Sep. 1992 – Sep. 1993
n.a n.a n.a n.a n.a n.a n.a
3. Project Cost Phase I:
Foreign currency Local currency Total ODA loan portion Exchange rate
6,615 million yen 2,410 million yen
(35,431 million Rp.) 9,025 million yen 7,671 million yen Rp.1 = 0.068 yen (as of Apr. 1991)
5,123 million yen 2,077 million yen
(32,087 million Rp.) 7,200 million yen 3,223 million yen Rp.1 = 0.064 yen (weighted average for 1992 - 1997)
Phase II: Foreign currency Local currency Total ODA loan portion Exchange rate
5,841 million yen 2,233 million yen
(34,880 million Rp.) 8,074 million yen 6,862 million yen Rp.1 = 0.064 yen (as of Apr. 1992)
n.a n.a n.a n.a
3,236 million yen n.a

22
Third Party Evaluator’s Opinion on Java-Bali Transmission Line/Substation Development Project (East Java) (I&II)
Dr. Pande Radja Silalahi
Vice Chairman/ Indonesia Antimonopoly Authority
Staff/ Center for Strategic and International Studies-Jakarta
Relevance The report is concise and covers all the relevant subjects set out in the DAC Evaluation Criteria. Development of the power transmission and distribution grid in East –Java has very high relevance especially in supporting or facilitating the power demand from industry, both mining and manufacturing. In fact, it could be argued that the development of the power transmission and distribution grid will become even more important as the economy of Indonesia and East Java is now on course for recovery after the economic crisis in 1997. Enhancing the stability and reliability of power supplies continues to be an critical issue especially due to the potential an energy crisis within Java-Bali, even though there are indications at this stage that supply capacity and the transmission and distribution network remain deficient. By improving of the reliability and stability of power supplies by meeting increase in demand it might be expected that economic activities will increase and as a result the added value received by the people at large or companies in the region will increase significantly. This project had positive impacts on local economic activities due to the cost reductions, which achieved via decreases in transmission and distribution loss. The actual cost of the projects was much lower than the estimate at the time of appraisal (about 44,47%) resulted mainly from international competitive bidding for transformer equipment, followed by, depreciation of local currency. Even though that the project was completed approximately 15 month behind schedule this project had contributed in guaranteeing better supply capacity in East Java. Impact It might be admitted that the project resulted in positive economics and social impacts. The project resulted in regional development in terms of improved availability and continuity of power supply to household as well as companies in the targeted region (East-Java). The increase in the substation capacity by approximately 30% of medium voltage transformer capacity expansions, increase in transmissions from all substations, increase in the number of customer handling capacity, improvement of SAIFI and SAIDI indexes, decreases in transmission loss had contributed to development of industrial sector in East Java. However, the economic crisis in 1997 resulted in the demand for power dropped and standstill after the year of crisis. This development had an impact on the calculation of the effectiveness of this project. Due to the impact of economic crisis and the price policy of electricity applied by government, the accurate economic benefit derived from this project is very difficult to quantify, and as a consequences the estimated economic rates of return (EIRR) also is very difficult to calculate. Therefore, in order to show whether this project was cost-efficient accurately, we need to compare the unit cost of the project with unit cost of a similar project and taken into account the subsidy policy implemented by government. The report pointed out that the actual cost was much lower than the estimate at the time of appraisal (about 44,47%). The significant cost under-run, about 44,47% lower than originally estimated, resulted from the excessive competition among bidders and the appreciation of the Yen vis-à-vis the Indonesian Rupiah.