indonesia minimum service standards for nutrition ... · indonesia minimum service standards for...
TRANSCRIPT
Technical Brief Indonesia Minimum Service Standards for Nutrition: Technical Brief for District Health Administrators
May 2017
April 2017

This technical brief is made possible by the generous support of the American people through the support of the Office of Health, Infectious Diseases, and Nutrition, Bureau for Global Health, U.S. Agency for International Development (USAID) Bureau for Asia under terms of Cooperative Agreement No. AID-OAA-A-12-00005, through the Food and Nutrition Technical Assistance III Project (FANTA), managed by FHI 360.
The contents are the responsibility of FHI 360 and do not necessarily reflect the views of USAID or the United States Government.
Recommended Citation
Indonesia Ministry of Health. 2017. Indonesia Minimum Service Standards for Nutrition: Technical Brief for District Health Administrators. Washington, DC: FHI 360/Food and Nutrition Technical Assistance III Project.
Contact Information
Food and Nutrition Technical Assistance III Project (FANTA) FHI 360 1825 Connecticut Avenue, NW Washington, DC 20009-5721 T 202-884-8000 F 202-884-8432 [email protected] www.fantaproject.org

INDONESIA MINIMUM SERVICE STANDARDS FOR NUTRITION: TECHNICAL BRIEF FOR DISTRICT HEALTH ADMINISTRATORS
Contents
1 Introduction ............................................................................................................................ 1
2 Key Government Policies, Strategies, and Plans Related to Nutrition ....................................... 3
3 Overview of the Nutrition Situation in Indonesia ..................................................................... 6
4 The Relationship Between Nutrition, Infection, and Mortality ................................................. 9
5 Guidance on Nutrition-Related Minimum Service Standards ................................................. 14
Category 1: Pregnant Women ................................................................................................ 14
Category 2: Women During Delivery ...................................................................................... 15
Category 3: Newborn Babies (Up to 28 Days) ......................................................................... 15
Category 4: Children Under 5 Years of Age ............................................................................ 16
Category 5: Women of Reproductive Age (15–49 Years Old) .................................................. 20
6 Conclusion ............................................................................................................................. 23
References .................................................................................................................................... 24
Appendix 1. Child Dietary Indicators by Province .......................................................................... 28

INDONESIA MINIMUM SERVICE STANDARDS FOR NUTRITION: TECHNICAL BRIEF FOR DISTRICT HEALTH ADMINISTRATORS
1
1 Introduction
The Government of Indonesia has recently updated its package of Minimum Service Standards (MSS, or Standar Pelayanan Minimum in Bahasa) for health services at the district level. These standards define the services that must be provided to all citizens at primary and secondary health care centers, and are the singular mechanism by which district health administrators are held accountable against the target indicators set for each standard. Local governments are responsible for providing the infrastructure, equipment, human resources, and budget to reach 100 percent of target indicators for each standard in the MSS. The district-level target indicators in the MSS are categorized into 12 population groups (shown in Box 1). In order to fully achieve the target indicators, district health administrators must work closely with private service providers, verify services from reports and health records, and conduct monitoring visits to ensure that quality services are delivered.
For District Health Administrators to achieve the target indicators set for the MSS standards for health, improving nutrition is key. Indonesia continues to have nutrition problems that are widely prevalent and affect several key segments of the population, especially adolescents, women and children. The nutrition problems that persist are holding Indonesia back from achieving its health and economic development objectives. Both nutrition and health must be addressed together to enable the country to achieve its national targets for nutrition and health.
The purpose of the technical brief is to orient district health administrators who are accountable for local health service delivery on: (1) why nutrition is important to address to achieve the MSS district health indicators and how it fits within the MSS for the health sector; (2) what the nutrition situation is in Indonesia; and (3) what the specific nutrition interventions and services are to improve health
Box 1. Categories of Population Groups for the Minimum Service Standards District Indicators for Health*
1. Pregnant women
2. Women during delivery
3. Newborn babies (up to 28 days)
4. Children under the age of 5 years
5. Students in elementary school
6. Women of reproductive age (15–49 years of age)
7. Elderly (60 years of age and older)
8. People with hypertension
9. People with diabetes mellitus
10. People with psychosocial health issues (severe cases)
11. People with tuberculosis
12. People who are high-risk of HIV infection
*For more information on the targets and steps, please see the Indonesian Ministry of Health Decree No. 43/2016 on Minimum Service Standards for Health.

INDONESIA MINIMUM SERVICE STANDARDS FOR NUTRITION: TECHNICAL BRIEF FOR DISTRICT HEALTH ADMINISTRATORS
2
and nutrition outcomes in Indonesia and achieve the MSS district health indicators. The brief focuses on 5 of the 12 categories identified by the MSS, as noted in Box 1, namely:
• Pregnant women
• Women during delivery
• Newborn babies (up to 28 days)
• Children under the age of 5 years
• Women of reproductive age (15–49 years of age)
District health administrators play a pivotal role in improving nutrition because they are responsible for: • Developing food and nutrition action plans at the district level
• Ensuring adequate funding is requested and allocated for nutrition when preparing annual budgets
• Ensuring adequate staffing for nutrition services to achieve the MSS
• Developing and strengthening the capacities and competencies of staff in charge of nutrition activities, clearly defining their roles and duties
• Providing in-service training on quality of services for health workers at the puskesmas level and for kaders at the village level
• Ensuring consistent quality nutrition service delivery
• Strengthening the supervision, monitoring, and evaluation of nutrition activities to ensure compliance with service and quality standards and protocols
• Ensuring that targets set for the indicators related to nutrition in the MSS are met

INDONESIA MINIMUM SERVICE STANDARDS FOR NUTRITION: TECHNICAL BRIEF FOR DISTRICT HEALTH ADMINISTRATORS
3
2 Key Government Policies, Strategies, and Plans Related to Nutrition
During the past decade, several policies, strategies, and plans have been put into place in Indonesia that serve as a framework for the MSS as they relate to nutrition. In Table 1 below these documents are summarized and an explanation of their relevance to the MSS is provided.
Table 1. Key Government Policies, Strategies, and Plans Related to Nutrition and Relevance to the MSS
Title Summary Relevance to MSS
Indonesia Health Law No. 36/2009
This law established nutrition development targets to achieve improved individual and community nutritional status.
Adherence to this law is to be achieved through improved consumption patterns for balanced nutrition, nutrition awareness, physical activity, clean and healthy life behaviors, and access to nutrition services, which are outlined in the MSS for health.
Presidential Decree No. 42/2013 on National Movement on Accelerating Nutrition Improvement
In 2011, Indonesia committed to the Scaling Up Nutrition (SUN) Movement and demonstrated its commitment to tackling malnutrition by launching the National Movement to Accelerate Nutrition Improvement through Presidential Decree No. 42/2013, which focuses on the first 1,000 days of a child’s life. Through this decree, Indonesia established longer-term nutrition targets that are in line with the World Health Assembly 2025 targets (see Table 2). This decree provided authority to the National Planning Agency (BAPPENAS) to oversee the coordination of the SUN Movement in Indonesia and identify coordinating structures to convene stakeholders and sectors at national and subnational levels.
The policy framework for the SUN Movement identifies six nutrition goals that cover stunting, wasting, overweight, low birth weight, and exclusive breastfeeding. However, in Indonesia there has been limited focus on the large contributing factors to stunting, wasting, overweight, and low birth weight, such as suboptimal infant and young child feeding practices, adolescent health and nutrition, maternal nutrition, and behaviors related to water, sanitation, and hygiene. This guidance document focuses on these areas and recommends services/interventions for each to meet the MSS indicators for health.
National Plan of Action on Food and Nutrition (2015–2019)
This action plan outlines food and nutrition activities to improve the nutritional status of pregnant women and children up to 2 years of age, including nutrition interventions implemented through health services. The indicators for nutrition are to reduce stunting in children under 2
Nutrition programs will be implemented at the community level through the Integrated Health and Nutritional Services (Posyandu – Pos Pelayanan Terpadu). Each province is also required to develop a provincial-level food and nutrition action plan, following the guidelines developed

INDONESIA MINIMUM SERVICE STANDARDS FOR NUTRITION: TECHNICAL BRIEF FOR DISTRICT HEALTH ADMINISTRATORS
4
years, and wasting and underweight in children under 5; address the rising levels of overweight; reduce maternal anemia; and increase rates of exclusive breastfeeding. The plan also includes targets for water and sanitation. The policy is multisectoral in nature and includes the agriculture, social welfare, and public works sectors.
by BAPPENAS, based on the National Plan of Action on Food and Nutrition. Plan indicators measure nutritional status, food access, quality and safety of food, hygiene and sanitation, and food and nutrition institutional strengthening. Development of food and nutrition action plans for districts is optional, but would assist districts to ensure nutrition interventions and services are planned, budgeted for and implemented.
Ministry of Health Decree No. 43/2016 on Minimum Service Standards for Health
The MSS for health serve as a guideline for the local government (district/city) in providing the minimum health services to the people. The decree outlined the targets and steps, and recommends a monitoring and evaluation (M&E) system as well as human resources needed to fulfill the services.
The decree outlines 12 services addressing mothers, children, persons with specific illnesses, and the population in general. The local government must conduct health services as part of their performance evaluation.
Ministry of Health Decree No. 852/2008 on National Strategy for Community-Led Total Sanitation
This decree of the health minister consists of five pillars: (1) stopping open defecation, (2) handwashing with soap, (3) improved household drinking water and food management, (4) improved household waste management, and (5) improved household liquid waste management. The implementation of the current strategy, however, is currently voluntary by districts.
The strategy takes into account the three conditions that have been proven necessary to reduce the incidence of diarrheal disease, including increasing community access to basic sanitation, promoting handwashing with soap, and improving the household management of safe drinking water, which are included in the services and interventions outlined in this technical brief to support adherence to MSS indicators.
Law No. 23/2014 Passed in 2014, this law states that basic health services are mandatory and the responsibility of both the central and local governments.
The passage of this law required revision of the MSS package for health services at the district level, making local governments responsible for providing infrastructure, equipment, human resources, and the budget to fully achieve targets set for the indicators outlined in the MSS. The law also states that governors or heads of districts who do not adhere to the MSS package will be sanctioned, which can range from administrative sanction to being temporarily or permanently removed from office.

INDONESIA MINIMUM SERVICE STANDARDS FOR NUTRITION: TECHNICAL BRIEF FOR DISTRICT HEALTH ADMINISTRATORS
5
Governmental Law No. 33/2012 on Exclusive Breastfeeding
Exclusive breastfeeding refers to giving only breast milk to infants until 6 months of age, without giving any additional food or drink. This law describes responsibilities of various stakeholders, including government, parents, producers of breast milk substitutes, and the public.
The provincial and district governments have responsibilities for the success of exclusive breastfeeding in their areas. Activities that should be considered by the local government to promote exclusive breastfeeding are advocacy, social mobilization, training, and M&E.
Table 2. Indonesia’s Goals for the Reduction of Malnutrition by 2025
Indicator Goal: By 2025i Current Prevalenceii
Target Prevalence in 2019iii
Target Prevalence by 2025
Stunting in children under 5 Reduce by 40% and maintain 37% 28%* 22%
Wasting in children under 5 Reduce to ≤ 5% 12% 9.5% ≤ 5%
Low birth weight Reduce by 30% 10% 8% 7%
Overweight in children under 5 No increase 12% Not set as
target** ≤ 12%
Anemia in women of reproductive age Reduce by 50% 37% 28%*** 19%
Exclusive breastfeeding Increase to at least 50% 37% 50% ≥ 50%
i Goals align with the World Health Assembly Nutrition Targets (WHO 2014). ii Source: Ministry of Health 2013 (Riskesdas) iii National Plan of Action for Food and Nutrition 2015–2019 * The target is children under 2 years. ** The target is 15.4% prevalence of overweight and obesity for age > 18 years. *** The target is pregnant women.

INDONESIA MINIMUM SERVICE STANDARDS FOR NUTRITION: TECHNICAL BRIEF FOR DISTRICT HEALTH ADMINISTRATORS
6
3 Overview of the Nutrition Situation in Indonesia
Neonatal and Infant Mortality As indicated in the 2012 Indonesia Demographic and Health Survey (IDHS) (Statistics Indonesia et al. 2013), the neonatal mortality rate (measured as deaths/1,000 live births) in Indonesia is 19 and the infant mortality rate is 32; these rates have remained virtually unchanged since 2002. Given that nearly 45 percent of child deaths are attributable to various forms of malnutrition, improving nutrition outcomes could have a significant impact on further reducing neonatal and infant mortality rates. Leading causes of neonatal mortality attributable to nutrition are adolescent pregnancy, maternal iron deficiency anemia during pregnancy, delayed initiation of exclusive breastfeeding beyond one hour of birth, and the introduction of pre-lacteal feeds. Neonatal mortality is highest for mothers under 20 years of age (neonatal mortality rate of 34). The leading causes of infant mortality are poor exclusive breastfeeding and complementary feeding practices, poor hygiene and sanitation resulting in repeated infections, and inadequate coverage of immunizations and vitamin A supplementation. The infant mortality rate is 50 for mothers under 20 years of age at the time of delivery, second only to the infant mortality rate in the oldest group (40−49 years), which is 58. Different forms of malnutrition carry different risks of mortality in children and the risk of mortality is greatest for children who are severely acutely malnourished or wasted.
Child Malnutrition In Indonesia, malnutrition among children begins early—among children under 6 months of age, nearly a quarter have chronic malnutrition (stunting or low height for age) and nearly 20 percent have acute malnutrition (wasting or low weight-for-height) (MOH 2013). This early onset of malnutrition in infants is a result of poor maternal nutrition and inadequate breastfeeding practices that slow infants’ physical growth; poor breastfeeding practices also expose infants to repeated infections, which also lead to slow physical growth. As seen in Figure 1, while wasting begins to decline after 6 months, stunting continues to climb to more than 40 percent in children under 5, and peaks among children aged 24–35 months. In addition, low birth weight (LBW) reaches more than a quarter in some regions (Dickey et al. 2010). The national prevalence of LBW in Riskesdas 2013 was 10 percent. These data indicate that both wasting and stunting are influenced by prenatal factors in Indonesia, which are compounded by high rates of disease, poor water and sanitation infrastructure, and poor infant and young child feeding practices, particularly delayed initiation of breastfeeding and low rates of exclusive breastfeeding (Statistics Indonesia et al. 2013). As of 2015, stunting prevalence in Indonesia remains high (Figure 2). The consequences of stunting for Indonesia are far-reaching given the scale of the problem. Not only is stunting an underlying cause of mortality, but it also increases susceptibility to repeated infections and adversely impacts children’s cognitive development, resulting in poorer school performance and consequently lower wages and economic productivity in the future (Black et al. 2013; Chaparro et al. 2014).
Acute malnutrition or wasting is caused by a decrease in food consumption and/or illness resulting in bilateral pitting edema or sudden weight loss. It is defined by the presence of bilateral pitting edema or wasting (low mid-upper arm circumference or low weight-for-height). Chronic malnutrition or stunting is defined by a height-for-age z-score below 2 standard deviations of the median (WHO standards). Stunting is a result of prolonged or repeated episodes of undernutrition, which can start before birth (FANTA 2014).

INDONESIA MINIMUM SERVICE STANDARDS FOR NUTRITION: TECHNICAL BRIEF FOR DISTRICT HEALTH ADMINISTRATORS
7
Figure 1. Nutritional Status of Children by Age (in Months) (Percentages) 2010
Source: National Report on Basic Health Research, Riskesdas, 2010 (Ministry of Health 2010) (data not provided for 2013)
23.929.7
41.1 43.6 40.9 40.5
11.5 12.2
16.520.5 20.3 22.1
19.1 13.8
14.1 11.9 10.5 10.40
20
40
60
80
100
0–5 6–11 12–23 24–35 36–47 48–59
Perc
ent
Stunted
Underweight
Wasted
Figure 2. Nutritional Status of Children by Age (in Months) (Percentages) 2015
23.1
15.112.8
35.3
22.6
11.1
STUNTED UNDERWEIGHT WASTED
0–23 months 24–59 months
Source: MOH 2016
Overnutrition in children under the age of 5 years is also increasing in Indonesia. The prevalence of overweight of children under the age of 2 years is 5.6 percent, and in children ages 23–59 months is 4.9 percent (MOH 2016). To reduce stunting as well as overweight/obesity, interventions need to focus on prevention of malnutrition during the first 1,000 days (from pregnancy through the first 2 years of life) and in adolescent girls, due to the high rate of adolescent pregnancy. Specific areas of focus include reducing and preventing anemia in adolescent girls and women of reproductive age, ensuring adequate nutrition during pregnancy, reducing LBW, and improving infant and young child feeding practices. In addition, strengthened health service delivery is needed throughout the country. For children, expanding access to water and sanitation, promoting improved hygiene practices, and increasing immunization and vitamin A supplementation coverage could further reduce child mortality, mediated through improved nutrition. Providing children with deworming

INDONESIA MINIMUM SERVICE STANDARDS FOR NUTRITION: TECHNICAL BRIEF FOR DISTRICT HEALTH ADMINISTRATORS
8
drugs every 6 months as a preventive measure could reduce both worm infestations and iron deficiency anemia, and increasing coverage and access to oral rehydration salts with the addition of zinc supplements could reduce the severity and duration of diarrheal infections. Promoting exclusive breastfeeding and complementary feeding will also further reduce child mortality rates.
Maternal Mortality The maternal mortality ratio (MMR) (measured as deaths/100,000 live births) rose from 228 in 2007 to 359 in the IDHS 2012. This increase reflects inadequate access to safe delivery services and emergency obstetric care, as well as poor nutrition. For women, preventing adolescent pregnancy, promoting both optimum pre-pregnant weight and weight gain during pregnancy, improving the iron status of women of reproductive age through iron/folic acid supplementation and deworming, and considering calcium supplementation for pregnant women could substantively reduce the maternal morality ratio. This reduction in MMR would be mediated through both optimal maternal age and nutritional status to prevent complications, postpartum hemorrhage, and pre-eclampsia.
Malnutrition among Women of Reproductive Age Maternal underweight is an issue in Indonesia, as 21 percent of women of reproductive age are underweight, with prevalence reaching as high as 48 percent in East Nusa Tenggara (MOH 2013). Undernutrition is particularly high in adolescent girls. According to the 2013 Riskesdas, 38.5 percent of pregnant girls and 46.5 percent of non-pregnant girls 15–19 years of age were underweight (mid-upper arm circumference or MUAC < 23.5) as compared to 21.4 percent and 13.5 percent, respectively, in pregnant and non-pregnant women 30–34 years. In addition, 37 percent of pregnant women were anemic, yet only 33 percent of women took iron/folic acid supplementation for the recommended 90 days or more during their most recent pregnancy (MOH 2013; Statistics Indonesia et al. 2013). Anemia prevalence is similar for pregnant and non-pregnant women in urban areas (36.4 percent and 22.4 percent, respectively) and rural areas (37.8 percent and 23 percent, respectively) (MOH 2013). Although neither the recent IDHS nor Riskesdas reports calcium intake, a 2012 literature review found that women in Indonesia were most likely calcium-deficient as their reported daily intake of calcium was well below the recommended levels of 1,000 mg/day (Hartriyanti et al. 2012). As of 2013, nearly 33 percent of women 35–49 years old were overweight or obese with a body mass index (BMI) of 25 or greater—an 18 percent increase since 2007 (MOH 2013).

INDONESIA MINIMUM SERVICE STANDARDS FOR NUTRITION: TECHNICAL BRIEF FOR DISTRICT HEALTH ADMINISTRATORS
9
4 The Relationship Between Nutrition, Infection, and Mortality
Following several decades of research, the relationship between nutrition, infection, and mortality is well understood and new evidence further demonstrates how and the extent to which mortality results from the interaction between nutrition and infections (see Figure 3). The implication of this relationship is that, to achieve sustained reductions in maternal and child mortality, interventions that reduce and prevent both malnutrition and infections simultaneously are necessary to achieve the greatest impact on reducing mortality. Without synergistic efforts, mortality reductions cannot be sustained or substantive.
The 2013 Lancet series (Black et al. 2013) on maternal and child undernutrition found that nearly 45 percent of all deaths of children under 5 are attributable to the various forms of malnutrition, with stunting, wasting, underweight, and breastfeeding practices accounting for the majority of total under-5 deaths (see Figure 4). In addition, vitamin A supplementation has been found to reduce all-cause mortality in children 6−59 months of age by 24 percent and diarrhea-related mortality by 28 percent; zinc supplementation was found to reduce all-cause mortality in children 12–59 months by 18 percent, the incidence of diarrhea by 13 percent, and the incidence of pneumonia by 19 percent (Black et al. 2013).
Figure 4. Under-5 Child Mortality Attributed to Malnutrition (Percentage)
Source: Black et al. 2013
Infection and malnutrition often occur at the same time, one leading to the other. Poor nutrition results in reduced immunity to infection and increases the severity and duration of an infection, while infection results in the loss of appetite and reduces nutrient absorption, which can produce further weight loss and continued or increased levels of malnutrition. As this cycle repeats itself in a child, growth is compromised, nutritional status worsens, and the risk of mortality continues to rise.
Intrauterine growth restriction and breastfeeding in neonates
19%
Suboptimal breastfeeding12%
Vitamin A deficiency2%
Zinc deficiency2%
Severe wasting8%
Wasting11%
Underweight17%
Stunting17%
Intrauterine growth restriction < 1 month
12%
Figure 3. Interaction between Nutrition and Infection and Its Impact on Childhood Morbidity
Adapted from: United Nations University 1984
INDONESIA MINIMUM SERVICE STANDARDS FOR NUTRITION: TECHNICAL BRIEF FOR DISTRICT HEALTH ADMINISTRATORS
10
One of the most significant pathways to repeated infection, particularly in young children, is through exposure to environmental pathogens as a result of poor hygiene and sanitation. Poor access to and usage of sanitation facilities and clean water as well as poor hygiene practices can substantially impact a child’s growth through increased infection and illness (e.g., diarrhea), but also through reduced absorption of nutrients due to chronic inflammation of a child’s gut. Emerging global evidence indicates that environmental enteric dysfunction, which is a subclinical disorder of the small intestine causing inflammation in the gut, reducing the absorption of nutrients, could be a significant contributor to stunting (Prendergast and Humphrey 2014). Environmental enteric dysfunction is caused by fecal bacteria ingested in large quantities by young children living in conditions of poor sanitation and hygiene (Humphrey 2009). In Figure 5, Humphrey has laid out her hypothesis on how poor sanitation and hygiene, tropical enteropathy, and child undernutrition impact childhood development and survival. As this figure illustrates, it is a complex issue with several critical points at which interventions must occur to break the cycle. One program that is testing aspects of this hypothesis in Bangladesh found that rural Bangladeshi children who had cleaner water, better toilets, and better-equipped handwashing stations had less environmental enteropathy and better linear growth (height for age) (Lin et al. 2013). An analysis of three systematic reviews found that the risk of diarrhea was reduced by 48 percent from handwashing with soap, by 17 percent from improved water quality, and by 36 percent from safe feces disposal (effects are not additive as each overlaps with the other) (Cairncross 2010).
With regard to maternal and neonatal mortality, several nutrition interventions are key to reducing mortality risk in these segments of the population. For pregnant women, adolescence increases the risk of mortality relative to older peers by 17−28 percent; iron-folate supplementation during pregnancy has been shown to reduce the risk of maternal, neonatal, and child mortality; and calcium supplementation for women could substantively reduce the risk of maternal mortality that is a result of pre-eclampsia (Nove et al. 2014; Blanc et al. 2013; Dibley et al. 2011; Imdad and Bhutta 2012). Neonatal mortality can be reduced by increasing the practice of early initiation of exclusive breastfeeding, within one hour of birth (Begum and Dewey 2010).
Table 3 provides a summary of the global evidence of nutrition-related interventions to reduce the risk of maternal, neonatal, infant, and child mortality. Taken together, programmatic efforts that seek to reduce preventable deaths need to focus not only on improving access to health, water, and sanitation, but must also have a robust focus on improving nutrition to be effective.

INDONESIA MINIMUM SERVICE STANDARDS FOR NUTRITION: TECHNICAL BRIEF FOR DISTRICT HEALTH ADMINISTRATORS
11
Figure 5. Model of the Mechanisms from Poor Sanitation and Hygiene to Tropical Enteropathy, Child Undernutrition, and Child Development and Survival
Source: Humphrey 2009

INDONESIA MINIMUM SERVICE STANDARDS FOR NUTRITION: TECHNICAL BRIEF FOR DISTRICT HEALTH ADMINISTRATORS
12
Table 3. Global Evidence of Nutrition-Related Interventions to Reduce the Risks of Maternal, Neonatal, Infant, and Child Mortality Nutrition interventions to reduce maternal mortality and improve birth outcomes
Intervention Evidence
Adolescence
• Prevent adolescent pregnancy
• Pregnant adolescent girls 15−19 years have a 17−28% increased risk of mortality compared to their older peers (women 20−24 years) (Nove et al. 2014; Blanc et al. 2013).
• Adolescent pregnancy is associated with a 50% increased risk of stillbirth and neonatal death, and an increased risk of low birth weight, premature birth, asphyxia, and maternal mortality (Bhutta et al. 2013).
Pregnancy
• Reduce maternal underweight and iron deficiency anemia
• Improve calcium status
• Maternal undernutrition and iron deficiency anemia increase the risk of death of the mother at delivery—accounting for at least 20% of maternal mortality (Black et al. 2008).
• A review of 15 randomized controlled trials suggested that calcium supplementation during pregnancy was associated with a 52% reduction in the incidence of pre-eclampsia, along with a 24% reduction in preterm birth and an increase in birth weight of 85 g (Imdad and Bhutta 2012).
Neonate
• Maternal iron/folic acid supplementation during pregnancy
• Early initiation of breastfeeding
• Neonatal vitamin A supplementation
• Maternal iron/folic acid supplementation reduced the risk of under-5 childhood death by 34% (31% during the neonatal period) (Dibley et al. 2011).
• A systematic review found breastfeeding initiation within 24 hours of birth is associated with a 44–45% reduction in all-cause and infection-related neonatal mortality (Debes et al. 2013).
• Studies in Nepal and Ghana suggest that initiation of breastfeeding within the first hour of birth could prevent 20% of neonatal deaths (Begum and Dewey 2010).
• Evidence from three southern Asian countries indicate that vitamin A given shortly after birth can reduce infant mortality by 21% (Bhutta et al. 2008).
Child Under 2 Years of Age
• Prevent stunting and wasting
• Exclusive breastfeeding
• Appropriate complementary feeding
• Nearly 45% of child deaths are attributable to various forms of undernutrition, 17% of total deaths of children under 5 are attributable to stunting and underweight, and 19% to wasting (moderate and severe) (Black et al. 2013).
• Approximately 45% of neonatal infectious deaths, 30% of diarrheal deaths, and 18% of respiratory deaths among children < 5 years are associated with suboptimal breastfeeding (WHO 2009).
• All-cause mortality is 14 times higher for infants (0−5 months) not breastfed than for exclusively breastfed children (Lambarti et al. 2011).
• Among infants 0–5 months of age, the relative risk of diarrhea mortality was significantly greater in children who were only partially breastfed (relative risk: 4.62) and not breastfed (relative risk: 10.52) as compared to children who were exclusively breastfed (Lambarti et al. 2011).
• It is estimated that 6% of child mortality is attributable to poor complementary feeding practices (Jones et al. 2003).

INDONESIA MINIMUM SERVICE STANDARDS FOR NUTRITION: TECHNICAL BRIEF FOR DISTRICT HEALTH ADMINISTRATORS
13
• Vitamin A supplementation for children 6−59 months
• Zinc supplementation
• A Cochrane review showed that vitamin A supplementation reduced all-cause mortality by 24% and diarrhea-related mortality by 28% in children 6–59 months (Imdad et al. 2010).
• Zinc supplementation reduced all-cause mortality by 18% in children 12–59 months (Imdad et al. 2010).

INDONESIA MINIMUM SERVICE STANDARDS FOR NUTRITION: TECHNICAL BRIEF FOR DISTRICT HEALTH ADMINISTRATORS
14
5 Guidance on Nutrition-Related Minimum Service Standards
There are five categories of population groups for which there are indicators in the MSS for health services in which nutrition is an important component. For each of these categories, the following guidance explains how it relates to nutrition, why it is important to improve nutrition, and what interventions can be implemented in each district in order for Indonesia to achieve its national targets and commitments for nutrition. Additional information on the specific services below can be found in the Indonesia Ministry of Health’s Maternal and Child Health Book (Buku Kesehatan Ibu Dan Anak in Bahasa).
Category 1: Pregnant Women Rationale for Services and Interventions In Indonesia, LBW, which is a risk factor for neonatal deaths, is widely prevalent and continues to affect 24–27 percent of births in regions such as Papua and Papua Barat (Dickey et al. 2010). Between 1997 and 2012, reductions in overall under-5 child mortality far outpaced reductions in neonatal deaths. Low birth weight in Indonesia is a result not only of young maternal age and poor pre-pregnant nutritional status, but also of poor birth spacing, poor dietary intake (quality, quantity, and diversity), inadequate weight gain, high workload, and inadequate rest in pregnancy. Improved maternal nutrition during pregnancy will improve birth outcomes and reduce the prevalence of LBW.
Improved sanitation, hygiene, and food safety behaviors can also improve nutrition outcomes. These are permanent behaviors that mothers and families need to practice consistently every day over the long term to mitigate the risk of infections and promote well-being, particularly for newborns and the youngest children in a household. It is important to begin communicating about water, sanitation, and hygiene practices during pregnancy so that mothers, their partners, and their family members have time to master these behaviors and practice them consistently before the arrival of a newborn.
To improve maternal nutrition during pregnancy, health workers at the puskesmas and posyandu levels, as well as in private practice, would need to be trained regularly on the following services and interventions. Providing each pregnant woman with four antenatal visits that include:
• Improving dietary intake during pregnancy, with an emphasis on increased quantities and improved quality and diet diversity to improve pregnancy weight gain
• Providing counseling on optimal weight gain during pregnancy depending on the woman’s pre-pregnancy weight1 and tracking weight gain during pregnancy
• Providing deworming medication for pregnant women
• Improving iron-folate status during pregnancy through intake of iron-folate supplements
• Promoting adequate rest and reducing workload in pregnancy
• Reducing calcium deficiency during pregnancy to decrease risk of pre-eclampsia
1 Optimal weight gain is 25–35 pounds if the woman is normal weight (18.5–24.9 BMI), 28–40 pounds if she is underweight (< 18.5 BMI), 15–25 pounds if she is overweight (25–29.9 BMI), and 11–20 pounds if she is obese (30+ BMI) by the end of the pregnancy (American College of Obstetricians and Gynecologists 2013).

INDONESIA MINIMUM SERVICE STANDARDS FOR NUTRITION: TECHNICAL BRIEF FOR DISTRICT HEALTH ADMINISTRATORS
15
• Promoting hygiene and food safety practices (see Figure 6 for more details) during pregnancy so mothers and families have time to master these skills before the arrival of a newborn
• Promoting early initiation of exclusive breastfeeding, within one hour of birth, and exclusive breastfeeding for 6 months
• Involving men and families to ensure mothers get adequate antenatal care
Category 2: Women During Delivery Rationale for Services and Interventions
Standard delivery services must include counseling for new mothers on early initiation and exclusive breastfeeding, postpartum nutrition, family planning, and healthy birth spacing. Maternal nutritional status is of critical importance during the postpartum period to support optimal breastfeeding and allow the mother to restore her nutritional status, which is depleted during pregnancy and lactation.
Family planning interventions, through adequate birth spacing, have been shown to reduce the risk of low birth weight and stunting and to decrease infant and maternal mortality. As birth weights increase in a population, nutritional status improves and mortality decreases. As children’s nutritional status improves, so does their cognitive development and performance in school, leading to higher educational attainment and improved earning capacity in adulthood. Those who attain a higher level of education are more likely to use family planning and often marry later and delay childbearing, thus continuing the cycle.
In addition, family planning counseling with older mothers and women is an opportunity to counsel them on improving the nutritional status of their adolescent girls and on delaying the first pregnancy past the age of 19. This will have a huge impact on improving young child nutrition and survival.
To improve maternal nutrition during the postpartum period and decrease infant and maternal mortality, health workers at the puskesmas and posyandu levels, as well as in private practice, would need to be trained regularly on the following services and interventions. • Ensuring standard delivery services include counseling on and support for early initiation and
exclusive breastfeeding, postpartum nutrition, family planning and healthy birth spacing
• Improving dietary intake during the postpartum period, with an emphasis on increased quantities and improved quality and diet diversity to support optimal breastfeeding
• Improving iron-folate status during the postpartum period through intake of iron-folate supplements
• Promoting adequate rest and reducing workload in the postpartum period
• Promoting adequate birth spacing through use of contraception in the postpartum period
• Involving men and families to ensure mothers get adequate delivery services and postpartum care
Category 3: Newborn Babies (Up to 28 Days) Rationale for Services and Interventions
Early initiation of breastfeeding (within one hour of birth) is a lifesaving practice for newborns, but in Indonesia only half of infants are put to the breast within an hour of birth, according to the Nutrition Surveillance 2015, and 45 percent of newborns receive other liquids (pre-lacteals) before receiving breast milk (Riskesdas 2013). More than 66 percent of mothers begin breastfeeding within one day of birth, but this is a high-risk practice that increases the risk of neonatal mortality. Delaying the initiation of breastfeeding and introducing other liquids prior to 6 months of age (including pre-lacteal feeds) increases the risk of disease and death. Research shows that delaying the initiation of

INDONESIA MINIMUM SERVICE STANDARDS FOR NUTRITION: TECHNICAL BRIEF FOR DISTRICT HEALTH ADMINISTRATORS
16
breastfeeding past the first 24 hours can increase the risk of death by 78 percent (Garcia et al. 2011). Importantly, the practice of breastfeeding itself has been shown to protect children from obesity by up to 22 percent. A 2014 meta-analysis found the risk of childhood obesity was 22 percent lower in breastfed children compared to children who were never breastfed (Yan et al. 2014).
LBW and preterm babies are at higher risk of neonatal and infant mortality and morbidity. Studies have shown that kangaroo care—early, continuous, and prolonged skin-to-skin contact between mother and baby—has been shown to be effective for thermal control, breastfeeding, and bonding in all newborn infants, irrespective of setting, weight, gestational age, and clinical conditions (WHO 2003).
To improve neonatal nutrition and decrease mortality, health workers at the puskesmas and posyandu levels, as well as in private practice, would need to be trained regularly on the following services and interventions. • Promoting the Baby-Friendly Hospital Initiative throughout Indonesia
• Promoting early initiation of exclusive breastfeeding, within one hour of birth
• Providing continued support to mothers to maintain exclusive breastfeeding for 6 months
• Discouraging caregivers from giving other liquids (“pre-lacteals”) to newborns before receiving breast milk
• Promoting early, continuous, and prolonged skin-to-skin contact (kangaroo care) between mother and baby (as well as father and baby) at the birth facility and continuing at home
• Promoting optimal hygiene, sanitation, and food safety practices (see Figure 6 for more details) with caregivers and families of newborns
Category 4: Children Under 5 Years of Age Rationale for Services and Interventions
Infant and Young Child Feeding Adequate feeding practices during infancy are critical to ensure optimal nutritional status during the first 2 years of life and are essential to prevent stunting and its long-term impacts. Breastfeeding in particular provides nutritional, immunological, and cognitive benefits. The World Health Organization recommends exclusive breastfeeding for children under 6 months and appropriate feeding for children 6–23 months, including continued breastfeeding, feeding solid/semi-solid food a minimum number of times per day, feeding a minimum number of food groups per day, continued feeding during and after illness, feeding appropriate quantities of food, providing food with appropriate consistency, and feeding nutrient-dense foods (Pan American Health Organization 2003). While almost every child in Indonesia is breastfed (96 percent), exclusive breastfeeding throughout the first 6 months drops to 65 percent, according to Nutrition Surveillance 2015. This is especially important because of the benefits of breastfeeding in reducing risk of infection, improving growth, and reducing risk of childhood obesity.
The complementary feeding period, when food and liquids other than breast milk are introduced into the infant’s diet, constitutes a high-risk period for development of malnutrition and disease, particularly diarrhea. Many aspects of complementary feeding in Indonesia are inadequate—the
Half of women in Indonesia do not breastfeed within an hour of birth and this behavior may be a big contributor to neonatal mortality. Studies have found that early initiation of breastfeeding could prevent around 20 percent of neonatal deaths (Begum and Dewey 2010).

INDONESIA MINIMUM SERVICE STANDARDS FOR NUTRITION: TECHNICAL BRIEF FOR DISTRICT HEALTH ADMINISTRATORS
17
timing of introduction of solid/semi-solid food, the frequency of feeding, the choice of foods, and the way in which they are prepared. Although most infants have begun complementary feeding by 6–8 months of age, the 2012 IDHS indicates that only 58 percent of children 6–23 months consume a diverse diet (minimum dietary diversity) and 37 percent have a minimally acceptable diet—which includes breastfeeding or providing formula or milk; providing foods from four or more groups; and feeding the minimum number of times per day according to age and breastfeeding status. Children in rural areas and in the lowest wealth quintile are less likely to receive adequate dietary diversity and minimum acceptable diets than their urban and higher socioeconomic status peers. There are also important regional variations in infant feeding practices, with a low of 14 percent of breastfed children 6−23 months of age in West Papua receiving the minimum acceptable diet and a high of 45 percent in West Sumatra (see Appendix 1 for more information on child dietary indicators by province).
Optimal Hygiene, Sanitation, and Food Safety One of the most significant pathways to repeated infections, particularly in young children, is through the exposure to environmental pathogens as a result of poor hygiene and sanitation. Poor access to and usage of sanitation facilities and clean water and poor hygiene practices can substantially impact a child’s growth, through increased infection and illness (e.g., diarrhea) but also through reduced absorption of nutrients due to chronic inflammation of a child’s gut. Emerging global evidence indicates that environmental enteric dysfunction (EED), which is a subclinical disorder of the small intestine that causes inflammation in the gut and reduces absorption of nutrients, could be a significant contributor to stunting (Prendergast and Humphrey 2014). EED is caused by fecal bacteria ingested in large quantities by young children living in conditions of poor sanitation and hygiene (Humphrey 2009). Poor sanitation and hygiene, tropical enteropathy, and child undernutrition impact childhood development and survival, which is a complex issue with several critical points at which interventions must occur to break the cycle.
Iron-folic Acid Supplementation, Consumption of Iron-Rich/Fortified Foods, Deworming, and Vitamin A Supplementation Preventing iron deficiency anemia is critical in young children through consumption of iron-rich foods, and iron-folic acid and/or multiple micronutrient supplementation (including multiple micronutrient powders such as “sprinkles”) (FANTA 2016). In settings where the prevalence of anemia in children under 2 or 5 years of age is 20 percent or higher, WHO recommends home fortification of complementary foods with multiple micronutrient powders to improve iron status and reduce anemia among infants and children 6–23 months of age (WHO 2011). Providing children with deworming drugs every 6 months as a preventive measure could reduce both worm infestations and iron deficiency anemia. Vitamin A supplementation has been found to reduce all-cause mortality in children 6−59 months of age by 24 percent and diarrhea-related mortality by 28 percent (Imdad et al. 2010).
Growth Monitoring and Promotion with a Focus on Children Under 2 Up to Children Under 5 Growth monitoring and promotion (GMP) is a process of following the growth of a child compared with a standard through periodic, frequent anthropometric measurements and assessments over time, and providing tailored counseling and follow-up problem solving with caregivers based on growth monitoring results. An undernourished or sick child will have a slower rate of weight gain than a well-nourished, healthy child, and early detection of growth faltering provides an early warning sign and trigger for early action. GMP is designed to assess growth adequacy and identify faltering before a child reaches the status of undernutrition. Based on the results of the growth assessment, health workers encourage good care practices, identify possible problems if growth is

INDONESIA MINIMUM SERVICE STANDARDS FOR NUTRITION: TECHNICAL BRIEF FOR DISTRICT HEALTH ADMINISTRATORS
18
not optimal, suggest doable actions/improved practices and negotiate with caregivers the doable actions that they will try, reinforce participation in community-based health and nutrition activities, and refer to health providers if needed. GMP at the community level can also be used for community mobilization and social action, particularly when growth monitoring data are aggregated and used for community-level assessment and analysis of child malnutrition. Community participation in GMP has the potential to increase community awareness of factors that negatively affect child nutrition and health and result in collective action to address these causes. GMP is also perceived as beneficial because it can provide an entry point for preventive and curative services and can be an integral part of programs that have been associated with significant reductions in malnutrition and mortality (Ashworth et al. 2008).
Identification and Treatment of Acute Malnutrition in Children in High-Risk Areas Providing inpatient treatment for children with severe acute malnutrition (SAM) with medical complications and using community-based approaches to identify and treat moderate acute malnutrition (MAM) and cases of SAM without medical complications has been proven effective. The use of specialized food, in the form of locally fortified corn-soy blended flours and lipid-based nutrient supplements, has proven effective for the treatment of MAM. Similarly, the use of ready-to-use-therapeutic food (RUTF) has proven effective for the treatment of SAM. Key considerations in the types of foods that should be used to treat acute malnutrition are the nutrient composition as well as whether the food is ready for consumption and carries minimal risk of infection. Particularly in the case of severely wasted children, infections can substantially heighten and precipitate the risk of mortality. For this reason, foods that are ready-to-use and pre-packaged carry significant benefits in treating severely wasted children. Lack of hygiene and sanitation within households, especially with regard to food preparation, are significant risk factors in the prevalence of acute malnutrition generally and particularly for severe acute malnutrition. In addition, severely wasted children cannot digest home-cooked foods easily, as their physiological ability to absorb nutrients and digest food is severely impaired (FANTA 2014).
Promoting Optimal Nutrition Care of Sick Children Optimal nutrition care of sick children includes continued feeding and increased fluids during illness; increased feeding after illness; and providing effective treatments for the clinical management of acute diarrhea including oral rehydration therapy (ORT) (using low concentration oral rehydration salts) and routine use of zinc supplementation (at a dosage of 20 mg per day for children older than 6 months or 10 mg per day in those younger than 6 months) for 10–14 days (WHO and UNICEF 2004). Oral rehydration is a well-known and relatively simple treatment approach for managing acute diarrhea by preventing dehydration (Cash et al. 1970). Zinc supplementation has been found to reduce the duration and severity of diarrheal episodes and likelihood of subsequent infections for 2–3 months (Bhutta et al. 2000). Zinc is an important micronutrient for normal growth and development of children both with and without diarrheal disease as it aids in cell growth, immune function, and intestinal transport of water and electrolytes. Children who are deficient are at increased risk of gastrointestinal infections, adverse effects on the structure and function of the gastrointestinal tract, and impaired immune function (WHO 2004). Zinc supplementation was found to reduce all-cause mortality in children 12–59 months by 18 percent, the incidence of diarrhea by 13 percent, and the incidence of pneumonia by 19 percent (Imdad et al. 2010). According to the 2012 IDHS, among children under 5 with diarrhea, 65 percent of caregivers sought treatment during the episode; however, only 47 percent used ORT and the use of zinc supplements was only 1.1 percent nationally, signaling an important opportunity to expand access to both.
INDONESIA MINIMUM SERVICE STANDARDS FOR NUTRITION: TECHNICAL BRIEF FOR DISTRICT HEALTH ADMINISTRATORS
19
Early Childhood Development Recent evidence suggests that integrated nutrition and early childhood development programs can help improve both child development and nutrition outcomes, laying the best foundation for children to achieve their full potential as adults. However, most programs do not yet effectively integrate early childhood development interventions within nutrition and health services targeting children under 2, resulting in a missed opportunity. In addition to adequate nutrition, children need a stimulating environment and social interaction with attentive caregivers to develop sufficiently in all four domains of early childhood development (physical, social, emotional, and cognitive development) to reach their potential (FANTA 2016).
Training Needs To improve health, and specifically nutrition outcomes, among children under 5, health workers at the puskesmas and posyandu levels, as well as in private practice, would need to be trained regularly on the following services and interventions.
Infant and Young Child Feeding • Promoting exclusive breastfeeding on demand for the first 6 months of a child’s life
• Discouraging introducing other liquids prior to 6 months of age
• Promoting adequate dietary intake for lactating women, with an emphasis on increased quantities and improved quality and diet diversity to support optimal breastfeeding
• Promoting timely and appropriate introduction of complementary foods beginning at 6 months, emphasizing diversity, quality, quantity, and frequency of foods; for example, children 6–8 months should have 2–3 meals a day with 1–2 nutritious snacks, while children 9–24 months should have 3–4 meals a day with 1–2 nutritious snacks (see Figure 5 for more details)
• Promoting responsive feeding by minimizing distractions during mealtimes, staying with children until they are done eating, and feeding them until they no longer show interest in a meal (see Figure 5 for more details)
• Involving men and families to promote shared responsibility for young child nutrition at the family and community levels
• Promoting family support for the mother, with an emphasis on time and resources to feed the child
Optimal Hygiene, Sanitation, and Food Safety • Promoting optimal hygiene, sanitation, and food safety practices (see Figure 6 for more details)
Iron-Folic Acid Supplementation, Consumption of Iron-Rich/Fortified Foods, Deworming, and Vitamin A Supplementation • Promoting the consumption of iron-rich foods, and iron-folic acid and/or multiple micronutrient
supplementation (including multiple micronutrient powders such as “sprinkles”) for children under 5
• Providing children with deworming drugs every 6 months as a preventive measure to reduce both worm infestations and iron deficiency anemia
• Providing children under 5 with Vitamin A supplementation to reduce all-cause mortality and diarrhea-related mortality

INDONESIA MINIMUM SERVICE STANDARDS FOR NUTRITION: TECHNICAL BRIEF FOR DISTRICT HEALTH ADMINISTRATORS
20
Growth Monitoring and Promotion with a Focus on Children Under 2 Up to Children Under 5 • Undertaking regular screening and tracking of infant growth (each month for children under 2
and less frequently for children 2–5 years of age) for both underweight and overweight
• Counseling mothers and families on optimal infant feeding practices
Identification and Treatment of Acute Malnutrition in Children in High-Risk Areas • Providing inpatient treatment for children with SAM with medical complications and using
community-based approaches to identify and treat MAM and cases of SAM without medical complications
• Providing RUTF for the treatment of SAM in children under 5
• Providing specialized food, in the form of locally fortified corn-soy blended flours and lipid-based nutrient supplements, for the treatment of MAM in children under 5
Promoting Optimal Nutrition Care of Sick Children • Continued feeding and increased fluids during illness; increased feeding after illness; and
appropriate treatments, such as zinc and ORT for diarrhea
Early Childhood Development • Integrating nutrition and early childhood development programs (which track children’s
developmental milestones before the age of 2) to improve both child development and nutrition outcomes
Category 5: Women of Reproductive Age (15–49 Years Old) Rationale for Services and Interventions Adolescent pregnancy is associated with a 50 percent increased risk of stillbirth and neonatal death, and an increased risk of low birth weight, premature birth, and asphyxia (Bhutta et al. 2013). Adolescence also increases the risk of mortality during pregnancy by 17−28 percent (Nove et al. 2014; Blanc et al. 2013). This is because, relative to their older peers, adolescent girls are persistently more undernourished, further contributing to the high prevalence of maternal malnutrition, poor pregnancy outcomes, and LBW, ultimately leading to young child malnutrition. Data also show that adolescent mothers struggle to provide optimum care for their infants relative to their older peers and that they need more support from family. Enabling adolescent girls to complete secondary education carries multiple benefits, including delaying marriage and first pregnancy, ensuring better nutritional status for them at the onset of pregnancy, and reducing malnutrition in their children in part through greater knowledge, capabilities, and caring capacity.
Iron-folate supplementation during pregnancy (for all ages) and deworming have been shown to reduce the risk of maternal, neonatal, and child mortality by decreasing the prevalence of anemia, which is a leading cause of preventable maternal deaths. Providing women with calcium supplementation could also substantively reduce the risk of maternal mortality that is a result of pre-eclampsia (Nove 2014; Blanc et al. 2013; Dibley et al. 2011; Imdad and Bhutta 2012).
Close child spacing also contributes to mortality and malnutrition among children under 5. Children conceived fewer than 24 months after the birth of the next older sibling have a greater risk of dying and becoming malnourished than children born farther apart (Rutstein 2008). High parity is not only a biological risk for every subsequent birth; it also means young mothers have very little time and resources to provide children under age 2 with optimum care and feeding, resulting in stunting.

INDONESIA MINIMUM SERVICE STANDARDS FOR NUTRITION: TECHNICAL BRIEF FOR DISTRICT HEALTH ADMINISTRATORS
21
Family planning interventions, through adequate birth spacing and limiting family size, have been shown to reduce risk of LBW and stunting and to decrease infant and maternal mortality. As birth weights increase in a population, nutritional status improves and mortality decreases. As children’s nutritional status improves, so do their cognitive development and performance in school, leading to higher educational attainment and improved earning capacity in adulthood. Those who attain a higher level of education are more likely to use family planning and often marry later and delay childbearing, thus continuing the cycle.
Working with obese women to obtain an optimal weight prior to pregnancy has been shown to decrease gestational diabetes mellitus, pre-eclampsia, maternal mortality, and complications from childbirth as well as neonatal and infant mortality and risk of childhood obesity that continues into adolescence and early adulthood (Torlini et al. 2009; Sohlberg et al. 2012; Aviram et al. 2011; Norman and Reynolds 2011; Chen et al. 2009; McGuire et al. 2010; Catalano 2003). Limiting the consumption of carbohydrates, sugar, salt, and fat and attaining optimal weight decreases the risk of chronic diseases such as diabetes and cardiovascular disease (WHO 2016).
To improve nutrition for women of reproductive age, especially in the critical adolescent years, health workers at the puskesmas and posyandu levels, as well as in private practice, would need to be trained regularly on the following services and interventions. • Improving pre-pregnant weight and iron-folate status among women of reproductive age,
especially adolescents
• Working with overweight and obese women of reproductive age to attain an optimal weight and working with all women of reproductive age to limit the consumption of carbohydrates, sugar, salt, and fat and eat a diverse diet of protein-rich and nutrient-dense foods
• Providing deworming medicines and calcium supplementation to women of reproductive age, especially adolescents
• Delaying marriage and first pregnancy past the age of 19
• Promoting secondary education completion for girls and boys
• Increasing use of contraception among married couples, especially adolescents
• Increasing knowledge of modern contraceptive methods among married and unmarried adolescent girls and their families

INDONESIA MINIMUM SERVICE STANDARDS FOR NUTRITION: TECHNICAL BRIEF FOR DISTRICT HEALTH ADMINISTRATORS
22
Figure 6. Nutrition and Water, Sanitation, and Hygiene during the First 1,000 Days

INDONESIA MINIMUM SERVICE STANDARDS FOR NUTRITION: TECHNICAL BRIEF FOR DISTRICT HEALTH ADMINISTRATORS
23
6 Conclusion
In summary, in order to meet 100 percent of indicators outlined in the MSS for pregnant women, women during delivery, newborn babies (up to 28 days), children under the age of 5 years, and women of reproductive age (15–49 years of age) nutrition must be an integral part of health services at the puskesmas and posyandu levels. DHAs, who are accountable for local health service delivery, play a pivotal role in improving nutrition and must also work closely with private sector providers to achieve the targets set by the government.

INDONESIA MINIMUM SERVICE STANDARDS FOR NUTRITION: TECHNICAL BRIEF FOR DISTRICT HEALTH ADMINISTRATORS
24
References
American College of Obstetricians and Gynecologists. 2013. “Weight Gain During Pregnancy. Committee Opinion No. 548.” Obstetrics and Gynecology. 121: 210–2.
Ashworth, A. et al. 2008. “Growth Monitoring and Promotion: Review of Evidence of Impact.” Maternal and Child Nutrition. 4:86–117.
Aviram, A.; M. Hod; and Y. Yogev. 2011. “Maternal Obesity: Implications for Pregnancy Outcome and Long-term Risks—A Link to Maternal Nutrition.” International Journal of Gynecology and Obstetrics. 115(suppl 1): S6–10.
Begum, K.; and K. G. Dewey. 2010. “Impact of Early Initiation of Breastfeeding on Newborn Deaths.” Insight: A & T Technical Brief Issue 1, January. Available at: http://aliveandthrive.org/wp-content/uploads/2014/11/Insight-Issue-1-Impact-of-early-initiation_English.pdf.
Bhutta, Z .A. et al. 2000. “Therapeutic Effects of Oral Zinc in Acute and Persistent Diarrhea in Children in Developing Countries: Pooled Analysis of Randomized Controlled Trials.” American Journal of Clinical Nutrition. 72(6): 1516–22.
Bhutta, Z. A. et al. 2008. “What Works? Interventions for Maternal and Child Undernutrition and Survival.” The Lancet. 371: 417–40.
Bhutta, Z. A. et al. 2013. “Evidence-Based Interventions for Improvement of Maternal and Child Nutrition: What Can Be Done At What Cost?” The Lancet. 382(9890): 452–77.
Black, R. E. et al. 2008. “Maternal and Child Undernutrition: Global and Regional Exposures and Health Consequences.” The Lancet. 371(9608): 243–60.
Black, R. E. et al. 2013. “Maternal and Child Undernutrition and Overweight in Low-Income and Middle-Income Countries.” The Lancet. 382(9890): 427–51.
Blanc, A.; W. Winfrey; and J. Ross. 2013. “New Findings for Maternal Mortality Age Patterns: Aggregated Results for 38 Countries.” PLoS One. 8(4): e59864. doi: 10.1371/journal.pone.0059864.
Cairncross, S. et al. 2010. “Water, Sanitation and Hygiene for the Prevention of Diarrhoea.” International Journal of Epidemiology. 39(suppl 1): i193–205.
Cash, R. A. et al. 1970. “A Clinical Trial of Oral Therapy in a Rural Cholera-Treatment Center.” American Journal of Tropical Medicine and Hygiene. 19(4): 653–6.
Catalano, P. M. 2003. “Obesity and Pregnancy—The Propagation of a Vicious Cycle?” Journal of Clinical Endocrinology and Metabolism. 88: 3505–6.
Chaparro, C.; L. Oot; and K. Sethuraman. 2014. Indonesia Nutrition Profile. Washington, DC: FHI 360/FANTA.
Chen, A.; S. A. Feresu; C. Fernandez; and W. J. Rogan. 2009. “Maternal Obesity and the Risk of Infant Death in the United States.” Epidemiology. 20: 74–81.
Debes, A. K. et al. 2013. “Time to Initiation of Breastfeeding and Neonatal Mortality and Morbidity: A Systematic Review.” BMC Public Health. 13(suppl 3): S19.
Dibley, M. J.; C. R. Titaley; C. D'Este; and K. E. Agho. 2011. “Iron and Folic Acid Supplements in Pregnancy Improve Child Survival in Indonesia.” American Journal of Clinical Nutrition. doi: 10.3945/ajcn.111.022699.
INDONESIA MINIMUM SERVICE STANDARDS FOR NUTRITION: TECHNICAL BRIEF FOR DISTRICT HEALTH ADMINISTRATORS
25
Dickey, V.; S. Boedihardjo; and T. Bardosono. 2010. USAID/Indonesia Nutrition Assessment for 2010 New Project Design. Washington, DC: USAID.
Food and Nutrition Technical Assistance III Project (FANTA). 2014. Managing Acute Malnutrition: A Review of the Evidence and Country Experiences in South Asia and a Recommended Approach for Bangladesh. Washington, DC: FANTA.
———. 2016. Technical Brief: Giving Children the Best Start in Life: Integrating Nutrition and Early Childhood Development Programming within the First 1,000 Days. Washington, DC: FANTA.
Garcia, S. et al. 2011. “Breast-Feeding Initiation Time and Neonatal Mortality Risk among Newborns in South India.” Journal of Perinatology. 31: 397–403.
Hartriyanti, Y. et al. 2012. “Nutrient Intake of Pregnant Women in Indonesia: A Review.” Malaysian Journal of Nutrition. 18(1): 113–24.
Humphrey, J. H. 2009. “Child Undernutrition, Tropical Enteropathy, Toilets, and Handwashing.” The Lancet. 374: 1,032–5.
Imdad, A.; and Z. A. Bhutta 2012. “Effects of Calcium Supplementation during Pregnancy on Maternal, Fetal and Birth Outcomes.” Paediatric and Perinatal Epidemiology. 26(suppl 1): 138–52.
Imdad, A. et al. 2010. “Vitamin A Supplementation for Preventing Morbidity and Mortality in Children From 6 Months to 5 Years of Age.” Cochrane Database of Systematic Reviews. 12. doi: 10.1002/14651858.CD008524.pub2.
Jones, G. et al. 2003. “How Many Child Deaths Can We Prevent This Year?” The Lancet. 362: 65–71.
Kementerian Hukum dan Hak Asasi Manusia–Ministry of Justice and Human Rights. 2009. Republic of Indonesia Law No. 36 year 2009 on Health. Jakarta: Ministry of the State Secretariat.
———. 2011. Republic of Indonesia Law No. 24 Year 2011 on Social Security Agency (Badan Penyelenggara Jaminan Sosial). Jakarta: Ministry of the State Secretariat.
———. 2012. Presidential Instruction No. 33 Year 2012 on Exclusive Breastfeeding. Jakarta: Ministry of the State Secretariat.
———. 2013. Presidential Instruction No. 42 Year 2013 on the National Movement to Accelerate Nutritional Improvement. Jakarta: Ministry of Health.
———. 2014. Presidential Instruction No. 185 Year 2014 on the Acceleration of Supply of Drinking Water and Sanitation. Jakarta: Coordinating Ministry for Human Development and Culture.
———. 2015. Presidential Instruction No. 2 Year 2015 on Five-Year National Development Plan 2015–2019. Jakarta: National Development Planning Agency.
Kementerian Kesehatan–Ministry of Health. 2015. Rencana Strategis Kementerian Kesehatan Tahun 2015–2019. Jakarta: Ministry of Health.
———. 2016. “Nutrition Surveillance and Nutrition Performance Indicator 2015.” In Pocket Book. Jakarta: Ministry of Health.
Kementerian Perencanaan Pembangunan Nasional/Badan Perencanaan Pembangunan Nasional–National Development Planning Agency (BAPPENAS). 2011. National Plan of Action on Food and Nutrition 2011–2015. Jakarta: National Development Planning Agency.

INDONESIA MINIMUM SERVICE STANDARDS FOR NUTRITION: TECHNICAL BRIEF FOR DISTRICT HEALTH ADMINISTRATORS
26
Lamberti, L. M. et al. 2011. “Breastfeeding and the Risk for Diarrhea Morbidity and Mortality.” BMC Public Health. 11(suppl 3): S15.
Lin, A. et al. 2013. “Household Environmental Conditions are Associated with Enteropathy and Impaired Growth in Rural Bangladesh.” American Journal of Tropical Medicine and Hygiene. 89(1): 130–7.
McGuire W.; L. Dyson; and M. Renfrew. 2010. “Maternal Obesity: Consequences for Children, Challenges for Clinicians and Carers.” Seminars in Fetal and Neonatal Medicine. 15: 108–12.
Ministry of Health. 2009. “Changes in Malnutrition from 1989 to 2007 in Indonesia.” In Basic Health Survey, Riskesdas, 2007. Presented at the International Congress on Nutrition, Bangkok, October 4–9.
———. 2010. National Report on Basic Health Research, Riskesdas, 2010. Jakarta: Research and Development Agency for Health. Analysis at: http://www.who.int/nutgrowthdb/database/countries/who_standards/idn_dat.pdf?ua=1.
———. 2013. National Report on Basic Health Research, Riskesdas 2013. Jakarta: Research and Development Agency for Health.
National Development Planning Agency. National Action for Food and Nutrition 2015–2019. Jakarta: National Development Planning Agency.
Norman, J. E.; and R. M. Reynolds. 2011. “The Consequences of Obesity and Excess Weight Gain in Pregnancy.” Proceedings of the Nutrition Society. 70: 450–6.
Nove, A.; Z. Matthews; S. Neal; and A. V. Camacho. 2014. “Maternal Mortality in Adolescents Compared with Women of Other Ages: Evidence from 144 Countries.” Lancet Global Health. 2(3): e155–64.
Pan American Health Organization. 2003. Guiding Principles for Complementary Feeding of the Breastfed Child. Washington, DC: Pan American Health Organization/World Health Organization.
Prendergast, A. J.; and J. H. Humphrey. 2014. “The Stunting Syndrome in Developing Countries.” Paediatrics and International Child Health. 34(4): 250–65.
Rutstein, S. O. 2008. Further Evidence of the Effects of Preceding Birth Intervals on Neonatal, Infant, and Under-Five-Years Mortality and Nutritional Status in Developing Countries: Evidence from the Demographic and Health Surveys Working Papers. DHS Working Paper. Calverton, MD: Macro International.
Sohlberg, S.; O. Stephansson; S. Cnattingius; and A. K. Wikström. 2012. “Maternal Body Mass Index, Height, and Risks of Preeclampsia.” American Journal of Hypertension. 25: 120–5.
Statistics Indonesia (BPS); National Population and Family Planning Board (BKKBN), and Kementerian Kesehatan (Kemenkes—MOH), and ICF International. 2013. Indonesia Demographic and Health Survey 2012. Jakarta: BPS, BKKBN, Kemenkes, and ICF International.
Torloni, M. R. et al. 2009. “Prepregnancy BMI and the Risk of Gestational Diabetes: A Systematic Review of the Literature with Meta-Analysis.” Obesity Review. 10: 194–203.
United Nations University. 1984. Methods for the Evaluation of the Impact of Food and Nutrition Programmes. Tokyo: United Nations University Press.
World Health Organization (WHO). 2003. Kangaroo Mother Care: A Practical Guide. Geneva: WHO.
———. 2009. Global Health Risks Report. Part 2. Geneva: WHO. Available at: http://www.who.int/healthinfo/global_burden_disease/GlobalHealthRisks_report_part2.pdf.
———. 2011. Guideline: Use of Multiple Micronutrient Powders for Home Fortification of Foods Consumed by Infants and Children 6–23 Months of Age. Geneva: WHO.
INDONESIA MINIMUM SERVICE STANDARDS FOR NUTRITION: TECHNICAL BRIEF FOR DISTRICT HEALTH ADMINISTRATORS
27
———. 2014. “Global Targets 2025 to Improve Maternal, Infant and Young Child Nutrition.” Geneva: WHO. Available at: http://www.who.int/nutrition/global-target-2025/en/.
———. 2016. “Report of the Commission on Ending Childhood Obesity.” Geneva: WHO. Available at: http://apps.who.int/iris/bitstream/10665/204176/1/9789241510066_eng.pdf.
WHO and UNICEF. 2004. “Clinical Management of Acute Diarrhoea.” Geneva/New York: World Health Organization/UNICEF. Available at: http://www.who.int/maternal_child_adolescent/documents/who_fch_cah_04_7/en
Yan, J. et al. 2014. “The Association between Breastfeeding and Childhood Obesity: A Meta-Analysis.” BMC Public Health. 14: 1,267.

28
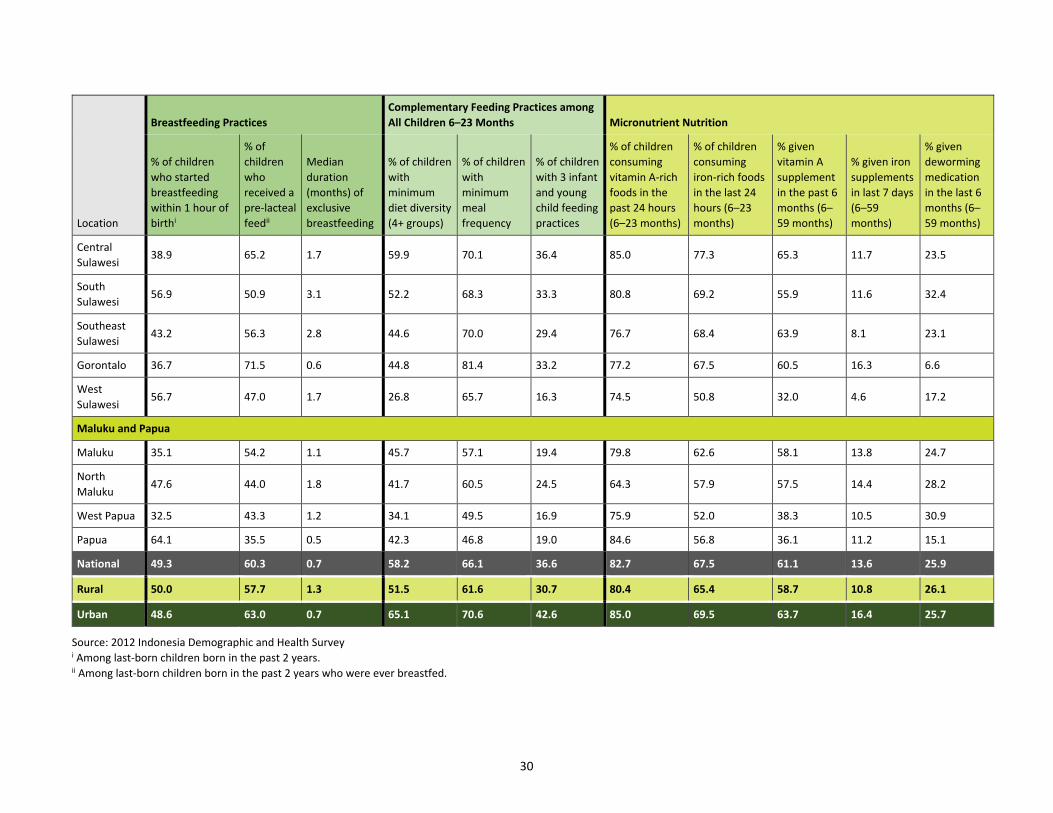
Appendix 1. Child Dietary Indicators by Province
Location
Breastfeeding Practices Complementary Feeding Practices among All Children 6–23 Months Micronutrient Nutrition
% of children who started breastfeeding within 1 hour of birthi
% of children who received a pre-lacteal feedii
Median duration (months) of exclusive breastfeeding
% of children with minimum diet diversity (4+ groups)
% of children with minimum meal frequency
% of children with 3 infant and young child feeding practices
% of children consuming vitamin A-rich foods in the past 24 hours (6–23 months)
% of children consuming iron-rich foods in the last 24 hours (6–23 months)
% given vitamin A supplement in the past 6 months (6–59 months)
% given iron supplements in last 7 days (6–59 months)
% given deworming medication in the last 6 months (6–59 months)
Sumatera
Aceh 46.4 65.8 2.3 49.7 73.6 34.5 71.7 60.5 48.7 8.7 29.4
North Sumatera
17.1 77.7 0.6 55.4 63.7 33.8 82.9 73.1 42.1 9.5 30.2
West Sumatera
38.6 61.5 0.7 68.0 71.5 43.8 82.9 75.3 55.6 8.0 24.1
Riau 26.2 80.5 0.6 61.9 71.6 38.7 83.8 70.1 49.7 6.8 30.3
Jambi 35.7 81.2 2.0 59.1 76.9 42.3 76.4 66.9 50.3 8.1 32.5
South Sumatera
35.9 69.3 0.5 57.3 63.7 33.4 82.4 72.7 49.0 7.8 31.3
Bengkulu 39.8 63.2 2.5 66.3 64.7 38.6 95.3 76.8 58.9 11.3 30.3
Lampung 43.9 62.2 0.5 68.2 71.5 46.9 88.9 76.3 60.6 11.7 34.8
Bangka Belitung
53.4 60.5 0.5 52.9 71.5 35.6 74.8 62.7 48.9 14.6 29.9
Riau Islands 51.5 63.8 0.6 70.4 75.1 41.1 88.9 73.9 56.2 11.0 20.9
Java
DKI Jakarta 60.1 55.1 0.6 74.4 74.1 46.5 87.9 78.3 61.0 25.9 33.7
West Java 56.7 58.2 1.1 55.4 54.6 29.1 82.6 61.8 65.7 15.4 28.7
Central Java 54.9 54.7 2.2 60.2 64.9 39.4 82.1 62.2 70.3 11.3 23.0

29
Location
Breastfeeding Practices Complementary Feeding Practices among All Children 6–23 Months Micronutrient Nutrition
% of children who started breastfeeding within 1 hour of birthi
% of children who received a pre-lacteal feedii
Median duration (months) of exclusive breastfeeding
% of children with minimum diet diversity (4+ groups)
% of children with minimum meal frequency
% of children with 3 infant and young child feeding practices
% of children consuming vitamin A-rich foods in the past 24 hours (6–23 months)
% of children consuming iron-rich foods in the last 24 hours (6–23 months)
% given vitamin A supplement in the past 6 months (6–59 months)
% given iron supplements in last 7 days (6–59 months)
% given deworming medication in the last 6 months (6–59 months)
DI Yogyakarta
55.1 49.1 3.0 71.0 81.2 55.5 88.3 72.3 70.3 15.1 25.7
East Java 52.2 66.9 0.7 63.5 74.7 44.0 85.3 72.3 68.2 20.0 19.5
Banten 49.5 60.7 0.6 63.9 62.1 36.4 85.1 66.3 62.4 13.4 27.2
Bali and Nusa Tenggara
Bali 47.9 64.3 1.0 58.8 73.1 41.3 79.3 64.5 66.9 22.3 13.7
West Nusa Tenggara
73.7 29.0 4.2 42.8 60.7 29.5 82.9 61.4 74.7 12.3 18.1
East Nusa Tenggara
68.2 27.2 2.8 44.3 61.0 27.0 79.0 60.4 59.7 8.9 24.9
Kalimantan
West Kalimantan
39.1 64.6 0.5 51.0 56.8 31.4 77.2 69.0 55.3 12.3 27.8
Central Kalimantan
42.6 68.0 1.6 55.2 76.9 39.3 77.8 67.3 48.8 8.2 26.0
South Kalimantan
46.8 69.0 0.5 56.9 74.2 39.2 79.8 68.8 64.3 12.3 15.5
East Kalimantan
46.9 63.2 0.7 63.1 82.5 50.4 87.0 74.8 68.4 9.9 30.0
Sulawesi
North Sulawesi
40.9 69.4 0.5 50.0 72.5 31.7 71.3 60.4 69.5 13.7 20.1
30
Location
Breastfeeding Practices Complementary Feeding Practices among All Children 6–23 Months Micronutrient Nutrition
% of children who started breastfeeding within 1 hour of birthi
% of children who received a pre-lacteal feedii
Median duration (months) of exclusive breastfeeding
% of children with minimum diet diversity (4+ groups)
% of children with minimum meal frequency
% of children with 3 infant and young child feeding practices
% of children consuming vitamin A-rich foods in the past 24 hours (6–23 months)
% of children consuming iron-rich foods in the last 24 hours (6–23 months)
% given vitamin A supplement in the past 6 months (6–59 months)
% given iron supplements in last 7 days (6–59 months)
% given deworming medication in the last 6 months (6–59 months)
Central Sulawesi
38.9 65.2 1.7 59.9 70.1 36.4 85.0 77.3 65.3 11.7 23.5
South Sulawesi
56.9 50.9 3.1 52.2 68.3 33.3 80.8 69.2 55.9 11.6 32.4
Southeast Sulawesi
43.2 56.3 2.8 44.6 70.0 29.4 76.7 68.4 63.9 8.1 23.1
Gorontalo 36.7 71.5 0.6 44.8 81.4 33.2 77.2 67.5 60.5 16.3 6.6
West Sulawesi
56.7 47.0 1.7 26.8 65.7 16.3 74.5 50.8 32.0 4.6 17.2
Maluku and Papua
Maluku 35.1 54.2 1.1 45.7 57.1 19.4 79.8 62.6 58.1 13.8 24.7
North Maluku
47.6 44.0 1.8 41.7 60.5 24.5 64.3 57.9 57.5 14.4 28.2
West Papua 32.5 43.3 1.2 34.1 49.5 16.9 75.9 52.0 38.3 10.5 30.9
Papua 64.1 35.5 0.5 42.3 46.8 19.0 84.6 56.8 36.1 11.2 15.1
National 49.3 60.3 0.7 58.2 66.1 36.6 82.7 67.5 61.1 13.6 25.9
Rural 50.0 57.7 1.3 51.5 61.6 30.7 80.4 65.4 58.7 10.8 26.1
Urban 48.6 63.0 0.7 65.1 70.6 42.6 85.0 69.5 63.7 16.4 25.7
Source: 2012 Indonesia Demographic and Health Survey i Among last-born children born in the past 2 years. ii Among last-born children born in the past 2 years who were ever breastfed.