bmj open · university muhammadiyah aceh, indonesia. 2department of public health nutrition....
TRANSCRIPT

For peer review only
Estimating the risk of cardiovascular disease using an obese-years metric
Journal: BMJ Open
Manuscript ID: bmjopen-2014-005629
Article Type: Research
Date Submitted by the Author: 05-May-2014
Complete List of Authors: Abdullah, Asnawi; Faculty of Public Health, University Muhammadiyah Aceh, Biostatistics and Population Health; Monash University, Department Epidemiology and Preventive Medicine, Amin, Fauzi; Faculty of Public Health, University Muhammadiyah Aceh, Public Health Nutritrion Stoelwinder, Johannes; Monash University, Epidemiology and Preventive Medicine Tanamas, Stephanie; Baker IDI Heart and Diabetes Institute,
Wolf, Rory; Monash University, Epidemiology and Preventive Medicine Barendregt, Jan; University of Queensland, School of Population Health Peeters, Anna; Baker IDI Heart and Diabetes Institute, Obesity and Population Health; Baker IDI Heart and Diabetes Institute, Clinical Diabetes and Epidemiology
<b>Primary Subject Heading</b>:
Epidemiology
Secondary Subject Heading: Nutrition and metabolism, Public health, Cardiovascular medicine
Keywords: EPIDEMIOLOGY, PUBLIC HEALTH, VASCULAR MEDICINE, Risk management < HEALTH SERVICES ADMINISTRATION & MANAGEMENT, Vascular medicine < INTERNAL MEDICINE, NUTRITION & DIETETICS
For peer review only - http://bmjopen.bmj.com/site/about/guidelines.xhtml
BMJ Open on 2 M
arch 2019 by guest. Protected by copyright.
http://bmjopen.bm
j.com/
BM
J Open: first published as 10.1136/bm
jopen-2014-005629 on 17 Septem
ber 2014. Dow
nloaded from
For peer review only
1
Title:
Estimating the risk of cardiovascular disease using an obese-years metric
Running title:
Obese-years and cardiovascular disease
Authors:
Asnawi Abdullah, PhD1,3;
Fauzi Ali Amin, MPH2;
Johannes Stoelwinder, MD3
Stephanie Tanamas, PhD4
Rory Wolf, PhD3
Jan Barendregt, PhD 5
Anna Peeters, PhD3,4
Authors Address:
1Department of Biostatistics and Population Health. Faculty of Public Health,
University Muhammadiyah Aceh, Indonesia.
2Department of Public Health Nutrition. Faculty of Public Health, University
Muhammadiyah Aceh, Indonesia
3Department of Epidemiology and Preventive Medicine, School of Public Health and
Preventive Medicine, Monash University, Australia;
4Baker IDI Heart and Diabetes Institute, Australia;
5School of Population Health, University Queensland, Australia.
Page 1 of 26
For peer review only - http://bmjopen.bmj.com/site/about/guidelines.xhtml
BMJ Open
123456789101112131415161718192021222324252627282930313233343536373839404142434445464748495051525354555657585960
on 2 March 2019 by guest. P
rotected by copyright.http://bm
jopen.bmj.com
/B
MJ O
pen: first published as 10.1136/bmjopen-2014-005629 on 17 S
eptember 2014. D
ownloaded from
For peer review only
2
Correspondence to: Asnawi Abdullah, Department of Biostatistics and Population
Health, Faculty of Public Health, University of Muhammadiyah Aceh, Jln. Leung Bata,
Batoh, Banda Aceh, Indonesia, 23245. Phone +6265131054, Fax. +6265131053, Email:
Word count:
Text = 2960 words;
Abstract = 300 words; 25 references, Tables 5
Page 2 of 26
For peer review only - http://bmjopen.bmj.com/site/about/guidelines.xhtml
BMJ Open
123456789101112131415161718192021222324252627282930313233343536373839404142434445464748495051525354555657585960
on 2 March 2019 by guest. P
rotected by copyright.http://bm
jopen.bmj.com
/B
MJ O
pen: first published as 10.1136/bmjopen-2014-005629 on 17 S
eptember 2014. D
ownloaded from
For peer review only
3
ABSTRACT:
Objective: To examine the association between obese-years and the risk of
cardiovascular disease.
Study design: Prospective cohort study for approximately 50 years of follow-up.
Setting: Boston, USA
Participants: 5036 participants of the original Framingham Heart Study were
examined.
Methods: The variable of obese-years was calculated by multiplying for each
participant the number of BMI units above 30 kg/m2 by the number of years lived at
that BMI during approximately 50 years of follow-up. The association between
obese-years and the outcome was analyzed by using time-dependent Cox regression
adjusted for potential confounders and compared with the current models using the
Akaike Information Criterion (AIC)
Primary outcome: Cardiovascular diseases.
The Results: The average cumulative obese-years was 63 (range, 2–556 obese-years).
During 138,918 person-years of follow-up, 2753 (55%) participants were diagnosed
with cardiovascular disease. The incidence rates and adjusted hazards ratios (AOR)
for CVD increased with an increase in the number of obese-years. AOR for the
categories 1–24.9, 25–49.9, 50–74.9, and ≥75 obese-years was 1.31 (95% CI: 1.15-
1.48), 1.37 (95% CI: 1.14-1.65), 1.62 (95% CI: 1.32-1.99), and 1.80 (95% CI: 1.54-2.10)
compared with those who never-obese (zero obese-years) respectively. A dose-
response relationship (across the 5 categories) was significant (P trend= 0.001). Effect
of obese-years was higher in males than females. For every 10 unit increase in obese-
years, the AOR of CVD increased by 6% (95% CI 4% to 8%) for males and 3% (95% CI
2% to 4%) for females. The AIC was lowest in the model containing obese-years
compared with models containing either the level of BMI or the duration of obesity
alone.
Conclusions: This study confirm that the obese-years construct is an independent
risk factor for CVD. Obese-years metric is a better predictor the risk of CVD although
it shows similar risk estimation to other two models.
Key Words:
Obesity, BMI, the duration of obesity, obese-years, risk factor, cardiovascular disease
Page 3 of 26
For peer review only - http://bmjopen.bmj.com/site/about/guidelines.xhtml
BMJ Open
123456789101112131415161718192021222324252627282930313233343536373839404142434445464748495051525354555657585960
on 2 March 2019 by guest. P
rotected by copyright.http://bm
jopen.bmj.com
/B
MJ O
pen: first published as 10.1136/bmjopen-2014-005629 on 17 S
eptember 2014. D
ownloaded from
For peer review only
4
Strengths and limitations of this study
• Examining the total effect of obesity by combining the number years lived with
obesity and the level of BMI into a single measurement of obese-years
• A long term prospective cohort study - approximately 50 years followed-up with
biennial measurements of body weight, covariates and health outcomes.
• The analysis takes into account changes in covariates during study follow-up and
adjusted for a large number of potential confounding variables.
• The obese-years construct was developed based on the measurement of BMI. It is
unclear whether using anthropometric measures other than BMI would produce
different results.
• Data used for this study was from a relatively old cohort study, baseline of the
study began in 1948
Page 4 of 26
For peer review only - http://bmjopen.bmj.com/site/about/guidelines.xhtml
BMJ Open
123456789101112131415161718192021222324252627282930313233343536373839404142434445464748495051525354555657585960
on 2 March 2019 by guest. P
rotected by copyright.http://bm
jopen.bmj.com
/B
MJ O
pen: first published as 10.1136/bmjopen-2014-005629 on 17 S
eptember 2014. D
ownloaded from
For peer review only
5
Background
Obesity has been associated with an increased risk of cardiovascular disease (CVD)1 2.
In addition, we have recently demonstrated that the duration of obesity is also risk
factor for type-2 diabetes, independent of level of body mass index (BMI) 3. However,
the quantification of these association by only analysing the level of BMI 4 or the
duration lived with obesity 5 6; this approach may not reflect the total effect of
obesity and may underestimated the risk of CVD associated with obesity.
We recently demonstrated the additional benefit of constructs combining the level of
obesity with the number of years lived with obesity into a single measure of an
obese-years construct is a better predictor the risk of type-2 diabetes than level of
BMI or duration of obesity alone 7. A similar approach that has been used in smoking
studies, examining the adverse health effects associated with the combination of
number of cigarettes or packs smoked per day (degree) and duration of smoking as
a cigarette-years or pack-years 8-10.
The use of a similar construct for body weight, to estimate the risk of CVD has not
been investigated yet. We hypothesized that the obese-years construct is likely a
similar independent risk factor for CVD and would provide an improved estimation of
the risk of future CVD. This study aimed to examine the association between obese-
Page 5 of 26
For peer review only - http://bmjopen.bmj.com/site/about/guidelines.xhtml
BMJ Open
123456789101112131415161718192021222324252627282930313233343536373839404142434445464748495051525354555657585960
on 2 March 2019 by guest. P
rotected by copyright.http://bm
jopen.bmj.com
/B
MJ O
pen: first published as 10.1136/bmjopen-2014-005629 on 17 S
eptember 2014. D
ownloaded from

For peer review only
6
years and risk of CVD and to examine whether the obese-years construct was a
better predictor for risk of CVD than current BMI or duration of obesity alone. We
investigated these objectives using the original Framingham Heart Study, a long term
prospective cohort study where body weight, health outcomes and other covariates
were measured regularly for almost 50 years 11.
METHODS
Data source
We used data from the original Framingham Heart Study (FHS) 12. In this prospective
cohort study, 5,209 participants (aged 28–62 years at the time of enrollment) were
examined regularly at 2-years interval for approximately 50 years from 1948. For the
purpose of this study, only participants who were free from CVD (any types), cancer
and type-2 diabetes at baseline included in the analysis (n = 5,036).
Variables: measurement, missing and imputation
Most of variables in the FHS was measured regularly at every two-years interval,
including body weight, height, demographic variables, health behaviors, and health
outcomes (including cardiovascular disease) 11. However some values are missing by
design where variables were not collected at every examination. For example the
variables of current smoking status was not recorded at four examinations (2, 3, 6
and 17), cholesterol was not measured at seven examinations (11, 12, 17-20 and 22),
Page 6 of 26
For peer review only - http://bmjopen.bmj.com/site/about/guidelines.xhtml
BMJ Open
123456789101112131415161718192021222324252627282930313233343536373839404142434445464748495051525354555657585960
on 2 March 2019 by guest. P
rotected by copyright.http://bm
jopen.bmj.com
/B
MJ O
pen: first published as 10.1136/bmjopen-2014-005629 on 17 S
eptember 2014. D
ownloaded from
For peer review only
7
alcohol consumption was measured only in eight examinations (2, 4, 7, 19, 20–23),
and physical activity was measured only at four examinations (4, 11, 12, and 19). For
this circumstance, the nearest measured value of the covariate was used in our
analysis. Another circumstance, the missing values occur intermittently missing one
or more values during study follow-up; for example body weight and hence BMI. In
this case missing values for BMI were imputed with a conditional mean estimated by
a multiple linear regression model using age at prior exam, sex and several
transformations of the previously measured BMI (BMI, log BMI, BMI squared and BMI
as a categorical variable). Methods of measurement of these variables have been
described in detail elsewhere 5 7.
The level of obesity, duration and obese-years measurement
A participant was considered obese at a given examination if their BMI was greater
than or equal to 30 kg/m2. The level of obesity was defined as follows: (1) if BMI < 30
kg/m2, the level was zero; and (2) if BMI ≥ 30 kg/m2, the level was BMI minus 29
kg/m2. For example, if BMI was 35 kg/m2, the level was 6 (35 – 29) obese units.
The duration of obesity was defined using a similar definition as has been described
previously 5. The duration of obesity was calculated for those individuals with at least
two consecutive occurrences of obesity (which implies at least two years of being
Page 7 of 26
For peer review only - http://bmjopen.bmj.com/site/about/guidelines.xhtml
BMJ Open
123456789101112131415161718192021222324252627282930313233343536373839404142434445464748495051525354555657585960
on 2 March 2019 by guest. P
rotected by copyright.http://bm
jopen.bmj.com
/B
MJ O
pen: first published as 10.1136/bmjopen-2014-005629 on 17 S
eptember 2014. D
ownloaded from
For peer review only
8
continuously obese), to avoid the potential misclassification of body weight, either
due to measurement error or fluctuations between the borderline of the ‘overweight’
category or the ‘obese’ category. For those individuals without two consecutive
obesity occurrences, duration was considered to be zero at all exams. For those
individuals with two consecutive obesity occurrences the beginning of their obesity
duration interval was defined as the date of the first of these two examinations and
from that time, the individual was considered to be continuously obese until either
the first of two consecutive non-obese examinations, or death, or the end of follow-
up at examination 24. The duration increased incrementally at each exam according
to the time (in years) between the current exam and the first obese examination.
Individuals could have multiple periods of obesity duration during follow-up.
The level of obesity and the duration of obesity then was combined into a single
variable called obese-years. The variable was calculated at each examination as the
defined level of obesity (in “obese units”) multiplied by the defined duration of
obesity (in years). The cumulative number of obese-years was calculated at each
examination as a sum of all obese-year “exposures” up to and including that
examination as has been illustrated in the previous paper7
Page 8 of 26
For peer review only - http://bmjopen.bmj.com/site/about/guidelines.xhtml
BMJ Open
123456789101112131415161718192021222324252627282930313233343536373839404142434445464748495051525354555657585960
on 2 March 2019 by guest. P
rotected by copyright.http://bm
jopen.bmj.com
/B
MJ O
pen: first published as 10.1136/bmjopen-2014-005629 on 17 S
eptember 2014. D
ownloaded from
For peer review only
9
Measurement of the outcome and time to event
The main outcome of interest in this study was CVD incident (the first event of any
type of CVD; defined as a composite of coronary heart disease (CHD),
cerebrovascular accident (CVA), peripheral artery disease, and congestive heart
failure (CHF)13. Additional outcomes are individual types of CVD: hard CVD, CHD,
CVA, and CHF. Hard CVD defined as a composite of hard CHD (coronary death,
myocardial infarction), stroke (fatal and nonfatal), peripheral artery disease and heart
failure. In the FHS, the criteria for each cardiovascular outcome during follow-up
were standardized 14 and a panel of Framingham investigators made the decision
regarding diagnosis. CHD includes the diagnoses of (1) angina pectoris, evidenced by
a typical history of chest pain on a physician-administered questionnaire; (2)
myocardial infarction, determined by specified electrocardiographic changes,
diagnostic elevation of serum enzymes with prolonged ischemic chest pain, or
autopsy; (3) coronary insufficiency, defined as prolonged ischemic chest pain
accompanied by transient ischemic abnormalities on the ECG; and (4) sudden (in less
than 1 hour) or non-sudden coronary death. CHF was indicated when at least two
major or one major and two minor diagnostic conditions existed concurrently upon
examination.
Time to event was measured as the time until the date a participant was diagnosed
as having cardiovascular disease. Individuals who died or reached the end of the
Page 9 of 26
For peer review only - http://bmjopen.bmj.com/site/about/guidelines.xhtml
BMJ Open
123456789101112131415161718192021222324252627282930313233343536373839404142434445464748495051525354555657585960
on 2 March 2019 by guest. P
rotected by copyright.http://bm
jopen.bmj.com
/B
MJ O
pen: first published as 10.1136/bmjopen-2014-005629 on 17 S
eptember 2014. D
ownloaded from
For peer review only
10
follow-up (examination 24) before developing CVD were censored at date of death
or examination 24, respectively.
Data analysis
To model the relationship between the various measures of obesity and risk of CVD,
a dynamic survival model4 (time-dependent Cox regression model)15 16 was used. The
demographic and health behavior variables included in the analysis were age, sex,
education level, country of birth, marital status, smoking status, alcohol consumption
(ounces/month), and physical activity. Most of these variables included in the model
were time-varying, except for sex, age (at baseline) and country of birth.
The obese-years construct was analysed both as a continuous and as a categorical
variable using a similar categories as using in the previous study 7 for comparison
purpose. For continuous analyses, hazard ratios were presented per 10 obese-years.
For categorical, those who never obese during study follow-up (zero obese-years)
was assigned as a comparator. Those who values of obese-years within the study
follow-up period, then obese-years was grouped into short, medium and long
periods representing 1-24.9, 25-49.9, 50-74.9 and >=75 obese-years. Hazard ratios
were presented, both as crude hazard ratios and as multivariate-adjusted hazard
ratios for both continuous and categorical variable. Three models of analysis were
Page 10 of 26
For peer review only - http://bmjopen.bmj.com/site/about/guidelines.xhtml
BMJ Open
123456789101112131415161718192021222324252627282930313233343536373839404142434445464748495051525354555657585960
on 2 March 2019 by guest. P
rotected by copyright.http://bm
jopen.bmj.com
/B
MJ O
pen: first published as 10.1136/bmjopen-2014-005629 on 17 S
eptember 2014. D
ownloaded from
For peer review only
11
used to examine the change in hazard ratios associated with the addition of different
confounding variables. Model 1 adjusted for age. Model 2 adjusted for age, sex,
marital status, educational level and country of birth. Model 3 includes all variables in
model 2 plus health behavior variables of smoking status, alcohol consumption and
physical activity and this model was considered the primary model of the study. The
analyses were additionally stratified by sex and a test for interaction between sex and
obese-years was performed for all models.
To compare the predictive value of obesity level, obesity duration and obese-years
construct, each of these three variables were divided into an equal number of
categories. One group was created for those who were never obese (BMI less than 30
kg/m2) as a reference. For those with obesity, ten deciles categories were created.
The goodness of fit of the models incorporating each of the three variables was
compared using Akaike's information criterion (AIC), computed as –2(log-likelihood)
+ 2 (number of estimated parameters); with a lower AIC indicating a better fit 17. All
analyses were performed using the Stata statistical software package version 11.0
(StataCorp, College Station, TX, USA) 18.
Page 11 of 26
For peer review only - http://bmjopen.bmj.com/site/about/guidelines.xhtml
BMJ Open
123456789101112131415161718192021222324252627282930313233343536373839404142434445464748495051525354555657585960
on 2 March 2019 by guest. P
rotected by copyright.http://bm
jopen.bmj.com
/B
MJ O
pen: first published as 10.1136/bmjopen-2014-005629 on 17 S
eptember 2014. D
ownloaded from
For peer review only
12
Sensitivity analyses
A sensitivity analysis was performed to examine whether the association might be
influenced by the imputation method for missing BMI; specifically, an analysis was
performed that included only participants with no missing values of BMI in any
examinations. The effect of the duration of obesity prior to baseline was tested by
performing extra analyses that excluded those who were obese at baseline (no =
576).
RESULTS
Characteristics of the Respondents
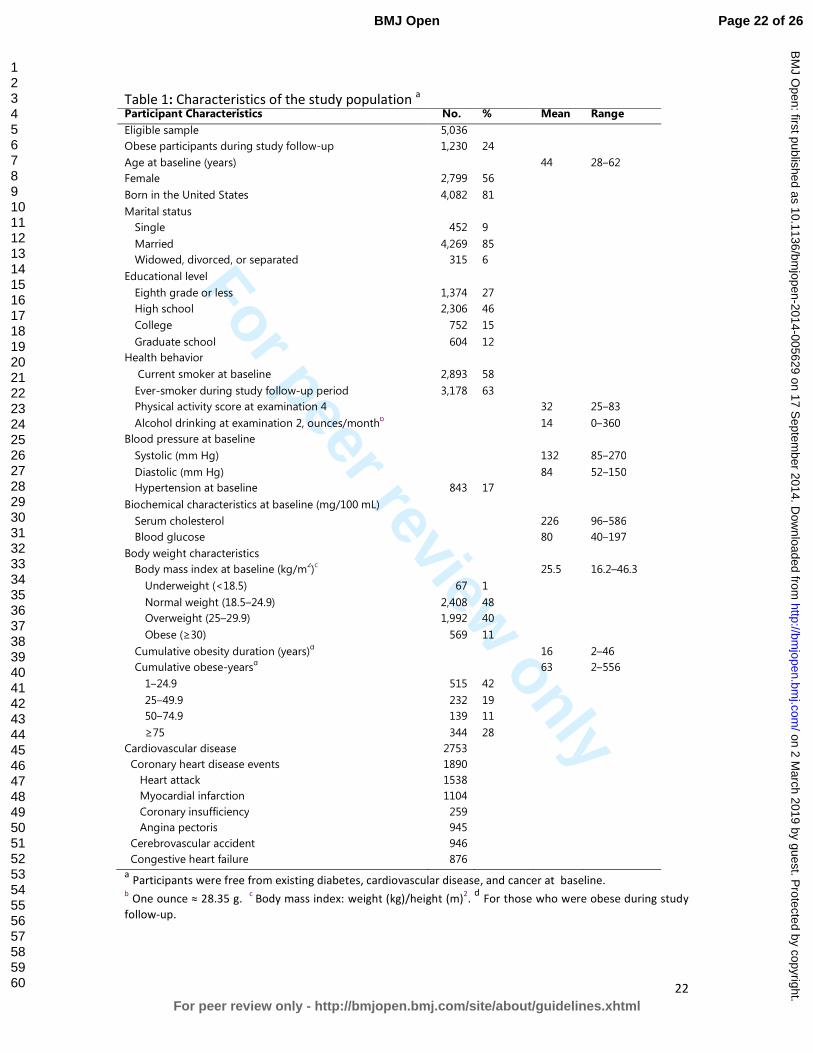
Of the 5,036 eligible study participants, 1230 (24%) participants were obese for at
least 2 consecutive examinations during the study follow-up. Mean cumulative
duration of obesity was approximately 16 years (range, 2–46 years), and the mean
cumulative obese-years was 63 (range, 2–556 obese-years). 2753 (55%) participants
were diagnosed with cardiovascular disease over approximately during 138,918
person-years of follow-up (Table 1).
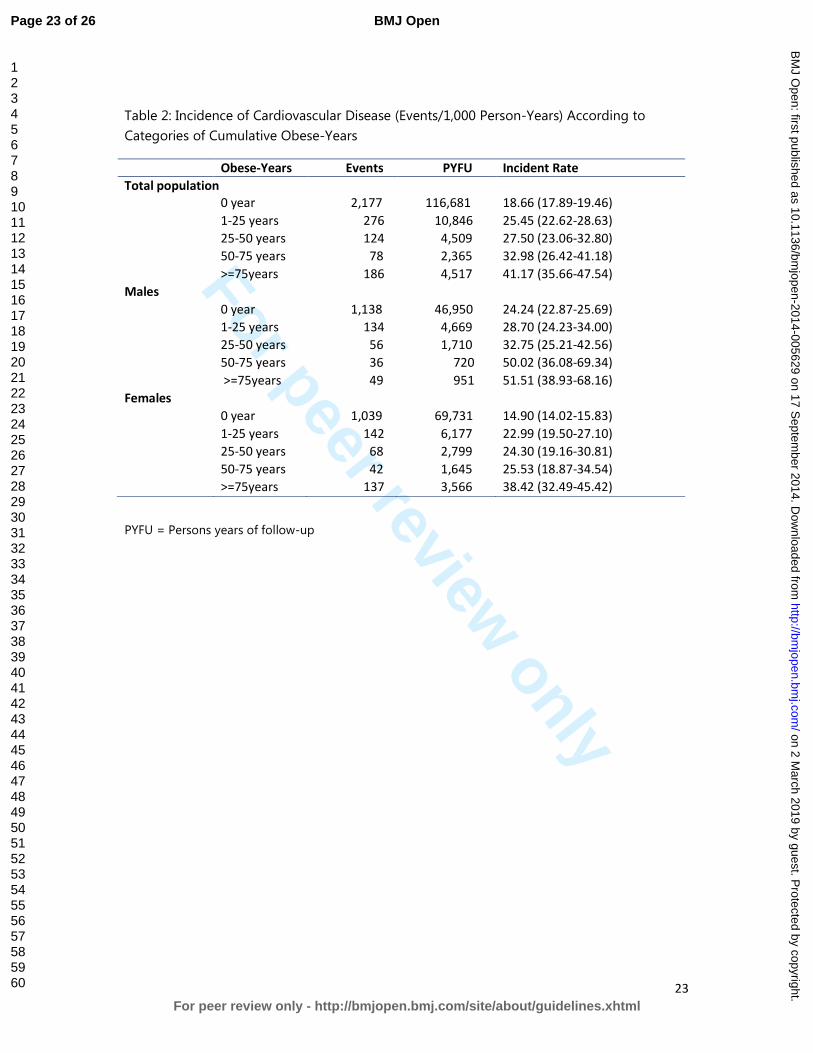
Incidence and Hazards Ratios of Cardiovascular Disease
The incidence rates and adjusted hazards ratios for CVD increased with an increase in
the number of obese-years (Table 2 and Table 3). In the primary model (Model 3) for
Page 12 of 26
For peer review only - http://bmjopen.bmj.com/site/about/guidelines.xhtml
BMJ Open
123456789101112131415161718192021222324252627282930313233343536373839404142434445464748495051525354555657585960
on 2 March 2019 by guest. P
rotected by copyright.http://bm
jopen.bmj.com
/B
MJ O
pen: first published as 10.1136/bmjopen-2014-005629 on 17 S
eptember 2014. D
ownloaded from
For peer review only
13
total population, the adjusted hazard ratios for the categories 1–24.9, 25–49.9, 50–
74.9, and ≥75 obese-years for total population was 1.31 (95% CI: 1.15-1.48), 1.37
(95% CI: 1.14-1.65), 1.62 (95% CI: 1.32-1.99), and 1.80 (95% CI: 1.54-2.10) compared
with those who never-obese (zero obese-years) respectively. A dose-response
relationship (across the 5 categories) was significant (P trend= 0.001). For continues
analysis, every 10 unit increase in obese-years, the adjusted hazard ratios for CVD in
the total population increased by 4% (95% CI 3% - 4%) (Table 4). There were no
significant interactions between obese-years categories and sex and smoking status
but there was evidence of an interaction between obese-years as a continuous
variable and each of sex (P value = 0.01). Effect of obese-years was higher in males
than females.
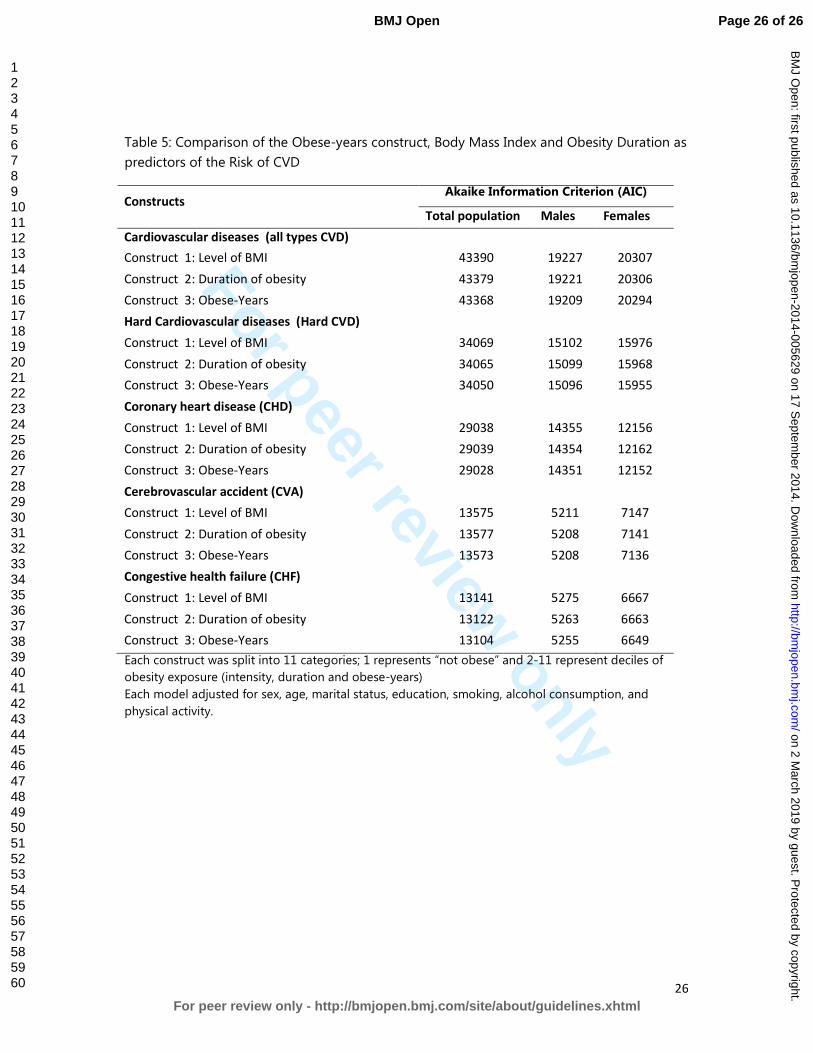
Comparing obesity constructs and Akaike's Information Criterion (AIC),
Table 5 demonstrates the risk of CVD for each of the three different constructs for
obesity: level of obesity (based on BMI), duration of obesity, and the obese-years
construct as additive effects. Each construct was analysed in a separate model and
the strength of association was compared using the Akaike Information Criterion
(AIC). In all outcomes, the AIC was lowest in the construct of obese-years compared
with the other two constructs both in analysis by total population and by sex.
Page 13 of 26
For peer review only - http://bmjopen.bmj.com/site/about/guidelines.xhtml
BMJ Open
123456789101112131415161718192021222324252627282930313233343536373839404142434445464748495051525354555657585960
on 2 March 2019 by guest. P
rotected by copyright.http://bm
jopen.bmj.com
/B
MJ O
pen: first published as 10.1136/bmjopen-2014-005629 on 17 S
eptember 2014. D
ownloaded from
For peer review only
14
Sensitivity analysis
The sensitivity analyses showed that the association between obese-years and risk of
CVD was similar between a complete case analysis and the analysis using imputed
missing values for BMI. Exclusion of participants who had no record of body mass
index at baseline has no change in adjusted hazard ratio, but exclusion of those who
were obese at baseline showed only a slightly lower adjusted hazard ratio: 1.03 (95%
CI: 1.01-1.05)
DISCUSSION
This study found that the approach of measuring the total effect of obesity by
combining the level and the duration of obesity into a single metric of obese-years,
is a stronger predictor of the risk of CVD than using the duration of obesity or the
intensity of obesity alone. A clear dose-response relation between obese-years and
the risk of CVD was observed. The stronger effect was found in males than females
Although the hazard ratios were very similar between three different constructs and
it is not possible to perform a statistical comparison of discrimination between the
models due to the fact that they are non-nested, the AIC does tell us that combining
level of obesity and the duration into a single construct of obese-years provides us
with more discriminative power than a model with level of obesity based on BMI or
Page 14 of 26
For peer review only - http://bmjopen.bmj.com/site/about/guidelines.xhtml
BMJ Open
123456789101112131415161718192021222324252627282930313233343536373839404142434445464748495051525354555657585960
on 2 March 2019 by guest. P
rotected by copyright.http://bm
jopen.bmj.com
/B
MJ O
pen: first published as 10.1136/bmjopen-2014-005629 on 17 S
eptember 2014. D
ownloaded from
For peer review only
15
obesity duration alone. This finding has important implications for future studies of
the total health impact associated with obesity that should be taken into account
both the impact of obesity level and changes in the duration of obesity.
There are different ways to operationalize the impact of excess weight over time. A
recent systematic review identified at least four models: additive models, duration-
of-obesity model, additive-weight-change model and interactive model 19. In
addition to these models, the obese-year model confirms that analyzing the
combined effect of the duration and the level of obesity as a predictor of the
cardiovascular is worthwhile. Such approaches add information over and above
simply the level of excess weight or length of time with obesity. As has been argued
previously 7 other potential additions to this analysis is examining the excess body
weight as higher than 25 kg/m2.
The finding is derived from analysis of a long term prospective cohort study with
biennial measurements of body weight, covariates and health outcomes which
enabled us to analyze change in level of obesity and the duration of obesity over
long term period. The analysis take into account changes in covariates, such as
smoking status, alcohol consumption and physical activity and adjusted for a large
number of potential confounding variables. However, some potential confounders,
Page 15 of 26
For peer review only - http://bmjopen.bmj.com/site/about/guidelines.xhtml
BMJ Open
123456789101112131415161718192021222324252627282930313233343536373839404142434445464748495051525354555657585960
on 2 March 2019 by guest. P
rotected by copyright.http://bm
jopen.bmj.com
/B
MJ O
pen: first published as 10.1136/bmjopen-2014-005629 on 17 S
eptember 2014. D
ownloaded from
For peer review only
16
such as diet, were not collected consistently in the original Framingham Heart Study
and therefore have not been adjusted for in this study.
As has been described elsewhere 7, the limitation of this analysis might related the
population of study using a relatively old cohort study of the original Framingham
Heart Study that began in 1948, and the prevalence rates of obesity and
cardiovascular disease were relatively low at that time (in the 1950s was below
10%)20. Therefore some people argued the results of this study might not reflect the
current population, where the prevalence of obesity is markedly higher than 50 years
ago. In 2008 alone, the prevalence of obesity among adults in the United States was
more than 30%21. Moreover, the contemporary obesity epidemic is also characterized
by a much earlier onset of obesity, which should result in even longer exposure by
the time today’s obese generation of children reach the age of our studied cohort. In
our study, the average age at onset of obesity was approximately 50 years, and the
average number of years lived with obesity was approximately 13 years but, in
today’s society, the average age at onset of obesity is likely to be more than 10 years
earlier than in previous decades 22. However, our results indicate that obese-years is
still valid and is a better tool than level of BMI or duration alone. If further analysis is
conducted, the association between obese-years and CVD could be even stronger
today since the exposure to obesity is now greater than it was.
Page 16 of 26
For peer review only - http://bmjopen.bmj.com/site/about/guidelines.xhtml
BMJ Open
123456789101112131415161718192021222324252627282930313233343536373839404142434445464748495051525354555657585960
on 2 March 2019 by guest. P
rotected by copyright.http://bm
jopen.bmj.com
/B
MJ O
pen: first published as 10.1136/bmjopen-2014-005629 on 17 S
eptember 2014. D
ownloaded from
For peer review only
17
The obese-years construct in this study was based on the measurement of BMI. It is
unclear whether using anthropometric measures other than BMI would produce
different results. Although a recent meta-analysis study has showed that BMI, waist
circumference (WC), and the waist/hip ratio (WHR) to each estimate a similar risk,
particularly type-2 diabetes 23; it is still worthy to explore the relationship between
obese-years and risk of CVD using WC or WHR.
As discussed in our previous study 7, the obese-years metric was developed based on
assumption that level and duration have a similar impact, an assumption that has
been used for the concept of pack-years in smoking studies. In some smoking
studies it was highlighted that for certain health outcomes, the effect of the duration
was more important than intensity 24, while in others, duration was not significant
after adjustment for intensity 25. As this is a new concept in obesity studies, it
requires further exploration. The notion that obese-years is only “switched on” when
BMI reaches 30 kg/m2 is crude, although it does find a parallel in pack-years for
smoking which is a construct that ignores any effects of passive smoking.
This findings demonstrate one again that it is important to consider not only the
level of obesity but also the duration of obesity and its combination when examining
the association between obesity and the risk of chronic disease. This effect is likely to
Page 17 of 26
For peer review only - http://bmjopen.bmj.com/site/about/guidelines.xhtml
BMJ Open
123456789101112131415161718192021222324252627282930313233343536373839404142434445464748495051525354555657585960
on 2 March 2019 by guest. P
rotected by copyright.http://bm
jopen.bmj.com
/B
MJ O
pen: first published as 10.1136/bmjopen-2014-005629 on 17 S
eptember 2014. D
ownloaded from

For peer review only
18
be because account is taken of the cumulative damage of obesity on body systems,
and consequently is likely to be applicable to other chronic diseases. However,
further investigations are recommended to undertaken, of other possible
intensity/duration constructs of obesity such as considering the effect of BMI above
25 kg/m2, and of relationships between obese-years and other chronic diseases and
mortality.
CONCLUSION
This study demonstrates the importance of measuring total effect of obesity
combining both the level and the duration of obesity when estimating the risk of
cardiovascular disease associated with obesity. The obese-years construct might
takes into account of the cumulative damage of obesity on body systems, therefore
provides better estimation the risk of CVD than level or the duration of obesity alone.
This approach of examining total effect of obesity is suggested to use in measuring
the burden of obesity related diseases in the community.
CONFLICT OF INTEREST:
None declared.
Page 18 of 26
For peer review only - http://bmjopen.bmj.com/site/about/guidelines.xhtml
BMJ Open
123456789101112131415161718192021222324252627282930313233343536373839404142434445464748495051525354555657585960
on 2 March 2019 by guest. P
rotected by copyright.http://bm
jopen.bmj.com
/B
MJ O
pen: first published as 10.1136/bmjopen-2014-005629 on 17 S
eptember 2014. D
ownloaded from
For peer review only
19
ACKNOWLEDGMENTS
The authors thank the Framingham Heart Study investigators for granting them
permission to use their data set for this study (the Framingham Heart Study is
conducted and supported by the National Heart, Lung, and Blood Institute (NHLBI) in
collaboration with study investigators). This article was prepared by using a limited-
access data set obtained from the NHLBI and does not necessarily reflect the
opinions or views of the Framingham Heart Study or the NHLBI.
CONTRIBUTORS
Author AA developed the analytical techniques of study, performed data analysis,
interpretation, drafting of the article and prepared the final version for publication;
FAA performed data analysis and interpretation of data; JS, ST, and JB helped review
the data analysis and reviewed the article; RW contributed to the study design and
reviewing of the article; and AP supervised the implementation of the study,
designed the study’s analytic strategy, and reviewing of the article.
SOURCES OF FUNDING
A. A. and F.A.A. were supported by an Indonesian Danone institutional research grant
2012. A. P. and S. T. by the NHMRC grant.
COMPETING INTERESTS
None
DATA SHARING STATEMENT
No additional data available
Page 19 of 26
For peer review only - http://bmjopen.bmj.com/site/about/guidelines.xhtml
BMJ Open
123456789101112131415161718192021222324252627282930313233343536373839404142434445464748495051525354555657585960
on 2 March 2019 by guest. P
rotected by copyright.http://bm
jopen.bmj.com
/B
MJ O
pen: first published as 10.1136/bmjopen-2014-005629 on 17 S
eptember 2014. D
ownloaded from
For peer review only
20
REFERENCES
1. Hubert HB, Feinleib M, McNamara PM, et al. Obesity as an independent risk factor
for cardiovascular disease: A 26-year follow-up of participants in the Framingham
Heart Study. Circulation 1983;67(5):968-77.
2. Morrison JA. Obesity and cardiovascular disease risk factors in Black and White
girls: The NHLBI Growth and Health Study. Am J Public Health 1992;82(12):1613-
20.
3. Abdullah A., Stoelwinder A., De Courten M., et al. The Duration of Obesity and the
Risk of Cardiovascular Disease. The Conference on Clinical Epidemiology and
Evidence-Based Medicine in Global Perspective 27-28 November. Bali, Indonesia,
2010.
4. He J, McGee D, Niu X, et al. Examining the dynamic association of BMI and
mortality in the Framingham Heart Study. Int J Environ Res Public Health
2009;6(12):3115-26.
5. Abdullah A, Stoelwinder J, Shortreed S, et al. The duration of obesity and the risk of
type 2 diabetes. Public Health Nutr 2011;14(1):119-26.
6. Abdullah A, Wolfe R, Stoelwinder JU, et al. The number of years lived with obesity
and the risk of all-cause and cause-specific mortality. Int J Epidemiol
2011;40(4):985-96.
7. Abdullah A, Wolfe R, Mannan H, et al. Epidemiologic merit of obese-years, the
combination of degree and duration of obesity. Am J Epidemiol 2012;176(2):99-
107.
8. Leffondre K, Abrahamowicz M, Siemiatycki J, et al. Modeling smoking history: a
comparison of different approaches. Am J Epidemiol 2002;156(9):813-23.
9. Neuner B, Wellmann J, Dasch B, et al. Modeling smoking history: a comparison of
different approaches in the MARS study on age-related maculopathy. Ann
Epidemiol 2007;17(8):615-21.
10. Dietrich T, Hoffmann K. A comprehensive index for the modeling of smoking
history in periodontal research. J Dent Res 2004;83(11):859-63.
11. Dawber T. The Framingham study: the epidemiology of atherosclerotic disease.
Cambridge, Mass.: Harvard University Press, 1980.
12. National Heart L, and Blood Institute, Boston University. The Framingham Heart
Study: 50 years of research success. Framingham, MA: Framingham Heart Study;
2012. (http://www.nhlbi.nih.gov/about/framingham/index.html). (Accessed
November 5, 2012).
13. D'Agostino RB, Sr., Vasan RS, Pencina MJ, et al. General cardiovascular risk profile
for use in primary care: the Framingham Heart Study. Circulation
2008;117(6):743-53.
14. Wilson PWF, D'Agostino RB, Sullivan L, et al. Overweight and obesity as
determinants of cardiovascular risk: the Framingham experience. Arch Intern Med
2002;162(16):1867-72.
Page 20 of 26
For peer review only - http://bmjopen.bmj.com/site/about/guidelines.xhtml
BMJ Open
123456789101112131415161718192021222324252627282930313233343536373839404142434445464748495051525354555657585960
on 2 March 2019 by guest. P
rotected by copyright.http://bm
jopen.bmj.com
/B
MJ O
pen: first published as 10.1136/bmjopen-2014-005629 on 17 S
eptember 2014. D
ownloaded from

For peer review only
21
15. Parmar MKB, Machin D. Survival analysis : a practical approach. Chichester ; New
York: J. Wiley, 1995.
16. Fisher LD, Lin DY. Time-Dependent Covariates in The Cox Proportional-Hazards
Regression Model. Annual Review of Public Health 1999;20(1):145-57.
17. Akaike H. A new look at the statistical model identification. IEEE Transactions on
Automatic Control 1974;19(6):716–23.
18. StataCorp LP. Stata Survival Analysis and Epidemiological Tables Reference
Manual Release 10. College Station, TX: Stata Corporation 2007.
19. Preston SH, Mehta NK, Stokes A. Modeling obesity histories in cohort analyses of
health and mortality. Epidemiology 2013;24(1):158-66.
20. National Center for Health Statistics National HaNESH, MD: National Center for
Health Statistics; (http://www.cdc.gov/nchs/nhanes.htm). (Accessed 3 November
2002). Secondary.
21. CDC. State-Specific Prevalence of Obesity Among Adults — United States.
MMWR 2008;57(36):765-8.
22. Lee JM, Pilli S, Gebremariam A, et al. Getting heavier, younger: trajectories of
obesity over the life course. Int J Obes (Lond) 2010;34(4):614-23.
23. Vazquez G, Duval S, Jacobs DR, Jr., et al. Comparison of Body Mass Index, Waist
Circumference, and Waist/Hip Ratio in Predicting Incident Diabetes: A Meta-
Analysis. Epidemiol Rev 2007;29(1):115-28.
24. Lagergren J, Bergström R, Lindgren A, et al. The role of tobacco, snuff and alcohol
use in the aetiology of cancer of the oesophagus and gastric cardia. Int J Cancer
2000;85(3):340-6.
25. Yuan JM, Wang XL, Xiang YB, et al. Non-dietary risk factors for nasopharyngeal
carcinoma in Shanghai, China. Int J Cancer 2000;85(3):364-9.
Page 21 of 26
For peer review only - http://bmjopen.bmj.com/site/about/guidelines.xhtml
BMJ Open
123456789101112131415161718192021222324252627282930313233343536373839404142434445464748495051525354555657585960
on 2 March 2019 by guest. P
rotected by copyright.http://bm
jopen.bmj.com
/B
MJ O
pen: first published as 10.1136/bmjopen-2014-005629 on 17 S
eptember 2014. D
ownloaded from
For peer review only
22
Table 1: Characteristics of the study population a
Participant Characteristics No. % Mean Range
Eligible sample 5,036
Obese participants during study follow-up 1,230 24
Age at baseline (years) 44 28–62
Female 2,799 56
Born in the United States 4,082 81
Marital status
Single 452 9
Married 4,269 85
Widowed, divorced, or separated 315 6
Educational level
Eighth grade or less 1,374 27
High school 2,306 46
College 752 15
Graduate school 604 12
Health behavior
Current smoker at baseline 2,893 58
Ever-smoker during study follow-up period 3,178 63
Physical activity score at examination 4 32 25–83
Alcohol drinking at examination 2, ounces/monthb
14 0–360
Blood pressure at baseline
Systolic (mm Hg) 132 85–270
Diastolic (mm Hg) 84 52–150
Hypertension at baseline 843 17
Biochemical characteristics at baseline (mg/100 mL)
Serum cholesterol 226 96–586
Blood glucose 80 40–197
Body weight characteristics
Body mass index at baseline (kg/m2)c 25.5 16.2–46.3
Underweight (<18.5) 67 1
Normal weight (18.5–24.9) 2,408 48
Overweight (25–29.9) 1,992 40
Obese (≥30) 569 11
Cumulative obesity duration (years)d 16 2–46
Cumulative obese-yearsd 63 2–556
1–24.9 515 42
25–49.9 232 19
50–74.9 139 11
≥75 344 28
Cardiovascular disease 2753
Coronary heart disease events 1890
Heart attack 1538
Myocardial infarction 1104
Coronary insufficiency 259
Angina pectoris 945
Cerebrovascular accident 946
Congestive heart failure 876
a Participants were free from existing diabetes, cardiovascular disease, and cancer at baseline.
b One ounce ≈ 28.35 g.
c Body mass index: weight (kg)/height (m)
2.
d For those who were obese during study
follow-up.
Page 22 of 26
For peer review only - http://bmjopen.bmj.com/site/about/guidelines.xhtml
BMJ Open
123456789101112131415161718192021222324252627282930313233343536373839404142434445464748495051525354555657585960
on 2 March 2019 by guest. P
rotected by copyright.http://bm
jopen.bmj.com
/B
MJ O
pen: first published as 10.1136/bmjopen-2014-005629 on 17 S
eptember 2014. D
ownloaded from
For peer review only
23
Table 2: Incidence of Cardiovascular Disease (Events/1,000 Person-Years) According to
Categories of Cumulative Obese-Years
Obese-Years
categories
Events PYFU Incident Rate
Total population
0 year 2,177 116,681 18.66 (17.89-19.46)
1-25 years 276 10,846 25.45 (22.62-28.63)
25-50 years 124 4,509 27.50 (23.06-32.80)
50-75 years 78 2,365 32.98 (26.42-41.18)
>=75years 186 4,517 41.17 (35.66-47.54)
Males
0 year 1,138 46,950 24.24 (22.87-25.69)
1-25 years 134 4,669 28.70 (24.23-34.00)
25-50 years 56 1,710 32.75 (25.21-42.56)
50-75 years 36 720 50.02 (36.08-69.34)
>=75years 49 951 51.51 (38.93-68.16)
Females
0 year 1,039 69,731 14.90 (14.02-15.83)
1-25 years 142 6,177 22.99 (19.50-27.10)
25-50 years 68 2,799 24.30 (19.16-30.81)
50-75 years 42 1,645 25.53 (18.87-34.54)
>=75years 137 3,566 38.42 (32.49-45.42)
PYFU = Persons years of follow-up
Page 23 of 26
For peer review only - http://bmjopen.bmj.com/site/about/guidelines.xhtml
BMJ Open
123456789101112131415161718192021222324252627282930313233343536373839404142434445464748495051525354555657585960
on 2 March 2019 by guest. P
rotected by copyright.http://bm
jopen.bmj.com
/B
MJ O
pen: first published as 10.1136/bmjopen-2014-005629 on 17 S
eptember 2014. D
ownloaded from
For peer review only
24
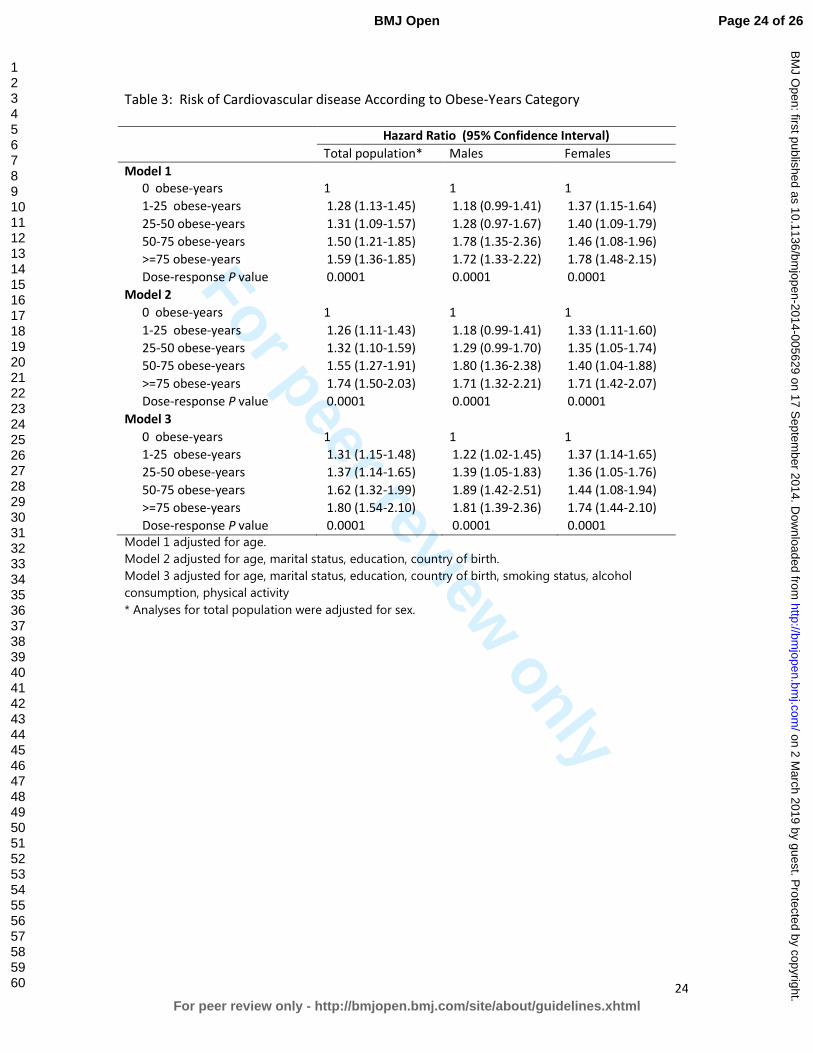
Table 3: Risk of Cardiovascular disease According to Obese-Years Category
Hazard Ratio (95% Confidence Interval)
Total population* Males Females
Model 1
0 obese-years 1 1 1
1-25 obese-years 1.28 (1.13-1.45) 1.18 (0.99-1.41) 1.37 (1.15-1.64)
25-50 obese-years 1.31 (1.09-1.57) 1.28 (0.97-1.67) 1.40 (1.09-1.79)
50-75 obese-years 1.50 (1.21-1.85) 1.78 (1.35-2.36) 1.46 (1.08-1.96)
>=75 obese-years 1.59 (1.36-1.85) 1.72 (1.33-2.22) 1.78 (1.48-2.15)
Dose-response P value 0.0001 0.0001 0.0001
Model 2
0 obese-years 1 1 1
1-25 obese-years 1.26 (1.11-1.43) 1.18 (0.99-1.41) 1.33 (1.11-1.60)
25-50 obese-years 1.32 (1.10-1.59) 1.29 (0.99-1.70) 1.35 (1.05-1.74)
50-75 obese-years 1.55 (1.27-1.91) 1.80 (1.36-2.38) 1.40 (1.04-1.88)
>=75 obese-years 1.74 (1.50-2.03) 1.71 (1.32-2.21) 1.71 (1.42-2.07)
Dose-response P value 0.0001 0.0001 0.0001
Model 3
0 obese-years 1 1 1
1-25 obese-years 1.31 (1.15-1.48) 1.22 (1.02-1.45) 1.37 (1.14-1.65)
25-50 obese-years 1.37 (1.14-1.65) 1.39 (1.05-1.83) 1.36 (1.05-1.76)
50-75 obese-years 1.62 (1.32-1.99) 1.89 (1.42-2.51) 1.44 (1.08-1.94)
>=75 obese-years 1.80 (1.54-2.10) 1.81 (1.39-2.36) 1.74 (1.44-2.10)
Dose-response P value 0.0001 0.0001 0.0001
Model 1 adjusted for age.
Model 2 adjusted for age, marital status, education, country of birth.
Model 3 adjusted for age, marital status, education, country of birth, smoking status, alcohol
consumption, physical activity
* Analyses for total population were adjusted for sex.
Page 24 of 26
For peer review only - http://bmjopen.bmj.com/site/about/guidelines.xhtml
BMJ Open
123456789101112131415161718192021222324252627282930313233343536373839404142434445464748495051525354555657585960
on 2 March 2019 by guest. P
rotected by copyright.http://bm
jopen.bmj.com
/B
MJ O
pen: first published as 10.1136/bmjopen-2014-005629 on 17 S
eptember 2014. D
ownloaded from
For peer review only
25
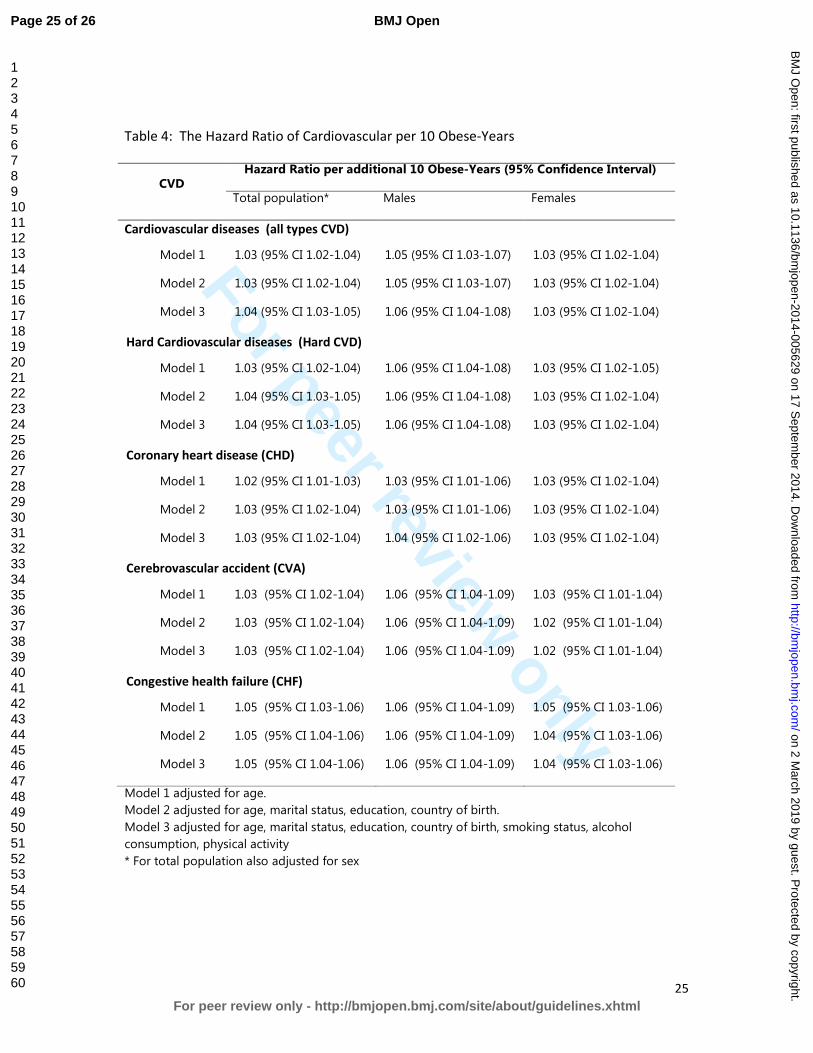
Table 4: The Hazard Ratio of Cardiovascular per 10 Obese-Years
CVD Hazard Ratio per additional 10 Obese-Years (95% Confidence Interval)
Total population* Males Females
Cardiovascular diseases (all types CVD)
Model 1 1.03 (95% CI 1.02-1.04) 1.05 (95% CI 1.03-1.07) 1.03 (95% CI 1.02-1.04)
Model 2 1.03 (95% CI 1.02-1.04) 1.05 (95% CI 1.03-1.07) 1.03 (95% CI 1.02-1.04)
Model 3 1.04 (95% CI 1.03-1.05) 1.06 (95% CI 1.04-1.08) 1.03 (95% CI 1.02-1.04)
Hard Cardiovascular diseases (Hard CVD)
Model 1 1.03 (95% CI 1.02-1.04) 1.06 (95% CI 1.04-1.08) 1.03 (95% CI 1.02-1.05)
Model 2 1.04 (95% CI 1.03-1.05) 1.06 (95% CI 1.04-1.08) 1.03 (95% CI 1.02-1.04)
Model 3 1.04 (95% CI 1.03-1.05) 1.06 (95% CI 1.04-1.08) 1.03 (95% CI 1.02-1.04)
Coronary heart disease (CHD)
Model 1 1.02 (95% CI 1.01-1.03) 1.03 (95% CI 1.01-1.06) 1.03 (95% CI 1.02-1.04)
Model 2 1.03 (95% CI 1.02-1.04) 1.03 (95% CI 1.01-1.06) 1.03 (95% CI 1.02-1.04)
Model 3 1.03 (95% CI 1.02-1.04) 1.04 (95% CI 1.02-1.06) 1.03 (95% CI 1.02-1.04)
Cerebrovascular accident (CVA)
Model 1 1.03 (95% CI 1.02-1.04) 1.06 (95% CI 1.04-1.09) 1.03 (95% CI 1.01-1.04)
Model 2 1.03 (95% CI 1.02-1.04) 1.06 (95% CI 1.04-1.09) 1.02 (95% CI 1.01-1.04)
Model 3 1.03 (95% CI 1.02-1.04) 1.06 (95% CI 1.04-1.09) 1.02 (95% CI 1.01-1.04)
Congestive health failure (CHF)
Model 1 1.05 (95% CI 1.03-1.06) 1.06 (95% CI 1.04-1.09) 1.05 (95% CI 1.03-1.06)
Model 2 1.05 (95% CI 1.04-1.06) 1.06 (95% CI 1.04-1.09) 1.04 (95% CI 1.03-1.06)
Model 3 1.05 (95% CI 1.04-1.06) 1.06 (95% CI 1.04-1.09) 1.04 (95% CI 1.03-1.06)
Model 1 adjusted for age.
Model 2 adjusted for age, marital status, education, country of birth.
Model 3 adjusted for age, marital status, education, country of birth, smoking status, alcohol
consumption, physical activity
* For total population also adjusted for sex
Page 25 of 26
For peer review only - http://bmjopen.bmj.com/site/about/guidelines.xhtml
BMJ Open
123456789101112131415161718192021222324252627282930313233343536373839404142434445464748495051525354555657585960
on 2 March 2019 by guest. P
rotected by copyright.http://bm
jopen.bmj.com
/B
MJ O
pen: first published as 10.1136/bmjopen-2014-005629 on 17 S
eptember 2014. D
ownloaded from
For peer review only
26
Table 5: Comparison of the Obese-years construct, Body Mass Index and Obesity Duration as
predictors of the Risk of CVD
Constructs Akaike Information Criterion (AIC)
Total population Males Females
Cardiovascular diseases (all types CVD)
Construct 1: Level of BMI 43390 19227 20307
Construct 2: Duration of obesity 43379 19221 20306
Construct 3: Obese-Years 43368 19209 20294
Hard Cardiovascular diseases (Hard CVD)
Construct 1: Level of BMI 34069 15102 15976
Construct 2: Duration of obesity 34065 15099 15968
Construct 3: Obese-Years 34050 15096 15955
Coronary heart disease (CHD)
Construct 1: Level of BMI 29038 14355 12156
Construct 2: Duration of obesity 29039 14354 12162
Construct 3: Obese-Years 29028 14351 12152
Cerebrovascular accident (CVA)
Construct 1: Level of BMI 13575 5211 7147
Construct 2: Duration of obesity 13577 5208 7141
Construct 3: Obese-Years 13573 5208 7136
Congestive health failure (CHF)
Construct 1: Level of BMI 13141 5275 6667
Construct 2: Duration of obesity 13122 5263 6663
Construct 3: Obese-Years 13104 5255 6649
Each construct was split into 11 categories; 1 represents “not obese” and 2-11 represent deciles of
obesity exposure (intensity, duration and obese-years)
Each model adjusted for sex, age, marital status, education, smoking, alcohol consumption, and
physical activity.
Page 26 of 26
For peer review only - http://bmjopen.bmj.com/site/about/guidelines.xhtml
BMJ Open
123456789101112131415161718192021222324252627282930313233343536373839404142434445464748495051525354555657585960
on 2 March 2019 by guest. P
rotected by copyright.http://bm
jopen.bmj.com
/B
MJ O
pen: first published as 10.1136/bmjopen-2014-005629 on 17 S
eptember 2014. D
ownloaded from
For peer review only
Estimating the risk of cardiovascular disease using an obese-years metric
Journal: BMJ Open
Manuscript ID: bmjopen-2014-005629.R1
Article Type: Research
Date Submitted by the Author: 22-Aug-2014
Complete List of Authors: Abdullah, Asnawi; Faculty of Public Health, University Muhammadiyah Aceh, Biostatistics and Population Health; Monash University, Department Epidemiology and Preventive Medicine, Amin, Fauzi; Faculty of Public Health, University Muhammadiyah Aceh, Public Health Nutritrion Stoelwinder, Johannes; Monash University, Epidemiology and Preventive Medicine Tanamas, Stephanie; Baker IDI Heart and Diabetes Institute,
Wolf, Rory; Monash University, Epidemiology and Preventive Medicine Barendregt, Jan; University of Queensland, School of Population Health Peeters, Anna; Baker IDI Heart and Diabetes Institute, Obesity and Population Health; Baker IDI Heart and Diabetes Institute, Clinical Diabetes and Epidemiology
<b>Primary Subject Heading</b>:
Epidemiology
Secondary Subject Heading: Nutrition and metabolism, Public health, Cardiovascular medicine
Keywords: EPIDEMIOLOGY, PUBLIC HEALTH, VASCULAR MEDICINE, Risk management < HEALTH SERVICES ADMINISTRATION & MANAGEMENT, Vascular medicine < INTERNAL MEDICINE, NUTRITION & DIETETICS
For peer review only - http://bmjopen.bmj.com/site/about/guidelines.xhtml
BMJ Open on 2 M
arch 2019 by guest. Protected by copyright.
http://bmjopen.bm
j.com/
BM
J Open: first published as 10.1136/bm
jopen-2014-005629 on 17 Septem
ber 2014. Dow
nloaded from
For peer review only
Title:
Estimating the risk of cardiovascular disease using an obese-years metric
Running title:
Obese-years and cardiovascular disease
Authors:
Asnawi Abdullah, PhD1,3
Fauzi Ali Amin, MPH2
Johannes Stoelwinder, MD3
Stephanie K Tanamas, PhD4
Rory Wolfe, PhD3
Jan Barendregt, PhD 5
Anna Peeters, PhD3,4
Authors Address: 1 Department of Biostatistics and Population Health. Faculty of Public Health,
University Muhammadiyah Aceh, Indonesia; 2 Department of Public Health Nutrition. Faculty of Public Health, University
Muhammadiyah Aceh, Indonesia; 3 Department of Epidemiology and Preventive Medicine, School of Public
Health and Preventive Medicine, Monash University, Australia; 4 Baker IDI Heart and Diabetes Institute, Australia; 5 School of Population Health, University Queensland, Australia.
Correspondence to:
Asnawi Abdullah, Department of Biostatistics and Population Health, Faculty of
Public Health, University of Muhammadiyah Aceh, Jln. Leung Bata, Batoh,
Banda Aceh, Indonesia, 23245. Phone +6265131054, Fax. +6265131053, Email:
Word count:
Text = 3325 words; Abstract = 294 words; 28 references, Tables 6
Page 1 of 65
For peer review only - http://bmjopen.bmj.com/site/about/guidelines.xhtml
BMJ Open
123456789101112131415161718192021222324252627282930313233343536373839404142434445464748495051525354555657585960
on 2 March 2019 by guest. P
rotected by copyright.http://bm
jopen.bmj.com
/B
MJ O
pen: first published as 10.1136/bmjopen-2014-005629 on 17 S
eptember 2014. D
ownloaded from

For peer review only
2
ABSTRACT:
Objective: To examine the association between obese-years and the risk of
cardiovascular disease (CVD).
Study design: Prospective cohort study
Setting: Boston, USA
Participants: 5036 participants of the Framingham Heart Study were
examined.
Methods: Obese-years was calculated by multiplying for each participant the
number of BMI units above 29 kg/m2 by the number of years lived at that BMI
during approximately 50 years of follow-up. The association between obese-
years and CVD was analyzed using time-dependent Cox regression adjusted
for potential confounders and compared with other models using the Akaike
Information Criterion (AIC). The lowest AIC indicated better fit.
Primary outcome: Cardiovascular disease.
The Results: The median cumulative obese-years was 24 (range, 2–556 obese-
years). During 138,918 person-years of follow-up, 2753 (55%) participants were
diagnosed with CVD. The incidence rates and adjusted hazards ratios (AHR) for
CVD increased with an increase in the number of obese-years. AHR for the
categories 1–24.9, 25–49.9, 50–74.9, and ≥75 obese-years were respectively
1.31 (95% CI: 1.15–1.48), 1.37 (95% CI: 1.14–1.65), 1.62 (95% CI: 1.32–1.99), and
1.80 (95% CI: 1.54–2.10) compared with those who were never obese (i.e. had
zero obese-years). The effect of obese-years was stronger in males than
females. For every 10 unit increase in obese-years, the AHR of CVD increased
by 6% (95% CI 4% to 8%) for males and 3% (95% CI 2% to 4%) for females. The
AIC was lowest for the model containing obese-years compared with models
containing either the level of BMI or the duration of obesity alone.
Conclusions: This study demonstrates that obese-years metric conceptually
captures the cumulative damage of obesity on body systems, and is found to
provide slightly more precise estimation of the risk of CVD than level or the
duration of obesity alone.
Key Words: Obesity, BMI, the duration of obesity, obese-years, risk factor,
cardiovascular disease
Page 2 of 65
For peer review only - http://bmjopen.bmj.com/site/about/guidelines.xhtml
BMJ Open
123456789101112131415161718192021222324252627282930313233343536373839404142434445464748495051525354555657585960
on 2 March 2019 by guest. P
rotected by copyright.http://bm
jopen.bmj.com
/B
MJ O
pen: first published as 10.1136/bmjopen-2014-005629 on 17 S
eptember 2014. D
ownloaded from
For peer review only
3
Strengths of this study
• The obese-years metric combines the number of years lived with obesity
and the level of BMI to examine the total effect of obesity.
• The Framingham Heart Study is a long term prospective cohort study with
approximately 50 years of follow-up, and biennial measurements of body
weight, covariates and health outcomes.
• By using time-dependent Cox proportional hazards regression, the analysis
takes into account changes in covariates during study follow-up and adjusts
for a large number of potential confounding variables.
Limitations of this study
• The obese-years metric was developed based on the measurement of BMI.
It is unclear whether using anthropometric measures other than BMI would
produce different results.
• Data used for this study was from a relatively old cohort study, which began
in 1948.
Page 3 of 65
For peer review only - http://bmjopen.bmj.com/site/about/guidelines.xhtml
BMJ Open
123456789101112131415161718192021222324252627282930313233343536373839404142434445464748495051525354555657585960
on 2 March 2019 by guest. P
rotected by copyright.http://bm
jopen.bmj.com
/B
MJ O
pen: first published as 10.1136/bmjopen-2014-005629 on 17 S
eptember 2014. D
ownloaded from
For peer review only
4
Background
The association between obesity and cardiovascular disease (CVD) is well
known1 2. However, these findings are generally based on analysing only the
level of BMI in relation to CVD. More recently, studies have demonstrated the
importance of taking into account the potential cumulative effect of the
duration of obesity, rather than the simple assessment of obesity at a single
point in time (e.g. at baseline). Duration of obesity has been shown to be a risk
factor for CVD3, type-2 diabetes4 and mortality5, independent of body mass
index (BMI). Nevertheless, analyses based on either level of BMI alone or
duration lived with obesity alone, may not reflect the total effect of obesity and
may underestimate the risk of CVD attributable to obesity. We have recently
demonstrated the additional benefit of combining the level of obesity with the
number of years lived with obesity into a single measure, finding that an
obese-years metric is a better predictor of the risk of type-2 diabetes than level
of BMI or duration of obesity alone7.
The use of the obese-years metric to estimate the risk of CVD has not been
investigated yet. We hypothesized that the obese-years metric is likely a similar
independent risk factor for CVD and would provide an improved estimation of
the risk of future CVD. This study aimed to examine the association between
Page 4 of 65
For peer review only - http://bmjopen.bmj.com/site/about/guidelines.xhtml
BMJ Open
123456789101112131415161718192021222324252627282930313233343536373839404142434445464748495051525354555657585960
on 2 March 2019 by guest. P
rotected by copyright.http://bm
jopen.bmj.com
/B
MJ O
pen: first published as 10.1136/bmjopen-2014-005629 on 17 S
eptember 2014. D
ownloaded from
For peer review only
5
obese-years and risk of CVD and to examine whether the obese-years metric is
a better predictor for risk of CVD than current BMI or duration of obesity alone.
We investigated these objectives using the Framingham Heart Study (FHS), a
long term prospective cohort study where body weight, health outcomes and
other covariates were measured biennially for almost 50 years11.
METHODS
Data source
We used data from the Framingham Heart Study (FHS)12. In this prospective
cohort study, 5,209 participants (aged 28–62 years at the time of enrolment)
attended biennial examinations for approximately 50 years beginning from
1948. For the purpose of this study, only participants who were free from CVD
(any type), cancer and type-2 diabetes at baseline were included in the analysis
(n = 5,036).
Variables: measurement, missing and imputation
Most variables in the FHS were measured regularly at the two-yearly
examinations, including body weight, height, demographic variables, health
behaviors, and health outcomes (including cardiovascular disease)11. Some
values are missing by design where variables were not collected at every
Page 5 of 65
For peer review only - http://bmjopen.bmj.com/site/about/guidelines.xhtml
BMJ Open
123456789101112131415161718192021222324252627282930313233343536373839404142434445464748495051525354555657585960
on 2 March 2019 by guest. P
rotected by copyright.http://bm
jopen.bmj.com
/B
MJ O
pen: first published as 10.1136/bmjopen-2014-005629 on 17 S
eptember 2014. D
ownloaded from
For peer review only
6
examination. For example current smoking status was not recorded at four
examinations (2, 3, 6 and 17), cholesterol was not measured at seven
examinations (11, 12, 17-20 and 22), alcohol consumption was measured only
at eight examinations (2, 4, 7, 19, 20–23), and physical activity was measured
only at four examinations (4, 11, 12, and 19). In this circumstance, the most
contemporary measured value of the variable was used in place of missing
values at the examination times when the variable was not measured. Another
missing data circumstance was when missing values occurred intermittently
during study follow-up; for example body weight and hence BMI. In this case
missing values for BMI were imputed with a conditional mean estimated by a
multiple linear regression model using age at prior exam, sex and several
transformations of the previously measured BMI (BMI, log BMI, BMI squared
and BMI as a categorical variable). Methods of measurement of these variables
have been described in detail elsewhere4 7.
The level of obesity, duration and obese-years measurement
A participant was considered obese at a given examination if their BMI was
greater than or equal to 30 kg/m2. The level of obesity was defined as follows:
(1) if BMI < 30 kg/m2, the level was zero; and (2) if BMI ≥ 30 kg/m2, the level
Page 6 of 65
For peer review only - http://bmjopen.bmj.com/site/about/guidelines.xhtml
BMJ Open
123456789101112131415161718192021222324252627282930313233343536373839404142434445464748495051525354555657585960
on 2 March 2019 by guest. P
rotected by copyright.http://bm
jopen.bmj.com
/B
MJ O
pen: first published as 10.1136/bmjopen-2014-005629 on 17 S
eptember 2014. D
ownloaded from
For peer review only
7
was BMI minus 29 kg/m2. For example, if BMI was 35 kg/m2, the level was 6 (35
– 29) obese units.
The duration of obesity followed a similar definition to that described
previously4. The duration of obesity was calculated for those individuals with at
least two consecutive examinations with occurrence of obesity (which is
interpreted as indicating at least two years of being continuously obese). The
requirement for two consecutive examinations with obesity was to avoid the
potential misclassification of body weight, either due to measurement error or
fluctuations between the borderline of the ‘overweight’ category or the ‘obese’
category. For those individuals without two consecutive obesity occurrences,
duration was considered to be zero at all exams. For those individuals with two
consecutive obesity occurrences, the beginning of their obesity duration
interval was defined as the date of the first of these two examinations and from
that time, the individual was considered to be continuously obese until either
the first of two consecutive non-obese examinations, or death, or the end of
follow-up at examination 24. Individuals could have multiple periods of obesity
duration during follow-up.
Page 7 of 65
For peer review only - http://bmjopen.bmj.com/site/about/guidelines.xhtml
BMJ Open
123456789101112131415161718192021222324252627282930313233343536373839404142434445464748495051525354555657585960
on 2 March 2019 by guest. P
rotected by copyright.http://bm
jopen.bmj.com
/B
MJ O
pen: first published as 10.1136/bmjopen-2014-005629 on 17 S
eptember 2014. D
ownloaded from

For peer review only
8
The level of obesity and the duration of obesity were combined as a single
variable called obese-years. Obese-years was calculated at each examination as
the defined level of obesity (in “obese units”) multiplied by the defined
duration of obesity (in years). Then the cumulative total of obese-years for
each examination was calculated as a sum of all obese-year “exposures” up to
and including that examination.
Table 1 illustrates the calculation of obese-years for a single individual. This
participant first had a measurement of obesity at examination 2 and was
assigned obesity duration of zero at this examination. At examination 3, this
participant was assumed to have lived with obesity for 2 years (the interval
between examination 2 and examination 3) with a degree of obesity of 1
kg/m2. This approach assumes that an individual’s BMI is carried forward from
a given examination (i.e., examination 2) and does not change until a different
BMI value at a subsequent examination (i.e., examination 3). The number of
obese-years at examination 3 was therefore 2 obese-years (1 BMI unit X 2
years in the preceding interval). From examination 3 to examination 4 (a 3 year
interval), the participant was still obese with a degree of obesity of 3 kg/m2
(BMI 32 kg/m2). At examination 4, the number of obese-years was 9 (3BMI unit
X 3 years) and the cumulative obese-years at this examination was 11 obese-
years (2 plus 9).
Page 8 of 65
For peer review only - http://bmjopen.bmj.com/site/about/guidelines.xhtml
BMJ Open
123456789101112131415161718192021222324252627282930313233343536373839404142434445464748495051525354555657585960
on 2 March 2019 by guest. P
rotected by copyright.http://bm
jopen.bmj.com
/B
MJ O
pen: first published as 10.1136/bmjopen-2014-005629 on 17 S
eptember 2014. D
ownloaded from

For peer review only
9
This method implies that individuals accumulating 50 obese-years, for example,
could have reached this quantity either by having been obese with BMI of 30
kg/m2 for approximately 50 years or by having been obese with BMI of 34
kg/m2 for approximately 10 years or, indeed, many other combinations.
Measurement of the outcome and time to event
The main outcome of interest in this study was CVD incidence (the first event
of any type of CVD; defined as a composite of coronary heart disease (CHD),
cerebrovascular accident (CVA), peripheral artery disease, and congestive heart
failure (CHF)13. Additional outcomes were individual types of CVD: hard CVD,
CHD, CVA, and CHF. Hard CVD was defined as a composite of hard CHD
(coronary death, myocardial infarction), stroke (fatal and nonfatal), peripheral
artery disease and heart failure. In the FHS, the criteria for each cardiovascular
outcome during follow-up were standardized14 and a panel of Framingham
investigators made an adjudication regarding diagnosis. CHD includes the
diagnoses of (1) angina pectoris, evidenced by a typical history of chest pain
on a physician-administered questionnaire; (2) myocardial infarction,
determined by specified electrocardiographic changes, diagnostic elevation of
serum enzymes with prolonged ischemic chest pain, or on autopsy; (3)
coronary insufficiency, defined as prolonged ischemic chest pain accompanied
Page 9 of 65
For peer review only - http://bmjopen.bmj.com/site/about/guidelines.xhtml
BMJ Open
123456789101112131415161718192021222324252627282930313233343536373839404142434445464748495051525354555657585960
on 2 March 2019 by guest. P
rotected by copyright.http://bm
jopen.bmj.com
/B
MJ O
pen: first published as 10.1136/bmjopen-2014-005629 on 17 S
eptember 2014. D
ownloaded from
For peer review only
10
by transient ischemic abnormalities on ECG; and (4) sudden (in less than 1
hour) or non-sudden coronary death. CHF was indicated when at least two
major or one major and two minor diagnostic conditions existed concurrently
upon examination.
Time to event was measured as the time from cohort entry until the date a
participant was diagnosed as having CVD. Individuals who died or reached the
end of the follow-up (examination 24) before developing CVD were censored
at date of death or examination 24, respectively.
Data analysis
To model the relationship between the various measures of obesity and risk of
CVD in a dynamic survival model way6 an extended Cox regression model
involving time-dependent (time-varying) variables15-18 was used. The
demographic and health behavior variables included in the analysis were age,
sex and country of birth at baseline, and the time-varying values of education
level, marital status, smoking status, alcohol consumption (ounces/month), and
physical activity. The regression coefficients from these models were
exponentiated and interpreted as hazard ratios noting that care is required
Page 10 of 65
For peer review only - http://bmjopen.bmj.com/site/about/guidelines.xhtml
BMJ Open
123456789101112131415161718192021222324252627282930313233343536373839404142434445464748495051525354555657585960
on 2 March 2019 by guest. P
rotected by copyright.http://bm
jopen.bmj.com
/B
MJ O
pen: first published as 10.1136/bmjopen-2014-005629 on 17 S
eptember 2014. D
ownloaded from

For peer review only
11
with this interpretation17 since the model does not technically define
proportional hazards in the presence of time-varying variables.
The obese-years metric was analysed both as a continuous and as a categorical
variable using the same categories as using in the previous study7 for
comparison purposes. For analyses of continuous obese-years, hazard ratios
are presented per 10 obese-years. For analyses of categorical obese-years,
participants who were never obese during study follow-up (zero obese-years)
were assigned as a comparator (reference category) and the level of obese-
years was grouped into short, medium long and extensive periods representing
1-24.9, 25-49.9, 50-74.9 and >=75 obese-years. Hazard ratios are presented,
both as crude hazard ratios and as multivariate-adjusted hazard ratios for both
continuous and categorical versions of obese-years. Three models were used
to examine the hazard ratios with the addition of different confounding
variables. Model 1 was adjusted for age. Model 2 was adjusted for age, sex,
marital status, educational level and country of birth. Model 3 included
adjustment for all variables in model 2 plus the health behavior variables of
smoking status, alcohol consumption and physical activity. The analyses were
stratified by sex and a test for interaction between sex/smoking status and
obese-years was performed.
Page 11 of 65
For peer review only - http://bmjopen.bmj.com/site/about/guidelines.xhtml
BMJ Open
123456789101112131415161718192021222324252627282930313233343536373839404142434445464748495051525354555657585960
on 2 March 2019 by guest. P
rotected by copyright.http://bm
jopen.bmj.com
/B
MJ O
pen: first published as 10.1136/bmjopen-2014-005629 on 17 S
eptember 2014. D
ownloaded from
For peer review only
12
To compare the relative predictive values of obesity level, obesity duration and
the obese-years metric, each of these three variables were divided into an
equal number of categories. One group was created for those who were never
obese (BMI less than 30 kg/m2) as a reference. For those with obesity, ten
deciles were used to create categories. The goodness of fit of the models
incorporating each of the three variables was compared using Akaike's
information criterion (AIC), computed as –2(log-likelihood) + 2 (number of
estimated parameters); with a lower AIC indicating a better fit19. All analyses
were performed using the Stata statistical software package version 11.0
(StataCorp, College Station, TX, USA)20.
Sensitivity analyses
A sensitivity analysis was performed to examine whether the associations were
influenced by the imputation method for missing BMI. The analysis was
repeated by including only participants with no missing values of BMI at any
examinations. The effect of the duration of obesity prior to baseline was tested
by excluding those who were obese at baseline (n = 576).
Page 12 of 65
For peer review only - http://bmjopen.bmj.com/site/about/guidelines.xhtml
BMJ Open
123456789101112131415161718192021222324252627282930313233343536373839404142434445464748495051525354555657585960
on 2 March 2019 by guest. P
rotected by copyright.http://bm
jopen.bmj.com
/B
MJ O
pen: first published as 10.1136/bmjopen-2014-005629 on 17 S
eptember 2014. D
ownloaded from
For peer review only
13
RESULTS
Characteristics of the Participants
Of the 5,036 eligible study participants, 1230 (24%) participants were obese for
at least 2 consecutive examinations during the study follow-up. For those who
were ever obese during the study, the median cumulative duration of obesity
was approximately 12 years (range, 2–46 years), and the median cumulative
obese-years was 24 (range, 2–556 obese-years). 2753 (55%) participants were
diagnosed with cardiovascular disease over approximately 138,918 person-
years of follow-up (Table 2).
Incidence and Hazards Ratios for Cardiovascular Disease
The incidence rates and adjusted hazards ratios for CVD increased with an
increase in the number of obese-years (Table 3 and Table 4). In Model 3 for
males and females combined, the adjusted hazard ratios for the categories 1–
24.9, 25–49.9, 50–74.9, and ≥75 obese-years were respectively 1.31 (95% CI:
1.15-1.48), 1.37 (95% CI: 1.14-1.65), 1.62 (95% CI: 1.32-1.99), and 1.80 (95% CI:
1.54-2.10) compared with those who were never obese (i.e. had zero obese-
years). For obese-years as a continuousvariable , with every 10 unit increase in
obese-years the adjusted hazard ratio for CVD was estimated to increase by
Page 13 of 65
For peer review only - http://bmjopen.bmj.com/site/about/guidelines.xhtml
BMJ Open
123456789101112131415161718192021222324252627282930313233343536373839404142434445464748495051525354555657585960
on 2 March 2019 by guest. P
rotected by copyright.http://bm
jopen.bmj.com
/B
MJ O
pen: first published as 10.1136/bmjopen-2014-005629 on 17 S
eptember 2014. D
ownloaded from
For peer review only
14
4% (95% CI 3% - 5%) (Table 5). There were no significant interactions between
obese-year categories with sex or smoking status. There was evidence of an
interaction between obese-years as a continuous variable and sex (P value =
0.01). The effect of obese-years was stronger in males than in females.
Comparing Obesity Metrics and Akaike's Information Criterion (AIC),
Table 6 demonstrates the risk of CVD for each of the three different constructs
for obesity: level of obesity (based on BMI), duration of obesity, and the obese-
years metric. Each construct was analysed in a separate model as an additive
effect and the strength of association was compared using the Akaike
Information Criterion (AIC). In all outcomes, the AIC was lowest in the model
using the obese-years metric compared with the other models for the total
population and by sex.
Sensitivity analysis
The sensitivity analyses showed that the association between obese-years and
risk of CVD was similar in a complete case analysis and the analysis using
imputed missing values for BMI. Exclusion of participantswho were obese at
baseline showed only a slightly lower adjusted hazard ratio: 1.03 (95% CI: 1.01-
1.05)
Page 14 of 65
For peer review only - http://bmjopen.bmj.com/site/about/guidelines.xhtml
BMJ Open
123456789101112131415161718192021222324252627282930313233343536373839404142434445464748495051525354555657585960
on 2 March 2019 by guest. P
rotected by copyright.http://bm
jopen.bmj.com
/B
MJ O
pen: first published as 10.1136/bmjopen-2014-005629 on 17 S
eptember 2014. D
ownloaded from
For peer review only
15
DISCUSSION
This study found that measuring the total effect of obesity by combining the
level and the duration of obesity into a single metric of obese-years is a
stronger predictor for the risk of CVD compared to using duration of obesity
or level of obesity alone. A clear dose-response relationship between obese-
years and risk of CVD was observed. A stronger effect was found in males
than in females
Although the hazard ratios were very similar between the three different
constructs, and it is not possible to perform a statistical comparison of
discrimination between the models due to the fact that they are non-nested,
the AIC does indicate that combining the level and duration of obesity into a
single construct of obese-years provides greater discriminative power than a
model with level of obesity or obesity duration alone. However the disparity in
AIC between the competing models was not as great as was observed with
diabetes as the outcome of interest7 and so it is unclear the extent to which
this finding has important implications for future studies of the total health
impact associated with obesity and whether future studies should take into
Page 15 of 65
For peer review only - http://bmjopen.bmj.com/site/about/guidelines.xhtml
BMJ Open
123456789101112131415161718192021222324252627282930313233343536373839404142434445464748495051525354555657585960
on 2 March 2019 by guest. P
rotected by copyright.http://bm
jopen.bmj.com
/B
MJ O
pen: first published as 10.1136/bmjopen-2014-005629 on 17 S
eptember 2014. D
ownloaded from

For peer review only
16
account both the impact of obesity level and changes in the duration of
obesity.
There are different ways to operationalize the impact of excess weight over
time. A recent systematic review identified at least four models: an additive
model, a duration-of-obesity model, an additive-weight-change model, and an
interactive model 21. In addition to these models, findings using the obese-year
model suggest that analyzing the combined effect of the duration and the level
of obesity as a predictor of CVD is worthwhile. Such approaches add
information over and above simply the level of excess weight or length of time
with obesity. As has been argued previously7 other potential addition to this
analysis is examining the excess body weight as higher than 25 kg/m2.
The findings in this study were derived from analysis of a long term
prospective cohort study with biennial measurements of body weight,
covariates and health outcomes which enabled us to analyze change in level of
obesity and duration of obesity over a long period. The analysis takes into
account changes in covariates, such as smoking status, alcohol consumption
and physical activity and adjusts for a large number of potential confounding
variables. However, some potential confounders, such as diet, were not
Page 16 of 65
For peer review only - http://bmjopen.bmj.com/site/about/guidelines.xhtml
BMJ Open
123456789101112131415161718192021222324252627282930313233343536373839404142434445464748495051525354555657585960
on 2 March 2019 by guest. P
rotected by copyright.http://bm
jopen.bmj.com
/B
MJ O
pen: first published as 10.1136/bmjopen-2014-005629 on 17 S
eptember 2014. D
ownloaded from
For peer review only
17
collected consistently in the Framingham Heart Study and therefore have not
been adjusted for in our analysis.
As has been described elsewhere7, the limitation of this analysis might relate to
the population being a relatively old cohort study, the Framingham Heart
Study that began in 1948, and the prevalence rates of obesity were relatively
low at that time (in the 1950s was below 10%)22. It could be argued that the
results of this study might not reflect contemporary populations, where the
prevalence of obesity is markedly higher than 50 years ago. In 2008 , the
prevalence of obesity among adults in the United States was more than 30%23
24. Moreover, the contemporary obesity epidemic is also characterized by a
much earlier onset of obesity, which could result in even longer exposure by
the time today’s obese generation of children reach the age of our studied
cohort. In our study, the average age at onset of obesity was approximately 50
years, and the average number of years lived with obesity was approximately
13 years but in today’s society, the average age at onset of obesity is likely to
be more than 10 years earlier than in previous decades25. Nevertheless, our
results indicate that the obese-years metric is still valid and may provide more
precision in predicting the risk of CVD than level of BMI or duration of obesity
alone.
Page 17 of 65
For peer review only - http://bmjopen.bmj.com/site/about/guidelines.xhtml
BMJ Open
123456789101112131415161718192021222324252627282930313233343536373839404142434445464748495051525354555657585960
on 2 March 2019 by guest. P
rotected by copyright.http://bm
jopen.bmj.com
/B
MJ O
pen: first published as 10.1136/bmjopen-2014-005629 on 17 S
eptember 2014. D
ownloaded from

For peer review only
18
The obese-years metric in this study was based on the measurement of BMI. It
is unclear whether using anthropometric measures other than BMI would
produce different results. Although a recent meta-analysis study has showed
that BMI, waist circumference (WC), and the waist/hip ratio (WHR) each
estimate a similar risk, particularly for type-2 diabetes26; it is still worthwhile
explore the relationship between obese-years and risk of CVD using WC or
WHR.
As discussed in our previous study7, the obese-years metric was developed
based on the assumption that level and duration of obesity have a similar
impact, an assumption that has been used for the concept of pack-years in
smoking studies. In some smoking studies, it was highlighted that for certain
health outcomes, the effect of the duration was more important than
intensity27, while in others, duration was not significant after adjustment for
intensity28. As we have previously discussed, the notion that obese-years is only
“switched on” when BMI reaches 30 kg/m2 is crude7, however it is an important
construct to consider whether the combination of level and duration is relevant
for a particular outcome. In addition, although obese-years does find a parallel
in pack-years for smoking, which is a construct that ignores any effects of
Page 18 of 65
For peer review only - http://bmjopen.bmj.com/site/about/guidelines.xhtml
BMJ Open
123456789101112131415161718192021222324252627282930313233343536373839404142434445464748495051525354555657585960
on 2 March 2019 by guest. P
rotected by copyright.http://bm
jopen.bmj.com
/B
MJ O
pen: first published as 10.1136/bmjopen-2014-005629 on 17 S
eptember 2014. D
ownloaded from
For peer review only
19
passive smoking, the nature of cumulative exposure in obesity is not as
straightforward as in smoking.
These findings demonstrate that it is important to consider not only the level
of obesity but also the duration of obesity and their combination when
examining the association between obesity and the risk of chronic disease. This
effect is likely to be because the obese-years metric takes into account the
cumulative damage of obesity to body systems, and consequently is likely to
be applicable to other chronic diseases. However, further investigations are
recommended to be undertaken, of other possible level/duration constructs of
obesity such as considering the effect of BMI above 25 kg/m2, and of
relationships between obese-years and other chronic diseases and mortality.
We acknowledge that a major challenge in examining the obese-years metric is
to have information on both the degree of obesity and the duration of obesity.
Few cohort studies measure obesity and health outcomes regularly as in the
FHS. However, we believe there would be value in more detailed assessment of
height and weight on multiple repeated occasions in future cohort studies and
to identify other more readily available proxies of duration, such as peak
Page 19 of 65
For peer review only - http://bmjopen.bmj.com/site/about/guidelines.xhtml
BMJ Open
123456789101112131415161718192021222324252627282930313233343536373839404142434445464748495051525354555657585960
on 2 March 2019 by guest. P
rotected by copyright.http://bm
jopen.bmj.com
/B
MJ O
pen: first published as 10.1136/bmjopen-2014-005629 on 17 S
eptember 2014. D
ownloaded from
For peer review only
20
weight or age of onset of obesity and to test to what extent those variables are
equivalent to the obese-year metric.
It is important that these results inform future epidemiological analyses,
suggesting that the risk of obesity on some health outcomes is being
underestimated if duration is not being taken into account. This has
consequent implications for underestimation of obesity-related burden of
disease modelling and cost-effectiveness analyses. In addition, the results
inform public health policy, demonstrating further rationale for preventing
weight gain and delaying the onset of obesity.
CONCLUSION
This study demonstrates that the risk of CVD associated with obesity is derived
both from the level of obesity attained and also the length of time lived with
obesity. The obese-years metric conceptually captures the cumulative damage
of obesity on body systems, and is found to provide slightly more precise
estimation of the risk of CVD than level or the duration of obesity alone.
Page 20 of 65
For peer review only - http://bmjopen.bmj.com/site/about/guidelines.xhtml
BMJ Open
123456789101112131415161718192021222324252627282930313233343536373839404142434445464748495051525354555657585960
on 2 March 2019 by guest. P
rotected by copyright.http://bm
jopen.bmj.com
/B
MJ O
pen: first published as 10.1136/bmjopen-2014-005629 on 17 S
eptember 2014. D
ownloaded from
For peer review only
21
CONFLICT OF INTEREST:
None declared.
ACKNOWLEDGMENTS
The authors thank the Framingham Heart Study investigators for granting them
permission to use their data set for this study (the Framingham Heart Study is
conducted and supported by the National Heart, Lung, and Blood Institute
(NHLBI) in collaboration with study investigators). This article was prepared by
using a limited-access data set obtained from the NHLBI and does not
necessarily reflect the opinions or views of the Framingham Heart Study or the
NHLBI.
CONTRIBUTORS
Author AA developed the analytical techniques of study, performed data
analysis, interpretation, drafting of the article and prepared the final version for
publication; FAA performed data analysis and interpretation of data; JS, ST, and
JB helped review the data analysis and reviewed the article; RW contributed to
the study design and reviewing of the article; and AP supervised the
implementation of the study, designed the study’s analytic strategy, and
reviewing of the article
SOURCES OF FUNDING
Page 21 of 65
For peer review only - http://bmjopen.bmj.com/site/about/guidelines.xhtml
BMJ Open
123456789101112131415161718192021222324252627282930313233343536373839404142434445464748495051525354555657585960
on 2 March 2019 by guest. P
rotected by copyright.http://bm
jopen.bmj.com
/B
MJ O
pen: first published as 10.1136/bmjopen-2014-005629 on 17 S
eptember 2014. D
ownloaded from
For peer review only
22
A. A. and F.A.A. were supported by an Indonesian Danone institutional research
grant 2012. A. P. and S. T. by an NHMRC project grant.
DATA SHARING STATEMENT
No additional data available
Page 22 of 65
For peer review only - http://bmjopen.bmj.com/site/about/guidelines.xhtml
BMJ Open
123456789101112131415161718192021222324252627282930313233343536373839404142434445464748495051525354555657585960
on 2 March 2019 by guest. P
rotected by copyright.http://bm
jopen.bmj.com
/B
MJ O
pen: first published as 10.1136/bmjopen-2014-005629 on 17 S
eptember 2014. D
ownloaded from
For peer review only
23
REFERENCES
1. Hubert HB, Feinleib M, McNamara PM, et al. Obesity as an independent risk factor
for cardiovascular disease: A 26-year follow-up of participants in the
Framingham Heart Study. Circulation 1983;67(5):968-77.
2. Morrison JA. Obesity and cardiovascular disease risk factors in Black and White
girls: The NHLBI Growth and Health Study. Am J Public Health
1992;82(12):1613-20.
3. Abdullah A., Stoelwinder A., De Courten M., et al. The Duration of Obesity and the
Risk of Cardiovascular Disease. The Conference on Clinical Epidemiology and
Evidence-Based Medicine in Global Perspective 27-28 November. Bali,
Indonesia, 2010.
4. Abdullah A, Stoelwinder J, Shortreed S, et al. The duration of obesity and the risk of
type 2 diabetes. Public Health Nutr 2011;14(1):119-26.
5. Abdullah A, Wolfe R, Stoelwinder JU, et al. The number of years lived with obesity
and the risk of all-cause and cause-specific mortality. Int J Epidemiol
2011;40(4):985-96.
6. He J, McGee D, Niu X, et al. Examining the dynamic association of BMI and
mortality in the Framingham Heart Study. Int J Environ Res Public Health
2009;6(12):3115-26.
7. Abdullah A, Wolfe R, Mannan H, et al. Epidemiologic merit of obese-years, the
combination of degree and duration of obesity. Am J Epidemiol
2012;176(2):99-107.
8. Leffondre K, Abrahamowicz M, Siemiatycki J, et al. Modeling smoking history: a
comparison of different approaches. Am J Epidemiol 2002;156(9):813-23.
9. Neuner B, Wellmann J, Dasch B, et al. Modeling smoking history: a comparison of
different approaches in the MARS study on age-related maculopathy. Ann
Epidemiol 2007;17(8):615-21.
10. Dietrich T, Hoffmann K. A comprehensive index for the modeling of smoking
history in periodontal research. J Dent Res 2004;83(11):859-63.
11. Dawber T. The Framingham study: the epidemiology of atherosclerotic disease.
Cambridge, Mass.: Harvard University Press, 1980.
12. National Heart L, and Blood Institute, Boston University. The Framingham Heart
Study: 50 years of research success. Framingham, MA: Framingham Heart
Study; 2012. (http://www.nhlbi.nih.gov/about/framingham/index.html).
(Accessed November 5, 2012).
13. D'Agostino RB, Sr., Vasan RS, Pencina MJ, et al. General cardiovascular risk
profile for use in primary care: the Framingham Heart Study. Circulation
2008;117(6):743-53.
14. Wilson PWF, D'Agostino RB, Sullivan L, et al. Overweight and obesity as
determinants of cardiovascular risk: the Framingham experience. Arch Intern
Med 2002;162(16):1867-72.
15. Parmar MKB, Machin D. Survival analysis : a practical approach. Chichester ;
New York: J. Wiley, 1995.
16. Fisher LD, Lin DY. Time-Dependent Covariates in The Cox Proportional-Hazards
Regression Model. Annual Review of Public Health 1999;20(1):145-57.
Page 23 of 65
For peer review only - http://bmjopen.bmj.com/site/about/guidelines.xhtml
BMJ Open
123456789101112131415161718192021222324252627282930313233343536373839404142434445464748495051525354555657585960
on 2 March 2019 by guest. P
rotected by copyright.http://bm
jopen.bmj.com
/B
MJ O
pen: first published as 10.1136/bmjopen-2014-005629 on 17 S
eptember 2014. D
ownloaded from

For peer review only
24
17. Kleinbaum DG, Klein M. Survival Analysis: A Self-Learning Text. the United
States of America: Springer, 2005.
18. Cleophas TJM, Zwinderman AH. Machine Learning in Medicine. Dordrecht:
Springer, 2013.
19. Akaike H. A new look at the statistical model identification. IEEE Transactions on
Automatic Control 1974;19(6):716–23.
20. StataCorp LP. Stata Survival Analysis and Epidemiological Tables Reference
Manual Release 10. College Station, TX: Stata Corporation 2007.
21. Preston SH, Mehta NK, Stokes A. Modeling obesity histories in cohort analyses of
health and mortality. Epidemiology 2013;24(1):158-66.
22. National Center for Health Statistics National HaNESH, MD: National Center for
Health Statistics; (http://www.cdc.gov/nchs/nhanes.htm). (Accessed 3
November 2002). Secondary.
23. CDC. State-Specific Prevalence of Obesity Among Adults — United States.
MMWR 2008;57(36):765-8.
24. World Health Organization. Global Database on Body Mass Index. Secondary
Global Database on Body Mass Index 2014. http://apps.who.int/bmi/index.jsp.
25. Lee JM, Pilli S, Gebremariam A, et al. Getting heavier, younger: trajectories of
obesity over the life course. Int J Obes (Lond) 2010;34(4):614-23.
26. Vazquez G, Duval S, Jacobs DR, Jr., et al. Comparison of Body Mass Index, Waist
Circumference, and Waist/Hip Ratio in Predicting Incident Diabetes: A Meta-
Analysis. Epidemiol Rev 2007;29(1):115-28.
27. Lagergren J, Bergström R, Lindgren A, et al. The role of tobacco, snuff and alcohol
use in the aetiology of cancer of the oesophagus and gastric cardia. Int J Cancer
2000;85(3):340-6.
28. Yuan JM, Wang XL, Xiang YB, et al. Non-dietary risk factors for nasopharyngeal
carcinoma in Shanghai, China. Int J Cancer 2000;85(3):364-9.
Page 24 of 65
For peer review only - http://bmjopen.bmj.com/site/about/guidelines.xhtml
BMJ Open
123456789101112131415161718192021222324252627282930313233343536373839404142434445464748495051525354555657585960
on 2 March 2019 by guest. P
rotected by copyright.http://bm
jopen.bmj.com
/B
MJ O
pen: first published as 10.1136/bmjopen-2014-005629 on 17 S
eptember 2014. D
ownloaded from

For peer review only
25
Table 1: Illustration of the Calculation of an Obese-Years Metric for a Single
Hypothetical Individual
ID Examination Interval
Between
Examinations,
yearsa
Body
Mass
Indexb
Degree of
Obesity
Duration of
Obesity, years
Obese-Yearsa Cumulative
Obese-Years
6 1 (baseline) - 28 0 - 0 0
6 2 2 30 1 0 0 0
6 3 2 32 3 2 2 2
6 4 3 34 5 3 9 11
6 5 1 32 3 1 5 16
6 6 2 30 1 2 6 22
6 7 1.5 28 0 1.5 1.5 23.5
6 8 2.5 28 0 0 0 23.5
6 9 2 30 1 0 0 23.5
6 10 1.5 32 3 1.5 1.5 25
6 11 3 34 5 3 9 34
6 12 2 32 3 2 10 44
6 13 2 30 1 2 6 50 a All intervals refer to the interval between the current examination and the prior examination
b Body mass index; weight (kg)/height (m)
2.
Page 25 of 65
For peer review only - http://bmjopen.bmj.com/site/about/guidelines.xhtml
BMJ Open
123456789101112131415161718192021222324252627282930313233343536373839404142434445464748495051525354555657585960
on 2 March 2019 by guest. P
rotected by copyright.http://bm
jopen.bmj.com
/B
MJ O
pen: first published as 10.1136/bmjopen-2014-005629 on 17 S
eptember 2014. D
ownloaded from

For peer review only
26
Table 2: Characteristics of the study populationa
Number Percentage Median Range P value
e
Participant Characteristics Total Males Females Total Males Females Total Males Females Total Males Females
Eligible sample 5,036 2,237 2,799 100 44 46
Participants ever obese during study follow-up 1,247 494 750 24.7 40 60 0.000
Age at baseline (years) 43 43 43 28–62 29-62 28-62 0.483
Born in the United States 4,082 1,826 2,256 81 44.7 55.3 0.355
Marital status 0.000
Single 452 117 335 9 5 12
Married 4,269 2,075 2,194 85 93 78
Widowed, divorced, or separated 315 45 270 6 2 10
Educational level 0.000
Eighth grade or less 1,374 616 758 27 28 27
High school 2,306 1,022 1,284 46 46 46
College 752 392 360 15 18 13
Graduate school 604 207 397 12 9 14
Health behavior
Current smoker at baseline 2,583 1,435 1,154 52 55 45 0.000
Ever-smoker during study follow-up period 3,178 1,837 1,341 63 58 42 0.000
Physical activity score at examination 4 32 33 31 25–83 25-83 25-55 0.000
Alcohol drinking at examination 2, yes, ounces/monthb
3,183 1,648 1,535 63 52 48 8 15 4 1–360 1-360 1-240 0.000
Body weight characteristics
Body mass index at baseline (kg/m2)
c 25.1 25.6 24.6 16.2–46.3 16.8-38.1 16.2–46.3 0.000
Underweight (<18.5) 65 14 51 1 1 2 0.000
Normal weight (18.5–24.9) 2,405 945 1,460 48 42 52
Overweight (25–29.9) 1,989 1,057 932 40 47 33
Obese (≥30) 567 217 350 11 10 13
Cumulative obesity duration (years) d 12 10 12 2–46 2–46 2–46 0.001
Cumulative obese-years d
24 15 31 2–556 2-251 2-556 0.000
Cumulative obese-years category d 0.000
1–24.9 579 269 319 52 62 45
25–49.9 192 77 115 17 18 17
50–74.9 119 31 87 11 7 13
Page 26 of 65
For peer review only - http://bmjopen.bmj.com/site/about/guidelines.xhtml
BMJ Open
123456789101112131415161718192021222324252627282930313233343536373839404142434445464748495051525354555657585960
on 2 March 2019 by guest. Protected by copyright. http://bmjopen.bmj.com/ BMJ Open: first published as 10.1136/bmjopen-2014-005629 on 17 September 2014. Downloaded from
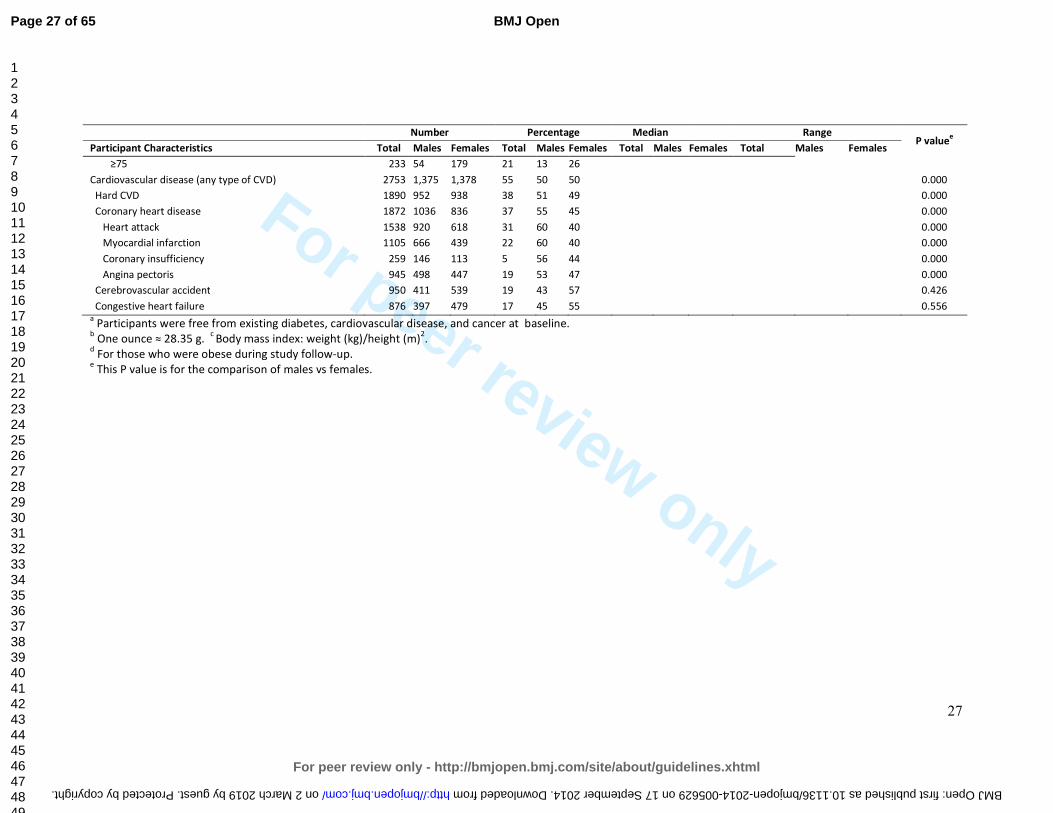
For peer review only
27
Number Percentage Median Range P value
e
Participant Characteristics Total Males Females Total Males Females Total Males Females Total Males Females
≥75 233 54 179 21 13 26
Cardiovascular disease (any type of CVD) 2753 1,375 1,378 55 50 50 0.000
Hard CVD 1890 952 938 38 51 49 0.000
Coronary heart disease 1872 1036 836 37 55 45 0.000
Heart attack 1538 920 618 31 60 40 0.000
Myocardial infarction 1105 666 439 22 60 40 0.000
Coronary insufficiency 259 146 113 5 56 44 0.000
Angina pectoris 945 498 447 19 53 47 0.000
Cerebrovascular accident 950 411 539 19 43 57 0.426
Congestive heart failure 876 397 479 17 45 55 0.556 a Participants were free from existing diabetes, cardiovascular disease, and cancer at baseline.
b One ounce ≈ 28.35 g.
c Body mass index: weight (kg)/height (m)
2.
d For those who were obese during study follow-up.
e This P value is for the comparison of males vs females.
Page 27 of 65
For peer review only - http://bmjopen.bmj.com/site/about/guidelines.xhtml
BMJ Open
123456789101112131415161718192021222324252627282930313233343536373839404142434445464748495051525354555657585960
on 2 March 2019 by guest. Protected by copyright. http://bmjopen.bmj.com/ BMJ Open: first published as 10.1136/bmjopen-2014-005629 on 17 September 2014. Downloaded from

For peer review only
28
Table 3: Incidence of Cardiovascular Disease (Events/1,000 Person-Years) According to
Categories of Cumulative Obese-Years
Obese-Years
categories
Events PYFU Incident Rate
Total population
0 year 2,177 116,681 18.66 (17.89-19.46)
1-25 years 276 10,846 25.45 (22.62-28.63)
25-50 years 124 4,509 27.50 (23.06-32.80)
50-75 years 78 2,365 32.98 (26.42-41.18)
>=75years 186 4,517 41.17 (35.66-47.54)
Males
0 year 1,138 46,950 24.24 (22.87-25.69)
1-25 years 134 4,669 28.70 (24.23-34.00)
25-50 years 56 1,710 32.75 (25.21-42.56)
50-75 years 36 720 50.02 (36.08-69.34)
>=75years 49 951 51.51 (38.93-68.16)
Females
0 year 1,039 69,731 14.90 (14.02-15.83)
1-25 years 142 6,177 22.99 (19.50-27.10)
25-50 years 68 2,799 24.30 (19.16-30.81)
50-75 years 42 1,645 25.53 (18.87-34.54)
>=75years 137 3,566 38.42 (32.49-45.42)
PYFU = Persons years of follow-up
Page 28 of 65
For peer review only - http://bmjopen.bmj.com/site/about/guidelines.xhtml
BMJ Open
123456789101112131415161718192021222324252627282930313233343536373839404142434445464748495051525354555657585960
on 2 March 2019 by guest. P
rotected by copyright.http://bm
jopen.bmj.com
/B
MJ O
pen: first published as 10.1136/bmjopen-2014-005629 on 17 S
eptember 2014. D
ownloaded from
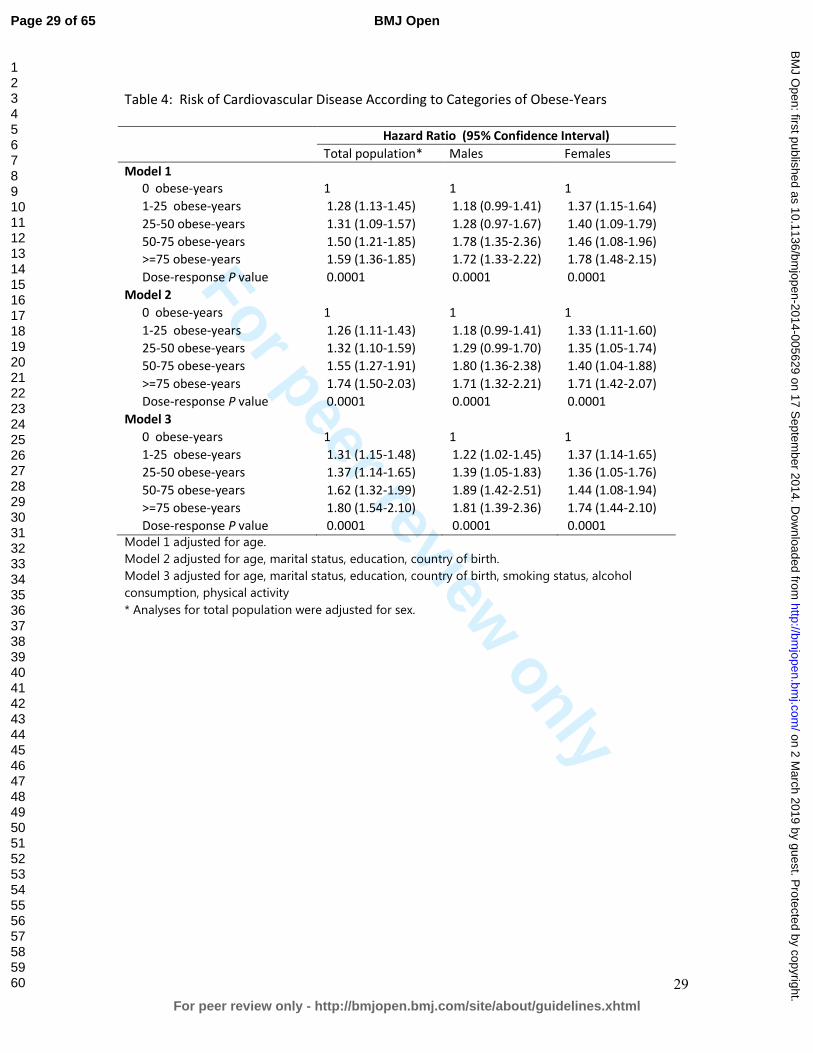
For peer review only
29
Table 4: Risk of Cardiovascular Disease According to Categories of Obese-Years
Hazard Ratio (95% Confidence Interval)
Total population* Males Females
Model 1
0 obese-years 1 1 1
1-25 obese-years 1.28 (1.13-1.45) 1.18 (0.99-1.41) 1.37 (1.15-1.64)
25-50 obese-years 1.31 (1.09-1.57) 1.28 (0.97-1.67) 1.40 (1.09-1.79)
50-75 obese-years 1.50 (1.21-1.85) 1.78 (1.35-2.36) 1.46 (1.08-1.96)
>=75 obese-years 1.59 (1.36-1.85) 1.72 (1.33-2.22) 1.78 (1.48-2.15)
Dose-response P value 0.0001 0.0001 0.0001
Model 2
0 obese-years 1 1 1
1-25 obese-years 1.26 (1.11-1.43) 1.18 (0.99-1.41) 1.33 (1.11-1.60)
25-50 obese-years 1.32 (1.10-1.59) 1.29 (0.99-1.70) 1.35 (1.05-1.74)
50-75 obese-years 1.55 (1.27-1.91) 1.80 (1.36-2.38) 1.40 (1.04-1.88)
>=75 obese-years 1.74 (1.50-2.03) 1.71 (1.32-2.21) 1.71 (1.42-2.07)
Dose-response P value 0.0001 0.0001 0.0001
Model 3
0 obese-years 1 1 1
1-25 obese-years 1.31 (1.15-1.48) 1.22 (1.02-1.45) 1.37 (1.14-1.65)
25-50 obese-years 1.37 (1.14-1.65) 1.39 (1.05-1.83) 1.36 (1.05-1.76)
50-75 obese-years 1.62 (1.32-1.99) 1.89 (1.42-2.51) 1.44 (1.08-1.94)
>=75 obese-years 1.80 (1.54-2.10) 1.81 (1.39-2.36) 1.74 (1.44-2.10)
Dose-response P value 0.0001 0.0001 0.0001
Model 1 adjusted for age.
Model 2 adjusted for age, marital status, education, country of birth.
Model 3 adjusted for age, marital status, education, country of birth, smoking status, alcohol
consumption, physical activity
* Analyses for total population were adjusted for sex.
Page 29 of 65
For peer review only - http://bmjopen.bmj.com/site/about/guidelines.xhtml
BMJ Open
123456789101112131415161718192021222324252627282930313233343536373839404142434445464748495051525354555657585960
on 2 March 2019 by guest. P
rotected by copyright.http://bm
jopen.bmj.com
/B
MJ O
pen: first published as 10.1136/bmjopen-2014-005629 on 17 S
eptember 2014. D
ownloaded from
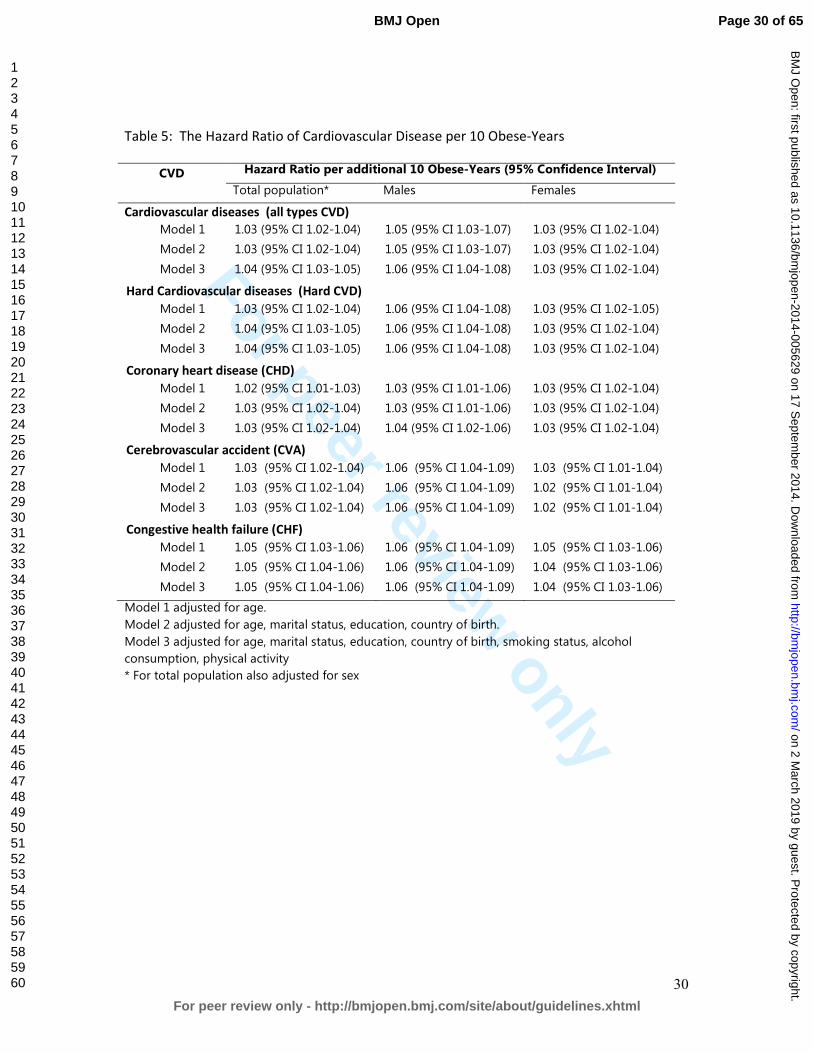
For peer review only
30
Table 5: The Hazard Ratio of Cardiovascular Disease per 10 Obese-Years
CVD Hazard Ratio per additional 10 Obese-Years (95% Confidence Interval)
Total population* Males Females
Cardiovascular diseases (all types CVD)
Model 1 1.03 (95% CI 1.02-1.04) 1.05 (95% CI 1.03-1.07) 1.03 (95% CI 1.02-1.04)
Model 2 1.03 (95% CI 1.02-1.04) 1.05 (95% CI 1.03-1.07) 1.03 (95% CI 1.02-1.04)
Model 3 1.04 (95% CI 1.03-1.05) 1.06 (95% CI 1.04-1.08) 1.03 (95% CI 1.02-1.04)
Hard Cardiovascular diseases (Hard CVD)
Model 1 1.03 (95% CI 1.02-1.04) 1.06 (95% CI 1.04-1.08) 1.03 (95% CI 1.02-1.05)
Model 2 1.04 (95% CI 1.03-1.05) 1.06 (95% CI 1.04-1.08) 1.03 (95% CI 1.02-1.04)
Model 3 1.04 (95% CI 1.03-1.05) 1.06 (95% CI 1.04-1.08) 1.03 (95% CI 1.02-1.04)
Coronary heart disease (CHD)
Model 1 1.02 (95% CI 1.01-1.03) 1.03 (95% CI 1.01-1.06) 1.03 (95% CI 1.02-1.04)
Model 2 1.03 (95% CI 1.02-1.04) 1.03 (95% CI 1.01-1.06) 1.03 (95% CI 1.02-1.04)
Model 3 1.03 (95% CI 1.02-1.04) 1.04 (95% CI 1.02-1.06) 1.03 (95% CI 1.02-1.04)
Cerebrovascular accident (CVA)
Model 1 1.03 (95% CI 1.02-1.04) 1.06 (95% CI 1.04-1.09) 1.03 (95% CI 1.01-1.04)
Model 2 1.03 (95% CI 1.02-1.04) 1.06 (95% CI 1.04-1.09) 1.02 (95% CI 1.01-1.04)
Model 3 1.03 (95% CI 1.02-1.04) 1.06 (95% CI 1.04-1.09) 1.02 (95% CI 1.01-1.04)
Congestive health failure (CHF)
Model 1 1.05 (95% CI 1.03-1.06) 1.06 (95% CI 1.04-1.09) 1.05 (95% CI 1.03-1.06)
Model 2 1.05 (95% CI 1.04-1.06) 1.06 (95% CI 1.04-1.09) 1.04 (95% CI 1.03-1.06)
Model 3 1.05 (95% CI 1.04-1.06) 1.06 (95% CI 1.04-1.09) 1.04 (95% CI 1.03-1.06)
Model 1 adjusted for age.
Model 2 adjusted for age, marital status, education, country of birth.
Model 3 adjusted for age, marital status, education, country of birth, smoking status, alcohol
consumption, physical activity
* For total population also adjusted for sex
Page 30 of 65
For peer review only - http://bmjopen.bmj.com/site/about/guidelines.xhtml
BMJ Open
123456789101112131415161718192021222324252627282930313233343536373839404142434445464748495051525354555657585960
on 2 March 2019 by guest. P
rotected by copyright.http://bm
jopen.bmj.com
/B
MJ O
pen: first published as 10.1136/bmjopen-2014-005629 on 17 S
eptember 2014. D
ownloaded from
For peer review only
31
Table 6: Comparison of the Obese-Years Metric, Body Mass Index and Obesity Duration as
Predictors of the Risk for Cardiovascular Disease
Constructs Akaike Information Criterion (AIC)
Total population Males Females
Cardiovascular diseases (all types CVD)
Construct 1: Level of BMI 43390 19227 20307
Construct 2: Duration of obesity 43379 19221 20306
Construct 3: Obese-Years 43368 19209 20294
Hard Cardiovascular diseases (Hard CVD)
Construct 1: Level of BMI 34069 15102 15976
Construct 2: Duration of obesity 34065 15099 15968
Construct 3: Obese-Years 34050 15096 15955
Coronary heart disease (CHD)
Construct 1: Level of BMI 29038 14355 12156
Construct 2: Duration of obesity 29039 14354 12162
Construct 3: Obese-Years 29028 14351 12152
Cerebrovascular accident (CVA)
Construct 1: Level of BMI 13575 5211 7147
Construct 2: Duration of obesity 13577 5208 7141
Construct 3: Obese-Years 13573 5208 7136
Congestive health failure (CHF)
Construct 1: Level of BMI 13141 5275 6667
Construct 2: Duration of obesity 13122 5263 6663
Construct 3: Obese-Years 13104 5255 6649
Each construct was split into 11 categories; 1 represents “not obese” and 2-11 represent deciles of
obesity exposure (level, duration and obese-years)
Each model adjusted for sex, age, marital status, education, smoking, alcohol consumption, and
physical activity.
Page 31 of 65
For peer review only - http://bmjopen.bmj.com/site/about/guidelines.xhtml
BMJ Open
123456789101112131415161718192021222324252627282930313233343536373839404142434445464748495051525354555657585960
on 2 March 2019 by guest. P
rotected by copyright.http://bm
jopen.bmj.com
/B
MJ O
pen: first published as 10.1136/bmjopen-2014-005629 on 17 S
eptember 2014. D
ownloaded from
For peer review only
Title:
Estimating the risk of cardiovascular disease using an obese-years metric
Running title:
Obese-years and cardiovascular disease
Authors:
Asnawi Abdullah, PhD1,3
Fauzi Ali Amin, MPH2
Johannes Stoelwinder, MD3
Stephanie K Tanamas, PhD4
Rory Wolfe, PhD3
Jan Barendregt, PhD 5
Anna Peeters, PhD3,4
Authors Address: 1 Department of Biostatistics and Population Health. Faculty of Public Health,
University Muhammadiyah Aceh, Indonesia; 2 Department of Public Health Nutrition. Faculty of Public Health, University
Muhammadiyah Aceh, Indonesia; 3 Department of Epidemiology and Preventive Medicine, School of Public
Health and Preventive Medicine, Monash University, Australia; 4 Baker IDI Heart and Diabetes Institute, Australia; 5 School of Population Health, University Queensland, Australia.
Correspondence to:
Asnawi Abdullah, Department of Biostatistics and Population Health, Faculty of
Public Health, University of Muhammadiyah Aceh, Jln. Leung Bata, Batoh,
Banda Aceh, Indonesia, 23245. Phone +6265131054, Fax. +6265131053, Email:
Word count:
Text = 2960 3325 words; Abstract = 30294 words; 25 28 references, Tables 56
Page 32 of 65
For peer review only - http://bmjopen.bmj.com/site/about/guidelines.xhtml
BMJ Open
123456789101112131415161718192021222324252627282930313233343536373839404142434445464748495051525354555657585960
on 2 March 2019 by guest. P
rotected by copyright.http://bm
jopen.bmj.com
/B
MJ O
pen: first published as 10.1136/bmjopen-2014-005629 on 17 S
eptember 2014. D
ownloaded from
For peer review only
2
ABSTRACT:
Objective: To examine the association between obese-years and the risk of
cardiovascular disease (CVD).
Study design: Prospective cohort study
for approximately 50 years of follow-up.
Setting: Boston, USA
Participants: 5036 participants of the original Framingham Heart Study were
examined.
Methods: The variable of oObese-years was calculated by multiplying for each
participant the number of BMI units above 3029 kg/m2 by the number of years
lived at that BMI during approximately 50 years of follow-up. The association
between obese-years and the outcome CVD was analyzed by using time-
dependent Cox regression adjusted for potential confounders and compared
with the currentother models using the Akaike Information Criterion (AIC). The
lowest AIC indicated better fit.
Primary outcome: Cardiovascular diseases.
The Results: The averagemedian cumulative obese-years was 63 24 (range, 2–
556 obese-years). During 138,918 person-years of follow-up, 2753 (55%)
participants were diagnosed with CVDcardiovascular disease. The incidence
rates and adjusted hazards ratios (ORAHR) for CVD increased with an increase
in the number of obese-years. OR AHR for the categories 1–24.9, 25–49.9, 50–
74.9, and ≥75 obese-years was were respectively 1.31 (95% CI: 1.15–1.48), 1.37
(95% CI: 1.14–1.65), 1.62 (95% CI: 1.32–1.99), and 1.80 (95% CI: 1.54–2.10)
compared with those who were never obese (i.e. had zero obese-years)
respectively. A dose-response relationship (across the 5 categories) was
significant (P trend= 0.001). Effect The effect of obese-years was higher
stronger in males than females. For every 10 unit increase in obese-years, the
AOHR of CVD increased by 6% (95% CI 4% to 8%) for males and 3% (95% CI
2% to 4%) for females. The AIC was lowest in for the model containing obese-
years compared with models containing either the level of BMI or the duration
of obesity alone.
Conclusions: This study demonstrates that obese-years metric conceptually
captures the cumulative damage of obesity on body systems, and is found to
provide slightly more precise estimation of the risk of CVD than level or the
duration of obesity alone.
Page 33 of 65
For peer review only - http://bmjopen.bmj.com/site/about/guidelines.xhtml
BMJ Open
123456789101112131415161718192021222324252627282930313233343536373839404142434445464748495051525354555657585960
on 2 March 2019 by guest. P
rotected by copyright.http://bm
jopen.bmj.com
/B
MJ O
pen: first published as 10.1136/bmjopen-2014-005629 on 17 S
eptember 2014. D
ownloaded from
For peer review only
3
This study confirms that the obese-years construct is an independent risk
factor for CVD. Obese-years metric is a better predictor the risk of CVD
although it shows similar risk estimation to other two models.
Key Words: Obesity, BMI, the duration of obesity, obese-years, risk factor,
cardiovascular disease
Page 34 of 65
For peer review only - http://bmjopen.bmj.com/site/about/guidelines.xhtml
BMJ Open
123456789101112131415161718192021222324252627282930313233343536373839404142434445464748495051525354555657585960
on 2 March 2019 by guest. P
rotected by copyright.http://bm
jopen.bmj.com
/B
MJ O
pen: first published as 10.1136/bmjopen-2014-005629 on 17 S
eptember 2014. D
ownloaded from
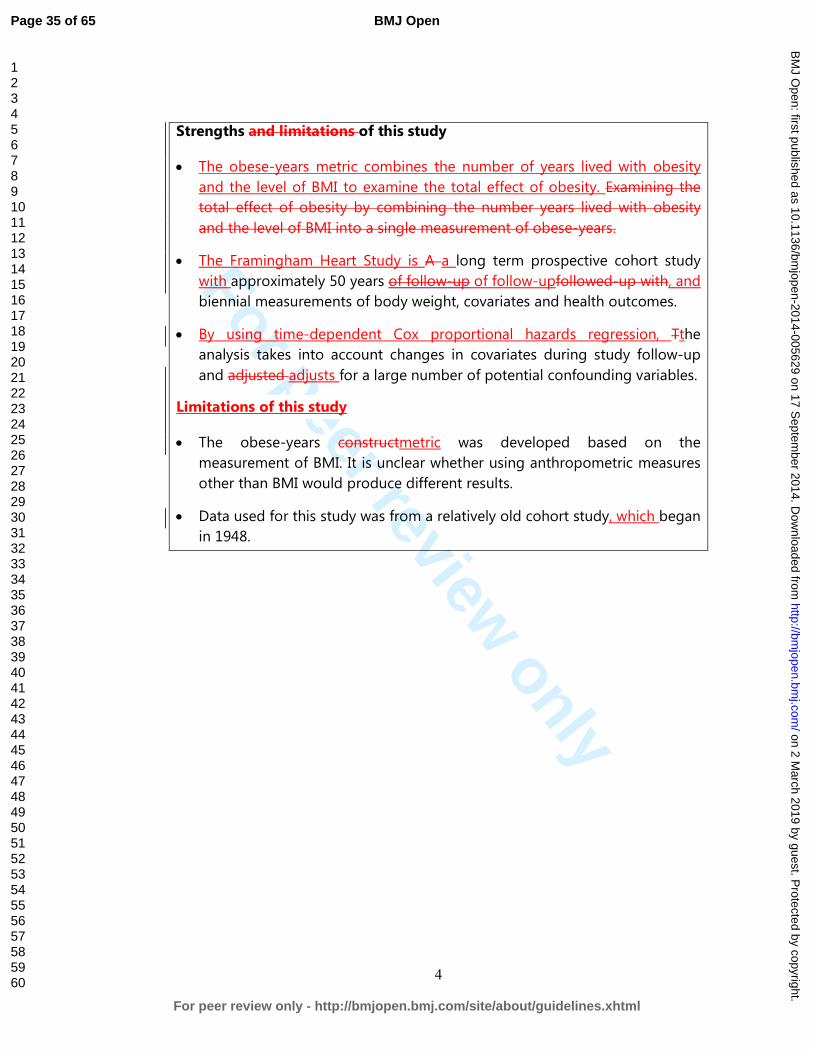
For peer review only
4
Strengths and limitations of this study
• The obese-years metric combines the number of years lived with obesity
and the level of BMI to examine the total effect of obesity. Examining the
total effect of obesity by combining the number years lived with obesity
and the level of BMI into a single measurement of obese-years.
• The Framingham Heart Study is A a long term prospective cohort study
with approximately 50 years of follow-up of follow-upfollowed-up with, and
biennial measurements of body weight, covariates and health outcomes.
• By using time-dependent Cox proportional hazards regression, Tthe
analysis takes into account changes in covariates during study follow-up
and adjusted adjusts for a large number of potential confounding variables.
Limitations of this study
• The obese-years constructmetric was developed based on the
measurement of BMI. It is unclear whether using anthropometric measures
other than BMI would produce different results.
• Data used for this study was from a relatively old cohort study, which began
in 1948.
Page 35 of 65
For peer review only - http://bmjopen.bmj.com/site/about/guidelines.xhtml
BMJ Open
123456789101112131415161718192021222324252627282930313233343536373839404142434445464748495051525354555657585960
on 2 March 2019 by guest. P
rotected by copyright.http://bm
jopen.bmj.com
/B
MJ O
pen: first published as 10.1136/bmjopen-2014-005629 on 17 S
eptember 2014. D
ownloaded from
For peer review only
5
Background
The association between Oobesity has been associated with an increased risk
of and cardiovascular disease (CVD) is well known1 2. However, these findings
are generally based on analysing only the level of BMI in relation to CVD. More
recently, studies have demonstrated the importance of taking into account the
potential cumulative effect of the duration of obesity, rather than the simple
assessment of obesity at a single point in time (e.g. at baseline). In addition, we
have recently demonstrated that the dDuration of obesity has been shown to
be ais also risk factor for CVD3, type-2 diabetes4 and mortality5, independent of
level of body mass index (BMI)3. Nevertheless, analyses based on either level of
BMI alone or duration lived with obesity alone, However, the quantification of
these association by only analysing the level of BMI 6 or the duration lived with
obesity4 5. This approach may not reflect the total effect of obesity and may
underestimated the risk of CVD associated withattributable to obesity.
We have recently demonstrated the additional benefit of constructs combining
the level of obesity with the number of years lived with obesity into a single
measure, finding that an obese-years constructmetric is a better predictor of
the risk of type-2 diabetes than level of BMI or duration of obesity alone7. A
similar approach that has been used in smoking studies, examining the adverse
Page 36 of 65
For peer review only - http://bmjopen.bmj.com/site/about/guidelines.xhtml
BMJ Open
123456789101112131415161718192021222324252627282930313233343536373839404142434445464748495051525354555657585960
on 2 March 2019 by guest. P
rotected by copyright.http://bm
jopen.bmj.com
/B
MJ O
pen: first published as 10.1136/bmjopen-2014-005629 on 17 S
eptember 2014. D
ownloaded from
For peer review only
6
health effects associated with the combination of number of cigarettes or
packs smoked per day (degree) and duration of smoking as a cigarette-years
or pack-years 8-10.
The use of a similar construct for body weightthe obese-years constructmetric,
to estimate the risk of CVD has not been investigated yet. We hypothesized
that the obese-years constructmetric is likely a similar independent risk factor
for CVD and would provide an improved estimation of the risk of future CVD.
This study aimed to examine the association between obese-years and risk of
CVD and to examine whether the obese-years constructmetric wais a better
predictor for risk of CVD than current BMI or duration of obesity alone. We
investigated these objectives using the original Framingham Heart Study (FHS),
a long term prospective cohort study where body weight, health outcomes and
other covariates were measured regularly biennially for almost 50 years11.
METHODS
Data source
We used data from the original Framingham Heart Study (OFHS)12. In this
prospective cohort study, 5,209 participants (aged 28–62 years at the time of
enrolment) were examined regularly at 2-years intervalsattended biennial
Page 37 of 65
For peer review only - http://bmjopen.bmj.com/site/about/guidelines.xhtml
BMJ Open
123456789101112131415161718192021222324252627282930313233343536373839404142434445464748495051525354555657585960
on 2 March 2019 by guest. P
rotected by copyright.http://bm
jopen.bmj.com
/B
MJ O
pen: first published as 10.1136/bmjopen-2014-005629 on 17 S
eptember 2014. D
ownloaded from
For peer review only
7
examinations for approximately 50 years beginning from 1948. For the purpose
of this study, only participants who were free from CVD (any types), cancer and
type-2 diabetes at baseline were included in the analysis (n = 5,036).
Variables: measurement, missing and imputation
Most of variables in the FHS was were measured regularly at every the two-
yearsyearly intervalexaminations, including body weight, height, demographic
variables, health behaviors, and health outcomes (including cardiovascular
disease)11. However sSome values are missing by design where variables were
not collected at every examination. For example the variables of current
smoking status was not recorded at four examinations (2, 3, 6 and 17),
cholesterol was not measured at seven examinations (11, 12, 17-20 and 22),
alcohol consumption was measured only atin eight examinations (2, 4, 7, 19,
20–23), and physical activity was measured only at four examinations (4, 11, 12,
and 19). For In this circumstance, the nearest most contemporary measured
value of the covariatevariable was used in place of missing values at the
examination times when the variable was not measured. Another missing data
circumstance was when missing values occurred intermittently missing one or
more values during study follow-up; for example body weight and hence BMI.
In this case missing values for BMI were imputed with a conditional mean
Page 38 of 65
For peer review only - http://bmjopen.bmj.com/site/about/guidelines.xhtml
BMJ Open
123456789101112131415161718192021222324252627282930313233343536373839404142434445464748495051525354555657585960
on 2 March 2019 by guest. P
rotected by copyright.http://bm
jopen.bmj.com
/B
MJ O
pen: first published as 10.1136/bmjopen-2014-005629 on 17 S
eptember 2014. D
ownloaded from

For peer review only
8
estimated by a multiple linear regression model using age at prior exam, sex
and several transformations of the previously measured BMI (BMI, log BMI, BMI
squared and BMI as a categorical variable). Methods of measurement of these
variables have been described in detail elsewhere4 7.
The level of obesity, duration and obese-years measurement
A participant was considered obese at a given examination if their BMI was
greater than or equal to 30 kg/m2. The level of obesity was defined as follows:
(1) if BMI < 30 kg/m2, the level was zero; and (2) if BMI ≥ 30 kg/m2, the level
was BMI minus 29 kg/m2. For example, if BMI was 35 kg/m2, the level was 6 (35
– 29) obese units.
The duration of obesity was defined usingfollowed a similar definition to that
as has been described previously4. The duration of obesity was calculated for
those individuals with at least two consecutive examinations with the
occurrences of obesity (which implies is interpreted as indicating at least two
years of being continuously obese). The requirement for two consecutive
examinations with obesity was to avoid the potential misclassification of body
Page 39 of 65
For peer review only - http://bmjopen.bmj.com/site/about/guidelines.xhtml
BMJ Open
123456789101112131415161718192021222324252627282930313233343536373839404142434445464748495051525354555657585960
on 2 March 2019 by guest. P
rotected by copyright.http://bm
jopen.bmj.com
/B
MJ O
pen: first published as 10.1136/bmjopen-2014-005629 on 17 S
eptember 2014. D
ownloaded from
For peer review only
9
weight, either due to measurement error or fluctuations between the
borderline of the ‘overweight’ category or the ‘obese’ category. For those
individuals without two consecutive obesity occurrences, duration was
considered to be zero at all exams. For those individuals with two consecutive
obesity occurrences, the beginning of their obesity duration interval was
defined as the date of the first of these two examinations and from that time,
the individual was considered to be continuously obese until either the first of
two consecutive non-obese examinations, or death, or the end of follow-up at
examination 24. The duration increased incrementally at each exam according
to the time (in years) between the current exam and the first obese
examination. Individuals could have multiple periods of obesity duration during
follow-up.
The level of obesity and the duration of obesity then was combined into a
single variable called obese-years. Obese-years lived were The variable was
calculated at each examination as the defined level of obesity (in “obese units”)
multiplied by the defined duration of obesity (in years). The cumulative number
of obese-years was calculated at each examination as a sum of all obese-year
“exposures” up to and including that examination as has been illustrated in the
previous paper7
Page 40 of 65
For peer review only - http://bmjopen.bmj.com/site/about/guidelines.xhtml
BMJ Open
123456789101112131415161718192021222324252627282930313233343536373839404142434445464748495051525354555657585960
on 2 March 2019 by guest. P
rotected by copyright.http://bm
jopen.bmj.com
/B
MJ O
pen: first published as 10.1136/bmjopen-2014-005629 on 17 S
eptember 2014. D
ownloaded from

For peer review only
10
The level of obesity and the duration of obesity were combined as a single
variable called obese-years. Obese-years was calculated at each examination as
the defined level of obesity (in “obese units”) multiplied by the defined
duration of obesity (in years). Then the cumulative total of obese-years for
each examination was calculated as a sum of all obese-year “exposures” up to
and including that examination.
Table 1 illustrates the calculation of obese-years for a single individual. This
participant first had a measurement of obesity at examination 2 and was
assigned obesity duration of zero at this examination. At examination 3, this
participant was assumed to have lived with obesity for 2 years (the interval
between examination 2 and examination 3) with a degree of obesity of 1
kg/m2. This approach assumes that an individual’s BMI is carried forward from
a given examination (i.e., examination 2) and does not change until a different
BMI value at a subsequent examination (i.e., examination 3). The number of
obese-years at examination 3 was therefore 2 obese-years (1 BMI unit X 2
years in the preceding interval). From examination 3 to examination 4 (a 3 year
interval), the participant was still obese with a degree of obesity of 3 kg/m2
(BMI 32 kg/m2). At examination 4, the number of obese-years was 9 (3BMI unit
Page 41 of 65
For peer review only - http://bmjopen.bmj.com/site/about/guidelines.xhtml
BMJ Open
123456789101112131415161718192021222324252627282930313233343536373839404142434445464748495051525354555657585960
on 2 March 2019 by guest. P
rotected by copyright.http://bm
jopen.bmj.com
/B
MJ O
pen: first published as 10.1136/bmjopen-2014-005629 on 17 S
eptember 2014. D
ownloaded from
For peer review only
11
X 3 years) and the cumulative obese-years at this examination was 11 obese-
years (2 plus 9).
This method implies that individuals accumulating 50 obese-years, for example,
could have reached this quantity either by having been obese with BMI of 30
kg/m2 for approximately 50 years or by having been obese with BMI of 34
kg/m2 for approximately 10 years or, indeed, many other combinations.
Measurement of the outcome and time to event
The main outcome of interest in this study was CVD incidencet (the first event
of any type of CVD; defined as a composite of coronary heart disease (CHD),
cerebrovascular accident (CVA), peripheral artery disease, and congestive heart
failure (CHF)13. Additional outcomes were individual types of CVD: hard CVD,
CHD, CVA, and CHF. Hard CVD was defined as a composite of hard CHD
(coronary death, myocardial infarction), stroke (fatal and nonfatal), peripheral
artery disease and heart failure. In the OFHS, the criteria for each cardiovascular
outcome during follow-up were standardized14 and a panel of Framingham
investigators made the decisionan adjudication regarding diagnosis. CHD
includes the diagnoses of (1) angina pectoris, evidenced by a typical history of
chest pain on a physician-administered questionnaire; (2) myocardial infarction,
determined by specified electrocardiographic changes, diagnostic elevation of
Page 42 of 65
For peer review only - http://bmjopen.bmj.com/site/about/guidelines.xhtml
BMJ Open
123456789101112131415161718192021222324252627282930313233343536373839404142434445464748495051525354555657585960
on 2 March 2019 by guest. P
rotected by copyright.http://bm
jopen.bmj.com
/B
MJ O
pen: first published as 10.1136/bmjopen-2014-005629 on 17 S
eptember 2014. D
ownloaded from
For peer review only
12
serum enzymes with prolonged ischemic chest pain, or on autopsy; (3)
coronary insufficiency, defined as prolonged ischemic chest pain accompanied
by transient ischemic abnormalities on the ECG; and (4) sudden (in less than 1
hour) or non-sudden coronary death. CHF was indicated when at least two
major or one major and two minor diagnostic conditions existed concurrently
upon examination.
Time to event was measured as the time from cohort entry until the date a
participant was diagnosed as having cardiovascular diseaseCVD. Individuals
who died or reached the end of the follow-up (examination 24) before
developing CVD were censored at date of death or examination 24,
respectively.
Data analysis
To model the relationship between the various measures of obesity and risk of
CVD in a dynamic survival model way6 an (extended time-dependent Cox
regression model involving time-dependent (time-varying) variables15-18 was
used. The demographic and health behavior variables included in the analysis
were age, sex and country of birth at baseline, and the time-varying values of ,
sex and country of birth at baseline, and the time-varying values of sex,
Page 43 of 65
For peer review only - http://bmjopen.bmj.com/site/about/guidelines.xhtml
BMJ Open
123456789101112131415161718192021222324252627282930313233343536373839404142434445464748495051525354555657585960
on 2 March 2019 by guest. P
rotected by copyright.http://bm
jopen.bmj.com
/B
MJ O
pen: first published as 10.1136/bmjopen-2014-005629 on 17 S
eptember 2014. D
ownloaded from
For peer review only
13
education level, country of birth, marital status, smoking status, alcohol
consumption (ounces/month), and physical activity. Most of these variables
included in the model were time-varying, except for sex, age (at baseline) and
country of birth. The regression coefficients from these models were
exponentiated and interpreted as hazard ratios noting that care is required
with this interpretation17 since the model does not technically define
proportional hazards in the presence of time-varying variables.
The obese-years constructmetric was analysed both as a continuous and as a
categorical variable using a similar the same categories as using in the previous
study7 for comparison purposes. For continuous analyses of continuous obese-
years, hazard ratios were are presented per 10 obese-years. For analyses of
categorical obese-years, those participants who were never obese during study
follow-up (zero obese-years) were was assigned as a comparator (reference
category) and the level of Those who values of obese-years within the study
follow-up period, then obese-years was grouped into short, medium and long
and extensive periods representing 1-24.9, 25-49.9, 50-74.9 and >=75 obese-
years. Hazard ratios were are presented, both as crude hazard ratios and as
multivariate-adjusted hazard ratios for both continuous and categorical
variable versions of obese-years. Three models of analysis were used to
Page 44 of 65
For peer review only - http://bmjopen.bmj.com/site/about/guidelines.xhtml
BMJ Open
123456789101112131415161718192021222324252627282930313233343536373839404142434445464748495051525354555657585960
on 2 March 2019 by guest. P
rotected by copyright.http://bm
jopen.bmj.com
/B
MJ O
pen: first published as 10.1136/bmjopen-2014-005629 on 17 S
eptember 2014. D
ownloaded from
For peer review only
14
examine the change in hazard ratios associated with the addition of different
confounding variables. Model 1 was adjusted for age. Model 2 was adjusted for
age, sex, marital status, educational level and country of birth. Model 3
includesd adjustment for all variables in model 2 plus the health behavior
variables of smoking status, alcohol consumption and physical activity and this
model was considered the primary model of the study. The analyses were
additionally stratified by sex and a test for interaction between sex/smoking
status and obese-years was performed for all models.
To compare the relative predictive values of obesity level, obesity duration and
the obese-years constructmetric, each of these three variables were divided
into an equal number of categories. One group was created for those who
were never obese (BMI less than 30 kg/m2) as a reference. For those with
obesity, ten deciles were used to create categories were created. The
goodness of fit of the models incorporating each of the three variables was
compared using Akaike's information criterion (AIC), computed as –2(log-
likelihood) + 2 (number of estimated parameters); with a lower AIC indicating a
better fit19. All analyses were performed using the Stata statistical software
package version 11.0 (StataCorp, College Station, TX, USA)20.
Page 45 of 65
For peer review only - http://bmjopen.bmj.com/site/about/guidelines.xhtml
BMJ Open
123456789101112131415161718192021222324252627282930313233343536373839404142434445464748495051525354555657585960
on 2 March 2019 by guest. P
rotected by copyright.http://bm
jopen.bmj.com
/B
MJ O
pen: first published as 10.1136/bmjopen-2014-005629 on 17 S
eptember 2014. D
ownloaded from
For peer review only
15
Sensitivity analyses
A sensitivity analysis was performed to examine whether the associations were
might be influenced by the imputation method for missing BMI.; specifically, an
The analysis was performed repeated that by includinged only participants with
no missing values of BMI in at any examinations. The effect of the duration of
obesity prior to baseline was tested by performing extra analyses that
excludinged those who were obese at baseline (no = 576).
RESULTS
Characteristics of the Participants Respondents
Of the 5,036 eligible study participants, 1230 (24%) participants were obese for
at least 2 consecutive examinations during the study follow-up. Mean For
those who were ever obese during the study, the median cumulative duration
of obesity was approximately 16 12 years (range, 2–46 years), and the mean
median cumulative obese-years was 63 24 (range, 2–556 obese-years). 2753
(55%) participants were diagnosed with cardiovascular disease over
approximately during 138,918 person-years of follow-up (Table 1 2).
Incidence and Hazards Ratios for of Cardiovascular Disease
Page 46 of 65
For peer review only - http://bmjopen.bmj.com/site/about/guidelines.xhtml
BMJ Open
123456789101112131415161718192021222324252627282930313233343536373839404142434445464748495051525354555657585960
on 2 March 2019 by guest. P
rotected by copyright.http://bm
jopen.bmj.com
/B
MJ O
pen: first published as 10.1136/bmjopen-2014-005629 on 17 S
eptember 2014. D
ownloaded from
For peer review only
16
The incidence rates and adjusted hazards ratios for CVD increased with an
increase in the number of obese-years (Table 2 3 and Table 34). In the primary
model (Model 3) for males and females combinedthe total populationsample,
the adjusted hazard ratios for the categories 1–24.9, 25–49.9, 50–74.9, and ≥75
obese-years for total population was were respectively 1.31 (95% CI: 1.15-1.48),
1.37 (95% CI: 1.14-1.65), 1.62 (95% CI: 1.32-1.99), and 1.80 (95% CI: 1.54-2.10)
compared with those who were never- obese (i.e. had zero obese-years)
respectively. A dose-response relationship (across the 5 categories) was
significant (P trend= 0.001). For obese-years as a continuouses variable
analysis, with every 10 unit increase in obese-years, the adjusted hazard ratios
for CVD was estimated to in the total population increased by 4% (95% CI 3%
- 45%) (Table 45). There were no significant interactions between obese-years
categories and with sex and or smoking status. but t There was evidence of an
interaction between obese-years as a continuous variable and each of sex (P
value = 0.01). Effect The effect of obese-years was higher stronger in males
than in females.
Comparing oObesity constructMetrics and Akaike's Information Criterion
(AIC),
Table 5 6 demonstrates the risk of CVD for each of the three different
constructs for obesity: level of obesity (based on BMI), duration of obesity, and
Page 47 of 65
For peer review only - http://bmjopen.bmj.com/site/about/guidelines.xhtml
BMJ Open
123456789101112131415161718192021222324252627282930313233343536373839404142434445464748495051525354555657585960
on 2 March 2019 by guest. P
rotected by copyright.http://bm
jopen.bmj.com
/B
MJ O
pen: first published as 10.1136/bmjopen-2014-005629 on 17 S
eptember 2014. D
ownloaded from

For peer review only
17
the obese-years constructmetric as additive effects. Each construct was
analysed in a separate model as an additive effect and the strength of
association was compared using the Akaike Information Criterion (AIC). In all
outcomes, the AIC was lowest in the model using the construct of obese-years
metric compared with the other models two constructs both in analysis by for
the total population and by sex.
Sensitivity analysis
The sensitivity analyses showed that the association between obese-years and
risk of CVD was similar between in a complete case analysis and the analysis
using imputed missing values for BMI. Exclusion of participants who had no
record of body mass index at baseline has no change in adjusted hazard ratio,
but exclusion of those who were obese at baseline showed only a slightly
lower adjusted hazard ratio: 1.03 (95% CI: 1.01-1.05)
DISCUSSION
This study found that the approach of measuring the total effect of obesity by
combining the level and the duration of obesity into a single metric of obese-
Page 48 of 65
For peer review only - http://bmjopen.bmj.com/site/about/guidelines.xhtml
BMJ Open
123456789101112131415161718192021222324252627282930313233343536373839404142434445464748495051525354555657585960
on 2 March 2019 by guest. P
rotected by copyright.http://bm
jopen.bmj.com
/B
MJ O
pen: first published as 10.1136/bmjopen-2014-005629 on 17 S
eptember 2014. D
ownloaded from

For peer review only
18
years, is a stronger predictor for of the risk of CVD than compared to using the
duration of obesity or the intensity level of obesity alone. A clear dose-
response relationship between obese-years and the risk of CVD was observed.
The A stronger effect was found in males than in females
Although the hazard ratios were very similar between the three different
constructs, and it is not possible to perform a statistical comparison of
discrimination between the models due to the fact that they are non-nested,
the AIC does tell us indicate that combining the level of obesity and the
duration of obesity into a single construct of obese-years provides us with
more greater discriminative power than a model with level of obesity based on
BMI or obesity duration alone. However the disparity in AIC between the
competing models was not as great as was observed with diabetes as the
outcome of interest7 and so it is unclear the extent to which Tthis finding has
important implications for future studies of the total health impact associated
with obesity and whether future studies that should be taken into account both
the impact of obesity level and changes in the duration of obesity.
There are different ways to operationalize the impact of excess weight over
time. A recent systematic review identified at least four models: an additive
Page 49 of 65
For peer review only - http://bmjopen.bmj.com/site/about/guidelines.xhtml
BMJ Open
123456789101112131415161718192021222324252627282930313233343536373839404142434445464748495051525354555657585960
on 2 March 2019 by guest. P
rotected by copyright.http://bm
jopen.bmj.com
/B
MJ O
pen: first published as 10.1136/bmjopen-2014-005629 on 17 S
eptember 2014. D
ownloaded from
For peer review only
19
models, a duration-of-obesity model, an additive-weight-change model, and
an interactive model 21. In addition to these models, findings using the obese-
year model confirms suggest that analyzing the combined effect of the
duration and the level of obesity as a predictor of the cardiovascular CVD is
worthwhile. Such approaches add information over and above simply the level
of excess weight or length of time with obesity. As has been argued previously
7 other potential additions to this analysis is examining the excess body weight
as higher than 25 kg/m2.
The findings in this study were is derived from analysis of a long term
prospective cohort study with biennial measurements of body weight,
covariates and health outcomes which enabled us to analyze change in level of
obesity and the duration of obesity over a long term period. The analysis takes
into account changes in covariates, such as smoking status, alcohol
consumption and physical activity and adjusted adjusts for a large number of
potential confounding variables. However, some potential confounders, such
as diet, were not collected consistently in the original Framingham Heart Study
and therefore have not been adjusted for in this studyour analysis.
Page 50 of 65
For peer review only - http://bmjopen.bmj.com/site/about/guidelines.xhtml
BMJ Open
123456789101112131415161718192021222324252627282930313233343536373839404142434445464748495051525354555657585960
on 2 March 2019 by guest. P
rotected by copyright.http://bm
jopen.bmj.com
/B
MJ O
pen: first published as 10.1136/bmjopen-2014-005629 on 17 S
eptember 2014. D
ownloaded from
For peer review only
20
As has been described elsewhere7, the limitation of this analysis might related
to the population of study us being a relatively old cohort study, of the
original Framingham Heart Study that began in 1948, and the prevalence rates
of obesity and cardiovascular diseaseCVD were relatively low at that time (in
the 1950s was below 10%)22. Therefore some people It could be argued that
the results of this study might not reflect contemporary the current
populations, where the prevalence of obesity is markedly higher than 50 years
ago. In 2008 alone, the prevalence of obesity among adults in the United
States was more than 30%23 24. Moreover, the contemporary obesity epidemic
is also characterized by a much earlier onset of obesity, which should could
result in even longer exposure by the time today’s obese generation of
children reach the age of our studied cohort. In our study, the average age at
onset of obesity was approximately 50 years, and the average number of years
lived with obesity was approximately 13 years but, in today’s society, the
average age at onset of obesity is likely to be more than 10 years earlier than
in previous decades25. HoweverNevertheless, our results indicate that the
obese-years constructmetric is still valid and may provide more precision in
predicting the risk of CVD is a better tool than level of BMI or duration of
obesity alone. If further analysis is conducted, the association between obese-
years and CVD could be even stronger today since the exposure to obesity is
now greater than it was.
Page 51 of 65
For peer review only - http://bmjopen.bmj.com/site/about/guidelines.xhtml
BMJ Open
123456789101112131415161718192021222324252627282930313233343536373839404142434445464748495051525354555657585960
on 2 March 2019 by guest. P
rotected by copyright.http://bm
jopen.bmj.com
/B
MJ O
pen: first published as 10.1136/bmjopen-2014-005629 on 17 S
eptember 2014. D
ownloaded from
For peer review only
21
The obese-years constructmetric in this study was based on the measurement
of BMI. It is unclear whether using anthropometric measures other than BMI
would produce different results. Although a recent meta-analysis study has
showed that BMI, waist circumference (WC), and the waist/hip ratio (WHR) to
each estimate a similar risk, particularly for type-2 diabetes26; it is still
worthwhiley to explore the relationship between obese-years and risk of CVD
using WC or WHR.
As discussed in our previous study7, the obese-years metric was developed
based on the assumption that level and duration of obesity have a similar
impact, an assumption that has been used for the concept of pack-years in
smoking studies. In some smoking studies, it was highlighted that for certain
health outcomes, the effect of the duration was more important than
intensity27, while in others, duration was not significant after adjustment for
intensity28. As this is a new concept in obesity studies, it requires further
exploration. As we have previously discussed, Tthe notion that obese-years is
only “switched on” when BMI reaches 30 kg/m2 is crude7, however it is an
important construct to consider whether the combination of intensitylevel and
duration is relevant for a particular outcome. In addition, although it obese-
Page 52 of 65
For peer review only - http://bmjopen.bmj.com/site/about/guidelines.xhtml
BMJ Open
123456789101112131415161718192021222324252627282930313233343536373839404142434445464748495051525354555657585960
on 2 March 2019 by guest. P
rotected by copyright.http://bm
jopen.bmj.com
/B
MJ O
pen: first published as 10.1136/bmjopen-2014-005629 on 17 S
eptember 2014. D
ownloaded from
For peer review only
22
years does find a parallel in pack-years for smoking, which is a construct that
ignores any effects of passive smoking, the nature of cumulative of exposure in
obesity e-years measurement is not as straightforward as in smoking.. As this
is a new concept in obesity studies, it requires further exploration.
This These findings demonstrate one again that it is important to consider not
only the level of obesity but also the duration of obesity and its their
combination when examining the association between obesity and the risk of
chronic disease. This effect is likely to be because it the obese-years
constructmetric takes into account is taken of the cumulative damage of
obesity onto body systems, and consequently is likely to be applicable to other
chronic diseases. However, further investigations are recommended to be
undertaken, of other possible intensitylevel/duration constructs of obesity such
as considering the effect of BMI above 25 kg/m2, and of relationships between
obese-years and other chronic diseases and mortality.
We acknowledge that a major challenge in examining the obese-years metric is
to have information on both the degree of obesity and the duration of obesity.
Page 53 of 65
For peer review only - http://bmjopen.bmj.com/site/about/guidelines.xhtml
BMJ Open
123456789101112131415161718192021222324252627282930313233343536373839404142434445464748495051525354555657585960
on 2 March 2019 by guest. P
rotected by copyright.http://bm
jopen.bmj.com
/B
MJ O
pen: first published as 10.1136/bmjopen-2014-005629 on 17 S
eptember 2014. D
ownloaded from
For peer review only
23
Few cohort studies measure obesity and health outcomes regularly as in the
FHS. However, we believe there would be value in more detailed assessment of
height and weight on multiple repeated occasions in future cohort studies and
to identify other more readily available proxies of duration, such as peak
weight or age of onset of obesity and to test to what extent those variables are
equivalent to the obese-year metric.
It is important that these results inform future epidemiological analyses,
suggesting that the risk of obesity on some health outcomes is being
underestimated if duration is not being taken into account. This has
consequent implications for underestimation of obesity-related burden of
disease modelling and cost-effectiveness analyses. In addition, the results
inform public health policy, demonstrating further rationale for preventing
weight gain and delaying the onset of obesity.
CONCLUSION
This study suggestsed possible value in demonstrates the importance of
measuring the total effect of obesity by combining both the level and the
duration of obesity when estimating demonstrates that the risk of
Page 54 of 65
For peer review only - http://bmjopen.bmj.com/site/about/guidelines.xhtml
BMJ Open
123456789101112131415161718192021222324252627282930313233343536373839404142434445464748495051525354555657585960
on 2 March 2019 by guest. P
rotected by copyright.http://bm
jopen.bmj.com
/B
MJ O
pen: first published as 10.1136/bmjopen-2014-005629 on 17 S
eptember 2014. D
ownloaded from
For peer review only
24
cardiovascular diseaseCVD associated with obesity is derived both from the
level of obesity attained and also the length of time lived with obesity. The
obese-years constructmetric conceptually captures might takes into account of
the cumulative damage of obesity on body systems, and is found to therefore
provides slightly better more precise estimation of the risk of CVD than level or
the duration of obesity alone. This approach of examining total effect of
obesity is suggested to use in measuring the burden of obesity related
diseases in the community.
CONFLICT OF INTEREST:
None declared.
ACKNOWLEDGMENTS
The authors thank the Framingham Heart Study investigators for granting them
permission to use their data set for this study (the Framingham Heart Study is
conducted and supported by the National Heart, Lung, and Blood Institute
(NHLBI) in collaboration with study investigators). This article was prepared by
using a limited-access data set obtained from the NHLBI and does not
necessarily reflect the opinions or views of the Framingham Heart Study or the
NHLBI.
Page 55 of 65
For peer review only - http://bmjopen.bmj.com/site/about/guidelines.xhtml
BMJ Open
123456789101112131415161718192021222324252627282930313233343536373839404142434445464748495051525354555657585960
on 2 March 2019 by guest. P
rotected by copyright.http://bm
jopen.bmj.com
/B
MJ O
pen: first published as 10.1136/bmjopen-2014-005629 on 17 S
eptember 2014. D
ownloaded from
For peer review only
25
CONTRIBUTORS
Author AA developed the analytical techniques of study, performed data
analysis, interpretation, drafting of the article and prepared the final version for
publication; FAA performed data analysis and interpretation of data; JS, ST, and
JB helped review the data analysis and reviewed the article; RW contributed to
the study design and reviewing of the article; and AP supervised the
implementation of the study, designed the study’s analytic strategy, and
reviewing of the article.
SOURCES OF FUNDING
A. A. and F.A.A. were supported by an Indonesian Danone institutional research
grant 2012. A. P. and S. T. by the an NHMRC project grant.
Page 56 of 65
For peer review only - http://bmjopen.bmj.com/site/about/guidelines.xhtml
BMJ Open
123456789101112131415161718192021222324252627282930313233343536373839404142434445464748495051525354555657585960
on 2 March 2019 by guest. P
rotected by copyright.http://bm
jopen.bmj.com
/B
MJ O
pen: first published as 10.1136/bmjopen-2014-005629 on 17 S
eptember 2014. D
ownloaded from

For peer review only
26
REFERENCES
1. Hubert HB, Feinleib M, McNamara PM, et al. Obesity as an independent risk factor
for cardiovascular disease: A 26-year follow-up of participants in the
Framingham Heart Study. Circulation 1983;67(5):968-77.
2. Morrison JA. Obesity and cardiovascular disease risk factors in Black and White
girls: The NHLBI Growth and Health Study. Am J Public Health
1992;82(12):1613-20.
3. Abdullah A., Stoelwinder A., De Courten M., et al. The Duration of Obesity and the
Risk of Cardiovascular Disease. The Conference on Clinical Epidemiology and
Evidence-Based Medicine in Global Perspective 27-28 November. Bali,
Indonesia, 2010.
4. Abdullah A, Stoelwinder J, Shortreed S, et al. The duration of obesity and the risk of
type 2 diabetes. Public Health Nutr 2011;14(1):119-26.
5. Abdullah A, Wolfe R, Stoelwinder JU, et al. The number of years lived with obesity
and the risk of all-cause and cause-specific mortality. Int J Epidemiol
2011;40(4):985-96.
6. He J, McGee D, Niu X, et al. Examining the dynamic association of BMI and
mortality in the Framingham Heart Study. Int J Environ Res Public Health
2009;6(12):3115-26.
7. Abdullah A, Wolfe R, Mannan H, et al. Epidemiologic merit of obese-years, the
combination of degree and duration of obesity. Am J Epidemiol
2012;176(2):99-107.
8. Leffondre K, Abrahamowicz M, Siemiatycki J, et al. Modeling smoking history: a
comparison of different approaches. Am J Epidemiol 2002;156(9):813-23.
9. Neuner B, Wellmann J, Dasch B, et al. Modeling smoking history: a comparison of
different approaches in the MARS study on age-related maculopathy. Ann
Epidemiol 2007;17(8):615-21.
10. Dietrich T, Hoffmann K. A comprehensive index for the modeling of smoking
history in periodontal research. J Dent Res 2004;83(11):859-63.
11. Dawber T. The Framingham study: the epidemiology of atherosclerotic disease.
Cambridge, Mass.: Harvard University Press, 1980.
12. National Heart L, and Blood Institute, Boston University. The Framingham Heart
Study: 50 years of research success. Framingham, MA: Framingham Heart
Study; 2012. (http://www.nhlbi.nih.gov/about/framingham/index.html).
(Accessed November 5, 2012).
13. D'Agostino RB, Sr., Vasan RS, Pencina MJ, et al. General cardiovascular risk
profile for use in primary care: the Framingham Heart Study. Circulation
2008;117(6):743-53.
14. Wilson PWF, D'Agostino RB, Sullivan L, et al. Overweight and obesity as
determinants of cardiovascular risk: the Framingham experience. Arch Intern
Med 2002;162(16):1867-72.
15. Parmar MKB, Machin D. Survival analysis : a practical approach. Chichester ;
New York: J. Wiley, 1995.
16. Fisher LD, Lin DY. Time-Dependent Covariates in The Cox Proportional-Hazards
Regression Model. Annual Review of Public Health 1999;20(1):145-57.
Page 57 of 65
For peer review only - http://bmjopen.bmj.com/site/about/guidelines.xhtml
BMJ Open
123456789101112131415161718192021222324252627282930313233343536373839404142434445464748495051525354555657585960
on 2 March 2019 by guest. P
rotected by copyright.http://bm
jopen.bmj.com
/B
MJ O
pen: first published as 10.1136/bmjopen-2014-005629 on 17 S
eptember 2014. D
ownloaded from
For peer review only
27
17. Kleinbaum DG, Klein M. Survival Analysis: A Self-Learning Text. the United
States of America: Springer, 2005.
18. Cleophas TJM, Zwinderman AH. Machine Learning in Medicine. Dordrecht:
Springer, 2013.
19. Akaike H. A new look at the statistical model identification. IEEE Transactions on
Automatic Control 1974;19(6):716–23.
20. StataCorp LP. Stata Survival Analysis and Epidemiological Tables Reference
Manual Release 10. College Station, TX: Stata Corporation 2007.
21. Preston SH, Mehta NK, Stokes A. Modeling obesity histories in cohort analyses of
health and mortality. Epidemiology 2013;24(1):158-66.
22. National Center for Health Statistics National HaNESH, MD: National Center for
Health Statistics; (http://www.cdc.gov/nchs/nhanes.htm). (Accessed 3
November 2002). Secondary.
23. CDC. State-Specific Prevalence of Obesity Among Adults — United States.
MMWR 2008;57(36):765-8.
24. World Health Organization. Global Database on Body Mass Index. Secondary
Global Database on Body Mass Index 2014. http://apps.who.int/bmi/index.jsp.
25. Lee JM, Pilli S, Gebremariam A, et al. Getting heavier, younger: trajectories of
obesity over the life course. Int J Obes (Lond) 2010;34(4):614-23.
26. Vazquez G, Duval S, Jacobs DR, Jr., et al. Comparison of Body Mass Index, Waist
Circumference, and Waist/Hip Ratio in Predicting Incident Diabetes: A Meta-
Analysis. Epidemiol Rev 2007;29(1):115-28.
27. Lagergren J, Bergström R, Lindgren A, et al. The role of tobacco, snuff and alcohol
use in the aetiology of cancer of the oesophagus and gastric cardia. Int J Cancer
2000;85(3):340-6.
28. Yuan JM, Wang XL, Xiang YB, et al. Non-dietary risk factors for nasopharyngeal
carcinoma in Shanghai, China. Int J Cancer 2000;85(3):364-9.
Page 58 of 65
For peer review only - http://bmjopen.bmj.com/site/about/guidelines.xhtml
BMJ Open
123456789101112131415161718192021222324252627282930313233343536373839404142434445464748495051525354555657585960
on 2 March 2019 by guest. P
rotected by copyright.http://bm
jopen.bmj.com
/B
MJ O
pen: first published as 10.1136/bmjopen-2014-005629 on 17 S
eptember 2014. D
ownloaded from
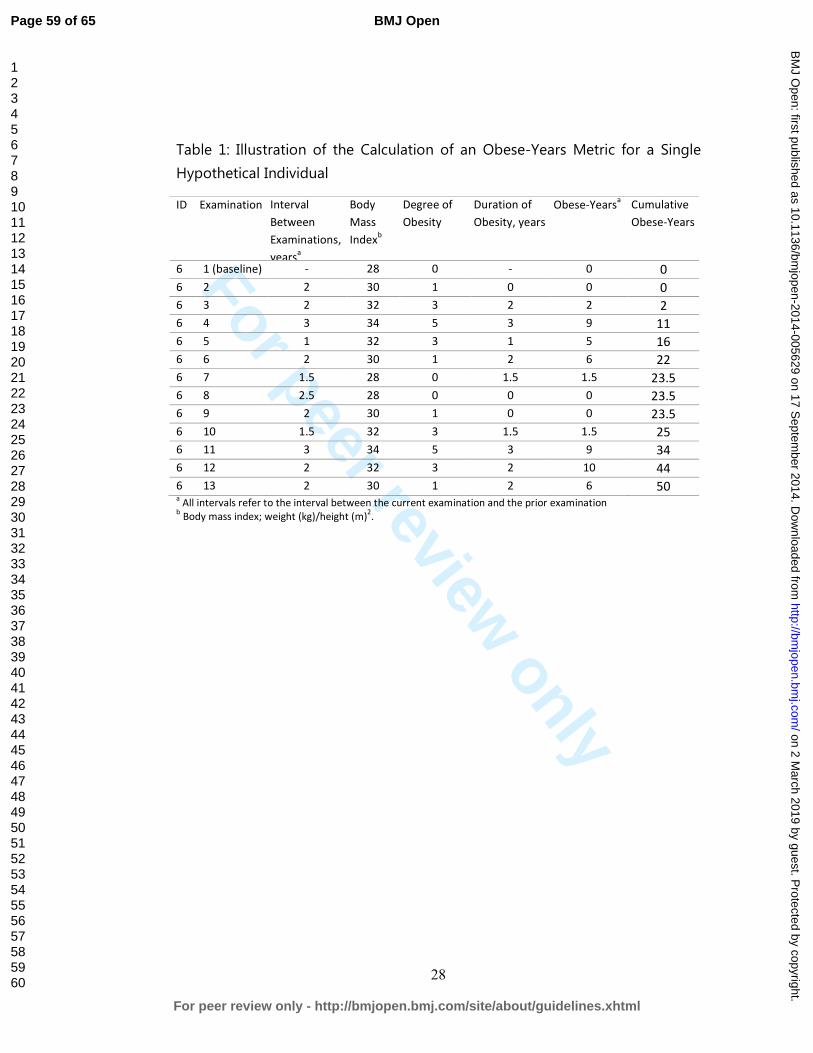
For peer review only
28
Table 1: Illustration of the Calculation of an Obese-Years Metric for a Single
Hypothetical Individual
ID Examination Interval
Between
Examinations,
yearsa
Body
Mass
Indexb
Degree of
Obesity
Duration of
Obesity, years
Obese-Yearsa Cumulative
Obese-Years
6 1 (baseline) - 28 0 - 0 0
6 2 2 30 1 0 0 0
6 3 2 32 3 2 2 2
6 4 3 34 5 3 9 11
6 5 1 32 3 1 5 16
6 6 2 30 1 2 6 22
6 7 1.5 28 0 1.5 1.5 23.5
6 8 2.5 28 0 0 0 23.5
6 9 2 30 1 0 0 23.5
6 10 1.5 32 3 1.5 1.5 25
6 11 3 34 5 3 9 34
6 12 2 32 3 2 10 44
6 13 2 30 1 2 6 50 a All intervals refer to the interval between the current examination and the prior examination
b Body mass index; weight (kg)/height (m)
2.
Page 59 of 65
For peer review only - http://bmjopen.bmj.com/site/about/guidelines.xhtml
BMJ Open
123456789101112131415161718192021222324252627282930313233343536373839404142434445464748495051525354555657585960
on 2 March 2019 by guest. P
rotected by copyright.http://bm
jopen.bmj.com
/B
MJ O
pen: first published as 10.1136/bmjopen-2014-005629 on 17 S
eptember 2014. D
ownloaded from
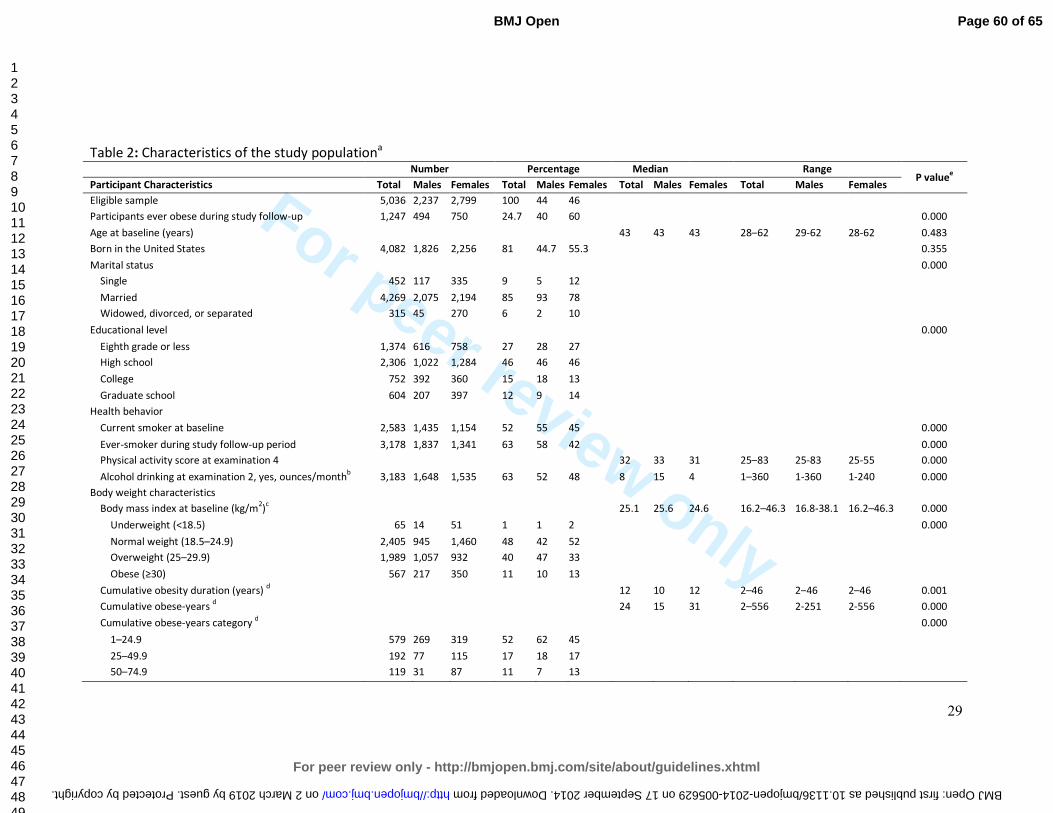
For peer review only
29
Table 2: Characteristics of the study populationa
Number Percentage Median Range P value
e
Participant Characteristics Total Males Females Total Males Females Total Males Females Total Males Females
Eligible sample 5,036 2,237 2,799 100 44 46
Participants ever obese during study follow-up 1,247 494 750 24.7 40 60 0.000
Age at baseline (years) 43 43 43 28–62 29-62 28-62 0.483
Born in the United States 4,082 1,826 2,256 81 44.7 55.3 0.355
Marital status 0.000
Single 452 117 335 9 5 12
Married 4,269 2,075 2,194 85 93 78
Widowed, divorced, or separated 315 45 270 6 2 10
Educational level 0.000
Eighth grade or less 1,374 616 758 27 28 27
High school 2,306 1,022 1,284 46 46 46
College 752 392 360 15 18 13
Graduate school 604 207 397 12 9 14
Health behavior
Current smoker at baseline 2,583 1,435 1,154 52 55 45 0.000
Ever-smoker during study follow-up period 3,178 1,837 1,341 63 58 42 0.000
Physical activity score at examination 4 32 33 31 25–83 25-83 25-55 0.000
Alcohol drinking at examination 2, yes, ounces/monthb
3,183 1,648 1,535 63 52 48 8 15 4 1–360 1-360 1-240 0.000
Body weight characteristics
Body mass index at baseline (kg/m2)
c 25.1 25.6 24.6 16.2–46.3 16.8-38.1 16.2–46.3 0.000
Underweight (<18.5) 65 14 51 1 1 2 0.000
Normal weight (18.5–24.9) 2,405 945 1,460 48 42 52
Overweight (25–29.9) 1,989 1,057 932 40 47 33
Obese (≥30) 567 217 350 11 10 13
Cumulative obesity duration (years) d 12 10 12 2–46 2–46 2–46 0.001
Cumulative obese-years d
24 15 31 2–556 2-251 2-556 0.000
Cumulative obese-years category d 0.000
1–24.9 579 269 319 52 62 45
25–49.9 192 77 115 17 18 17
50–74.9 119 31 87 11 7 13
Page 60 of 65
For peer review only - http://bmjopen.bmj.com/site/about/guidelines.xhtml
BMJ Open
123456789101112131415161718192021222324252627282930313233343536373839404142434445464748495051525354555657585960
on 2 March 2019 by guest. Protected by copyright. http://bmjopen.bmj.com/ BMJ Open: first published as 10.1136/bmjopen-2014-005629 on 17 September 2014. Downloaded from
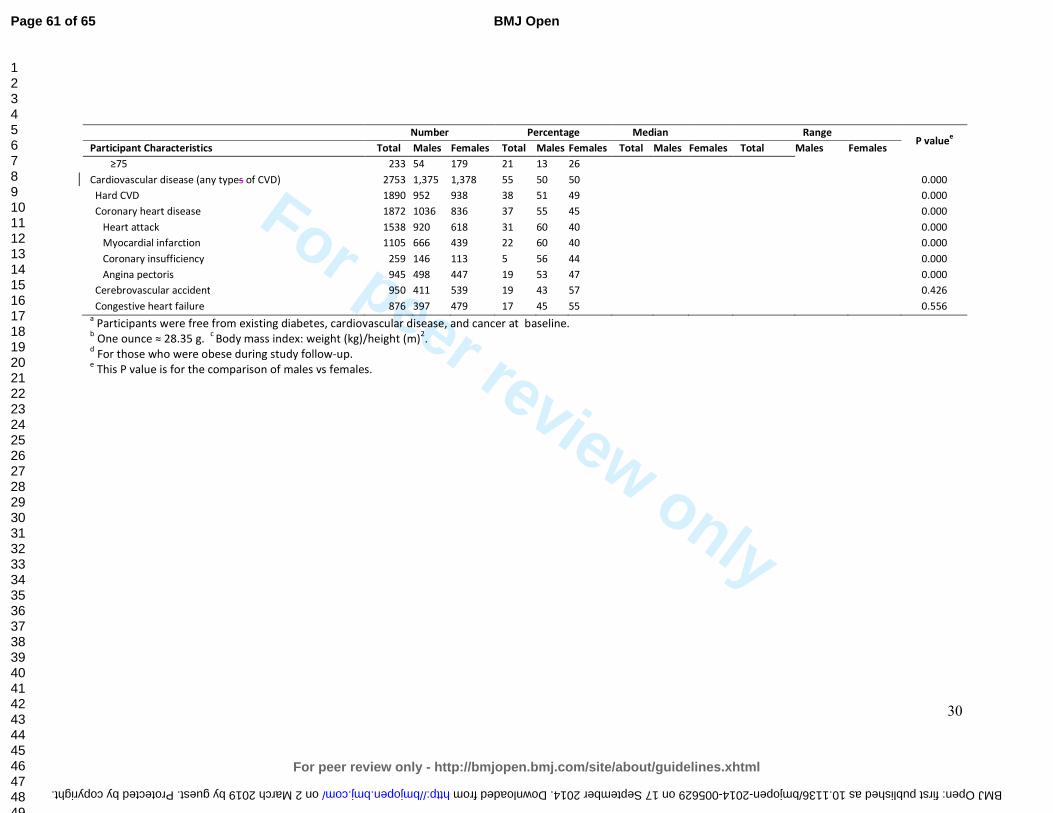
For peer review only
30
Number Percentage Median Range P value
e
Participant Characteristics Total Males Females Total Males Females Total Males Females Total Males Females
≥75 233 54 179 21 13 26
Cardiovascular disease (any types of CVD) 2753 1,375 1,378 55 50 50 0.000
Hard CVD 1890 952 938 38 51 49 0.000
Coronary heart disease 1872 1036 836 37 55 45 0.000
Heart attack 1538 920 618 31 60 40 0.000
Myocardial infarction 1105 666 439 22 60 40 0.000
Coronary insufficiency 259 146 113 5 56 44 0.000
Angina pectoris 945 498 447 19 53 47 0.000
Cerebrovascular accident 950 411 539 19 43 57 0.426
Congestive heart failure 876 397 479 17 45 55 0.556 a Participants were free from existing diabetes, cardiovascular disease, and cancer at baseline.
b One ounce ≈ 28.35 g.
c Body mass index: weight (kg)/height (m)
2.
d For those who were obese during study follow-up.
e This P value is for the comparison of males vs females.
Page 61 of 65
For peer review only - http://bmjopen.bmj.com/site/about/guidelines.xhtml
BMJ Open
123456789101112131415161718192021222324252627282930313233343536373839404142434445464748495051525354555657585960
on 2 March 2019 by guest. Protected by copyright. http://bmjopen.bmj.com/ BMJ Open: first published as 10.1136/bmjopen-2014-005629 on 17 September 2014. Downloaded from
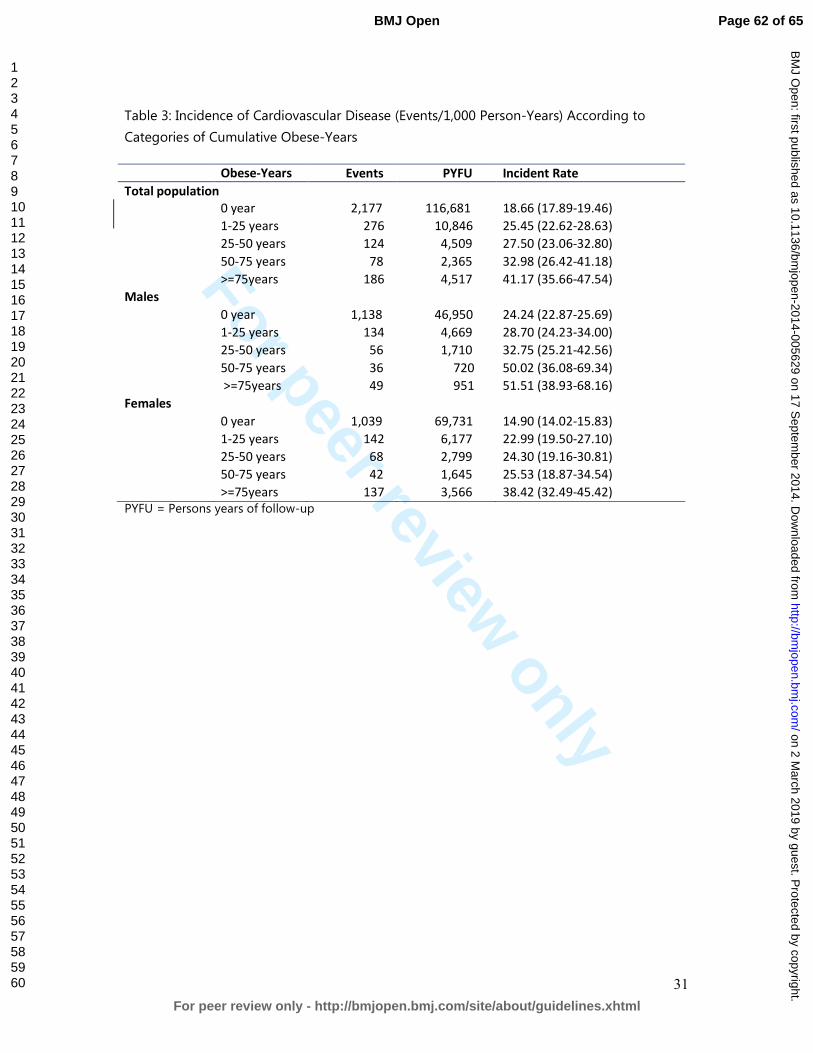
For peer review only
31
Table 3: Incidence of Cardiovascular Disease (Events/1,000 Person-Years) According to
Categories of Cumulative Obese-Years
Obese-Years
categories
Events PYFU Incident Rate
Total population
0 year 2,177 116,681 18.66 (17.89-19.46)
1-25 years 276 10,846 25.45 (22.62-28.63)
25-50 years 124 4,509 27.50 (23.06-32.80)
50-75 years 78 2,365 32.98 (26.42-41.18)
>=75years 186 4,517 41.17 (35.66-47.54)
Males
0 year 1,138 46,950 24.24 (22.87-25.69)
1-25 years 134 4,669 28.70 (24.23-34.00)
25-50 years 56 1,710 32.75 (25.21-42.56)
50-75 years 36 720 50.02 (36.08-69.34)
>=75years 49 951 51.51 (38.93-68.16)
Females
0 year 1,039 69,731 14.90 (14.02-15.83)
1-25 years 142 6,177 22.99 (19.50-27.10)
25-50 years 68 2,799 24.30 (19.16-30.81)
50-75 years 42 1,645 25.53 (18.87-34.54)
>=75years 137 3,566 38.42 (32.49-45.42)
PYFU = Persons years of follow-up
Page 62 of 65
For peer review only - http://bmjopen.bmj.com/site/about/guidelines.xhtml
BMJ Open
123456789101112131415161718192021222324252627282930313233343536373839404142434445464748495051525354555657585960
on 2 March 2019 by guest. P
rotected by copyright.http://bm
jopen.bmj.com
/B
MJ O
pen: first published as 10.1136/bmjopen-2014-005629 on 17 S
eptember 2014. D
ownloaded from
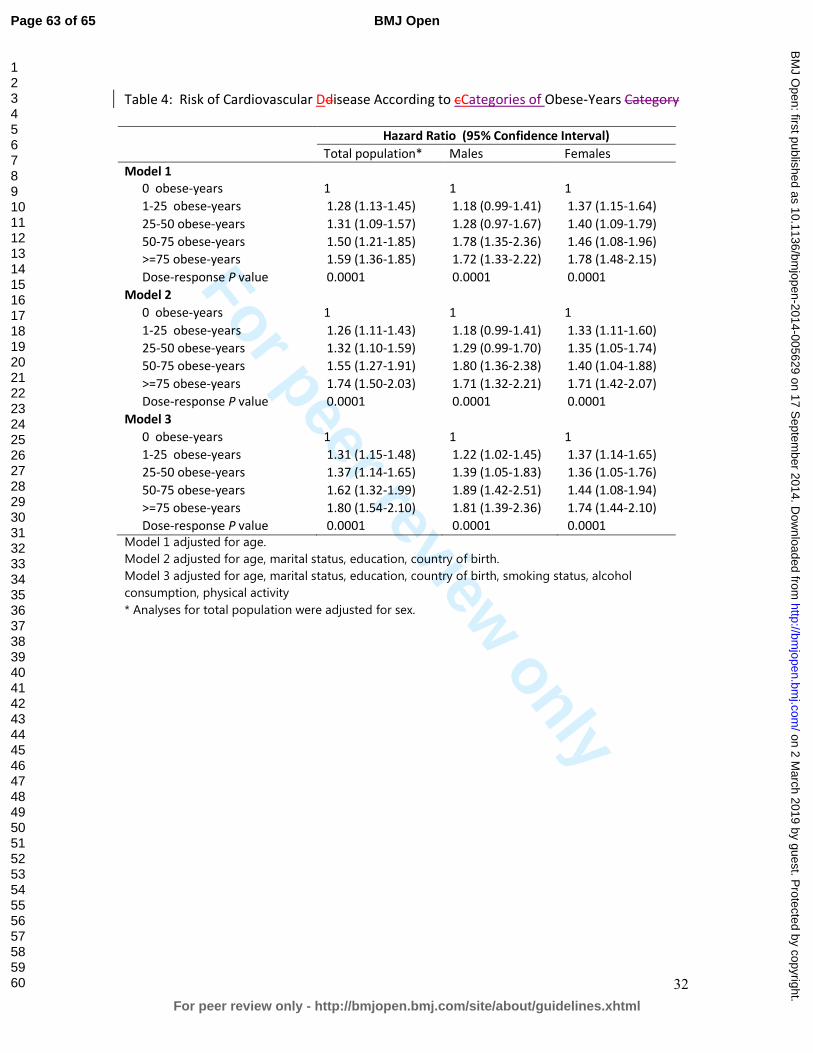
For peer review only
32
Table 4: Risk of Cardiovascular Ddisease According to cCategories of Obese-Years Category
Hazard Ratio (95% Confidence Interval)
Total population* Males Females
Model 1
0 obese-years 1 1 1
1-25 obese-years 1.28 (1.13-1.45) 1.18 (0.99-1.41) 1.37 (1.15-1.64)
25-50 obese-years 1.31 (1.09-1.57) 1.28 (0.97-1.67) 1.40 (1.09-1.79)
50-75 obese-years 1.50 (1.21-1.85) 1.78 (1.35-2.36) 1.46 (1.08-1.96)
>=75 obese-years 1.59 (1.36-1.85) 1.72 (1.33-2.22) 1.78 (1.48-2.15)
Dose-response P value 0.0001 0.0001 0.0001
Model 2
0 obese-years 1 1 1
1-25 obese-years 1.26 (1.11-1.43) 1.18 (0.99-1.41) 1.33 (1.11-1.60)
25-50 obese-years 1.32 (1.10-1.59) 1.29 (0.99-1.70) 1.35 (1.05-1.74)
50-75 obese-years 1.55 (1.27-1.91) 1.80 (1.36-2.38) 1.40 (1.04-1.88)
>=75 obese-years 1.74 (1.50-2.03) 1.71 (1.32-2.21) 1.71 (1.42-2.07)
Dose-response P value 0.0001 0.0001 0.0001
Model 3
0 obese-years 1 1 1
1-25 obese-years 1.31 (1.15-1.48) 1.22 (1.02-1.45) 1.37 (1.14-1.65)
25-50 obese-years 1.37 (1.14-1.65) 1.39 (1.05-1.83) 1.36 (1.05-1.76)
50-75 obese-years 1.62 (1.32-1.99) 1.89 (1.42-2.51) 1.44 (1.08-1.94)
>=75 obese-years 1.80 (1.54-2.10) 1.81 (1.39-2.36) 1.74 (1.44-2.10)
Dose-response P value 0.0001 0.0001 0.0001
Model 1 adjusted for age.
Model 2 adjusted for age, marital status, education, country of birth.
Model 3 adjusted for age, marital status, education, country of birth, smoking status, alcohol
consumption, physical activity
* Analyses for total population were adjusted for sex.
Page 63 of 65
For peer review only - http://bmjopen.bmj.com/site/about/guidelines.xhtml
BMJ Open
123456789101112131415161718192021222324252627282930313233343536373839404142434445464748495051525354555657585960
on 2 March 2019 by guest. P
rotected by copyright.http://bm
jopen.bmj.com
/B
MJ O
pen: first published as 10.1136/bmjopen-2014-005629 on 17 S
eptember 2014. D
ownloaded from
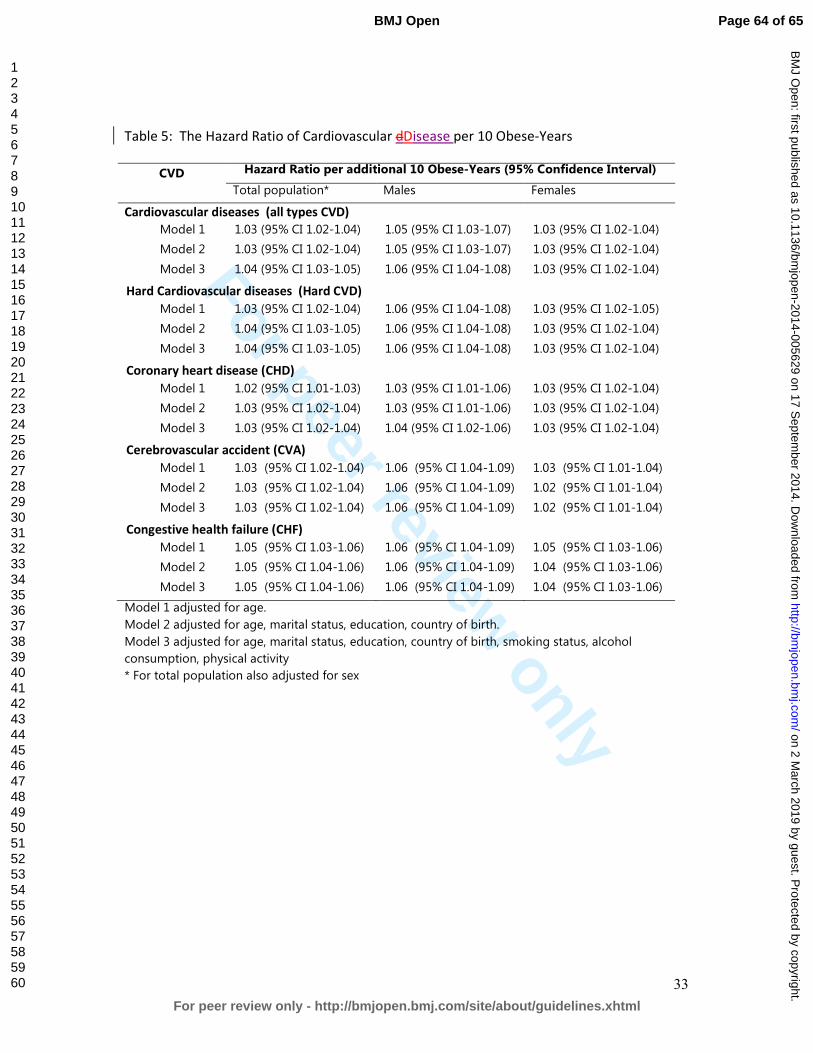
For peer review only
33
Table 5: The Hazard Ratio of Cardiovascular dDisease per 10 Obese-Years
CVD Hazard Ratio per additional 10 Obese-Years (95% Confidence Interval)
Total population* Males Females
Cardiovascular diseases (all types CVD)
Model 1 1.03 (95% CI 1.02-1.04) 1.05 (95% CI 1.03-1.07) 1.03 (95% CI 1.02-1.04)
Model 2 1.03 (95% CI 1.02-1.04) 1.05 (95% CI 1.03-1.07) 1.03 (95% CI 1.02-1.04)
Model 3 1.04 (95% CI 1.03-1.05) 1.06 (95% CI 1.04-1.08) 1.03 (95% CI 1.02-1.04)
Hard Cardiovascular diseases (Hard CVD)
Model 1 1.03 (95% CI 1.02-1.04) 1.06 (95% CI 1.04-1.08) 1.03 (95% CI 1.02-1.05)
Model 2 1.04 (95% CI 1.03-1.05) 1.06 (95% CI 1.04-1.08) 1.03 (95% CI 1.02-1.04)
Model 3 1.04 (95% CI 1.03-1.05) 1.06 (95% CI 1.04-1.08) 1.03 (95% CI 1.02-1.04)
Coronary heart disease (CHD)
Model 1 1.02 (95% CI 1.01-1.03) 1.03 (95% CI 1.01-1.06) 1.03 (95% CI 1.02-1.04)
Model 2 1.03 (95% CI 1.02-1.04) 1.03 (95% CI 1.01-1.06) 1.03 (95% CI 1.02-1.04)
Model 3 1.03 (95% CI 1.02-1.04) 1.04 (95% CI 1.02-1.06) 1.03 (95% CI 1.02-1.04)
Cerebrovascular accident (CVA)
Model 1 1.03 (95% CI 1.02-1.04) 1.06 (95% CI 1.04-1.09) 1.03 (95% CI 1.01-1.04)
Model 2 1.03 (95% CI 1.02-1.04) 1.06 (95% CI 1.04-1.09) 1.02 (95% CI 1.01-1.04)
Model 3 1.03 (95% CI 1.02-1.04) 1.06 (95% CI 1.04-1.09) 1.02 (95% CI 1.01-1.04)
Congestive health failure (CHF)
Model 1 1.05 (95% CI 1.03-1.06) 1.06 (95% CI 1.04-1.09) 1.05 (95% CI 1.03-1.06)
Model 2 1.05 (95% CI 1.04-1.06) 1.06 (95% CI 1.04-1.09) 1.04 (95% CI 1.03-1.06)
Model 3 1.05 (95% CI 1.04-1.06) 1.06 (95% CI 1.04-1.09) 1.04 (95% CI 1.03-1.06)
Model 1 adjusted for age.
Model 2 adjusted for age, marital status, education, country of birth.
Model 3 adjusted for age, marital status, education, country of birth, smoking status, alcohol
consumption, physical activity
* For total population also adjusted for sex
Page 64 of 65
For peer review only - http://bmjopen.bmj.com/site/about/guidelines.xhtml
BMJ Open
123456789101112131415161718192021222324252627282930313233343536373839404142434445464748495051525354555657585960
on 2 March 2019 by guest. P
rotected by copyright.http://bm
jopen.bmj.com
/B
MJ O
pen: first published as 10.1136/bmjopen-2014-005629 on 17 S
eptember 2014. D
ownloaded from
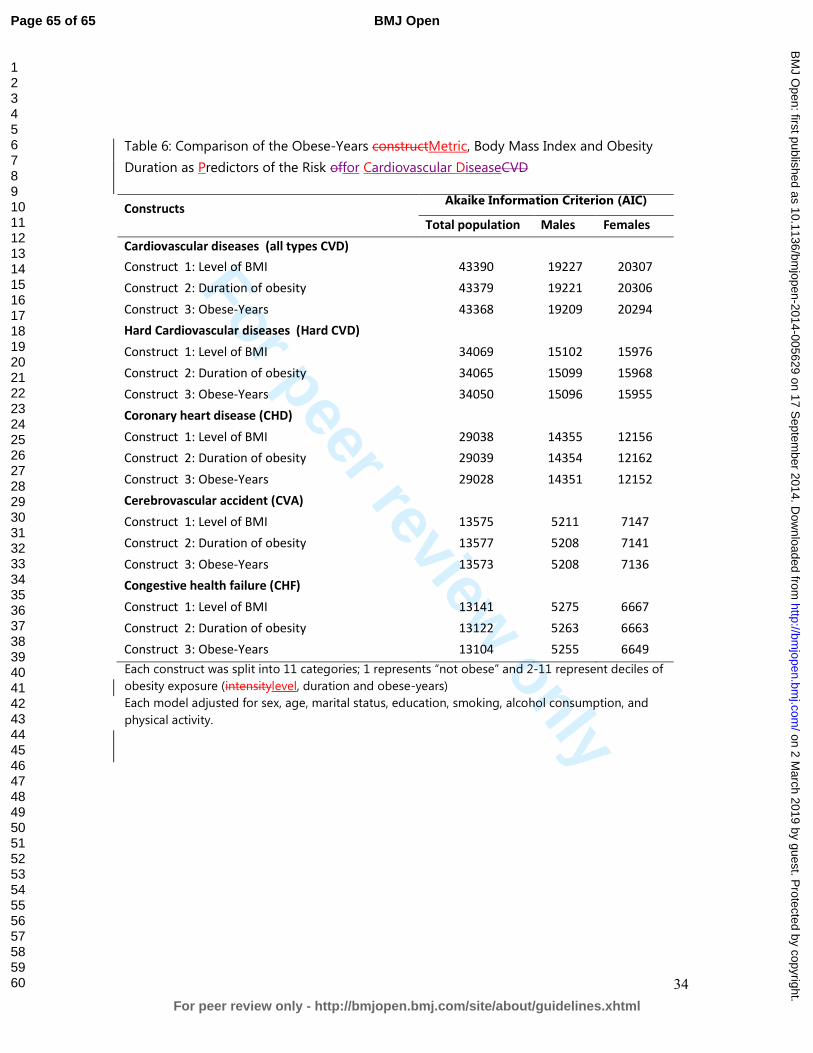
For peer review only
34
Table 6: Comparison of the Obese-Years constructMetric, Body Mass Index and Obesity
Duration as Predictors of the Risk offor Cardiovascular DiseaseCVD
Constructs Akaike Information Criterion (AIC)
Total population Males Females
Cardiovascular diseases (all types CVD)
Construct 1: Level of BMI 43390 19227 20307
Construct 2: Duration of obesity 43379 19221 20306
Construct 3: Obese-Years 43368 19209 20294
Hard Cardiovascular diseases (Hard CVD)
Construct 1: Level of BMI 34069 15102 15976
Construct 2: Duration of obesity 34065 15099 15968
Construct 3: Obese-Years 34050 15096 15955
Coronary heart disease (CHD)
Construct 1: Level of BMI 29038 14355 12156
Construct 2: Duration of obesity 29039 14354 12162
Construct 3: Obese-Years 29028 14351 12152
Cerebrovascular accident (CVA)
Construct 1: Level of BMI 13575 5211 7147
Construct 2: Duration of obesity 13577 5208 7141
Construct 3: Obese-Years 13573 5208 7136
Congestive health failure (CHF)
Construct 1: Level of BMI 13141 5275 6667
Construct 2: Duration of obesity 13122 5263 6663
Construct 3: Obese-Years 13104 5255 6649
Each construct was split into 11 categories; 1 represents “not obese” and 2-11 represent deciles of
obesity exposure (intensitylevel, duration and obese-years)
Each model adjusted for sex, age, marital status, education, smoking, alcohol consumption, and
physical activity.
Page 65 of 65
For peer review only - http://bmjopen.bmj.com/site/about/guidelines.xhtml
BMJ Open
123456789101112131415161718192021222324252627282930313233343536373839404142434445464748495051525354555657585960
on 2 March 2019 by guest. P
rotected by copyright.http://bm
jopen.bmj.com
/B
MJ O
pen: first published as 10.1136/bmjopen-2014-005629 on 17 S
eptember 2014. D
ownloaded from