inductively coupled plasma optical emission spectrometry ·...
TRANSCRIPT

Inductively Coupled PlasmaOptical Emission Spectrometry
Xiandeng HouCollege of Chemistry, Sichuan University, Chengdu,China
Renata S. AmaisCenter for Nuclear Energy in Agriculture, Universityof Sao Paulo, Piracicaba, Brazil
Bradley T. Jones and George L. DonatiWake Forest University, Winston-Salem, NC, USA
1 Introduction 12 Theory 2
2.1 Inductively Coupled Plasma Operation 22.2 Inductively Coupled Plasma
Characteristics 33 Sample Introduction 4
3.1 Nebulizers 43.2 Hydride Generation 63.3 Electrothermal Vaporization 73.4 Chromatographic Couplers 8
4 Torch Configuration 84.1 Radial View 84.2 Axial View 94.3 Dual View 9
5 Detection of Emission 105.1 Gratings 105.2 The Photomultiplier Tube 125.3 Array Detectors 14
6 Analytical Performance 156.1 Analytical Wavelength 156.2 Quantitative Methods 156.3 Analytical Figures of Merit 176.4 Continuum Background and Interferences 20Acknowledgments 21Abbreviations and Acronyms 21Related Articles 22References 22Further Reading 25
Update based on the original article by Xiandeng Hou and Bradley T.Jones, Encyclopedia of Analytical Chemistry, ©2000, John Wiley & Sons, Ltd.
Inductively coupled plasma optical emission spectrometry(ICP OES) is a powerful tool for the determination ofmany elements in a variety of different sample matrices.With this method, liquid samples are injected into aradiofrequency (RF)-induced argon plasma using one ofa variety of nebulizers or sample introduction techniques.The sample mist reaching the plasma is quickly dried,vaporized, and energized through collisional excitationat high temperature. The atomic emission emanatingfrom the plasma is viewed in either a radial or axialconfiguration, collected with a lens or mirror, and imagedonto the entrance slit of a wavelength selection device.Single-element measurements can be performed cost-effectively with a simple monochromator–photomultipliertube (PMT) combination, and simultaneous multielementdeterminations are performed for up to 70 elements withthe combination of a polychromator and an array detector.The analytical performance of such systems is competitivewith most other inorganic analysis techniques, especiallywith regard to sample throughput and sensitivity.
1 INTRODUCTION
ICP OES is one of the most powerful and popularanalytical tools for the determination of trace elements ina myriad of sample types (Table 1). The term inductivelycoupled plasma atomic emission spectrometry (ICP AES)has also been used, but it is not recommended to preventconfusion with Auger electron spectroscopy (AES). Thetechnique is based on the spontaneous emission ofphotons from atoms and ions that have been excitedin a RF discharge. Liquid and gas samples may beinjected directly into the instrument, while solid samplesusually require extraction or acid digestion so that theanalytes are present in a solution. The sample solutionis converted to an aerosol and directed into the centralchannel of the plasma. At its core, the inductively coupledplasma (ICP) sustains a temperature of approximately10 000 K, so the aerosol is quickly vaporized. Analyteelements are liberated as free atoms in the gaseousstate. Further collisional excitation within the plasmaimparts additional energy to the atoms, promoting themto excited states. Sufficient energy is often available toconvert the atoms to ions and subsequently promote theions to excited states. Both the atomic and ionic excitedstate species may then relax to the ground state via theemission of a photon. These photons have characteristicenergies that are determined by the quantized energylevel structure for each type of atom or ion. Thus, thewavelength of the photons can be used to identify theelements from which they originated. The total numberof photons is directly proportional to the concentrationof the originating element in the sample.
Encyclopedia of Analytical Chemistry, Online © 2006–2016 John Wiley & Sons, Ltd.This article is © 2016 John Wiley & Sons, Ltd.This article was published in the Encyclopedia of Analytical Chemistry in 2016 by John Wiley & Sons, Ltd.DOI: 10.1002/9780470027318.a5110.pub3
2 ATOMIC SPECTROSCOPY
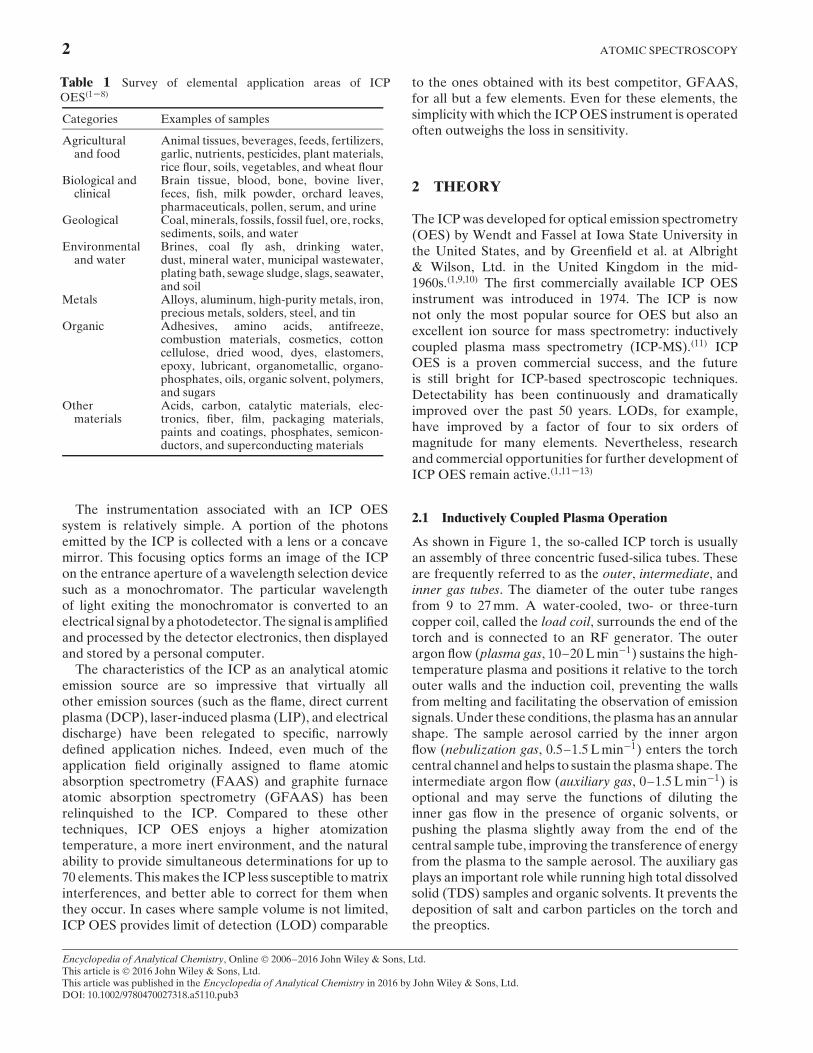
Table 1 Survey of elemental application areas of ICPOES(1–8)
Categories Examples of samples
Agriculturaland food
Animal tissues, beverages, feeds, fertilizers,garlic, nutrients, pesticides, plant materials,rice flour, soils, vegetables, and wheat flour
Biological andclinical
Brain tissue, blood, bone, bovine liver,feces, fish, milk powder, orchard leaves,pharmaceuticals, pollen, serum, and urine
Geological Coal, minerals, fossils, fossil fuel, ore, rocks,sediments, soils, and water
Environmentaland water
Brines, coal fly ash, drinking water,dust, mineral water, municipal wastewater,plating bath, sewage sludge, slags, seawater,and soil
Metals Alloys, aluminum, high-purity metals, iron,precious metals, solders, steel, and tin
Organic Adhesives, amino acids, antifreeze,combustion materials, cosmetics, cottoncellulose, dried wood, dyes, elastomers,epoxy, lubricant, organometallic, organo-phosphates, oils, organic solvent, polymers,and sugars
Othermaterials
Acids, carbon, catalytic materials, elec-tronics, fiber, film, packaging materials,paints and coatings, phosphates, semicon-ductors, and superconducting materials
The instrumentation associated with an ICP OESsystem is relatively simple. A portion of the photonsemitted by the ICP is collected with a lens or a concavemirror. This focusing optics forms an image of the ICPon the entrance aperture of a wavelength selection devicesuch as a monochromator. The particular wavelengthof light exiting the monochromator is converted to anelectrical signal by a photodetector. The signal is amplifiedand processed by the detector electronics, then displayedand stored by a personal computer.
The characteristics of the ICP as an analytical atomicemission source are so impressive that virtually allother emission sources (such as the flame, direct currentplasma (DCP), laser-induced plasma (LIP), and electricaldischarge) have been relegated to specific, narrowlydefined application niches. Indeed, even much of theapplication field originally assigned to flame atomicabsorption spectrometry (FAAS) and graphite furnaceatomic absorption spectrometry (GFAAS) has beenrelinquished to the ICP. Compared to these othertechniques, ICP OES enjoys a higher atomizationtemperature, a more inert environment, and the naturalability to provide simultaneous determinations for up to70 elements. This makes the ICP less susceptible to matrixinterferences, and better able to correct for them whenthey occur. In cases where sample volume is not limited,ICP OES provides limit of detection (LOD) comparable
to the ones obtained with its best competitor, GFAAS,for all but a few elements. Even for these elements, thesimplicity with which the ICP OES instrument is operatedoften outweighs the loss in sensitivity.
2 THEORY
The ICP was developed for optical emission spectrometry(OES) by Wendt and Fassel at Iowa State University inthe United States, and by Greenfield et al. at Albright& Wilson, Ltd. in the United Kingdom in the mid-1960s.(1,9,10) The first commercially available ICP OESinstrument was introduced in 1974. The ICP is nownot only the most popular source for OES but also anexcellent ion source for mass spectrometry: inductivelycoupled plasma mass spectrometry (ICP-MS).(11) ICPOES is a proven commercial success, and the futureis still bright for ICP-based spectroscopic techniques.Detectability has been continuously and dramaticallyimproved over the past 50 years. LODs, for example,have improved by a factor of four to six orders ofmagnitude for many elements. Nevertheless, researchand commercial opportunities for further development ofICP OES remain active.(1,11–13)
2.1 Inductively Coupled Plasma Operation
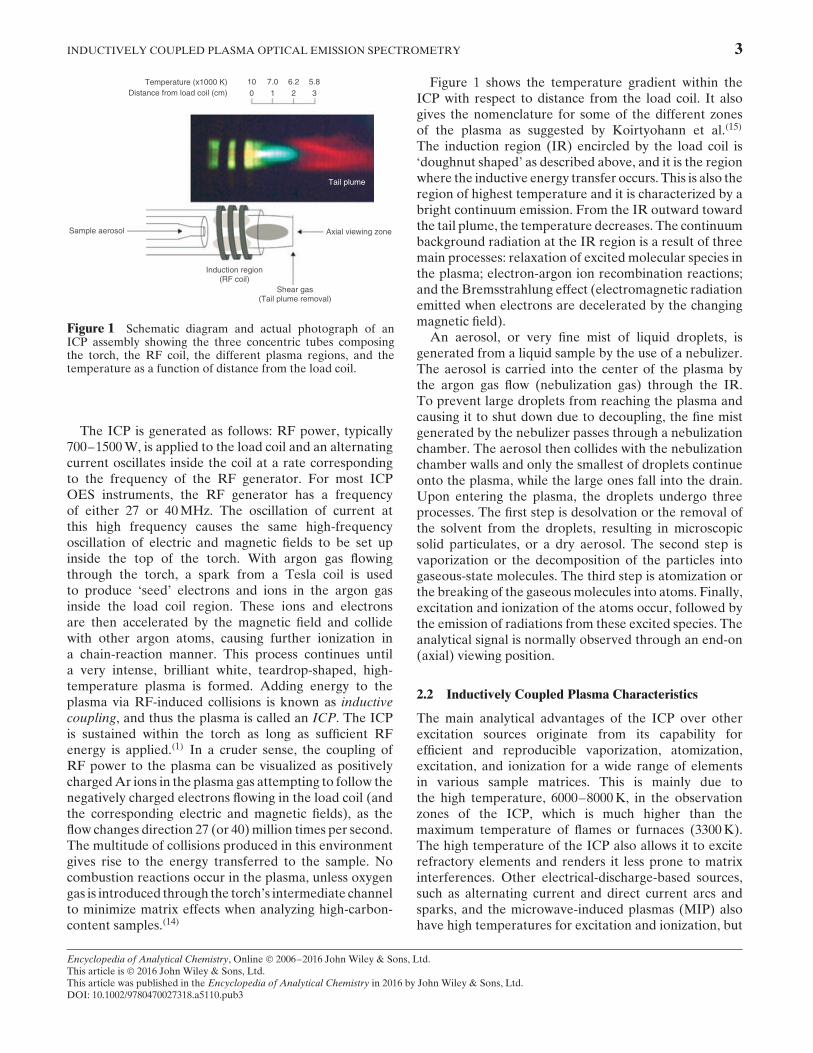
As shown in Figure 1, the so-called ICP torch is usuallyan assembly of three concentric fused-silica tubes. Theseare frequently referred to as the outer, intermediate, andinner gas tubes. The diameter of the outer tube rangesfrom 9 to 27 mm. A water-cooled, two- or three-turncopper coil, called the load coil, surrounds the end of thetorch and is connected to an RF generator. The outerargon flow (plasma gas, 10–20 L min−1) sustains the high-temperature plasma and positions it relative to the torchouter walls and the induction coil, preventing the wallsfrom melting and facilitating the observation of emissionsignals. Under these conditions, the plasma has an annularshape. The sample aerosol carried by the inner argonflow (nebulization gas, 0.5–1.5 L min−1) enters the torchcentral channel and helps to sustain the plasma shape. Theintermediate argon flow (auxiliary gas, 0–1.5 L min−1) isoptional and may serve the functions of diluting theinner gas flow in the presence of organic solvents, orpushing the plasma slightly away from the end of thecentral sample tube, improving the transference of energyfrom the plasma to the sample aerosol. The auxiliary gasplays an important role while running high total dissolvedsolid (TDS) samples and organic solvents. It prevents thedeposition of salt and carbon particles on the torch andthe preoptics.
Encyclopedia of Analytical Chemistry, Online © 2006–2016 John Wiley & Sons, Ltd.This article is © 2016 John Wiley & Sons, Ltd.This article was published in the Encyclopedia of Analytical Chemistry in 2016 by John Wiley & Sons, Ltd.DOI: 10.1002/9780470027318.a5110.pub3
INDUCTIVELY COUPLED PLASMA OPTICAL EMISSION SPECTROMETRY 3
Sample aerosol
Induction region(RF coil)
Shear gas(Tail plume removal)
Tail plume
Axial viewing zone
Temperature (x1000 K)
Distance from load coil (cm) 0
10
2
6.2
3
5.8
1
7.0
Figure 1 Schematic diagram and actual photograph of anICP assembly showing the three concentric tubes composingthe torch, the RF coil, the different plasma regions, and thetemperature as a function of distance from the load coil.
The ICP is generated as follows: RF power, typically700–1500 W, is applied to the load coil and an alternatingcurrent oscillates inside the coil at a rate correspondingto the frequency of the RF generator. For most ICPOES instruments, the RF generator has a frequencyof either 27 or 40 MHz. The oscillation of current atthis high frequency causes the same high-frequencyoscillation of electric and magnetic fields to be set upinside the top of the torch. With argon gas flowingthrough the torch, a spark from a Tesla coil is usedto produce ‘seed’ electrons and ions in the argon gasinside the load coil region. These ions and electronsare then accelerated by the magnetic field and collidewith other argon atoms, causing further ionization ina chain-reaction manner. This process continues untila very intense, brilliant white, teardrop-shaped, high-temperature plasma is formed. Adding energy to theplasma via RF-induced collisions is known as inductivecoupling, and thus the plasma is called an ICP. The ICPis sustained within the torch as long as sufficient RFenergy is applied.(1) In a cruder sense, the coupling ofRF power to the plasma can be visualized as positivelycharged Ar ions in the plasma gas attempting to follow thenegatively charged electrons flowing in the load coil (andthe corresponding electric and magnetic fields), as theflow changes direction 27 (or 40) million times per second.The multitude of collisions produced in this environmentgives rise to the energy transferred to the sample. Nocombustion reactions occur in the plasma, unless oxygengas is introduced through the torch’s intermediate channelto minimize matrix effects when analyzing high-carbon-content samples.(14)
Figure 1 shows the temperature gradient within theICP with respect to distance from the load coil. It alsogives the nomenclature for some of the different zonesof the plasma as suggested by Koirtyohann et al.(15)
The induction region (IR) encircled by the load coil is‘doughnut shaped’ as described above, and it is the regionwhere the inductive energy transfer occurs. This is also theregion of highest temperature and it is characterized by abright continuum emission. From the IR outward towardthe tail plume, the temperature decreases. The continuumbackground radiation at the IR region is a result of threemain processes: relaxation of excited molecular species inthe plasma; electron-argon ion recombination reactions;and the Bremsstrahlung effect (electromagnetic radiationemitted when electrons are decelerated by the changingmagnetic field).
An aerosol, or very fine mist of liquid droplets, isgenerated from a liquid sample by the use of a nebulizer.The aerosol is carried into the center of the plasma bythe argon gas flow (nebulization gas) through the IR.To prevent large droplets from reaching the plasma andcausing it to shut down due to decoupling, the fine mistgenerated by the nebulizer passes through a nebulizationchamber. The aerosol then collides with the nebulizationchamber walls and only the smallest of droplets continueonto the plasma, while the large ones fall into the drain.Upon entering the plasma, the droplets undergo threeprocesses. The first step is desolvation or the removal ofthe solvent from the droplets, resulting in microscopicsolid particulates, or a dry aerosol. The second step isvaporization or the decomposition of the particles intogaseous-state molecules. The third step is atomization orthe breaking of the gaseous molecules into atoms. Finally,excitation and ionization of the atoms occur, followed bythe emission of radiations from these excited species. Theanalytical signal is normally observed through an end-on(axial) viewing position.
2.2 Inductively Coupled Plasma Characteristics
The main analytical advantages of the ICP over otherexcitation sources originate from its capability forefficient and reproducible vaporization, atomization,excitation, and ionization for a wide range of elementsin various sample matrices. This is mainly due tothe high temperature, 6000–8000 K, in the observationzones of the ICP, which is much higher than themaximum temperature of flames or furnaces (3300 K).The high temperature of the ICP also allows it to exciterefractory elements and renders it less prone to matrixinterferences. Other electrical-discharge-based sources,such as alternating current and direct current arcs andsparks, and the microwave-induced plasmas (MIP) alsohave high temperatures for excitation and ionization, but
Encyclopedia of Analytical Chemistry, Online © 2006–2016 John Wiley & Sons, Ltd.This article is © 2016 John Wiley & Sons, Ltd.This article was published in the Encyclopedia of Analytical Chemistry in 2016 by John Wiley & Sons, Ltd.DOI: 10.1002/9780470027318.a5110.pub3

4 ATOMIC SPECTROSCOPY
the ICP is typically less noisy and better able to handleliquid samples. In addition, the ICP is an electrodelesssource, so there is no contamination from the impuritiespresent in an electrode material. Furthermore, it isrelatively easy to build an ICP assembly, and it isinexpensive when compared to some other sources suchas a LIP. The following is a list of some of the mostbeneficial characteristics of the argon ICP source:
• high temperature (6000–8000 K),• high electron density (1014 –1016 cm−3),• appreciable degree of ionization for many elements,• simultaneous multielement capability (over 70
elements including P and S),• low background emission and relatively low chemical
interference,• high stability leading to excellent accuracy and
precision,• excellent LODs for most elements
(0.1–300 μg L−1),(16)
• wide linear dynamic range (LDR) (four to six ordersof magnitude),
• applicable to refractory elements, and• cost-effective analyses.
The majority of ICP OES routine applications utilizeargon as the plasma gas. However, there are severalinteresting applications of mixed-gas plasmas, and evencomplete replacement of argon to improve the analyticalfigures of merit. The addition of other gases (e.g.H2, N2, O2, halocarbon gases, He, and other noblegases) to the composition of the auxiliary gas or thenebulization gas can improve plasma characteristics suchas thermal conductivity, electron number density, andplasma temperature. Such modifications can facilitate theatomization, ionization, and excitation of elements withhigh excitation and ionization energies (e.g. F, Cl, Br, I,As, Se, P, and S) and enable the analysis of slurries. Evensmall amounts of He or O2 added to the composition ofplasma gas (5%) can generate significantly more energeticconditions, resulting in potentially fewer matrix effects.Temperatures and electron number densities tend tobe higher for an O2 –Ar plasma when compared to aconventional all-Ar plasma. For high-carbon matricesand organic solvent mixtures, adding O2 to the plasma canprevent the deposition of carbon on the torch and reducebackground emissions due to CN and C2 bands. The maindrawbacks for using mixed-gas or alternative-gas plasmasare the required modifications in the torch and/or otherparts of the instrumentation, the introduction of newpotential interferences, and the additional running costsassociated with using different gases and mixtures.(17,18)
3 SAMPLE INTRODUCTION
An introduction system is used to transport a sampleinto the central channel of the ICP as a gas, vapor,aerosol of fine droplets, or solid particles. The generalrequirements for an ideal sample introduction systeminclude amenity to samples in all phases (solid, liquid, orgas), tolerance to complex matrices, the ability to analyzevery small amounts (<1 mL or <50 mg), excellent stabilityand reproducibility, high transport efficiency, simplicity,and low cost.(2) A wide variety of sample introductionmethods have been developed, such as nebulization,hydride generation (HG), electrothermal vaporization(ETV), laser ablation (LA), and direct sample insertion(DSI).(1,19–25) The analysis of liquid microsamples, at flowrates less than 0.1 mL min−1, is also possible.(26,27) Themost popular sample introduction methods are describedbelow.
3.1 Nebulizers
Nebulizers are the most commonly used devices forsolution sample introduction in ICP OES. With anebulizer, the liquid sample is converted into an aerosoland transported to the plasma. Both pneumatic nebulizers(PNs) and ultrasonic nebulizers (USNs) have beensuccessfully used in ICP OES. PNs make use of high-speed gas flows to create an aerosol, while the USNbreaks liquid samples into a fine aerosol by the ultrasonicoscillations of a piezoelectric crystal. The formation ofaerosol by the USN is therefore independent of the gasflow rate.
Only very fine droplets (about 8 μm in diameter) inthe aerosol are suitable for injection into the plasma. Aspray chamber is placed between the nebulizer and theICP torch to remove large droplets from the aerosol andto dampen pulses that may occur during nebulization.Thermally stabilized spray chambers are sometimesadopted to decrease the amount of liquid introducedinto the plasma, thus providing stability especially whenorganic solvents are involved. Because of this strictdroplet size selection, pneumatic nebulization becomesa very inefficient process. Only a very small fraction (lessthan 5%) of the aspirated sample solution actually reachesthe plasma, and most of the liquid is lost down the drain inthe spray chamber. Despite its drawbacks, PN retains itspopularity owing to its convenience, reasonable stability,and ease of use. Efficiency may only be a concern whensample volumes are limited or measurements must beperformed at or near the LOD.
Three types of PNs are commonly employed in ICPOES: the concentric nebulizer, the cross-flow nebulizer,and the Babington nebulizer (Figure 2). The concentricnebulizer is designed from fused silica. The sample
Encyclopedia of Analytical Chemistry, Online © 2006–2016 John Wiley & Sons, Ltd.This article is © 2016 John Wiley & Sons, Ltd.This article was published in the Encyclopedia of Analytical Chemistry in 2016 by John Wiley & Sons, Ltd.DOI: 10.1002/9780470027318.a5110.pub3

INDUCTIVELY COUPLED PLASMA OPTICAL EMISSION SPECTROMETRY 5
Ar
Sample
Ar
Sample
Ar
Sample
Samplefilm
(a)
(b) (c)
Figure 2 Schematic diagrams of three types of pneumaticnebulizer: (a) the concentric nebulizer; (b) the cross-flownebulizer; and (c) the Babington nebulizer.
solution is pumped into the back end of the nebulizerby a peristaltic pump. Liquid uptake rates may be ashigh as 4 mL min−1, but lower flows are more common.The sample solution flows through the inner capillary ofthe nebulizer. This capillary is tapered so that flexibletubing from the pump is attached at the entrance (4-mm outer diameter). The exit has a narrow orificeapproaching 100 μm or less in inner diameter. Ar gas(0.5–1.5 L min−1) is supplied at a right angle into thenebulizer outer tube. This tube is also tapered so that theexit internal diameter approaches the outer diameter forthe sample capillary. As the Ar gas passes through thisnarrow orifice, its velocity is greatly increased (Venturieffect), resulting in the shearing of the sample stream intotiny droplets (Figure 2a). Concentric nebulizers have theadvantages of excellent sensitivity and stability, but thesmall fragile fused-silica orifices are prone to clogging,especially when aspirating samples of high-salt content.Concentric nebulizers also require a fairly large volume ofsample, given the high uptake rate. The microconcentricnebulizer (MCN) is designed to solve this problem. Thesample uptake rate for the MCN is less than 0.1 mL min−1.The compact MCN employs a smaller diameter capillary(polyimide or Teflon) and poly(vinylidene difluoride)body to minimize the formation of large droplets and tofacilitate the use of hydrofluoric acid.
A second type of PN, the cross-flow nebulizer, isdesigned to reduce the clogging problem. In contrastto concentric nebulizers, cross-flow nebulizers use a high-speed stream of argon perpendicular to the tip of thesample capillary. Again, the sample solution is brokeninto an aerosol, as shown in Figure 2(b). The drawbacks
Ar
Samplechannel
Pt grids
CircularV-groove
Sapphirecrystal
Figure 3 The Hildebrand grid nebulizer (HGN).
of the cross-flow nebulizer include lower sensitivity andpotential capillary misalignment.
The third type of PN used for ICP OES is the Babingtonnebulizer, which allows a film of the sample solution toflow over a smooth surface containing a small orifice(Figure 2c).(28) High-speed argon gas emanating from theorifice shears the sheet of liquid into small droplets. Insome cases, the liquid may be guided over the argonorifice by positioning both the orifice and the sampleintroduction port at the base of a V-shaped groove (V-groove nebulizer). The essential feature of the Babingtonnebulizer is that the sample solution flows freely overa small aperture, rather than passing through a finecapillary, resulting in a high tolerance to dissolved solids.In fact, even slurries can be nebulized with a Babingtonnebulizer.(29) This type of nebulizer is the least susceptibleto clogging and it can nebulize very viscous liquids.
The Hildebrand grid nebulizer (HGN) (Figure 3) maybe considered a specialized version of the Babingtonnebulizer with many orifices. Often the nebulizer hasa screw-cap design. The outer member (cap) of thenebulizer holds two parallel platinum screens or grids.The grids are separated by approximately 2 mm. Theinner body of the nebulizer (screw) has a single samplechannel. Liquid is pumped through this channel at ratesup to 1 mL min−1. The inner body also has a circularV-groove that allows the liquid to contact the entireperimeter of the inner platinum grid. In this manner,the liquid completely wets both grids. A high-velocitystream of argon (1 L min−1) blows through the center ofthe nebulizer. Often the velocity of the argon is increasedby placing a sapphire crystal containing a small orifice(0.2 mm) in the center of the gas stream. The high-velocity argon forces the liquid through the tiny openingsin the screens producing a fine aerosol. The HGN ischaracterized by clog-free operation, high efficiency, andexcellent stability.
Another PN alternative to minimize clogging andimprove sensitivity is based on Flow Blurring®hydrodynamics.(30) In these devices, similar to a concen-tric nebulizer, the sample solution is pumped into the
Encyclopedia of Analytical Chemistry, Online © 2006–2016 John Wiley & Sons, Ltd.This article is © 2016 John Wiley & Sons, Ltd.This article was published in the Encyclopedia of Analytical Chemistry in 2016 by John Wiley & Sons, Ltd.DOI: 10.1002/9780470027318.a5110.pub3

6 ATOMIC SPECTROSCOPY
(a)
(b)
Liquid
H
D
Gas
Spray
θ
Figure 4 Flow Blurring® nebulizer: (a) cross-sectionaldiagram of the nozzle geometry, where H is the distancebetween the end of the solution capillary and the externalnebulizer tube and D is the diameter of the exit orifice;(b) back-flow mixing region when ψ= 0.2. (Reproduced withpermission from A.M. Ganan-Calvo, Appl. Phys. Lett., 86,214101 (2005) http://dx.doi.org/10.1063/1.1931057 © 2005, AIPPublishing LLC.)
back end of the nebulizer by a peristaltic pump, andthe nebulization gas is introduced perpendicularly to theliquid flow (Figure 4a). However, while nebulization ina concentric nebulizer relies on the Venturi effect, FlowBlurring® nebulizers provide a fine aerosol, with a partic-ularly narrow-sized droplet distribution, owing to theturbulent and extremely efficient micromixing betweennebulization gas and sample solution. This is achievedby forcing the nebulization gas to flow upstream intothe incoming liquid solution (Figure 4b), when ψ< 0.25(ψ= H/D, where H is the distance between the end ofthe solution capillary and the external nebulizer tubeand D is the diameter of the exit orifice). An interestingapplication of the Flow Blurring® technology is the possi-bility of developing multinebulizer systems.(31) The useof a multiple nozzle device allows for the simultaneousnebulization of different solutions (e.g. sample, standards,internal standards [ISs], and other reagents), which canenable online calibration, matrix matching, HG, and other‘in chamber’ sample preparation procedures.
With the USN, sample solution is first introduced ontothe surface of a piezoelectric transducer that is operatedat a frequency between 0.2 and 10 MHz. The longitudinalwave, which propagates perpendicularly to the surface ofthe transducer toward the liquid–air interface, producespressure that breaks the liquid into an aerosol.(32,33) Theefficiency of an USN is typically between 10% and 20%.This nebulizing efficiency is greater than that of a PN, andit is independent of argon flow rate. Therefore, a slowergas flow rate can be used to transport the aerosol to theplasma, thus prolonging the residence time of the analytein the plasma. This can result in improved sensitivity, andLODs may be lowered by a factor of 8–200, depending onthe element. However, the USN is more complicated andexpensive, and more susceptible to high solid loading andmatrix and memory effects. The USN is not compatiblewith hydrofluoric acid.
While the efficiency of each type of nebulizer dependson the specific ICP OES instrument employed (and itspower, gas, and flow parameters), some comparisonsare possible. Table 2 compares the relative magnitudeof LODs observed for 11 elements using four differentnebulizers. As the USN provides the lowest LOD in eachcase, its value is set to 1, and the other LODs are higherby the factor listed in Table 2. Using these 11 elementsas representative cases, on an average, LODs followthe trend USN < HGN < concentric < V-groove.(3,34)
Various other means of nebulization have been testedwith limited degrees of success.(32)
3.2 Hydride Generation
HG is a very effective sample introduction technique forsome elements. These elements include arsenic, bismuth,germanium, lead, antimony, selenium, tin, and tellurium.In this method, the sample in diluted acid solution ismixed with a reducing agent, usually a solution of sodiumborohydride in dilute sodium hydroxide. The reaction ofsodium borohydride with the acid produces hydrogen.The hydrogen then reduces the analyte metal ions tohydrides, which are gaseous at ambient temperature. Thechemical reactions are shown in Equations (1) and (2).
NaBH4 + 3H2O + HCl → H3BO3 + NaCl + 8H (1)
Em+ + (m + n) H → EHn + mH+ (2)
where E is the hydride-forming element of interest.The advantages of the HG technique include the
following:
• physical separation of the analyte from possible matrixinterfering concomitants;
Encyclopedia of Analytical Chemistry, Online © 2006–2016 John Wiley & Sons, Ltd.This article is © 2016 John Wiley & Sons, Ltd.This article was published in the Encyclopedia of Analytical Chemistry in 2016 by John Wiley & Sons, Ltd.DOI: 10.1002/9780470027318.a5110.pub3

INDUCTIVELY COUPLED PLASMA OPTICAL EMISSION SPECTROMETRY 7
Table 2 Relative ICP OES LODs observed using different nebulizers(3,34)
Element Wavelength (nm) USNa HGN Concentric V-groove
Ag 328.1 1 9 9 17Al 396.2 1 3 10 14As 193.7 1 6 4 8Cd 226.5 1 2 8 19Co 228.6 1 3 6 11Cr 267.7 1 3 7 11Cu 324.8 1 4 12 25Mn 267.6 1 7 8 12Ni 231.6 1 2 3 6Pb 220.4 1 7 5 9Zn 213.9 1 4 6 8Average 1 5 7 13
aThe relative LOD is the ratio of the LOD using a given nebulizer to the LOD for the USN.
• higher efficiency than conventional pneumatic nebu-lization;
• preconcentration of the analyte for better LODs;• capability for inorganic and/or organic speciation; and• ease of automation when used with flow injection
techniques.
On the other hand, several disadvantages of thistechnique may include the following:
• interference from those contaminants that reduce HGefficiency;
• slow reactions, necessitating hydride trapping beforeintroduction;
• critical control of experimental conditions such as pHand reagent concentrations; and
• extra influential factors, such as the oxidation state ofthe analyte of interest.
Table 3 shows a comparison of LODs for the hydride-generating elements determined by ICP OES using HG orconventional nebulization techniques. The values for HG-ICP OES in Table 3 are the best LODs cited in Nakahara’sreview paper.(19) Compared with conventional pneumaticnebulization techniques, LODs achieved by the HGtechnique are enhanced by a factor between 10 and 1000,depending on the element.
3.3 Electrothermal Vaporization
ETV has also been used to solve problems associatedwith pneumatic nebulization. Graphite furnaces or otherelectrothermal devices, such as carbon rods, carboncups, graphite boats, graphite tubes, tungsten coils,and other metal filaments, have been used in researchlaboratories to electrothermally vaporize a liquid or solidsample for introduction into the ICP.(20,21,35–37) Othervaporization methods, such as arc/spark vaporization and
Table 3 LODs observed by hydride generation, HG-ICPOES(1,19)
Elements LODby HG
(μg L−1)
LOD byconventionalnebulization
(μg L−1)
Ratios(conventional/
HG)
As 0.03 20 667Bi 0.06 20 333Ge 0.3 20 67Pb 1.0 10 10Sb 0.07 10 143Se 0.04 50 1250Sn 0.2 30 150Te 0.04 10 250
LA/vaporization, have also been used as a means forsample introduction in ICP OES. Even the ICP itselfhas been used to vaporize samples into a second ICP foranalytical measurements.(38) In a typical experiment, alow current is applied to the ETV to remove the samplesolvent. A small portion of the sample is then vaporizedby the device through the application of a high current.An optional ‘ash’ step may be used to remove some of thematrix before the analyte vaporization step. The resultingdense cloud of the analyte vapor is then efficiently sweptinto the center of the plasma by a flow of argon gas.
A commercial graphite furnace designed for atomicabsorption spectrometry (AAS) is most frequently usedin ETV-ICP OES. The major advantage of ETV as ameans of sample introduction is that the transportationefficiency is dramatically improved over a PN, fromless than 5% to over 60%. Consequently, the LODsare improved by at least an order of magnitude. Somedifficult-to-analyze samples, those with high TDSs, forexample, can be introduced by the ETV. However,as these devices are generally not of a continuous-flow nature, the ICP instrument has to be capable of
Encyclopedia of Analytical Chemistry, Online © 2006–2016 John Wiley & Sons, Ltd.This article is © 2016 John Wiley & Sons, Ltd.This article was published in the Encyclopedia of Analytical Chemistry in 2016 by John Wiley & Sons, Ltd.DOI: 10.1002/9780470027318.a5110.pub3

8 ATOMIC SPECTROSCOPY
recording transient signals. In addition, the simultaneousmultielement capability of the system could be limitedowing to this transient nature of signals. Furthermore,when graphite material is used for the ETV, carbideformation could be a problem for some elements,resulting in lowered sensitivity and memory effects forrefractory elements.
In an attempt to eliminate the problems associatedwith graphite, metal filaments have been employed forETV-ICP OES. For example, a tungsten coil from acommercial slide projector bulb can be used to vaporizeliquid samples before their introduction into the ICP.(35,39)
A small volume, typically 10–20 μL, of sample solutionis delivered to the tungsten coil and dried at low current.Then, a higher current is applied to atomize the samplefrom the coil. The vapor is then rapidly introduced intothe plasma as a dense plug by a flow of argon/hydrogengas. The LODs are typically improved by 100–1500 timescompared with pneumatic nebulization. These LODs arecomparable to those obtained by GFAAS, but with thecapability of simultaneous multielement measurementand at a low cost. A tungsten loop has also been usedas an in-torch vaporization (ITV) means for sampleintroduction to the ICP, and the operation can possiblybe automated.(20) These approaches still share some ofthe other disadvantages associated with graphite furnaceETV, and commercial systems have not yet appeared.
3.4 Chromatographic Couplers
The combination of the separation power of chromatog-raphy and the detection power of atomic emissionspectroscopy results in many advantages. One of theprimary advantages of chromatography over conven-tional sample introduction is the ability to obtainspeciation information.(40,41) When used as a detectorfor chromatographic methods, the ICP offers good sensi-tivity, wide LDR, and multielement detection capability.The multielement capability of the ICP, in turn, enhancesthe performance of chromatographic methods. Both gaschromatography (GC) and high-performance liquid chro-matography (HPLC) can be coupled with ICP OES.(42–46)
Compared with HPLC, however, the GC-ICP coupling isless common because the analytical performance of ICPOES is often not adequate for the typical non-metal-containing analytes separated by GC. Undoubtedly,GC-ICP OES is still useful in the analyses of volatileorganometallics, as demonstrated in the determinationof methylmercury species.(47) The successful combina-tion of these two techniques is realized through the useof chromatographic couplers. Fortunately, most of theinterface systems currently in use are relatively inexpen-sive and easy to construct, and they require few, if any,modifications to commercial ICP OES instruments.
Direct connections between the end of the HPLCcolumn and the nebulizer suffer from poor transportefficiency and low tolerance to many of the organicsolvents commonly employed in mobile phases for HPLC,particularly when a PN is used. To improve the transportefficiency and to minimize the influence of organicsolvents on the stability of the ICP, USNs, water-cooledthermospray chambers, and glass-frit nebulizers havebeen utilized for sample introduction in HPLC-ICP OES.The solvent load on the plasma can also be decreasedby aerosol thermostating, by adding oxygen gas into theplasma composition, increasing the incident RF power,using a condenser, or using a micro-HPLC column.
Other major sample introduction methods, such asthermospray, DSI, and LA, have also been used for ICPOES.(22,23,48–52) Each of these has its advantages anddisadvantages. For example, LA can be used to vaporizeany solid sample into the ICP.(22,53,54) In this case, nosample preparation is required, which usually resultsin improved LODs. On the other hand, LA generallyhas poor reproducibility, relatively high cost, and issuesassociated with calibration.
4 TORCH CONFIGURATION
The atomic emission from the plasma, as shown inFigure 1, is sampled for spectrometric measurements.Two configurations may be employed for observingemission from the ICP. One is referred to as a radialor side-on viewing of the plasma and the other is knownas an axial or end-on viewing of the plasma (Figure 1).A third viewing mode is the combination of these twobasic modes and is known as dual view. These are allcommercially available, and each of them has advantagesand disadvantages.
4.1 Radial View
The radial view is the classical operation mode for ICPOES. With radial viewing, the plasma is operated in avertical orientation, and the analytical zone is observedfrom the side of the plasma. This mimics the classicalviewing orientation for atomic emission from a flame.Radial viewing constrains the observation volume to thedistance through the diameter of the plasma. As this pathlength is limited, sensitivity is also limited, and so are theeffects of potential spectral and background interferences.The radial view orientation allows for better linearity andless noisy determinations than the axial view orientation,which results in improved analytical precision. The radialview also suffers from less matrix effects, as analyticalsignals from specific optimal regions of the plasma can becollected.
Encyclopedia of Analytical Chemistry, Online © 2006–2016 John Wiley & Sons, Ltd.This article is © 2016 John Wiley & Sons, Ltd.This article was published in the Encyclopedia of Analytical Chemistry in 2016 by John Wiley & Sons, Ltd.DOI: 10.1002/9780470027318.a5110.pub3

INDUCTIVELY COUPLED PLASMA OPTICAL EMISSION SPECTROMETRY 9
4.2 Axial View
With the axial view, the emission signal is observedfrom the end of the plasma (usually in a horizontalposition). The axial view provides better LODs thanthe radial view.(55) This may be attributed to thelonger viewing path available down the axis of theplasma. Thus, a better sensitivity and a 5- to 10-foldimprovement in the LODs can be achieved. Thedisadvantages of the axial view include the increasedpotential for spectral interference and matrix-inducedinterferences. Moreover, self-absorption effects can bequite severe because the observations are made throughthe much cooler tail plume of the plasma. Theseeffects can be significantly reduced by use of a sheargas,(56) or an appropriate cooled-cone optical interface,which displaces the tail plume from the optical path,thus reducing the self-absorption (Figure 1). However,both strategies present disadvantages associated to theadditional consumption of gas or the reduced capacityof handling samples with high amounts of dissolved(or suspended) solids. On the other hand, spectral
interferences may be either corrected or minimizedby improving spectral resolution, using an alternateanalytical line with less or no interference, or by applyingan interelement correction (IEC) factor.(1)
4.3 Dual View
In cases of very complicated sample matrices havinga wide range of elemental concentrations, the axialview may be inadequate. Several commercial instrumentscombine the axial and radial view configurations into asingle unit, known as dual view. This dual view systemallows the user to optimize the appropriate configurationfor the type of sample without the expense of two separateICP OES systems.(1) Dual view instruments are usuallybuilt to be either axially or radially-optimized, with theother plasma view orientation working at a compromisecondition. In any case, reflective surfaces or periscopesare required to enable signal collection from bothview orientations.(12) Conventional dual view instrumentsrequire at least two sequential readings of the sample tocover both axial and radial plasma views. Depending on
Axial light
To detector
Dichroic spectralcombiner (OSC)
Verticaltorch andplasma
Radial light
Figure 5 Schematic diagram of the synchronous vertical dual view configuration. Emitted radiations from axial and radial plasmaviews synchronously converge onto the dichroic spectral combiner and are transmitted to the polychromator. (Reproduced withpermission from Ref. 57. © Agilent Technologies®, 2014.)
Encyclopedia of Analytical Chemistry, Online © 2006–2016 John Wiley & Sons, Ltd.This article is © 2016 John Wiley & Sons, Ltd.This article was published in the Encyclopedia of Analytical Chemistry in 2016 by John Wiley & Sons, Ltd.DOI: 10.1002/9780470027318.a5110.pub3

10 ATOMIC SPECTROSCOPY
the instrument design, up to four readings are necessary,which deteriorates the analytical throughput.
Alternatively, a dichroic spectral combiner can beused to select and combine radiations from both views,allowing specific emission wavelengths to be reflectedand transmitted to the detector.(57) The synchronousvertical dual view configuration (Figure 5) allows forthe determination of elements at high concentrationlevels (e.g. macronutrients) simultaneously to those attrace levels. The simultaneous acquisition enables fasteranalysis and less consumption of argon than other dualview configurations.
5 DETECTION OF EMISSION
5.1 Gratings
ICP OES is characterized by remarkably rich spectra. Forexample, the 70 elements most commonly determinedby the method give rise to at least 70 000 totalemission lines in the 200- to 600-nm wavelengthrange. A consequence of this high density of spectralinformation is the need for high resolving power. Thelow-resolution dispersive systems typically employed withatomic absorption spectrometers will not suffice. Spectralinterferences occur in this case even if only a smallnumber of concomitant elements are present at moderateconcentrations in the sample. Much higher resolution isdesirable in ICP OES, with spectral bandpass (�λs) of0.01 nm or lower, if possible. Traditionally, this degreeof resolution has been accomplished using plane gratingmonochromators with large focal lengths ( f = 0.5 m ormore).
Figure 6 depicts a plane-ruled grating. The normalto the grating surface (N) is shown as a dashed line.A light ray incident to the grating approaches at angle α,measured with respect to N. The diffracted ray leavesthe grating surface at angle β. Parallel rays strikingthe grating on different adjacent groove facets travela different distance before reaching a common positionbeyond the grating. If the difference in distance traveled isa multiple of the wavelength of the light (λ) incident uponthe grating surface, then the rays undergo constructiveinterference. Otherwise, destructive interference occurs.Relatively simple geometrical considerations result in thegrating formula shown in Equation (3):
d(sin α + sin β) = mλ (3)
Equation (3) shows the relationship between α, β, thegroove spacing (d), the wavelength of light (λ), and theorder of diffraction (m). The order of diffraction maytake any integer value including zero. At zero order,
α
β
d
N
Figure 6 Diagram of the plane-ruled grating. N is the normalto the grating surface, α the angle of incidence measured withrespect to N, β the angle of diffraction measured with respect toN, and d the width of a single groove.
all wavelengths undergo constructive interference at thesame diffraction angle, and the grating works as a mirror.In the first order, one particular wavelength undergoesconstructive interference at the angle β, which corre-sponds to the specular reflection angle for rays incidentat angle α. This wavelength is called the blaze wavelengthfor the grating, and it is determined by the angle at whichthe grooves are cut with respect to the surface of thegrating. A grating is most efficient at its blaze wavelength.Typically, a grating may have efficiency as high as 70%at its blaze wavelength, so the intensity measured at theblaze wavelength is 70% of the intensity that would bemeasured at the specular reflectance angle for a polishedmirror of the same coating and material as the grating.
Normally, when a plane grating is employed, the angleof incidence is nearly 0, so sin α approaches 0. In this case,the grating formula may be further reduced, as shown inEquation (4):
sin β = mλ
d(4)
The angular dispersion of the grating (dβ/dλ) may befound, as shown in Equations (5) and (6), by taking thederivative of both sides of the above equation with respectto λ:
(cos β)dβ
dλ= m
d(5)
dβ
dλ= m
d cos β(6)
The angular dispersion, therefore, increases with largerorder, smaller groove spacing, or larger β. Angulardispersion may be converted to linear dispersion along
Encyclopedia of Analytical Chemistry, Online © 2006–2016 John Wiley & Sons, Ltd.This article is © 2016 John Wiley & Sons, Ltd.This article was published in the Encyclopedia of Analytical Chemistry in 2016 by John Wiley & Sons, Ltd.DOI: 10.1002/9780470027318.a5110.pub3

INDUCTIVELY COUPLED PLASMA OPTICAL EMISSION SPECTROMETRY 11
the exit focal plane of the monochromator by simplymultiplying by the focal length (f) of the monochromator.The spectral bandpass (�λs) in wavelength units isthen determined by dividing the slit width of themonochromator by the linear dispersion. So �λs getssmaller (higher resolution) for larger f, larger order,larger β, smaller d, and smaller slit width. A typical planegrating is operated in the first order. The groove densityof the grating might be as high as 3600 grooves mm−1,so the groove spacing (d) might be as small as0.0003 mm. Therefore, assuming β is 45◦ and the slitwidth is 25 μm, a monochromator with a focal length of500 mm provides a spectral bandpass of 0.01 nm. Sucha system effectively isolates most ICP emission lines.However, simultaneous multielement determinations arenot performed effectively with such a system. The focalplane for this type of monochromator is 5-cm long at best,so the entire spectral window is approximately 20 nmin width. Unless the analytes of interest exhibit emissionlines within 20 nm of one another, the wavelength must bescanned to detect multiple elements. So, two other opticalapproaches have become more popular for simultaneousdeterminations: the concave grating placed on a Rowlandcircle and the echelle grating coupled with a prism order-sorting device.
Shortly after designing his grating ruling engine in1881, Rowland first conceived the idea of ruling gratingson a spherical mirror of speculum metal.(58) The mostimportant property of such a concave grating was alsoobserved by Rowland. If the source of light and thegrating are placed on the circumference of a circle, andthe circle has a diameter equal to the radius of curvatureof the grating, then the spectrum is always brought toa focus on the circle. Hence, the focal ‘plane’ is curvedand of considerable length (Figure 7). In this case, oneentrance slit is placed on the circle for introduction ofthe source radiation, and multiple exit slits may be placedaround the circle at the analytical wavelengths of interest.Thus, Rowland’s circle is ideally suited for multielementICP emission spectrometry. A further advantage of theRowland geometry is the elimination of the need forany collimating or focusing lenses or mirrors. A Rowlandcircle spectrometer with the same groove density, slitwidth, and focal length as the plane grating systemdescribed above provides similar spectral bandpass butwith a much larger spectral window.
The Paschen-Runge arrangement shown in Figure 7is the basis of the commercial optimized Rowland circlealignment (ORCA) system. The configuration, with 32line array detectors, a sealed polychromator filled withAr, and no focusing lenses, mirrors, or prisms, allows forlow stray light levels, high resolution and high sensitivityin the UV and vacuum ultraviolet (VUV) region. TheORCA system has a larger footprint than traditional
N
λ2
λ3
λ4 λ5
λ6
λ7
λ8
λ1
From
ICP
Figure 7 The Paschen-Runge mounting of a concave gratingon a Rowland circle. The grating, entrance slit, and focusedimages of the diffracted wavelengths are all positioned on theperimeter of the circle. N is the grating normal.
echelle-based instruments. On the other hand, it providesuniform resolution over a wide spectral region.(13)
A second approach to carrying out high-resolution,multielement determinations is based on the echellegrating, which is a coarsely ruled grating, typically havinga groove density of 70 grooves mm−1, so d = 0.014 mm.The increase in spectral bandpass due to the increase in dis overcome by operating the grating in higher orders(m = 25–125) and using steeper angles of diffraction(β> 45◦). Figure 8 demonstrates how the steeper sidesof the groove facets are used with the echelle grating.If the steep sides of the grooves are blazed such thatspecular reflectance occurs when α= 60◦ and β= 50◦,then each wavelength exhibits a peak in grating efficiencyat a particular order as determined by the grating formula.For example, for the 70 grooves mm−1 grating describedabove, the order of maximum efficiency (mmax) occurs asshown in Table 4. The efficiency of the grating for a givenwavelength at its optimum order can be as high as 65%.This level of efficiency is typically attained across the freespectral range for a given order. The free spectral range(�λf) is defined as the range of wavelengths over whichno overlap from adjacent orders occurs and is given byEquation (7):
�λf = λ
m + 1(7)
As indicated in Table 4, �λf is very small forlarge values of m. Obviously, then, severe spectraloverlap occurs with an echelle grating. The overlapdoes not simply involve adjacent orders, but all orders
Encyclopedia of Analytical Chemistry, Online © 2006–2016 John Wiley & Sons, Ltd.This article is © 2016 John Wiley & Sons, Ltd.This article was published in the Encyclopedia of Analytical Chemistry in 2016 by John Wiley & Sons, Ltd.DOI: 10.1002/9780470027318.a5110.pub3

12 ATOMIC SPECTROSCOPY
αβ
d
N
Figure 8 Diagram of the echelle grating. N is the normal to thegrating surface, α the angle of incidence measured with respectto N, and β the angle of diffraction measured with respect to N.The light is incident to the steeper sides of the groove facets andapproaches the grating at nearly grazing angles (62◦); d is thewidth of a single groove.
Table 4 The order of maximum efficiency and the freespectral range at that order for an echelle grating having70 grooves mm−1, angle of incidence (α) of 60◦, and blazeangle (β) of 50◦
λ (nm) mmax �λf (nm)
200 117 1.7250 93 2.7300 78 3.8350 67 5.2400 58 6.7
are dispersed in multiple layers along the same focalplane. This overlap is corrected most often with anorder-sorting prism. This prism is placed between theechelle grating and the focal plane (Figure 9). Theprism is positioned so that it disperses the light in adirection perpendicular to the direction of dispersion ofthe grating. As a result, the focal plane has wavelengthdispersed in the horizontal direction and order sorted inthe vertical direction. The free spectral range (and theregion of maximum efficiency) has a roughly triangularshape centered horizontally on the plane (Figure 10). Anechelle spectrograph often provides a spectral bandpassnearly 10 times smaller than that of a typical gratingmonochromator with a similar focal length. In addition,the echelle system provides high efficiency at manywavelengths rather than a single blaze wavelength.Finally, both the high efficiency and superior resolutionare available over a very broad spectral window. As
Focalplane
Echellegrating
Prism
Entranceslit
AxialICP
Collimatingmirror
Collectionmirror
Imagingmirror
Figure 9 Schematic diagram of an echelle spectrograph.(Adapted from the schematic diagram of the Prodigy ICPprovided by Teledyne Leeman Labs, Inc., Hudson, NH.)
a result, the echelle configuration is the predominantoptical arrangement in modern ICP OES instruments.(59)
Oxygen gas strongly absorbs radiation in the VUV(100–200 nm) region of the electromagnetic spectrum.Elements such as As, Br, C, Cl, P, and S present strongemission lines in this region and almost no analyticallysignificant emission line above 200 nm. Thus, to enabledetections of these analytes in normal atmospheric airconditions, the entire path length from the plasma to thedetector is purged with an inert gas. The most commonchoices are N2 and Ar, which depend not only on theanalytical performance but also on the cost. The opticscan also be evacuated, which is more expensive andcan negatively affect the price of the instrument.(60) Analternative is to seal the entire polychromator and fill itwith Ar, as in the previously described ORCA system.(13)
5.2 The Photomultiplier Tube
Figure 11 is a schematic representation of the PMT. Likeits predecessor, the vacuum phototube, the heart of thePMT consists of two electrodes sealed in a fused-silicaenvelope. The cathode has a relatively large surface area,usually in the shape of a vertical, hollow ‘half cylinder’.The cathode is made from a photoemissive material suchas an alkali metal oxide. The anode is simply an electroncollection wire or grid. Unlike the phototube, however,the PMT has up to 14 secondary emission dynodes placedbetween the cathode and the anode. Typically, the anodeis fixed to the ground potential and the dynodes are atpotentials that are successively more negative, by about100 V/dynode. The potential of the cathode is typically−1000 V.
Encyclopedia of Analytical Chemistry, Online © 2006–2016 John Wiley & Sons, Ltd.This article is © 2016 John Wiley & Sons, Ltd.This article was published in the Encyclopedia of Analytical Chemistry in 2016 by John Wiley & Sons, Ltd.DOI: 10.1002/9780470027318.a5110.pub3

INDUCTIVELY COUPLED PLASMA OPTICAL EMISSION SPECTROMETRY 13
Order
(m)
125
115
105
95
85
75
65
55
45
35
λ2(nm)
193
209
229
253
283
321
370
438
535
688
λ1(nm)
180
195
214
237
264
300
346
409
499
642
Free spectral range(a) (b)
(c) (d)
(e)
Ca 315.89
Ca 393.37
Si 288.16
Mg 285.21Mg 280.27
Mg 279.55
Figure 10 Diagram representing the two-dimensional focalplane provided by the echelle spectrograph (a). The triangle-shaped free spectral range is the region of highest gratingefficiency. The distance between adjacent vertical lines is 1 nm,and the beginning (λ1) and ending (λ2) wavelengths depicted bythe lines are listed for each order. Only 1 out of every 10 ordersis shown for clarity. An actual negative image collected duringthe aspiration of tap water (b) shows atomic emission lines asdark spots against a white background. Close inspection revealsthe different orders as faint horizontal lines across the image,with the roughly triangular shape of the free spectral range. Animage for distilled-deionized water (c) may be subtracted fromthe tap water image resulting in a background-subtracted image(d). The region of interest may be enlarged so that emissionlines from Ca, Mg, and Si in the tap water may be identified (e).
A photon generated in the ICP and passing through thewavelength selection device may pass through the fused-silica envelope of the PMT, through a baffle-type grill,and strike the photocathode. If the energy of the photonis higher than the work function of the photocathodematerial, then an electron may be ejected from thecathode (photoelectric effect). The fraction of photonswith energy greater than the work function that actuallyproduce a photoelectron is called the quantum efficiencyof the photocathode. The quantum efficiency may be ashigh as 0.5, and it depends on the photocathode materialand the wavelength. A plot of quantum efficiency versuswavelength is called the spectral response curve for the
e−
ne−
n2e−
Dynodes
Anode
Shield
hν
Grill
Figure 11 Cross-sectional and front views of a side-on PMT.In the cross section, two types of dynodes are depicted: curved(outer) and flat (inner). The outside surfaces of the curveddynodes are seen in the front view.
PMT. The spectral response curve is usually supplied bythe manufacturer.
Once an electron has been ejected by the photocathode,it is accelerated toward the first dynode. Upon impact,the first dynode releases x secondary electrons (wherex is typically between 2 and 5). This process continuesat each dynode, with each electron impact imparting xnew secondary electrons. So, by the time that the pulsegenerated by a single photon reaches the anode it hasbeen greatly multiplied, and hence the name multiplierphototube or PMT. The gain, G, for a PMT can be definedas shown in Equation (8):
G = xn (8)
where n is the number of dynodes. The gain dependson the voltage across the PMT and it may be as high as108. One of the best features of the PMT is that the gainis acquired with almost no increase in noise. Thus, thePMT is ideally suited for the detection of small analyticalsignals against a relatively dark background, as is thecase near the LOD in high-resolution atomic emissionspectrometry.
Usually the entrance aperture, as defined by the grillon the PMT, is very large compared to a single resolutionelement at the focal plane of a monochromator. Thisdisparity is corrected by placing a mechanical slit on thefocal plane in front of the PMT. The width of this slit thendefines the range of wavelengths (�λs) that are allowedto strike the PMT. Sequential detection of multipleelements can be accomplished by changing the gratingangle in a conventional monochromator, thus scanningthe wavelengths that are detected. A second approachis to move the PMT rapidly along the focal curve of
Encyclopedia of Analytical Chemistry, Online © 2006–2016 John Wiley & Sons, Ltd.This article is © 2016 John Wiley & Sons, Ltd.This article was published in the Encyclopedia of Analytical Chemistry in 2016 by John Wiley & Sons, Ltd.DOI: 10.1002/9780470027318.a5110.pub3

14 ATOMIC SPECTROSCOPY
a Rowland circle spectrometer. Such a spectrometermay have several prealigned exit slits along the focalcurve, each corresponding to a particular element(Figure 7). A still more efficient method for sequentialmultielement determinations involves the echelle poly-chromator (Figure 9). A mask with many slits, eachcorresponding to a different element, may be placed onthe two-dimensional focal plane. The PMT is held in amechanical arm that quickly positions the detector atthe appropriate x–y coordinates for a given element.This design allows very fast sequential determinationsby ‘wavelength hopping’ or direct reading rather thanscanning linearly through all wavelengths to reach aselect few. One commercial instrument using this designis called a direct reading echelle (DRE) ICP instrument.
Simultaneous multielement determinations may beperformed with multiple PMTs, but such designs quicklybecome limited by the size of the PMTs and thegeometry of the polychromator. Multiple PMTs may bepositioned either along the focal curve of a Rowlandcircle spectrometer or along the exit plane of an echellepolychromator. Solid-state detectors, with their relativelysmall size and intrinsic multielement nature, are usuallymore effective for simultaneous determinations.
5.3 Array Detectors
Charge transfer devices (CTDs) include a broad range ofsolid-state silicon-based array detectors.(61) They includethe charge injection device (CID) and the charge-coupleddevice (CCD). The CCD has found extensive use innonspectroscopic devices such as video cameras, bar codescanners, and photocopiers. With the CTDs, photonsfalling on a silicon substrate produce electron–hole pairs.The positive electron–holes migrate freely through thep-type silicon semiconductor material, while the electronsare collected and stored temporarily by an array of metaloxide semiconductor (MOS) capacitors (Figure 12). EachMOS capacitor is composed of a small metal electrodeand a thin layer of insulating SiO2 material on top of thep-type silicon substrate. A positive potential is appliedto the metal electrode, so the electrons generated in agiven region are trapped just below the insulating layer.Each MOS capacitor (or pixel) has a width in the 5- to50-μm range and a height that may be as large as 200 μm.A two-dimensional array of pixels is easily prepared byproper placement of the metal electrodes. Such arraysmay vary in size, even beyond 4000 pixels on an edge. TheCCD differs from the CID mainly in the readout scheme.The CCD is read out in a sequential charge-shiftingmanner toward the output amplifier. The CID, on theother hand, may be read out in a nondestructive mannerby shifting charge between adjacent electrodes, and thenshifting it back again. The CID thus benefits from quick
- - - - - - - -
Insulating layer
(SiO2)
p-type silicon
Electrons
Metal electrodes
hν
Figure 12 Cross-sectional diagram of two adjacent pixels in aCCD detector.
random access, even during long integration periods. InCID-based devices, charges can be measured even duringsignal collection. Thus, integration time can be adjustedto avoid blooming (charge spill from one pixel to one ofits neighbors) and improve the detector’s dynamic range.Because charges in each pixel are measured and recordedseparately in a CID, background and spectral interferencecorrection can be carried out after the measurement. Inaddition, both intense and weak signals can be recordedsimultaneously at the most adequate signal-to-noise (S/N)conditions for each case.
Spectroscopic applications of CTDs have beenhampered by the physical mismatch between the rela-tively small surface area of the detector and thelarge, sometimes two-dimensional, focal plane associatedwith polychromators. This mismatch may be overcome,however, and one commercial ICP spectrometer employsa CID detector having more than 250 000 pixels positionedon an echelle focal plane.
Alternative approaches have been successful with theCCD detector. In one case, a group of several CCD arraysare arranged around a circular optical system (CIROS)based on a Rowland circle design. Rather than monitoringdiscrete wavelengths, as is the case with the multiple PMTRowland circle systems, the CIROS system provides totalwavelength coverage from 120 to 800 nm, with resolutionon the order of 0.009 nm.
A second multiple CCD array detector has beenavailable commercially. This detector, called a segmentedarray charge-coupled device detector (SCD), employsover 200 small subarrays of 20–80 pixels each.(61) Thesubarrays are positioned along the two-dimensional focalplane of an echelle spectrograph. The position of eachsubarray corresponds to one of the 236 most prominentICP emission lines of the 70 most commonly determinedICP elements. This design allows for discrete wavelengthdeterminations as seen with the multiple PMT designs, butit also provides additional spectral information around
Encyclopedia of Analytical Chemistry, Online © 2006–2016 John Wiley & Sons, Ltd.This article is © 2016 John Wiley & Sons, Ltd.This article was published in the Encyclopedia of Analytical Chemistry in 2016 by John Wiley & Sons, Ltd.DOI: 10.1002/9780470027318.a5110.pub3
INDUCTIVELY COUPLED PLASMA OPTICAL EMISSION SPECTROMETRY 15
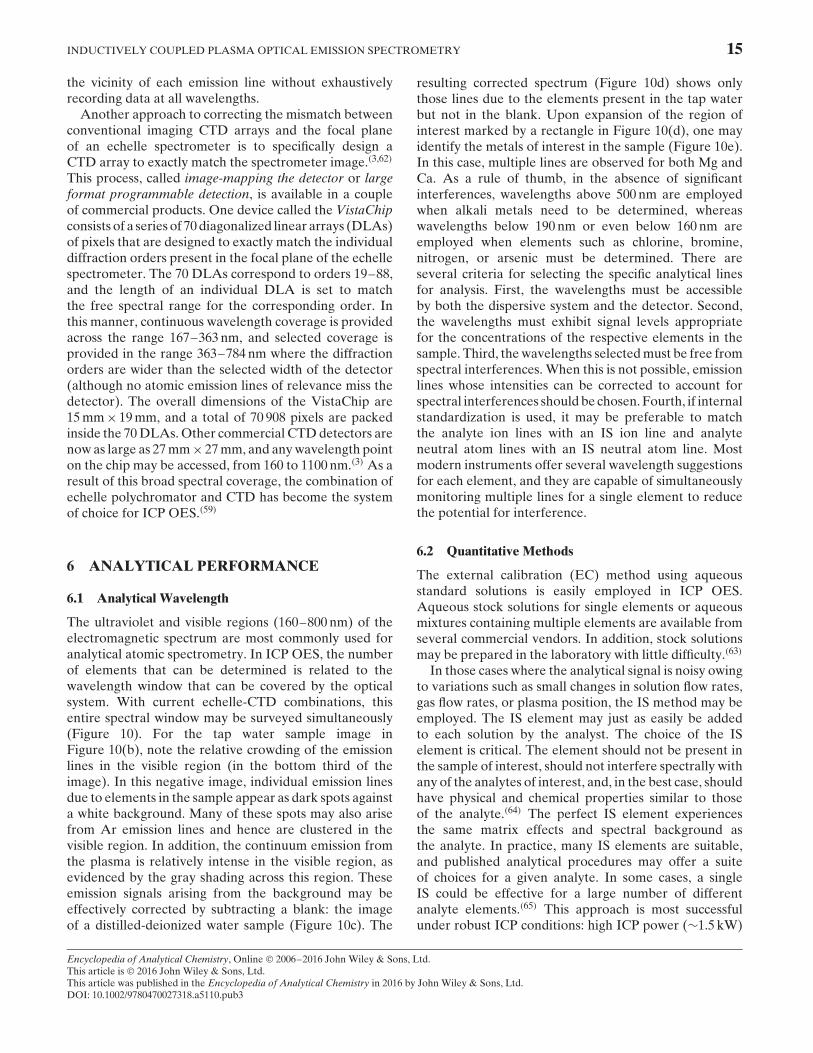
the vicinity of each emission line without exhaustivelyrecording data at all wavelengths.
Another approach to correcting the mismatch betweenconventional imaging CTD arrays and the focal planeof an echelle spectrometer is to specifically design aCTD array to exactly match the spectrometer image.(3,62)
This process, called image-mapping the detector or largeformat programmable detection, is available in a coupleof commercial products. One device called the VistaChipconsists of a series of 70 diagonalized linear arrays (DLAs)of pixels that are designed to exactly match the individualdiffraction orders present in the focal plane of the echellespectrometer. The 70 DLAs correspond to orders 19–88,and the length of an individual DLA is set to matchthe free spectral range for the corresponding order. Inthis manner, continuous wavelength coverage is providedacross the range 167–363 nm, and selected coverage isprovided in the range 363–784 nm where the diffractionorders are wider than the selected width of the detector(although no atomic emission lines of relevance miss thedetector). The overall dimensions of the VistaChip are15 mm × 19 mm, and a total of 70 908 pixels are packedinside the 70 DLAs. Other commercial CTD detectors arenow as large as 27 mm × 27 mm, and any wavelength pointon the chip may be accessed, from 160 to 1100 nm.(3) As aresult of this broad spectral coverage, the combination ofechelle polychromator and CTD has become the systemof choice for ICP OES.(59)
6 ANALYTICAL PERFORMANCE
6.1 Analytical Wavelength
The ultraviolet and visible regions (160–800 nm) of theelectromagnetic spectrum are most commonly used foranalytical atomic spectrometry. In ICP OES, the numberof elements that can be determined is related to thewavelength window that can be covered by the opticalsystem. With current echelle-CTD combinations, thisentire spectral window may be surveyed simultaneously(Figure 10). For the tap water sample image inFigure 10(b), note the relative crowding of the emissionlines in the visible region (in the bottom third of theimage). In this negative image, individual emission linesdue to elements in the sample appear as dark spots againsta white background. Many of these spots may also arisefrom Ar emission lines and hence are clustered in thevisible region. In addition, the continuum emission fromthe plasma is relatively intense in the visible region, asevidenced by the gray shading across this region. Theseemission signals arising from the background may beeffectively corrected by subtracting a blank: the imageof a distilled-deionized water sample (Figure 10c). The
resulting corrected spectrum (Figure 10d) shows onlythose lines due to the elements present in the tap waterbut not in the blank. Upon expansion of the region ofinterest marked by a rectangle in Figure 10(d), one mayidentify the metals of interest in the sample (Figure 10e).In this case, multiple lines are observed for both Mg andCa. As a rule of thumb, in the absence of significantinterferences, wavelengths above 500 nm are employedwhen alkali metals need to be determined, whereaswavelengths below 190 nm or even below 160 nm areemployed when elements such as chlorine, bromine,nitrogen, or arsenic must be determined. There areseveral criteria for selecting the specific analytical linesfor analysis. First, the wavelengths must be accessibleby both the dispersive system and the detector. Second,the wavelengths must exhibit signal levels appropriatefor the concentrations of the respective elements in thesample. Third, the wavelengths selected must be free fromspectral interferences. When this is not possible, emissionlines whose intensities can be corrected to account forspectral interferences should be chosen. Fourth, if internalstandardization is used, it may be preferable to matchthe analyte ion lines with an IS ion line and analyteneutral atom lines with an IS neutral atom line. Mostmodern instruments offer several wavelength suggestionsfor each element, and they are capable of simultaneouslymonitoring multiple lines for a single element to reducethe potential for interference.
6.2 Quantitative Methods
The external calibration (EC) method using aqueousstandard solutions is easily employed in ICP OES.Aqueous stock solutions for single elements or aqueousmixtures containing multiple elements are available fromseveral commercial vendors. In addition, stock solutionsmay be prepared in the laboratory with little difficulty.(63)
In those cases where the analytical signal is noisy owingto variations such as small changes in solution flow rates,gas flow rates, or plasma position, the IS method may beemployed. The IS element may just as easily be addedto each solution by the analyst. The choice of the ISelement is critical. The element should not be present inthe sample of interest, should not interfere spectrally withany of the analytes of interest, and, in the best case, shouldhave physical and chemical properties similar to thoseof the analyte.(64) The perfect IS element experiencesthe same matrix effects and spectral background asthe analyte. In practice, many IS elements are suitable,and published analytical procedures may offer a suiteof choices for a given analyte. In some cases, a singleIS could be effective for a large number of differentanalyte elements.(65) This approach is most successfulunder robust ICP conditions: high ICP power (∼1.5 kW)
Encyclopedia of Analytical Chemistry, Online © 2006–2016 John Wiley & Sons, Ltd.This article is © 2016 John Wiley & Sons, Ltd.This article was published in the Encyclopedia of Analytical Chemistry in 2016 by John Wiley & Sons, Ltd.DOI: 10.1002/9780470027318.a5110.pub3

16 ATOMIC SPECTROSCOPY
216.0
0
20
40
60
Em
issio
n s
ignal
80
100
120
216.5 217.0
Pb
Cu
Wavelength (nm)
217.5
Figure 13 ICP OES spectrum of a solution containing60 μg L−1 Pb and 100 μg L−1 Cu.
and low nebulization gas flow rate (∼0.6 L min−1 Ar).(66)
The procedure is straightforward. One simply adds the ISelement with a constant concentration to each standardand sample solution to be analyzed. For example, aPb calibration curve in the range of 0–100 μg L−1 maybe constructed by preparing five Pb standard solutionsspanning this concentration region, each containing100 μg L−1 Cu. The Pb emission line at 217.0 nm maybe monitored along with a nearby Cu emission line at216.5 nm (Figure 13). If spectra such as this are collectedfor each solution, a plot of the raw Pb signals generatethe calibration points depicted by the black diamonds inFigure 14. If, on the other hand, those same Pb signals aredivided by the emission signal for Cu in each spectrum, abetter linear fit is observed (circles in Figure 14). When
0 20 40 60
Pb concentration (μg L−1)
Pb e
mis
sio
n s
ignal P
b s
ignal/C
u s
ignal
80 1000.00
0.05
0.10
0.15
0.20
0.25
0.30
0.35
0.40
0.45
0
5
10
15
20
25
30
40
35
Figure 14 Internal standard correction for a Pb calibrationcurve. The fit using the raw Pb emission signal (diamonds) isgreatly improved when ratioed to the signal measured for agiven amount of Cu (100 μg L−1) added to each sample (circles).The same Pb ICP OES emission signals were used in each case.
the curves are scaled to the same magnitude, note thatthe slopes are nearly identical, as, in theory, the IS plot isequivalent to the raw plot divided by a constant. In thisexample, not only is the linear fit improved but also theS/N ratio for the individual measurements is increased bynearly a factor of 10.
In extreme cases, where the sample matrix actuallyaffects the slope of the calibration curve, the standardadditions (SA) method should be employed.(67–69) It isalso possible to combine IS and SA to improve bothaccuracy and precision in ICP OES determinations. Theinternal standard additions (ISA) method has been usedto analyze urine samples by ETV-ICP OES after simple1:1 dilution with water.(70) The urine sample was dividedinto five separate 1-mL aliquots. Increasing amounts ofa Cd standard solution were added to the five aliquots,resulting in a series of solutions having 0, 2.5, 5.0, 7.5,and 10.0 μg L−1 added Cd. Each solution was also spikedwith 1 μg L−1 Bi as an IS, and the final volume was madeup to 2 mL with water. No further sample preparationwas employed, and the ETV-ICP OES signals fromCd (diamonds) and Cd/Bi ratio (circles) are plotted inFigure 15. Note that the IS correction is necessary toimprove the fit such that an accurate x intercept may bedetermined. The value for the x intercept is −1.1 μg L−1,and thus the original urine sample was found to contain1.1 ± 0.2 μg L−1 Cd. Analysis of the same sample byGFAAS following microwave acid digestion gave a valueof 1.3 ± 0.5 μg L−1 Cd.(70)
Standard dilution analysis (SDA) is another calibrationalternative that is faster and as accurate and preciseas SA.(71) Only two calibration solutions are requiredin SDA. Solution 1 contains 50% sample and 50% ofa standard reference solution containing the analytesand an IS. Solution 2 has 50% sample and 50% blank.As Solution 1 is introduced into the ICP OES, thecontinuously monitored analyte and IS signals increaseuntil they reach a stable plateau. Solution 2 is thenadded to the same tube containing Solution 1 and manycalibration points are generated as dilution takes place(Figure 16). Because the amount of sample never changes(both Solutions 1 and 2 contain each 50% sample), onlythe standard is diluted; hence the name SDA. This matrix-matching effect contributes to improved accuracies, andthe presence of an IS minimizes signal fluctuations due tovariations in solution flow rates, gas flow rates, or plasmapositioning.(71,72)
The SDA calibration curve is built by plotting theanalyte-to-IS signal ratio (SA/SIS) on the y-axis and thereciprocal of the IS concentration (1/CIS) on the x-axis(Figure 16b). Equations (9)–(12) show the mathematicalapproach to the SDA strategy. The analytical signal (SA)arises from both the sample (sam) and the referencestandard (std), while the IS signal (SIS) comes from the
Encyclopedia of Analytical Chemistry, Online © 2006–2016 John Wiley & Sons, Ltd.This article is © 2016 John Wiley & Sons, Ltd.This article was published in the Encyclopedia of Analytical Chemistry in 2016 by John Wiley & Sons, Ltd.DOI: 10.1002/9780470027318.a5110.pub3

INDUCTIVELY COUPLED PLASMA OPTICAL EMISSION SPECTROMETRY 17
(a)
(b)
−2 0
20
40
60
80
100
Cd added (μg L−1)
Cd e
mis
sio
n s
ignal
2 4 6 8 10 12
−2 0
2
4
6
8
Cd added (μg L−1)
Cd s
igna
l/B
i sig
nal
2 4 6 8 10 12
Figure 15 Standard additions curves for the determinationof Cd in urine by ETV-ICP OES. The x-axis represents theconcentration of Cd added to separate 1 mL aliquots of a urinesample. Each sample was also spiked with 1 μg L−1 Bi. Thediamonds (a) represent the raw Cd signal and the circles (b)include internal standard correction using the ratio of the Cdand Bi emission signals. The urine sample was found to contain1.1 μg L−1 Cd using the internal standard. Without the internalstandard, the amount found (x intercept) was zero.
reference standard only. These signals are related tothe respective concentrations by the calibration curvesensitivities (m): SA = mACA and SIS = mISCIS. The ratiobetween analyte and IS signals will then be
SA
SIS= mACA
mISCIS= mA(C sam
A + C stdA )
mISCIS
= mAC samA
mISCIS+ mAC std
A
mISCIS(9)
If SA/SIS is the dependent variable (y-axis) and 1/CIS isthe independent variable (x-axis), the slope and interceptof this calibration curve will be
Slope = mAC samA
mIS(10)
Table 5 Average recoveries (%) for Cr, Cu, and Fedetermined in five different matrices by ICP OES and EC, IS,SA, or SDA
Analyte EC IS SA SDA
Cr 110 ± 21 116 ± 7 103 ± 13 102 ± 5Cu 116 ± 18 123 ± 12 95 ± 7 97 ± 3Fe 112 ± 29 118 ± 15 105 ± 14 103 ± 5
Results are the combined mean ± 1 standard deviation (n = 15) forred wine, mouthwash, cola soft drink, HNO3 40% v v−1, and waterspiked with 10 mg L−1 of each analyte.(71)
Intercept = mAC stdA
mISCIS(11)
Finally, the analyte concentration in the sample iscalculated by rearranging Equations (10) and (11):
C samA = Slope
Interceptx
C stdA
CIS(12)
When compared to the traditional methods of EC, IS,and SA, the SDA method provides improved accuracyand precision, as shown in Table 5 for Cr, Cu, and Fedetermined by ICP OES.(71) In this example, samples ofred wine, mouthwash, cola soft drink, HNO3 40% v v−1,and water were spiked with 10 mg L−1 of each analyte. Theresults are shown as average recoveries for all matricescombined.
6.3 Analytical Figures of Merit
For ICP OES, the analytical figures of merit include thenumber of elements that can be determined, selectivity,reproducibility, long-term stability, susceptibility tomatrix interferences, LOD, and accuracy.(73) The numberof elements that can be measured by ICP OES is oftenmore than 70 out of a total of 92 naturally occurringelements, as listed in Table 6. Routine determinationof 70 elements can be accomplished by ICP OES atconcentration levels below 1 mg L−1. As can be seen fromTable 6, almost all naturally occurring elements, withthe exception of hydrogen, oxygen, fluorine, and inertgases, can be determined by ICP OES. The elements thatare not usually determined by ICP OES fall into threebasic categories. The first one includes those elementsthat occur either as trace contaminants in the argongas used in the ICP OES (C from CO2), constituentsof the sample solvent (C, O, H), or as contaminantsfrom the environment or atmosphere (N, for example).The second category encompasses those elements thatrequire high excitation energy, such as the halogens.However, these elements could be determined with poorLOD. The third category is the family of short-lived
Encyclopedia of Analytical Chemistry, Online © 2006–2016 John Wiley & Sons, Ltd.This article is © 2016 John Wiley & Sons, Ltd.This article was published in the Encyclopedia of Analytical Chemistry in 2016 by John Wiley & Sons, Ltd.DOI: 10.1002/9780470027318.a5110.pub3

18 ATOMIC SPECTROSCOPY
1.1
1
0.9
0.8
0.7
SA (
counts
)S
A/S
IS0.6
0.5
0.4
0.32
00
0.2
0.2
0.4
0.4
0.6
0.6
0.8
0.8
1 1.2
1
1.2
12 22 32 42 52 62 72
Time (s)
1/[IS] (L mg−1)
Cr Cu Fe V
Cr Cu Fe V
(a)
(b)
Figure 16 Typical standard dilution analysis signal profiles for (a) Cr, Cu, Fe, and V and (b) the corresponding SDA calibrationcurves.
Table 6 List of elements that can be determined by ICP OES
Alkaline and alkaline earth Lanthanides and actinides Transition metals Others
Li, Na, K, Rb, Cs, Be, Mg,Ca, Sr, Ba
Ce, Pr, Nd, Sm, Eu, Gd, Tb,Dy, Ho, Er, Tm, Yb, Lu, Th,U
Sc, V, Ti, Cr, Mn, Fe, Co,Ni, Cu, Zn, Y, Nb, Zr, Mo,Ru, Th, Pd, Ag, Cd, La, Hf,Ta, W, Re, Os, Ir, Pt, Au,Hg
B, C, N, Al, Si, P, S, Cl, Ga,Ge, As, Se, Br, In, Sn, Sb,Te, I, Tl, Pb, Bi
radioactive elements that are commonly determined byγ-ray spectrometry.(1)
Selectivity is important to minimize the spectraloverlap interferences resulting from elements withrich-line emission spectra (tungsten, cobalt, niobium,molybdenum, tantalum, and rare earth elements) andto improve the signal-to-background ratio (SBR).(73)
Selectivity is largely decided by the practical reso-lution of the wavelength dispersive system of theICP OES instrument. High selectivity is usuallyachieved with a sacrifice in sensitivity and the wave-length coverage range. For the best commercial ICPOES instruments, a resolution of less than 5 pm ispossible.(73)
Encyclopedia of Analytical Chemistry, Online © 2006–2016 John Wiley & Sons, Ltd.This article is © 2016 John Wiley & Sons, Ltd.This article was published in the Encyclopedia of Analytical Chemistry in 2016 by John Wiley & Sons, Ltd.DOI: 10.1002/9780470027318.a5110.pub3

INDUCTIVELY COUPLED PLASMA OPTICAL EMISSION SPECTROMETRY 19
The LODs of ICP OES are generally in the microgramper liter range. The LOD is usually defined asthe analyte concentration that produces an analyticalsignal equivalent to three times the standard deviationobserved for several measurements (e.g. 20) of a blanksolution.(74) Another definition of LOD for ICP OESdeterminations is related to the SBR of the analyte lineat a given concentration, c, and the relative standarddeviation (RSD) of the background, RSDB, as shown inEquations (13) and (14):(16,75)
LOD = 3 × c × RSDB
SBR(13)
orLOD = 3 × RSDB × BEC (14)
In this case, RSDB = SB/IB, where SB and IB are thestandard deviation and the mean intensity for the blank(n = 16); SBR = INet/IB, where INet is the analyte’s meannet intensity for concentration c and IB the mean intensityfor the blank (n = 16); and the background equivalentconcentration, BEC = c/SBR.
The LOD is determined, therefore, by the sensitivityof the measurement and the noise level (or stability) ofthe ICP OES instrument. The high degree of stability ofan ICP was identified when Greenfield et al.(10) first usedit for analytical atomic spectrometry. For the best ICPOES instruments, a long-term stability of less than 1%RSD has been achieved.(73) The atomic emission signalsfrom the ICP are larger than those from other sources,such as a flame. This occurs because the high-temperatureand inert-argon environment of the ICP leads to moreefficient atomization, ionization, and excitation. In fact,the temperature of the ICP is so high that the largestsignals are usually from ionic lines. There are manyother factors that may influence LOD, such as nebulizertype, view mode, and sample matrix.(16,76) Table 7 showsrepresentative ICP OES LODs obtained for 27 differentelements.(3) LODs using an axially viewed plasma aretypically better than those observed by radial viewing bya factor of 5–10,(1) as shown in Table 7. Table 8 showsLODs for ETV-ICP OES in comparison with those ofGFAAS. LODs for many elements by ETV-ICP OESare better than, or equivalent to, those achieved byGFAAS.(77,78) Notice that some elements that cannotbe determined by GFAAS can be measured by ICP OES.
Often the BEC is also used to check instrumentalperformance in ICP OES. The BEC is defined asthe concentration of a solution that results in ananalyte emission signal equivalent in intensity to thatof the background emission signal at the measurementwavelength. The BEC can be used as an indicator ofrelative sensitivity for an emission line. An unusually
Table 7 LODs (μg L−1) observed for ICP OES using aconcentric nebulizer with different viewing modes(3)
Element Wavelength (nm) Radial view Axial view
Ag 328.07 1 0.4Al 396.15 1 0.2As 193.70 12 3B 249.77 2 0.1Ba 455.40 0.1 0.01Be 313.04 0.06 0.04Ca 317.93 2 0.6Cd 226.50 0.7 0.2Co 228.62 2 0.3Cr 267.72 1 0.1Cu 324.75 0.7 0.2Fe 259.94 0.7 0.1K 766.49 10 0.8Mg 279.55 7 0.01Mn 267.61 0.3 0.02Mo 202.03 1 1Na 589.00 1 0.08Ni 231.60 2 0.4P 177.43 30 10Pb 220.35 5 1Sb 206.83 9 3Se 196.03 20 4Si 288.16 10 0.8Sr 407.77 0.05 0.03Tl 190.86 20 2V 292.40 0.9 0.07Zn 213.86 0.7 0.09
high BEC often indicates problems with the efficiency ofthe sample introduction system.
The LDR of calibration curves for ICP OES is usuallyfour to six orders of magnitude wide, starting fromthe LOD on the low-concentration side. These LDRsare significantly larger than the two to three orders ofmagnitude observed for competing techniques such asAAS and arc/spark OES. The wide LDRs in ICP OEStranslate into simple preparation of calibration curves.Very often, a couple of standards together with a blanksolution is enough to produce an accurate calibration.Multiple sample dilutions are seldom needed before theanalysis.
In general, the accuracy of the ICP OES techniquegets poorer as the analyte concentration approaches theLOD. For semiquantitative analysis (accuracy ±10%),the analyte concentration should be at least five timeshigher than the LOD. For accurate quantitation (±2%),the concentration should be 100 times greater thanthe LOD. At this concentration level, the precision istypically better than 1% RSD. This precision is consideredsufficient for most trace element determinations. Betterprecision can be achieved, if necessary, by sacrificinganalysis speed or with a more complex instrumentaldesign. The concept of limit of quantitation (LOQ) has
Encyclopedia of Analytical Chemistry, Online © 2006–2016 John Wiley & Sons, Ltd.This article is © 2016 John Wiley & Sons, Ltd.This article was published in the Encyclopedia of Analytical Chemistry in 2016 by John Wiley & Sons, Ltd.DOI: 10.1002/9780470027318.a5110.pub3

20 ATOMIC SPECTROSCOPY
Table 8 LODs (pg) for ETV-ICP OES compared with thoseof GFAAS(2,77,78)
Elements ETV-ICP OES GFAAS
Ag 1 0.5Al 0.5 4As 60 20Au 10 10Ba 0.3 10Be 1 1Bi 200 10B 4 NACa 150 5Cd 1 0.3Co 12 1Cu 2 1Er 34 300Eu 12 10Fe 10 2Ga 10 10Ge 10 20Hg 4 100In 20 5K 1200 2Li 2 5Lu 54 4000Mg 0.1 0.4Mn 0.3 1Mo 7 4Na 400 5Ni 27 10P 100 3000Pb 4 5Pt 25 50Rb 2800 5Re 100 NARu 95 40Sb 100 20Sc 17 40Se 450 20Si 100 40Sn 20 20Sr 5 2Te 50 10Ti 6 100Tl 300 10U 3 2.4 μgV 6 20W 160 NAY 25 NAYb 18 4Zn 0.6 1
NA, not available.
been defined as a concentration for which the precision,expressed as RSD, would be below a given threshold,for instance, 10% or 5%.(79) A 5%-based LOQ normallyoccurs at concentrations approximately 10 times greaterthan the LOD (based on three standard deviations).
6.4 Continuum Background and Interferences
The ICP spectrum includes argon emission lines and acontinuum background emission that covers the entirewavelength region used in ICP OES. This emissioncontinuum may or may not be related to spectralinterferences. It is mainly a result of radiation emittedby decelerating electrons (Bremsstrahlung effect) andby recombination reactions (M+ + e− → M + hν, whereM+ can be any ion, but primarily represents argonspecies). These phenomena are responsible for the plasmacontinuum background emission in the visible and UVregions, respectively. Although not generally significant,molecular emission bands from species generated in theplasma by aqueous solutions and atmosphere gases (e.g.OH, N2
+, NH, NO, and CN) also contribute to thebackground continuum. The introduction of matrices thatcause plasma cooling also affects background intensity.On the other hand, more severe effects may be observedwhen introducing high-carbon-content matrix samplesand organic-solvent-containing mixtures into the plasma.Relatively high molecular emission from species such asC2 (Swan band), CN (violet), and CH can significantlyimpact the background signal intensity and representpotential spectral interferences for determinations above300 nm.(14,80) Because the intensity of the backgroundcontinuum is proportional to the square of the electronnumber density (ne
2), the optimization of instrumentalparameters such as RF applied power and nebulizationgas flow rate can minimize potential interfering effects.
Among all commonly used analytical atomic spectrom-etry techniques, ICP OES is probably the one with thefewest number of interferences. The argon plasma is inertwhen compared to the chemical reactivity of a flame. Inaddition, the high temperature of the plasma helps toreduce chemical interferences. The temperature is highenough to break down most species into atoms or ions forexcitation and subsequent emission. In contrast, in a low-temperature flame, chemical interferences can be a severeproblem. For example, a small amount of aluminum willinterfere with the determination of calcium in flame AAS.On the other hand, no such chemical interference isobserved in ICP OES even at aluminum concentrations100 times higher than what would have been a problem forFAAS. However, chemical interferences do exist in ICPOES. Sometimes higher RF applied power and/or lowernebulization argon flow rates are used to minimize theseeffects. One particular type of chemical interference is theso-called easily ionized element (EIE) effect. The EIEsare those elements that have low ionization potentials,such as alkaline elements. High concentrations of EIEscan suppress or enhance emission signals, depending onthe analyte species. One way to reduce the EIE effect is todilute the sample solution to the point that the EIE effect
Encyclopedia of Analytical Chemistry, Online © 2006–2016 John Wiley & Sons, Ltd.This article is © 2016 John Wiley & Sons, Ltd.This article was published in the Encyclopedia of Analytical Chemistry in 2016 by John Wiley & Sons, Ltd.DOI: 10.1002/9780470027318.a5110.pub3

INDUCTIVELY COUPLED PLASMA OPTICAL EMISSION SPECTROMETRY 21
is not measurable. Sometimes, higher RF applied poweror mathematical correction may be used to compensatefor EIE interference. Instrumental conditions such as slitwidth, viewing height, and viewing volume can be chosento minimize interference and to optimize emission signalcollection in either axial or radial configuration.(81)
The most common interference problem in ICP OESis spectral interference (also referred to as backgroundinterference). Ironically, this type of interference arisesbecause of the multielement nature of the plasma. Asthe ICP is capable of exciting almost any element that isintroduced into the plasma, spectra are likely to be rich,especially for highly complex and concentrated samples.The solution to the spectral interference problem,as discussed previously, is the use of high-resolutionspectrometers. However, some spectral overlap may stillexist even with the best commercial system. In thesecases, advanced background correction techniques areemployed or a different analytical wavelength for theelement(s) of interest is chosen. Spectral interferences canbe classified into four categories: simple background shift,sloping background shift, direct spectral overlap, andcomplex background shift. The simple background shift isdefined as a shift in background intensity that is essentiallyconstant over a given wavelength range on either side ofthe analytical line. The background may shift up or down.There are two approaches to deal with this backgroundproblem. The first is to select a different analytical lineat a wavelength with no background interference. Thesecond is to correct for the background by measuring itsomewhere near, but not falling on, the profile of theanalytical line of the analyte element. Two backgroundcorrection points, one on each side of the profile ofthe analytical line, are used to correct for the slopingbackground shift. This means that the average signalmeasured at the two points is subtracted from the totalsignal measured at the analytical line. In the worst case,direct spectral overlap occurs. This can be corrected if themagnitude of the interference is known as a function ofthe concentration of the interfering element. A correctionfactor can be calculated and used to correct the signalmeasured at the analyte wavelength. This can be bestachieved by making simultaneous measurements of boththe signal at the analyte wavelength and at a differentwavelength for the interfering element. This method isreferred to as the concentration ratio method or IECmethod. The basic requirement is that the concentrationof the interfering element can be accurately measured atanother wavelength. With advanced detector systems, allspectral lines are present, so IEC is possible. A complexbackground shift is a shift in a background intensity thatvaries significantly on both sides of the analytical line.This is usually caused by the occurrence of a number ofintense, closely spaced emission lines nearby, and perhaps
directly overlapping the analyte wavelength. In this case,a different analytical wavelength should be chosen ifpossible.(1)
ACKNOWLEDGMENTS
This work was funded in part by Teledyne Leeman Labs,Hudson, NH. Teledyne Leeman Labs also provided thephotograph in Figure 1, and the schematics in Figures 3and 9. The images in Figure 10 were acquired with aProdigy ICP OES system provided by Teledyne LeemanLabs as well. Figures 4 and 5 were kindly provided by AIPPublishers LLC and Agilent Technologies®, respectively.The authors would also like to thank the Sao PauloResearch Foundation (FAPESP) (grant 2013/26857-5).
ABBREVIATIONS AND ACRONYMS
AAS Atomic Absorption SpectrometryBEC Background Equivalent ConcentrationCCD Charge-coupled DeviceCID Charge Injection DeviceCIROS Circular Optical SystemCTD Charge Transfer DeviceDCP Direct Current PlasmaDLA Diagonalized Linear ArrayDRE Direct Reading EchelleDSI Direct Sample InsertionEC External CalibrationEIE Easily Ionized ElementETV Electrothermal VaporizationFAAS Flame Atomic Absorption SpectrometryGC Gas ChromatographyGFAAS Graphite Furnace Atomic Absorption
SpectrometryHG Hydride GenerationHGN Hildebrand Grid NebulizerHPLC High-performance Liquid
ChromatographyICP Inductively Coupled PlasmaICP-MS Inductively Coupled Plasma Mass
SpectrometryICP OES Inductively Coupled Plasma Optical
Emission SpectrometryIEC Interelement CorrectionIR Induction RegionIS Internal StandardISA Internal Standard AdditionsITV In-torch VaporizationLA Laser AblationLDR Linear Dynamic Range
Encyclopedia of Analytical Chemistry, Online © 2006–2016 John Wiley & Sons, Ltd.This article is © 2016 John Wiley & Sons, Ltd.This article was published in the Encyclopedia of Analytical Chemistry in 2016 by John Wiley & Sons, Ltd.DOI: 10.1002/9780470027318.a5110.pub3

22 ATOMIC SPECTROSCOPY
LIP Laser-induced PlasmaLOD Limit of DetectionLOQ Limit of QuantitationMCN Microconcentric NebulizerMIP Microwave-induced PlasmaMOS Metal Oxide SemiconductorOES Optical Emission SpectrometryORCA Optimized Rowland Circle AlignmentPN Pneumatic NebulizerPMT Photomultiplier TubeRF RadiofrequencyRSD Relative Standard DeviationSA Standard AdditionSBR Signal-to-background RatioSCD Segmented Array Charge-coupled Device
DetectorSDA Standard Dilution AnalysisTDS Total Dissolved SolidsUSN Ultrasonic NebulizerVUV Vacuum Ultraviolet
RELATED ARTICLES
Clinical ChemistryAtomic Spectrometry in Clinical Chemistry
CoatingsAtomic Spectroscopy in Coatings Analysis
Environment: Trace Gas MonitoringLaser-induced Breakdown Spectroscopy, ElementalAnalysis
Environment: Water and WasteEnvironmental Analysis of Water and Waste:Introduction • Atomic Fluorescence in Environ-mental Analysis • Capillary Electrophoresis Coupledto Inductively Coupled Plasma-Mass Spectrometry forElemental Speciation Analysis • Flame and GraphiteFurnace Atomic Absorption Spectrometry in Environ-mental Analysis • Gas Chromatography with AtomicEmission Detection in Environmental Analysis • HeavyMetals Analysis in Seawater and Brines • HydrideGeneration Sample Introduction for Spectroscopic Anal-ysis in Environmental Samples • Inductively CoupledPlasma Mass Spectrometry in Environmental Analysis •Laser Ablation Inductively Coupled Plasma Spectrom-etry in Environmental Analysis • Microwave-assistedTechniques for Sample Preparation in Organic Environ-mental Analysis • Optical Emission Inductively CoupledPlasma in Environmental Analysis • Sample Preparationfor Elemental Analysis of Biological Samples in theEnvironment • Sample Preparation for Environmental
Analysis in Solids (Soils, Sediments, and Sludges) •Sample Preparation Techniques for Elemental Analysisin Aqueous Matrices • Sampling Considerations forBiomonitoring
FoodAtomic Spectroscopy in Food Analysis
Forensic ScienceAtomic Spectroscopy for Forensic Applications
Industrial HygieneMetals in Blood and Urine: Biological Monitoring forWorker Exposure • Surface and Dermal Monitoring
Petroleum and Liquid Fossil Fuels AnalysisMetals, Nitrogen and Sulfur in Petroleum Residue,Analysis of
Steel and Related MaterialsAtomic Absorption and Emission Spectrometry,Solution-based in Iron and Steel Analysis • MetalAnalysis, Sampling and Sample Preparation in
Atomic SpectroscopyAtomic Spectroscopy: Introduction
REFERENCES
1. C.B. Boss, K.J. Fredeen, Concept, Instrumentation andTechniques in Inductively Coupled Plasma Optical Emis-sion Spectrometry, 2nd edition, Perkin-Elmer, Norwalk,1997.
2. J.M. Carey, J.A. Caruso, ‘Electrothermal Vaporization forSample Introduction in Plasma Source Spectrometry’, Crit.Rev. Anal. Chem., 23(5), 397–439 (1992).
3. Teledyne Leeman Labs, Inc., Application andTechnical Notes for ICP OES Teledyne LeemanLabs, Inc., Hudson, NH, 2016, available athttp://www.teledyneleemanlabs.com/appnotes
4. M.D.A. Korn, D.S.S. dos Santos, B. Welz, M.G.R.Vale, A.P. Teixeira, D.D. Lima, S.L.C. Ferreira, ‘AtomicSpectrometric Methods for the Determination of Metalsand Metalloids in Automotive Fuels—A Review’, Talanta,73(1), 1–11 (2007).
5. A.C. Davis, P. Wu, X.F. Zhang, X.D. Hou, B.T. Jones,‘Determination of Cadmium in Biological Samples’, Appl.Spectrosc. Rev., 41(1), 35–75 (2006).
6. K.L. Linge, ‘Recent Developments in Trace ElementAnalysis by ICP-AES and ICP-MS with ParticularReference to Geological and Environmental Sample’,Geostandards Geoanal. Res., 29(1), 7–22 (2005).
7. J. Meija, S. Mounicou, J.A. Caruso, ‘Plasma Spectrometryfor Elemental Speciation and Characterization in Bever-ages’, J. Assoc. Off. Anal. Chem. Int., 87(1), 205–224(2004).
Encyclopedia of Analytical Chemistry, Online © 2006–2016 John Wiley & Sons, Ltd.This article is © 2016 John Wiley & Sons, Ltd.This article was published in the Encyclopedia of Analytical Chemistry in 2016 by John Wiley & Sons, Ltd.DOI: 10.1002/9780470027318.a5110.pub3

INDUCTIVELY COUPLED PLASMA OPTICAL EMISSION SPECTROMETRY 23
8. M. Aceto, O. Abollino, M.C. Bruzzoniti, E. Mentasti, C.Sarzanin, M. Malandrino, ‘Determination of Metals inWine with Atomic Spectroscopy (Flame-AAS, GF-AASand ICP-AES); A Review’, Food Addit. Contam., 19(2),126–133 (2002).
9. R.H. Wendt, V.A. Fassel, ‘Induction-coupled PlasmaSpectrometric Excitation Source’, Anal. Chem., 37(7),920–922 (1965).
10. S. Greenfield, I.L. Jones, C.T. Berry, ‘High-pressurePlasma as Spectroscopic Emission Sources’, Analyst,89(11), 713–720 (1964).
11. V.A. Fassel, ‘Analytical Inductively Coupled PlasmaSpectroscopies—Past, Present, and Future’, Fresenius Z.Anal. Chem., 324(6), 511–518 (1986).
12. K. Mitko, M. Bebek, ‘Determination of Major Elements inSaline Water Samples Using a Dual-View ICP OES’, At.Spectrosc., 21(3), 77–85 (2000).
13. Which Spectrometer Optical Technology Offers SuperiorPerformance? Echelle vs. ORCA, SPECTRO AnalyticalInstruments GmbH, Kleve, 2015, available at http://icp-oes.spectro.com/echelle-vs-orca.
14. A. Leclercq, A. Nonell, J.L.T. Torro, C. Bresson,L. Vioa, T. Vercoutera, F. Chartier, ‘Introduction ofOrganic/hydro-organic Matrices in Inductively CoupledPlasma Optical Emission Spectrometry and Mass Spec-trometry: A Tutorial Review. Part II. Practical Considera-tions’, Anal. Chim. Acta, 885, 57–91 (2015).
15. S.R. Koirtyohann, J.S. Jones, C.P. Jester, D.A. Yates, ‘Useof Spatial Emission Profiles and a Nomenclature Systemas Acids in Interpreting Matrix Effects in the Low-powerArgon Inductively Coupled Plasma’, Spectrochim. Acta,36B(1), 49–59 (1981).
16. M. Thompson, R.M. Barnes, ‘Analytical Performance ofInductively Coupled Plasma—Atomic Emission Spec-trometry’, in Inductively Coupled Plasma in AnalyticalAtomic Spectrometry, 2nd edition, eds A. Montaser, D.W.Golightly, Wiley-VHC, New York, 249–297, 1992.
17. J.R. Chirinos, K. Kahen, S.E. O’Brien, A. Montaser,‘Mixed-gas Inductively Coupled Plasma Atomic EmissionSpectrometry Using a Direct Injection High EfficiencyNebulizer’, Anal. Bioanal. Chem., 372(1), 128–135 (2002).
18. A. Fisher, S.J. Hill, Alternative and Mixed Gas Plasmas,in Inductively Coupled Plasma Spectrometry and itsApplications, eds. S.J. Hill, Blackwell Publishing Ltd,Oxford, 226–250, 2007.
19. T. Nakahara, ‘Hydride Generation Techniques and theirApplications in Inductively Coupled Plasma–AtomicEmission Spectrometry’, Spectrochim. Acta Rev., 14(1/2),95–109 (1991).
20. H. Bin, S. Li, G.Q. Xiang, M. He, Z.C. Jiang, ‘RecentProgress in Electrothermal Vaporization—InductivelyCoupled Plasma Atomic Emission Spectrometry and
Inductively Coupled Plasma Mass Spectrometry’, Appl.Spectrosc. Rev., 42(2), 203–234 (2007).
21. T. Kantor, ‘Electrothermal Vaporization and LaserAblation Sample Introduction for Flame and PlasmaSpectrometric Analysis of Solid and Solution Samples’,Spectrochim. Acta, 56B(9), 1523–1563 (2001).
22. R.E. Russo, ‘Laser Ablation’, Appl. Spectrosc., 49(9),14A–28A (1995).
23. R. Sing, ‘Direct Sample Insertion for Inductively CoupledPlasma Spectrometry’, Spectrochim. Acta, 54B(3–4),411–441 (1999).
24. J.L. Todoli, J.M. Mermet, Liquid Sample Introduction inICP Spectrometry: A Practical Guide, 1st edition, ElsevierScience, Amsterdam, 2008.
25. N.H. Bings, J.O. Orlandini von Niessen, J.N.Schaper, ‘Liquid Sample Introduction in Induc-tively Coupled Plasma Atomic Emission and MassSpectrometry—Critical Review’, Spectrochim. Acta,100B, 14–37 (2014).
26. J.L. Todoli, J.M. Mermet, ‘Sample Introduction Systemsfor the Analysis of Liquid Microsamples by ICP-AES andICP-MS’, Spectrochim. Acta, 61B(3), 239–283 (2006).
27. J.L. Todoli, J.M. Mermet, ‘Elemental Analysis of LiquidMicrosamples Through Inductively Coupled PlasmaSpectyrochemistry’, TRAC—Trends Anal. Chem., 24(2),107–116 (2005).
28. R.S. Babington, ‘It’s Superspray’, Pop. Sci., 202, 102–104(1973).
29. M.C. Santos, J.A. Nobrega, ‘Slurry Nebulization in Plasmasfor Analysis of Inorganic Materials’, Appl. Spectrosc. Rev.,41(4), 427–448 (2006).
30. A.M. Ganan-Calvo, ‘Enhanced Liquid Atomization: FromFlow-Focusing to Flow-Blurring’, Appl. Phys. Lett., 86,214101 (2005).
31. F.D.A. Orozco, N. Kovachev, M.A.A. Pastor, C.E.Domini, B.S.F. Band, A.C. Hernandez, ‘Analysis of Metalsand Phosphorus in Biodiesel B100 from Different Feed-stock Using a Flow Blurring Multinebulizer in InductivelyCoupled Plasma-optical Emission Spectrometry’, Anal.Chim. Acta, 827(27), 15–21 (2014).
32. J.G. Williams, ‘Instrument Options’, in InductivelyCoupled Plasma Mass Spectrometry, eds K.E. Jarvis, A.L.Gray, R.S. Houk, Blackie, New York, 58–80, 1992.
33. S. Greenfield, A. Montaser, Common RF Generator,Torches, and Sample Introduction Systems, in InductivelyCoupled Plasma in Analytical Atomic Spectrometry, eds.A. Montaser, D. W. Golightly, 2nd edition, Wiley-VHC:New York, 187–247.
34. J. Borkowska-Burnecka, A. Lesniewicz, W. Zymicki,‘Comparison of Pneumatic and Ultrasonic Nebuliza-tions in Inductively Coupled Plasma Atomic EmissionSpectrometry—Matrix Effects and Plasma Parameters’,Spectrochim. Acta, 61B, 579–587 (2006).
Encyclopedia of Analytical Chemistry, Online © 2006–2016 John Wiley & Sons, Ltd.This article is © 2016 John Wiley & Sons, Ltd.This article was published in the Encyclopedia of Analytical Chemistry in 2016 by John Wiley & Sons, Ltd.DOI: 10.1002/9780470027318.a5110.pub3

24 ATOMIC SPECTROSCOPY
35. K. Levine, K.A. Wagner, B.T. Jones, ‘Low-cost, ModularElectrothermal Vaporization System for InductivelyCoupled Plasma Atomic Emission Spectrometry’, Appl.Spectrosc., 52(9), 1165–1171 (1998).
36. F. Borno, S. Richter, D. Deiting, N. Jakubowski, U. Panne,‘Direct Multi-element Analysis of Plastic Materials viaSolid Sampling Electrothermal Vaporization InductivelyCoupled Plasma Optical Emission Spectroscopy’, J. Anal.At. Spectrom., 30(5), 1064–1071 (2015).
37. D. Bauer, T. Vogt, M. Klinger, P.J. Masset, M. Otto,‘Direct Determination of Sulfur Species in Coals from theArgonne Premium Sample Program by Solid SamplingElectrothermal Vaporization Inductively Coupled PlasmaOptical Emission Spectrometry’, Anal. Chem., 86(20),10380–10388 (2014).
38. G.M. Allen, D.M. Coleman, ‘Segregated Sampling andExcitation with a Dual Inductively Coupled Plasma’, Anal.Chem., 56(14), 2981–2983 (1984).
39. S.N. Hanna, C.P. Calloway Jr, J.D. Sanders, R.A.Nelson, J. Cox, B.T. Jones, ‘Design of a Compact,Aluminum, Tungsten-coil Electrothermal VaporizationDevice for Inductively Coupled Plasma-optical EmissionSpectrometry’, Microchem. J., 99(2), 165–169 (2011).
40. R. Lobinski, F.C. Adams, ‘Speciation Analysis byGas Chromatography with Plasma Source SpectrometricDetection’, Spectrochim. Acta, 52B(13), 1865–1903 (1997).
41. D.J. Butcher, ‘Environmental Applications of ArsenicSpeciation Using Atomic Spectrometry Detection’, Appl.Spectrosc. Rev., 42(1), 1–22 (2007).
42. S.J. Hill, M.J. Bloxham, P.J. Worsfold, ‘ChromatographyCoupled with Inductively Coupled Plasma Atomic Emis-sion Spectrometry and Inductively Coupled Plasma MassSpectrometry’, J. Anal. At. Spectrom., 8(6), 499–515(1993).
43. J.C.A. Wuilloud, R.G. Wuilloud, A.P. Vonder-heide, J.A. Caruso, ‘Gas Chromatography/PlasmaSpectrometry—An Important Analytical Tool forElemental Speciation Studies’, Spectrochim. Acta, 59B(6),755–792 (2004).
44. H.L. Peters, B.T. Jones, ‘Determination of Non-metalsby High Performance Liquid Chromatography withInductively Coupled Plasma Detection’, Appl. Spectrosc.Rev., 38(1), 71–99 (2003).
45. C.L. Kahakachchi, D.A. Moore, ‘Speciation of Gadoliniumin Gadolinium-based Magnetic Resonance ImagingAgents by High Performance Liquid ChromatographyInductively Coupled Plasma Optical Emission Spectrom-etry’, J. Anal. At. Spectrom., 24(10), 1389–1396 (2009).
46. T. Narukawa, E. Matsumoto, T. Nishimura, A. Hioki,‘Determination of Sixteen Elements and Arsenic Speciesin Brown, Polished and Milled Rice’, Anal. Sci., 30(2),245–250 (2014).
47. T. Kato, T. Uehiro, A. Yasuhara, M. Morita, ‘Determi-nation of Methylmercury Species by Capillary ColumnGas Chromatography with Axially Viewed InductivelyCoupled Plasma Atomic Emission Spectrometric Detec-tion’, J. Anal. At. Spectrom., 7(2), 15–18 (1992).
48. T.S. Conver, J. Yang, J.A. Koropchak, ‘New Developmentsin Thermospray Sample Introduction for Atomic Spec-trometry’, Spectrochim. Acta, 52B(8), 1087–1104 (1997).
49. V. Karanassios, G. Holick, ‘Direct Sample InsertionDevices for Inductively Coupled Plasma Spectrometry’,Spectrochim. Acta Rev., 13(2), 89–166 (1990).
50. C.D. Skinner, M. Cazagou, J. Blaise, E.D. Salin, ‘DirectInsertion of Trace Metals Preconcentrated on ActivatedCharcoal into an Inductively Coupled Plasma’, Appl.Spectrosc., 53(2), 191–196 (1999).
51. C.D. Skinner, E.D. Salin, ‘Preconcentration and Adsorp-tion of Metal Chelates with Analysis by Direct SampleInsertion Inductively Coupled Plasma Atomic EmissionSpectrometry’, J. Anal. At. Spectrom., 18(5), 495–500(2003).
52. L. Moenke-Blankenburg, ‘Laser-ICP-spectrometry’, Spec-trochim. Acta Rev., 15(1), 1–38 (1993).
53. M.S. Gomes, E.R. Schenk, D. Santos Jr, F.J. Krug, J.R.Almirall, ‘Laser Ablation Inductively Coupled PlasmaOptical Emission Spectrometry for Analysis of Pelletsof Plant Materials’, Spectrochim. Acta, 94–95B, 27–33(2014).
54. K. Stepankova, K. Novotny, M.V. Galiova, V. Kanicky,J. Kaiser, D.W. Hahn, ‘Laser Ablation Methods forAnalysis of Urinary Calculi: Comparison Study Based onCalibration Pellets’, Spectrochim. Acta, 81B, 43–49 (2013).
55. F.E. Lichte, S.R. Koirtyohann, Induction Coupled PlasmaEmission from a Different Angle, Paper 26, Federation ofAnalytical Chemistry and Spectroscopy Society, Philadel-phia, 1976.
56. D.R. Demers, ‘Evaluation of the Axially Viewed (End-on) Inductively Coupled Argon Plasma Source for AtomicEmission Spectrometry’, Appl. Spectrosc., 33(6), 584–591(1979).
57. Synchronous Vertical Dual View (SVDV) for SuperiorSpeed and Performance, Agilent Technologies® Inc., 2014,Publication number: 5991-4853EN, available at. https://www.agilent.com/cs/library/technicaloverviews/public/5991-4853EN%20_TechOview_5100_SVDV.pdf
58. E.C.C. Bailey, Spectroscopy, Longman Green, Chapter 1,London, 1905.
59. J.W. Olesik, ‘Echelle Grating Spectrometers forInductively Coupled Plasma—Optical EmissionSpectrometry—A Review of Basic Equations andOperating Principles’, Spectroscopy, 14(10), 36–41 (1999).
60. J. Nolte, ICP Emission Spectrometry—A Practical Guide,Wiley-VCH, Weinheim, 2003.
Encyclopedia of Analytical Chemistry, Online © 2006–2016 John Wiley & Sons, Ltd.This article is © 2016 John Wiley & Sons, Ltd.This article was published in the Encyclopedia of Analytical Chemistry in 2016 by John Wiley & Sons, Ltd.DOI: 10.1002/9780470027318.a5110.pub3

INDUCTIVELY COUPLED PLASMA OPTICAL EMISSION SPECTROMETRY 25
61. C.W. Earle, M.E. Baker, M. Bonner Denton, R.S.Pomeroy, ‘Imaging Applications for Chemical AnalysisUtilizing Charge Coupled Device Array Detectors’, TrendsAnal. Chem., 12(10), 395–403 (1993).
62. A.T. Zander, R.L. Chien, C.B. Cooper, P.V. Wilson,‘An Image Mapped Detector for Simultaneous ICP-AES’,Anal. Chem., 71(16), 3332–3340 (1999).
63. B.W. Smith, M.L. Parsons, ‘Preparation of StandardSolutions: Critically Selected Compounds’, J. Chem. Educ.,50(10), 679–681 (1973).
64. W.B. Barnett, V.A. Fassel, R.N. Kniseley, ‘TheoreticalPrinciples of Internal Standardization in AnalyticalEmission Spectroscopy’, Spectrochim. Acta, 23B(10),643–664 (1968).
65. G.A. Zachariadis, C. Vogiatzis, ‘An Overview of the Useof Yttrium for Internal Standardization in InductivelyCoupled Plasma-Atomic Emission Spectrometry’, Appl.Spectrosc. Rev., 45(3), 220–239 (2010).
66. G.J. Schmidt, W. Slavin, ‘Inductively Coupled PlasmaEmission Spectrometry with Internal Standardization andSubtraction of Plasma Background Fluctuations’, Anal.Chem., 54, 2491–2495 (1982).
67. W.R. Kelly, K.W. Pratt, W.F. Guthrie, K.R. Martin, ‘Originand Early History of Die Methode des Eichzusatzes or theMethod of Standard Addition with Primary Emphasis onits Origin, Early Design, Dissemination, and Usage ofTerms’, Anal. Bioanal. Chem., 400(6), 1805–1812 (2011).
68. D.T. Harvey, ‘External Standards or Standard Addition?Selecting and Validating a Method of Standardization’, J.Chem. Educ., 79(5), 613–615 (2002).
69. D.A. Goncalves, B.T. Jones, G.L. Donati, ‘The Reversed-axis Method to Estimate Precision in Standard AdditionsAnalysis’, Microchem. J., 124, 155–158 (2016).
70. A.C. Davis, B.W. Alligood, C.P. Calloway, B.T. Jones Jr,‘Direct Determination of Cadmium in Urine by ETV-ICP Analysis Using a Tungsten Coil Atomizer’, Appl.Spectrosc., 59(10), 1300–1303 (2005).
71. W.B. Jones, G.L. Donati, C.P. Calloway Jr, B.T.Jones, ‘Standard Dilution Analysis’, Anal. Chem., 87(4),2321–2327 (2015).
72. F.M. Fortunato, M.A. Bechlin, J.A. Gomes Neto,G.L. Donati, B.T. Jones, ‘Internal Standard AdditionCalibration: Determination of Calcium and Magnesium
by Atomic Absorption Spectrometry’, Microchem. J., 122,63–69 (2015).
73. J.M. Mermet, E. Poussel, ‘ICP Emission Spectrometers:1995 Analytical Figures of Merit’, Appl. Spectrosc., 49(10),12A–18A (1995).
74. G.L. Long, J.D. Winefordner, ‘Limit of Detection: ACloser Look at the IUPAC Definition’, Anal. Chem., 55(7),712A–724A (1983).
75. P.W.J.M. Boumans, ‘LODs and Spectral Interferencesin Atomic Emission Spectrometry’, Anal. Chem., 66(8),459A–467A (1994).
76. T.C. Johnson, R.S. Perry, L.J. Fick, H.B. Fannin, ‘AnExamination of Relative Trends of Atomic LODs in theInductively Coupled Plasma’, Spectrochim. Acta, 52B(1),125–129 (1997).
77. Guide to Atomic Spectroscopy Techniques andApplications: AA, GFAA, ICP, ICP-MS, Perkin-Elmer Instruments, Norwalk, 2000, available athttp://library.certh.gr/libfiles/pdf/gen-papyr-788-the-guide-by-pe-in-manuals-pp-40-y-2000.pdf
78. W. Slavin (ed.), Graphite Furnace AAS: A Source Book,Perkin-Elmer, Ridgefield, 1984.
79. M. Carre, S. Excoffier, J.M. Mermet, ‘A Study ofthe Relation between the Limit of Detection and theLimit of Quantitation in Inductively Coupled PlasmaSpectrochemistry’, Spectrochim. Acta, 52B(14), 2043–2049(1997).
80. A.W. Boorn, R.F. Browner, ‘Effects of Organic Solvents inInductively Coupled Plasma Atomic Emission Spectrom-etry’, Anal. Chem., 54(8), 1402–1410 (1982).
81. P.J. Galley, G.M. Hieftje, ‘Easily Ionizable Element(EIE) Interference in Inductively Coupled Plasma AtomicEmission Spectrometry-II. Minimization of EIE Effectsby Choice of Observation Volume’, Spectrochim. Acta,49B(7), 703–724 (1994).
FURTHER READING
V. Karanassios, K.P. Bateman, ‘Electrically Heated Wire-loop, In-torch Vaporization Sample Introduction System forInductively Coupled Plasma Atomic Emission Spectrometrywith Photodiode Array Detection’, Spectrochim. Acta,49B(9), 847–865 (1994).
Encyclopedia of Analytical Chemistry, Online © 2006–2016 John Wiley & Sons, Ltd.This article is © 2016 John Wiley & Sons, Ltd.This article was published in the Encyclopedia of Analytical Chemistry in 2016 by John Wiley & Sons, Ltd.DOI: 10.1002/9780470027318.a5110.pub3