industrial and commercial bank of china (malaysia)...
TRANSCRIPT

(Company No. 839839 M)(Incorporated in Malaysia)
OFFICER-IN-CHARGE’S ATTESTATION
YUAN BIN
Chief Executive Officer
Date: 31 July 2014
I, Yuan Bin, being the Chief Executive Officer of Industrialand Commercial Bank of China (Malaysia)Berhad, do hereby state that, in my opinion, the Pillar 3 Disclosures set out on pages 1 to 21 have beenprepared in accordance with the Bank Negara Malaysia’s Risk-Weighted Capital Adequacy Framework(Basel II) - Disclosure Requirements (Pillar 3), and are accurate and complete.
Industrial and Commercial Bank of China (Malaysia) Berhad
Risk-Weighted Capital Adequacy Framework (Basel II) Pillar 3 Disclosuresas at 30 June 2014

1Industrial and Commercial Bank of China (Malaysia) Berhad(Company No. 839839 M)(Incorporated in Malaysia)
Risk-Weighted Capital Adequacy Framework (Basel II)Pillar 3 Disclosure
1.0 Overview
(i) Pillar 1
(ii) Pillar 2
(iii) Pillar 3
Risk Type1 Credit2 Market3 Operational
2.0
The Bank seeks to diversify its capital base in a range of different forms from various sources. On top of the minimum regulatorycapital requirements, a buffer is added on to arrive at the Bank’s internal capital target to ensure adequacy of capital to support thecurrent and anticipated business growth. Internal CapitalAdequacy Assessment Process (“ICAAP”) is formulated to identify thematerial risks in the business. The material risk areas thatare taken into consideration are credit risk, market risk, liquidity risk,operational risk, compliance risk as well as business risk.
The approaches adopted by Industrial and Commercial Bank of China (Malaysia) Berhad (“the Bank”), are shown in table below:
Capital Requirement Assessment Standard risk-weights
Approach Adopted
The Pillar 3 Disclosure for financial reporting beginning 1January 2011 is required under the Bank Negara Malaysia (“BNM”)’s Risk-Weighted Capital Adequacy Framework (“RWCAF”). This is equivalent to Basel II issued by the Basel Committee on BankingSupervision. Basel II consists of the following Pillars:
Outlines the minimum regulatory capital that banking institutions must hold against the credit, market and operational risks assumed.
Outlines the minimum disclosure requirements of information on the risk management practices and capital adequacy of bankinginstitutions. The Pillar’s aim is to enhance transparency and market discipline in regulating the risk-taking behaviours of bankinginstitutions. In turn, this will contribute to BNM’s supervisory monitoring efforts and strengthen incentives for thebanking institutionsto implement robust risk management systems.
Focuses on strengthening the supervisory review process indeveloping more rigorous risk management framework and techniques.The purpose of this Pillar is for banking institutions to implement an effective and rigorous internal capital adequacyassessmentprocess that commensurates with the scale, nature and complexity of its operations. It sets out the requirements to assess risks in aholistic manner and beyond the capital requirements for Pillar 1 risks.
Basic Indicator Approach (BIA)Standardised ApproachStandardised Approach
Standard risk-weights
The Bank is principally engaged in the provision of conventional banking and other related financial services. The Bank’s Pillar 3Disclosure is in compliance with the BNM’s Risk-Weighted Capital Adequacy Framework (Basel II) - Disclosure Requirements (Pillar 3). The information provided herein has been reviewed and certified by the Bank's Chief Executive Officer.
Fixed percentage over average gross income for a fixed number of years
Capital Management and Capital Adequacy
The Bank’s lead regulator, BNM, sets and monitors capital requirement for the Bank. The Bank is required to comply with theprovisions of the Basel II framework in respect of regulatory capital adequacy.

2(Company No. 839839 M)
2.0
(i)
(ii)
(a) Capital Adequacy Ratio 30 Jun 2014 31 Dec 2013
CET1 capital ratio 20.474% 17.094%Tier 1 capital ratio 20.474% 17.094%Total capital ratio 21.462% 17.793%
Capital adequacy ratios of the Bank are computed in accordance with BNM’s Capital Adequacy Framework. The minimum regulatorycapital adequacy requirement is 8% on the risk-weighted assets (“RWA”) for total capital at all times. During the 2-yeartransitionalperiod, the minimum CET1 Capital ratio is set at 3.5% and 4.0%respectively for year 2013 and 2014, whereas the minimum Tier 1Capital ratio it is set at 4.5% and 5.5% over the said respective periods. Commencing 1 January 2015, the minimum CET1 Capital andTier 1 Capital ratio will be set at 4.5% and 6.0% respectively(excluding conservation buffer). The following information presents thecapital adequacy ratios of the Bank and the breakdown of RWA:
The Bank’s regulatory capital are analysed as follows:
Tier 2 Capital includes collective impairment allowances (excluding collective impairment allowances attributableto financingclassified as impaired) and regulatory reserve.
• Common Equity Tier 1 (“CET1”) Capital, which includes ordinary share capital, share premium, retained earnings (net ofdividends declared), statutory reserve and other regulatory adjustments relating to items that are included in equitybut are treateddifferently for capital adequacy purpose.
• Additional Tier 1 Capital, which consists of instruments that are issued and paid-up, subordinated to depositors and perpetual innature (amongst all other criteria) which are not included in CET1 Capital, the share premium arising from issuance of suchinstruments as well as the regulatory adjustments in relation to the calculation of Additional Tier 1 Capital.
Capital Management and Capital Adequacy (continued)
The Bank undertakes stress test exercise on half yearly basis to assess the Bank’s capability to withstand the adverse environment. Thestress test will at least cover the exceptional but plausible event and the worst case scenario. The possible impact to the Bank due tooccurrence of adverse events, i.e. significant deterioration in borrowers’ credit profile, decline in collateral value, erosion in the Bank’snet interest margin and sizeable foreign exchange loss willbe examined. The results of the stress test together with theproposedmitigating actions shall be tabled to the Senior Management and the Board of Directors for deliberations.
Tier 1 Capital, which comprises the followings:
Internal capital assessment is carried out to determine thelevel of internal capital required by the Bank based on the Pillar 1 and 2requirements as well as actual results of the preceding financial year (as the base case). Capital plan, business plan and 3-year budgetare approved by the Board of Director on annual basis. The business plan in particular would set out the Bank’s risk appetite to be inline with the lending direction and business strategies forthe coming year. Senior Management is responsible in ensuring a smoothdevelopment and implementation of the ICAAP framework as well as effective systems and processes are in place. The Bank’sperformance against the internal capital levels is reviewed on a regular basis by the Senior Management. Should there bea need forcapital raising exercise, it will be presented to the Board of Directors for approval.

3(Company No. 839839 M)
2.0
(b)
Risk type Risk-Gross Net Weighted Capital
Exposures Exposures Assets RequirementRM’000 RM’000 RM’000 RM’000
Credit RiskOn-Balance Sheet ExposuresSovereigns/Central Banks 1,246,625 1,246,625 - - Banks, Development Financial Institutions and MDBs 933,933 933,933 206,053 16,484 Corporates 1,749,535 1,749,535 1,012,164 80,973 Regulatory Retail 10,951 10,951 10,632 851 Residential Mortgages 29,172 29,172 10,936 875 Other Assets 19,726 19,726 13,146 1,052
Total On-Balance Sheet Exposures 3,989,942 3,989,942 1,252,931 100,235
Off-Balance Sheet ExposuresCredit-related off-balance sheet exposures 513,507 513,507 375,071 30,006 OTC derivatives 9,077 9,077 3,469 278
Total Off-Balance Sheet Exposures 522,584 522,584 378,540 30,284 Total On and Off-Balance Sheet Exposures 4,512,526 4,512,526 1,631,471 130,519
Large exposure risk requirement* - - - -
Market Risk Long Short Position Position
Foreign currency risk 3,267 3,110 3,267 3,267 261
Operational Risk - - - 116,048 9,284
Total RWA and Capital Requirements 1,750,786 140,064
Note:
MDBs - Multilateral Development Banks
OTC - Over the counter
The breakdown of RWA by exposures in each major risk category under standardised approach are as follows:
30 Jun 2014
Capital Management and Capital Adequacy (continued)
*The Bank does not need to fulfill the capital requirement for Large Exposure Risk as there is no amount in excess of the lowestthreshold arising from equity holdings as specified in the BNM’s RWCAF.

4(Company No. 839839 M)
2.0
Risk type Risk-Gross Net Weighted Capital
Exposures Exposures Assets RequirementRM’000 RM’000 RM’000 RM’000
Credit RiskOn-Balance Sheet ExposuresSovereigns/Central Banks 874,270 874,270 - - Banks, Development Financial Institutions and MDBs 2,270,291 2,270,291 576,925 46,154 Corporates 1,799,752 1,799,752 996,549 79,724 Regulatory Retail 10,026 10,026 9,897 792 Residential Mortgages 9,231 9,231 4,015 321 Other Assets 31,759 31,759 27,394 2,192
Total On-Balance Sheet Exposures 4,995,329 4,995,329 1,614,780 129,183
Off-Balance Sheet ExposuresCredit-related off-balance sheet exposures 524,882 524,882 373,042 29,843 OTC derivatives 27,218 27,218 9,857 789
Total Off-Balance Sheet Exposures 552,100 552,100 382,899 30,632 Total On and Off-Balance Sheet Exposures 5,547,429 5,547,429 1,997,679 159,815
Large exposure risk requirement* - - - -
Market Risk Long Short Position Position
Foreign currency risk 383 2,260 2,260 2,260 181
Operational Risk - - - 95,324 7,626
Total RWA and Capital Requirements 2,095,263 167,622
Note:
MDBs - Multilateral Development Banks
OTC - Over the counter
Capital Management and Capital Adequacy (continued)
31 Dec 2013
*The Bank does not need to fulfill the capital requirement for Large Exposure Risk as there is no amount in excess of the lowestthreshold arising from equity holdings as specified in the BNM’s RWCAF.

5(Company No. 839839 M)
3.0 Capital Structure
30 Jun 2014 31 Dec 2013Common Equity Tier 1 (“CET1”) Capital RM’000 RM’000
Paid-up share capital 331,000 331,000 Retained earnings 13,602 13,602 Statutory reserve 16,607 16,607 Regulatory reserve 6,175 6,175 Unrealised (losses)/gains on financial investments available-for-sale (220) (251)
367,164 367,133 Less: Regulatory adjustments applied in calculation of CET1 Capital - Intangible asset (1,604) (1,864) - Deferred tax assets (927) (927) - Regulatory reserve attributable to loans, advances and financing (6,175) (6,175)
(8,706) (8,966)
Total CET1 Capital 358,458 358,167
Tier 2 Capital
Collective impairment allowance 11,115 8,466 Regulatory reserve 6,175 6,175
Total Tier 2 Capital 17,290 14,641
Total Capital 375,748 372,808
4.0 Risk Management Framework
The Board Audit Committee, supported by Internal Audit Department, provides an independent assessment of the adequacyandreliability of the risk management processes and system of internal controls, and compliance with risk policies and regulatoryrequirements.
• Liquidity risk.
The bank’s total capital according to Bank Negara Malaysia’s Capital Adequacy Framework (Capital Components) are as follows:
RMC has been established for active Senior Management oversight, understanding, and dialogue on policies, profiles, and activitiespertaining to the relevant risk types. All major risk policies have to be deliberated at RMC level prior to escalation to BRMC andBoard of Directors for approval.
The Board of Directors establishes the Bank’s risk appetiteand risk principles. The Board Risk Management Committee (“BRMC”) isthe principal board committee that oversees the Bank’s riskmanagement. It reviews the Bank’s overall risk management frameworksand major risk policies. The BRMC is supported by both Risk Management Committee (“RMC”) at management level and RiskManagement Department.
The Bank’s risk management policies are established to identify the risks faced by the Bank, to set appropriate risk limits and controls,and to monitor risks and adherence to limits. Unsecured exposures are managed in a prudent manner and collaterals are takenwhenever required as risk mitigation measures. The Bank’s unsecured exposures are diversified to a larger pool of clients to promote amore effective use of capital. Risk management policies andsystems are reviewed regularly to reflect changes in the market condition,products and services offered. Periodic credit review is performed on the Bank’s loan portfolio to assess the impact of changes ineconomic environment to the Bank’s exposures and the collaterals taken. The Bank, through its training and management standardsand procedures, aims to develope a disciplined and constructive control environment, in which all employees understand their rolesand obligations.
The Bank has exposure to the following risks from financial instruments:
• Credit risk• Market risk• Operational risk
6(Company No. 839839 M)
5.0 Credit Risk
• Formulating and reviewing credit policies• Setting underwriting standards/lending direction• Recommending approval on credit requests• Monitoring and controlling exposures.
The Board of Directors has delegated responsibility for theoversight of credit risk to the Credit Committee. The CreditCommittee issupervised by the Senior Management. The functions of the Credit Committee are as follows:
The Bank employs a 14-grade credit risk grading system as a tool for determining the credit risk profile of borrowers using appropriateform of scorecards. The credit grades are used as a basis to support the underwriting of credit and are mapped accordinglyto the creditrating scales of major international credit rating agencies.
The methodology adopted for collective impairment assessment and the list of trigger events for individual impairmentassessment willbe reviewed on a regular basis to suit with the Bank’s policy and the traits of its loan portfolio.
Credit risk is the risk of financial loss to the Bank due to failure of the Bank’s customers or counterparties in meeting their contractualfinancial obligation. The credit risk comes primarily fromthe Bank’s cash and deposits/placements, direct lending, trade finance andfunding activities.
A collective impairment allowance is performed on “collective basis” on the Bank’s loan portfolio using statistical techniques with thenecessary adjustments to the credit grades and probabilityof defaults of the respective credit grade band of the loans in order to guardagainst the risk of judgement error in the credit grading process. Although the credit grading process would involve qualitativeassessment which is subject to judgement error, the loans within the same credit grade band generally share the similar credit riskcharacteristics for collective assessment. Given the lackof historical loss experience, the relevant market data will be taken forconsideration to derive the model risk adjustment.
In the case of individual assessment, a loan is deemed as impaired if there is objective evidence of impairment which is triggered bycertain events. In general, loans that are not repaid on timeas they come due, be it the principal or interest, will be monitored closely asthe likelihood of impairment from these past due loans is expected to be higher. Individual impairment allowances are made for loans,advances and financing which have been individually reviewed and specifically identified as impaired. Individual impairmentallowances are provided if the recoverable amount (presentvalue of estimated future cash flows discounted at originaleffective interestrate) is lower than the carrying value of the loans, advancesand financing (outstanding amount of loans, advances and financing, netof individual impairment allowance). The expected cash flows are based on projections of liquidation proceeds, realisation of assets orestimates of future operating cash flows.
(Company No. 839839 M) 7
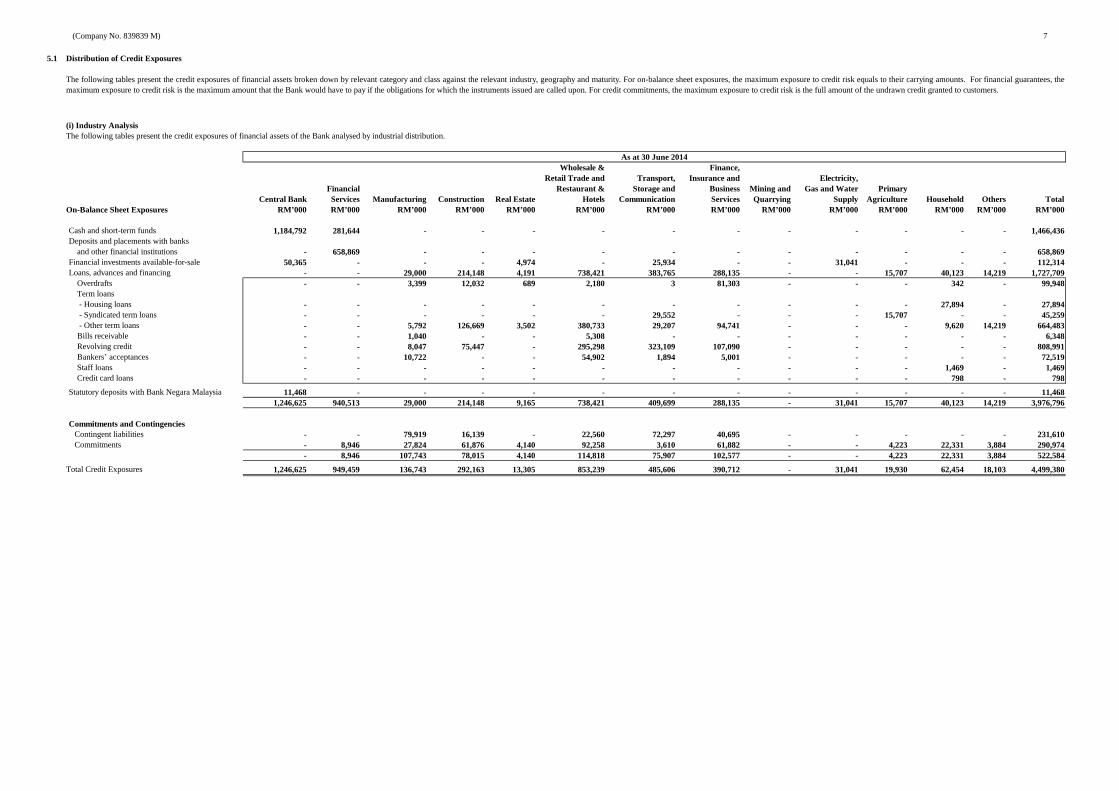
5.1 Distribution of Credit Exposures
Wholesale & Finance,Retail Trade and Transport, Insurance and Electricity,
Financial Restaurant & Storage and Business Mining and Gas and Water PrimaryCentral Bank Services Manufacturing Construction Real Estate Hotels Communication Services Quarrying Supply Agriculture Household Others Total
On-Balance Sheet Exposures RM’000 RM’000 RM’000 RM’000 RM’000 RM’000 RM’000 RM’000 RM’000 RM’000 RM’000 RM’000 RM’0 00 RM’000
Cash and short-term funds 1,184,792 281,644 - - - - - - - - - - - 1,466,436 Deposits and placements with banks and other financial institutions - 658,869 - - - - - - - - - - - 658,869 Financial investments available-for-sale 50,365 - - - 4,974 - 25,934 - - 31,041 - - - 112,314 Loans, advances and financing - - 29,000 214,148 4,191 738,421 383,765 288,135 - - 15,707 40,123 14,219 1,727,709 Overdrafts - - 3,399 12,032 689 2,180 3 81,303 - - - 342 - 99,948 Term loans - Housing loans - - - - - - - - - - - 27,894 - 27,894 - Syndicated term loans - - - - - - 29,552 - - - 15,707 - - 45,259 - Other term loans - - 5,792 126,669 3,502 380,733 29,207 94,741 - - - 9,620 14,219 664,483 Bills receivable - - 1,040 - - 5,308 - - - - - - - 6,348 Revolving credit - - 8,047 75,447 - 295,298 323,109 107,090 - - - - - 808,991 Bankers’ acceptances - - 10,722 - - 54,902 1,894 5,001 - - - - - 72,519 Staff loans - - - - - - - - - - - 1,469 - 1,469 Credit card loans - - - - - - - - - - - 798 - 798
Statutory deposits with Bank Negara Malaysia 11,468 - - - - - - - - - - - - 11,468 1,246,625 940,513 29,000 214,148 9,165 738,421 409,699 288,135 - 31,041 15,707 40,123 14,219 3,976,796
Commitments and ContingenciesContingent liabilities - - 79,919 16,139 - 22,560 72,297 40,695 - - - - - 231,610 Commitments - 8,946 27,824 61,876 4,140 92,258 3,610 61,882 - - 4,223 22,331 3,884 290,974
- 8,946 107,743 78,015 4,140 114,818 75,907 102,577 - - 4,223 22,331 3,884 522,584
Total Credit Exposures 1,246,625 949,459 136,743 292,163 13,305 853,239 485,606 390,712 - 31,041 19,930 62,454 18,103 4,499,380
The following tables present the credit exposures of financial assets broken down by relevant category and class against the relevant industry, geography and maturity. For on-balance sheet exposures, the maximum exposure to credit risk equals to their carrying amounts. For financial guarantees, themaximum exposure to credit risk is the maximum amount that the Bank would have to pay if the obligations for which the instruments issued are called upon. For credit commitments, the maximum exposure to credit risk is the full amount of the undrawn credit granted to customers.
(i) Industry Analysis
As at 30 June 2014
The following tables present the credit exposures of financial assets of the Bank analysed by industrial distribution.
(Company No. 839839 M) 8
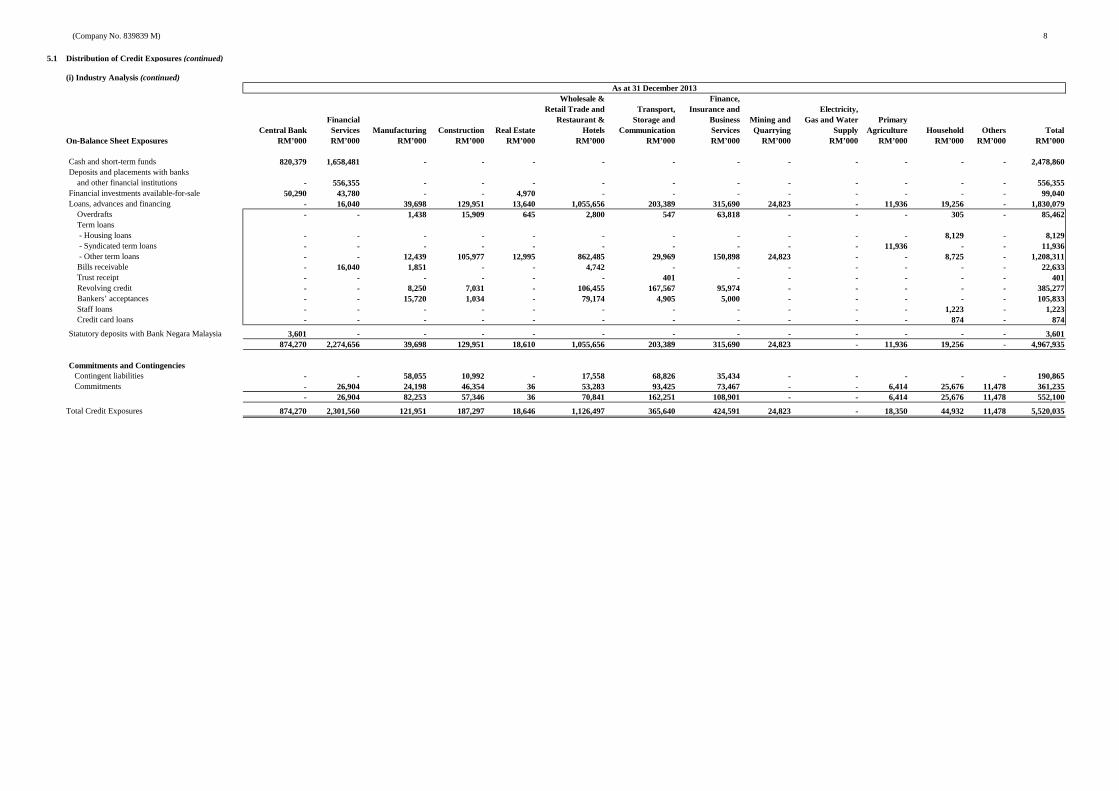
5.1 Distribution of Credit Exposures (continued)
Wholesale & Finance,Retail Trade and Transport, Insurance and Electricity,
Financial Restaurant & Storage and Business Mining and Gas and Water PrimaryCentral Bank Services Manufacturing Construction Real Estate Hotels Communication Services Quarrying Supply Agriculture Household Others Total
On-Balance Sheet Exposures RM’000 RM’000 RM’000 RM’000 RM’000 RM’000 RM’000 RM’000 RM’000 RM’000 RM’000 RM’000 RM’0 00 RM’000
Cash and short-term funds 820,379 1,658,481 - - - - - - - - - - - 2,478,860 Deposits and placements with banks and other financial institutions - 556,355 - - - - - - - - - - - 556,355 Financial investments available-for-sale 50,290 43,780 - - 4,970 - - - - - - - - 99,040 Loans, advances and financing - 16,040 39,698 129,951 13,640 1,055,656 203,389 315,690 24,823 - 11,936 19,256 - 1,830,079 Overdrafts - - 1,438 15,909 645 2,800 547 63,818 - - - 305 - 85,462 Term loans - Housing loans - - - - - - - - - - - 8,129 - 8,129 - Syndicated term loans - - - - - - - - - - 11,936 - - 11,936 - Other term loans - - 12,439 105,977 12,995 862,485 29,969 150,898 24,823 - - 8,725 - 1,208,311 Bills receivable - 16,040 1,851 - - 4,742 - - - - - - - 22,633 Trust receipt - - - - - - 401 - - - - - - 401 Revolving credit - - 8,250 7,031 - 106,455 167,567 95,974 - - - - - 385,277 Bankers’ acceptances - - 15,720 1,034 - 79,174 4,905 5,000 - - - - - 105,833 Staff loans - - - - - - - - - - - 1,223 - 1,223 Credit card loans - - - - - - - - - - - 874 - 874
Statutory deposits with Bank Negara Malaysia 3,601 - - - - - - - - - - - - 3,601 874,270 2,274,656 39,698 129,951 18,610 1,055,656 203,389 315,690 24,823 - 11,936 19,256 - 4,967,935
Commitments and ContingenciesContingent liabilities - - 58,055 10,992 - 17,558 68,826 35,434 - - - - - 190,865 Commitments - 26,904 24,198 46,354 36 53,283 93,425 73,467 - - 6,414 25,676 11,478 361,235
- 26,904 82,253 57,346 36 70,841 162,251 108,901 - - 6,414 25,676 11,478 552,100
Total Credit Exposures 874,270 2,301,560 121,951 187,297 18,646 1,126,497 365,640 424,591 24,823 - 18,350 44,932 11,478 5,520,035
(i) Industry Analysis (continued)As at 31 December 2013
(Company No. 839839 M) 9
5.1 Distribution of Credit Exposures (continued)
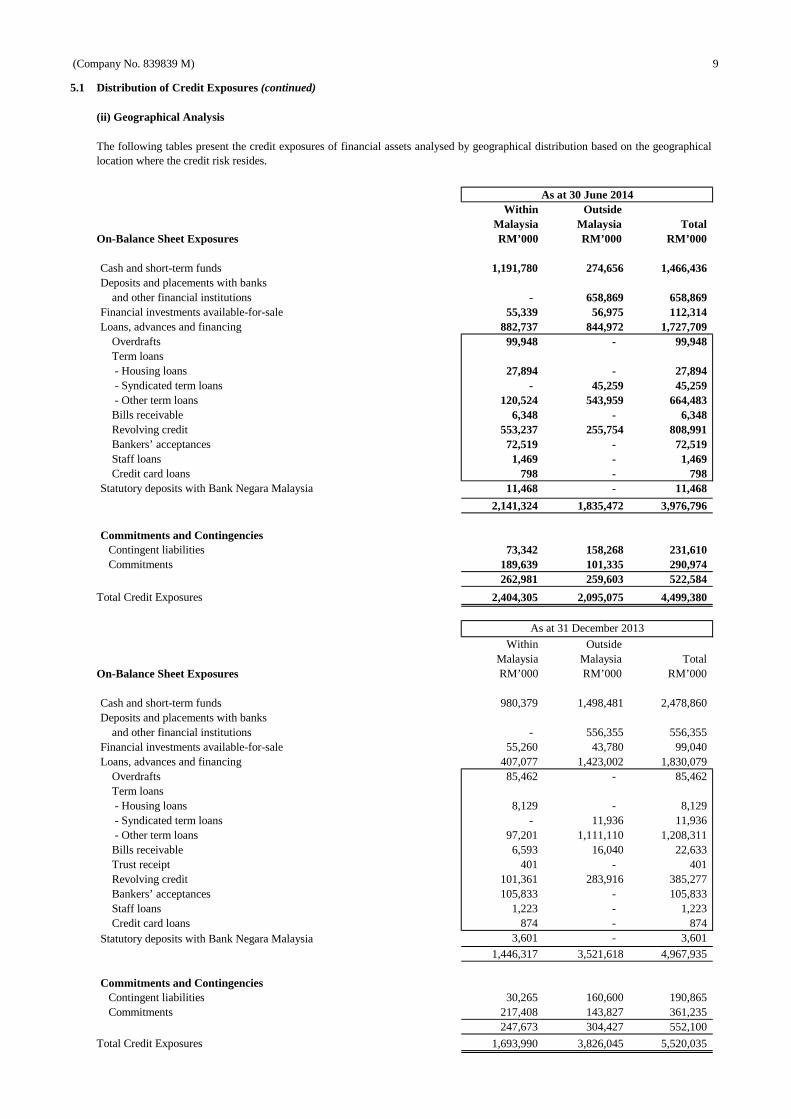
(ii) Geographical Analysis
Within OutsideMalaysia Malaysia Total
On-Balance Sheet Exposures RM’000 RM’000 RM’000
Cash and short-term funds 1,191,780 274,656 1,466,436 Deposits and placements with banks and other financial institutions - 658,869 658,869 Financial investments available-for-sale 55,339 56,975 112,314 Loans, advances and financing 882,737 844,972 1,727,709 Overdrafts 99,948 - 99,948 Term loans - Housing loans 27,894 - 27,894 - Syndicated term loans - 45,259 45,259 - Other term loans 120,524 543,959 664,483 Bills receivable 6,348 - 6,348 Revolving credit 553,237 255,754 808,991 Bankers’ acceptances 72,519 - 72,519 Staff loans 1,469 - 1,469 Credit card loans 798 - 798 Statutory deposits with Bank Negara Malaysia 11,468 - 11,468
2,141,324 1,835,472 3,976,796
Commitments and ContingenciesContingent liabilities 73,342 158,268 231,610 Commitments 189,639 101,335 290,974
262,981 259,603 522,584
Total Credit Exposures 2,404,305 2,095,075 4,499,380
Within OutsideMalaysia Malaysia Total
On-Balance Sheet Exposures RM’000 RM’000 RM’000
Cash and short-term funds 980,379 1,498,481 2,478,860 Deposits and placements with banks and other financial institutions - 556,355 556,355 Financial investments available-for-sale 55,260 43,780 99,040 Loans, advances and financing 407,077 1,423,002 1,830,079 Overdrafts 85,462 - 85,462 Term loans - Housing loans 8,129 - 8,129 - Syndicated term loans - 11,936 11,936 - Other term loans 97,201 1,111,110 1,208,311 Bills receivable 6,593 16,040 22,633 Trust receipt 401 - 401 Revolving credit 101,361 283,916 385,277 Bankers’ acceptances 105,833 - 105,833 Staff loans 1,223 - 1,223 Credit card loans 874 - 874 Statutory deposits with Bank Negara Malaysia 3,601 - 3,601
1,446,317 3,521,618 4,967,935
Commitments and ContingenciesContingent liabilities 30,265 160,600 190,865 Commitments 217,408 143,827 361,235
247,673 304,427 552,100
Total Credit Exposures 1,693,990 3,826,045 5,520,035
As at 30 June 2014
As at 31 December 2013
The following tables present the credit exposures of financial assets analysed by geographical distribution based on the geographicallocation where the credit risk resides.
(Company No. 839839 M) 10
5.1 Distribution of Credit Exposures (continued)
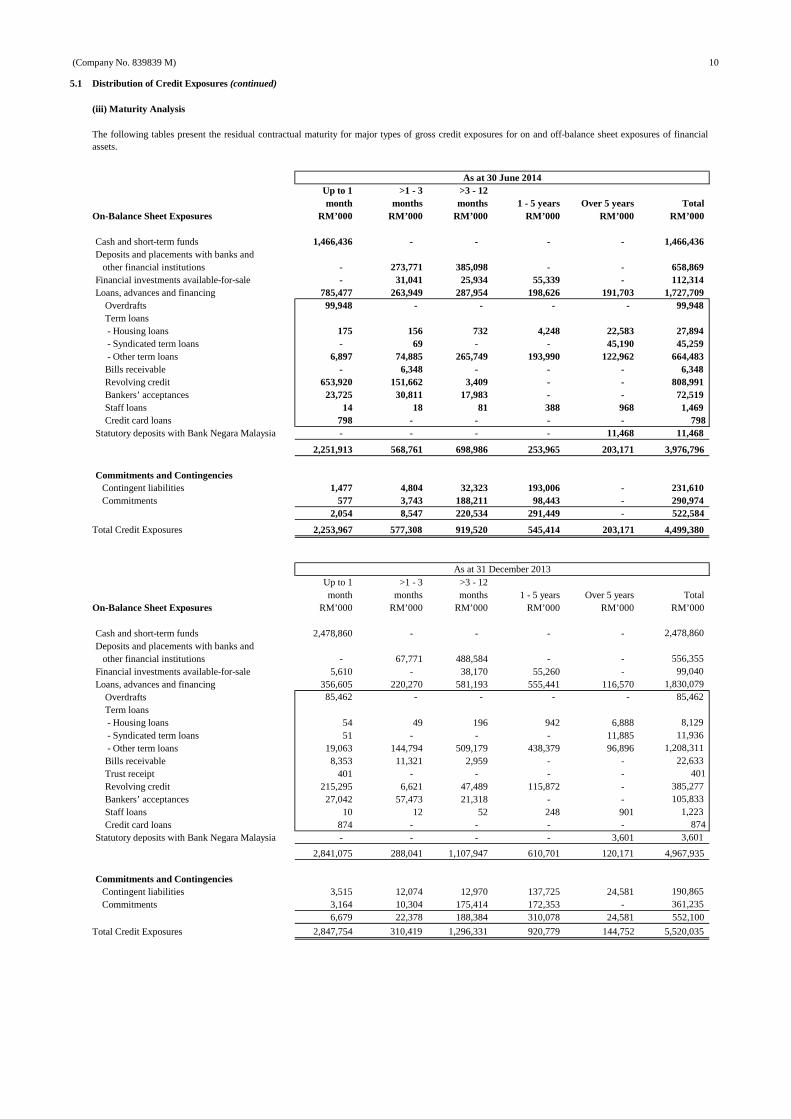
(iii) Maturity Analysis
Up to 1 >1 - 3 >3 - 12month months months 1 - 5 years Over 5 years Total
On-Balance Sheet Exposures RM’000 RM’000 RM’000 RM’000 RM’000 RM’000
Cash and short-term funds 1,466,436 - - - - 1,466,436 Deposits and placements with banks and other financial institutions - 273,771 385,098 - - 658,869 Financial investments available-for-sale - 31,041 25,934 55,339 - 112,314 Loans, advances and financing 785,477 263,949 287,954 198,626 191,703 1,727,709 Overdrafts 99,948 - - - - 99,948 Term loans - Housing loans 175 156 732 4,248 22,583 27,894 - Syndicated term loans - 69 - - 45,190 45,259 - Other term loans 6,897 74,885 265,749 193,990 122,962 664,483 Bills receivable - 6,348 - - - 6,348 Revolving credit 653,920 151,662 3,409 - - 808,991 Bankers’ acceptances 23,725 30,811 17,983 - - 72,519 Staff loans 14 18 81 388 968 1,469 Credit card loans 798 - - - - 798 Statutory deposits with Bank Negara Malaysia - - - - 11,468 11,468
2,251,913 568,761 698,986 253,965 203,171 3,976,796
Commitments and ContingenciesContingent liabilities 1,477 4,804 32,323 193,006 - 231,610 Commitments 577 3,743 188,211 98,443 - 290,974
2,054 8,547 220,534 291,449 - 522,584
Total Credit Exposures 2,253,967 577,308 919,520 545,414 203,171 4,499,380
Up to 1 >1 - 3 >3 - 12month months months 1 - 5 years Over 5 years Total
On-Balance Sheet Exposures RM’000 RM’000 RM’000 RM’000 RM’000 RM’000
Cash and short-term funds 2,478,860 - - - - 2,478,860 Deposits and placements with banks and other financial institutions - 67,771 488,584 - - 556,355 Financial investments available-for-sale 5,610 - 38,170 55,260 - 99,040 Loans, advances and financing 356,605 220,270 581,193 555,441 116,570 1,830,079 Overdrafts 85,462 - - - - 85,462 Term loans - Housing loans 54 49 196 942 6,888 8,129 - Syndicated term loans 51 - - - 11,885 11,936 - Other term loans 19,063 144,794 509,179 438,379 96,896 1,208,311 Bills receivable 8,353 11,321 2,959 - - 22,633 Trust receipt 401 - - - - 401 Revolving credit 215,295 6,621 47,489 115,872 - 385,277 Bankers’ acceptances 27,042 57,473 21,318 - - 105,833 Staff loans 10 12 52 248 901 1,223 Credit card loans 874 - - - - 874 Statutory deposits with Bank Negara Malaysia - - - - 3,601 3,601
2,841,075 288,041 1,107,947 610,701 120,171 4,967,935
Commitments and ContingenciesContingent liabilities 3,515 12,074 12,970 137,725 24,581 190,865 Commitments 3,164 10,304 175,414 172,353 - 361,235
6,679 22,378 188,384 310,078 24,581 552,100
Total Credit Exposures 2,847,754 310,419 1,296,331 920,779 144,752 5,520,035
As at 31 December 2013
As at 30 June 2014
The following tables present the residual contractual maturity for major types of gross credit exposures for on and off-balance sheet exposures of financialassets.
(Company No. 839839) 11
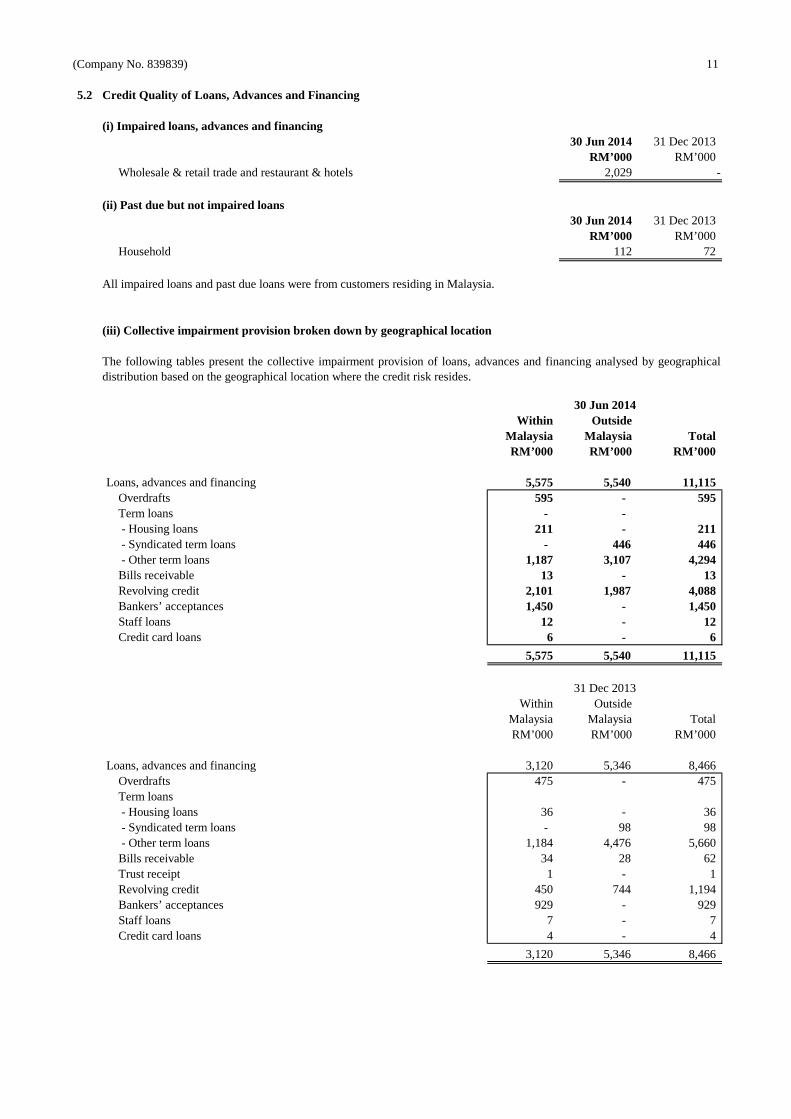
5.2 Credit Quality of Loans, Advances and Financing
(i) Impaired loans, advances and financing30 Jun 2014 31 Dec 2013
RM’000 RM’000 Wholesale & retail trade and restaurant & hotels 2,029 -
(ii) Past due but not impaired loans30 Jun 2014 31 Dec 2013
RM’000 RM’000 Household 112 72
(iii) Collective impairment provision broken down by geographical location
Within OutsideMalaysia Malaysia TotalRM’000 RM’000 RM’000
Loans, advances and financing 5,575 5,540 11,115 Overdrafts 595 - 595 Term loans - - - Housing loans 211 - 211 - Syndicated term loans - 446 446 - Other term loans 1,187 3,107 4,294 Bills receivable 13 - 13 Revolving credit 2,101 1,987 4,088 Bankers’ acceptances 1,450 - 1,450 Staff loans 12 - 12 Credit card loans 6 - 6
5,575 5,540 11,115
Within OutsideMalaysia Malaysia TotalRM’000 RM’000 RM’000
Loans, advances and financing 3,120 5,346 8,466 Overdrafts 475 - 475 Term loans - Housing loans 36 - 36 - Syndicated term loans - 98 98 - Other term loans 1,184 4,476 5,660 Bills receivable 34 28 62 Trust receipt 1 - 1 Revolving credit 450 744 1,194 Bankers’ acceptances 929 - 929 Staff loans 7 - 7 Credit card loans 4 - 4
3,120 5,346 8,466
31 Dec 2013
The following tables present the collective impairment provision of loans, advances and financing analysed by geographicaldistribution based on the geographical location where the credit risk resides.
30 Jun 2014
All impaired loans and past due loans were from customers residing in Malaysia.
(Company No. 839839 M) 12
5.2 Credit Quality of Loans, advances and Financing (continued)
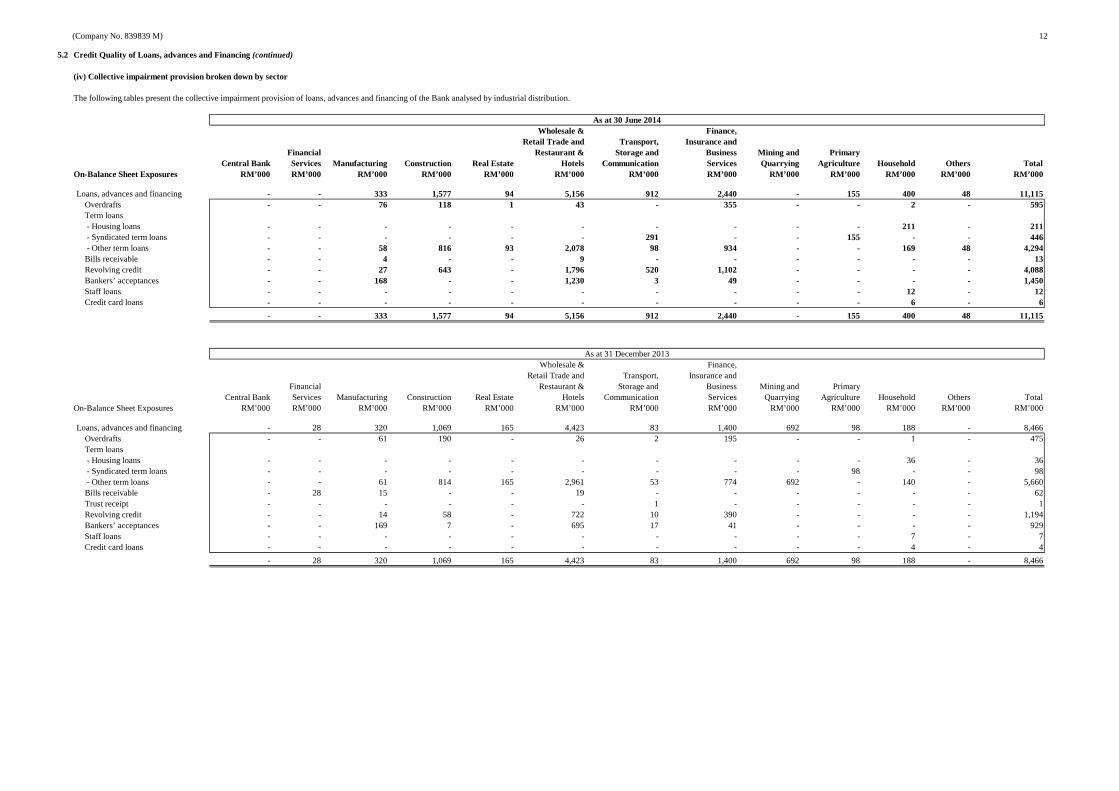
(iv) Collective impairment provision broken down by sector
Wholesale & Finance,Retail Trade and Transport, Insurance and
Financial Restaurant & Storage and Business Mining and PrimaryCentral Bank Services Manufacturing Construction Real Estate Hotels Communication Services Quarrying Agriculture Household Others Total
On-Balance Sheet Exposures RM’000 RM’000 RM’000 RM’000 RM’000 RM’000 RM’000 RM’000 RM’000 RM’000 RM’000 RM’000 RM’0 00
Loans, advances and financing - - 333 1,577 94 5,156 912 2,440 - 155 400 48 11,115 Overdrafts - - 76 118 1 43 - 355 - - 2 - 595 Term loans - Housing loans - - - - - - - - - - 211 - 211 - Syndicated term loans - - - - - - 291 - - 155 - - 446 - Other term loans - - 58 816 93 2,078 98 934 - - 169 48 4,294 Bills receivable - - 4 - - 9 - - - - - - 13 Revolving credit - - 27 643 - 1,796 520 1,102 - - - - 4,088 Bankers’ acceptances - - 168 - - 1,230 3 49 - - - - 1,450 Staff loans - - - - - - - - - - 12 - 12 Credit card loans - - - - - - - - - - 6 - 6
- - 333 1,577 94 5,156 912 2,440 - 155 400 48 11,115
Wholesale & Finance,Retail Trade and Transport, Insurance and
Financial Restaurant & Storage and Business Mining and PrimaryCentral Bank Services Manufacturing Construction Real Estate Hotels Communication Services Quarrying Agriculture Household Others Total
On-Balance Sheet Exposures RM’000 RM’000 RM’000 RM’000 RM’000 RM’000 RM’000 RM’000 RM’000 RM’000 RM’000 RM’000 RM’000
Loans, advances and financing - 28 320 1,069 165 4,423 83 1,400 692 98 188 - 8,466 Overdrafts - - 61 190 - 26 2 195 - - 1 - 475 Term loans - Housing loans - - - - - - - - - - 36 - 36 - Syndicated term loans - - - - - - - - - 98 - - 98 - Other term loans - - 61 814 165 2,961 53 774 692 - 140 - 5,660 Bills receivable - 28 15 - - 19 - - - - - - 62 Trust receipt - - - - - - 1 - - - - - 1 Revolving credit - - 14 58 - 722 10 390 - - - - 1,194 Bankers’ acceptances - - 169 7 - 695 17 41 - - - - 929 Staff loans - - - - - - - - - - 7 - 7 Credit card loans - - - - - - - - - - 4 - 4
- 28 320 1,069 165 4,423 83 1,400 692 98 188 - 8,466
The following tables present the collective impairment provision of loans, advances and financing of the Bank analysed by industrial distribution.
As at 31 December 2013
As at 30 June 2014
(Company No. 839839) 13
5.2 Credit Quality of Loans, advances and Financing (continued)
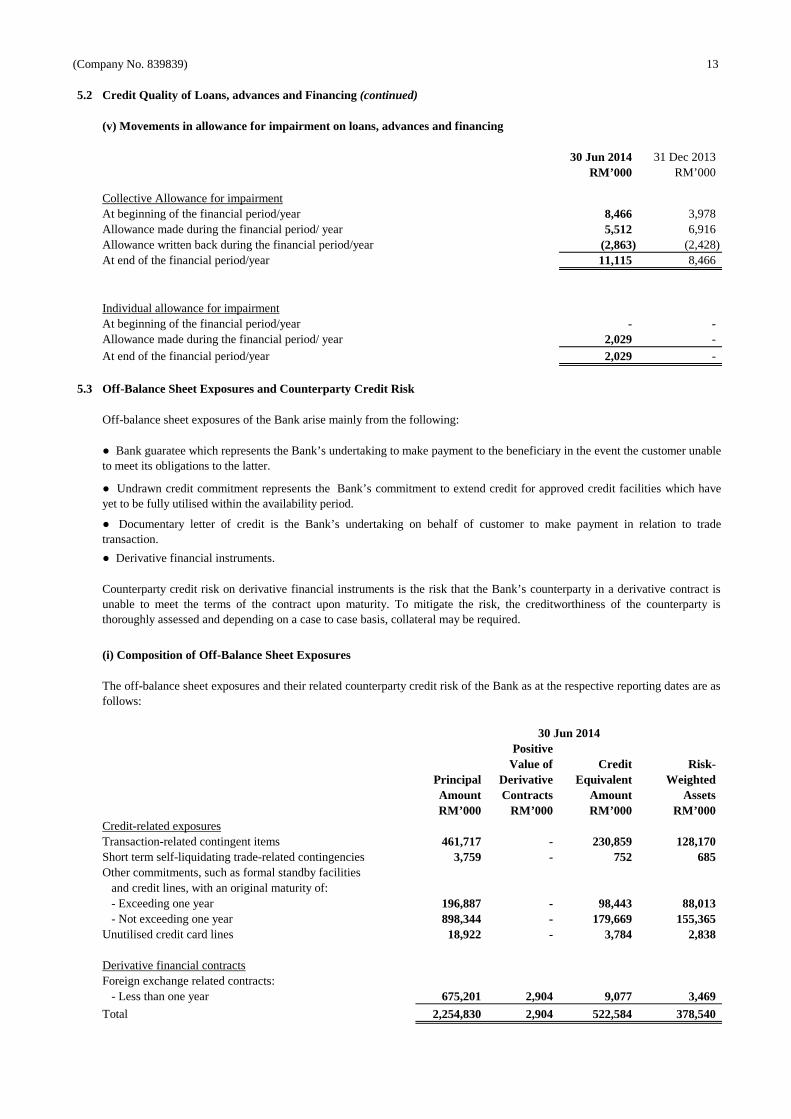
(v) Movements in allowance for impairment on loans, advances and financing
30 Jun 2014 31 Dec 2013RM’000 RM’000
Collective Allowance for impairmentAt beginning of the financial period/year 8,466 3,978 Allowance made during the financial period/ year 5,512 6,916 Allowance written back during the financial period/year (2,863) (2,428) At end of the financial period/year 11,115 8,466
Individual allowance for impairmentAt beginning of the financial period/year - - Allowance made during the financial period/ year 2,029 - At end of the financial period/year 2,029 -
5.3 Off-Balance Sheet Exposures and Counterparty Credit Risk
(i) Composition of Off-Balance Sheet Exposures
PositiveValue of Credit Risk-
Principal Derivative Equivalent WeightedAmount Contracts Amount AssetsRM’000 RM’000 RM’000 RM’000
Credit-related exposuresTransaction-related contingent items 461,717 - 230,859 128,170 Short term self-liquidating trade-related contingencies 3,759 - 752 685 Other commitments, such as formal standby facilities and credit lines, with an original maturity of: - Exceeding one year 196,887 - 98,443 88,013 - Not exceeding one year 898,344 - 179,669 155,365 Unutilised credit card lines 18,922 - 3,784 2,838
Derivative financial contractsForeign exchange related contracts: - Less than one year 675,201 2,904 9,077 3,469
Total 2,254,830 2,904 522,584 378,540
Off-balance sheet exposures of the Bank arise mainly from the following:
Counterparty credit risk on derivative financial instruments is the risk that the Bank’s counterparty in a derivative contract isunable to meet the terms of the contract upon maturity. To mitigate the risk, the creditworthiness of the counterparty isthoroughly assessed and depending on a case to case basis, collateral may be required.
● Bank guaratee which represents the Bank’s undertaking to make payment to the beneficiary in the event the customer unableto meet its obligations to the latter.
● Undrawn credit commitment represents the Bank’s commitment to extend credit for approved credit facilities which haveyet to be fully utilised within the availability period.
The off-balance sheet exposures and their related counterparty credit risk of the Bank as at the respective reporting dates are asfollows:
● Documentary letter of credit is the Bank’s undertaking on behalf of customer to make payment in relation to tradetransaction.
● Derivative financial instruments.
30 Jun 2014
(Company No. 839839) 14
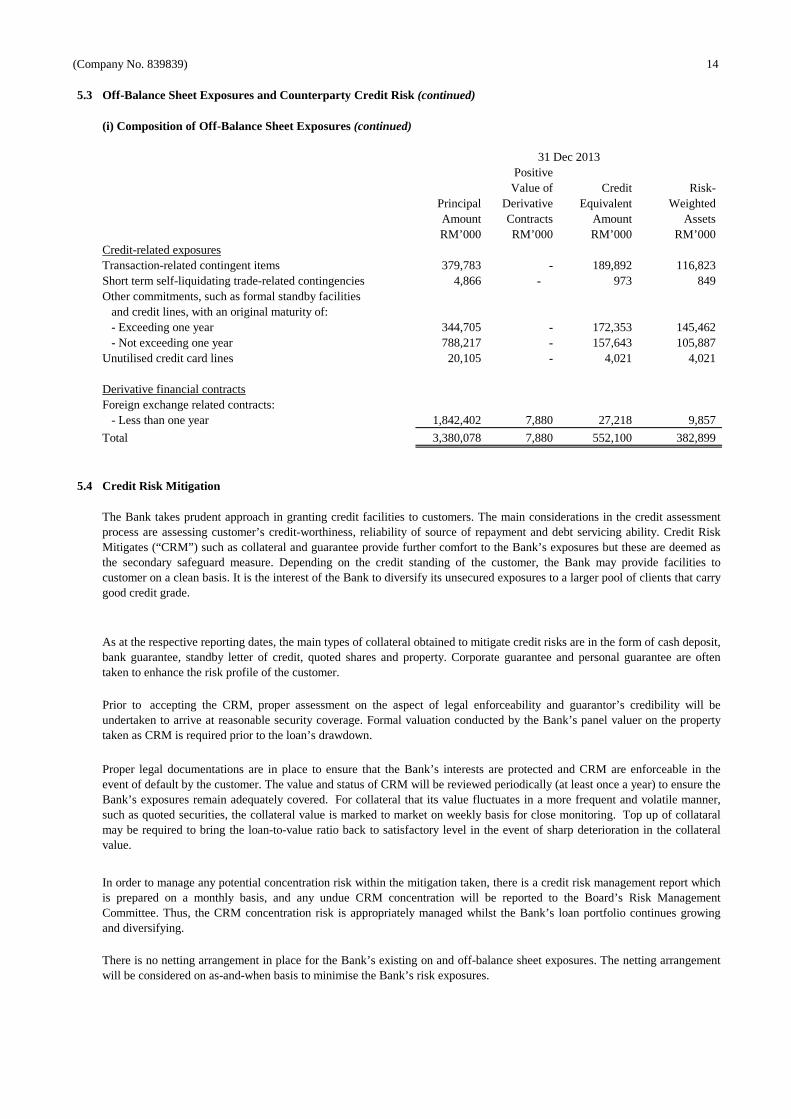
5.3 Off-Balance Sheet Exposures and Counterparty Credit Risk (continued)
(i) Composition of Off-Balance Sheet Exposures (continued)
PositiveValue of Credit Risk-
Principal Derivative Equivalent WeightedAmount Contracts Amount AssetsRM’000 RM’000 RM’000 RM’000
Credit-related exposuresTransaction-related contingent items 379,783 - 189,892 116,823 Short term self-liquidating trade-related contingencies 4,866 - 973 849 Other commitments, such as formal standby facilities and credit lines, with an original maturity of: - Exceeding one year 344,705 - 172,353 145,462 - Not exceeding one year 788,217 - 157,643 105,887 Unutilised credit card lines 20,105 - 4,021 4,021
Derivative financial contractsForeign exchange related contracts: - Less than one year 1,842,402 7,880 27,218 9,857
Total 3,380,078 7,880 552,100 382,899
5.4 Credit Risk Mitigation
There is no netting arrangement in place for the Bank’s existing on and off-balance sheet exposures. The netting arrangementwill be considered on as-and-when basis to minimise the Bank’s risk exposures.
Proper legal documentations are in place to ensure that the Bank’s interests are protected and CRM are enforceable in theevent of default by the customer. The value and status of CRM will be reviewed periodically (at least once a year) to ensuretheBank’s exposures remain adequately covered. For collateral that its value fluctuates in a more frequent and volatile manner,such as quoted securities, the collateral value is marked tomarket on weekly basis for close monitoring. Top up of collataralmay be required to bring the loan-to-value ratio back to satisfactory level in the event of sharp deterioration in the collateralvalue.
In order to manage any potential concentration risk within the mitigation taken, there is a credit risk management report whichis prepared on a monthly basis, and any undue CRM concentration will be reported to the Board’s Risk ManagementCommittee. Thus, the CRM concentration risk is appropriately managed whilst the Bank’s loan portfolio continues growingand diversifying.
Prior to accepting the CRM, proper assessment on the aspect of legal enforceability and guarantor’s credibility will beundertaken to arrive at reasonable security coverage. Formal valuation conducted by the Bank’s panel valuer on the propertytaken as CRM is required prior to the loan’s drawdown.
The Bank takes prudent approach in granting credit facilities to customers. The main considerations in the credit assessmentprocess are assessing customer’s credit-worthiness, reliability of source of repayment and debt servicing ability. Credit RiskMitigates (“CRM”) such as collateral and guarantee providefurther comfort to the Bank’s exposures but these are deemedasthe secondary safeguard measure. Depending on the credit standing of the customer, the Bank may provide facilities tocustomer on a clean basis. It is the interest of the Bank to diversify its unsecured exposures to a larger pool of clients that carrygood credit grade.
31 Dec 2013
As at the respective reporting dates, the main types of collateral obtained to mitigate credit risks are in the form of cash deposit,bank guarantee, standby letter of credit, quoted shares andproperty. Corporate guarantee and personal guarantee are oftentaken to enhance the risk profile of the customer.
(Company No. 839839) 15
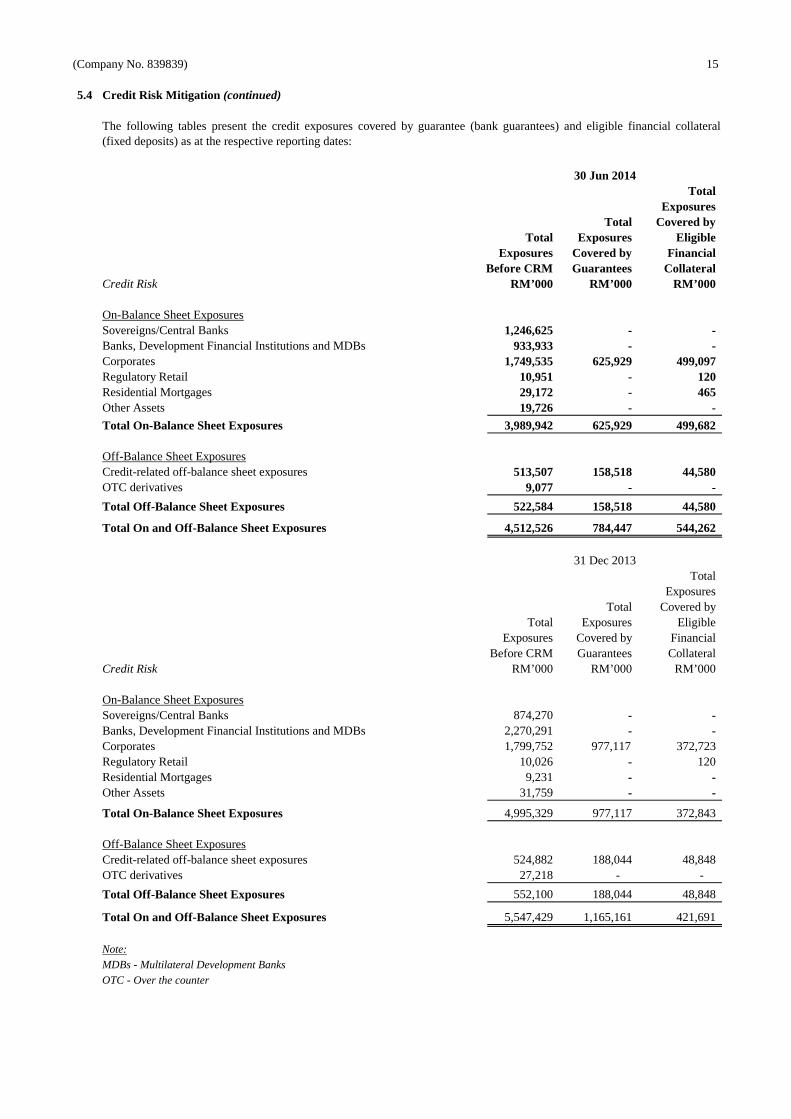
5.4 Credit Risk Mitigation (continued)
TotalExposures
Total Covered byTotal Exposures Eligible
Exposures Covered by FinancialBefore CRM Guarantees Collateral
Credit Risk RM’000 RM’000 RM’000
On-Balance Sheet ExposuresSovereigns/Central Banks 1,246,625 - - Banks, Development Financial Institutions and MDBs 933,933 - - Corporates 1,749,535 625,929 499,097 Regulatory Retail 10,951 - 120 Residential Mortgages 29,172 - 465 Other Assets 19,726 - -
Total On-Balance Sheet Exposures 3,989,942 625,929 499,682
Off-Balance Sheet ExposuresCredit-related off-balance sheet exposures 513,507 158,518 44,580 OTC derivatives 9,077 - -
Total Off-Balance Sheet Exposures 522,584 158,518 44,580
Total On and Off-Balance Sheet Exposures 4,512,526 784,447 544,262
TotalExposures
Total Covered byTotal Exposures Eligible
Exposures Covered by FinancialBefore CRM Guarantees Collateral
Credit Risk RM’000 RM’000 RM’000
On-Balance Sheet ExposuresSovereigns/Central Banks 874,270 - - Banks, Development Financial Institutions and MDBs 2,270,291 - - Corporates 1,799,752 977,117 372,723 Regulatory Retail 10,026 - 120 Residential Mortgages 9,231 - - Other Assets 31,759 - -
Total On-Balance Sheet Exposures 4,995,329 977,117 372,843
Off-Balance Sheet ExposuresCredit-related off-balance sheet exposures 524,882 188,044 48,848 OTC derivatives 27,218 - -
Total Off-Balance Sheet Exposures 552,100 188,044 48,848
Total On and Off-Balance Sheet Exposures 5,547,429 1,165,161 421,691
Note:
MDBs - Multilateral Development Banks
OTC - Over the counter
30 Jun 2014
31 Dec 2013
The following tables present the credit exposures covered by guarantee (bank guarantees) and eligible financial collateral(fixed deposits) as at the respective reporting dates:
(Company No. 839839) 16
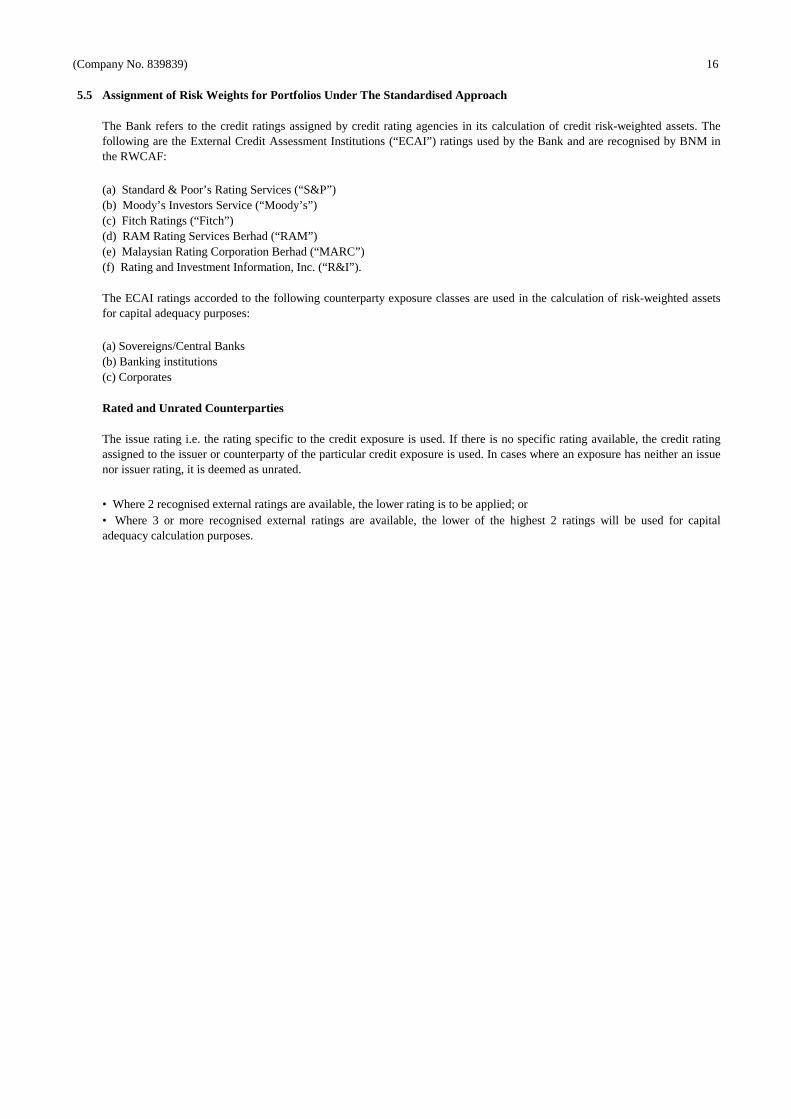
5.5 Assignment of Risk Weights for Portfolios Under The Standardised Approach
(a) Standard & Poor’s Rating Services (“S&P”)(b) Moody’s Investors Service (“Moody’s”)(c) Fitch Ratings (“Fitch”)(d) RAM Rating Services Berhad (“RAM”)(e) Malaysian Rating Corporation Berhad (“MARC”)(f) Rating and Investment Information, Inc. (“R&I”).
(a) Sovereigns/Central Banks(b) Banking institutions(c) Corporates
Rated and Unrated Counterparties
The Bank refers to the credit ratings assigned by credit rating agencies in its calculation of credit risk-weighted assets. Thefollowing are the External Credit Assessment Institutions(“ECAI”) ratings used by the Bank and are recognised by BNM inthe RWCAF:
The issue rating i.e. the rating specific to the credit exposure is used. If there is no specific rating available, the credit ratingassigned to the issuer or counterparty of the particular credit exposure is used. In cases where an exposure has neither an issuenor issuer rating, it is deemed as unrated.
• Where 3 or more recognised external ratings are available,the lower of the highest 2 ratings will be used for capitaladequacy calculation purposes.
• Where 2 recognised external ratings are available, the lower rating is to be applied; or
The ECAI ratings accorded to the following counterparty exposure classes are used in the calculation of risk-weighted assetsfor capital adequacy purposes:
(Company No. 839839) 17
5.5 Assignment of Risk Weights for Portfolios Under The Standardised Approach (continued)
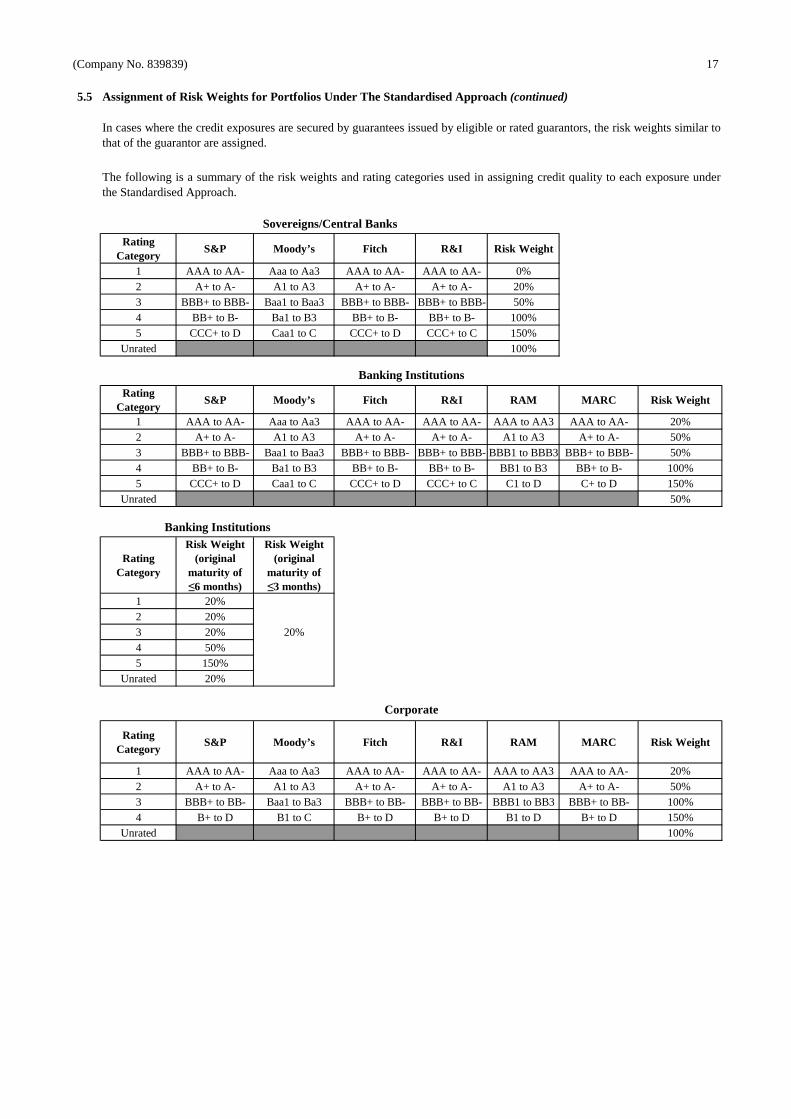
RatingCategory
S&P Moody’s Fitch R&I Risk Weight
1 AAA to AA- Aaa to Aa3 AAA to AA- AAA to AA- 0%2 A+ to A- A1 to A3 A+ to A- A+ to A- 20%3 BBB+ to BBB- Baa1 to Baa3 BBB+ to BBB- BBB+ to BBB- 50%4 BB+ to B- Ba1 to B3 BB+ to B- BB+ to B- 100%5 CCC+ to D Caa1 to C CCC+ to D CCC+ to C 150%
Unrated 100%
RatingCategory
S&P Moody’s Fitch R&I RAM MARC Risk Weight
1 AAA to AA- Aaa to Aa3 AAA to AA- AAA to AA- AAA to AA3 AAA to AA- 20%2 A+ to A- A1 to A3 A+ to A- A+ to A- A1 to A3 A+ to A- 50%3 BBB+ to BBB- Baa1 to Baa3 BBB+ to BBB- BBB+ to BBB- BBB1 to BBB3 BBB+ to BBB- 50%4 BB+ to B- Ba1 to B3 BB+ to B- BB+ to B- BB1 to B3 BB+ to B- 100%5 CCC+ to D Caa1 to C CCC+ to D CCC+ to C C1 to D C+ to D 150%
Unrated 50%
RatingCategory
Risk Weight(original
maturity of ≤6 months)
Risk Weight(original
maturity of ≤3 months)
1 20%2 20%3 20% 20%4 50%5 150%
Unrated 20%
RatingCategory
S&P Moody’s Fitch R&I RAM MARC Risk Weight
1 AAA to AA- Aaa to Aa3 AAA to AA- AAA to AA- AAA to AA3 AAA to AA- 20%2 A+ to A- A1 to A3 A+ to A- A+ to A- A1 to A3 A+ to A- 50%3 BBB+ to BB- Baa1 to Ba3 BBB+ to BB- BBB+ to BB- BBB1 to BB3 BBB+ to BB- 100%4 B+ to D B1 to C B+ to D B+ to D B1 to D B+ to D 150%
Unrated 100%
Corporate
Banking Institutions
Sovereigns/Central Banks
The following is a summary of the risk weights and rating categories used in assigning credit quality to each exposure underthe Standardised Approach.
In cases where the credit exposures are secured by guarantees issued by eligible or rated guarantors, the risk weights similar tothat of the guarantor are assigned.
Banking Institutions
(Company No. 839839 M) 18
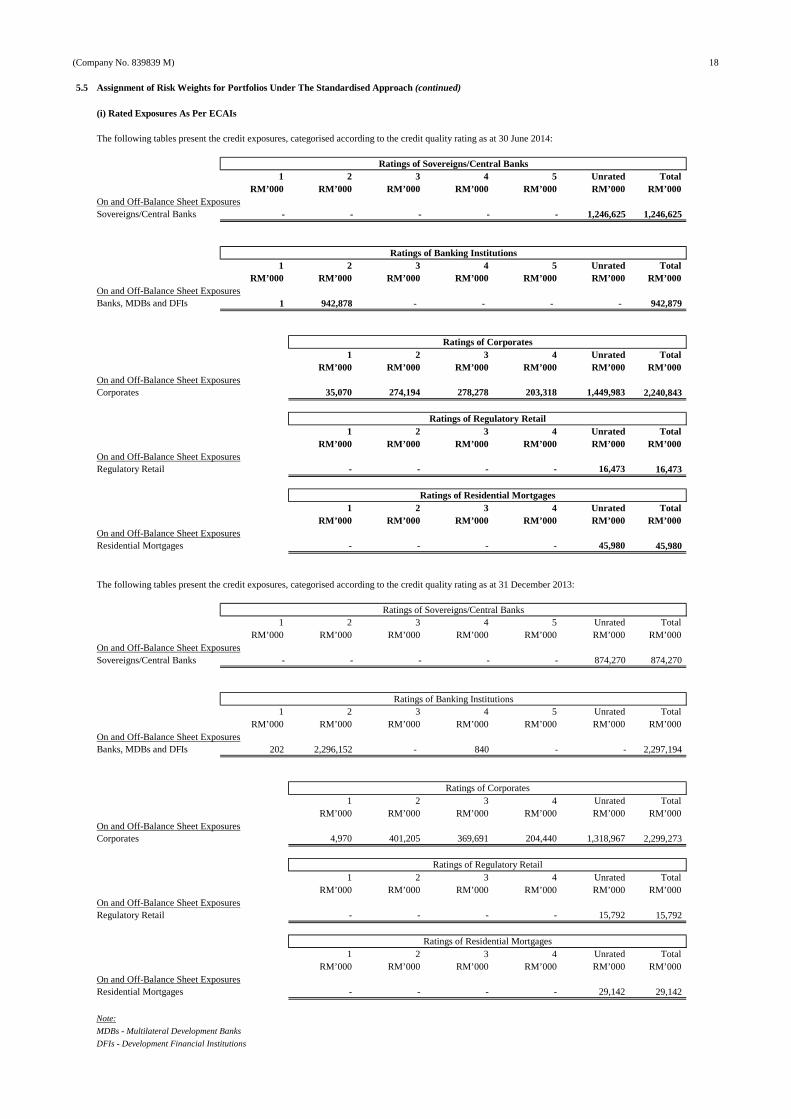
5.5 Assignment of Risk Weights for Portfolios Under The Standardised Approach (continued)
(i) Rated Exposures As Per ECAIs
1 2 3 4 5 Unrated TotalRM’000 RM’000 RM’000 RM’000 RM’000 RM’000 RM’000
On and Off-Balance Sheet ExposuresSovereigns/Central Banks - - - - - 1,246,625 1,246,625
1 2 3 4 5 Unrated TotalRM’000 RM’000 RM’000 RM’000 RM’000 RM’000 RM’000
On and Off-Balance Sheet ExposuresBanks, MDBs and DFIs 1 942,878 - - - - 942,879
1 2 3 4 Unrated TotalRM’000 RM’000 RM’000 RM’000 RM’000 RM’000
On and Off-Balance Sheet ExposuresCorporates 35,070 274,194 278,278 203,318 1,449,983 2,240,843
1 2 3 4 Unrated TotalRM’000 RM’000 RM’000 RM’000 RM’000 RM’000
On and Off-Balance Sheet ExposuresRegulatory Retail - - - - 16,473 16,473
1 2 3 4 Unrated TotalRM’000 RM’000 RM’000 RM’000 RM’000 RM’000
On and Off-Balance Sheet ExposuresResidential Mortgages - - - - 45,980 45,980
1 2 3 4 5 Unrated TotalRM’000 RM’000 RM’000 RM’000 RM’000 RM’000 RM’000
On and Off-Balance Sheet ExposuresSovereigns/Central Banks - - - - - 874,270 874,270
1 2 3 4 5 Unrated TotalRM’000 RM’000 RM’000 RM’000 RM’000 RM’000 RM’000
On and Off-Balance Sheet ExposuresBanks, MDBs and DFIs 202 2,296,152 - 840 - - 2,297,194
1 2 3 4 Unrated TotalRM’000 RM’000 RM’000 RM’000 RM’000 RM’000
On and Off-Balance Sheet ExposuresCorporates 4,970 401,205 369,691 204,440 1,318,967 2,299,273
1 2 3 4 Unrated TotalRM’000 RM’000 RM’000 RM’000 RM’000 RM’000
On and Off-Balance Sheet ExposuresRegulatory Retail - - - - 15,792 15,792
1 2 3 4 Unrated TotalRM’000 RM’000 RM’000 RM’000 RM’000 RM’000
On and Off-Balance Sheet ExposuresResidential Mortgages - - - - 29,142 29,142
Note:
MDBs - Multilateral Development Banks
DFIs - Development Financial Institutions
The following tables present the credit exposures, categorised according to the credit quality rating as at 31 December 2013:
Ratings of Regulatory Retail
Ratings of Residential Mortgages
The following tables present the credit exposures, categorised according to the credit quality rating as at 30 June 2014:
Ratings of Sovereigns/Central Banks
Ratings of Banking Institutions
Ratings of Corporates
Ratings of Residential Mortgages
Ratings of Sovereigns/Central Banks
Ratings of Banking Institutions
Ratings of Corporates
Ratings of Regulatory Retail
(Company No. 839839 M) 19
5.5 Assignment of Risk Weights for Portfolios Under The Standardised Approach (continued)
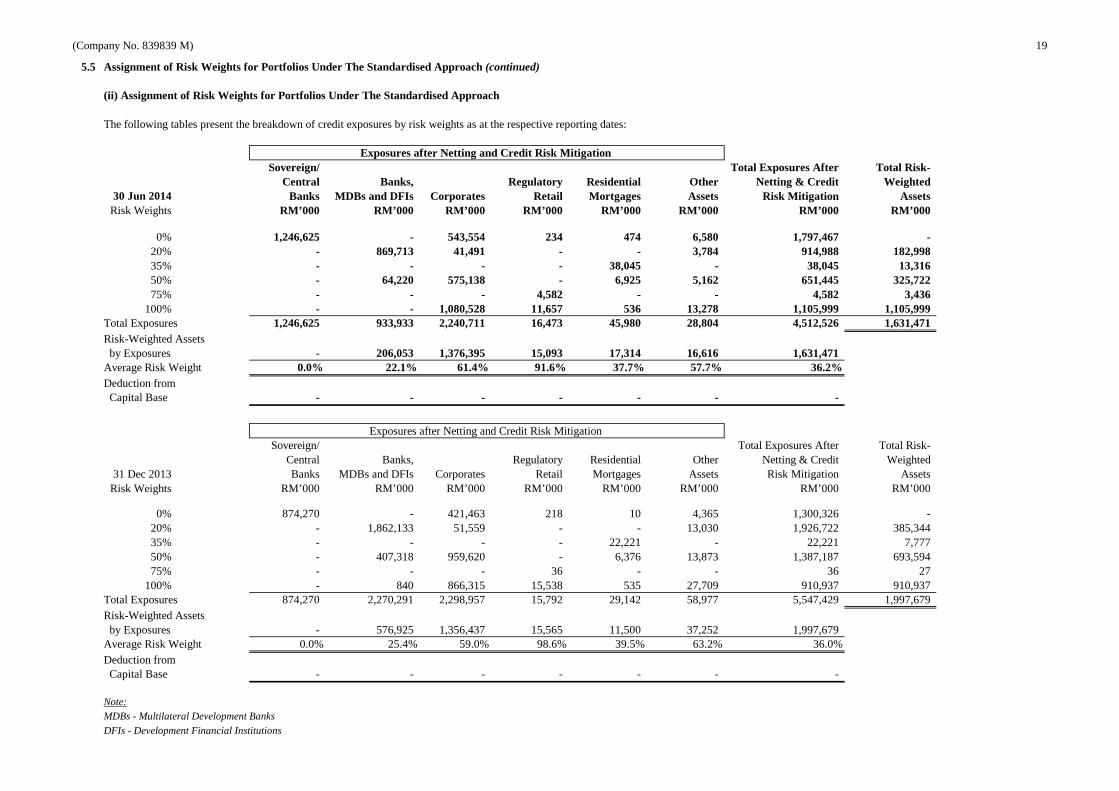
(ii) Assignment of Risk Weights for Portfolios Under The Standardised Approach
Sovereign/ Total Exposures After Total Risk-Central Banks, Regulatory Residential Other Netting & Credit Weighted
30 Jun 2014 Banks MDBs and DFIs Corporates Retail Mortgages Assets Risk Mitigation AssetsRisk Weights RM’000 RM’000 RM’000 RM’000 RM’000 RM’000 RM’000 RM’000
0% 1,246,625 - 543,554 234 474 6,580 1,797,467 - 20% - 869,713 41,491 - - 3,784 914,988 182,998 35% - - - - 38,045 - 38,045 13,316 50% - 64,220 575,138 - 6,925 5,162 651,445 325,722 75% - - - 4,582 - - 4,582 3,436
100% - - 1,080,528 11,657 536 13,278 1,105,999 1,105,999 Total Exposures 1,246,625 933,933 2,240,711 16,473 45,980 28,804 4,512,526 1,631,471 Risk-Weighted Assets by Exposures - 206,053 1,376,395 15,093 17,314 16,616 1,631,471 Average Risk Weight 0.0% 22.1% 61.4% 91.6% 37.7% 57.7% 36.2%Deduction from Capital Base - - - - - - -
Sovereign/ Total Exposures After Total Risk-Central Banks, Regulatory Residential Other Netting & Credit Weighted
31 Dec 2013 Banks MDBs and DFIs Corporates Retail Mortgages Assets Risk Mitigation AssetsRisk Weights RM’000 RM’000 RM’000 RM’000 RM’000 RM’000 RM’000 RM’000
0% 874,270 - 421,463 218 10 4,365 1,300,326 - 20% - 1,862,133 51,559 - - 13,030 1,926,722 385,344 35% - - - - 22,221 - 22,221 7,777 50% - 407,318 959,620 - 6,376 13,873 1,387,187 693,594 75% - - - 36 - - 36 27
100% - 840 866,315 15,538 535 27,709 910,937 910,937 Total Exposures 874,270 2,270,291 2,298,957 15,792 29,142 58,977 5,547,429 1,997,679 Risk-Weighted Assets by Exposures - 576,925 1,356,437 15,565 11,500 37,252 1,997,679 Average Risk Weight 0.0% 25.4% 59.0% 98.6% 39.5% 63.2% 36.0%Deduction from Capital Base - - - - - - -
Note:
MDBs - Multilateral Development Banks
DFIs - Development Financial Institutions
Exposures after Netting and Credit Risk Mitigation
The following tables present the breakdown of credit exposures by risk weights as at the respective reporting dates:
Exposures after Netting and Credit Risk Mitigation
(Company No. 839839) 20
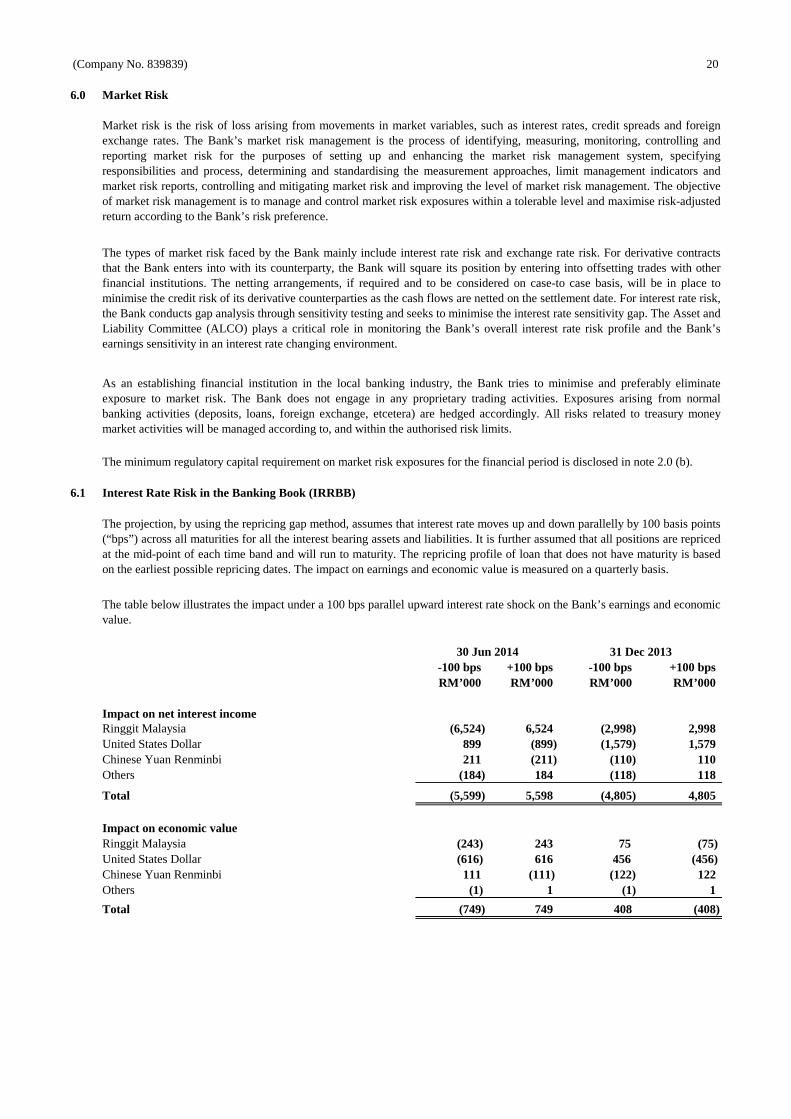
6.0 Market Risk
6.1 Interest Rate Risk in the Banking Book (IRRBB)
-100 bps +100 bps -100 bps +100 bpsRM’000 RM’000 RM’000 RM’000
Impact on net interest incomeRinggit Malaysia (6,524) 6,524 (2,998) 2,998 United States Dollar 899 (899) (1,579) 1,579 Chinese Yuan Renminbi 211 (211) (110) 110 Others (184) 184 (118) 118
Total (5,599) 5,598 (4,805) 4,805
Impact on economic valueRinggit Malaysia (243) 243 75 (75)United States Dollar (616) 616 456 (456)Chinese Yuan Renminbi 111 (111) (122) 122 Others (1) 1 (1) 1
Total (749) 749 408 (408)
The projection, by using the repricing gap method, assumes that interest rate moves up and down parallelly by 100 basis points(“bps”) across all maturities for all the interest bearing assets and liabilities. It is further assumed that all positions are repricedat the mid-point of each time band and will run to maturity. The repricing profile of loan that does not have maturity is basedon the earliest possible repricing dates. The impact on earnings and economic value is measured on a quarterly basis.
The table below illustrates the impact under a 100 bps parallel upward interest rate shock on the Bank’s earnings and economicvalue.
31 Dec 201330 Jun 2014
Market risk is the risk of loss arising from movements in market variables, such as interest rates, credit spreads and foreignexchange rates. The Bank’s market risk management is the process of identifying, measuring, monitoring, controlling andreporting market risk for the purposes of setting up and enhancing the market risk management system, specifyingresponsibilities and process, determining and standardising the measurement approaches, limit management indicators andmarket risk reports, controlling and mitigating market risk and improving the level of market risk management. The objectiveof market risk management is to manage and control market risk exposures within a tolerable level and maximise risk-adjustedreturn according to the Bank’s risk preference.
The types of market risk faced by the Bank mainly include interest rate risk and exchange rate risk. For derivative contractsthat the Bank enters into with its counterparty, the Bank will square its position by entering into offsetting trades with otherfinancial institutions. The netting arrangements, if required and to be considered on case-to case basis, will be in place tominimise the credit risk of its derivative counterparties as the cash flows are netted on the settlement date. For interest rate risk,the Bank conducts gap analysis through sensitivity testingand seeks to minimise the interest rate sensitivity gap. TheAsset andLiability Committee (ALCO) plays a critical role in monitoring the Bank’s overall interest rate risk profile and the Bank’searnings sensitivity in an interest rate changing environment.
As an establishing financial institution in the local banking industry, the Bank tries to minimise and preferably eliminateexposure to market risk. The Bank does not engage in any proprietary trading activities. Exposures arising from normalbanking activities (deposits, loans, foreign exchange, etcetera) are hedged accordingly. All risks related to treasury moneymarket activities will be managed according to, and within the authorised risk limits.
The minimum regulatory capital requirement on market risk exposures for the financial period is disclosed in note 2.0 (b).
(Company No. 839839) 21
7.0 Operational Risk
• requirement for appropriate segregation of duties, including the independent authorisation of transactions• requirements for the reconciliation and monitoring of transactions• compliance with regulatory and other legal requirements• documentation of controls and procedures• development of contingency plans• training and professional development• ethical and business standards• risk mitigation, including insurance where this is effective.
8.0 Liquidity Risk
The minimum regulatory capital requirement on operational risk exposures for the financial period is disclosed in note 2.0 (b).
As an established financial institution in the Malaysian banking industry, it is imperative for the Bank to continuously seek andmaintain new sources of funding to increase and diversify its funding base. The Bank also endeavours to maintain an optimumliquidity position in anticipation of the stringent Liquidity Coverage Ratio and Net Stable Funding Ratio under the BASEL IIIliquidity standards once the regulator has set out the details on the formal implementation date.
The management of liquidity and funding is mainly carried out in compliance with BNM’s New Liquidity Framework; andpractices and limits set by parent company, and the Asset andLiability Committee (ALCO). The Bank maintains a strongliquidity position and constantly manage the liquidity profile of its assets, liabilities and commitments to ensure that cash flowrequirements are appropriately balanced and all obligations are met accordingly.
Liquidity risks are the risks when the Bank fails to raise funds to meet the present or future demand of customers orcounterparties at a reasonable cost. The potential liquidity risks of the Bank include mainly customers’ premature andcollective withdrawal, overdue payment of the debtors, mismatched asset-liability maturity structure and difficulties inrealisation of assets, and daily management of its liquidity positions.
Operational risk is the risk of direct or indirect loss arising from a wide variety of causes associated with the Bank’s processes,personnel, technology and infrastructure, and from external factors other than credit, market and liquidity risk.
The primary responsibility for the development and implementation of controls to address operational risk is assignedto SeniorManagement within each department. The responsibility is supported by the development of an overall Bank standard for themanagement of operational risk in the following areas: