industrial energy efficiency and climate meetings
TRANSCRIPT

March 2007
Energy ManagementStandards in Industry
19-20 March 2007Vienna International Centre
21-22 March 2007Vienna International Centre
UNITED NATIONS INDUSTRIAL DEVELOPMENTORGANIZATION
A seminar organized jointly by UNIDO, the ClimateTechnology Initiative and UK Trade and Investmentto discuss how the Kyoto Protocol can increase theefficiency of energy use in industry.
How to make energy efficiency “business as usual” in the industry sector. The UNIDO Expert GroupMeeting brings together energy efficiency and standards experts to discuss linking energy efficiency to global competitiveness, cost reduction,increased productivity and environmental compli-
Vienna ENERGY EFFICIENCY and CLIMATE MEETINGS
Industrial Energy EfficiencyProjects in the CleanDevelopment Mechanism and Joint Implementation
V.07
-803
75–F
ebru
ary
2007
–10
http://www.unido.org/en/doc/61189
back to contents page

UNITED NATIONS INDUSTRIAL DEVELOPMENT ORGANIZATIONVienna, 2007
Proceedingsof the UNIDO/CTI Seminar
on Energy Efficiencyand CDM
u n i d o r e s e a r c h p r o g r a m m e

iii
Contents
11.. IInnttrroodduuccttiioonn 11.1 Brief description 1 1.2 Clean Development Mechanism (CDM) and Joint Implementation (JI) 1 1.3 Industrial energy efficiency 2 1.4 Agenda 2
22.. CCoonncclluussiioonnss aanndd rreeccoommmmeennddaattiioonnss 52.1 General 52.2 Energy efficiency projects in CDM and JI 52.3 New approaches to CDM: Programmatic CDM (PoA) 62.4 Existing energy efficiency expertise, protocols and best practices should
play a greater role in the CDM 72.5 Linking Montreal and Kyoto: Chiller demonstration projects 82.6 Cogeneration projects in CDM: a success story 102.7 CDM methodology issues related to energy efficiency projects 112.8 Findings/recommendations 11
33.. KKeeyynnoottee pprreesseennttaattiioonnss//ssttaatteemmeennttss 133.1 Opening statement 13 3.2 Keynote statement 13 3.3 Introduction of agenda 19
44.. PPaanneell sseessssiioonn II:: OOvveerrvviieeww ooff ccaarrbboonn mmaarrkkeettss 27 4.1 Presentations 27
An overview of the CDM and JI markets 27Where we stand in the market 32Carbon market 2007 40Carbon market overview 47Energy demand, carbon markets, and energy efficiency 54
4.2 Discussions 61
55.. PPaanneell sseessssiioonn IIII:: SSttaattuuss ooff eenneerrggyy eeffffiicciieennccyy uunnddeerr CCDDMM aanndd JJII 63 5.1 Presentations 63
Status and overview: Energy efficiency in CDM & JI 63The status of energy efficiency: Approved methodologies and lessons learned 71Joint implementation and energy efficiency 77Small-scale CDM energy efficiency project activities 85Energy efficiency CDM in Georgia 91
5.2 Discussions 99
66.. PPaanneell sseessssiioonn IIIIII:: LLeessssoonnss lleeaarrnneedd aanndd bbaarrrriieerrss ttoo eenneerrggyy eeffffiicciieennccyy iinn CCDDMM//JJII 101 6.1 Presentations 101
Barriers to energy efficiency projects in CDM/JI from a validator’s perspective 101Pöyry’s energy consulting 102The Austrian JI/CDM programme 106Building a market for industrial energy efficiency services 118Energy efficiency in the CDM and JI from a carbon seller’s perspective 128Technological breakthroughs for 3E: Japanese industry and NEDO’s activities on JI 138
6.2 Discussions 145

iv
77.. PPaanneell sseessssiioonn IIVV:: NNeeww aapppprrooaacchheess ttoo CCDDMM//JJII 1477.1 Presentations 150
Energy efficiency and CDMs 150Why programs? Why are we on PoA? 156Chillers between Montreal and Kyoto 162Landing programmatic CDM at a Peruvian airport 175Programmatic CDM methodology: Case of CFL distribution programmes 183Bundling and programmatic CDM: Foundry cluster and glass cluster 190
7.2 Discussions 199
88.. PPaanneell sseessssiioonn VV:: MMeetthhooddoollooggiieess ffoorr eelleeccttrriicc mmoottoorr--ddrriivveenn ssyysstteemmss 201 8.1 Presentations 201
India: Accelerated chiller replacement programme (NM0197) overview and issues 201Insights from energy efficiency projects on motor-driven systems outside CDM 208Energy efficient motors: Draft CDM methodology 214Energy efficient motors: Key considerations in their application 223
8.2 Discussions 238
99.. DDiissccuussssiioonn ggrroouuppss 2399.1 Group 1: Programmes of activities and energy efficiency 239 9.2 Group 2: Energy efficiency methodology issues and tools 249 9.3 Group 3: CHP in CDM 269 9.4 Group 4: Linking Montreal and Kyoto: chiller demonstration projects and CDM 283 9.5 Group 5: Linking the EE and CDM/JI expert communities: CDM EE network 287
1100.. PPaanneell sseessssiioonn VVII:: TTrraannssffoorrmmiinngg mmaarrkkeettss ffoorr eenneerrggyy eeffffiicciieennccyy 29110.1 Presentations 291
Energy use by, and CO2 emissions from the manufacturing sector in selected countries 291Industrial energy efficiency projects in the clean development mechanism and joint implementation 297Barriers to improving energy efficiency 302Financing of projects by means of JI/CDM 302UNDP approach to transforming markets for energy efficiency 313Industrial system energy efficiency: potential and opportunity 318
10.2 Discussions 327
1111.. AAnnnneexx II:: LLiisstt ooff ppaarrttiicciippaannttss 329
1122.. AAnnnneexx IIII:: LLiisstt ooff aabbbbrreevviiaattiioonnss aanndd aaccrroonnyymmss 333
1133.. AAnnnneexx IIIIII:: SSeemmiinnaarr oonn eenneerrggyy eeffffiicciieennccyy pprroojjeeccttss iinn tthhee CCDDMM aanndd JJII aaggeennddaa 335
1144.. AAnnnneexx IIVV:: PPaappeerrss 339 Energy Efficiency in CDM - Ms. Anne Arquit Niederberger - Policy Solutions 340Way Forward for CDM Energy Efficiency Projects - Mr. Patrick Matschoss - German Advisory Council on the Environment 366Clean Development though Cogeneration - Ms. Sytze Dijkstra – WADE 384Lessons from Submission and Approval Process of Methodologies - Mr. Daisuke Hayashi - Perspectives Climate Change Gmbh 442Energy Efficient Lighting Projects in the CDM - Carbon Finance Unit - World Bank 465

1
I. Introduction
1.1 Brief description
The Seminar on Industrial Energy Efficiency Projects in the Clean Development Mechanism andJoint Implementation took place at the Vienna International Centre, Vienna, Austria, from 19-20March 2007. An initiative of the United Nations Industrial Development Organization(UNIDO), in partnership with the Climate Technology Initiative (CTI) and UK Trade andInvestment, the seminar provided a forum for business and industry to discuss energy efficiencyprojects under the Kyoto Protocol’s Clean Development Mechanism (CDM) and barriers to theirdevelopment and implementation. It also created an opportunity for discussion among countrieshosting CDM and Joint Implementation (JI) projects, and countries interested in purchasing emis-sions reductions to meet emissions reduction targets.
The objective of the seminar was to provide a forum for business and industry to advance theirunderstanding of the methodological issues surrounding energy efficiency, including small-scaleenergy efficiency projects/programmes within the CDM and the barriers for their developmentand implementation. The seminar provided an opportunity for expert discussions and knowledgesharing among countries hosting CDM and JI projects and those that are interested in buyingemissions reductions to meet the emissions reduction targets. The Seminar provided a forum forproject developers and other stakeholders in industry who are directly involved in the developmentof energy efficiency projects such as CDM or JI projects.
Over the course of the two-day seminar, participants and speakers, representing governments,industry, international organizations, financial and legal entities, and research institutionsattended. The event provided a networking and knowledge-sharing opportunity for business andindustry as well as for government experts and other stakeholders involved in the implementationof emissions trading and the project-based mechanism. Full details of the seminar schedule areincluded in Annex IV.
1.2 Clean Development Mechanism (CDM) and Joint Implementation (JI)
The Kyoto Protocol introduces two project-based mechanisms that allow Parties with nationalemissions caps to achieve emissions reductions outside their borders. Article 6 of the Protocolintroduces JI and sets the ground for the transfer of emissions reduction units (ERUs) amongAnnex I Parties.
The CDM allows legal entities in developing countries to undertake cooperative projects with part-ners from Annex I countries in order to generate certified emissions reduction units (CERUs).CERUs are transferable to Annex I investor countries and can be used to augment the allocated

amounts of emissions in the first budget period (2008-2012). CDM projects are to be undertakenfor the benefit of both parties and should lead to emissions reductions that are real, measurable andlong-term. Such projects are also expected to result in demonstrable non-GHG benefits (i.e. envi-ronmental and socio-economic benefits) to the recipient developing country.
The modalities for the implementation of the CDM have yet to be developed and clarified throughnegotiations. To receive recognition as credits, project-based emissions reductions have to be addi-tional to any that would have taken place in the absence of CDM or JI investment. Establishingadditionality and baselines for project-based emissions reductions is one of the most challengingproblems that have to be addressed in order to make the CDM and JI workable.
Additionality determination (in particular financial additionality) is a particularly challenging taskfor energy-efficiency projects, as these projects are regarded most cost-effective in reducing emis-sions. It will be difficult to make a distinction between cost-effective (and hence competitive) proj-ects and those that are not financially additional.
1.3 Industrial energy efficiency
The industrial sector accounts for some 41 per cent of global primary energy demand and approxi-mately the same share of CO
2emissions. GHG emissions can be substantially cut in this sector
through policies and initiatives that stimulate market transformation and new technologies whichwould help improve end-use energy efficiency by recovering waste heat (in the case of cogeneration).
Although industrial energy efficiency has improved greatly in industrialized countries, efficiencygains have remained low in developing countries and economies in transition. In some cases, theenergy intensity and carbon intensity of industrial output has increased despite an economic slowdown. The promotion of cogeneration and end-use efficiency in the industrial sector can not onlyreduce emissions but also contribute to improvements in productivity and competitiveness and inthe security of energy supply.
These economic, environmental and social benefits of cogeneration suggest that there is a potentialfor developing CDM or JI projects which would support the introduction of cogeneration and pro-mote industrial end-use efficiency as a climate change mitigation option in industry.
Although the benefits of Industrial Energy Efficiency (IEE) are well known, IEE projects representonly 3.4 per cent of registered CDM projects (19 of 563 CDM projects approved, as of 22 March2007). Additionally, only 5 of 277 large-scale and 6 of 286 small-scale projects are aimed atimproving the efficiency of energy end-use, or energy demand. UNIDO believes that energy effi-ciency CDM and JI projects are underrepresented in both processes, and seeks to highlight thepotential of demand-side IEE projects to significantly reduce carbon dioxide emissions.Specifically, UNIDO seeks to promote a “systems approach” to energy efficiency (analyzing thewhole system), as opposed to making specific components more efficient.
1.4 Agenda
The Seminar on Energy Efficiency Projects in the CDM and JI took place from 19-20 March2007. The seminar was organized as a series of interactive panel sessions, where speakers provide
2

short 10-15 minute slide presentations followed by a question-and-answer period. Speakers andparticipants included renowned international experts, project and methodology developers and awide-range of high-profile institutions and industry representatives. On Monday, 19 March, panelsessions were held on:
I. An overview of carbon marketsII. The status of energy efficiency under the CDM and JI, and
III. Lessons learned and barriers to energy efficiency in the CDM/JI.
On Tuesday, 20 March, there were panel sessions on:
IV. New approaches to CDM and JIV. Methodologies for electric motor systems, and
VI. Transforming markets for energy efficiency.
In between Sessions V and VI, five discussion groups were formed to discuss the following topics:
� Programmes of activities (PoAs) and energy efficiency� Energy efficiency methodology issues and tools� CHP in CDM� Linking Montreal and Kyoto: chiller demonstration projects and CDM, and � Linking the IEE and CDM/JI expert communities: CDM EE Network.
3


2. Conclusions and recommendations
2.1 General
The objective of the seminar was to provide a forum for business and industry to advance theirunderstanding of the methodological issues surrounding energy efficiency projects/programmeswithin the CDM/JI and the barriers for their development and implementation. The seminar pro-vided an opportunity for expert discussion and knowledge sharing among countries hosting CDMand JI projects and countries that are interested in buying emissions reductions to meet their ownemissions reduction targets.
The seminar was organized as a series of interactive panel sessions, where speakers provided short10-15 minute slide presentations followed by a question-and-answer period. Speakers and partici-pants included renowned international experts, project and methodology developers and a widerange of high-profile representatives from institutions and industry.
The event provided an excellent networking and knowledge-sharing opportunity for business andindustry as well as for government experts and other stakeholders involved in the implementationof emissions trading and project-based JI/CDM mechanisms.
2.2 Energy efficiency projects in CDM and JI
Energy efficiency projects are in general underrepresented in CDM and JI. While the potential ofenergy efficiency as a mitigation option is widely recognized and acknowledged, the mechanisms ofthe Kyoto Protocol have so far failed so far to live up to their expectations in terms of their poten-tial to promote more efficient technologies. Among the 563 CDM projects approved up to 22March 2007, industrial CHP and the use of waste heat recovery projects are well-represented, butonly five large-scale and six small-scale projects – out of a total number of 277 and 286, respectively– are aimed at improving the efficiency of energy end-use (i.e. “Sectoral Scope 3” projects).
There are 19 approved energy efficiency projects in the industrial sector representing only 3 percent of the total number of registered CDM projects. The estimated GHG reductions from theseprojects are < 300 kilo tonnes CO
2 equivalent per year, which is a miniscule share of global energy
efficiency potential. The projects are also limited in terms of their geographical distribution (all buttwo projects are in India) and the range of applied technologies and energy efficiency know-how.
The international climate change community expressed its concern at the limitations encounteredby energy efficiency projects, and with demand-side industrial energy efficiency projects in particular.Their underrepresentation in the CDM pipeline is not only a lost opportunity in terms of CER
5
volumes, but is also a growing challenge to the CDM itself, particularly in the light of the uncer-tainties with the post-2012 regulatory framework and the growing demand for projects with shorterpay-back periods and the potential for the delivery of quality emission reductions. In August 2006,there was a call for public input on the issue of small-scale energy efficiency projects and some changesto the definition of the eligibility limits were introduced for small-scale energy efficiency projects.
The purpose of the UNIDO seminar was to provide an input for global discourse on the issue ofenergy efficiency in CDM and JI and to examine methodological and other barriers that hinder thedevelopment of such projects.
The following sections and subsections highlight the main substantive issues addressed by the seminar.
2.3 New approaches to CDM: Programmatic CDM (PoA)
The panel session IV and a discussion group on day two of the Seminar considered the very newapproach to CDM, i.e. programme of activities (PoA). The group discussions and presentationsprovided an exchange of views on a number of issues in a fruitful discussion.
The following are some highlights from the discussions:
The implementation of CDM activities under a programme of activities (PoA) may reduce some
barriers to energy efficiency but not all.
Energy efficiency requires a conducive economic environment. This environment relates to (a)electricity tariffs and related subsidies, (b) the size of the emission factors and (c) the capacity torecover costs. Electricity tariffs need to be sufficiently high in order to create an economic incentivefor energy efficiency. Subsidies on electricity may make energy efficiency projects unviable. Highemission factors (through low grid efficiency and/or high shares of fossil fuel in the fuel mix) resultin higher generation of CER per unit of end-use energy saved and therefore make efficiency proj-ects more viable. The last issue relates to illegal access to the grid. If electricity users do not pay forthe electricity in the first place, there is no incentive to invest in energy efficiency measures.Therefore, cost recovery is essential. These conditions for successful energy efficiency project activ-ities apply to “normal” CDM projects as well as to PoAs. That is, PoAs too work only under certaincircumstances that relate to the general economic framework. PoAs may be particularly useful ifthey lead to enhanced cost recovery.
The restriction to one technology in PoA is perceived as a barrier.
Increasing end-use energy efficiency often relates to dispersed micro-activities (light bulbs, refriger-ators, air conditioning, insulation etc.). Currently, distinct baseline and monitoring methodologiesare required for each technology in order to be able to prove the additionality of the respective tech-nology or measure. Furthermore, there is no definition of the term “technology”. An alternativewould be the implementation of several technologies as a package. A standardized package of tech-nologies as a “typical” project activity under a PoA would enable emission reductions to be attrib-
6

uted to this package. This would reduce transaction costs and increase the financial viability ofPoAs. Among the participants of the discussion group there was a perceived need for further guid-ance from the CDM Executive Board on this issue. Metering was regarded as a prerequisite in orderto measure electricity savings. At the same time it was also considered an obstacle as metering is notwidespread in many developing countries.
Policies as a PoA
Policies as a PoA have been ruled non-eligible by COP/MOP as actions where considered non-additional in the event of binding legislation. However, legislation is often not enforced. Therefore,participants of the discussion group generally welcomed the specification of the CDM ExecutiveBoard that the actual implementation of an otherwise not enforced legislation is additional andmay be therefore eligible.
Labelling under the CDM.
Labelling refers to the provision of information on energy use of, for instance, appliances. Amongthe participants, labelling was felt to be a vital measure to increase the uptake of energy efficientequipment. However, there has been a very recent rejection of a methodology that introduces thelabelling of air conditioners as a CDM activity. Participants in the discussion group attributed thisto the problem of being unable to prove cause-and-effect relationships when submitting CDMmethodologies. It was felt that the ability to do so is vital when submitting CDM methodologies.However, the ability to show these cause-and-effect relationships is particularly difficult in thelabelling of energy-using appliances since it relates to measuring behavioural change.
Taken together, many participants in the group felt that PoAs may make an important contribu-tion to the increased uptake of energy efficiency in the CDM. However, the instrument is still new.In addition, there are still some clarifications necessary in order to unfold the full potential of PoAs.
2.4 Existing energy efficiency expertise, protocols and best practicesshould play a greater role in the CDM
The participants concluded that it was crucial to build on the large body of existing knowledge oninternational protocols/best practice that has been built since the 1973 oil crisis. This requiresengaging government regulators and industry energy efficiency experts (e.g. utilities, ESCOs, tech-nology providers, end-users) with experience in the implementation and evaluation of public andprivate energy efficiency, regulatory, incentive, contracting, training and audit programmes.Ideally, a “community of practice” on energy efficient CDM would be built.
There is an urgent need for top-down guidance on key energy efficiency design issues, including:
� Emission reduction quantification methodologies: Most energy efficiency programmes/proto-cols offer a menu of approved options that can be selected by the project proponents, typicallyincluding (a) use of default abatement factors ("deemed savings" approach), (b) calculated(engineering) methods for discrete equipment/systems, sometimes in conjunction with default
7

efficiencies and other parameters, (c) before/after metering/modeling, typically applied tomore complex systems such as buildings and (d) sometimes, reliance on energy monitoringplans audited by third parties (this is the approach followed under JI Track 2).
� Baseline adjustment requirements/techniques for routine and non-routine factors.
� Decisions on whether it is necessary and, if so, how to treat "gross-to-net" energy saving issues(including leakage, rebound effects, free riders, spillovers).
� Definition of related default abatement factors, efficiencies and other parameters to enhancetransparency, consistency and certainty.
Such issues are not new to CDM, and regulators have made decisions in the context of existing reg-ulatory programmes about how to handle them. This experience could be synthesized to come upwith common methodologies, tools and default factors for Sectoral Scope 3 CDM. The previouspractice under the CDM–with the exception of small-scale and sink-related methodologies–hasbeen to derive guidance and tools based on bottom-up submissions. However, since there are sofew approved Sectoral Scope 3 methodologies to draw from, and the approval process has beeninconsistent, a top-down approach that draws on methodologies for demand-efficiency projectsalready available outside of the CDM world is urgently needed.
A great deal of work has been done internationally, by national governments, energy agencies, util-ities and other private actors, and by NGOs to devise measurement and verification protocols forenergy efficiency activities, and these have been used in a range of regulatory programmes. All ofthese stakeholders need to be brought together in a rapid process to propose good practice monitor-ing and verification approaches for key sectors and technologies under the CDM.
The role of UNIDO and other international organizations, programmes and agencies could beinstrumental in supporting and catalyzing this process.
2.5 Linking Montreal and Kyoto: Chiller demonstration projects
The panel session and the discussion group addressed the issue of carbon finance and its potentialrole for the implementation of the chiller demonstration project under the Montreal Protocol.
Barriers
The participants perceived the following as barriers for chiller replacement projects:
� Owners lack trust in the reliability of new equipment and its maintenance requirements;
� The financial viability of chiller replacement is one of the barriers, but in many cases it could beovercome by commercial financing arrangements and the involvement of ESCOs;
8

� Co-funding by the Multilateral Fund under the Montreal Protocol and GEF to complementCDM revenues provides a limited window of opportunity for implementing demonstration proj-ects. At the end of this limited period, CDM methodologies and financing models must be avail-able which reach the entire chiller market, including smaller markets in developing countries.
Monitoring
� Monitoring concepts have to be developed in view of how revenues from CERs will beassigned to project stakeholders. In contrast to large-scale chiller projects where a strong imple-menting entity may take a major role in ensuring the efficient operation of new chillers, small-scale projects may need to provide a direct revenue stream to owners as an incentive to operatethe units efficiently;
� Detailed metering during project implementation will also provide relevant information fordeveloping energy efficiency policies;
� The stringent monitoring requirements as foreseen under NM0197 will not be suitable forprojects implemented in small developing countries. Approaches applicable for addressingchiller replacement in such countries need to be developed.
Baseline and project emissions
� If methodology NM0197 is approved, the baseline procedures set out are also very likely to beuseful for other projects and methodologies, including chiller projects;
� In NM0197, the aspect of future change (increase/decrease) in cooling load may need to beaddressed in more detail. The basic provisions for including load variations however areincluded in NM0197. Over the project implementation period, changes in load will be thestandard case and the methodology should not restrict improvements in the overall buildingsystems.
Application of chiller methodologies to other technologies
� CDM approaches would be beneficial for addressing other relevant technologies in relation toMontreal Protocol compliance, such as air-conditioners, domestic and commercial refrigera-tors;
� Existing chiller methodologies will not suit the requirements for addressing a large numbers ofsmall appliances because such monitoring requirements are too stringent for application tolarge volumes of appliances.
Financing options
� Co-financing by MF under the Montreal Protocol and GEF to complement CDM revenuesprovides only a limited opportunity for chiller demonstration projects. At the end of this lim-
9

ited period, CDM methodologies and financing models must be available which reach theentire chiller market, including units in smaller developing countries;
� GEF supports approaches that look at the entire building system in an integral way. Whilechiller-related CDM activities will need to focus on the chiller units, GEF co-financing may beused for enlarging the project scope to an integrated system approach;
� Participants suggested the development of national carbon funds which can be used as revolv-ing funds for the replication of projects.
2.6 Cogeneration projects in CDM: a success story
Cogeneration projects have been successful in the Clean Development Mechanism to date: about20 per cent of all registered projects have involved some kind of CHP application. Most projectshave been in the sugar sector, but there have also been projects using industrial waste heat in theiron and cement sector. India and Brazil have been the most active countries.
The additionality of these cogeneration projects has sometimes been questioned, because many areeconomically viable in their own right, due to considerable efficiency improvement and fuel savings. However, industrial CHP projects in developing countries face many other barriers,including:
� High up-front investment costs;
� Internal rate of return insufficient for commercial loans;
� Lack of skills available locally, particularly for gas-turbine cogeneration;
� Inadequate access to the electricity network for exporting electricity;
� Unfamiliarity with the power sector.
The initial success of CHP in the CDM does not show the whole picture. Cogeneration projectactivities have mostly been limited to a few countries, and a few sectors. Most projects use well-established technology for cogeneration in the food processing industry, using biomass wastes. ForCHP projects to remain successful in the CDM, it is therefore necessary to widen the application ofthe types of projects to more countries and sectors. In addition, other technologies, fuel types andapplication sites must be developed. The most important opportunities for new industrial cogener-ation projects are:
� Grid-connected gas-turbine cogeneration;
� Building-integrated CCHP;
� Biomass cogeneration in industries other than food processing.
10

To enable the expansion of the applications of CHP in the CDM, a number of new baselinemethodologies for the types of application listed above must be developed. At the moment mostmethodologies are for biomass CHP, so a particular need exists for gas-fired cogeneration method-ologies. Similarly, no methodologies for building-integrated CCHP are available, despite the con-siderable potential of such applications in developing countries. These projects face the additionalbarrier of being small, so that they would need to be bundled to become attractive for the CDM. Itis important that experience with such bundling is developed, and disseminated.
The interest in such baseline methodologies would be considerable, and many project developersare developing such projects. However, these project developers normally prefer to use an existingmethodology, rather than proposing one themselves, so they are all waiting for others to developthe methodology. This suggests a possible role for organizations such as UNIDO, WADE andother technical agencies and programmes.
2.7 CDM methodology issues related to energy efficiency projects
It was noted that energy efficiency methodologies suffer the highest rate of rejection by the EB. Theparticipants called for more top-down guidance from the EB and Meth Panel on methodologies forenergy efficiency project activities. Some common reasons for the rejection of energy efficiencymethodologies were highlighted:
� Failure to provide method/procedure for selecting the baseline scenario;
� Lack of clear definition of project boundary;
� Lack of justification for the appropriateness of benchmark period
� Failure to consider variables that would affect future emissions (i.e. autonomous energy efficiency improvements);
� Inadequate monitoring and verification plans;
� Deficiencies in accounting for leakage;
� Lack of distinction between discretionary retrofit, planned replacement and new equipmentprojects;
� Lack of methodological specificity to allow DOE to verify reductions.
2.8 Findings/recommendations
The following findings and recommendations were noted:
� Energy efficiency driven by CDM could help developing countries to achieve tremendous eco-nomic and sustainable development benefits of energy efficiency.
11

� Greater efforts are needed to ensure that the existing expertise, programmes and protocolsdeveloped and practised by utilities, ESCOs, technology providers and other energy efficiencystakeholders are synthesized to come up with common methodologies and best practices forSectoral Scope 3 CDM projects.
� Statistical sampling is a very important tool for energy efficiency projects to estimate baselineand project emissions. More guidance is needed on the use of such methods. Similarly,methodologies using conservative benchmarking could be a great asset in facilitating energyefficiency CDM projects.
� Rigour must be balanced against results: at present the level of rigour demanded by the EB and Meth Panel has prevented the approval of numerous industrial energy efficiency method-ologies and hence meaningful volumes of GHG emission reductions being generated fromend-use energy efficiency projects. Sometimes, getting a better estimate might be more costlythan the value of extra CERs generated.
� Using standardized PDDs would be a major facilitating factor for energy efficiency projects.
� To improve the status of demand-side energy efficiency projects, both top-down and bottom-up efforts are needed. Better quality PDDs must be developed and submitted, but guidance isnecessary from the EB/Meth Panel on key energy efficiency issues, such as the “deemed savings”approach, calculated (engineering) methods for discrete equipment/systems, sometimes in con-junction with default efficiency and other parameters, before/after metering/modeling appliedto complex energy efficiency systems; treatment of rebound effects, uncertainty, free riders, etc.,and the definition of related default abatement factors, efficiencies and other parameters.
� Greater use of measurement and verification protocols (e.g. IPMVP), energy managementstandards, evaluation guidebooks on DSM and energy audits and other technical and engi-neering tools is needed in order to improve transparency, consistency and certainty of energyefficiency methodologies and consequently, energy efficiency projects in CDM.
12

3. Keynote presentations/statements
3.1 Opening session
Mr. Dmitri Piskounov, Managing Director, UNIDO, said that IEE is a core activity of UNIDOand noted that the seminar represents another step in the dialogue on carbon mechanisms and IEEinitiated by UNIDO in 2003. He said that although the benefits of IEE are well known, IEE proj-ects represent only 3 per cent of registered CDM projects. He invited participants to consider thebottlenecks that hinder the development of demand-side energy efficiency projects and ways toovercome the high transaction costs of these projects.
Mr. John Macgregor, Ambassador, UK Trade and Investment, highlighted the increased level ofpublic and governmental concern about climate change, and said energy efficiency CDM and JIprojects represent practical avenues to addressing climate change.
Welcoming delegates, Mr. Karl Fiala, Director, CTI, highlighted Austria’s role in the CTI andnoted that the CTI brings together stakeholders for technology transfer and information dissemi-nation.
Ms. Gertraud Wollansky, Deputy Head of the Climate Unit, Federal Ministry of Agriculture,Forestry, Environment and Water Management of Austria, underscored that energy efficiency andclimate change are being discussed in numerous forums, including the UN Commission onSustainable Development. She noted that although the CDM and JI provide excellent opportu-nities for implementing energy efficiency initiatives, there are not currently many energy efficiencyprojects, and suggested participants focus on identifying opportunities to increase their number.
3.2 Keynote statement
Dr. Peter Jenkins, REEEP
Mr. Peter Jenkins, Special Representative, Renewable Energy and Energy Efficiency Partnership(REEEP), presented the activities of REEEP and processes for obtaining approval for energy effi-ciency projects under the CDM and JI. He cited three significant barriers to achieving CDM or JIstatus for energy efficiency projects: the small number of established methodologies for energy effi-ciency projects; the few business models that can be used for energy efficiency projects; and difficul-ties with ensuring adequate legal frameworks, given uncertainties surrounding the enforceability ofcontractual arrangements for some projects. He noted that REEEP sees industry as the most prom-ising sector for energy efficiency gains.
13

14
Seminar on Energy Efficiency
Projects in CDM and JI:
Transforming Markets for Energy
Peter JenkinsSpecial Representative of REEEP
Vienna, 19 March 2007
1. REEEP is one of the fastest-growing global partnershipsfor clean energy and energy efficiency
2. REEEP aims to reduce market barriers and financial obstacles forrenewables and energy efficiency systems and to improve access to energy for the poor
3. REEEP believes in action on the ground via project activitiesthat are targeted on policy improvements and innovativefinance mechanisms
REEEP is a Partnership for Delivery

15
REEEP acts as a facilitator and enabler
• Empowering locals through capacity building, trainings, awareness raising
• Providing information tools which give access to the world’s best data sources on REES, incl. technologies
• Assisting governments in implementing favorable policies, tariffs, standards and labels
• Providing finance tools to attract local and international investors, including CDM and JI
• Removing international law barriers to technology trading
REEEP is driven by regional and local demand
REEEP Regional Office East Asia
REEEP Regional OfficeLatin America &
CaribbeanREEEP Local Focal Point
MEDREPREEEP Regional Office
South Asia
REEEP Regional OfficeSouth East Asia & Pacific
REEEP Regional OfficeRussiaREEEP International
SecretariatREEEP Regional Office North America
REEEP Regional Office Central Europe
REEEP Regional Office Africa

16
The 51 REEEP projects encourage local initiatives
in 44 countries
Currently 51 projects
Locations – 44 countries
• Some projects – multiple countries
1
7
7
8
6
6
1 2
1
1
3
2
5
1
3
1
1
1
22
2
1
1
1
11
3
22
1
1
1
1
1
11
1
1
1
1
REEEP JI Project: Financing Biomass-Fuelled District
Heating Systems in Irkutsk and Khabarovsk in Russia
1. Development of a mechanism to finance new district heating plants fuelled with sustainable biomass
2. Project conducted in partnership with local and international financiers
3. The replacement of fossil fuels will reduce greenhouse gas emissions and improve air quality

17
REEEP CDM Projects: Support for Gold Standard CDM
RE/EE Projects in Southern Africa
1. Workshops in Mozambique and Tanzania to raise capacity and awareness around carbon financing
2. Financing secured for two Gold Standard projects
3. Publication and distribution of a CDM Financing Guide by SouthSouthNorth
REEEP CDM Projects: Increasing the Supply of
Gold Standard CDM Projects
1. Capacity building and coaching for project developers in Brazil, China and the Philippines
2. Training workshops/project clinics for a better understanding of the Gold Standard methodology and benefits
3. Attraction of carbon finance to Gold Standard project portfolios through “buyers’ forums” at Carbon Expos

18
1. Potential of CDM and JI not in doubt
2. Current number of EE projects in CDM and JI portfolios very low
3. Barriers to an increased share of EE in CDM and JI include• methodological complexities• lack of business models• lack of facilitating legal frameworks
4. The number of EE projects starting to grow. Most of the growth is in the industrial sector
Prospects for CDM and JI funding for Energy Efficiency
projects
REEEP International Secretariat
Vienna International Centre
Vienna, Austria
+43 26026 3425
www.reeep.org
www.reegle.info

19
3.3 Introduction of agenda, Ms. Marina Ploutakhina,UNIDO/PTC/Energy efficiency and climate change
Ms. Marina Ploutakhina, Industrial Development Officer, UNIDO, outlined the seminar agendaand noted that a wide spectrum of CDM and carbon market stakeholders were represented amongseminar participants, including developers, buyers, traders, academics and analysts of the carbonindustry.
www.unido.org

20
www.unido.org
Energy Efficiency Projectsin CDM and JI
Seminar by UNIDO/CTI/UK Trade and Investment
www.unido.org
Objectives
�
�
�

21
www.unido.org
Introducing the Agenda
�
�
�
�
�
www.unido.org
Introducing the Agenda
�
�
�
�

22
www.unido.org
Introducing the Agenda
�
�
�
�
www.unido.org
Introducing the Agenda
�
�
�
�
�

23
www.unido.org
�
�
�
�
�
Introducing the Agenda
www.unido.org
Introducing the Agenda
�
�
�
�

24
www.unido.org
Introducing the Agenda
Energy efficiency methodology issues & tools. Facilitator: Mr. Sudhir Sharma, UNFCCC SecretariatGroup 3: CHP in CDM, Facilitator: Mr. Sytze Dijkstra, WADEGroup 4: Linking Montreal and Kyoto: chiller demonstration projects & CDM, Facilitator: Mr. Stefan Kessler, InfrasGroup 5: Linking the EE & CDM/JI expert communities: CDM EE Network, Facilitator: Dr. Anne Arquit Niederberger, A+B International (Sustainable Energy Advisors)
www.unido.org
Logistics

25
www.unido.org
For more information


4. Panel session I: Overview of carbon markets
Mr. Edwin Aalders, Director, International Emissions Trading Association (IETA), moderated thediscussion and introduced panel participants.
4.1 Presentations An overview of the CDM and JI markets
Mr. Hervé Gueguen, EDF Trading
Mr. Hervé Gueguen, Environmental Product Manager, EDF Trading, provided an overview of hisorganization and presented the cumulative supply and demand of CERs and ERUs, noting the pos-sibility of CDM and JI projects exceeding demand. He said this is dependent on the number ofprojects that are successfully implemented and the number of new countries that enter the market.Gueguen explained that, as buyers, EDF Trading determines the prices of CERs and ERUs byassessing project risk.
27
Unido seminar: an overview of the CDM and JI markets
Hervé Gueguen – EDF Trading19 March 2007

28
2
EDFT carbon brief overview
• EDFT is a 100 % owned subsidiary of the EDF group, the largest power utility in Europe in charge of wholesale markets
• EDF Group has yearly EUA allowance of circa 100 Mt/y
• EDFT activity in the carbon sector revolves around the optimisation of EDF assets, the supply of risk-management services to large industrials, the procurement of carbon credits and proprietary trading
• EDFT has developed a portfolio of 40 projects in 12 countries representing a potential of over 30 MCER
• EDFT is managing a carbon fund of 290 M€– Limited to EDF affiliates (EDFE, Edison, EnBW, EDF SA)
– Backed by compliance buyers
– EDFT is the counterpart of record of project developers)
3
EU ETS
EU govts
Japan corporate
Japan govts
Other Annexe I govt
Other
CER/ERU demand from around the world
Totall == 2.22 bn tonnes

29
4
11%
36%
24%
8%
7%
3%2%
9%
Energy Efficiency
Industrial processes
Renewables
Waste
Coal handling and mining
Gas flaring reduction
Fuel switching
Other
CER/ERU supply 2000 - 2012
Totall == 2.44 bn tonnes
5
Low cost CDM project have been a catalyst
• “Low hanging fruit” such HFC 23 and N2O from chemical plant have been largely identified
• Next wave of projects will have more barrier (technological, cost…) imply new challenges
€1
HFC N2O Animal Waste
Coal Bed Methane
Landfill
855MT
€2
€3
€4
€5
Cost
Quantity

30
6
Too many CDM and JI projects ?
Cumulative CER/ERU supply and demand
0
500
1000
1500
2000
2500
3000
3500
4000
2000 2001 2002 2003 2004 2005 2006 2007 2008 2009 2010 2011 2012
EU+JP governments procurement programs
Corporate Japan
Net ETS demand
PointCarbon max supply ("total including upcoming")
PointCarbon best estimate ("risk-adjusted" supply)
MtCO2e
7
Main CER/ERU price determinants
0%
20%
40%
60%
80%
100%
0 2 4 6 8 10 12 14 16 18CDM/JI Project time to Market
CE
R/E
RU
Pu
rch
as
e P
ric
e (
% o
fg
ua
ran
tee
dC
ER
/ER
U)
Poor Credit /
CERPA terms /
Delivery timeframe
Guaranteed Delivery /
Early Delivery /
Good Credit /Registered
Projects
Unregistered
Projects
Delivered in EU
National Registry
(hypothetical)
World Bank VER
Purchases

31
8
Main CER/ERU price determinants
-
5.00
10.00
15.00
20.00
25.00
30.00
08/07/05 08/01/06 08/07/06 08/01/07
Phase 1 Phase 2
EUA price
Guaranteed Delivered
credits
CER/ERU price
Projectrisk
Constraint on CER/ERU use
Intermediarymargin
9
Thank You!
Hervé Gueguen
Telephone: +44-20-7061-4214

32
Where we stand in the market
Eva Šnajdrová
Carbon Capital Markets
Where we stand in the market
Ms. Eva Snajdrova, Carbon Capital Markets
Ms. Eva Šnajdrová, Policy Advisor, Capital Carbon Markets, outlined various CDM technologies.She highlighted the success of renewable energy CDM projects; the fact that CERs generated inAfrica may attract price premiums in the future; and the large future potential for carbon dioxidecapture and storage CDM projects. She said that when the International Transaction Law forCERs and ERUs is introduced, trading will be standardized and traded volumes will increase.

33
2
Content
• About Carbon Capital Markets
• Where we stand in the market
• Successful and less successful technologies
• Technologies not (yet) part of the market
3
Content
• About Carbon Capital Markets
• Where we stand in the market
• Successful and less successful technologies
• Technologies not (yet) part of the market

34
4
Carbon Capital Markets
• Carbon Capital Markets® (“CCM”) launched in 2005 with €16 million in
equity capital.
• CCM’s business areas are carbon emissions trading and carbon finance.
• CCM is authorised and regulated by the Financial Services Authority to
trade as principal and to undertake asset management activities.
• The successful European trading desk; over 20 million allowances traded.
5
Carbon Asset Fund
• €100m vehicle investing equity in global CDM projects
• Invests in diversified portfolio of CDM developed and registered projects
framework to generate low cost CERs
• Vertically integrated along the carbon value chain. Our activities range
from:
– Project development
– Private equity and finance
– Knowledge of CDM policy and regulations
– Local presence: employees and offices in Latin America and partnerships around the world.
– International deal origination

35
6
Content
• About Carbon Capital Markets
• Where we stand in the market
• Successful and less successful technologies
• Technologies not (yet) part of the market
7
Where we stand in the market
• Direct trades/OTC only
• No standardisation � variety of contract conditions � variety of prices
• ITL not operational (end of 2007?)
• Expected increase in liquidity and standardisation in the future

36
8
Content
• About Carbon Capital Markets
• Where we stand in the market
• Successful and less successful technologies
• Technologies not (yet) part of the market
9
Successful and less successful technologies –projects registered by CDM EB
• Renewable energy (biomass, wind, solar, hydro) - 280
• Waste mitigation projects - 152
• Energy efficiency projects – 57
• Fuel switching - 16
• Projects connected to industrial processes – 33
• LULUCF – 1
• CCS - 0

37
10
Destruction of HFC 23 - Successful technology but…
• HFC 23 is a by-product of HCFC-22 (refrigerant used in air-conditioning)
• Low cost project generating many CERs (some project almost 10mil CO2eq
annually)
• Nature magazine called it immoral – generates GHG and then destroys it
�CERs from such projects are traded at discount of around €0.20
�What if market is significantly short in the future?
�Will some projects gain price premium?
11
Content
• About Carbon Capital Markets
• Where we stand in the market
• Successful and less successful technologies
• Technologies not (yet) part of the market

38
12
Carbon Capture and Storage Projects
• Methodology submitted to CDM EB but not yet approved
• Issues to be solved
– Leakage (during and after the end of the project)
– Project and national boundary
– Long term responsibility for monitoring
• COP/MOP 2 decided to continue discussions about the issues in the
future
13
Thank you for your attention
Eva ŠnajdrováTel: +44 20 7317 6208E-mail: [email protected]

39
14
Eva ŠnajdrováLevel 3, 15 Berkeley Street
London W1J 8DY, UKPhone +44 (0)20 7317 6208 Mobile: +44 7906 012 024Fax +44 (0)20 7317 6201
eva.snajdrova@carboncapitalmarkets.comwww.carboncapitalmarkets.com

Carbon market 2007
Ms. Olga Gassan-zade, PointCarbon
Ms. Olga Gassan-zade, Managing Director, Point Carbon, discussed the outlook for the carbontrading market. She said the volume of carbon transactions is expected to increase by 50 per cent in2007, but that much of this growth will occur in the European Union Greenhouse Gas EmissionTrading Scheme (EU ETS). She explained that primary CDM projects for 2007 are expected todecrease, while secondary CDM and JI transactions are likely to increase.
Providing critical insights into energy and environmental markets www.pointcarbon.com
Carbon Market 2007
Olga Gassan-zade
Point Carbon
Vienna, 19 March 2007
40

41
Providing critical insights into energy and environmental markets www.pointcarbon.com
A sort of goodbye...
0
5
10
15
20
25
30
35
2-Ja
n-06
2-Fe
b-06
2-M
ar-0
6
2-Apr
-06
2-M
ay-0
6
2-Ju
n-06
2-Ju
l-06
2-Aug
-06
2-Sep
-06
2-Oct
-06
2-Nov
-06
2-Dec
-06
2-Ja
n-07
2-Fe
b-07
2-M
ar-0
7
•/t
0
2
4
6
8
10
12
14
Mt
CO
2
Volume EUA 2007 EUA 2008
Providing critical insights into energy and environmental markets www.pointcarbon.com
Stairway to 07
0
500
1,000
1,500
2,000
2,500
2003 2004 2005 2006 2007
forecast
Mt
CO
2e
CDM JI EU ETS Other

42
Providing critical insights into energy and environmental markets www.pointcarbon.com
CER and ERU price categories (March 2007)
n.A€ 11 – 13 4. Guaranteed delivery, seller assumes all delivery risk
€ 6 – 12€ 10 – 12 3. Firm volume, compensation upon non-delivery
€ 6 – 9€ 6 – 102. Standard off take, non-firm volume
€ 5 – 6€ 5 – 71. Non-firm volume; buyer assumes regulatory risk
JI (€/t)
CDM (€/t)
Contract category
Lower risk for the seller
Higher risk for the seller
Providing critical insights into energy and environmental markets www.pointcarbon.com
CER prices
-2.004.006.008.00
10.0012.0014.0016.00
nov.0
4jan
.05
mar.05
may.05
jul.05
sep.0
5
nov.0
5jan
.06
mar.06
may.06
jul.06
sep.0
6
Eur
o
CER non-guaranteed delivery CER guaranteed delivery
43
Providing critical insights into energy and environmental markets www.pointcarbon.com
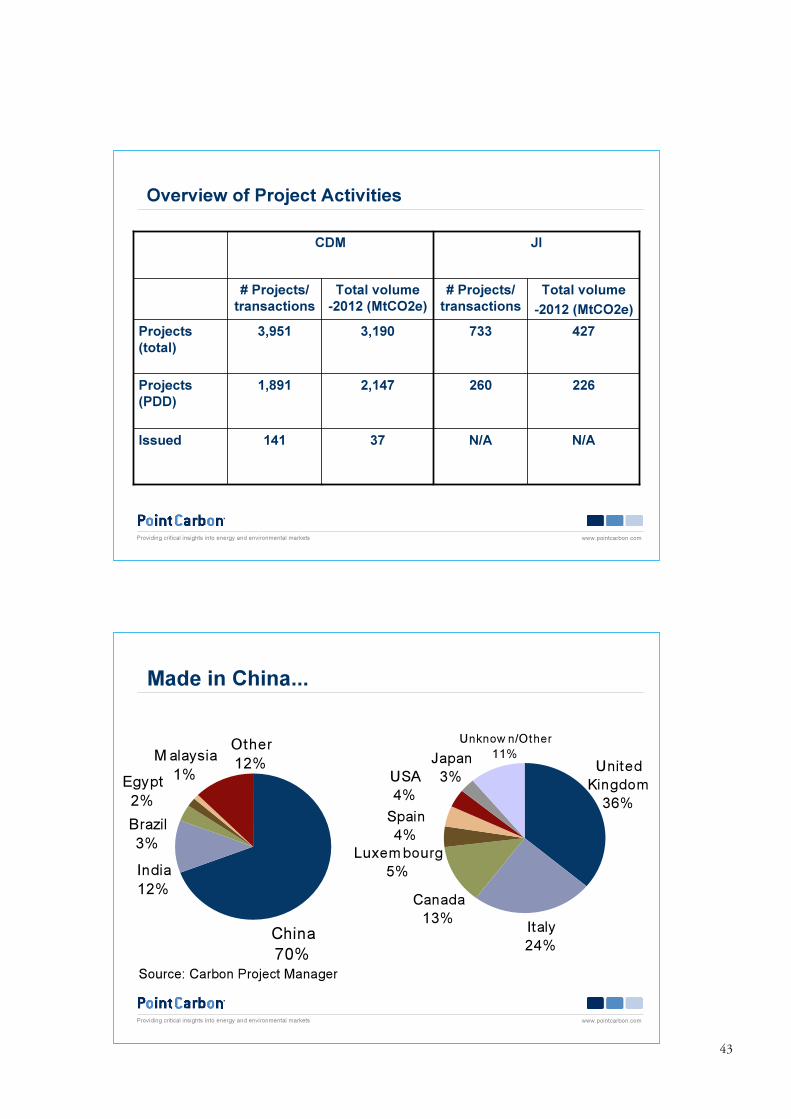
Made in China...
Italy24%
Unknow n/Other11%
United Kingdom
36%Spain4%
USA4%
Luxembourg5%
Canada13%
Japan3%
China70%
M alaysia1%Egypt
2%
Other12%
Brazil3%
India12%
Source: Carbon Project Manager
Providing critical insights into energy and environmental markets www.pointcarbon.com
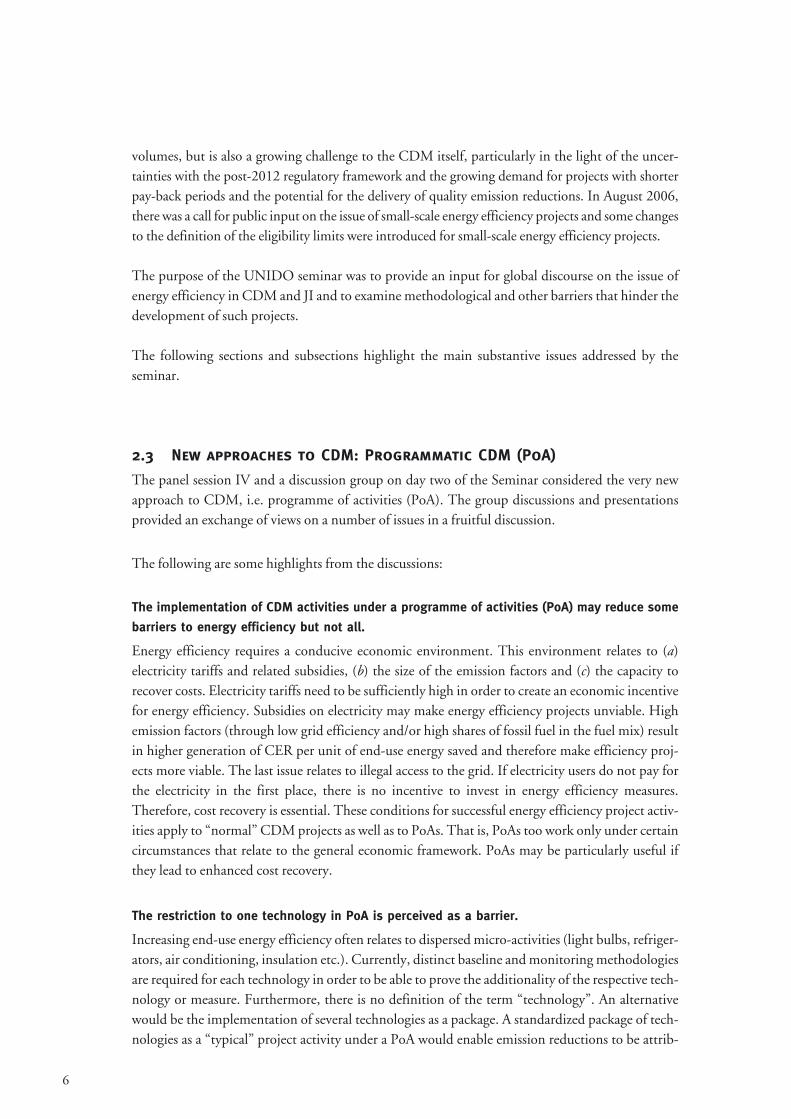
Overview of Project Activities
37
2,147
3,190
Total volume -2012 (MtCO2e)
N/A
260
733
# Projects/ transactions
JICDM
N/A141Issued
2261,891Projects (PDD)
427 3,951Projects (total)
Total volume -2012 (MtCO2e)
# Projects/ transactions

44
Providing critical insights into energy and environmental markets www.pointcarbon.com
Enough CERs/ERUs?
0%
20%
40%
60%
80%
100%
Yes N o
QQ Will the credit flows from CDM/JI projects eliminate the need for internal abatement in EU ETS phase 2?
Providing critical insights into energy and environmental markets www.pointcarbon.com
Project Types, CDM and JI
18%
27%
4%
39%
12%
EnergyEfficiency
15%
34%Industrial
18%
Renewable24%
Waste8%
LULUCF1%
Fugitive
19%2%5%
49%
22%
2% Fugitive10%
Industrial, 38%
19%
Waste12% 18%
LULUCF2%
Other1% Energy
Efficiency
Renewable
CDM JI Inner circle - # of projectsOuter circle - volume

45
Providing critical insights into energy and environmental markets www.pointcarbon.com
Prices in the long run?
0%
10%
20%
30%
40%
<€5 €5-10 €10-15 €15-20 €20-25 €25-35 >€35
Shar
e of
resp
onse
s
2010 2020
Average price:2010: €17.4/tonne2020: €23.1/tonne
Providing critical insights into energy and environmental markets www.pointcarbon.com
Has the EU ETS initialised internal abatement?
0% 10% 20% 30% 40% 50% 60% 70%
Yes
No
Do not know
2006 2007
Filter: Organisations governed by the EU ETS

Providing critical insights into energy and environmental markets www.pointcarbon.com
What do we expect in 2007
• Volumes expected to grow by 50% in
2007
• Main increase in the EU ETS – From 1,017 billion tonnes CO2 in 2006 to 1,750
billion in 2007
– Primary CDM transactions slightly down from 523 Mt
CO2e to 456 Mt CO2e in 2007
– Secondary CDM transactions and JI transactions
expected to increase considerably
46

47
Carbon market overview
Ms. Heather McGeory, Natsource
Ms. Heather McGeory, Project Manager, Natsource, explained that Natsource is one of the largestprivate sector environmental asset managers. She noted that investors have a strong interest in fuelswitching, renewable energies and non-carbon dioxide projects, and observed that as investorsbecome more experienced, they become more willing to invest in new locations and to invest forlonger terms, including post-2012.
Carbon Market OverviewCarbon Market Overview
UNIDO Industrial Energy Efficiency Projects in the CDM and JI
March 19, 2007Vienna, Austria
Natsource Asset ManagementHeather McGeory, Project Manager

48
2
Natsource OverviewNatsource Overview� Natsource’s global business is comprised of
three integrated business units:1. Asset Management2. Transaction Services3. Advisory and Research Services
� One of the largest private-sector environmental asset managers worldwide– Compliance Buyers: GG-CAP ~ $US820 million from
24 participants to purchase and manage a large pool of emissions reductions from 2005-2012
– Private Investors: Aeolus Funds and Managed Accounts in emissions and renewable energy markets to achieve superior returns for their investors
3
Investor Profile:Investor Profile:Who are our private investors? Who are our private investors?
• More US-based, non-compliance, private sector investors
• Looking for higher than average returns based on a mixture of allowances and project-based credits
• Interest in taking equity positions and buying securities
• Willing to take risks – have not shrunk away from the market when the market has dropped off

49
4
CDM Primary Market Buyers CDM Primary Market Buyers
5
Market Technologies:Market Technologies:What are investors interested in?What are investors interested in?
PAST� N2O� HFC� Non-CO2 Projects
– Landfill methane capture/destruction, Anaerobic digestion of agricultural wastes, Coal mine methane, Repair pipeline leakages, Capture/destroy process emissions; chemical process changes; capture and use of fugitive emissions
PRESENT� Fuel Switching
– fossil fuel to biomass– Ethanol and biodiesel
� Renewable Energy– Wind, Biomass, Landfill gas to energy
� Non-CO2 Projects (as above)
FUTURE� Energy Efficiency
– Generation Efficiency Upgrades, End-user efficiency upgrades� Land Use and Forestry sequestration� Mobile Source
– Fleet changes, modernization, fuel switches, biodiesel

50
6
Market Technologies:Market Technologies:January January -- December 2004December 2004
Source: “State and Trends of the Carbon Market 2006”
% of Total Volume% of Total Volume
7
Market Technologies:Market Technologies:January 2005 January 2005 -- March 2006March 2006
Source: “State and Trends of the Carbon Market 2006”
% of Total Volume% of Total Volume

51
8
CDM Project Geography:CDM Project Geography:Where have our investors been?Where have our investors been?
Source: UNFCCC 2006Source: UNFCCC 2006
9
Timeline:Timeline:What timeframe are investors What timeframe are investors
willing to transact for?willing to transact for?
• Phase One (EU ETS), Phase Two (Kyoto) and Post 2012 combinations
• Post-2012 Issues:• How to bring the current large industrial non-
participants that have refused to ratify Kyoto (i.e., U.S., Australia and Canada) under a carbon cap
• How to bring large industrializing countries under a carbon cap (i.e., China and India)

52
10
Typical CDM Transaction Structures:Typical CDM Transaction Structures:How do investors want to do deals?How do investors want to do deals?
� Forward stream of reductions credits� Payment on delivery for CERs� Transactions may include upside market
participation for sellers� Investor may also take equity positions in
or make loans to the underlying project� Invest in large projects because of fixed
transaction costs� Invest in replicable projects because of
fixed transaction costs
11
CDM Deal Structure NegotiationsCDM Deal Structure Negotiations
� Realistic expectations from seller– Firm offer price or clear price indications– Discreet negotiations – Understand prices linked to EUA indexes can have a
downside risk as well– See the value of a creditworthy buyer and the expert
assistance offered by an experienced buyer� Investor wants seller to be happy with the
commercial terms– Long term confidence of project and CER delivery
� Investor desire to do business where there is transparency and ease of doing business

53
12
In Summary:In Summary:
• Non-Compliance investors are getting more comfortable with the risks associated with the carbon market.• Willing to take Post-2012 positions • Technologies and Methodologies – as the
“low-hanging fruit” disappears, interest in biodiesel, renewables and energy efficiency has increased
• Geography – Africa, FSU• Transaction Structure – forward contracts still
most common but seeing some debt/equity structures
54
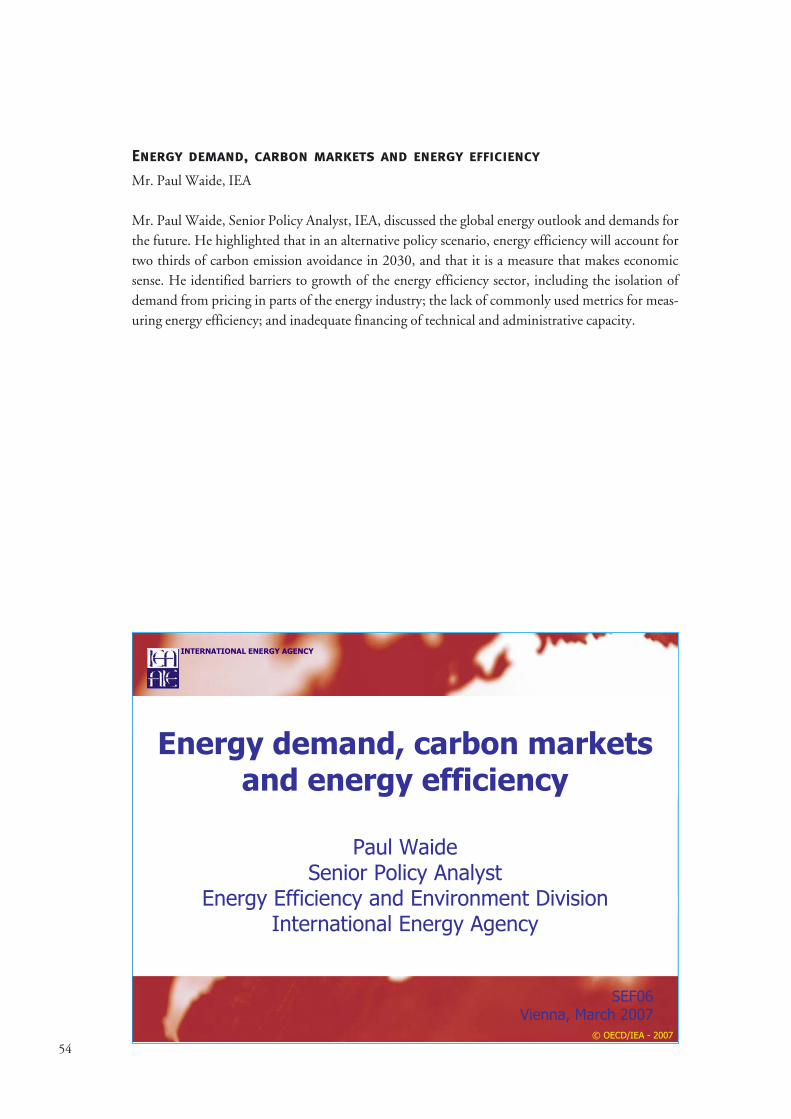
Energy demand, carbon markets and energy efficiency
Mr. Paul Waide, IEA
Mr. Paul Waide, Senior Policy Analyst, IEA, discussed the global energy outlook and demands forthe future. He highlighted that in an alternative policy scenario, energy efficiency will account fortwo thirds of carbon emission avoidance in 2030, and that it is a measure that makes economicsense. He identified barriers to growth of the energy efficiency sector, including the isolation ofdemand from pricing in parts of the energy industry; the lack of commonly used metrics for meas-uring energy efficiency; and inadequate financing of technical and administrative capacity.
INTERNATIONAL ENERGY AGENCY
Energy demand, carbon markets and energy efficiency
Paul WaideSenior Policy Analyst
Energy Efficiency and Environment DivisionInternational Energy Agency
SEF06Vienna, March 2007
© OECD/IEA - 2007

55
INTERNATIONALENERGY AGENCY
Reference Scenario: World Primary Energy Demand
Global demand grows by more than half over the next quarter of a century, with coal use rising most in absolute terms
Oil
Coal
Gas
BiomassNuclear
Other renewables
0
2 000
4 000
6 000
8 000
10 000
12 000
14 000
16 000
18 000
1970 1980 1990 2000 2010 2020 2030
Mto
e
INTERNATIONALENERGY AGENCY
Energy security concerns e.g. growing European Union Oil and Gas
Import Dependence
EU oil import dependence will reach 94% by 2030 and gas import dependence will increase
from 49% in 2002 to 81% in 2030
0
10
20
30
40
50
60
70
80
90
100
2002 2010 2020 2030
pe
r ce
nt
Gas Oil

56
INTERNATIONALENERGY AGENCY
Oil 21%
Electricity56%
Coal 3%Gas 19%
$4.3 trillion$11.3 trillion
$3.9 trillion
$0.6 trillion
Biofuels 1%
Reference Scenario: Cumulative Investment, 2005-2030
EU and European Transition Economies account for ~18%
$20.2 trillion (in $2005)
INTERNATIONALENERGY AGENCY
Reference Scenario:Energy-Related CO2 Emissions by
Fuel
Half of the projected increase in emissions come from new powerstations, mainly using coal & mainly located in China & India
Increase of 14.3 Gt (55%)
0
10
20
30
40
50
1990 2004 2010 2015 2030
billio
n ton
nes
Coal Oil Gas

57
INTERNATIONALENERGY AGENCY Improved end-use efficiency accounts for two-thirds
of avoided emissions in 2030 in the APS
Increased nuclear (10%)
Power sector efficiency & fuel (13%) Increased renewables (12%)
Electricity end-use efficiency (29%)
Fossil-fuel end-use efficiency (36%)
26
30
34
38
42
Alternative Policy Scenario
Reference Scenario
2004 2010 2015 2020 2025 2030
Gtof
CO 2
Alternative Policy Scenario: Key Policies for CO2 Reduction
INTERNATIONALENERGY AGENCY
Alternative Policy Scenario:Cost Effectiveness of Policies
� Total energy investment – from production to consumption
– is lower than in the RS
� Consumers spend $2.4 trillion more in 2005-2030 in more
efficient cars, refrigerators etc
� ..but over $3 trillion less investment is required on the
supply side
� Each $1 invested in more efficient electrical appliances saves $2.2 in investment in power plants & networks
� Each $1 invested in more efficient oil-consuming equipment (mainly cars) saves $2.4 in oil imports to 2030
� The higher initial investment by consumers is more than
offset by fuel-cost savings

58
OF ENERGY USEIN IEA COUNTRIES
Oil
Crises &
Climate
Challenges
Actuall energyy usee andd hypotheticall Actuall energyy usee andd hypotheticall energyy usee withoutt savings:: OECDenergyy usee withoutt savings:: OECD--1111
Without energy savings achieved since 1973 energy demand in 1998 would have been 50% higher
Actual energy use
Additional energy
use without
savings
0
20
40
60
80
100
120
140
160
1973 1975 1977 1979 1981 1983 1985 1987 1989 1991 1993 1995 1997
exajo
ule
s
50%
INTERNATIONAL ENERGY AGENCY AGENCE INTERNATIONALE DE L’ENERGIE
Avoiding 1 billion tons of CO2 per year
To meet the energy demand & stabilize CO2 concentrations unprecedented technology changes must occur in this century
CoalCoal
CO2 SequestrationCO2 Sequestration
NuclearNuclear
WindWind
Solar PVSolar PV
Replace 300 conventional, 500-MW coal power
plants with “zero-emission” power plants, or ...
Replace 300 conventional, 500-MW coal power
plants with “zero-emission” power plants, or ...
Install 200 x current US wind generation in lieu
of unsequestered coal
Install 200 x current US wind generation in lieu
of unsequestered coal
Install 1300 x current US solar generation in lieu
of unsequestered coal
Install 1300 x current US solar generation in lieu
of unsequestered coal
Install 1000 Sleipner CO2 sequestration plantsInstall 1000 Sleipner CO2 sequestration plants
Build 140 1-GW power plants in lieu of
unsequestered coal plants
Build 140 1-GW power plants in lieu of
unsequestered coal plants

59
© OECD/IEA - 2006
2 0 0 6
ENERGYTECHNOLOGY
PERSPECTIVES
Scenarios &Strategies
to 2050
Energy Technology PerspectivesGlobal CO2 Emissions 2003-2050
0
10 000
20 000
30 000
40 000
50 000
60 000
2003 Baseline
2030
Baseline
2050
Map No CCS Low
Effic iency
TECH Plus
2050
Other
Buildings
Transport
Industry
Transformation
PowerGeneration
ACT Scenarios 2050
-16%
+137%
+6%
+21%+27%
Mt CO2
© OECD/IEA - 2006
2 0 0 6
ENERGYTECHNOLOGY
PERSPECTIVES
Scenarios &Strategies
to 2050
Emission Reduction by Technology AreaACT Map Scenario
Other renewables
Biomass
Fossil fuel generation
efficiency
Nuclear
Coal to gas
Hydropower
CCSPower
generation
End-use
efficiency
Biofuels in transport
CCS in fuel
transformation
CCS in industry
Fuel mix in buildings
and industry

60
INTERNATIONAL ENERGY AGENCY AGENCE INTERNATIONALE DE L’ENERGIE
The market does not fully deliver cost-effective savings autonomously
The market The market does notdoes not fully deliver fully deliver
costcost--effective savings autonomouslyeffective savings autonomously
�� Missing or partial information on EE Missing or partial information on EE performance and lack of common metricsperformance and lack of common metrics
�� Lack of awareness re costLack of awareness re cost--effective savings effective savings
potentialspotentials
�� Split incentives: LandlordSplit incentives: Landlord--Tenant issueTenant issue
�� EE often a minor determinant of capitalEE often a minor determinant of capital--acquisition decisions acquisition decisions
�� EE is bundledEE is bundled--in with more important capital in with more important capital decision factorsdecision factors
�� All result in emphasis on 1All result in emphasis on 1stst not Lifenot Life--cycle costscycle costs
INTERNATIONALENERGY AGENCY
Role for carbon finance?
� Help fund the transition to more sustainable energy choices, uses and practices
� Promoting energy efficiency should be the highest priority
� Finance is needed for technical and administrative capacity and infrastructure as much as for incremental technology costs
� Much stronger coordination needed between international assistance schemes
� Simpler and more transparent project support mechanisms required

61
4.2 Discussions
Participants focused on speculation surrounding post-2012 prices and Ms. Eva Šnajdrová cited thedecision of the EU to reduce its emissions by 20 per cent by 2012 as an important signal to indus-try. On questions from participants from non-Annex I countries regarding the types of CDM andJI projects to focus on, panellists suggested, inter alia, developing appropriate institutions and let-ting the market decide; reviewing approved methodologies and selecting the most appropriate; andtaking note of the general interest in increasing the number of energy efficiency projects.


5. Panel session II: Status of energyefficiency under CDM and JI
Marina Ploutakhina moderated the discussion and introduced panel participants.
5.1 Presentations
Status and overview: Energy efficiency in CDM & JI
Mr. Adrian Lema, UNEP Risoe Centre on Energy, Climate and Sustainable Development
Mr. Adrian Lema, Research Assistant, UNEP Risø Centre on Energy, Climate and SustainableDevelopment, outlined the data collated on CDM and JI projects currently in the pipeline. He saidthat as of 14 March 2007, 1743 projects were in the pipeline and that energy efficiency projectswould generate 7.3 per cent of the total CERs until 2012. He explained that 91 per cent of the 194energy efficiency projects in the CDM pipeline are located in China or India, and that the iron,steel and cement industries account for more than half of all energy efficiency projects.
63
Status and Overview:
Energy Efficiency in CDM & JI
Energy Efficiency Projects in CDM and JI
Vienna, 19th – 20th March, 2007
Adrian LemaUNEP Risoe Centre, Denmark

64
Contents• CDM projects
• Overview
• Sectoral distribution
• Geographical distribution
• CDM Energy efficiency projects
• Definitions
• Methods
• EE Industry Sub-Sectors
• Demand side projects
• JI projects
• Overview
• EE projects in JI
Status of CDM projects: 1727 in the pipelineStatus Number
At validation 1047
Request for registration 108
Request for review 10
Correction requested 10
Under review 5
Total in the process of registration 133
Withdrawn 4
Rejected by EB 12
Registered, no issuance requested 391
Registered, request for CERs 16
Registered, correction requested 1
Registered, request for CER issuance review 1
Registered, under review 0
Registered. CER issued 138
Total registered 547
Total number of projects (incl. rejected & withdrawn) 1743

65
Small-scale projects• 962 projects in the pipeline are small-scale
• 56 % of all CDM projects are small-scaleProject types Small-scale CDM project activity categories Number
Type I: A. Electricity generation by the user 13
Renewable B. Mechanical energy for the user 4
energy projects C. Thermal energy for the user 75
<15 MW D. Renewable electricity generation for a grid 506
Type II: A. Supply side energy efficiency improvements - transmission and distribution 0
Energy efficiency B. Supply side energy efficiency improvements - generation 13
improvement C. Demand-side energy efficiency programmes for specific technologies 8
projects D. Energy efficiency and fuel switching measures for industrial facilities 63
E. Energy efficiency and fuel switching measures for buildings 14
<60 GWh savings F. Energy efficiency and fuel switching measures for agricultural facilities and activities 1
Type III: A. Agriculture (no methodologies available) 0
B. Switching fossil fuels 22
EB27: C. Emission reductions by low-greenhouse emission vehicles 2
<60 ktCO2 D. Methane recovery 167
reduction E. Avoidance of methane production from biomass decay through controlled combustion 47
F. Avoidance of methane production from biomass decay through composting 7
G. Landfill methane recovery 1
H. Methane recovery in wastewater treatment 17
I. Avoidance of methane production in wastewater treatment through replacement of anaerobic lagoonsby aerobic systems 1
J. Avoidance of fossil fuel combustion for carbon dioxide production to be used as raw material for
industrial processes 0
K. Avoidance of methane release from charcoal production by shifting from pit method to mechanized
charcoaling process 1Note: some projects use more than one category. 962
Number of CDM projects in each sector
Renewables
59%
HFCs, PFCs
& N2O
reduction
2%
Fuel switch
4%
Energy
efficiency
13%
Afforestation
&
Reforestation
0%
CH4 reduction
& Cement &
Coal mine/bed
22%
Type Number CERs/yr (000)
HFCs, PFCs & N2O reduction
41 2% 123189 40%
CH4 reduction & Cement & Coal mine/bed
372 22% 64583 21%
Renewables 1015 59% 71885 24%
Energy efficiency 230 13% 23835 7,8%
Fuel switch 63 4% 20682 7%
Afforestation &Reforestation
6 0% 615 0%

66
Large emerging countries dominate the pipeline
• China has 370 projects in the pipeline (21.4 %)
• India has 586 projects in the pipeline (33.9 %)
• Brazil has 219 projects in the pipeline (12.7 %)
• These three countries account for 74.6 % of CERs to be issued by 2012
Total in the CDM Pipeline Number kCERs 2012 kCERs
Latin America 518 30,0% 49296 319182 16,9%
Asia & Pacific 1145 66,3% 237226 1450070 76,8%
Europe and Central Asia 16 0,9% 941 5668 0,3%
Sub-Sahara Africa 25 1,4% 11189 75294 4,0%
North Africa & Middle-East 23 1,3% 6138 36879 2,0%
Total 1727 100% 304789 1887093 100%
EE definitions in CDM/JI Pipeline• EE covers industry, supply side, households and service (+
distribution and transport)
• EE Industry covers both demand-side efficiency and generation projects at industrial facilities (e.g. co-generation).
• EE Industry is distributed on 17 sub-sectors in the CDM/JI Pipeline
• The UNFCCC ”sectoral scopes” are translated into ”Types” in the CDM/JI Pipeline
Sectoral Scope UNEP Risoe CDM/JI Pipeline Types
Energy distribution (2) Energy distribution
Energy demand (3) EE households. EE service. EE industry
Manufacturing industries (4) EE industry. EE supply. Cement. Fossil fuel switch. Biomass energy

67
Energy efficiency, Supply side
ACM7 Conversion from single cycle to combined cycle power generation 4
AM14 (ver 2) Natural gas-based package cogenereation 40
Energy efficiency, Industry:
AM17 (ver 2) Steam system efficiency improvement by replacing steam traps and returning condensate 0AM18 Baseline methodology for steam optimization systems 12
ACM3 (ver 4) Emission reduction through partial substitution of fossil fuels with alternative fuels in cement 9
ACM4 (ver 2) Waste gas and/or heat for power generation 109
AM32 Waste gas or waste heat based cogeneration system 0
AM24 Waste gas recovery and utilization for power generation at cement plant 3
AM38 Improved electrical energy efficiency of an existing submerged electric arc
furnace used for the production of SiMn
1
AM44 Energy efficiency improvement projects: boiler rehabilitation or replacement in industrial and district
heating sectors
0
Energy efficiency, Households:
AM46 Replacement of incandescent lamps by compact fluorescent lamps
Energy efficiency, Service:
AM20 Water pumping efficiency improvement 0
1F. Energy efficiency and fuel switching measures for agricultural facilities and activities<60 GWh
savings
14E. Energy efficiency and fuel switching measures for buildings
63D. Energy efficiency and fuel switching measures for industrial facilities
8C. Demand-side energy efficiency programmes for specific technologies
13B. Supply side energy efficiency improvements - generation
Energy
Efficiency
Improvement
projects
0A. Supply side energy efficiency improvements - transmission and distribution Type II:
Largescale
Smallscale
EE Industry distributed by 17 sub-sectors
0
10
20
30
40
50
60
70
80
Iro
n &
ste
el
Ce
me
nt
Pe
tro
ch
em
ica
ls
Ch
em
ica
ls
Pa
pe
r
Co
ke
ove
n
Ele
ctr
on
ics
Fo
od
Bu
ild
ing
ma
teri
als
No
n-f
err
ou
sm
eta
lsG
lass
Ma
ch
ine
ry
Min
ing
Te
xtile
s
Co
nstr
uctio
n
Me
tal p
rod
ucts
Wo
od
EE Industry
sectors
At
Validation
Request
registration Registered Total MW
Iron & steel 43 6 20 69 1610Cement 23 5 6 34 371Petrochemicals 10 2 7 19 26Chemicals 10 3 6 19 61Paper 6 1 5 12 0Coke oven 11 1 2 14 294Electronics 2 0 2 4 5Food 5 1 0 6 22Building
materials 1 0 2 3 0Non-ferrous
metals 1 2 0 3 9Glass 4 0 0 4 0Machinery 3 0 0 3 0Mining 0 1 0 1 0Textiles 2 0 1 3 16Construction 0 0 0 0 0Metal products 0 0 0 0 0Wood 0 0 0 0 0
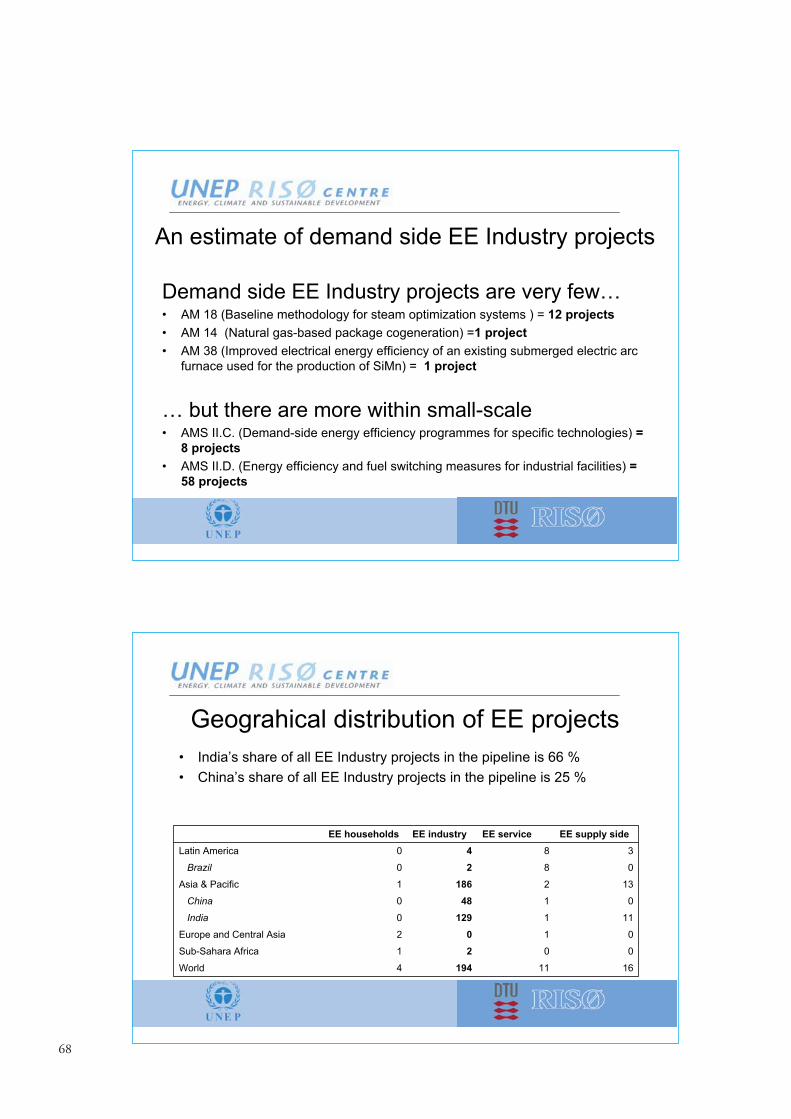
68
An estimate of demand side EE Industry projects
Demand side EE Industry projects are very few…• AM 18 (Baseline methodology for steam optimization systems ) = 12 projects
• AM 14 (Natural gas-based package cogeneration) =1 project
• AM 38 (Improved electrical energy efficiency of an existing submerged electric arc furnace used for the production of SiMn) = 1 project
… but there are more within small-scale• AMS II.C. (Demand-side energy efficiency programmes for specific technologies) =
8 projects
• AMS II.D. (Energy efficiency and fuel switching measures for industrial facilities) =
58 projects
Geograhical distribution of EE projects
• India’s share of all EE Industry projects in the pipeline is 66 %
• China’s share of all EE Industry projects in the pipeline is 25 %
EE households EE industry EE service EE supply side
Latin America 0 4 8 3
Brazil 0 2 8 0
Asia & Pacific 1 186 2 13
China 0 48 1 0
India 0 129 1 11
Europe and Central Asia 2 0 1 0
Sub-Sahara Africa 1 2 0 0
World 4 194 11 16

69
Status of JI Track II projects: 155 in the pipelineStatus of CDM projects Number
Early movers 111
At determination 43
Request for registration 1
Request for review 0
Correction requested 0
Under review 0
Total in the process of registration 1
Withdrawn 0
Rejected by EB 0
Registered, no issuance requested 0
Registered, request for CERs
Registered, correction requested
Registered, request for CER issuance review
Registered, under review
Registered. CER issued
Total registered 0
Total number of projects (incl. rejected & withdrawn) 155
Renewables
47%
CH4
reduction &
Cement &
Coal
mine/bed
25%
Energy
efficiency
20%
Fuel switch
5%
HFCs, PFCs
& N2O
reduction
2%
Afforestation &
Reforestation
1%
Geographical distribution of JI projectsTotal Number kERUs 2012 kERUs
Russia & Ukraine 48 31% 18965 94174 66%
Russia 31 20% 14468 72446 51%
Ukraine 17 11% 4497 21728 15%
Eastern Europe 99 64% 8968 44890 31%
Bulgaria 20 13% 3245 16224 11%
Czech Republic 21 14% 814 4070 3%
Romania 15 10% 1590 8093 6%
Poland 13 8% 802 3971 3%
Hungary 11 7% 1437 7078 5%
Estonia 11 7% 602 3063 2%
Latvia 0 0% 0 0 0%
Lithuania 5 3% 193 966 1%
Slovakia 3 2% 285 1425 1%
Others 8 5% 705 3525 2%
Germany 3 2% 194 972 1%
New Zealand 5 3% 511 2553 2%
Total JI countries 155 100% 28638 142589 100%

70
Geographical distribution of EE projects in JIEE households EE industry EE service EE supply side
Russia & Ukraine 0 5 0 4
Russia 0 2 0 4
Ukraine 0 3 0 0
Eastern Europe 1 7 0 5
Bulgaria 1 4 0 2
Czech Republic 0 0 0 0
Romania 0 2 0 3
Poland 0 0 0 0
Hungary 0 1 0 0
Estonia 0 0 0 0
Latvia 0 0 0 0
Lithuania 0 0 0 0
Slovakia 0 0 0 0
Others 0 0 0 0
Germany 0 0 0 0
New Zealand 0 0 0 0
Total JI countries 1 12 0 9
Source: CDM/JI Pipeline Overview, Unep Risoe Centre, 14th March 2007
For more information:
www.uneprisoe.org or www.cd4cdm.org
Ph. +45 4677 5177

71
The Status of Energy Efficiency:Approved methodologies and
lessons learned Sudhir Sharma
UNFCCC
The Status of energy efficiency: Approved methodologies and lessonslearned
Mr. Sudhir Sharma, UNFCCC Secretariat
Mr. Sudhir Sharma, Programme Officer, UNFCCC Secretariat, presented on approved supplyand demand-side energy efficiency methodologies and lessons learned. On the demand side, heoutlined two methods for defining reductions, namely, the “black box” approach, involving theratio of energy output to energy input, and theoretical modelling. He said the key challengesinclude differentiating between project-related gains and business as usual gains; identifyingboundaries to isolate the effects on efficiency of processes under consideration; and how to addressefficiency due to load variations.

72
2
Contents
I. Key CDM Statistics
II. Approved methodologies
III. Key issues in Energy Efficiency Methodology
IV. Structure of CDM Secretariat
V. Information sources CDM
3
Score Board: CDM
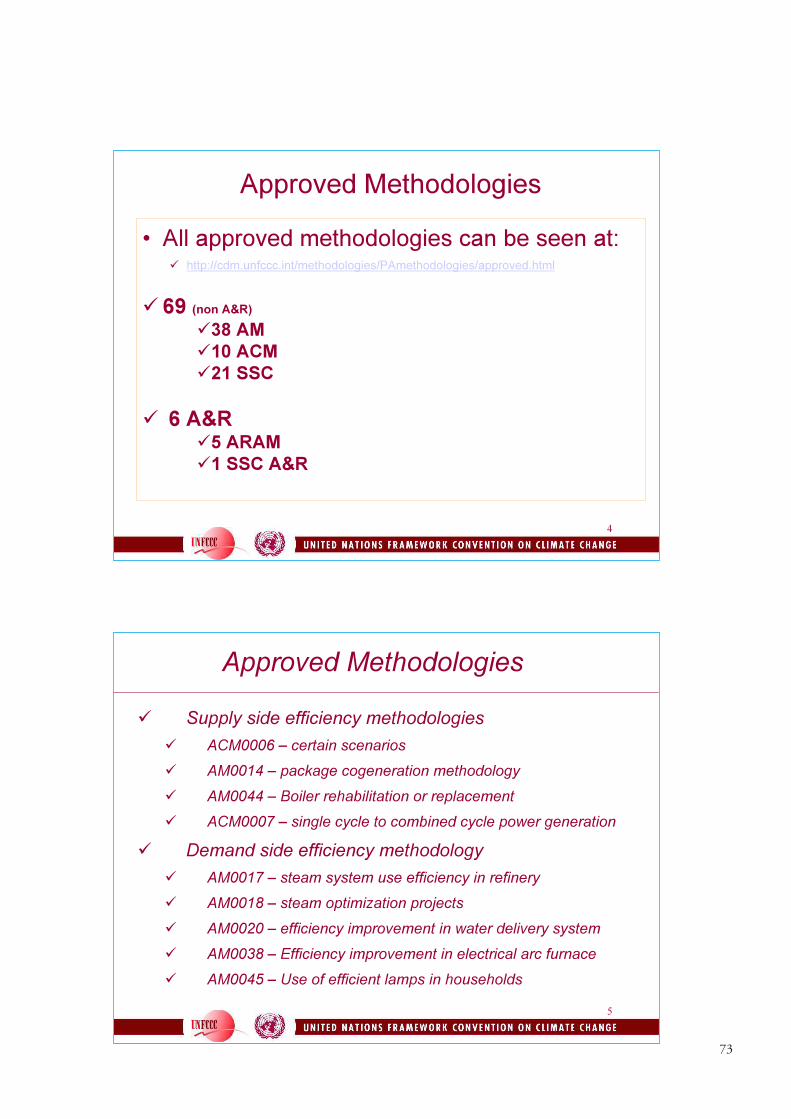
73
4
Approved Methodologies
• All approved methodologies can be seen at:� http://cdm.unfccc.int/methodologies/PAmethodologies/approved.html
� 69 (non A&R)
�38 AM�10 ACM�21 SSC
� 6 A&R�5 ARAM�1 SSC A&R
5
Approved Methodologies
� Supply side efficiency methodologies � ACM0006 – certain scenarios
� AM0014 – package cogeneration methodology
� AM0044 – Boiler rehabilitation or replacement
� ACM0007 – single cycle to combined cycle power generation
� Demand side efficiency methodology� AM0017 – steam system use efficiency in refinery
� AM0018 – steam optimization projects
� AM0020 – efficiency improvement in water delivery system
� AM0038 – Efficiency improvement in electrical arc furnace
� AM0045 – Use of efficient lamps in households

74
6
Key challenges in EE methodologies (1)
• Defining reductions in Industrial DSM meths
�Black Box Approach:
– EE defined as ratio of energy output to energy input
in the part of the process/equipment where EE
measure implemented.
�Theoretical models:
– Gains based not on actual changes in energy
consumption but theoretical estimates.
– Difficult to isolate and measure actual energy input,
output to system under consideration.
7
Key challenges in EE methodologies (2)
�Differentiating b/n project related gains and BAU gains.
�Identifying system boundaries to isolate outside effects on efficiency of process/equipment under consideration.
�Addressing efficiency variations due to load variations.
�Issue of signal to noise ratio (more relevant of theoretical models).
�Rebound effect – accounting for emission leakages due to rebound affect.

75
8
Key challenges in EE methodologies (3)
• Small scale appliance project activities
�Linkage between project activity and emission reductions.
�Additionality/real reductions – Identifying free riders
– Those who would have anyway used the appliance.
– Those who are part of other diffusion programs.
�Monitoring – robust sampling procedures
– to assess actual impact on energy consumption.
– Monitoring whether the equipment is operational and in use.
9
Structure of CDM Secretariat
CDM EBCDM EB
Methodology Unit
Registration & Issuance Unit
AccreditationPanel SU
CDM EB Secretary &
Management
Other Support Units
Methodology Panel SU
SSC WG SU
ARWG SU

76
10
INFORMATION SOURCEKeep up to date
�CDM project search (http://cdm.unfccc.int/Projects/projsearch.html)
� Interactive map with registered project activities (http://cdm.unfccc.int/Projects/MapApp)
�UNFCCC CDM website (http://unfccc.int/cdm)
�UNFCCC CDM News Facility (Requirement to register as a
UNFCCC CDM web site user (join) -> automatically subscribed)
�CDM EB meetings are web cast (internet),
�Reports of the EB to COP/MOP
11
Thanks
Contact: [email protected]
We Invite you to be on our Roster of
Experts – one can apply through http://cdm.unfccc.int/Panels/meth/CallForExperts

77
Joint implementation
and energy efficiency
Daniela Stoycheva – BulgariaMember of the JISC
Joint Implementation and energy efficiency
Ms. Daniela Stoycheva, JISC
Ms. Daniela Stoycheva, Member, Joint Implementation Supervisory Committee (JISC), explainedhow the JISC is similar to the CDM EB and said that it expects to receive 125 new project designdocuments in 2007. She stated that energy efficiency projects comprise 25 per cent of the totalnumber of JI projects and account for 49 per cent of ERUs generated by JI projects. She also high-lighted the capture of fugitive emission gases as an area for future growth.

78
Joint implementation
• Art. 6 of the Kyoto Protocol – “For the purpose of meeting their commitments under art. 3, any Party included in Annex I may transfer to, or acquire from, any other such Party emission reduction units resulting from projects aimed at reducing anthropogenic emissions by sources or enhancing anthropogenic removals by sinks of greenhouse gases in any sector of the economy…”
Requirements for participation in Track 2 / Track 1
– Marrakech accords eligibility criteria:
� Party to the Kyoto Protocol; � has calculated and recorded its AAUs; � has in place a national registry;============ JISC =================� has in place a national system for estimation of GHG’s; �submits annually GHG inventory report; � has submitted supplementing information on AAUs.

79
Potential of JI projects• Host countries: Russia is estimated to have the
greatest JI potential (600 Mt CO2 per annum) followed by the Ukraine (150 Mt CO2 p.a.). Poland and Romania are the next biggest players (94-100 Mt CO2 per year), with Bulgaria ranking fifth (11-20 Mt CO2 per year)
• Buyers: EC countries the largest purchasers Japan is the second largest buyer
• Imbalance sectoral distribution of JI projects in the pipeline hydro and wind projects are strongly prevalent as are methane gas and biomass energy projects, followed by EE (manufacturing industries, district heating). In contrast, there are only a very limited number of afforestation, agriculture, coal bed/methane, and EE household projects.
• In EU member states• In non EU states• International emission trading - GIS
Number of expected JI projects by country
Host country for JI projects Number of kERUs Number of kERUsProjects per year Projects per year
Russia 28 13912 16 11145Bulgaria 21 3297 3 327Czech Republic 21 814 0 0Ukraine 17 2900 3 991Romania 16 2054 2 223Poland 13 802 3 192Hungary 11 1437 1 141Estonia 11 602 3 212New Zealand 5 511 0 0Lithuania 5 193 3 104Slovakia 3 285 0 0Germany 3 224 0 0Latvia 0 0 0 0Total 154 27031 34 13335
All JI tracks JI Track 2
Source : UNEP/Risoe database www.cd4cdm.org (12 February, 2007)

80
% of the number of JI projects in
different sectors /UNEP Risoe data/
Number of JI projects %
Afforestation &
Reforestation
1%
Fossil fuel
switch
5%
Renewables
48%
Energy
Efficiency
25%
HFCs, PFCs &
N2O reduction
2%
CH4 reduction
& Cement &
Coal mine/bed
19%
Source : UNEP/Risoe database www.cd4cdm.org (12 February, 2007)
% annual ERUs from JI projects
in different sectors
Annual ERUs from JI projects
Energy
Efficiency
49%HFCs, PFCs &
N2O reduction
7%
CH4 reduction
& Cement &
Coal mine/bed
12%
Fossil fuel
switch
9%
Renewables
23%
Afforestation &
Reforestation
0%
Source : UNEP/Risoe database www.cd4cdm.org (12 February, 2007)Source : UNEP/Risoe database www.cd4cdm.org (12 February, 2007)

81
JI project status in RussiaProject status Number Volume until 2012[tCO2e]
• ERPAs signed 6 16,000,000 • Projects with LoAs 0 0
• Projects at PDD stage 32 84,600,000 • Projects with LoEs 33 34,000,000
– 123 projects at different stages!
Project types (PDDs) Number Volume until 2012[tCO2e]
• Energy efficiency 10 6,700,000 • Fuel switch 5 7,614,000• Renewable energy 7 8,700,000
• Fugitives 9 56,900,000 • Waste 3 4,700,000
� But no DNFP, no national quidance, no LoA
Source: Point Carbon March 2007
JI project status in Ukraine
Project status Number Volume [tCO2e]
• ERPAs signed 5 3,400,000• Projects with LoAs 5 14,900,000• Projects at PDD stage 17 23,200,000• Projects with LoEs 49 54,700,000
– 116 projects overall on different stages!
Project types (PDDs) Number Volume [tCO2e]
• Energy efficiency 5 2,730,000• Fugitive emissions 5 13,380,000• Industrial processes 1 3,087,702 • Renewables 2 1.630.432 • Waste 4 2,249,083
� DNFP, national guidance, LoA, first project to JISC
Source: Point Carbon March 2007

82
EE related PDDs submitted to
JISC – 9 of 40
1.“Rehabilitation of the District Heating System in Donetsk
Region”, Ukraine
2. “Improvement of efficiency of power generation by Bratsk Hydropower Plant, Irkutsk Oblast ”, RF
3. GHG emission reduction through energy efficiency improvement in the communal heating system of Zima town, Irkutsk Oblast, RF
4.Introduction of energy efficiency measures at ISTIL mini steel mill, Ukraine
5. Murmansk District heating Rehabilitation, RF
6.Turceni Energy Efficiency Project, Lithuania
7. Energy conservation at Khimki DHC, RF
8.District Heating System Upgrade and Rehabilitation, Romania
9. Rehabilitation of Dolna Arda Hydropower Cascade, Bulgaria
Main obstacles to EE JI
projects
• Buyers prefer “low hanging fruit”
• Higher transaction cost
• More complicated monitoring
• Higher investment cost
• Public sector (ownership)
• National quidelines
But EE JI projects have more benefits like new technologies, social and environmental

83
JI Supervisory committee
JISC – Track 2 JI
• Decisions 9/CMP.1 (JI guidelines from Marrakech Accords) and 10/CPM.1 (Montreal decision)
• JISC established
• Results – in 9 mounts JI Track 2 launched – 26 October 2006
• Decisions 2 and 3 / CMP.2 (Nairobi decisions)
• From procedural to operational
JISC’s Work programme– Development of rules of procedure
– Development of JI PDD
– Establishment of accreditation system
– Development of guidelines on criteria for baseline setting and monitoring
– Development of procedures for making PDDs, monitoring reports and determination reports publicly available
– Development of procedures for review of
determinations
– Development of procedures for charging fees
– Development of management plan
– Accreditation of IEs (10/25)
– Appraisal/Review of projects (1/40/125)


85
Seite 1 25.06.2007
Panel 2 - Status of Energy Efficiencyunder CDM and JI
Industrial Energy Efficiency Projects in the CDM and JI, UNIDO
Vienna, 19 and 20 March, 2007
Gertraud Wollansky, BMLFUW
Small-scale CDM energy efficiency project activities
Ms. Gertraud Wollansky, BMLFUW
Ms. Gertraud Wollansky discussed small-scale (SSC) energy efficiency CDM project activities andexplained that as a result of the small number of projects being registered, a call for public input hadbeen launched. She noted barriers to attaining registration of energy efficiency CDM projects,including that the 15 Gigawatts hour (GWh) limit for SSC projects affects the financial viability ofenergy efficiency projects given their transaction costs; the emissions reductions are low when com-pared with other SSC categories; CER generation is too small to attract carbon funds; and paybackperiods of more than 2.5 years are not attractive to non-Annex I countries. She explained that theSSC limit had been increased to 60 GWh and encouraged participants to consider if this is sufficient.

86
Seite 2 25.06.2007
Small Scale CDM Energy Efficiency project
activities
� Barriers for SSC Energy Efficiency project activities
� Small scale limits – Revision at CMP2
Seite 3 25.06.2007
Barriers to EE project activities (1)
�The Executive Board at 25th meeting noted that very few SSC CDM project activities under type II (energy efficiency) wereregistered
�EB therefore launched a call for public inputs on the followingquestions:
a) Does the current definition (15 GWh) of type II SSC CDM projectactivities pose barriers to developing projects under this type?
b) Are there other barriers in this regard that relate to methodologicalissues?

87
Seite 4 25.06.2007
Barriers to EE project activities (2)
Results of the call for public input:
Question a)
�Definition according to CMP1 decision (limit of 15 GWh) is a barrier, as transaction costs are too high and make SSC type II projects financially unviable
�Average expected emission reductions of the 4 registered type II project activities 6300 t CO2/y, range from 3400 to 12000 t/y
�CER generation too small to be attractive for Carbon Funds
�Suggestions: introduce common threshold of CERs (30 or 50 kt) for all SSC project activities, increase GWh limit
Seite 5 25.06.2007
Barriers to EE project activities (3)
Results of the call for public input:
Question b)
�Pay back period of more than 2,5 years not attractive for industriesin DCs, increasing limit could help
�Other barriers not related to the CDM, even for EE measures thatare financially viable

88
Seite 6 25.06.2007
Barriers to EE project activities (4)
Suggestions for revision of SSC type II methodologies
�Change provision that leakage has to be considered if the energyefficiency technology is equipment transferred from another activityor if the existing equipment is transferred to another activity –unrealistic, because it is not possible to keep track of equipment
�Lack of methodologies to address improvements of the EE of systems across sectors, not discrete equipment
�Lack of specificity in SSC methodologies for type II projects, whichcreates need for better guidance on methodological issues commonto EE projects
Seite 7 25.06.2007
Barriers to EE project activities (5)
Suggestions for revision of SSC type II methodologies (cont.)
�Improvements of the monitoring aspects to make them less strictand costly
�Introduce programmatic CDM
�Open CDM up for standards and labelling programmes
�Less frequent revisions of methodologies

89
Seite 8 25.06.2007
Change of limits for SSC projects (1)
�Request by CMP 1 to Executive Board to make a recommendation forthe revision of the limits for the SSC categories
�SSC Working Group made a proposal to EB on revision of Type II and Type III limits, based on public input and work done in the SSC WG
�Considerations of SSC WG:
-Energy saving to be obtained by avoiding consumption of an equivalent of 15 MW is in the order of 100 GWh/y
-Typical Type II activities do not qualify as SSC, while activities with similarcapacity measured in output could qualify under Type I
-No linear correlation between GWh saved and the emission reductions of the project activity for Type II
Seite 9 25.06.2007
Change of limits for SSC projects (2)
�EB accepted the structure proposed by SSC WG with modifications to the figures (60 GWh for Type II, 60 kt emission reductions for Type III)
�Recommendation to CMP2 to revise the limit for type II and III
�By decision of CMP 2 the limit for type II was increased from 15 GWh to 60 GWh
90
Seite 10 25.06.2007
Summary
�Limit of 15 GWh was one barrier Type II project activities - however, number of other barriers were identified
�Other proposals for removing barriers have not yet been implemented in the SSC categories
A few questions:
�Was raising the limit sufficient to promote SSC Type II project activites?
�If not, what more needs to be done?
�What about energy efficiency in the non-renewable biomass context?
�What role can programmatic CDM play in SSC Type II?
�……
Seite 11 25.06.2007
DankeDanke fffüüür die Aufmerksamkeitr die Aufmerksamkeitr die AufmerksamkeitDanke

91
Energy Efficiency CDM in Georgia
Industrial Energy Efficiency Projects in the Clean Development Mechanism and Joint Implementation
(organized by UNIDO)
Marina Shvangiradze
19-20 March 2007Vienna, Austria
Energy efficiency CDM in Georgia
Ms. Marina Shvangiradze, Coordinator, Second National Communication Project of Georgia
Ms. Marina Shvangiradze, Coordinator, Second National Communication Project of Georgia, dis-cussed Georgia’s experience in energy efficiency CDM projects. She highlighted successes in vari-ous projects including projects to increase the efficiencies of turbines at the Engury Hydro PowerPlant; replace and refurbish gas transmission pipelines; and increase pump efficiencies in municipalwater supply systems.
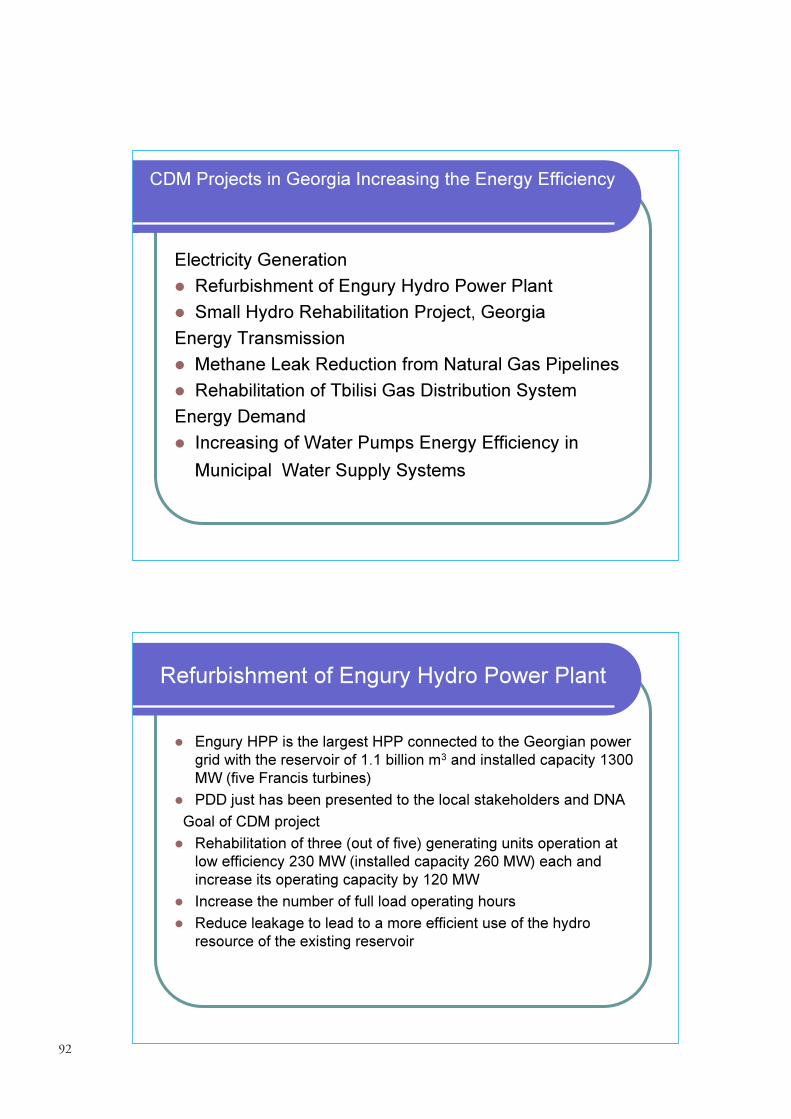
92
CDM Projects in Georgia Increasing the Energy Efficiency
Electricity Generation� Refurbishment of Engury Hydro Power Plant� Small Hydro Rehabilitation Project, GeorgiaEnergy Transmission� Methane Leak Reduction from Natural Gas Pipelines� Rehabilitation of Tbilisi Gas Distribution SystemEnergy Demand� Increasing of Water Pumps Energy Efficiency in
Municipal Water Supply Systems
Refurbishment of Engury Hydro Power Plant
� Engury HPP is the largest HPP connected to the Georgian power grid with the reservoir of 1.1 billion m3 and installed capacity 1300 MW (five Francis turbines)
� PDD just has been presented to the local stakeholders and DNAGoal of CDM project
� Rehabilitation of three (out of five) generating units operation at low efficiency 230 MW (installed capacity 260 MW) each and increase its operating capacity by 120 MW
� Increase the number of full load operating hours� Reduce leakage to lead to a more efficient use of the hydro
resource of the existing reservoir

93
Cont.
� Annual average of estimated reductions over the crediting periodis estimated as 155,901 tones of CO2eq.
� Crediting period is fixed for 10 years� Host party participant is Government of Georgia through
Engurhesi Ltd.� Project Developer is EBRD� Baseline methodology applied is ACM0002/ver.06� Average historic output of these three units in years 1981-2006 is
2,035 GWh� Average capacity factor is 2,950 hours� Additional electricity produced annually is estimated as 485 GWh
Small Hydro Rehabilitation Project, Georgia
Goal of CDM project� Rehabilitation of existing small HPP and creation of at least 15 MW
additional small, run-of-the-river hydro capacity� In total 24 sites are selected� Majority of the sites require simple rehabilitation of turbines, generators,
lines, transformers, waterways, and other basic components.� Project developer is the Energy Efficiency Centre Georgia (NGO);
Bundling agency responsible for “monitoring” in a sense of CDM.� Sponsors: Bank of Georgia; USAID;UNDP; WB; EBRD.� Full implementation of the project is planned for 3 years and should be
finished in 2010. � After full implementation of the project the annual average of estimated
reductions should be 32,550 t CO2e

94
Cont.
� Total project cost is estimated as $15 mln� EBRD and BoG pledged to allocate $8.5 mln
(construction)� USAID allocated $4.5 mln (construction)� WB, UNDP, Local community $2 mln (preparatory
stage, CDM component and the rest)
Methane Leak Reduction from Natural Gas Pipelines
� The pipeline considered in the project carries gas predominately
from Russia into Georgia and on to Armenia
� PPs:Georgia Gas International Corporation (GGIC), Greenrights
(The Netherlands), WB (project developer)
� The following types of activities will be undertaken to reduce
leakage:
-The current system relies on old pipes that have not been designed
adequately to stand up to natural corrosive elements in their location.
These old lines that are highly prone to leakage will be replaced with
modern pipes or relined using advanced materials
-The gate stations are often sources for major methane emissions and
therefore they should be permanently tested for leakage
-Leaking valves, worn seals, etc. will be identified and replaced.

95
Cont.
� Annual average over the crediting period of estimated reductions(tones of CO2e) is 1,836,986
� Fixed crediting period 10 years� New methodology has been submitted (NM0172)� Fraction of total gas input that leaks from the pipeline at the last
of the three years in which the three-year baseline measurement plan is executed equals to 6.27%
Rehabilitation of Tbilisi Gas Distribution System
� According to the assessments done by National Energy Regulating Commission the loses from Tbilisi gas distribution system reach about 12% (by JSC “TBILGAS” and Polytechnical University it is more than 18%)
� Gas consumption by Tbilisi city population is increasing annually since 1997-98 when the gas supply has been recovered after three years break
� Bilateral CDM project has been launched in 2003 (delay with the preparation of the new methodology and PDD)
� In 2006 the gas distribution system was sold to “Kaztransgas”� The total length of pipelines now belonging to the new owner
“Kaztransgas” is 1950 km. 1550 km of distribution system is underground and needs serious rehabilitation

96
Cont.
� Initial assessment showed that 15% of obsolete elements are to be replaced and the rest 75% to be repaired
� Rehabilitation of the system will reduce about 800,000 tCO2e annually
� New owner decided to work with a new investor and in the beginning of 2006 the company started process of feasibility study
Increasing of Water Pumps Energy Efficiency in Municipal Water Supply Systems
� Initial interest expressed by potential PPs from host country has been later lost when necessary data on energy consumption by pumps have been asked from the project developers
� International banks are not expressed enough interest as well

97
Barriers to the Demand-Side CDM EE Projects
Energy sector security barriers
� Traditional attitude
� Low awareness on economic effects
� Low willingness to conduct energy audit and monitoring (voluntarily)
� Comparatively cheap energy
� Absence of EE targets and programmes
� High initial investment costs
� Limited access to the free capital
CDM related barriers
� Low grid EF (Georgia’s case)
� High transaction costs comparing with low CDM income
Cont.
� Non-stability of ownership� Delay in preparatory phase (development and approval of
methodology, preparation of PDD)� Relatively small size of the CDM projects� Not reliable statistic (or absence) on historical data

98
High transaction costs
� Lack of local experts� Absence of local DOEs

99
5.2 Discussions
Participants discussed the lengthy approval time for CDM projects, top-down versus bottom-upapproaches to CDM methodology development, and the support offered by the MethodologyPanel and the CDM EB to project participants. Mr. Sudhir Sharma said the UNFCCC Secretariatwill increase communication with project participants and that bottom-up approaches are gener-ally favoured for methodology development.


6. Panel session III: Lessons learned and barriers toenergy efficiency in CDM /JI
Mr. Robert Williams, Chief, Energy Efficiency and Climate Change Unit, UNIDO, moderatedthe discussion and introduced the panel participants.
6.1 Presentations
Barriers to energy efficiency projects in CDM/JI from a validator’sperspective
Ms. Ayse Frey, TUV Süd
Ms. Ayse Frey, Project Manager, TÜV Süd, discussed barriers to energy efficiency projects underthe CDM and JI from the perspective of a certification and inspection agency. She said barriersinclude the small number of methodologies available and the fact that they tend to be project-specific, along with the challenge of showing additionality. She also suggested that there is aninconsistency between the projects that are accepted by the Methodology Panel and those thatreceive requests for review, and that the Methodology Panel should increase the clarity and trans-parency of its decisions.
Slides of Ms. Frey’s presentation are unavailable.
101

102
Pöyry’s Energy Consulting
Mr. Michael Haslinger, Pöyry Energy
Mr. Michael Haslinger, Principal Consultant, Pöyry Energy, discussed additionality with regardsto energy efficiency CDM projects. He stated that commodity prices are crucial in assessing a pro-ject’s additionality and that where fuel prices increase, CERs would account for less than 10 percent of the savings experienced in oil and gas energy efficiency projects. He also noted that, withhigh commodity prices, some energy efficiency projects are carried out without being registered asCDM or JI projects, as they are economically viable and therefore unlikely to be considered addi-tional.
1
Pöyry’s Energy Consulting
Barriers to energy efficiency in JI/CDM
Panel Session 3
Industrial Energy Efficiency Projects in the Clean Development
Mechanism and Joint Implementation
UNIDO – Vienna – March 19, 2007

103
2
PÖYRY’S ENERGY BUSINESS GROUPPÖYRY’S ENERGY BUSINESS GROUP
TECHNICALEXPERTISE
We are the management consulting division of Pöyry’s Energy business group…
TECHNICALEXPERTISE
• STRATEGY
• BUSINESSOPERATION
• VALUATION &FINANCING
• SUSTAINABILITY• Carbon Strategies• Carbon Finance JI/CDM
• STRATEGY
• BUSINESSOPERATION
• VALUATION &FINANCING
• SUSTAINABILITY• Carbon Strategies• Carbon Finance JI/CDM
ENERGYCONSULTING
ENERGYCONSULTING
Our focus on the energy sector and integration with our technical experts affords Pöyry’s Energy Consulting a unique insight on the energy market
• HYDROPOWER
• POWER & HEAT
• RENEWABLE ENERGY
• OIL & GAS
• HYDROPOWER
• POWER & HEAT
• RENEWABLE ENERGY
• OIL & GAS
1,520 EmployeesOffices worldwide
1,520 EmployeesOffices worldwide
170 Energy market experts10 offices in Europe
170 Energy market experts10 offices in Europe
3
Several factors drive investments in energy efficiency measures
Energy
Efficiency
Electricity price
Fuel price
CO2 price
• Energy intensive industry is constantly pursuing measures to decrease production costs through demand and supply side efficiency improvements
• Commodity prices (i.e. fuels, CO2, electricity, etc.) are main influence factorfor feasibility of energy efficiency projects
� Additionality �
• Regulatory framework may cause legal requirement for efficiency measures

104
4
Fuel prices and electricity prices are increasing worldwide…
• Oil price again at record levels
• Gas price down again after peaking in 2006
• Coal prices rather stable
• Electricity prices highly volatile
�Difficult to argue “Additionality” in timesof high commodity prices – BUT: long term expectations are relevant
Source: Vattenfall 2006
5
…therefore representing the major source of income for energy efficiency projects
• Most industrial energy efficiency projects lead to reductions in oil or gas consumption
• For oil/gas reducing projects, ERUs/CERs contribute only 5 to 10% to the total savings at current commodity prices
• Sale of ERUs/CERs is limited until 2012, whereas fuel savings can be considered throughout project lifetime
� Very few energy efficiency projects become economically viable through generation of ERUs/CERs
Fuel savings vs. CO2 savings
0%
20%
40%
60%
80%
100%
Oil reduction Gas reduction Coal reduction
[EU
R]
Fuel savings CO2 savings at 10EUR/t
Source: Pöyry calculations based on current market prices in Europe

105
6
Role of JI/CDM in energy efficiency projects - Summary
• Many energy efficiency projects are undertaken in the industry – BUT: very few under JI/CDM because high fuel/electricity prices make Additionalityargumentation difficult
• JI/CDM would require companies to disclose otherwise confidential production data for monitoring, e.g. efficiency benchmarks, etc.This is more critical in EE projects than in greenfield investments
• Efforts for undertaking small scale energy efficiency projects under JI/CDM are even more difficult because of rather fixed Carbon transaction costs
• Lack of required technological process know-how of host country authorities can make the approval process cumbersome
7
CONTACT:
Michael Haslinger
+43 (0)50313 54867+43 (0)664 8285238
• Competence. Service. Solutions.
THANK YOU!
Pöyry’s Energy business group

106
The Austrian JI/CDM programme
Mr. Peter Koegler, Austrian JI/CDM programme
Mr. Peter Koegler, Consultant, Kommunalkredit Austrian JI/CDM Programme, discussed theAustrian JI and CDM Programme. He outlined that Austria only has one JI and no CDM energyefficiency projects and said proving additionality is a challenge because of the financial advantagesto project owners. Koegler also discussed obstacles for projects in Russia and the Ukraine, notingthat both countries have low energy prices and thus little incentive for improving energy efficiency.
25.06.2007 Austrian JI/CDM Programme 1
The Austrian JI/CDM Programme
19 March 2007
Peter Koegler
Kommunalkredit Public Consulting GmbH
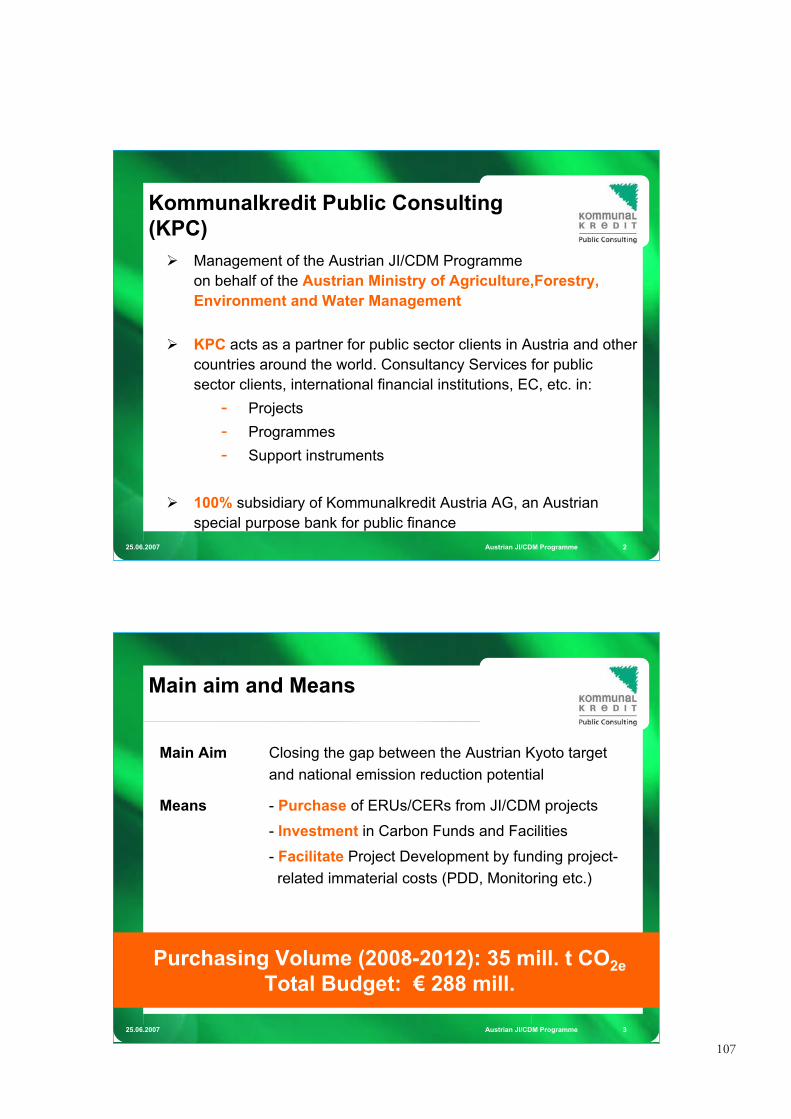
107
25.06.2007 Austrian JI/CDM Programme 2
Kommunalkredit Public Consulting
(KPC)
� Management of the Austrian JI/CDM Programme
on behalf of the Austrian Ministry of Agriculture,Forestry,
Environment and Water Management
� KPC acts as a partner for public sector clients in Austria and other
countries around the world. Consultancy Services for public
sector clients, international financial institutions, EC, etc. in:
- Projects
- Programmes
- Support instruments
� 100% subsidiary of Kommunalkredit Austria AG, an Austrian
special purpose bank for public finance
25.06.2007 Austrian JI/CDM Programme 3
Main Aim Closing the gap between the Austrian Kyoto target
and national emission reduction potential
Means - Purchase of ERUs/CERs from JI/CDM projects
- Investment in Carbon Funds and Facilities
- Facilitate Project Development by funding project-
related immaterial costs (PDD, Monitoring etc.)
Purchasing Volume (2008-2012): 35 mill. t CO2e
Total Budget: € 288 mill.
Main aim and Means

108
25.06.2007 Austrian JI/CDM Programme 4
Memoranda of Understanding – MoU
� Competence: Austrian Federal Minister of Agriculture, Forestry, Environment and Water Management& Host Country Ministry
� Aim: Basic agreement on co-operationFacilitation of project implementation
� Contents: Prioritised project categoriesBasic agreement on transfer of CERs & ERUs
MoU:19 signed: Argentina, Bolivia, Bulgaria, China, Colombia, Czech Republic, Ecuador, Estonia, Hungary, Indonesia, Latvia, Mexico, Morocco, New Zealand, Peru, Romania, Slovakia, Tunisia, Vietnam.under negotiation/in preparation: Brazil, Chile, Russia, South Africa, Ukraine, ...
25.06.2007 Austrian JI/CDM Programme 5
JI
CDM
Status 1 Jan. 2007
161 Projects in Pipeline
Project Pipeline: 161 projects
- Expression of Interest (PIN): 122 projects
- Invitation for Negotiation: 39 projects
ERPA/finalised negotiation: 31 projects

109
25.06.2007 Austrian JI/CDM Programme 6
JI ERPA VOLUMES as of 1 January 2007
Joint Implementation Mechanism
No. Technology Host CountryEmission Reductions
up to 2012*
1 Renewable Energy (agricultural wastes)
Hungary 163.000 t CO2e
2 Renewable Energy (Hydro) Bulgaria 1.006.000 t CO2e
3 Renewable Energy (Hydro) Estonia 46.000 t CO2e
4 Renewable Energy (Hydro,Wind)
Bulgaria 777.000 t CO2e
5 Renewable Energy (Wind) Hungary 358.000 t CO2e
6 Renewable Energy (Wind) Estonia 266.000 t CO2e
7 Renewable Energy (Wind) Estonia 88.000 t CO2e
8 Landfill gas New Zealand 149.000 t CO2e
9 Landfill gas Czech Republic 150.000 t CO2e
10 Landfill gas Russia 928.000 t CO2e
11 Landfill gas Russia 1.067.000 t CO2e
12 N2O Decomposition Hungary 2.000.000 t CO2e
13 Stripped Casing-head Gas Ukraine 310.000 t CO2e
7.308.000 t CO2e
25.06.2007 Austrian JI/CDM Programme 7
CDM ERPA VOLUMES as of 1 January 2007
1 Renewable Energy (Hydro) Colombia 121.000 t CO2e2 Renewable Energy (Hydro) China 511.000 t CO2e3 Renewable Energy (Wind) China 612.000 t CO2e4 Renewable Energy (Wind) China 341.000 t CO2e5 Renewable Energy (Wind) China 1.180.000 t CO2e6 Renewable Energy (Wind) China 1.015.000 t CO2e7 Renewable Energy (Wind) China 1.162.000 t CO2e8 Renewable Energy (Biomass) India 147.000 t CO2e9 Renewable Energy (Biomass) India 120.000 t CO2e10 Renewable Energy (Biomass) India 455.000 t CO2e11 Renewable Energy (Biomass) India 244.000 t CO2e12 Renewable Energy (Biomass) India 252.000 t CO2e13 Renewable Energy (Biomass) Malaysia 285.000 t CO2e14 Landfill Gas Brazil 1.500.000 t CO2e15 Landfill Gas China 1.125.000 t CO2e16 Landfill Gas Israel 240.000 t CO2e17 N20 Decomposition Egypt 3.900.000 t CO2e18 Coal Mine Methane China 2.000.000 t CO2e
Clean Development Mechanism
Host Country
Emission
Reductions
up to 2012
15.210.000 t CO2e
No. Technology

110
25.06.2007 Austrian JI/CDM Programme 8
Funds and Facilities
Funds & Facilities
No. Type of Fund Manager Investment Volume
1 Small Scale CDM Projects, varioustechnologies, focus on LDCs and particular focus on LLDCs
World Bank
USD 5.000.000
2 Small Scale CDM Projects, varioustechnologies, focus particularly on Latin America and Caribbean countries
Ecosecurities Ltd. 1.250.000 t CO2e
3 CDM Projects, focus on renewable energy, energy efficiency and methane avoidance projects in Asia and Africa
South Pole 2.000.000 t CO2e
25.06.2007 Austrian JI/CDM Programme 9
Regional distribution of Project Pipelineas of 1 January 2007
Africa
4%
India
17%
Central & Eastern
Europe
9%Latin America
7%
Other CDM
2%
Other JI
2%
Russia
6%
Ukraine
11%
China
28%
Baltic States
3%Asia
11%

111
25.06.2007 Austrian JI/CDM Programme 10
� Energy efficiency projects
� Combined heat and power installations
� Fuel switch to renewables or less carbon intensive fuels
� Renewable energy production plants (hydro, wind, biomass, biogas
etc.)
� Avoidance or recovery of landfill gases
� Waste management measures
� Other industrial gases: N2O, HFC, SF6
Eligible Project Categories
25.06.2007 Austrian JI/CDM Programme 11
Specific Features & Benefits
� Rating AAA buyer
� Excellent relationships to governments and UNFCCC
� Flexibility within the tendering procedure
� Continuous approval and negotiation procedure
� Prepayment is possible (up to 30% of contract value)
� Possibility of financial support for PDD development, Baseline
Study, Monitoring Plan, Validation, etc.
� No specific country restriction
� Establishment of long term relationships with reliable sellers

112
25.06.2007 Austrian JI/CDM Programme 12
Support for Immaterial Costs (IC)
Application Stage:
- After Invitation for PDD - development
Scope:
- PDD dev.
- Baseline Study
- Monitoring Plan
- Validation etc.
Amount:
- 50% of immaterial project costs with a cap on
EUR 40,000.
25.06.2007 Austrian JI/CDM Programme 13
Energy Efficiency (EE)
Current status:
- Few EE projects in the portfolio
- High investments => ER cover only a small fraction of investment
- Additionality => problematic because of the advantages of EE for the project owner
Outlook for EE Projects:
- Russia & Ukraine => huge potential
- Heavy industry
- Cement
- District heating
- Power plants (hydro, coal)

113
25.06.2007 Austrian JI/CDM Programme 14
Energy Efficiency (EE)
Russia & Ukraine:
- Low energy prices => no necessity for improvement
- Poor municipalities
- Huge investments necessary = financing difficult
- PPP not common or existing
- E.g. district heating => bank guarantees expensive
Possible Solution:
- Banks: temporary ownership of facility
25.06.2007 Austrian JI/CDM Programme 15
Project ExampleVacha Cascade Hydropower Project, Bulgaria
Technical Data
� Capacity 80 MW� Energy Generation 198 GWh/a�CO2 Red. 1,000,000 t CO2e
for 5 yrs
Financial Data
� Investment EUR 200 Mill.
� Impact CER app. 5% of inv.

114
25.06.2007 Austrian JI/CDM Programme 16
Project ExampleJilin Taonan Wind Power Project, CHINA
Technical Data
� Capacity 50 MWel� Energy Generation 103 GWh/a� Annual CO2 Red. 94,000 tCO2e
for 6,5 yrs
Financial Data
� Investment EUR 50 Mill.
� Impact CER app. 6% of inv.
25.06.2007 Austrian JI/CDM Programme 17
Project ExampleAlwar Power Company Ltd. Biomass Project,
India
Technical Data
� Capacity 7.5 MWel� Annual CO2 Red. 30-36,000tCO2e
Financial Data
� Investment EUR 5.4 Mio.
� Financing 30% Equity70% Debt
� Impact CER 20% of Inv.

115
25.06.2007 Austrian JI/CDM Programme 18
Project ExamplePalhalma Biogas Plant, Hungary
Financial Data
�Investment EUR 6 Mio.
�Impact ERU app. 10% of Inv.
Technical Data
�Input Manure 90,000 t/a�Biogas 13.376 MWh/a P.
14.944 MWh/a H.�Annual CO2 Red. 25-30,000 t CO2e
25.06.2007 Austrian JI/CDM Programme 19
Project ExampleN2O Destruction Proj. Abu Qir Fertiliser, Egypt
Technical Data:
� Catalytic destruction for N2O
emissions
� Annual CO2 Red. 900,000 tCO2e
Financial Data:
� Investment EUR 7 Mio
� Financing Equity, Advance Payment (bank guarantee)
� Impact CER 400-500% of inv.

116
25.06.2007 Austrian JI/CDM Programme 20
Experience & ExpectationsFirst CER Deliveries in March 2007
� 3 CDM Projects delivered so far (prompt start projects)
- 1 wind power project in China
- 2 biomass based cogeneration projects in India
� 94% of contracted CERs have been delivered out of these 3
projects
� Approx. 1 month delay compared to scheduled date of
delivery (mostly caused by delays in verification & certification
resp. issuance!)
� Full evaluation of performance is not possible yet!
25.06.2007 Austrian JI/CDM Programme 21
Experience & ExpectationsEU-ETS Phase 2 & 3, Kyoto post 2012
� Growing market on supply and demand side – project cycle will
further accelerate, new entrants like banks & financial institutions, credit
and cash return funds for institutional but also for private investors
� Supply from new markets – regional as well as from new technologies
(CCS, Biofuels)
� Demand from new markets – regional as well as tighter EU-ETS Phase
2, extension of scope of EU-ETS Phase 3 (aviation, shipping)
� Further diversification in market instruments (Programmatic CDM,
Green Investment Schemes, secondary market)
� Market price – less volatility due to increased liquidity and know-how of
market participants

117
25.06.2007 Austrian JI/CDM Programme 22
Austrian JI/CDM Programmewww.ji-cdm-austria.at
25.06.2007 SR6030-00-01 23
Mr. Peter Koegler
Tel: +43/(0)1/31 6 31-246
www.ji-cdm-austria.at

118
Industrial System Energy Efficiency: Potential and Opportunity
March 19, 2007
Vienna, Austria
Aimee McKane, Lawrence Berkeley National Laboratory
Wayne Perry, Kaeser Compressors
Building a market for industrial energy efficiency services
Ms. Aimee McKane, LBNL/ Mr. Wayne Perry, Kaeser Compressors
Ms. Aimee McKane, Programme Manager, Lawrence Berkley National Laboratory, and WaynePerry, Technical Director, Kaeser Compressors, discussed the potential and opportunities forindustrial system energy efficiency. McKane highlighted that motor and steam-driven systemsaccount for more than 50 per cent of final manufacturing systems energy use worldwide. Perry out-lined the challenges of increasing industrial system energy efficiency, including that some develop-ing countries are rapidly industrializing, but that new facilities are not more energy efficient. Toovercome challenges, McKane suggested, inter alia, standardizing practice through energy manage-ment standards; making capacity-building a part of the CDM tool kit; and developing sample pro-cedures and training on their integration into management systems.

119
Why are industrial systems important?• Steam and motor-driven systems account for more than
50% of final manufacturing energy use worldwide
• Energy savings potential from cost-effective optimization of these systems for energy efficiency is estimated at 10-12 EJ of primary energy1
• A global effort to cost-optimize industrial systems for energy efficiency could achieve these energy savings through
– the application of commercially available technologies
– in existing and new industrial facilities
1 2007 IEA Statistics
World Primary Energy
2004 IEA Statistics
11%
2%
81%
0.4%0.1%
6.5%
Geothermal
Solar/Wind/Other
Combustible Renew ables &
Waste
Hydro
Nuclear
Fossil

120
Potential Impact of System Optimization
2004 Primary Energy- does not consider other factors that could affect future fuel mix
11%
2%
6%
78%
0.4%0.1%3%
Geothermal
Solar/Wind/Other
Combustible Renewables& WasteHydro
Nuclear
Fossil
Motor/Steam SystemEfficiency
• I have about 10 minutes to explain why industry has not adopted systems efficiency programs
• About 10 minutes is all service providers have to discuss energy efficiency with corporate management
Why is Industry Slow to Change?

121
Why is Industry Slow to Change?
• Industrial energy efficiency is not a product that can be bought and installed
• Industrial energy efficiency involves changing a corporate culture
• Explaining culture change takes more than 10 minutes
• Most large corporations are focused on short-term goals that maximize stock value
• Factory managers follow the lead of corporate management...usually having their compensation tied to short-term results
Why is Industry Slow to Change?

122
• Most service providers work with plant-level personnel like maintenance engineers and purchasing agents
• Their main concerns are reliability and lowest first cost
• They are not evaluated on energy efficiency
• Trying to convince plant personnel that they are buying the wrong equipment risks losing business
Why is Industry Slow to Change?
• Life Cycle costs are rarely considered in purchasing decisions
• System efficiency has traditionally been difficult to quantify
• If it is not being measured, it cannot be managed
Why is Industry Slow to Change?

123
Why aren’t industrial systems more energy efficient?1. Engineers are trained to make industrial systems
reliable, not energy efficient
2. Industrial systems are not typically separately metered, so the cost of their operation is not known to management
3. Energy efficiency is not core mission for most industries
4. Even if facility engineers know how to make a system more energy efficient, production needs and operational patterns may negate their efforts
Relevance to CDM
• Developing countries are rapidly industrializing
• Steam and motor-driven systems in these new industrial facilities aren’t any better designed than existing systems
• Once installed, the next opportunity to substantially improve the energy efficiency of these systems will be during a major system renovation, in 10-20 years
• Identifying and documenting the incremental improvement between “standard practice” and “best practice” is technically achievable

124
Barriers to CDM
• Industrial system energy efficiency projects are relatively small- $250K or less
• Optimizing a system requires skill
• Systems are complex; while they have many characteristics in common, each application is unique
• Although techniques for system optimization are well-tested, there aren’t any accepted standards for optimization
Establishing a Baseline of Use
• System energy efficiency is identified by an energy assessment or audit– a snapshot in time
• Establishing a reliable baseline requires consideration of all major operational modes of an industrial facility
– Seasonal, weekly, shift variations
• For existing facilities, how is this data collected in an economically feasible manner?
• For new construction, what are acceptable assumptions?

125
Assuring Persistence of Energy Savings• System energy improvement projects have a life
expectancy of between 7 and 10 years, on average
– Some major system renovations can last much longer
• Documentation is essential
– Policies
– Procedures
– Work Instructions
Assuring Persistence of Energy Savings
• If management does not adhere to documented policies and procedures, energy savings may not be realized over the useful life of the project
• Energy efficiency improvements need to become part of the institutional memory, and not be reliant on individuals

126
What can be done?• Standardize practice, by developing
– Energy management standard
– System assessment protocols
• Develop skills through training – Engineering and design community
– Practicing facility engineers
• Document– Sample procedures
– Sample work instructions
– Training on how to integrate into existing management systems (such as ISO)
Create interest• Make capacity-building part of the CDM toolkit
• Encourage the adoption of energy management standards (recognition, incentives)
• Demonstrate applications of standards and techniques, especially in developing countries
• Host international workshops on optimization techniques ( actual and virtual)
• Communicate the opportunity to the financial community in their language

127
Aimee T. McKane
Lawrence Berkeley National Laboratory
P.O. Box 790
Latham, NY 12110
USA
518 782 7002
Wayne Perry
Kaeser Compressors
P.O Box 946
Fredericksburg, VA 22404
USA
540 898 5500
For more information:

128
Energy efficiency in the CDM and JI from a carbon seller’s perspective
Mr. Michael Bess, ESD
Mr. Mike Bess, Director, Camco International, discussed lessons learned and barriers to energyefficiency projects under the CDM and JI, and highlighted that CERs can contribute to energyefficiency being considered as part of core business within industry. He recommended the aggrega-tion and bundling of SSC CDM projects to overcome high transaction costs.
1
Industrial Energy Efficiencyin the Clean Development Mechanism and Joint Implementation
Panel Session 3: Lessons Learned and Barriers to Energy Efficiency in CDM /JI
Energy Efficiency in the CDM and JI from a Carbon Seller’s Perspective
Mike Bess
Camco InternationalVienna
19th March 2007

129
3
Introduction to Camco� Camco is a co-developer of CDM projects and our role is to help
project hosts to identify opportunities to generate carbon credits and to realise and monetise those opportunities
� We develop all aspects of a CDM Project:� Develop all CDM Documentation, including new methodologies,
if required;� Structure the off-take contracts to maximise benefits / minimise
risks; � Manage the approval and validation process at local and UN
Level;� Manage monitoring and verification; and,� Cover the costs of developing the CDM aspects of the project.
� We co-finance the development costs of the Project in certain cases:
� For example, cover costs of Feasibility Reports, Environmental Impact Assessments, Project Structuring to attract investment and reach financial close quicker
� We have a number of other services and co-operation models which can help project developers get their projects registered and generating credits.
2
SUMMARY� Introduction to Camco
� Kyoto mechanisms & energy efficiency
� Energy efficiency projects in JI & the CDM
� Principles & methodologies for energy efficiency & Climate
Change
� Problems with JI & CDM energy efficiency projects
� Camco’s role in energy efficiency in CDM
� Prospects for energy efficiency beyond 2012

130
5
Energy Efficiency in JI & CDM� First, and most common, energy efficiency projects under JI & CDM are
fuel-substitution (mostly natural gas for coal in electricity and heat
generation, or combined heat & power (CHP)
� Second most common is CHP (cogeneration), and biomass waste taking
the leading share (sugar bagasse, other agricultural wastes from oil
extraction, agro-industries, pulp & paper, milling, etc.)
� Next is waste heat recovery (including cement, steel, alloys, metallurgy)
� Energy efficiency in JI & the CDM has yet to realise but a tiny fraction of its
potential
� Energy efficiency, when dealing with JI & CDM projects is hard to
differentiate between, say, methane recovery, waste utilization, etc.
4
Kyoto & Energy Efficiency
� Energy efficiency in reality:
� Improved efficiency of energy use in industry,
commercial, transport & ag-sectors
� Demand side management (DSM)
� Fuel-substitution/fuel-switching
� Energy efficiency has the greatest role in reducing
greenhouse gas emission (GHG) of any field under
the Kyoto Protocol

131
7
� But, reality is, far more interest & support in renewable energy, HFCs, NOx, methane, fugitive gases & energy technologies than energy efficiency
� EE projects in JI & CDM are not very “sexy”� Energy efficiency projects generally have higher
transaction costs than supply side projects, etc.� Returns on most energy efficiency projects are
often low� Monitoring requirements for energy efficiency
projects are generally very high, and complicated� Boundaries of energy efficiency projects tend to
be more difficult to define than others� Also, scepticism about being able to measure
energy efficiency cause & effect
Problems with JI & CDM EE Projects
6
� Energy efficiency principles are well-understood & formulated, particularly since 1970s oil crises, when North America, Japan & Europe began “decoupling” energy from industry
� EU industrial sector generates nearly three times the GDP per € as 1970 at less energy consumption per unit than 1980
� California’s per capita electricity consumption today is less than 1970, yet per capita GDP has increase 2.5 times since 1970
� So, “decoupling” energy and GHG from growth is possible, and should be supported
Principles & Methodologies for EE

132
9
� AM 0007: Analysis of the least-cost fuel option for seasonally-operating biomass cogeneration plants� AM 0009: Recovery and utilization of gas from oil wells that would otherwise be flared� AM 0014: Natural gas-based package cogeneration� AM 0017: Steam system efficiency improvements by replacing steam traps and returning condensate� AM 0018: Steam optimizing systems � AM 0020: Baseline methodology for water pumping efficiency improvements� AM 0022: Avoided Wastewater and On-site Energy Use Emissions in the Industrial Sector� AM 0023: Leak reduction from natural gas pipeline compressors or gate stations� AM 0024: Baseline methodology for greenhouse gas reductions through waste heat recovery and utilization for power
generation at cement plants� AM 0029: Baseline Methodology for Grid Connected Electricity Generation Plants using Natural Gas� AM 0031: Baseline Methodology for Bus Rapid Transit Projects� AM 0032: Baseline methodology for waste gas or waste heat based cogeneration system� AM 0033: Use of non-carbonated calcium sources in the raw mix for cement processing� AM 0036: Fuel switch from fossil fuels to biomass residues in boilers for heat generation� AM 0037: Flare reduction and gas utilization at oil and gas processing facilities� AM 0038: Methodology for improved electrical energy efficiency of an existing submerged electric arc furnace used for
the production of SiMn� AM 0040: Baseline and monitoring methodology for project activities using alternative raw materials that contain
carbonates in clinker manufacturing in cement kilns� AM 0041: Mitigation of Methane Emissions in the Wood Carbonization Activity for Charcoal Production� AM 0043: Leak reduction from a natural gas distribution grid by replacing old cast iron pipes with� polyethylene pipes� AM 0044: Energy efficiency improvement projects: boiler rehabilitation or replacement in industrial and� district heating sectors� AM 0045: Grid connection of isolated electricity systems� AM 0046: Distribution of efficient light bulbs to households� AM 0047: Production of waste cooking oil-based biodiesel for use as fuel� ACM 0003: Emissions reduction through partial substitution of fossil fuels with alternative fuels in cement manufacture� ACM 0004: Consolidated baseline methodology for waste gas and/or heat and/or pressure for power Generation� ACM 0005: Consolidated Baseline Methodology for Increasing the Blend in Cement Production� ACM 0006: Consolidated methodology for grid-connected electricity generation from biomass residues� ACM 0007: Baseline methodology for conversion from single cycle to combined cycle power generation� ACM 0009: Consolidated baseline methodology for fuel switching from coal or petroleum fuel to natural gas
Principles & Methodologies for EE
8
Methodology EE Activity CategoryAM 0014 CogenAM0029, AM0036, AM0047, ACM0003, AM0006 Fuel SubAM0027 Fuel Sub, CogenAM0031,AM0033, AM0038,AM0040,AM0044,AM0045,AM0046,ACM0005,ACM0007 OptimizationAM0009 RecoveryAM0017,AM0018,AM0020,AM0022,AM0023,AM0024,AM0032,AM0027,AM0041,AM043,ACM0004 Recovery, Optimization
CDM Methodologies for EE

133
11
� AM 0029: Baseline Methodology for Grid Connected Electricity Generation Plants using Natural Gas
� AM 0031: Baseline Methodology for Bus Rapid Transit Projects� AM 0032: Baseline methodology for waste gas or waste heat based
cogeneration system� AM 0033: Use of non-carbonated calcium sources in the raw mix
for cement processing� AM 0036: Fuel switch from fossil fuels to biomass residues in
boilers for heat generation� AM 0037: Flare reduction and gas utilization at oil and gas
processing facilities� AM 0038: Methodology for improved electrical energy efficiency of
an existing submerged electric arc furnace used for the production of SiMn
� AM 0040: Baseline and monitoring methodology for project activities using alternative raw materials that contain carbonates in clinker manufacturing in cement kilns
� AM 0041: Mitigation of Methane Emissions in the Wood Carbonization Activity for Charcoal Production
� AM 0043: Leak reduction from a natural gas distribution grid by replacing old cast iron pipes with polythene pipes
Principles & Methodologies for EE
10
� AM 0007: Analysis of the least-cost fuel option for seasonally-operating biomass cogeneration plants
� AM 0009: Recovery and utilization of gas from oil wells that would otherwise be flared
� AM 0014: Natural gas-based package cogeneration� AM 0017: Steam system efficiency improvements by
replacing steam traps and returning condensate� AM 0018: Steam optimizing systems � AM 0020: Baseline methodology for water pumping
efficiency improvements� AM 0022: Avoided Wastewater and On-site Energy Use
Emissions in the Industrial Sector� AM 0023: Leak reduction from natural gas pipeline
compressors or gate stations� AM 0024: Baseline methodology for greenhouse gas
reductions through waste heat recovery and utilization for power generation at cement plants
Principles & Methodologies for EE

134
13
� Authors of AM0024Methodology for GHG reductions through waste heat recovery and utilization for power generation at cement plants
� Based on Taishan Cement Works Waste Heat Recovery for Power Generation Project
� 676,000 CERsApplication of ACM0004 in various industrial contexts and sectors
Camco’s Contribution to EE Projects under CDM
12
� AM 0044: Energy efficiency improvement projects: boiler rehabilitation or replacement in industrial and
� district heating sectors� AM 0045: Grid connection of isolated electricity systems� AM 0046: Distribution of efficient light bulbs to households� AM 0047: Production of waste cooking oil-based biodiesel
for use as fuel� ACM 0003: Emissions reduction through partial substitution
of fossil fuels with alternative fuels in cement manufacture� ACM 0004: Consolidated baseline methodology for waste
gas and/or heat and/or pressure for power Generation� ACM 0005: Consolidated Baseline Methodology for
Increasing the Blend in Cement Production� ACM 0006: Consolidated methodology for grid-connected
electricity generation from biomass residues� ACM 0007: Baseline methodology for conversion from
single cycle to combined cycle power generation� ACM 0009: Consolidated baseline methodology for fuel
switching from coal or petroleum fuel to natural gas
Principles & Methodologies for EE

135
15
� Methodological� Require intimate knowledge in specific industrial processes -
combined industry & CDM expertise� Potential other uses of “waste resource” – real emissions reductions ?� Small-scale vs Large-scale: small-scale often not seen “worth it”� Most buyers not interested in small number of credits, so, bundling,
focus on programmatic CDM required� High returns on paper don’t fit easily with prevailing CDM
Methodological Approaches to baseline & additionality determination;� Reluctance of regulators to give credence to barrier analysis
approaches
Challenges Facing EE Projects under CDM
14
� Structural� Non-core business activity, limited attention/
representation at enterprise Board level� Requires cultural changes in organizational planning and
operations� Investments in new, replacement technologies sometimes
seen as more strategic than tactical (i.e. short time horizon of JI & CDM)
� Benefits not seen as large as other projects (e.g., methane, HFCs, NOx), etc.
Challenges Facing EE Projects under CDM

136
17
Prospects for EE beyond 2012
� If the past year is any example, energy efficiency will
come even more into its own in the coming years
� We need to emphasise programmatic & bundling, &
reducing transaction costs for really bringing in lots of
energy efficiency in
� Energy efficiency is front & centre on the JI & CDM project
stage
� Finally, recognition of true potential
For energy efficiency in combating climate change
16
� Less reliance on pure economic analysis� Gathering of national data to facilitate use of industry
benchmarking approaches� More open methodologies – e.g., Meth Panel recommendation to
restrict applicability of ACM0004 would hold back the sector even further
� Reduce transaction costs – particularly monitoring requirements & costs
� Make small-scale methodologies easier� Increasingly an area of national strategic importance in booming
economies of China & India� Programmatic CDM itself is an opportunity to accelerate EE
Projects under CDM (see Annex 15 - Guidance on the registration of a programme of activities as a single project activity, http://cdm.unfccc.int/EB/028/eb28_repan15.pdf)
Recommendations to Accelerate EE Projects under CDM

137
18
Thank you!
Mike BessDirector, International Division
Energy for Sustainable Development Ltd.and
Camco International+44 7887 726843

138
Morihiro KURUSHIMAProfessor
Department of Regional Development Studies, Toyo UniversityDevelopment Studies, Toyo University / NEDO/ NEDO
Technological Breakthroughs for 3E: Japanese Industry and NEDO ’s activities on JI
19, 3, 2007 UNIDO, Vienna
Technological breakthroughs for 3E: Japanese industry and NEDO’sactivities on JI
Prof. Morihiro Kurushima, CTI
Mr. Morihiro Kurushima, Programme Manager, CTI, discussed projects where Japan has madecontributions and investments, and a “win-win” project involving technology transfer to Mexico.He highlighted Japan’s high level of energy efficiency and stressed industry’s role in sustainabledevelopment.

139
2
1. Feasibility Study / Basic Survey
in Mexico in Thailand
Entrust
Ex:NEDO
PrivateSector
FS
.F/S by NEDO on CDM/JI Projects .F/S by NEDO on CDM/JI Projects in Mexico etc. in Mexico etc. - Hop/Step/Business -
NEDO Offices are waiting for you.HeadquartersHeadquarters
WashingtonWashington
ParisParis
BangkokBangkok
BeijingBeijing
JakartaJakarta
New Energy and Industrial Technology Development Organization (NEDO) TEL:+81-44-520-5190, FAX:+81-44-520-5193

140
4
3. Project Implement.
In Mexico & Thailand
Japan AMA
Export (200 vehicles)
Monitoring, Construct. etc.Traffic ImprovementProject in Bangkok
Mexico STE
Mitsubishi Electric Corp.
3
2. Project Formulation In Mexico
In Thailand
Mitsubishi Electric Corp.
Japan AMA
Japan EXIMBank Finance
Thai AIA/OCMRT, MOSTE Consultation
Mexico BANOBRAS
Priv. Bank

141
6
II – 2 : GHG Emissions Comparison US, EU and Japan
1990 2002 2010
Japan
USA
EU0
1000
2000
3000
4000
5000
6000
7000
-10%
-5%
0%
5%
10%
15%
Million CO2ton
13.1%
7.6%
-2.9%
-6%
-7%
-8%
5
II – 1: Comparison of Primary Energy Supply per GDP
Source: IEA “Key World Energy Statistics 2006”
Since Ukraine uses 28 times more energy per GDP dollar than Japan, thereis a significant opportunity for energy conservation technology.
Primary energy supply per GDP in different countries
Ukraine China U.S.A France Germany UK Japan
Tons
ofoi
lequ
ival
ent/
1,00
0do
llars =
Possibility
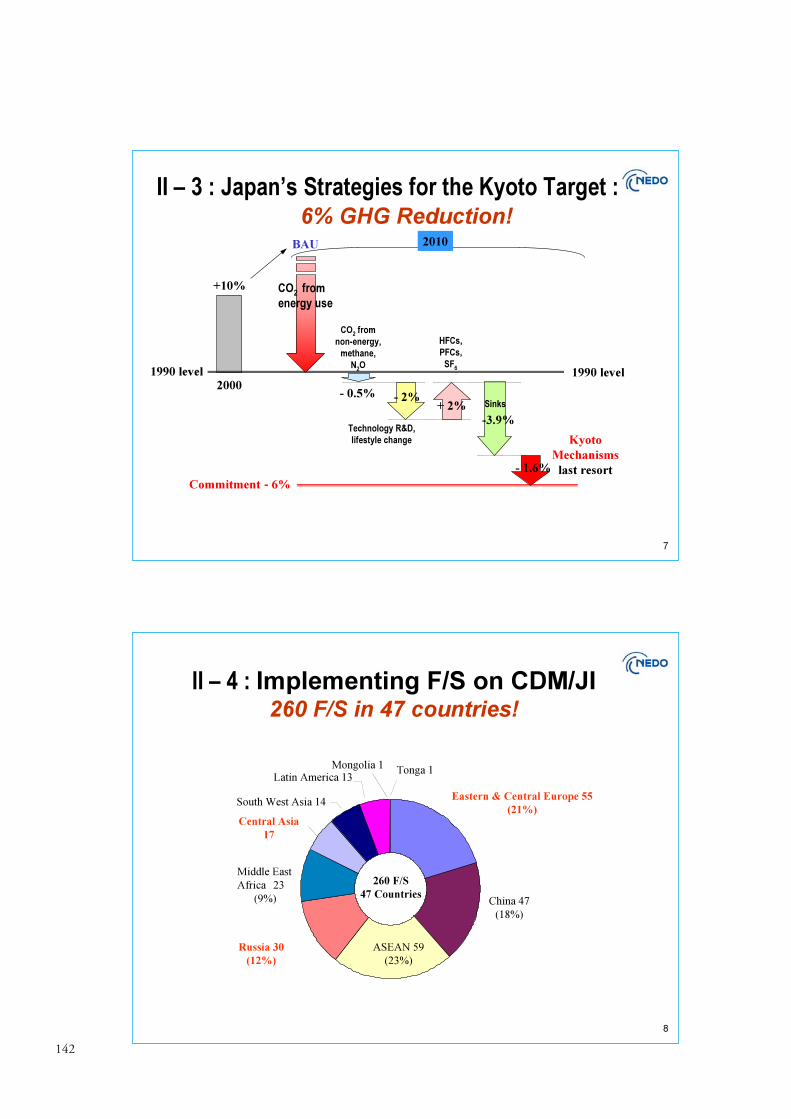
142
8
II – 4 : Implementing F/S on CDM/JI260 F/S in 47 countries!
Latin America 13
Middle East Africa 23
(9%)
Mongolia 1
South West Asia 14
Tonga 1
Eastern & Central Europe 55(21%)
China 47(18%)
ASEAN 59(23%)
260 F/S47 Countries
Central Asia17
Russia 30(12%)
7
II – 3 : Japan’s Strategies for the Kyoto Target :6% GHG Reduction!
2000
+10%
CO2 from non-energy,
methane, N2O
- 0.5%
HFCs,PFCs,
SF6
Technology R&D, lifestyle change
Sinks-3.9%
Commitment - 6%
CO2 from energy use
Kyoto Mechanisms
last resort
BAU 2010
+ 2%- 2%
- 1.6%
1990 level 1990 level

143
10
III – 1 : Project with Tohoku Electric Power in Kazakhstan
Fuel Natural Gas
Fuel Natural Gas Steam
turbinesSteamturbines
Power generation
boilers
Power generation
boilers
Hot water boilers
Hot water boilers
Thermal Thermal
Power Power
122.
Heat Recovery Steam Generation
Heat Recovery Steam Generation
Gas TurbineGas Turbine
Current condition
Model Project
Annual CO2 emissions in baseline case 192,000 t-CO2 /yAnnual CO2 emissions in project case 130,000 t-CO2 /y
Fuel flowHeat Power
9
*CDM/JIProject Activity
Japanese Private Sector Firms
NEDO
Necessary cost A Equipment
introductionValidation
CertificationVerification
Etc.
Subsidy: maximum ½ or all of necessary cost
*Eligibility: Non-Annex & AnnexCountries
Ministry of Economy, Trade and Industry (METI)
II – 5 : Subsidy for CDM/JI by NEDOF/S: 10/10, Projects: 5/10

144
11
III – 2 : Project with Nippon Steel in China & India
Cooling chamber
Generator
Heat recovery boiler
Conveyor
Fan
Dust collectorSteam produced
Cokes basket
Steam turbine
Extracted steam
Cokes
Heated cokes
Copy Rights; Nippon SteelCopy Rights; Nippon Steel

145
6.2 Discussions
Participants noted that a broader definition for projects that included training and skills couldincrease the benefit of the CDM to developing countries. Some participants questioned the lack ofCDM projects in Africa. One participant stressed that the development of CDM projects could beimproved by addressing methodology issues and that direct communication between project par-ticipants, the CDM EB and the UNFCCC Secretariat would help in the processing of projects.

back to
first page

147
7. Panel session IV: New approaches to CDM/JI
Mr. Patrick Matschoss, Economist, German Advisory Council on the Environment, introducedthe panelists and said the session would focus on bundling projects and Programme of Activities(PoAs) under the CDM, which is a mechanism to define a series of projects under a single imple-menting agency that use the same methodology and technology.
www.unido.org
back to contents page

148
www.unido.org
Industrial Energy Efficiency Projects in the CDM and JI
Panel Session 4:New approaches to CDM/JI
www.unido.org
Energy Efficiency CDM: Barriers
�
�
�
�

149
www.unido.org
New Approaches I:Bundling
�
�
�
www.unido.org
New Approaches II:Programme of Activities (PoA)
�
�

150
UNIDO, Vienna 20 March 2007 1
Energy Efficiency and CDMs
Paolo Bertoldi, European Commission, Directorate General JRC
7.1 Presentations
Energy efficiency and CDMs
Mr. Paolo Bertoldi, EU-JRC
Mr. Paolo Bertoldi, EC Joint Research Centre, described actions for increasing energy efficiencyCDM projects, including financial instruments such as direct subsidies, tax incentives, loans orpartial guarantee funds, and carbon financing. He suggested the Green Investment Scheme couldencourage energy efficiency projects under JI, and noted the need to develop monitoring and veri-fication protocols to account for energy savings, as well as methodologies for assessing the marketpenetration of efficient technologies.

151
UNIDO, Vienna 20 March 2007 2
Issues• Energy efficiency one of the key area of action for climate change mitigations;
• Energy Efficiency solutions and projects are dispersed in different sectors (residential buildings, commercial buildings, industry, transport), and use technologies (boilers, air-conditioners, lighting, motors, etc.);
• Energy Efficiency even if its know to be very cost-effective does not take place as economic theory would predict.
• There is a large number of well know institutional, regulatory, and financial barriers (split incentives, high risk associated with efficiency);
• Hence policy support is needed to promote energy efficiency;
• Policy support is not enough, financial instruments are needed to further promote efficiency.
UNIDO, Vienna 20 March 2007 3
Financial instruments to support EE
• Direct subsidies (e.g. utilities programmes, white certificates, state programmes);
• Tax incentives;
• Loans or partial guarantee funds;
• ESCOs (including EPC and TPF);
• Carbon financing;

152
UNIDO, Vienna 20 March 2007 4
Carbon Financing• Not easy, and in addition only representing a small share of investment in
EE (especially at the very low cost of CO2 allowances), still very important;
• Very difficult to include end-use EE projects (e.g. electricity efficiency projects) in the EU ETS, as these is based on the the direct (upstream) approach (based on the physical source (‘the pipe’)) ;
• Great hopes on CDMs and JIs, and more recently in GISs (perhaps the right solution for EE under JIs);
• However additional problems in the methodologies
UNIDO, Vienna 20 March 2007 5
Watt-hour (Wh) meters &What Would Have Happened (WWHH) meters
250,000
500,000
750,000
1,000,000
kW
h
Baseline Period Performance Period
WWHH meter
Watt-hour Meter
What Would Have Happened Meter

153
UNIDO, Vienna 20 March 2007 6
Measuring Energy Savings
Common issue in programme evaluation (e.g. DSM programme) and white certificates programmes (creating a real market for “energy savings”;
Methodologies have been developed both for individual projects (IPMVP) and for programmes and polices (based on bottom up methods with correction for free riders and spill over effect, life of the measure and persistence of the measure, using deem values, engineering models with partial measurement, and full measurement). Benchmarking is also under development
Methodologies for the assessment of market penetration of efficient technologies (in particular following labelling/classification schemes)
UNIDO, Vienna 20 March 2007 7
Programmatic CDMs
• Policies and programmes such as Standards and Labels, voluntary programme, and awareness programme are need to transform the market;
• However a Policies and programmes such as Standards and Labels is not a guarantee that the market is transformed. It requires enforcement, promotion (manufacturing of advanced equipment, market surveillance).
• CDMs can provide useful and important financial assistance to market transformation programmes. CDM methodology is very similar to programme evaluation (in our view these should be similar).

154
UNIDO, Vienna 20 March 2007 8
M&V Risk Management @ a
reasonable cost
Organization’s Cash-flow
Organization Risk Tolerance
Uncertainty w/ no risk mgmt
$0 for M&V
$/yr
Expected Cash-flow
Uncertainty w/ some risk mgmt
$X for M&V
Uncertainty w/ more risk mgmt
$2X for M&V
UNIDO, Vienna 20 March 2007 9
Conclusions
• End-use EE is very important component in climate change mitigation, and needs to be supported as other carbon mitigations options through carbon financing mechanisms;
• Great complexity is measuring EE, however a lot of work and activities have been carried out over the pats 10 years (e.g. IPMVP, evaluation protocols, etc.). These can and shall be used by the CDM community.
• EE Policies and programmes needs to additional support of carbon financing, as well as EE policies can further promote CO2 emission reduction.

155
UNIDO, Vienna 20 March 2007 10
Energy ImpactsBalancing Investment in Supply and Demand
Demand -Side
Investment
€ € €
Supply
? ?
How does evaluation support demand-side?• Decisions• Implementation• Settlement
How does evaluation support demand-side?• Decisions• Implementation• Settlement
GenerationTransmissionDistributionSettlement
Efficiency Projects (Long-term)Demand Response (Short-term)Settlement
UNIDO, Vienna 20 March 2007 11
Thank you for your attention!
http://re.jrc.ec.europa.eu/energyefficiency/

156
Why programs? Why are we on PoA?
Ms. Christiana Figueres, CDM Executive Board
Ms. Christiana Figueres, Member, CDM EB, discussed programmatic CDM projects, and notedthat guidelines for programmatic approaches have been approved by the CDM EB and that theapproval of some programmatic CDM projects has commenced. She explained that CDM PoAsallow for greater variation and flexibility in the timing and location of activities to reduce emis-sions. She also noted some restrictions on CDM PoAs, which may be addressed by the CDM EB,including that PoAs are limited to one technological approach and methodology.
Figueres, 3/07
Why Programs?
Where are We on PoA?
Seminar on EE and CDM/JI
UNIDO, Vienna
March 20, 2007
Christiana Figueres
Costa Rica

157
Figueres, 3/07
Why CDM for EE?
• Can positively affect SOME barriers to EE:– CERs are additional income stream -- versatile!– Upfront costs– Split incentive
• Could affect policy willingness• Could entice institutional strengthening
• Does NOT solve all the challenges of EE dissemination
Figueres, 3/07
Are Bundles Appropriate
for end use EE?
Bundle: separate CDM projects bundled
to reduce transaction costs
Reduction activities are exactly identified
(location, size, etc) at registration
Discreet projects- not systems or sectoral
approach
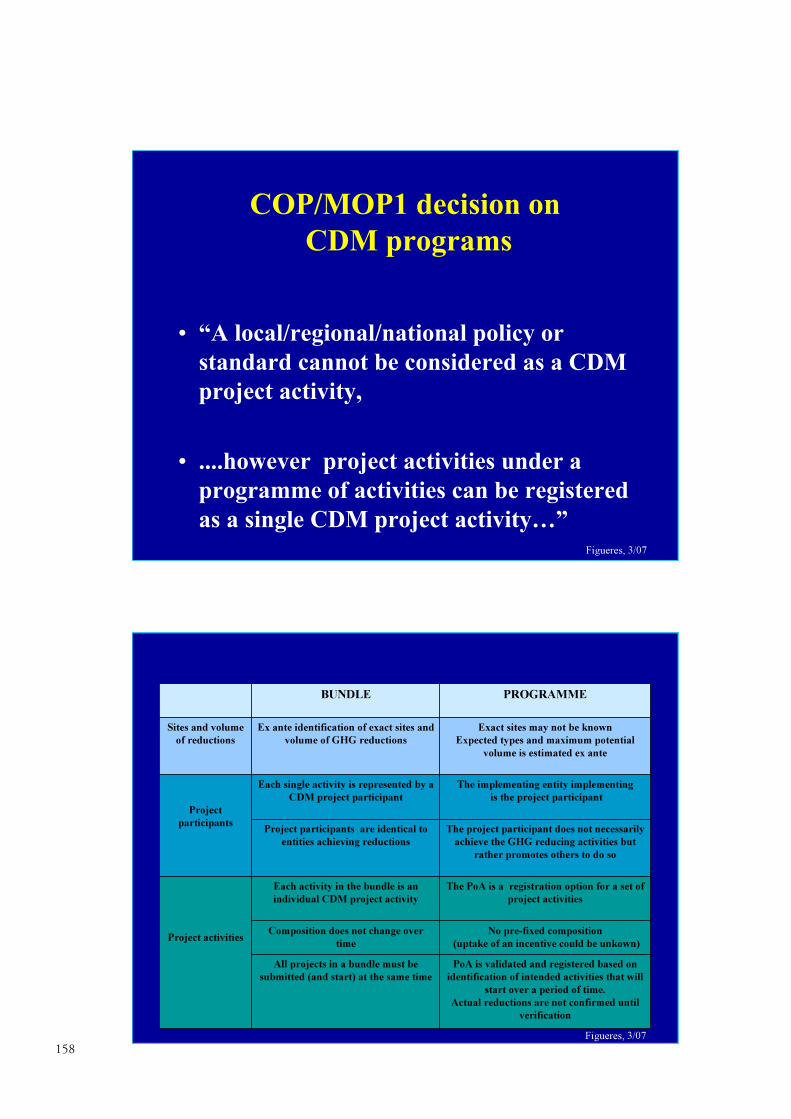
158
Figueres, 3/07
COP/MOP1 decision on
CDM programs
• “A local/regional/national policy or
standard cannot be considered as a CDM
project activity,
• ....however project activities under a
programme of activities can be registered
as a single CDM project activity…”
Figueres, 3/07
PoA is validated and registered based on identification of intended activities that will
start over a period of time. Actual reductions are not confirmed until
verification
All projects in a bundle must be submitted (and start) at the same time
No pre-fixed composition(uptake of an incentive could be unkown)
Composition does not change over time
The PoA is a registration option for a set of project activities
Each activity in the bundle is an individual CDM project activity
Project activities
The project participant does not necessarily achieve the GHG reducing activities but
rather promotes others to do so
Project participants are identical to entities achieving reductions
The implementing entity implementingis the project participant
Each single activity is represented by a CDM project participant
Project participants
Exact sites may not be knownExpected types and maximum potential
volume is estimated ex ante
Ex ante identification of exact sites and volume of GHG reductions
Sites and volume of reductions
PROGRAMMEBUNDLE

159
Figueres, 3/07
CDM Programs
Based on a deliberate program of emission reduction actions - Government policy (mandatory or voluntary)
- Private initiative (voluntary)
One coordinating agent
– Private or public
– Provides incentives or obligations
– The “project participant”
– Does not necessarily implement all actions but does
promote others to do so
Figueres, 3/07
CDM Programs
Implement multiple dispersed actions
- Actions may be implemented by many entities/owners
- Can occur over a period of time
- Size and timing may not be known at registration
- Actual reductions are confirmed through verification

160Figueres, 3/07
Achievements
• PoA coordinates or implements a policy or measure– If mandatory, not enforced or PoA goes beyond– Allows sectoral approach
• Boundary of PoA can extend beyond a country• Duration of PoA 30 years
– Crediting period of CPA: 2x7 or 10 years
• Project activities can be added to PoA during crediting period
• Small scale PoAs (60 GWh) offer many opportunities for end-use EE
Figueres, 3/07
Chronology
• Dec ‘05 COP/MOP1 Decision to allow• June ‘06 MP 21 Issues paper• Sept ‘06 MP 22 Options for definition paper• Sept ‘06 EB 26 no decision• Oct ’06 EB 27 no decision • Nov ‘06 COP/MOP2 “finalize guidance”• Dec ‘06 EB 28 Guidance • Feb ‘07 EB 29 Forms, not discussed• March ‘07 EB 30 Review guidance and forms

161
Figueres, 3/07
Challenges Ahead
• Restriction to one methodology• Restriction to one technology
• Attribution, particularly in market transformation • Guidance on generic issues of EE
• Methodologies developed and approved!!!!– Start with best EE measurement protocols – Add what is necessary for CDM requirements– CDM implies additional layer of stringency
Figueres, 3/07
Gracias!
www.figueresonline.com
“ Let There be Light in the CDM“ paperwith Martina Bosi, WB

162
Chillers between Montreal and Kyoto
Additionality Financial
Technological
Prevailing practice (regulation or policy)
AFROC technological add. , 6 African countries
India programme with fixed financial incentives
ICICI CERs are ex-ante estimated and performance
does not affect the grant terms
Chillers between Montreal and Kyoto
Mr. Thomas Grammig, GTZ
Mr. Thomas Grammig, Project Manager, GTZ, discussed the issue of centrifugal chillers that usechlorofluorocarbons (CFCs). He explained that a large stock of chillers exists, including over 600in Africa, that were not addressed under the Montreal Protocol. Grammig said GTZ’s approach tophasing out chillers is to bundle them and to pursue CDM registration under technological addi-tionality. He also described the CDM India Accelerated Chiller Replacement Programme, imple-mented by the ICICI Bank, and said that additionality was demonstrated for each owner using afinancial model to illustrate fiscal barriers.ethodology under programmatic CDM.

163
Chillers between Montreal and Kyoto
AFROC
African Fund for Replacement of Chillers project created through
decision 48/25 of the Exec. Committee of the Multilateral Fund.
Its purpose is to fund strategic projects for the conversion of
CFC chillers in:
Cameroon, Egypt, Namibia, Nigeria, Sudan and Senegal
19 chillers to be replaced in the first round, Lead Agency UNIDO
CDM approach: bundle investor types, public sector, hotels etc.
small scale methodology,
technological additionality
Chillers between Montreal and Kyoto
Key financial parameters
1,470 kW total cooling capacity
0,445 N$ / kWh current price used for electricity bills in Windhoek
8 % price increase p.a. according to the contract Eskom and Nampower
R2.38 mio. price for NH3 chiller, quote from Grasso International
R61,600 maintenance cost savings estimated by GTZ-Proklima
1,362 MWh saving p.a.calculated by GTZ Proklima based on industry
statistics for split-system units and data provided
R76 / t CO2
current low price range, applying in Namibian conditions
37.4 % Internal rate of return
System change by replacing multi-splits

164
Chillers between Montreal and Kyoto
Sensitivity Analysis Chiller NH3 Kalahari Sands
3.500.000,00
4.000.000,00
4.500.000,00
5.000.000,00
5.500.000,00
6.000.000,00
6.500.000,00
lower
20%
lower
10%
10%
higher
20%
higher
Ne
t P
res
en
t V
alu
e (
Ra
nd
)
Electricity price, energy saving
Investment cost
Maintenance cost savings
Price of CERs sold
Chillers between Montreal and Kyoto
For chillers
even at South African EF, CER incentive like maintenance
seek systems changes to create other incentives
that allow more
technological additionality, in small countries in Africa
but that makes it a specific solution each site
bundle with a methodology for each site
problem to find a bundle owner, Montreal Protocol habits

165
Additionality in SSC submitted
PV lights Techn. Barrier PV support services unavailableIndia Invest. Barrier capital cost in rural areas
Solar heating “ each techn. excessive discount rateSouth Africa
Biomass “ negative NPV without CERMoldova
Manufact plant “ < 2 yrs payback of past investmentsMalaysia
Compressed air „ payback < 3 yearsMalaysia
Steam turbine Invest. Barrier increase of IRRIndia
Glass furnace Techn. Barrier furnace control techn. new in countryIndia Invest. Barrier IRR below past investment, uncertainty
continued Additionality in SSC
Elec arc furnace Techn. Barrier different system components untestedIndia Prev. Practice supplier’s training for operators
Air preheater Techn. Barrier flue gas temperature too lowIndia Prev. Practice retrofit not common
Beer wasteheat Techn. Barrier no operating experienceLaos
Automobile plant Techn. Barrier performance uncertaintyIndia Prev. Practice sector is new for technology package
Caustic soda Invest. Barrier electrolysis cell costIndia Prev. Practice fuel switch from NG to H2
Plate heat exch Techn. Barrier heat exchange manufacturingIndia

166
most cases investment analysis alone
technology barriers and prevailing practice
but fewer with investment and technology barriers
perhaps only seen as difficult combination, easier for chillers
continued Additionality in SSC
Chillers between Montreal and Kyoto
often chillers represent neglected business management,
operating conditions are so suboptimal that financial critera
do not show additionality
better argument for owner future cost threats, as bigger incentive
than CER income
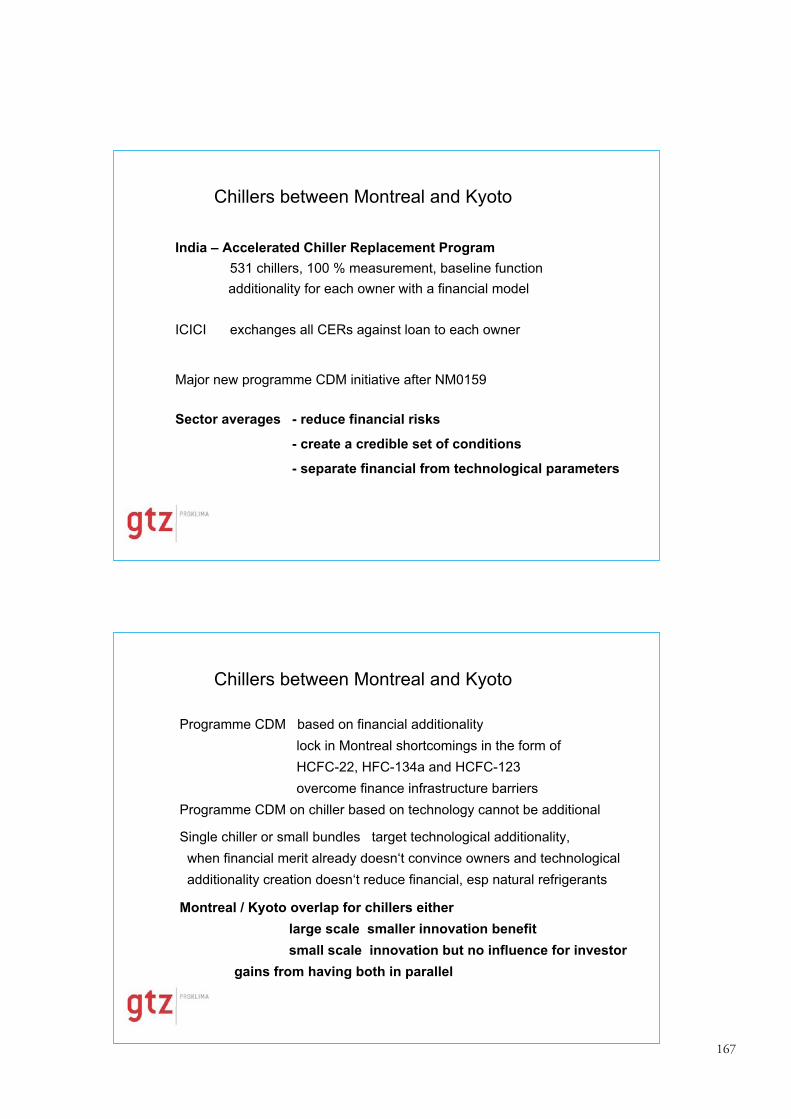
167
Chillers between Montreal and Kyoto
India – Accelerated Chiller Replacement Program
531 chillers, 100 % measurement, baseline function
additionality for each owner with a financial model
ICICI exchanges all CERs against loan to each owner
Major new programme CDM initiative after NM0159
Sector averages - reduce financial risks
- create a credible set of conditions
- separate financial from technological parameters
Chillers between Montreal and Kyoto
Programme CDM based on financial additionality
lock in Montreal shortcomings in the form of
HCFC-22, HFC-134a and HCFC-123
overcome finance infrastructure barriers
Programme CDM on chiller based on technology cannot be additional
Single chiller or small bundles target technological additionality,
when financial merit already doesn‘t convince owners and technological
additionality creation doesn‘t reduce financial, esp natural refrigerants
Montreal / Kyoto overlap for chillers either
large scale smaller innovation benefit
small scale innovation but no influence for investor
gains from having both in parallel

168
CER sales from CDM are directly proportional to energy savings
Gain from investment with CDM Emission factor x CER price----------------------------------------------- = ---------------------------------------Gain from investment without CDM Electricity price
Egypt: 0.525 CER / MWh x 12 € / CER-------------------------------------------- = 23 % higher NPV
0.027 € / kWh with CDM
Nigeria: 0.540 CER/MWh, 0.067 €/kWh = 9.6 %
Cameroon: 0.880 CER/MWh, 0.09 €/kWh = 11.7 %
Financial Parameters
Bundles have been submitted from Indonesia, South Africa, Moldova,Morocco, Nepal, Sri Lanka, India
all bundle parts must have the same crediting period
the composition of bundles shall not change over time, i.e. all activitiesmust be submitted at the same time
one DOE validates, registers and certifies the whole bundle
Bundling organization: private company, NGO, trade or industrialorganization, manufacturer, distributor, contractor
Bundling basics
maximum size 60 GWh / year + 60 CO2Ee HFC, when exceeded during “any verified period” CER limited to maximum

169
Chillers between Montreal and Kyoto
Institutional factors are path-dependent because of organisatioal learning within the companies involved
origin 100% usable skills:
Engineering master technology
PDD, NM prove emission reductions
Investment financing
CER sale brokerage
Chillers between Montreal and Kyoto
Brazil: India: China:
CDM de jure operator- government
investor owned owned owned

170
Small-scale simplified PDD, baseline, methodologymost importantly simplified additionality: 1 barrier sufficient
< 60 GWh / yr = 60,000 CER / yr = 500 - 900,000 / yr
900 kWh/yr = max 100.000 refrigerators
Small-scale and large scale allow to propose a new methodology
Approved small-scale methodologies: AMS II.C 8 registeredAMS II.D 32 registeredAMS II.E 3 registered
Pending: AMS III.- fluorinated gas emissions
Methodology
Bundling and Methodology
Bundle with same technologies: one monitoring plan
Bundle with different technologies: separate monitoring and reports
Different chiller types can be in the same bundle and use either
AMS II.C or AMS II.D
even so types, systems are different all chillers in Senegal, Cameroon, Sudan or all public chillers in Egypt can be one bundleBundle challenge: which company can assure technical quality, establish
contracts with the chillers owners, with DOE and sale CER ?
Common baseline for all chillers on the grid, separate common baseline for all chillers on generators with differentiated emission factor for the load factor

171
De-Bundling
Appendix C1 of the Simplified Modalities and Procedures for Small-Scale CDM DETERMINING THE OCCURRENCE OF DEBUNDLING
1. Debundling is defined as the fragmentation of a large project activity into smaller parts. Asmall-scale project activity that is part of a large project activity is not eligible to use thesimplified modalities and procedures for small-scale CDM project activities. The full project activity or any component of the full project activity shall follow the regular CDM modalities and procedures.2. A proposed small-scale project activity shall be deemed to be a debundled component of a large project activity if there is a registered small-scale CDM project activity or an application to register another small-scale CDM project activity:• With the same project participants;
• In the same project category and technology/measure; and
• Registered within the previous 2 years; and
• Whose project boundary is within 1 km of the project boundary of the proposed small-scale activity at the closest point.
3. If a proposed small-scale project activity is deemed to be a debundled component in accordance with paragraph 2 above, but total size of such an activity combined with the previous registered small-scale CDM project activity does not exceed the limits for small-scale CDM project activities as set in paragraph 6 (c) of the decision 17/CP.7, the project activity can qualify to use simplified modalities and procedures for small-scale CDM project activities.
Ineligible when All 4 apply
Additionality
time
emissions
Baseline scenario
Project activity
Additionality
tool
Baseline emissions
capped at< 60 GWh
each project shall meet the threshold criterion of each type, i.e.total energy saving (plus fluorinated gas emissions 60 ktCO2e)

172
Version 06: 30 September 2005 Attachment A to Appendix B of the simplified modalities and procedures for small-scale CDM
1. Project participants shall provide an explanation to show that the project activitywould not have occurred anyway due to at least one of the following barriers:
(a) Investment barrier: a financially more viable alternative to the project activity would have led to higher emissions;
(b) Technological barrier: a less technologically advanced alternative to the project activity involves lower risks due to the performance uncertainty or low market share of the new technology adopted for the project activity and so would have led to higher emissions;
(c) Barrier due to prevailing practice: prevailing practice or existing regulatory orpolicy requirements would have led to implementation of a technology with higher emissions;
(d) Other barriers: without the project activity, for another specific reason identified by the project participant, such as institutional barriers or limited information,managerial resources, organizational capacity, financial resources, or capacity to absorb new technologies, emissions would have been higher.
Additionality
CDM – Meth Panel 22nd Meeting Report Annex 13 13 Sept. 2006
Draft proposal on definitions to distinguish between a bundle,
a program and a policy as well as alternative definitions of a program
By reducing transaction costs, CDM programmes could help reduce one of the barriers to CDM project development.
Option 3: Each individual project activity in a ”programme of activities”has a direct, real and measurable impact on emission reductions and should be traceable, e.g. identified and localized at either the validation or verification stage of the ”programme”.A requirement that each underlying activity generates measurable reductions would not mean that each underlying activity has to be measured in practice: just that it could be measured if necessary. This will exclude ”soft” actions.
Each ”programme of activities” can involve only one [option 4: or more] project type, and is put in place by a coordinator/managingentity [option 5: that is neither part of the government, nor a government agency.
comes from Kyoto
decided as ‘anyone’option
Policy Bundle Programme

173
AMS II.C. Formula for groups of devices
Baseline
3. If the energy displaced is a fossil fuel, the energy baseline is the existing fuel consumption or the amount of fuel that would be used by the technology that would have been implemented otherwise.The emissions baseline is the energy baseline multiplied by an emission coefficient for the fossil fuel displaced. IPCC default values for emission coefficients may be used.
4. If the energy displaced is electricity, the energy baseline is calculated as follows:
EB = i (ni . pi . oi) where:
EB annual energy baseline in kWh per year
i the sum over the group of “i” devices replaced (e.g. 40W incandescent bulb, 5hp motor), for
which the replacement is operating during the year, implemented as part of the project.ni the number of devices of the group of “i” devices replaced (e.g. 40W incandescent bulb, 5hp
motor) for which the replacement is operating during the year.pi the power of the devices of the group of “i” devices replaced (e.g. 40W, 5hp). In the case of a
retrofit programme, “power” is the weighted average of the devices replaced. In the case of newinstallations, “power” is the weighted average of devices on the market.
oi the average annual operating hours of the devices of the group of “i” devices replaced.
5. The energy baseline is multiplied by an emission coefficient (measured in kg CO2equ/kWh) for the electricity displaced calculated in accordance with provisions under category I.D.
AMS II.C. page 2
Monitoring
7. If the devices installed replace existing devices, the number and “power” of the replaced devices shall be recorded and monitored.1
8. Monitoring shall consist of monitoring either the “power” and “operating hours” or the “energy use” of the devices installed using an appropriate methodology. Possible methodologies include:
(a) Recording the “power” of the device installed (e.g., lamp or refrigerator) using nameplate data or bench tests of a sample of the units installed and metering a sample of the units installed fortheir operating hours using run time meters.
OR(b) Metering the “energy use” of an appropriate sample of the devices installed. For technologies that represent fixed loads while operating, such as lamps, the sample can be small while for technologies that involve variable loads, such as air conditioners, the sample may need to be
relatively large.
9. In either case, monitoring shall include annual checks of a sample of non-metered systems toensure that they are still operating (other evidence of continuing operation, such as on-going rental/lease payments could be a substitute).
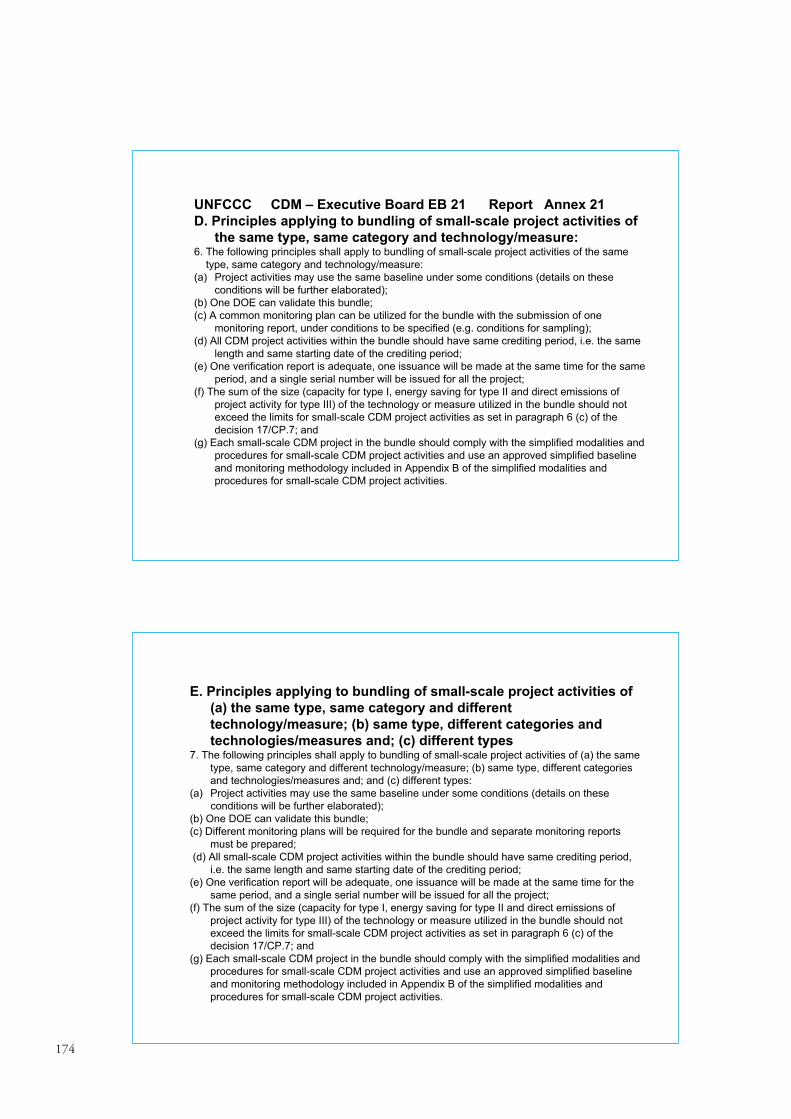
174
UNFCCC CDM – Executive Board EB 21 Report Annex 21
D. Principles applying to bundling of small-scale project activities of
the same type, same category and technology/measure:6. The following principles shall apply to bundling of small-scale project activities of the same
type, same category and technology/measure:(a) Project activities may use the same baseline under some conditions (details on these
conditions will be further elaborated);(b) One DOE can validate this bundle;(c) A common monitoring plan can be utilized for the bundle with the submission of one
monitoring report, under conditions to be specified (e.g. conditions for sampling);(d) All CDM project activities within the bundle should have same crediting period, i.e. the same
length and same starting date of the crediting period;(e) One verification report is adequate, one issuance will be made at the same time for the same
period, and a single serial number will be issued for all the project;(f) The sum of the size (capacity for type I, energy saving for type II and direct emissions of
project activity for type III) of the technology or measure utilized in the bundle should not exceed the limits for small-scale CDM project activities as set in paragraph 6 (c) of the decision 17/CP.7; and
(g) Each small-scale CDM project in the bundle should comply with the simplified modalities and procedures for small-scale CDM project activities and use an approved simplified baseline and monitoring methodology included in Appendix B of the simplified modalities and procedures for small-scale CDM project activities.
E. Principles applying to bundling of small-scale project activities of
(a) the same type, same category and different
technology/measure; (b) same type, different categories and
technologies/measures and; (c) different types7. The following principles shall apply to bundling of small-scale project activities of (a) the same
type, same category and different technology/measure; (b) same type, different categories and technologies/measures and; and (c) different types:
(a) Project activities may use the same baseline under some conditions (details on theseconditions will be further elaborated);
(b) One DOE can validate this bundle;(c) Different monitoring plans will be required for the bundle and separate monitoring reports
must be prepared;(d) All small-scale CDM project activities within the bundle should have same crediting period,
i.e. the same length and same starting date of the crediting period;(e) One verification report will be adequate, one issuance will be made at the same time for the
same period, and a single serial number will be issued for all the project;(f) The sum of the size (capacity for type I, energy saving for type II and direct emissions of
project activity for type III) of the technology or measure utilized in the bundle should not exceed the limits for small-scale CDM project activities as set in paragraph 6 (c) of the decision 17/CP.7; and
(g) Each small-scale CDM project in the bundle should comply with the simplified modalities and procedures for small-scale CDM project activities and use an approved simplified baseline and monitoring methodology included in Appendix B of the simplified modalities and procedures for small-scale CDM project activities.

175
WWW.MARKETFACILITATORS.COM
Hedging climate change risk through regulatory, financial and technological solutions
LANDING PROGRAMMATIC CDM AT A PERUVIAN AIRPORT
Luis Ugarelli
A2G Corp
WWW.ATWOG.COM
Vienna, March 19-20 2007
Landing programmatic CDM at a Peruvian airport
Mr. Luis Ugarelli, BCI
Mr. Luis Ugarelli, Managing Partner, Market Facilitators, discussed the proposal for a fuel switch-ing project in Peru as a programmatic CDM project. He detailed that retrofitting boilers to befuelled by natural gas instead of coal or oil is expected to generate between 500,000 and 3 millionCERs. He also noted the challenges of being limited to one methodology under programmaticCDM.

176
WWW.MARKETFACILITATORS.COM
Hedging climate change risk through regulatory, financial and technological solutions
I. ABOUT A2G
A2G, a global consulting firm, integrates a full range of consulting capabilities to hedge non financial risk through regulatory, commercial and technological solutions.
Our staff, business and technology savvy, is able to manage current emerging issues such as climate change, state reform, regulatory change, mergers and acquisitions and business development to enter new markets.
For more information visit www.atwog.com or contact us at [email protected]
WWW.ATWOG.COM
WWW.MARKETFACILITATORS.COM
Hedging climate change risk through regulatory, financial and technological solutions
I. ABOUT A2G AND MARKET FACILITATORS
II. WHAT´S THE ITINERARY? STEPS FOR A PoA
III. WHO´S THE PILOT? THE PoA MANAGER PROFILE
IV. CHECKING NAVIGATION CONDITIONS: CURRENT RULES
V. TAKING OFF: STARTING THE PoA
VI. FLYING BY THE DASHBOARD: MONITORING BASICS
VII. LANDING AT PERU: DELIVERING GHG REDUCTIONS
WWW.ATWOG.COM

177
WWW.MARKETFACILITATORS.COM
Hedging climate change risk through regulatory, financial and technological solutions
II. WHAT´S THE ITINERARY?...
WWW.ATWOG.COM
Promote a GHG reducing practice
through a feasible concept
Get the concept registered as PoA
Use the registered PoA as an
incentive to enroll CPAs
Manage the PoA and distribute its
benefits
WWW.MARKETFACILITATORS.COM
Hedging climate change risk through regulatory, financial and technological solutions
I. ABOUT MARKET FACILITATORS
Market Facilitators is an independent consulting firm with the mission of supporting companies, governments and other participants in the market to strengthen the areas of investments and competitiveness through the study and the implementation of strategies in key variables.
Its areas of work include environment and sustainable development.
For more information visit www.marketfacilitators.com or contact us at [email protected]
WWW.ATWOG.COM

178
WWW.MARKETFACILITATORS.COM
Hedging climate change risk through regulatory, financial and technological solutions
WWW.ATWOG.COM
IV. CHECKING NAVIGATION CONDITIONS: CURRENT RULES
According to the “guidance on the registration of project
activities under a programme of activities as a single CDM
project activity” passed by the CDM Executive Board on its28th meeting, each CDM Program can use only one approvedbaseline methodology and one technology.
What are the the pros and cons of this restriction?
WWW.MARKETFACILITATORS.COM
Hedging climate change risk through regulatory, financial and technological solutions
III. WHO´S THE PILOT? THE PoA MANAGER PROFILE
WWW.ATWOG.COM
The PoA Manager should be :
• Business and technology savvy on the sector targetedby the PoA.
• Fully conversant on CDM Meths.
• Experienced developing CDM projects.
• Competent on the monitoring and management ofsimultaneous projects.
• Highly credible to safeguard full compliance with CDM rules of the enrolled CPAs.

179
WWW.MARKETFACILITATORS.COM
Hedging climate change risk through regulatory, financial and technological solutions
WWW.ATWOG.COM
V. TAKING OFF: STARTING THE PoA • 500+ Peruvian boilers: Fuel switching fromresidual fuel oil to natural gas
• Partnership establishedwith equipment vendorsand Natural Gas Distributor
• CERs can be accepted as a colateral by NG distributor to take thepipeline beyond thefeasible limit
• CERs can be seen as incentive to switch to NG even if it involves capital expenditure
• Meth used: ACM0009
PoAoptions
BoilersPoA
PoA Manager: A2G
FILTER
WWW.MARKETFACILITATORS.COM
Hedging climate change risk through regulatory, financial and technological solutions
WWW.ATWOG.COM
PROGRAM CONCEPT based on:
PRO´s CON´s
OneBaseline
methodology and a
single technology
Homogenousuniverse makessampling easier
for monitoringand verification.
This “one fits all” approach is divorced from reality, even in a single project activity (e.g. LANDFILL) one can findseveral meth and technologies includedThis means that a PoA seeking to promote, forinstance, landfill gas capture to supply electricity to thegrid would not be allowed since they need to use twobaseline & monitoring methodologies and utilize more than one type of technology.
Severalmeth and
several tech
Allows thestructuring of
“real programs”addressed to
tackle specificbusiness sector
activities.
Its heterogeneous universe adds complexity to the samplingprocess. However, sampling can be unnecessary if thePoA Manager standardizes information and monitoringprotocols to ease verification activities.
180
WWW.MARKETFACILITATORS.COM
Hedging climate change risk through regulatory, financial and technological solutions
WWW.ATWOG.COM
ABOUT THE CPA´s
A typical CPA will consist on fuel switching at a small or mediumsize boiler and the CPA activities would consist of:
• Contract to extend natural gas pipeline
• Purchase and installation of internal natural gas tubingwithin the industrial facility
• Purchase and installation of natural gas meters andnatural gas burners
• Natural Gas Supply contract & Fuel switch from coalor oil to natural gas
WWW.MARKETFACILITATORS.COM
Hedging climate change risk through regulatory, financial and technological solutions
WWW.ATWOG.COM
These will be implemented by a multitude of boilers (+500) owners/users in response to the PoA. According to ACM0009, the following conditionsapply:
•Prior to the implementation of the CPA, only coal or petroleum fuel (but not natural gas) have been used at the boilers;•Regulations/programs do not constrain boilers from using the fossilfuels prior to fuel switching;•Regulations do not require the use of natural gas or any other fuel atboilers;•The CPAs do not increase the capacity of thermal output or lifetimeof the element processes during the crediting period nor is there anythermal capacity expansion for each boiler planned during thecrediting period;•The proposed PoA does not result in integrated process changes;
ABOUT THE PoA

181
WWW.MARKETFACILITATORS.COM
Hedging climate change risk through regulatory, financial and technological solutions
WWW.ATWOG.COM
VI. FLYING BY THE DASHBOARD: MONITORING BASICS
Since the PoA will use the consolidated methodology ACM0009, A2G plans to monitor the PoA according to the following indicators:
•The annual natural gas consumption for each CPA will be measured on a continuous basis. This is to be reported on a monthly basis to A2G, the Program Manager.
•The energy efficiency of each CPA, the net calorific value (NCVNG,y) and the CO2 emission factor of natural gas (EFNG,CO2) will be monitored monthly, based on national or international standards. Based on the monthly measurements, annual averages will be calculated and used in the equations presented in the baseline methodology.
WWW.MARKETFACILITATORS.COM
Hedging climate change risk through regulatory, financial and technological solutions
WWW.ATWOG.COM
VII. LANDING AT PERU: DELIVERING GHG REDUCTIONS
This PoA expect to deliver:
•GHG reduction in the range of 500,000 – 3´000,000 CERs for the period 2008-2012•Total Capital Expenditure of 6´000,000 – 21´000,000 US$•Total Operative Expenditure of 500,000 - 750,000 US$•On average the impact of CERs revenues on each CPA will be 1.5 - 3%
The impact of the PoA will be to boost NG consumption beyond the feasible pipeline and he feasible migrations to NG.

182
WWW.MARKETFACILITATORS.COM
Hedging climate change risk through regulatory, financial and technological solutions
THANKS
FEEL FREE TO CONTACT US TO REQUEST FURTHER
INFORMATION
FAX: +44-871-2640588
WWW.ATWOG.COM
182

[email protected] www.perspectives.cc
Kyoto Mechanisms in Business Practice
Programmatic CDM methodology
- Case of CFL distribution programs -
20 March 2007, Vienna
Daisuke Hayashi
Perspectives GmbH, Hamburg
Competence and Experience in CDM, JI, and Emissions Trading
Programmatic CDM methodology: Case of CFL distribution programmes
Mr. Daisuke Hayashi, Perspective GmbH
Mr. Daisuke Hayashi, Consultant, Perspectives, outlined the methodology for a compact fluores-cent lamp (CFL) distribution project under the CDM. He outlined barriers to the take-up of CFLin the residential sector, such as higher initial costs, lack of information, inadequate regulatoryguidance, and a lack of incentives for lighting installers. Hayashi described the methodology andrandom sampling method used in calculating emission reductions. He stressed the trade-offbetween sample size and the volume of CERs, and the need to consider optimal sample size to max-imize CER volume to reduce transaction costs.

184
[email protected] www.perspectives.cc
Lighting: Cost-effective savings
� Global lighting cost could be reduced by US$ 2.6 trillion and
16 GtCO2 could be saved (2008-2030)
� These savings are realized by making good use of today’s
routinely available efficient-lighting technologies
Source: IEA (2006) Light’s labour’s lost:
Policies for energy-efficient lighting
[email protected] www.perspectives.cc
Compact fluorescent lamps (CFLs):
Energy-efficient light bulbs
� Technology commercialized in early 1980s
� Available in two types:
• Lamps with ballast integrated
– Intended as direct substitutes for incandescent lamps
• Lamps without ballast integrated
– Oriented more at commercial building retrofits and new-build as
alternatives to incandescent lamps
� Much longer lifetimes (5,000-25,000 hours) compared to
incandescent lamps (1,000 hours)
� Consume 1/4th to 1/5th of the energy used by incandescent lamps
Source: OECD (2006) Barriers to technology
diffusion: The case of CFLsFigure: CFLs with ballast integrated

185
[email protected] www.perspectives.cc
The economics of CFLs compared to
incandescent lamps
Source: IEA (2006) Light’s labour’s lost:
Policies for energy-efficient lighting� Economics of CFLs:
• Significantly higher initial costs (20 times more expensive than
incandescent lamps)
• Lower life-cycle costs (less than 1/3rd of incandescent lamps)
[email protected] www.perspectives.cc
Estimated light production
by user sector and lamp type in 2005
� Incandescent lamps prevalent in the residential sector due to:
• Lack of information on energy efficiency levels for end-users;
• Lack of incentives for lighting equipment installer (e.g. landlord)
to minimize energy bills of end-users (e.g. tenant); and
• Lack of regulatory guidance on residential lighting energy
efficiency, etc.
Source: IEA (2006) Light’s labour’s lost:
Policies for energy-efficient lighting

186
[email protected] www.perspectives.cc
CDM methodology for
CFL distribution programs
[email protected] www.perspectives.cc
Brief program description
� Program of activities is sales, at a reduced price, or donation
of CFLs to households within a distinct geographical area
� A distributed light bulb must have:
• i) higher efficiency and
• ii) the same (or lower) lumen output than a replaced light bulb
� The households purchase or receive CFLs upon return of
currently used and functioning light bulbs
� The returned light bulbs must be destroyed
� Distribution and collection of CFLs must be conducted:
• i) directly at each household; and/or
• ii) at dedicated distribution/collection points upon presentation
of an invitation to participate in the program

187
[email protected] www.perspectives.cc
Project activity area(s) under the program
� Applicable to
single- or multi-
site programs
� Each site is
restricted to the
area of:
• 4 km2 (2 km x 2
km) for urban
areas; and
• 3,600 km2 (60
km x 60 km) for
rural areas
[email protected] www.perspectives.cc
l = 2 km (urban area);
60 km (rural area)
l
Emission reductions calculation:
Random experimentation method
Population group
Project area i Sample groupRandom
sampling
Coin toss
BSG: Households do not receive the program intervention, but are free to purchase CFLs autonomouslyPSG: Households participate in the program
Sample size in project area i
# of CFLs to be distributed in project area i
Total # of CFLs to be distributed under the program
=Total sample size under the program
(min. 200)
x
Allocation of households to BSG and PSG
Difference in emissions from lighting-related electricity consumption in BSG and PSG represents the program impact (i.e. emission reductions)
i) Electricity consumption or utilization hours with power ratings,ii) Existence of lighting appliances, and iii) Functionality of measurement equipment
Use of randomization to establish
“equivalence” between baseline sample
group (BSG) and project sample group (PSG)
Monitoring every three to six months
(or at least annually)
Emission reductions calculation
Main monitoring items:

188
[email protected] www.perspectives.cc
Issues in emission reductions calculation
� Statistical treatment is indispensable because it is
cost-prohibitive to monitor every single project activity
• Need to consider “perfect” vs. “good enough” program
impact assessments
• It remains to be seen if alternatives to a random
experimentation method can pass the CDM scrutiny
� Emission reductions are adjusted by:
• Conservative sides of 95% confidence intervals for
baseline and project emissions calculation
• Note that a smaller sample size leads to a higher margin
of error (although it reduces transaction costs)
� Hence, a trade-off exists between:
• Sample size (i.e. transaction costs), and
• CER volume
[email protected] www.perspectives.cc
Conclusions
� The first approved programmatic CDM methodology has
set rigorous precedence
� Monitoring requirement is heavy and associated costs
are likely to be high
• Rule of thumb: At least 2,000,000 CFLs should be
distributed to make a CFL program attractive under the
CDM (~ min. 500,000 households required)
� A trade-off exists between sample size and CER volume
• Need to contemplate the optimal sample size to maximize
CER volume under the transaction costs constraint
� Intermediaries play a pivotal role
• If monitoring is not conducted properly, the program will
get problems at the verification stage

189
[email protected] www.perspectives.cc
Countries of particular interest
for CFL distribution programs
� Countries with higher grid emission factors (gCO2/kWh)
• India: 750 – 1,040
• China: 700 – 1,000
• Southeastern Europe: Macedonia, Moldowa, Serbia: ~ 750
• Near East: Israel, Qatar, Oman, UAE: ~ 800
• Africa: Morocco, Senegal, South Africa: ~ 800
• Island states:
– Caribbean: Jamaica: 835, Cuba: ~ 800, Trinidad: ~ 700
– Mediterranean: Malta: ~ 900, Cyprus: ~ 760
[email protected] www.perspectives.cc
Thank you for your attention!
Daisuke Hayashi
www.perspectives.cc

190
B , S , S . Economic Consultants
Bundling and Programmatic CDM
Foundry Cluster and Glass Cluster
Presented by
Dr. Wolfram Kägi and Stefanie Steiner
B,S,S. Economic Consultants
[email protected], [email protected]
Bundling and programmatic CDM: Foundry cluster and glass cluster
Ms. Stefanie Steiner, BSS
Ms. Stefanie Steiner, Researcher, BSS, discussed a foundry project in Belguam, India, designed toincrease the energy efficiency of 100 foundries by improving the design of the cupolas, which areused to melt iron. Wolfram Kägi, Chief Executive Officer, BSS, described a glass project inFirozabad, India, where numerous efficiency improvements could be made in local glass manufac-turing, resulting in savings of up to 100,000 tonnes of carbon dioxide per year. He suggested theBelgaum project could form part of a bundled CDM project, and that ideally the Firozabad projectwould be programmatic.

191
B , S , S . Economic Consultants
The Foundry Cluster Project
� Located in Belgaum
� About 100 foundry units
� Produce high-precision
castings used by
industries to
manufacture electric
motors, pumps, valves,
etc.
B , S , S . Economic Consultants
Technology
Processes
1. Charging
2. Melting
3. Pouring
4. Moulding

192
B , S , S . Economic Consultants
Energy-intensive Stage
� Melting is the most energy-intensive stage
� -> The melting stage is the most important process
regarding the reduction potential of greenhouse gas
emissions
B , S , S . Economic Consultants
One air blast -> not enough
oxygen in the upper zone of
the cupola -> reduces the core
temperature and lowers the
furnace efficiency
Common practice: conventional cupola
Two air blasts to improve
the oxygen supply
Project idea: divided-blast cupola (DBC):
Improvement of the design of the cupola
Air blast 2
Air blast 1
Air blast

193
B , S , S . Economic Consultants
Energy saving due to DBC
Conventional cupola:
1 t coal -> 3.2 t iron
divided-blast cupola:
1 t coal -> 5.3 t iron
�Reduction of coal consumption in Belgaum foundry Cluster: ~ 3500 tons/a
�emission reduction: ~ 9000 tons CO2/a
B , S , S . Economic Consultants
Costs and Benefits of a DBC
� Installation of a new divided-blast cupola:
~ USD 20‘000 per unit
�Conversion of a conventional cupola:
~ USD 4‘500 per unit
�Energy bill of a typical unit can be reduced
by ~ USD 10‘000 per year and unit
�CERs: 90 tCO2 per year and unit

194
B , S , S . Economic Consultants
Belgaum as Bundling Project
Belgaum Foundry Cluster (established in 2004)
� Promotion of the project
� Enrol micro enterprises under the project
� Provide logistical support
� Undertake the carbon transaction as an intermediary
TERI (The Energy and Resource Institute)
� Provide technology know how
� Write the PDD
UNIDO and B,S,S. Economic Consultants
� Support of PDD development
Proposed Project Organization
B , S , S . Economic Consultants
The Glass Cluster Project
�About 300 glass
units are located in
Firozabad
� Produce a variety of
glass items (ranging
from simple glass
ware to high value
added products)

195
B , S , S . Economic Consultants
Characteristics of Glass Cluster Firozabad
� Income for half a
million people
�Very primitive and
inefficient technology
B , S , S . Economic Consultants
Energy Efficiency of Glass Cluster
0100020003000400050006000
Firo
zaba
d
Res
t of
Indi
a
Inte
rnat
iona
lav
erag
e
kcal
/kg
glas
s

196
B , S , S . Economic Consultants
Energy Efficiency of Glass Cluster
�Energy consumption of furnace accounts for
70-85% of whole process
� Industry of Firozabad is obligated to switch
from coal to gas (60% of the units allready
use natural gas, 40% use coal)
�Baseline emissions (2002): about 1’000’000 tons CO2 per year.
�Energy consumption about 4000 GWh per year
B , S , S . Economic Consultants
Possible Energy Efficiency Measures
� Improvement of furnace design
� Improvement of burner efficiency
� Introduction of temperature control
� Introduction of gas usage control
� Introduction of pressure control
� Heat recovery
�Estimation of reduction potential:
�about 10% of actual CO2 emission
�100‘000 tCO2 per year totally
�333 tCO2 per year and unit

197
B , S , S . Economic Consultants
Methodological Approach
� Is the proposed approach appropriate for the two projects? Bundling or programmatic CDM?
�“A programmatic project activity is a CDM project activity where the emission reductions are achieved by multiple actions executed over timeas a result of a government measure or a private sector initiative. “(Christiana Figueres, 2005)
B , S , S . Economic Consultants
Glass Cluster as Programmatic CDM
Organisation to be selected
� Promotion of program
� Provide technology know how
� Provide logistical support
NPC (National Productivity Council of India)
� Provide technology know how
� Write the PDD
Indian Government
� Introduce the program (USD 3 Mio. are available for the program)
UNIDO and B,S,S. Economic Consultants
� Development of the program
� Establishment of new methodology
Proposed Project Organization

198
B , S , S . Economic Consultants
Comparison of Projects regarding Methodological Approach
Foundry Belgaum Glass Firozabad
Number of
companies
~ 100 ~ 300
Investor Single units Indian Government
Energy
efficiency
activities
1 activity
(Introduction of
divided-blast cupola)
Various activities
(improvement of furnace design
and efficiency, introduction of
monitoring instruments)
Scale and
category
Small scale, category
II.D.
Large scale
Emission
reduction
9’000 tons CO2 per
year
about 100‘000 tons CO2 per year
ProgrammaticBundlingProposed Approach:
B , S , S . Economic Consultants
Thank you for your attention!

199
7.2 Discussions
Participants focused on CFLs, with some highlighting the high transaction costs of CFL substitu-tion in households as opposed to at the point of purchase. Hayashi said the methodology is rigor-ous and resulted from discussions with the Methodology Panel. He also noted that the optimalsample size for monitoring is 300 households.

200

201
8. Panel session V: Methodologiesfor electric motor-driven systems
Ms. Anne Arquit Niederberger, Director, A+B International, moderated the session and intro-duced the panelists.
8.1 Presentations
India: Accelerated chiller replacement programme (NM0197) — overviewand issues
Ms. Martina Bosi, World Bank (NM0197 chillers)
Ms. Martina Bosi, Methodology Specialist, Carbon Finance Unit, World Bank, discussed theIndia Accelerated Chiller Replacement Programme, where under the PoAs, CFC-based centrifugalchiller systems would be replaced with hydrofluorocarbon (HFC) chillers by offering replacementcosts. She noted this programme could reduce emissions by up to 2.3 Mt of carbon dioxide by 2012as a result of energy efficiency gains, and that this excluded the secondary benefits of using HFC-based, instead of CFC-based, chillers. She highlighted the synergies between the GlobalEnvironment Facility (GEF), the Multilateral Fund for the Implementation of the MontrealProtocol on Substances that Deplete the Ozone Layer (Montreal Protocol), and the CDM. Afterparticipants inquired about the disposal of the refrigerants, Bosi confirmed that these would not bedestroyed under the project, but that CFCs may be recovered. Other participants shared informa-tion on Indian companies that recover CFCs commercially.

202
India – Accelerated Chiller Replacement Program (NM0197)–
Overview and Issues
Martina Bosi and Klaus OppermannCarbon Finance Unit, The World Bank
March 20, 2006Presentation to the
UNIDO/CTI/UK Trade and Investment Seminar on Energy EfficiencyUnder CDM and JI
Vienna, Austria
India Chiller replacement program: Overview
• Accelerated replacement of building cooling systems– Accelerated replacement of old, large-size (>100 tons refrigeration)
CFC chillers by more efficient HFC chillers– Established technology but significant barriers– Without project, chillers could remain in operation for 30 years or
more.– Location: all states (i.e. 20) or territories (i.e. 15)
• Contribution to India’s sustainable development• Estimated impact:
– Expected number of chiller replacements 2007-10: > 500 – Improvements of ~40%-50% in energy consumption– Expected CO2 reductions up to 2012: > 2.3 Mt CO2
• Only CO2 emission reductions from power savings are claimed

203
India Chiller replacement program: Building on Synergies between Agendas
• GEF:– Interest in addressing environmental and economic
externalities – provide new and additional resources for incremental costs of measures to achieve global environmental benefits
• Multilateral Fund (MLF) of the Montreal Protocol:– Interest in eliminating consumption* of CFCs by 2010(*defined as production, less feedstock use, plus imports, less exports, less
destruction)
• Kyoto Protocol:– Reduction of GHG emissions and contribution to host
country’s sustainable development
India Chiller replacement program: How it works
• To compensate chiller owners for cost of earlier replacement– Carbon credits, together with grant funding from GEF and
Multilateral Fund of Montreal Protocol are critical�Average grant amount (incl. carbon credits): ~ 10% of new chiller
cost (and accelerates replacement by estimated 10.1 years)�Carbon credits represent ~ 60% of incentive amount (average)
• Financing– ICICI Bank offers grants to chiller owners refinanced out of GEF,
MLF of the Montreal Protocol, Carbon finance– GEF, MLF as seed funding for first chiller generation; then self-
financing out of CER revenues

204
India Chiller replacement program: Roles and Responsibilities
• Core legal undertaking of chiller owners in program:– Sign over their carbon credit rights in exchange for
upfront incentive for replacement of chillers– Chiller onwers responsible for replacement activities (e.g.
appraisal, installation, operation…) • Program implemented by ICICI Bank (program
implementing entity); its role is:– Market program to eligible owners;– Develop legal & financial instruments for chiller owners;– Monitor implementation of chiller replacement activities
Meth: Power Saving through accelerated replacement of non-system integrated electrical equipment with
variable output (NM0197)• Baseline power consumption:
– BAU remaining lifetime of old chillers (manufacturers).– Power consumption of old chillers under operational conditions of new chillers
(power consumption function for old chillers through measurement procedure).– Applies up to capacity of old chillers.
• Project power consumption: measured (as well as operating conditions: output delivered).
• Baseline for both (i) program implementing entity; and (ii) individualequipment owners participating in program
• Scrapping of old chillers in order to avoid leakage.• No refrigerant leakage due to exclusion of shifts to refrigerants with
higher GWP • Status: Received Preliminary recommendations from Panel (15-19
January, 2007); resubmitted to Meth Panel; expect rating at EB31

205
Preliminary Feedback from MethPanel – Key Issues (1)
1. Recovery & destruction of refrigerants• Panel recommends recovery & destruction of
refrigerants contained in existing equipment• However, destruction is environmentally dangerous
done in a couple of incineration plants in US & EU difficult & costly
• NM 0197 based on normal practice accepted Montreal Protocol
• Project is good practice and is supported by Multilateral Fund of the Montreal Protocol
• If Panel insists on recovery and destruction of refrigerants project stopper
Preliminary Feedback from MethPanel – Key Issues (2)
2. Output Capacity– NM 0197 allows replacing small with larger chillers (but
increased energy efficiency in small chillers should limit this)– Meth already conservative as based on actual sizes:
– Panel comment suggest misunderstanding of equations: « capacity of new equipment should not be larger than existing equipment »
– In meth revisions, we are clarifying the approach
No emissionreductions
Example:baseline: size: 100 TR with EF 1 100tCO2project: size: 200 TR with EF 0.5 100tCO2

206
Preliminary Feedback from MethPanel – Key Issues (3)
3. Applicability Conditions
– Applicability of original Meth very broad: all variable output equipment
– Panel arguing that it is too broad; Panel asking for completeguidance on how to use the Meth for each type of equipment.
– Result: • we are narrowing down the applicability to chillers, pumpsets
and refrigerators � but unsure if this will be accepted; in the end, may need to
restrict to chillers.
General interest of the Chiller program
• Incentive scheme with contractual relationships with owners of individual activities (allows integration of monitoring requirements)
• Self-financing vehicle out of CDM revenues with help of seed funding (transforms emission reduction payments on delivery in upfront payment for next generation of activities)
• Combining agenda of Montreal Protocol with agenda of Kyoto Protocol; combining CDM and GEF
• Development of new CDM methodology for programmes of activities

207
For more informationContacts: Martina Bosi ([email protected])Klaus Oppermann ([email protected]
World Bank Carbon Finance website:www.carbonfinance.org
UNFCCC CDM website (NM0197)http://cdm.unfccc.int/methodologies/PAmethodologies/publicview.html
208
Insights from energy efficiency projects on motor driven systems
outside CDM
UNIDO,CTI, UK Trade and Investment SEMINARIndustrial Energy Efficiency Projects in the Clean
Development Mechanism and Joint Implementation
Vienna International Centre
19-20 March 2007
PRESENTED BY DR. I.E. LANE (South Africa)
Insights from energy efficiency projects on motor-driven systems outside CDM
Mr. Ian Lane, Energy Cybernetics
Mr. Ian Lane, Director, Energy Cybernetics, provided insights from the South African experiencewith energy efficiency projects for motor driven-systems outside the CDM. He noted that thereare few energy efficiency CDM projects in South Africa and explained that this may be because
the national energy regulator’s demand-side management fund pays US$45 per tonne of carbondioxide-equivalent to protect supply side security. He said projects funded under this scheme typically take system approaches and would not qualify for the CDM as they would not demon-strate additionality.

209
OVERVIEW
• CDM IN SOUTH AFRICA
• ENERGY EFFICIENCY IN CDM IN SA
• ENERGY EFFICIENCY OUTSIDE CDM IN SA
• CONCLUSION ON MOTOR ENERGY EFFICIENCY PROJECTS IN SA
• MEASUREMENT AND VERIFICATION OF MOTOR ENERGY EFFICIENCY PROJECTS IN SA
• CLASSES OF MOTOR ENERGY EFFICIENCY PROJECTS
CDM IN SOUTH AFRICA
• 43 PROJECTS ACKNOWLEDGED BY DNA
• 26 AT PIN STAGE
• 17 AT PDD STAGE
• 6 REGISTERED BY CDM EXECUTIVE BOARD
• 2 REQUESTING REGISTRATION
• 9 AT VALIDATION STAGE
• 121950 KILOTONS CO2 EQUIVALENT
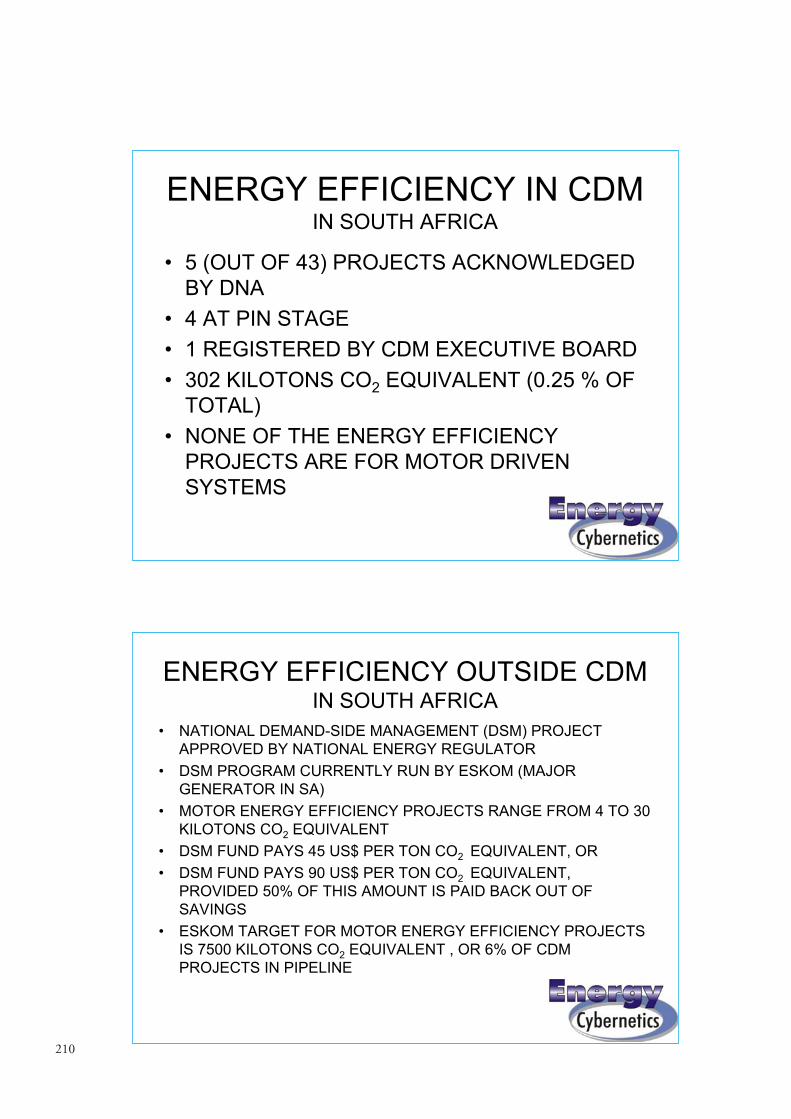
210
ENERGY EFFICIENCY IN CDM IN SOUTH AFRICA
• 5 (OUT OF 43) PROJECTS ACKNOWLEDGED BY DNA
• 4 AT PIN STAGE
• 1 REGISTERED BY CDM EXECUTIVE BOARD
• 302 KILOTONS CO2 EQUIVALENT (0.25 % OF TOTAL)
• NONE OF THE ENERGY EFFICIENCY PROJECTS ARE FOR MOTOR DRIVEN SYSTEMS
ENERGY EFFICIENCY OUTSIDE CDM IN SOUTH AFRICA
• NATIONAL DEMAND-SIDE MANAGEMENT (DSM) PROJECT APPROVED BY NATIONAL ENERGY REGULATOR
• DSM PROGRAM CURRENTLY RUN BY ESKOM (MAJORGENERATOR IN SA)
• MOTOR ENERGY EFFICIENCY PROJECTS RANGE FROM 4 TO 30 KILOTONS CO2 EQUIVALENT
• DSM FUND PAYS 45 US$ PER TON CO2 EQUIVALENT, OR
• DSM FUND PAYS 90 US$ PER TON CO2 EQUIVALENT, PROVIDED 50% OF THIS AMOUNT IS PAID BACK OUT OF SAVINGS
• ESKOM TARGET FOR MOTOR ENERGY EFFICIENCY PROJECTS IS 7500 KILOTONS CO2 EQUIVALENT , OR 6% OF CDM PROJECTS IN PIPELINE

211
CONCLUSION ON MOTOR ENERGY EFFICIENCY PROJECTS
IN SOUTH AFRICA
THE HIGH VALUE ATTACHED TO DSM BY THE
GOVERNMENT IN SOUTH AFRICA MAKES IT DIFFICULT
FOR CDM TO GENERATE ENERGY EFFICIENCY
PROJECTS ON MOTOR DRIVEN SYSTEMS IN SOUTH
AFRICA
HOWEVER, THE TARGET FOR TONS CO2 EQUIVALENT
EMISSIONS REDUCTION DUE TO MOTOR ENERGY
EFFICIENCY PROJECTS OUTSIDE THE CDM IN SA
REPRESENTS A SIGNIFICANT PERCENTAGE OF THE
TOTAL FORESEEN BY THE DNA
MEASUREMENT AND VERIFICATION OF MOTOR ENERGY EFFICIENCY PROJECTS
IN SOUTH AFRICA (OUTSIDE CDM)
• ESKOM APPOINTS UNIVERSITIES TO CREATE BASELINE METHODOLOGIES, TO VERIFY SAVINGS AND TO PRODUCE M&V REPORTS
• M&V FUNDED SEPARATELY OUT OF DSM FUND
• M&V PROTOCOLS DOCUMENT INSPIRED BY IPMVP, BUT ADAPTED TO ALSO PROVIDE FOR
– WHEN ENERGY IS USED (TO M&V LOAD MANAGEMENT, LOAD CURTAILMENT)
– HOW ENERGY IS STORED
– WHAT LEVEL OF SERVICE IS ACTUALLY REQUIRES
– IDENTIFICATION OF FACORS THAT DRIVE ENERGY CONSUMPTION
• SA PROTOCOLS RESULTED IN– LOWER TRANSACTION COSTS
– MORE CREDIBLE AND ACCURATE REPORTS ON SAVINGS
• NEW METHODOLOGIES APPROVED BY M&V STEERING COMMITTEE

212
CLASSES OF MOTOR ENERGY EFFICIENCY PROJECTS
TYPICAL PROJECTS THAT DO QUALIFY FOR DSM FUNDING
(NOTE DSM PROJECTS NEED NOT BE ADDITIONAL)
• MONITORING, TARGETING AND ON-LINE CONTROL OF ENERGY CONSUMPTION
• OPTIMIZATION OF CONTROLS TO REDUCE SPECIFIC ENERGY– SWITCH OFF UNNECESSARY EQUIPMENT (e.g. IDLING MACHINES)
– AVOID OPERATING OUT OF BEST EFFICIENCY ZONE
– OPTIMIZE SET-POINTS IN PROCESSES
• TAKE ADVANTAGE OF PROCESS MEDIA STORAGE TO AVOID THROTTLING FLOW
• REPLACE WITH MORE EFFICIENT MOTOR SYSTEMS (INCLUDING VSD’S )
• SPECIFY MORE EFFICIENT SYSTEMS FOR NEW CONSTRUCTION
CLASSES OF MOTOR ENERGY EFFICIENCY PROJECTS
TYPICAL PROJECTS THAT DO NOT QUALIFY FOR DSM FUNDING
(THESE PROJECTS MAY BE ADDITIONAL, AND COULD BE CDM COMPATIBLE)
• REPLACING SYSTEMS WITH VSD’S WHEN THERE ARE HIGH RETROFIT COSTS, e.g. CIVIL WORKS
• REPLACING MOTOR DRIVEN SYSTEMS PREMATURELY
• PLANT OR PROCESS MODIFICATIONS TO INCREASE CAPACITY OR DE-BOTTLENECK
• VSD’S AND SPECIAL CONTROLS TO LIMIT FRICTION ENERGY CONSUMPTION ON CONVEYORS

213
QUESTIONS?

214
Energy efficient motors
Draft CDM methodology
Maarten NeelisYvonne HofmanErnst Worrell
UNIDO seminar on Energy Efficiency Project in CDM/JI
Vienna, 19/20 March 2007
Energy efficient motors: Draft CDM methodology
Mr. Maarten Neelis, Ecofys (motors)
Mr. Maarten Neelis, Consultant, Ecofys, outlined a methodology developed by Ecofys and fundedby the Ministry of Economics, Trade and Industry of Japan for induction motors. He explainedthat the methodology was not developed for a specific project and had therefore not been submit-ted to the Methodology Panel. Neelis said the methodology involved determining a representativesample, and monitoring periods and using load-efficiency curves to assess minimum differencesbetween efficiencies. He emphasized that the methodology would suit projects with many smallmotors functioning in the same way.

215
Background and status
• Draft methodology prepared as part of project: “future CDM”, funded by METI, Japan
• Principles of baseline and monitoring methodology checked with motor experts
• Methodology not yet submitted to CDM-EB
Other ‘motor’ methodologies
• NM 0100: Electric motor replacement program in Mexico – Rejected (variable load issue)
• NM0159: activities to increase market penetration of EE appliances – Rejected (improper definition of system output)
• NM 0197: Accelerated replacement of electrical equipment – comparable approach, but how to determine “output” in non-chiller cases?

216
Applicability 1/2
• Only AC induction motors
• Not for the introduction of Adjustable Speed Drive
• No fuel switching of electricity supply within project boundary
• Applicable to individual projects as well as programmatic CDM
• Only motor efficiency – no system improvements
Applicability 2/2
No motor system improvements:
- Avoids difficulties in specifying the ‘output’ of the motor system (compare rejection NM 0159)
- Avoids difficulties in determining project boundary (other causes for system changes)
- But, the largest potential is in the motor systems!

217
Baseline approach
• Approach 48b (economically attractive course of action) as this addresses that the most likely BAU motor procurement
• 48a: actual emissions do not apply as the motor in the baseline situation (in the case of end-of-life replacement) will not be implemented
• 48c:too complicated to assess ‘similar’ project activities
Baseline methodology
• Distinction between end-of-life replacement and early replacement.
• Assessment of remaining lifetime of existing motor
• Division of motors into categories by size and purpose: baseline for each category
• Possible scenario’s:–Project without CDM–Continuation of current situation including BAU
• Barrier and investment analysis• Common practice analysis:
– Individual projects & Programmatic projects

218
Possible barriers
• Risks due to new technology• Lack of skills of employees• Fail of motors needs quick solutions: repair or BAU new motor
• Company motor specification reduce options
Emission reductions
1. Determine representative sample 2. Determine reasonable monitoring periods
(depending on load characteristics)3. Monitor electricity use and determine load using
load-efficiency curve4. Use load-efficiency curve of BL motor to estimate
electricity use of BL motor at this load and calculate emission reductions
5. Extrapolate to total motor population

219
Emission reductions (motors with ASD)
• Load-efficiency curve does not apply due to ASD
• Our approach: use curves to assess minimum difference between efficiencies of baseline and project motor
• Very conservative approach
1.1 kW motor (data from EURODEEM database)
40%
60%
80%
100%
0% 25% 50% 75% 100% 125%
Load factor (%)
Eff
icie
nc
y (
%)
High Improved Standard

220
1.1 kW motor (data from EURODEEM database)
0.0
0.4
0.8
1.2
1.6
0.28 0.55 0.83 1.10
Output = Load (kW)
Inp
ut
po
wer
(kW
)
High Standard
monitored
based on curve
based on curve
savings
Required monitoring
•Variables to be monitored:–T_motor: operating hours per monitoring period–EC_motor: electricity consumption during monitoring
periods (data logging equipment)
•Variables not monitored:–NPC: nameplate capacity of motor–Efficiency project motor (determined based on curve)–Efficiency baseline motor (determined based on curve)

221
Methodological challenges 2/2
Replacing 400 motors (75 kW) results in annual savings of 26 GWh and reductions of 30 kton CO2 assuming:
- Full load operation
- Indian grid electricity (900 ton / GWh)
- 10% savings for each motor
Preferred projects (also in view of monitoring):
- Projects with relatively few large motors
- Projects with many small motors doing the same thing
Methodological challenges 1/2
1. Will the use of load-efficiency curves be accepted (accuracy)
2.Actual design of the sampling method
3. How to determine suitable amount of monitoring periods (comments NM0197)
4. Determining normal replacement practice (rejection NM0159)
5. Limited potential per motor – Required project size


223
Universidade de CoimbraUniversidade de Coimbra
Energy Efficient Motors –Key considerations in their application
Anibal de Almeida University of Coimbra
UNIDO, Vienna, March19-20,2007
Energy efficient motors: Key considerations in their application
Prof. Anibal T. de Almeida, University of Coimbra
Mr. Aníbal De Almeida, Professor, Coimbra University, discussed the application of energy efficient motors. He pointed out that improvements in efficiencies in electric motor systems couldsave up to 1.25 megatons (Mt) of carbon dioxide per year, with medium and large scale motors comprising the majority. He noted the importance of, inter alia, harmonization of electric motor efficiency standards; technology transfer; correct motor sizing; and full analysis of the systems inwhich electric motors are installed.

224
Universidade de CoimbraUniversidade de Coimbra
Global electricity consumption for industrial motors
Unit Value Electricity production global
(2006) TWh/a 19.000
Electricity for industrial motors (40% of total consumption)
TWh/a 7.400
Capacity for electric motors (peak)
TWe 1.6 to 2.3
Motor electricity, greenhouse gas emissions
Mt CO2/a 4.300
Motor system energy efficiency improvement potential (average
within life cycle 10..20 years)
Range 20-30%
25%
Electricity savings potential TWh/a 1.850
Greenhouse gas emission reductions potential
M t CO2/a
1.250
Electricity cost savings potential (industrial end-users)
Billion Euro/a
100
Universidade de CoimbraUniversidade de Coimbra
Disaggregation of motor electricity consumptionby end-use, in the Industrial sector
Air Compressors18%
Fans16%Cooling
Compressors7%
Conveyors2%
Other Motors36% Pumps
22%

225
Universidade de CoimbraUniversidade de Coimbra
Motor Electricity Consumption by power range inthe industrial sector
0,0
5,0
10,0
15,0
20,0
25,0
]0;0,75[ [0,75;4[ [4;10[ [10;30[ [30;70[ [70;130[ [130;500[ [500;---[Power ranges
%
0100020003000400050006000700080009000
Ope
ratin
gH
ours
Consumption Capacity Hours
Universidade de CoimbraUniversidade de Coimbra
Electric Motor System – Key Factors:-Power quality;
-Motor selection;
-Motor controller (VSDs);
-Transmission ;
-End-use device (e.g. Pump, fan, etc)
-System and design
-Type of process
-Maintenance practices

226
Universidade de CoimbraUniversidade de Coimbra
INDUCTION MOTORS - Lifecycle Cost
-In Industry, an induction motor can consume per year an energyquantity equivalent to 5-10 times its initial cost, along all itslifetime of about 12-20 years, representing 60-200 times its initialcost.
-This fact justifies a life-cycle cost (LCC) analysis including therepair/maintenance.
Universidade de CoimbraUniversidade de Coimbra
ENERGY EFFICIENT MOTORSHIGHER EFFICIENCY (2-8% MORE);
THEY CAN REDUCE ENERGY BILLS AS WELL AS THE MAINTENANCE COSTS;
MORE MATERIAL OF HIGHER QUALITY – MORE EXPENSIVE (25-30%);
LONGER LIFETIME (LOWER OPERATING TEMPERATURE);
TYPICALLY, LOWER STARTING TORQUE (DEPENDS ON THE ROTOR SLOT SHAPE);
HIGHER STARTING CURRENT (DEPEND ON STARTING TORQUE);
LOWER SLIP- MAY REDUCE SAVINGS;
HIGHER ROTOR INERTIA.

227
Universidade de CoimbraUniversidade de Coimbra
Efficiency testing standards� IEEE 112-B (2004)-North America and Latin America.
� IEC 60034-2 (1996)-Europe and part of Asia
� JEC 37-Japan
•AS 1359.102-Australian Std.
•IEC 60034-2 (CDV Ed.4/2, 2006).-Allows three different test methods to obtain the motor efficiency:
Universidade de CoimbraUniversidade de Coimbra
Barriers to application of energy efficient motors
• Market structure (OEM market)• Efficiency of low importance• Ambiguous definition of motor efficiency
Efficiency Testing and Classification• Motors not interesting • Split budgets• Stocks of old motors• Company motor specifications• Repair of failed motors• Economical factors (e.g. capital)

228
Universidade de CoimbraUniversidade de Coimbra
Comparison of Minimum Efficiency Requirements in Different Parts of the World
75
80
85
90
95
100
0,1 1 10 100 1000power [kW]
Effic
ienc
y [%
]
NEMA Premium at 50HzAUS HighEPAct at 50 HzAUS MEPSEff1Eff2
Universidade de CoimbraUniversidade de Coimbra
Harmonization of efficiency classification standards in the World
IEC is now developing a classification standard trying to harmonize different requirements for induction motors efficiencylevels. Efficiency and losses shall be tested in accordance with revisedIEC60034-2.
IEC 60034-30 Energy Efficiency ClassesFour efficiency classes are being proposed:•CClasss ***: Premium efficiency (16-20% lower losses than class B)•CClasss **: High efficiency (existing Eff1, EPAct)•CClasss *: Improved efficiency (existing Eff2)•CClasss : Standard efficiency (existing Eff3)

229
Universidade de CoimbraUniversidade de Coimbra
Proposed new IEC 60034-30 Energy Efficiency Classes 0.75 kW - 370 kW (4-poles, 50Hz)
70
75
80
85
90
95
0,1 1 10 100 1000Motor size log scale (kW)
Effic
ienc
y (%
)
50 Hz ***50 Hz **50 Hz *
Universidade de CoimbraUniversidade de Coimbra
Motor Markets in USA and Europe: New motors sold with energy efficiency classes (2005)
Motor Market Shares
5% 7%
25%
84%54%
9%16%0%
0%
20%
40%
60%
80%
100%
USA CEMEP
3-Star Premium2-Star EPAct (Eff 1)1-Star (Eff 2)no Star (Eff 3)

230
Universidade de CoimbraUniversidade de Coimbra
SEEEM (Standards for Energy Efficiency of Electric Motor Systems)
• Market transformation strategy to promote efficient industrial electric motor systems worldwide;
• Harmonize energy efficiency testing procedures, efficiency classes and marking schemes for motors;
• Introduce a timeline for mandatory minimum energy performance requirements for motors and harmonize them at a high efficiency level;
• Promote best practice and coordinate measures to achieve efficient motor systems.
Universidade de CoimbraUniversidade de Coimbra
CENTRIFUGAL FAN
STANDARD MOTOR
HIGH EFFICIENCY MOTOR
SYNCHRONOUS SPEED (%) 100%
TOR
QU
E
Upgrading to an EEM may not bring the expectedbenefits – May even lead to higher consumption!

231
Universidade de CoimbraUniversidade de Coimbra
DESADVANTAGES: • HIGHER CAPITAL COST (MOTOR AND
COMMAND AND PROTECTION EQUIPMENT);• LOWER MOTOR EFFICIENCY AND POWER
FACTOR;
AVERAGE LOAD FACTOR BY POWER RANGE, IN NDUSTRY AND TERTIARY SECTOR, EUROPEAN UNION,
2000.
MOTOR OVERSIZING
Universidade de CoimbraUniversidade de Coimbra
Efficiency of AC induction motors
1000 kW
1 kW

232
Universidade de CoimbraUniversidade de Coimbra
Universidade de CoimbraUniversidade de Coimbra
Power Quality Factors
• Voltage magnitude• Voltage unbalance• Harmonic distortion

233
Universidade de CoimbraUniversidade de Coimbra
Economical Product Life
2075 – 250 kW
157.5 – 75 kW
121.0 – 7.5 kW
Average life –yearsPower range
Average motor life (including repairs)
Universidade de CoimbraUniversidade de Coimbra
Repair and maintenance costsMotor larger than 5 kW are normally repaired when they fail. For small motors
it is not in general economical to repair them.A motor is normally repaired at least 2 times during its lifetime but this can
happen up to 4 times.
Comparisonn betweenn repairr pricess andd neww motorr prices

234
Universidade de CoimbraUniversidade de Coimbra
Motor Repair/Maintenance
-In the EU Motors are repaired 2-3 times, more times in Developing Countries -Similar market size (€) to new motors-Motor repair practices may reduce motor efficiency typically between 0.5 and 1%, and sometimes up to 4%.-Issue particularly relevant in Developing Countries
Universidade de CoimbraUniversidade de Coimbra
INDUCTION MOTORS - REPAIR/MAINTENANCEWhat happens during repair ?-Extraction of old windings-Uncorrect rewinding

235
Universidade de CoimbraUniversidade de Coimbra
010203040506070
0 10 20 30 40Temperature rise (ºC)
Insu
latio
n life
time
(%)
Lifetime versus temperature rise above the maximum permissible temperature of the material used.
Impact of repair in motor Lifetime and operating cost
INDUCTION MOTORS - REPAIR/MAINTENANCE
Universidade de CoimbraUniversidade de Coimbra
Pumping installation – Looking at whole system.

236
Universidade de CoimbraUniversidade de Coimbra
Universidade de CoimbraUniversidade de Coimbra
Fans systems are more than a fan
-Fan Saving Potential is about 5 to 10 %;-Fan System Saving Potential is about 17.5 %;

237
Universidade de CoimbraUniversidade de Coimbra
Compressed Air Systems (CAS)
• More than 321 000 Compressed Air Systems (CAS) are commonly used in the industrial and service sectors,
• Compressed air accounts for 10% of industrial consumption of electricity
• Compressed air systems often have poor energy efficiency: possible energy savings are in the range from 5% to 50%
• Potential average savings 25%
Energy costs78%
Maintenance costs
6%
Investment costs16% Assumptions
Power 110 kWEquipment life 15 yearsOperating hours 4000 h/yearElectricity price 5 c€/kWh

238
8.2 Discussions
Ms. Anne Arquit Niederberger observed that there are clear barriers to energy efficiency CDMprojects and said top-down guidance is required from the CDM EB on the specific information itrequires for demonstrating the barriers to energy efficiency. She cautioned that methodologiesappear to be being developed to fit the demands of the Methodology Panel and that a systemsapproach is not being taken.

239
9. Discussion Groups
Participants divided into five groups to consider the following topics: PoAs and energy efficiencyprojects (Group 1); energy efficiency projects and methodology issues (Group 2); combined heatand power (CHP) projects and the CDM (Group 3); linking chiller demonstration projects underthe Montreal and Kyoto Protocols (Group 4); and linking energy efficiency projects to the CDMand JI (Group 5). Late Tuesday afternoon, representatives from each group reported back to allseminar participants.
9.1 Group 1: Programmes of activities and energy efficiency
Mr. Patrick Matschoss outlined three issues the group had identified for PoAs: that allowances arenecessary for economic and technical frameworks within which proposed PoAs take place, forexample, energy tariffs and grid emission factors; the need for further guidance from the CDM EBas to the restriction of a single technology to PoA projects; and the need for support to obtain assis-tance for appliance labelling as an energy efficiency programme.
Mr. Chia-Chin Cheng, with the UNEP Risø Center on Energy, Climate and SustainableDevelopment, submitted the following presentation.

240
Energy Efficiency Potentials in End-Use Consumptions in China
Energy Efficiency Potentials in EndEnergy Efficiency Potentials in End--Use Use Consumptions in ChinaConsumptions in China
Chia-Chin Cheng
UNEP Risø Center on Energy, Climate and Sustainable Development
Chia-Chin Cheng
UNEP Risø Center on Energy, Climate and Sustainable Development
1
UNIDO Industrial Energy Efficiency Projects in the CDM and JI
Energy Efficiency Potentials in Electricity End-Use in China
Energy Efficiency Potentials in Electricity Energy Efficiency Potentials in Electricity EndEnd--Use in ChinaUse in China

241
Why Electricity End-UseWhy Electricity End-Use
� Electricity sector is the largest carbon emitter
� Electricity demand has been growing at 10 % per year
� 98% electrification rate, -- links to almost all aspects of economic activities
& human livelihood – includes main and dispersed consumptions
What constitutes the future demandWhat constitutes the future demand
� Electricity demand is quadrupled by 2024
� Annual CO2 emissions reaches 300 MT, 70% from new demand
� Industrial sector demand is still a big portion
� Household and services sector demand will constitute nearly half; largest portion is from AC/Heating demand
� Electricity demand is quadrupled by 2024
� Annual CO2 emissions reaches 300 MT, 70% from new demand
� Industrial sector demand is still a big portion
� Household and services sector demand will constitute nearly half; largest portion is from AC/Heating demand
20000
30000
40000
50000
60000
70000
July 2, Summer Load, 2023
MW
01:00 AM 12:00 PM 11:00 PM
0
10000 2003 baseline
new
old
10000Industrial
Commercial
Fridge
Pump
Kitchen
Light
TV
WH
AC
Fan
Heater
HP

242
Summary of Electric Energy Saving PotentialsSummary of Electric Energy Saving Potentials
Source: Wu, 2003, Shanto Power Plant, Shanxi
Cumulative Total Peak 600 MW Carbon Saving Carbon SavingGWh Saving Load Saving Power Potential Potential
till 2024 at 2024 Units Saved Shandong ChinaEE Options Categories % % # MT CO2 MT CO2
Appliances 1% 1-2% 2 50 700Household Buildings 1% 2-4% 5 50 700
App. +Buildings 2% 4-5% 6 85 1200Behavior Change add 3-6% add 2-5% 8-11 100-230 1400-3200
Industrial Motor Driven Equip 5% 3-5% 5 220 3000
Commercial AC/HP+Buildings 1-2% 7-9% 13 90 1200
combined Total 12-15% 14-15% 38-41 580 8000
Priorities of Energy Efficiency ImprovementPriorities of Energy Efficiency Improvement
� Regulating new installation first
� Improving building technology
� Aggressive industrial energy efficiency measures & industrial structural change
� Designing behavioral and operational measures along with technological improvement
� Combining with urbanization policies
� Improving appliances efficiency

243
Chinese Energy Efficiency PoliciesChinese Energy Efficiency PoliciesChinese Energy Efficiency Policies
China’s National Energy Efficiency PlanChina’s National Energy Efficiency Plan
� The 11th Five-year Plan (2006-2010): reducing the
energy intensity per GDP by 20%;
� 2020 Energy Conservation Plan: China plans to
double its energy consumption as its economy
quadruples by 2020 on the 2002 level.
� 40% reduction in the CO2 emission intensity per GDP
by 2020, 80% drop by 2050 (both on 2000 basis)

244
10 Priority Areas of Chinese EE policy –Electricity & Others10 Priority Areas of Chinese EE policy –Electricity & Others
� Motor engine system energy saving program;
� Building energy-saving program;
� Green lighting program;
� Regional heat and electricity co-generation program;
� Energy system optimization program;
� The coal-fired industrial boiler renovation program;
� Waste heat and waste pressure capture and using
program;
� Oil saving and replacement program;
� The program of energy-saving in governmental agencies
� The program of energy-saving monitoring and technical
service system establishment
Industriall sectorr EEE policyy --Targetingg bigg playerss andd outdatedd technologiess Industriall sectorr EEE policyy --Targetingg bigg playerss andd outdatedd technologiess
� 1000-enterprise action- targeting big players
� Identified 1008 industrial enterprises in 9 energy-intensive
industries, e.g. iron and steel, metallurgical, coal, electricity,
oil and petrochemical, chemicals, building material, textile,
and paper.
� These 1008 industrial enterprises’ total energy consumption
in 2004 was 670 million toc, account for 33% of China’s
energy consumption and 47% of the energy consumption by
the industrial sector.
� Mandatory early elimination of low efficiency and out-
dated production capacity
� in 13 energy-intensive industries (iron & steel, aluminium,
cement)

245
Realizing Energy Efficiency Potentials through CDM
Realizing Energy Efficiency Potentials Realizing Energy Efficiency Potentials through CDMthrough CDM
Harnessing the full potentials of energy efficiency- various CDM schemesHarnessing the full potentials of energy
efficiency- various CDM schemes
# u
nits
/ow
ner
Long Tail: small units, small owners
BundledCDM
Programmatic CDMRegular
CDM
Unit size
� Small to medium-size units � Geographically dispersed� Temporally dispersed� Large quantity of owners� Unknown committed owners� Combine EE measures
� Several conglomerate sites� Temporally concentrated� Limited # of owners� Known committed owners� Combine EE measures
� Large units � Large site� Single owner
large medium to small small
heavy medium to light industrieslarge development individual household/ small business

246
Further discussion to realize EE potentials in CDM frameworkFurther discussion to realize EE potentials in CDM framework
� Interplay between standards and regulations v.s P-CDM
� Important for new installations for perspective into the future
� Non-compliances from the tail
� New rules allow P-CDM if local policies not enforced
� Mandatory v.s. voluntary
� Proving additionality– source of struggle
� Affecting regulation of government- incentive & implementation
� Can P-CDM & government climate policies facilitate each other?
� Combine methodologies
� Reduced trouble for small owners
� Reduced costs
� Include soft measures� Technology based
� Devil is in detail, in day-to-day operation
Energy Efficiency through P-CDM in China
� URC is actively exploring new ideas of EE projects under P-CDM
framework, one recent activity is through a project in China
� Project: TA sponsored by DANIDA, implemented by URC and local
partners in China
� Time-frame: March. – Feb. 2007, so far MOU signed between
DANIDA and Chinese government, detailed working plans are under
drafting, kick-off meeting planned in early March.
� Contents: the potential and feasibility of P-CDM implementation in
China, focusing on 3 case studies: one is about industrial EE. URC’s
role is keeping track of P-CDM rule changes, implementation
progress, and international research about P-CDM to help with CDM
policy making and local capacity building.


248
REPORT ON DISCUSSION GROUP
Mr. Patrick Matschoss
The discussion group considered the very new approach of programmes of activities (PoAs) in theCDM. The Group exchanged their views on a number of issues in a fruitful discussion.
The implementation of CDM activities under a programme of activities (PoA) may reduce somebarriers to energy efficiency but not all. Energy efficiency requires a conducive economic environ-ment. This environment relates to (a) electricity tariffs and related subsidies, (b) the size of theemission factors and (c) the capacity to recover cost. Electricity tariffs need to be sufficiently high inorder to create an economic incentive for energy efficiency. Subsidies on electricity may makeenergy efficiency projects unviable. High emission factors (through low grid efficiency and/or highshares of fossil fuel in the fuel mix) result in higher generation of CER per unit of end-use energysaved and therefore make efficiency projects more viable. The last issue relates to illegal access to thegrid. If electricity users do not pay for the electricity in the first place, there is no incentive to investin energy efficiency measures. Therefore, cost recovery is essential. These conditions for successfulenergy efficiency project activities apply to “normal” CDM projects as well as to PoAs. That is,PoAs too work only under certain circumstances that relate to the general economic framework.PoAs may be particularly useful if they lead to enhanced cost recovery.
The restriction to one technology in PoAs is perceived as a barrier. Increasing end-use energy effi-ciency often relates to dispersed micro-activities (light bulbs, refrigerators, air conditioning, insula-tion etc.). Currently, distinct baseline and monitoring methodologies are required for eachtechnology in order to be able to prove the additionality of the respective technology or measure.Furthermore, there is no definition of the term “technology”. An alternative would be the imple-mentation of several technologies as a package. A standardized package of technologies as a “typi-cal” project activity under a PoA would enable emission reductions to be attributed to this package.This would reduce transaction costs and increase the financial viability of PoAs. Among the partic-ipants of the discussion group there was a perceived need for further guidance from the CDMExecutive Board on this issue. Metering was regarded as prerequisite in order to measure electricitysavings. At the same time it was also considered as an obstacle as metering is not widespread inmany developing countries.
Policies as a PoA have been ruled non-eligible by COP/MOP as actions where considered non-additional in the event of binding legislation. However, legislation is often not enforced. Therefore,participants of the discussion group generally welcomed the specification of the CDM ExecutiveBoard that the actual implementation of an otherwise not enforced legislation is additional andmay be therefore eligible.
Labelling under the CDM. Labelling refers to the provision of information on energy use of, forinstance, appliances. Among the participants, labelling was felt to be a vital measure to increase theuptake of energy efficient equipment. However, there has been a very recent rejection of a method-ology that introduces the labelling of air conditioners as a CDM activity. Participants in the discus-sion group attributed this to the problem of being unable to prove cause-and-effect relationshipswhen submitting CDM methodologies. It was felt that the ability to do so is vital when submitting

249
www.unido.org
CDM methodologies. However, the ability to show these cause-and-effect relationships is particu-larly difficult in the labelling of energy-using appliances since it relates to measuring behaviouralchange.
Taken together, many participants in the group felt that PoAs may make an important contribu-tion to the increased uptake of energy efficiency in the CDM. However, the instrument is still new.In addition, there are still some clarifications necessary in order to unfold the full potential of PoAs.
9.2 Group 2: Energy efficiency methodology issues and tools
Mr. Robert Novak, UNIDO, explained the Computer Model for Feasibility Analysis andReporting (COMFAR) tool developed by UNIDO, which assesses the feasibility of projects basedon cash flows and which can be used in additionality assessments.

250
www.unido.org
COMFAR III SoftwareComputer Model for Feasibility Analysis and Reporting
UNIDO’s methodology for project preparation and appraisal
www.unido.org
COMFAR III – what it is

251
www.unido.org
COMFAR III – Common features
�
�
�
www.unido.org
COMFAR III – Common features
�
�
�
�
�
�

252
www.unido.org
COMFAR III Expert – what it is
�
�
�
�
www.unido.org
COMFAR III Expert – main features
�
�
�����
�

253
www.unido.org
COMFAR III Expert – CDM/JI Module
��
�
�
�
�
�
�
www.unido.org
COMFAR III Expert – CDM/JI Module

254
www.unido.org
COMFAR III Expert – CDM/JI Module
www.unido.org
COMFAR III Expert – CDM/JI Module

255
www.unido.org
COMFAR III Expert – CDM/JI Module
www.unido.org
COMFAR III Expert – CDM/JI Module

256
www.unido.org
COMFAR III Expert – Training
�
�
www.unido.org
COMFAR III Expert – Testing
�

257
www.unido.org
COMFAR III Expert – Contact
�
www.unido.org
COMFAR III Software

258
Seminar
‘Industrial Energy Efficiency Projects in CDM and JI’
UNIDO, the Climate Technology Initiative and UK Trade and Investment
Alexandre V. MELLO
Environmental Department – Climate ChangeBrazilian Confederation of Industries - CNI
20 March 2007
UNIDO – Vienna/Austria
REPORT ON DISCUSSION GROUP
Mr. Alexandre V. Mello, Brazilian Confederation of Industries – CNI, explained the InternationalStandards Organization (ISO) 14064 Standard for greenhouse gas accounting and project monitoring.

259
ISO 14064
New International Standards for
Greenhouse Gas
Management
Origins, concepts and challenges
ISO 14064 Standards for greenhouse gas accounting and verification
Topics
• Why an ISO standard?
• Source Material
• Key issues
• The standards

260
Why an ISO standard?
• Climate Change Task Force (CCTF) published initial papers 1998
• Climate change events
• Carbon market pressure
• Different CO2 schemes and other voluntary standards
• Discussion with relevant ISO committees
Existing ISO work
TCs most strategically placed or
active vis-à-vis climate change
Other TCs of direct relevance
22 Road Vehicles
59 Building Construction 27 Solid Mineral Fuels
146 Air Quality 70 Internal Combustion Engines
180 Solar Quality 86 Refrigeration and Air Conditioning
190 Soil Quality 160 Glass in Building
197 Hydrogen Technologies 163 Thermal Insulation
203 Technical Energy Systems 192 Gas Turbines
205 Building Environment Design 193 Natural Gas
207 Environmental Management 208 Thermal Turbines

261
Source materials
• UK ETS
• UNEP GHG Indicator Report
• WBCSD/WRI GHG Protocol
• Canadian CC Voluntary Challenge & Register
• Standards Australia – Carbon Accounting
Standard
• Sundry US state CC protocols
Guiding Principles
• Technical rigour
• Speed to market
• Extensive participation
• Policy/regime neutral
• Compatibility/consistency:– WBCSD / WRI GHG Protocol;
– Kyoto Mechanisms

262
ISO 14064 - Benefits:
• Support the environmental integrity of GHG assertions;
• Promote and harmonize best practice;• Assist organizations to manage GHG –
related risks;• Promote investor confidence and
facilitate trade;• Flexible, regime-neutral tools for use in
voluntary or regulatory GHG schemes.
Other benefits of using ISO 14064
• Internal:
– Providing technical guidance
– Ensuring consistency of a GHG management scheme
• External:
– Enhancing credibility of a GHG management approach (e.g. in communications with stakeholders)
– Enhancing compatibility with external requirements

263
Requirements of the Applicable
GHG Programme of intended user
Level of assurance consistent with
needs of intended user
Part 2 of ISO 14064Design and Implement GHG Projects
GHG Assertion
Verification
Part 1 of ISO 14064Design and Develop Organizational GHGInventories
For example ISO 14065 Requirements for
Validation or VerificationBodies
Part 3 of ISO 14064Verification Process Validation and Verification Process
GHG Assertion
Validation and/ orVerification
GHG Inventory Documentation and Reports
GHG Project Documentation and Reports
programmespecific
programmespecific
The Road Map for ISO 14064 Series
ISO 14064 - Greenhouse gases(1 Standard in 3 Parts)
Part 1:
Specification with guidance at the organization level for the quantification and reporting of greenhouse gásemissions and removals
Part 2:
Specification with guidance at the project level for the quantification, monitoring and reporting of greenhouse gás emission reductions and removal enhancements
Part 3:
Specification with guidance for the validation and verification of greenhouse gas assertions
ISO TC 207 / WG5 Deliverables

264
ISO 14064 Part 2: Key Issues
• Ensuring completeness in quantification of all relevant emissions reductions and removal enhancements;
• Tracking the impacts of project-based activities and induced emissions (or leakage);
• Identifying the environmental additionality of emissions reduction or removal enhancement projects; and
• Promoting transparency and considering public access to relevant project information.
ISO 14064 – Greenhouse Gases (Part 1)
• Direct GHG emissions and removals; energy indirect
GHG emissions; indirect GHG emissions
• Quantification methodology
• Uncertainly – parameter associated with the result of
quantification which characterizes the dispersion of the
values that could be reasonably attributed to the
quantified amount
• Requirement for quality management of data compilation
• Reporting
• Verification

265
ISO 14064 Part 2: Future Application
The standard should provide guidance on good practices for:
• project developers regardless of which emissions reduction regime they operate within;
• validators of emissions reduction or removal enhancement projects;
• administrators and regime developers; and
• investors and financiers seeking to evaluate project design documents.
ISO 14064 – Greenhouse Gases (Part 2)
• Base line scenario
• Planning and implementation
• Project validation
• Project verification

266
ISO 14065 – Greenhouse Gases
Specifications for greenhouse gas validation and verification bodies for use in
accreditation and other forms of recognition
ISO 14064 – Greenhouse Gases (Part 3)
• competent verifiers/validators (ISO 14065)
• Scope
• Criteria
• ..evidence collected in the assessments of controls, GHG
data and information, and applicable GHG programme
criteria supports the GHG assertion
• Offer a level of assurance

267
• National and International Policies:• Any policies that require quantification and reporting of
GHG emissions;
• Bottom-up approach to compiling UNFCCC national inventories (might be especially relevant for some transition countries);
• Implementation of emission trading schemes
• Development of National CDM strategies and quick-scan for CDM eligibility of projects
• Development of “green investment funds”
• Voluntary initiatives for GHG reporting or GHG management (e.g. Global Reporting Initiative)
Potential Use of ISO 14064
Potential Use of ISO 14064
• Organizations:– Companies with significant direct and indirect climate
impacts • For large transnational corporations for GHG management,
including internal emission trading;• For responsible management of their environmental impacts
and preparing for the “greening of the market”;• For identification of GHG issues in the supply chain;• In SMEs: quick scan of potential emissions and reductions and
estimation of CDM or JI potential
– Service companies (e.g. verifiers of inventories, brokers of GHG projects)
– Non-business organizations, such as municipalities orinternational financial institutions, (e.g. World Bank)


269
9.3 Group 3: CHP in CDM
Mr. Sytze Dijkstra, Research Executive, World Alliance for Decentralized Energy (WADE), notedthat although CHP CDM projects are touted as success stories, they are presently limited geo-graphically to India and Brazil and sectorally limited to sugar projects. He said that CHP has muchlarger sectoral potential, including hospitals and schools, and in the area of gas-fired CHP. He out-lined barriers identified by the group, including the difficulty in ensuring project financing due toupfront capital costs; the variability of grid access; and the existence of a cultural barrier for indus-tries not familiar with selling electricity. Dijkstra said the group recommended that UNIDO andWADE work together in an industrial context to develop broadly applicable methodologies.
Report on discussion group
Mr. Styze Dijkstra
Cogeneration projects have been successful in the Clean Development Mechanism to date: about20 per cent of all registered projects have involved some kind of CHP application. Most projectshave been in the sugar sector, but there have also been projects using industrial waste heat in theiron and cement sector. India and Brazil have been the most active countries.
The additionality of these cogeneration projects has sometimes been questioned, because many areeconomically viable in their own right, due to considerable efficiency improvement and fuel savings. However, industrial CHP projects in developing countries face many other barriers,including:
� High up-front investment costs
� Internal rate of return insufficient for commercial loans
� Lack of skills available locally, particularly for gas-turbine cogeneration
� Inadequate access to the electricity network for exporting electricity
� Unfamiliarity with the power sector
The initial success of CHP in the CDM does not show the whole picture. Cogeneration projectactivities have mostly been limited to a few countries, and a few sectors. Most projects use well-established technology for cogeneration in the food processing industry, using biomass wastes. ForCHP projects to remain successful in the CDM, it is therefore necessary to widen the application ofthe types of projects to more countries and sectors. In addition, other technologies, fuel types andapplication sites must be developed. The most important opportunities for new industrial cogener-ation projects are:
� Grid-connected gas-turbine cogeneration
� Building-integrated CCHP
� Biomass cogeneration in industries other than food processing

270
Clean Development through Cogeneration
Seminar on Energy Efficiency Projects in CDM and JI
Vienna19 March 2007
Sytze Dijkstra – Research ExecutiveWorld Alliance for Decentralized Energy (WADE)
To enable the expansion of the applications of CHP in the CDM, a number of new baselinemethodologies for the types of application listed above must be developed. At the moment mostmethodologies are for biomass CHP, so a particular need exists for gas-fired cogeneration method-ologies. Similarly, no methodologies for building-integrated CCHP are available, despite the con-siderable potential of such applications in developing countries. These projects face the additionalbarrier of being small, so that they would need to be bundled to become attractive for the CDM. Itis important that experience with such bundling is developed, and disseminated.
The interest in such baseline methodologies would be considerable, and many project developersare developing such projects. However, these project developers normally prefer to use an existingmethodology, rather than proposing one themselves, so they are all waiting for others to developthe methodology. This suggests a possible role for organizations such as UNIDO, WADE andother technical agencies and programmes.

271
3
WADE Mission
� WADE Research activities� Reports, market surveys and studies� WADE Economic Model
� WADE Advocacy activities� Policy advise for governments� Participation in legislative and regulatory proceedings� Cooperation with International Organisations, Institutions and
NGOs� WADE Promotion activities
� WADE Conferences and events� WADE Newsletters
2
� Founded in response to UNFCCC process� Non-profit research & promotion organisation
created June 2002
� Aims to accelerate the worldwide development of high efficiency cogeneration (CHP) and decentralized renewable energy systems
� Raises awareness of the substantial economic and environmental benefits Decentralised Energy (DE) can deliver
About WADEAbout WADE

272
5
Why Decentralised Energy?
Electricity Generation Worldwide (TWh)
(Source: International energy Agency 2002)
4
Electricity production at the point of use, irrespective of size, fuel or technology – on-grid or off-grid:
• High efficiency cogeneration (CHP)• On-site renewable energy• Industrial energy recycling and On-site power
• Otherwise known as:• Distributed Generation, Captive Power, Embedded Generation
What is Decentralized Energy (DE)?What is Decentralized Energy (DE)?

273
6
DE Benefits – Environmental
� CO2 emissions, kg per MWh� Heavy Fuel 844� Coal (FBC) 815� Gas oil (diesel) 815� OCT (open cycle) 582� CCGT (combined cycle) 354� CHP (combined Heat & Power) 269� Biomass 0� Renewables (wind, solar etc.) 0
Source : IEA + DIDEME
Fossil Fuel Emissions by Technology
7
WADE Economic Model – Combined Heat and PowerAdded Annual Fossil Fuel Use for Incremental year 20 Load
0
2
4
6
8
10
12
14
16
18
20
100% Central /0% DE
75% / 25% 50% / 50% 25% / 75% 0% Central /100% DE
% DE of Total Generation
Exa
jou
les (
EJ)
of F
ossil
Fu
el / Y
ea
r
Total "New" Central Generation Fuel Use Total "New" Distributed Generation Fuel Use
More efficient fuel use

274
8
Clean Development Mechanism – General Principles
CDM Global Principles
� Participation of the project partners is voluntary.
� The project results in real, measurable and long term benefits related to the mitigation of climate change.
� Additionality Principle: The reduction of emissions through the CDM project must be additional to reductions that would occur without the CDM project.
9
Project Types and CHP
Type I – Renewable Energy Projects
• I-A Electricity generation by the user
• I-B Mechanical energy for the user
• I-C Thermal energy for the user
• I-D Renewable generation for a grid
Type II – Energy Efficiency Projects
• Supply-side
• Demand-side and fuel switching
Type III – Other Projects• Methane recovery
• Transport, agriculture, land use
CHP Projects

275
11
Baseline Methodologies for CHP Projects
Baseline Methodology
•Project specific
• Cover all emissions within project boundary
• Adjusted for leakage
• Reflect local policies and regulation
• Use transparent data and methodology
Additionality
• Investment Analysis
• Barrier Analysis
• Common Practice Analysis
Considerations for CHP
• Up-front capital required
• Internal rate of return for commercial loans
• Not the cheapest option locally (AM0007)
10
Project Cycle for CHP ProjectsParty
1. Screening and Planning CDM Project
Project Stage
PP
Output
7. Issuance of CERs CDM-EB CERs
2. Preparing the Project Design Document (PDD)
PP Project Design Document
3. National Approval of Involved Parties
DNAPP
Letter of Approval
4. Validation and Registration DOE 1
CDM-EB
Validation Report
5. CDM Project Activity and Monitoring
PP Monitoring Report
6. Verification and Certification DOE 2 Verification and Certification Reports
Project Design Document
• Additionality assessment
• Baseline methodology
• Monitoring requirements
• Emission reduction calculation

276
13
Current Status of CHP ProjectsCumulative emissions reductions from registered CHP projects
0
500
1000
1500
2000
2500
3000
3500
4000
Sep-05 Oct-05 Nov-05 Dec-05 Jan-06 Feb-06 Mar-06 Apr-06 May-06 Jun-06 Jul-06 Aug-06 Sep-06
Months
Em
issio
ns r
ed
ucti
on
(kt/
yr)
Registered projects
Registered cogeneration projects (October 2006)
• 66 projects registered (20%)
• Annual emission reductions of 3.6 Mt CO2-eq
• Main countries: India (37%), Malaysia (29%), Brazil (14%)
12
Emission Reductions from CHP
Baseline emissions
• Electricity and heat generated
• Alternative generation processes
• Other emissions
Project emissions
• Fuel input
• On-site emissions from storage, processing etc
• Leakage
Emission Saving
Certified Emission Reductions

277
15
Current status – Industrial Waste-heat recycling
Emission reductions from industrial waste heat
recycling
0
100
200
300
400
500
600
Apr-06 May-06 Jun-06 Jul-06
Month
Em
iss
ion
re
du
cti
on
s (
kt
CO
2/y
r)
Activated Cabon
Cement
Iron
Steel
CDM projects using Industrial Waste-heat recycling:
• Large projects (average emission reduction 875,000 tCO2/yr)
• Main sectors: Steel, Iron and Cement
• Cost-effective emission reductions
• Issue of additionality
14
Current Status – Industrial sectors
Examples:
Sugar: Bagasse CHP
Paper:
Iron and Steel: Waste-heat recycling
Food: Fruit bunches forCHP
Registered Emission Reductions by
Sector
25%
4%
20%
2%
33%
3%
13%
Sugar
Paper
Iron & Steel
Textile
Food
Pow er
Other

278
17
CHP in the CDM - Brazil
• DNA: Interministerial Commission on Global Change (CIMGC)
• Sustainability criteria: Contribution to local economy
• Status of CHP: 26 out of 71 projects, mostly bagasse CHP
• Opportunities: Bagasse, oil refining, industrial energy recycling
Brazil - CHP and CDM Potentials
0
500
1000
1500
2000
2500
3000
3500
4000
4500
Bagasse
CHP
Oil Refining Chemicals Steel Pulp and
Paper
Rice mills
Sector
CH
P P
ote
nti
al (M
We)
0
1
2
3
4
5
6
7
CD
M P
ote
nti
al M
t/yr)
CHP Potential
CDM Potential
16
Industrial CCHP Project – Tetra Pak, Pune, India
Description
• Food packaging factory
• Project developer: Thermax India
• Existing 2.0 MW and 1.25 MW Cummins engines
• 342 TR Absorption Chillerreplacing electric cooling
• Cooling for production process (14ºC/7ºC)
• Electricity saving: 298.8 kWh/h
• Payback: 0.8 years

279
19
CHP in the CDM - India
India - CHP and CDM Potentials
0
500
1000
1500
2000
2500
3000
3500
Sugar Iron &
Steel
Beverages Rice mills Textiles Pulp &
Paper
Cement Fertiliser
Sector
CH
P P
ote
nti
al (M
We)
0
1
2
3
4
5
6
7
8
CD
M P
ote
nti
al (M
t/yr)
CHP Potential
CDM Potential
• DNA:National Clean Development Mechanism Authority (NCA)
• Sustainability criteria: Societal benefits and poverty reduction
• Status of CHP: 23 out of 104 projects
• Opportunities: Food processing, Iron and Steel, Chemicals
18
CHP in the CDM - China
• DNA: National Development and Reform Commission (NDRC)
• Sustainability criteria: energy efficiency, renewable energy methane capture
• Status of CHP: 1 out of 20 projects
• Opportunities: Power sector, large industry
China - CHP and CDM Potentials
0
500
1000
1500
2000
2500
3000
3500
4000
4500
5000
Power Oil
Refining
Steel Pulp and
Paper
Cement Food
sector
Landfill
gas
Coal-bed
methaneSector
CH
P P
ote
nti
al (M
We)
0
2
4
6
8
10
12
14
16
18
CD
M P
ote
nti
al (M
t/yr)
CHP Potential (2010)
CDM Potential

280
20
CHP in the CDM – Future
Neglected opportunities for cogeneration in the CDM:
• Building-Integrated CHP and CCHP
• Avoided network losses through on-site generation
• CHP replacing CCGT
Outstanding issues for the CDM:
• CDM creates additional emissions allowances
• Additionality difficult to prove
• Political uncertainty – Post-Kyoto arrangements
• Financial uncertainty – Carbon markets and carbon prices
Industrial cogeneration projects are likely to play an increasingly important role in the CDM and other GHG-reduction mechanisms
21
Clean Development through Cogeneration
Questions?
World Alliance for Decentralised Energy (WADE)
www.localpower.org

281
22
DE Project Examples – Mittal Steel Energy Recovery
• Conventional power generation discards 2/3 of energy output
• Most discarded energy can be profitably recycled on-site
• Efficient energy recycling requires decentralised generation
Mittal Steel – Chicago, IL
Source: Primary Energy, 2006
Industrial Energy Recycling• Streamlines production process• Supplies on-site energy demand
• Mittal Steel: 20%• Cost effective• Reduces Emissions
• CO2: 490,000 t/yr• NOx: 1,300 t/yr• SOx: 1,500 t/yr
23
WADE Research
DE Market data
Sector Specific DE Research
Research on Specific Challenges facing DE
Future Studies:
Onsite Power in the Cement Industry, August 2006
Cogeneration andthe CDM,September 2006
Onsite Power and Security, ?
WADE Economic Model

282
24
WADE Economic Model
Additional
Capacity
MW
Additional
Generation
GWh
Additional
Capacity
MW
Additional
Generation
GWh
Additional
Capacity
MW
Additional
Generation GWh
Additional
Capacity
MW
Additional
Generation
GWh
Additional
Capacity
MW
Additional
Generation
GWh
Additional
Capacity
MW
Coal ST 99 782 0 0 995 7,828 0 0 1,388 10,927 0
Oil ST 0 0 0 0 0 0 0 0 0 0 0
Mixed ST 340 894 0 0 3,590 9,435 0 0 5,622 14,774 0
Gas T&Oil Engines 320 0 0 0 320 0 0 0 1,744 0 0
Gas CC (CCGT) 1,298 7,263 0 0 10,564 76,080 0 0 18,706 125,969 0
Bioenergies 86 447 0 0 1,967 10,236 0 0 3,748 19,509 0
Nuclear 0 0 0 0 458 3,399 0 0 7,719 57,329 0
Interconnector 18 112 0 0 214 1,305 0 0 445 2,709 0
HEP / Pump Stor. 0 0 0 0 0 0 0 0 0 0 0
Tidal / Ocean / Wave 0 0 0 0 366 2,393 0 0 686 4,488 0
Wind - Onshore 387 1,117 0 0 3,950 11,419 0 0 6,245 18,052 0
Wind - Offshore 193 559 0 0 2,915 8,425 0 0 5,930 17,141 0
Solar 0 0 0 0 0 0 0 0 0 0 0
Empty 0 0 0 0 0 0 0 0 0 0 0
Empty 0 0 0 0 0 0 0 0 0 0 0
Total 2,742 11,174 0 0 25,338 130,520 0 0 52,233 270,897 0
100% DE
CG
2023
100% CG 100%
2004 2013
100% CG 100% DE100% CG
100% CG 100% DE DE Savings % Change
Total Capital Cost(Capacity + T&D)
Billions of £
Retail Cost (pence / kWh; new plant) 7.03 7.14 -0.11 -2%
Emissions (000 t):
NOx 112 28 84 75%
SO2 21 14 7 32%
PM10 1 3 -2 -244%
CO2 Emissions (Mt) 36.31 32.42 3.89 11%
100% CG 100% DE DE Savings % Change
11%
TOTAL CO2 EMISSIONS 81.64 77.74 3.89 5%
CO2 emissions from new capacity, over
20 years (Mt)36.31 32.4 3.89
Total CO2 in 2023
CO2 emissions from remaining base year
capacity (Mt)45.33 45.33 0.00 0%
Impact of Meeting Demand Change to 2023 with CG or DE
4%55 52 2
Annual CO2 Emissions From Total Year 20 Load
0
10
20
30
40
50
60
70
80
90
100% CG /
0% DE
75% / 25% 50% / 50% 25% / 75% 0% CG /
100% DE% DE of Total Generation
Millio
n M
etr
icT
onnes/Y
ear
CO2 emitted for total CG CO2 emitted for total DE
Capital / Investment Costs
2023 Return on Capital Financing Term
CG
2003 Installed Cost
(£/ KW)
Avg. Yearly £ Increase
(Reduction) in Costs
(%)
£ / KW % Years
Coal ST 994 994 0.0% 0.0% 994 10.0% 10.0% 20Oil ST 580 580 0.0% 0.0% 580 10.0% 10.0% 20Mixed ST 580 580 0.0% 0.0% 580 10.0% 10.0% 20Gas T&Oil Engines 500 500 0.0% 0.0% 500 10.0% 10.0% 20Gas CC (CCGT) 471 471 0.5% 0.5% 520 10.0% 10.0% 20Bioenergies 1200 1200 -2.0% -2.0% 801 10.0% 10.0% 20Nuclear 1903.6 1903.6 1.0% 1.0% 2,323 10.0% 10.0% 20Interconnector 470 470 0.0% 0.0% 470 10.0% 10.0% 20HEP / Pump Stor. 1300 1300 0.0% 0.0% 1,300 10.0% 10.0% 20Tidal / Ocean / Wave 4000 4000 -3.0% -3.0% 2,175 10.0% 10.0% 20Wind - Onshore 969.4 969.4 -1.0% -1.0% 793 10.0% 10.0% 20
Wind - Offshore 1591 1591 -3.0% -3.0% 865 10.0% 10.0% 20Solar 3300 3300 -5.0% -5.0% 1,183 10.0% 10.0% 20Empty 0 0 0.0% 0.0% 0 10.0% 10.0% 20Empty 0 0 0 0.0% 0 10.0% 10.0% 20
2023 Return on Capital Financing Term
DE
2003 Installed Cost
(£/ KW)
Avg. Yearly £ Increase
(Reduction) in Costs
(%)
£ / KW % Years
Gas CHP 670 670 0.0% 0.0% 671 10.0% 10.0% 20Gas micro-CHP 700 700 0.0% 0.0% 699 10.0% 10.0% 20Coal CHP 1400 1400 0.0% 0.0% 1,400 10.0% 10.0% 20Biomass CHP 1300 1300 -2.0% -2.0% 868 10.0% 10.0% 20Hydro - Small 1300 1300 0.0% 0.0% 1,300 10.0% 10.0% 20Wind (Local) 1500 1500 -2.0% -2.0% 1,001 10.0% 10.0% 20Solar (Local) 3500 3500 -5.0% -5.0% 1,255 10.0% 10.0% 20Empty 0 0 0.0% 0.0% 0 10.0% 10.0% 20Empty 0 0 0.0% 0.0% 0 10.0% 10.0% 20Empty 0 0 0.0% 0.0% 0 10.0% 10.0% 20
Existing Capacity and Generation
CG 2005
Capacity (GW) Load Factor
Generation(TWh) -
calculated
Generation(TWh) -
reported
Future LoadFactor
Coal ST 22.627 22.627 66.0% 66.0% 130.894 Total Coal 130.894 35.7%
Oil ST 3.262 3.262 9.5% 9.5% 2.716 130.89 2.716 7.2%
Mixed ST 6.403 6.403 0.0% 0.000 Total Oil
Gas T&Oil Engines 1.346 1.346 0.0% 0.000 2.72
Gas CC (CCGT) 24.373 24.373 59.6% 59.6% 127.250 Total Gas 137.483 66.1%
Bioenergies 1.453 1.453 58.2% 58.2% 7.409 127.25 9.042
Nuclear 11.852 11.852 72.4% 72.4% 75.168 81.618 78.3%
Interconnector 2.500 2.500 0.0% 0.000HEP / Pump Stor. 4.061 4.061 19.5% 19.5% 6.923 6.923 10.8%
Tidal / Ocean / Wave 0.001 0.001 0.0% 0.0% 0.000 0.000
Wind - Onshore 1.351 1.351 26.5% 26.5% 3.137 2.505 33.0%
Wind - Offshore 0.214 0.214 27.2% 27.2% 0.509 0.403 33.0%
Solar 0.000 0.000 9.7% 9.7% 0.000 0.000 9.7%
Empty 0.000 0.000 0.0% 0.0% 0.000 0.000 0.0%
Empty 0.000 0.000 0.0% 0.0% 0.000 0.000 0.0%
Total 79.443 79.443 354.006 371.584
DE 2005
Capacity (GW) Load FactorGeneration
(TWh) - calculated
Generation(TWh) -
reported
Future LoadFactor
Gas CHP - Industrial 4.216 4.216 61.6% 61.6% 22.737 Total Coal 22.737
Gas micro-CHP 0.000 0.000 30.0% 30.0% 0.000 7.10 0.000 30.0%
Coal CHP 1.451 1.451 55.8% 55.8% 7.097 Total Oil 7.097
Biomass CHP 0.124 0.124 46.7% 46.7% 0.506 0.00 0.506
Hydro - Small 0.000 0.000 50.0% 50.0% 0.000 Total Gas 0.000 50.0%
Wind (Local) 0.000 0.000 17.0% 17.0% 0.000 22.74 0.000 17.0%
Solar (Local) 0.000 0.000 9.7% 9.7% 0.000 0.000 9.7%
Gas CHP - MPP 0.000 0.000 95.0% 95.0% 0.000 0.000 95.0%
Empty 0.000 0.000 0.0% 0.0% 0.000 0.000 0.0%
Empty 0.000 0.000 0.0% 0.0% 0.000 0.000 0.0%
Total 5.791 5.791 30.340 30.340
Average Operating, Maintenance, & Fuel Expenses
O & M (Current
Plants)
O & M
(Future Plants)
O & M
Improvements
(Future Plants) Fuel Cost Fuel Cost
CG
tenths of pence /
KWh tenths of pence / KWh
Annualized Increase
(Reduction) £ / GJ
Annualized
Increase
(Reduction)
Coal ST 2.00 2.00 2.00 2.00 0.0% 0% 2.27 2.27 1.0% 1%Oil ST 3.00 3.00 3.30 3.30 0.0% 0% 3.92 3.92 3.0% 3%Mixed ST 3.00 3.00 3.30 3.30 0.0% 0% 2.50 2.50 2.0% 2%Gas T&Oil Engines 5.30 5.30 4.00 4.00 0.0% 0% 3.00 3.00 3.0% 3%Gas CC (CCGT) 2.00 2.00 2.00 2.00 0.0% 0% 6.88 6.88 5.0% 5%Bioenergies 5.30 5.30 4.70 4.70 0.0% 0% 2.00 2.00 2.0% 2%Nuclear 0.00 0.00 0.00 0.00 0.0% 0% 1.11 1.11 1.0% 1%Interconnector 0.00 0.00 0.00 0.00 0.0% 0% 0.00 0.00 0.0% 0%HEP / Pump Stor. 4.30 4.30 4.30 4.30 0.0% 0% 0.00 0.00 0.0% 0%Tidal / Ocean / Wave 8.00 8.00 7.00 7.00 0.0% 0% 0.00 0.00 0.0% 0%Wind - Onshore 0.00 0.00 0.00 0.00 0.0% 0% 0.00 0.00 0.0% 0%Wind - Offshore 0.00 0.00 0.00 0.00 0.0% 0% 0.00 0.00 0.0% 0%Solar 1.30 1.30 1.30 1.30 0.0% 0% 0.00 0.00 0.0% 0%Empty 0.00 0.00 0.00 0.00 0.0% 0% 0.00 0.00 0.0% 0%Empty 0.00 0.00 0.00 0.00 0.0% 0% 0.00 0.00 0.0% 0%
O & M (Current
Plants)
O & M
(Future Plants)
O & M
Improvements
(Future Plants) Fuel Cost Fuel Cost
DE
tenths of pence /
KWh tenths of pence / KWh
Annualized Increase
(Reduction) £ / GJ
Annualized
Increase
(Reduction)
Gas CHP 5.30 5.30 4.00 4.00 0.0% 0% 6.88 6.88 5.0% 5%Gas micro-CHP 2.00 2.00 1.50 1.50 0.0% 0% 6.88 6.88 5.0% 5%Coal CHP 5.10 5.10 5.30 5.30 0.0% 0% 2.27 2.27 1.0% 1%Biomass CHP 4.30 4.30 4.30 4.30 0.0% 0% 2.50 2.50 2.0% 2%Hydro - Small 6.70 6.70 6.70 6.70 0.0% 0% 0.00 0.00 0.0% 0%Wind (Local) 0.00 0.00 0.00 0.00 0.0% 0% 0.00 0.00 0.0% 0%Solar (Local) 2.00 2.00 2.00 2.00 0.0% 0% 0.00 0.00 0.0% 0%Empty 0.00 0.00 0.00 0.00 0.0% 0% 0.00 0.00 0.0% 0%Empty 0.00 0.00 0.00 0.00 0.0% 0% 0.00 0.00 0.0% 0%Empty 0.00 0.00 0.00 0.00 0.0% 0% 0.00 0.00 0.0% 0%
Compares DE with centralised generation on the basis of costs, emissions and fuel use
25
Decentralised Energy Systems
Source: Danish Energy Center

283
Linking Montreal and Kyoto Protocol: Chiller Demonstration Projects
Summary of DiscussionPoints in Discussion Group 4
Facilitator: Stefan Kessler, INFRAS
9.4 Group 4: Linking Montreal and Kyoto: Chiller demonstration projects and CDM
Mr. Stefan Kessler, Senior Project Manager, Infras, noted the availability of seed funding from theMontreal Protocol’s Multilateral Fund and the GEF for chiller demonstration projects. He said thegroup suggested the establishment of national level carbon funds fed from different CDM projectsto carry projects beyond the demonstration stage. He also reported that the group discussed moni-toring approaches and highlighted the need for in-built direct incentives, through revenue streamsfrom CERs, to ensure owners operate replacement technologies efficiently. The group concludedthat the methodology developed by the World Bank, known as NM0197, will be useful for otherchiller projects, and agreed that the destruction of recovered CFCs should not be included as arequirement in methodologies.

284
Präsentationstitel | 00. Monat 2001 | Vortragender | Seite 2
Barriers
- The discussion group members perceived the missingtrust of owners in the reliability of the new equipmentand it‘s maintenance requirements as the main barrierfor chiller replacement projects.
- Financial viability of chiller replacement is one of thebarriers but in many cases can be overcome withcommercial financing arrangement, involvement of Energy Saving Companies (ESCO), etc. dependingon the project area.
- Co-financing by Multilateral Fund under Montreal Protocol and GEF to complement CDM revenuesprovides a limited window of opportunity forimplementing demonstration projects. At the end of this limited period CDM methodologies and financingmodels must be available which reach the entirechiller market incl. the units in smaller countries .
Präsentationstitel | 00. Monat 2001 | Vortragender | Seite 3
Monitoring
- The monitoring concept has to be developed in viewof how the revenues from CERs will be assigned to the the project stakeholders. In contrast to large scalechiller projects where a strong implementing entitymay take a major responsibility in ensuring efficientoperation of the new chillers, small scale projectsmay need to provide a direct revenue stream to owners as an incentive to operate the units efficiently
- Detailed metering during project implementation will also provide relevant information for developingenergy efficiency policies.
- The stringent monitoring requirements as foreseenunder NM0197 will not suit the requirements of projects implemented in small countries. Approachesapplicable for addressing chiller replacement in smallcountries also need to be developed.

285
Präsentationstitel | 00. Monat 2001 | Vortragender | Seite 4
Baseline and project emissions
- If methodology NM0197 will be approved, the set out baseline procedures will very likely be useful also forother projects and methodologies incl. other chillerprojects.
- In NM0197 the aspect of future change(increas/decrease) in cooling load may need to beaddressed in more detail. The basic provisions forincluding including load variations however areincluded in NM0197. Over the project implementationperiod, changes in load will be the standard case and the methodology should not restrict improvements in the overall building systems.
Präsentationstitel | 00. Monat 2001 | Vortragender | Seite 5
Application of chiller methodologies to other technologies
- CDM approaches would be beneficial to addressother relevant technologies in relation to Montreal Protocol compliance such as Air-Conditioners, domestic and commercial refrigerators, etc.
- Existing chiller methodologies will not suit therequirements for addressing a large numbers of smallappliances as e.g. monitoring requirements are toostringent for application to large volumes of appliances.

286
Präsentationstitel | 00. Monat 2001 | Vortragender | Seite 6
Financing options
- Co-financing by Multilateral Fund under Montreal Protocol and GEF to complement CDM revenuesprovides a limited window of opportunity forimplementing demonstration projects. At the end of this limited period CDM methodologies and financingmodels must be available which reach the entirechiller market incl. the units in smaller countries .
- GEF supports approaches which look at the entirebuilding system in an integral way. While chillerrelated CDM activities will need to focus on the chillerunits, GEF co-financing may be used for enlarging theproject scope to an integrated system aproach.
- Suggestion was made to develop e.g. on a national level CDM based Carbon Funds which can be usedas revolving funds for multiplication of projects. However, no specific suggestions could be arrived at from the discussion.
Präsentationstitel | 00. Monat 2001 | Vortragender | Seite 7
Restrictions on use of refrigerant fromdiscarded systems
- Under the Montreal Protocol it is good practice to recover refrigerants from old installations. This shouldbe mandatory for all project activities under CDM involving refrigerant handling.
- A requirement to immediately destruct recoveredCFCs should NOT be included in methodologies. Theestablished procedures under the Montreal Protocoland specific national legislations will allow for:
- Direct reuse of the refrigerant in other installations(e.g. in older ones which can not be retrofitted on a commercially viable basis)
- Reclaim refrigerant to virgin standard and use as recycled refrigerant.
- Destruct refrigerant in specialised incinerationinstallations.

287
9.5 Group 5: Linking the EE and CDM/JI expert communities: CDM EE network
Mr. Maarten Neelis said the involvement of energy efficiency experts is key to improving CDMproject design. He identified calls for public input and methodologies as issues on which energy effi-ciency experts can contribute and said the group proposed a CDM energy efficiency expert group.He said that vast amounts of energy efficiency knowledge from a network of energy efficiencyexperts could be communicated to the CDM world, and highlighted existing protocols and stan-dards of practice that would be beneficial to CDM activities, such as the International PerformanceMeasurement and Verification Protocol (IPMVP) and energy management standards.
Report on discussion group
Ms. Anne Arquit Niederberger and Mr. Maarten Neelis
Who are we?
Following a quick round of introductions, a survey of the 11 participants showed that 6 regardedthemselves primarily as energy efficiency (EE) experts, 2 as climate change (CC) experts and 3 ashybrid EE/CC experts. This was a good mix to address the issue of better linking the two communities.
Goal of linking
Better cross-fertilization between EE and climate/CDM experts to leverage carbon markets forenergy efficiency
Entry points for EE expertise into CDM
The group identified four primary pathways that the expertise of the energy efficiency expert com-munity can flow to the CDM community:
1. Response to public calls for input from the CDM bodies2. Submission of new methodologies/projects to the CDM-EB for approval3. Direct participation in CDM bodies (e.g., Meth Panel, RIT, Meth Expert for Desk Reviews) 4. Unsolicited inputs to CDM bodies or Parties to the Kyoto Protocol.
It was agreed that none of these pathways had been effective, and that there was a need for:
� Top-down consideration of methodological issues related to energy efficiency under the CDMand
� Institutional arrangements that would ensure informed decisions on EE CDM by the CDMEB and Meth Panel, based on authoritative energy efficiency expertise.
The group suggested the creation of an international energy efficiency expert network that can giveunsolicited inputs, also directly to the countries involved in Kyoto (e.g. to the intermediary meet-ings annually in May in preparation of the COP). Participants stressed that such a network should

288
not be limited to CDM issues, since issues of quantification of energy savings and greenhouse gasemission reductions face other types of policies and measures (e.g., white certificate trading,domestic utility demand-side management), and considering the full breadth of energy efficiencypromotion programmes would contribute to greater fungibility among programmes.
What can the energy efficiency community deliver?
An Energy Efficiency Expert Network could bring existing expertise into the CDM/JI world.These inputs could be classified into the following areas (not strictly separated):
� Clear framework for methodologies (i.e., terminology; specification of which issues should betreated in the baseline itself vs. addressed via monitoring and baseline adjustments vs. in thecontext of gross-to-net adjustments)
� Inputs into the gross-to-net adjustment discussion: Within the EE community (e.g., utilities,ESCOs, government EE programme managers), there is quite some knowledge about reboundeffects and free-rider/spillover effects. This knowledge could be used to develop generic top-down tools/guidance on this issue.
� Tools/guidance on demonstrating barriers and additionality: Investment analysis as a demon-stration of additionality is in many cases not relevant in the context of EE CDM projects(which are often highly profitable, once barriers to implementation can be overcome). Barrieranalysis is therefore crucial to the demonstration of additionality for EE projects/programmes.However, current tools and guidance do not reflect the main barriers that EE programmes typically face, and the Meth Panel has demonstrated scepticism of barrier analysis for profitable projects. It was proposed that the EE Expert Network could compile information ongeneric and project-type specific barriers to EE initiatives that could then be used by individualproject developers to demonstrate additionality. It was regarded as wasteful and ineffective torequire each individual energy efficiency programme/project to document barriers, when thereis ample evidence or real, prevalent and persistent barriers to EE globally, many of which aresystemic in nature. Specifically, it was proposed that the Network could provide documenta-tion (based on the published literature) of:
Generic barriers that prevent the adoption of EE technologies/practices
Barriers to specific technologies/practices (e.g., industrial electric motor systems) and pro-gramme types (e.g., provision of financial incentives for high-efficiency equipment) thatcan yield large climate benefits. One output could be a list of energy efficiency technolo-gies and/or programme types that are judged by the CDM EB ex ante to be additional,which could be periodically reviewed.
It was also suggested that the EE experts could draft a tool or provide guidance for project develop-ers that would specify documentation requirements for barrier analysis of additionality that couldbe met with the types of existing information typically available in the developing country context.Requiring data that do not exist will prevent energy efficiency projects/programmes from goingforward. Participants stressed the urgency of removing barriers to EE, given that huge amounts ofcapital equipment/infrastructure will be built in the developing world over the next decade.

289
� Recommendation of appropriate Key Performance Indicators for specific technologies/sys-tems for approval by the CDM EB, which would make it much easier for methodology devel-opers to prepare new methodologies and for the Meth Panel to evaluate them.
� Development of methodologies (based on current good practice and taking into account thedeveloping country context for CDM) for top-down approval by the CDM EB (as has beendone for SSC and A/R projects): Within the context of energy efficiency programmes, numer-ous standards and EE programme methodology guidance documents have already been devel-oped, and could serve as a basis for the Expert Network to develop good practice methodologyguidance for the CDM. Special attention should be given to system approaches and designissues (e.g. compressed air, steam systems). At present, methodology developers are focusingon discrete technologies, even though they know that a system approach is needed, because ofthe difficulty of getting EB approval of methodologies that address systems that are viable inthe field.
More information on the methodological challenges facing EE projects/programmes and the typesof methodological inputs that the energy efficiency expert community could contribute is includedin the Seminar Issue Paper and other seminar documentation (papers, PowerPoint presentations),which can be accessed at www.unido.org.

290

291
Energy Use by, and CO2 Energy Use by, and CO2 Emissions from the Emissions from the
Manufacturing Sector in Manufacturing Sector in Selected CountriesSelected Countries
Ralph (Skip) Ralph (Skip) LukenLuken, UNIDO Expert, UNIDO Expert
10. Panel session VI: Transformingmarkets for energy efficiency
Paolo Bertoldi, EC Joint Research Centre, introduced the discussion and the panelists.
10.1 Presentations
Energy use by, and CO2 emissions from the manufacturing sector inselected countries
Mr. Ralph Luken, UNIDO Consultant

292
IntroductionIntroduction
•• The industrial (manufacturing) sector accounted The industrial (manufacturing) sector accounted for 26% of global energy use and emitted 18.5% for 26% of global energy use and emitted 18.5% of COof CO22 emissions in 2004 (IEA).emissions in 2004 (IEA).
•• Global and selected country trends in energy use Global and selected country trends in energy use from industrial growth between 1990 and 2004. from industrial growth between 1990 and 2004.
•• Comparison: energyComparison: energy--use and associated CO2 use and associated CO2 emission intensities at country level and selected emission intensities at country level and selected subsectorssubsectors..
The Decoupling Concept and Data The Decoupling Concept and Data
AvailabilityAvailability
•• Relative growth rates of environmental pressure Relative growth rates of environmental pressure and the economic activity with which it is and the economic activity with which it is causally linkedcausally linked..
•• Decoupling occurs when the growth rate of an Decoupling occurs when the growth rate of an environmentally relevant variable, energy use in environmentally relevant variable, energy use in this case, is less than the growth rate of the this case, is less than the growth rate of the economically relevant variable, industrial output economically relevant variable, industrial output in this case, over the same period of timein this case, over the same period of time..

293
GLOBAL AND SELECTED GLOBAL AND SELECTED COUNRY TRENDS IN COUNRY TRENDS IN
DECOUPLINGDECOUPLINGEnergy use (2004)
Country Group (number
of countries/total
number in group
%
Total
MVA
%
CO2
EmissionsRelative Absolute
Developed Countries
(24/24) 74 63 -17 5
Transition Economies
(6/29) 1.3 3 -66 -47
Developing Countries
(54/70) 24 33 -26 69
Least Developed Countries
(8/15) 0.05 0.1 NA 87
CountryCountry--level energylevel energy--use intensitiesuse intensitiesEnergy Use Energy Use intensity
"Energy use intensity
(toe/1000US$)"
Average
Annual
Growth (%)
1990 2004 1990 2004
Developed Market Economies
(23/23/23)* 0.4 0.23 0.19 -1.2 27 24
Transition Economies (9/7/9) -2.7 1.35 0.55 -4.2 37 27
Newly Industrialized
Countries (7/7/7) 7.8 0.23 0.21 -0.8 25 23
China (1/1/1) 4.6 2.08 0.72 -4.6 50 39
Other Developing Countries
(59/52/59) 3.5 0.72 0.78 0.6 27 24
Least Developed Countries Least Developed Countries
(13/12/13)(13/12/13) 19.619.6 0.660.66 2.162.16 16.316.3 1818 1111
Average
energy use
in industry
as a share
of total
energy use
Average
Annual
Growth (%)
Country Group

294
SUBSUB--SECTOR ENERGYSECTOR ENERGY--USE USE INTENSITYINTENSITY
• Energy-use data for selected manufacturing sub-sector in some countries (IEA).
• MVA data for most manufacturing sub-sectors and most countries (UNIDO).
• Same sector analysis avoids complexity of structural differences in economies for energy efficiency comparisons.
Chemical and petrochemicalChemical and petrochemicalChemical and Petrochemical
VA
(1995 US$)
CO2
-emissions
(Mt)
Developed (23/24 and
22/24) 156 5.5*108 26.2 297.6 4.2*10-7
Transition (9/29 and
9/29) 72 0.1*108 188.1 81 3.1*10-6
Developing (20/70 and
14/70) 217 1.2*108 134.8 312.7 43.3*10-7
CO2
–
use
Int.
Energy-
use
Int. (10-5)
(toe /
1000 US$)
Energy
use
(000’s Ktoe)Country Group
•• The per cent reduction in energy use in the chemical and The per cent reduction in energy use in the chemical and petrochemical subpetrochemical sub--sector, if developing countries were to meet sector, if developing countries were to meet developed countriesdeveloped countries’’ average energyaverage energy--use intensity, was estimated use intensity, was estimated to be 38 per cent less energy useto be 38 per cent less energy use
40% 5%78%

295
Pulp and paper subPulp and paper sub--sectorsector
•• The per cent reduction in energy use in the pulp and paper subThe per cent reduction in energy use in the pulp and paper sub--sector, if developing countries met developed countriessector, if developing countries met developed countries’’ average average energyenergy--use intensity, was estimated to be approximately 77 per use intensity, was estimated to be approximately 77 per cent less energy use in the subcent less energy use in the sub--sector.sector.
Paper, Pulp and Printing
Country GroupEnergy use
(000’s Ktoe)
VA (1995 US$)
Energy
-use
int.
(toe /
1000
US$)
CO2
emissions
(Mt)
CO2
Emissio
n
- int.
Developed (22/24
and19/24) 116 44.7*107 2.5*10-4 121.6 2.0*10-7
Transition (9/24 and
7/24) 5 1.3*107 4.3*10-4 6.8 5.3*10-7
Developing (12/70
and 9/70) 49 3.6*107 2.9*10-4 65.8 4.3*10-7
135% 91% 85%
Food and tobaccoFood and tobacco
•• The reduction in energy use in the food and tobacco subThe reduction in energy use in the food and tobacco sub--sector, sector, if developing countries were to meet developed countries if developing countries were to meet developed countries average energyaverage energy--use intensity, was estimated to be about 58 per use intensity, was estimated to be about 58 per cent less energy use.cent less energy use.
Food and Tobacco
VA CO2
(1995
US$)
emissions
(Mt)
Developed (21 and
20) 66 5.1*108 1.2*10-4 121.5 1.9*10-7
Transition (9 and 8) 26 0.3*108 3.5*10-4 26.5 6.0*10-7
Developing
Countries (13
and10) 79 1.1*108 2.0*10-4 100.4 4.5*10-7
CO2
Int.
Energy
-use
Int.
(toe /
1000US$)
Energy use
(000’s Ktoe)Country Group
20% 21%80%

296
Textile and leatherTextile and leather
•• The reduction in energy use in the textiles and leather subThe reduction in energy use in the textiles and leather sub--sector, sector, if developing countries were to meet developed countries if developing countries were to meet developed countries average energy average energy --use intensity, was estimated to be 75 per cent use intensity, was estimated to be 75 per cent less energy use.less energy use.
Textile and Leather
VA
Energy use
(Ktoe) (1995 US$)
Energy-
use
Int. (toe/
1000 US$)
CO2
emissions
(Mt)
CO2
Int.
Developed (20/24 and
18/24) 14 15.8*107 1.01*10-4 22.17
1.72*10-
7
Transition (9/29 and
8/29) 5 0.93*107 2.32*10-4 3.44
2.89*10-
7
Developing (13/70 and
8/70) 56 6.66*107 1.11*10-4 66.75
2.53*10-
7
Country Group
300% 200%58%
SUMMARY/CONCLUSIONSSUMMARY/CONCLUSIONS•• The comparison of energyThe comparison of energy--use intensities supports the use intensities supports the
proposition that there still remains significant potential to reproposition that there still remains significant potential to reduce duce energyenergy--use intensity and the associated CO2 emissions. use intensity and the associated CO2 emissions.
•• 2 2 ‘‘what if what if ’’ scenarios, all developing countries meeting the scenarios, all developing countries meeting the average energyaverage energy--use intensity of developing countries and all use intensity of developing countries and all developing countries meeting the average energydeveloping countries meeting the average energy--use intensity of use intensity of developed countries, found that there could be the potential to developed countries, found that there could be the potential to reduce energy use by 40 and 70 per cent respectively.reduce energy use by 40 and 70 per cent respectively.
•• The subThe sub--sector analysis of energysector analysis of energy--use intensity for four subuse intensity for four sub--sectors, chemicals and petroleum, pulp and paper, food and sectors, chemicals and petroleum, pulp and paper, food and tobacco and textiles and leather, supports the findings of the tobacco and textiles and leather, supports the findings of the country level analysis that there is potential for improving country level analysis that there is potential for improving energyenergy--use efficiencyuse efficiency

297
The Climate Change Projects Office
Industrial Energy Efficiency Projects in the Clean Development
Mechanism and Joint Implementation
UNIDO/CTI/UKTI SeminarVienna International Centre
19 -20 March 2007
Jed JonesThe UK Climate Change Projects Office
Industrial energy efficiency projects in the Clean Development Mechanism and Joint Implementation
Mr. Jed Jones, DTI CCPO
Mr. Jed Jones, Principal Projects Advisor, Department of Trade and Industry Climate ChangeProject Office, UK, explained that poor energy efficiency is widespread, on both the supply anddemand sides, and said the central question around energy efficiency CDM projects is additional-ity. He stressed the need to demonstrate additionality and suggested regional, sectoral and techno-logical benchmarks were necessary to do this. He said supply-side energy efficiency projects fit wellwith the CDM and JI, but that demand-side projects require lateral thinking, and he questioned ifthe CDM is the most appropriate vehicle for demand-side energy efficiency projects or if a moreappropriate alternative could be developed.

298
The Climate Change Projects Office
The Climate Change Projects Office
The Problem
The problem of low energy efficiency is widespread. It is not limited to non-Annex I countries or the EITs.
• Supply side
Poor energy utilisation
Inadequate management practices
• Demand side
Poor training
Lack of maintenance
Neglect

299
The Climate Change Projects Office
The perception of the Kyoto mechanisms
We must respect the objectives of the CDM/JI,
particularly
• Sustainable development
• Integrity and credibility
The Climate Change Projects Office
Additionality
Additionality is not going to go away
• Many registered CDM projects are considered not to be additional
• These projects will survive their crediting period
• Do not repeat mistakes of the past

300
The Climate Change Projects Office
How do we assure additionality
• Do not reward bad practices or neglect
• Set appropriate baselines for demand side
projects
Regional
Sectoral
Technological
The Climate Change Projects Office
How do we move forward
• Do not reward bad practices or neglect
• Set appropriate baselines for demand side projects
Regional
Sectoral
Technological
BENCHMARKS

301
The Climate Change Projects Office
Does Energy Efficiency have a future in the CDM and JI
There should be a future for energy efficiency in the mechanisms, particularly on the supply side
Demand side projects need innovative lateral thinking. Is the CDM the best vehicle to undertake these projects?
Could demand side projects be financed through a different vehicle, e.g. through a re-structured adaptation fund?
The Climate Change Projects Office
The UK Climate Change Projects Office
Thank you and good luck!
Jed Jones
Tel: +44 (0)20 7215 3748
www.dti.gov.uk/sectors/ccpo/

302
Barriers to improving energy efficiency
Ms. Marianne Moscoso-Osterkorn, REEEP
Ms. Marianne Moscoso-Osterkorn, International Director, REEEP, discussed barriers to improv-ing energy efficiency, highlighting lack of institutional support for energy efficiency measures andsubsidies for fossil fuels. She stressed the need to increase support for improving energy efficiencyfrom the financial sector, and suggested that perceptions of energy efficiency activities might needimproving. She suggested the CDM’s present structure is not appropriate for typical energy effi-ciency projects, citing examples of top-down methodologies for industry and building energy effi-ciency, which have been created but are not being used.
The slides for Ms. Moscoso-Osterkorn’s presentation are unavailable.
Financing of projects by means of JI/CDM
Mr. Oliver Walters, VA Tech Finance GmbH
Mr. Oliver Walters, Vice President, VA TECH Finance, discussed the financing of CDM and JIprojects. He presented a case study of the Hydro Electric Power Plant Tsankov Kamak in Bulgaria,which involved the financing of an 80 Megawatt (MW) hydro power plant. He highlighted thesuccess of the intersectoral synergies required to implement this project. He also noted the benefitsto Austria, which secured its first JI deal, and to Bulgaria, which reduced carbon dioxide emissionsequivalent to the fossil fuel required to generate 200 GWh per year.
1Global Export and Sales Finance
VA TECH Finance GmbH
SEMINAR ON ENERGY EFFICIENCY PROJECTS IN JI/CDM
Financing of Projects by means of JI/CDM
UNIDO, Vienna, Austria
March 20th, 2007
Oliver WALTER

303
2
Global Export and Sales Finance
VA TECH Finance GmbH
Financing is a most decisive step in the entire project development
process, it is not a bolt-on element, which can be set up at the end of a
process, but must be secured and embedded early in the process!
� Finance Dept./Institutions shall be involved at an early stage of a
project!
� a good and bankable project must be identified at the beginning!
� lack of realistic and viable projects!
� convincing approach towards potential lenders
(also bankers have to be trained!)
Financing in the Project Development Process
3
Global Export and Sales Finance
VA TECH Finance GmbH
• Third party financing of - in particular large scale - projects is a
challenge and has to be structured well.
• Kyoto related financing is not yet widely known and adopted and
often companies have to finance their investments themselves!
• Funds are available but it is often difficult for host countries to make
use of them (collateral, required min. equity, involvement of local
banks,..).
Financing, the greatest barrier?

304
4
Global Export and Sales Finance
VA TECH Finance GmbH
Sources for Kyoto related financing might be:• Funds/donors:
Out of various energy efficiency, carbon or private funds f.ex. the Global Environment Facility (GEF, www.gefweb.org) has given since 1995
over USD 1 bio in grants to climate change activities in developing countries.
The Special Climate Change Fund finances projects relating to technology
transfer
(http://unfccc.int/cooperation_and_support/financial_mechanism/special_climate_change_fund/items/3657.php).
• Export Credit Agencies: so far, only limited experience
• International Financial Institutions (EIB, EBRD, NIB,..)
public sector financial institutions usually require tendering.
• commercial banks: required tenors, amounts,..?
Sources of Financing / Risk Insurance
5
Global Export and Sales Finance
VA TECH Finance GmbH
Involvement of ECAs ensures:
• longer credit periods (construction period plus generally up to 10 or
12y repayment)
• lower interest rates (CIRR or even below)
• lower risk premiums, due to national export promotion schemes
Local capital markets/banks are in most cases:
• only active in rather short term transactions
• lower volumes and
• characterized by liquidity problems
� off-shore escrow accounts might be door-opener for set-up of
comprehensive bankable financing structure!
ECA financing vs. local financing

305
6
Global Export and Sales Finance
VA TECH Finance GmbH
Establishing the necessary enabling environments, including removing of
barriers remains an essential element not only in relation to financing
but also to the overall process of technology transfer.
� important aspect for prove of financial additionality in Baseline Study!
� take into account trade, investment and environmental policies!
� sustainable development objectives have to be made palatable to financial
institutions/ ECAs (generally, MoF is behind National Carbon Fund and ECA,
one budget pot! - national measures vs. flexible instruments.)
� innovative legislation linked with incentives
� a good understanding and cooperation between involved government
institutions is a precondition, often a MoU is of great value!
(Financial) environments
7
Global Export and Sales Finance
VA TECH Finance GmbH
• focus on creditworthiness of Borrower/Guarantor and country risk
often requires challenging security packages
• more and more, traditional securities do not suffice anymore in
particular for high volume projects (pledge, mortgage, corporate
guarantees, prom. notes,…)
� cash payments for ERUs/CERs by a purchasing fund/nationalJI/CDM program are considered as bankable security from a lender’s point of view!
Collateral Structure

306
8
Global Export and Sales Finance
VA TECH Finance GmbH
• Emission Reduction Purchase Agreements are concluded between
the owner of the ERUs/CERs in the host country and the buyer of the
Certificates. Upon Commercial Operation of a plant (= start of
repayment period) and successful Monitoring, ERUs/CERs will be
generated, issued and thereafter transferred from the national
register of the host country to the fund‘s country.
• So far, only PPAs were accepted as security by banks, nowadays
ERPAs become more commonly accepted by Lenders as bankable
and reliable collateral.
• it is favourized to have ERU/CER-payments by the buyer to be
effected on an off-shore escrow account, serving as partial
repayment of the loan.
ERPA as collateral – escrow account
9
Global Export and Sales Finance
VA TECH Finance GmbH
• collect info and build up detailed knowledge of JI/CDM regulations
• select good, JI/CDM-eligible project
• company’s in-house common understanding and convince
Management for JI/CDM as useful instrument and benefit
• bankable security structure for set-up financing
• have a clear picture on additional JI/CDM related cost � PIN at early
stage to potential buyer for 1st cross check might save stranded cost
• together with client early positioning towards involved (non-) govt.
institutions (Ministries, Consultants, Banks, Embassies, IE/OE,…)
• close co-operation between related government entities
Key factors for success

307
10
Global Export and Sales Finance
VA TECH Finance GmbH
Carbon Financing Structure
off-shore escrow account
partia
l repaym
ent o
f loan
payments for CERsnat. JI/CDM Fund
PDD, Validation Registration
CERsERPA
co-operation
support of approval
host country govt. - DNA
Government
support, LoE, LoA
co-o
pera
tion
Lender
credit agreement
cover
additional collateral package
Exporter
Importer
supply
contra
ct
ECA
cover
11
Global Export and Sales Finance
VA TECH Finance GmbH
Simplified CER revenue calculation
Project: Hydro Power Plant, EUR 100 mio
Installed Capacity: 2 x 45 MW
Annual Output: 220.000 MWh
Carbon Factor acc. to BLS: ~ 1 ton of CO2e/MWh
Tons of CO2 avoidance: approx. 220.000 tons of CO2e per annum
CERs: approx. 220.000 CERs shall be issued/annum
Commercial operation: 1/2008
Kyoto Period: 2008-2012
Price per CER: EUR 5,-
Revenues: EUR 5.500.000,- during 1st Kyoto Comm.Period

308
12Global Export and Sales Finance
VA TECH Finance GmbH
Case Study:
Financing of a JI-Pilot Project
under the Kyoto Protocol
’HEPP Tsankov Kamak’ - Bulgaria
13Global Export and Sales Finance
VA TECH Finance GmbH
Project Data
Hydro Power Plant Tsankov Kamak (2x40 MW)
• Total Project Cost: approx. EUR 200 Mio.
• Client: NEK, Natsionalna Elektricheska Kompania
(investor, owner, operator & borrower)
• Exporters: - VA TECH HYDRO
- ALPINE MAYREDER
- Verbundplan

309
14Global Export and Sales Finance
VA TECH Finance GmbH
Starting Point in 2001
Approach of IFIs and ECAs (OeKB) for Financing:
Project Cost:
MEUR 200 versus MEUR 5 max. OeKB cover for BG
Security:
NEK corporate risk versus request for State Guarantee
Tenor:
16 y versus cover of up to 5 y repayment period
Client:
100% state owned versus cover only for private clients
15
Global Export and Sales Finance
VA TECH Finance GmbH
Development
• Kyoto Protocol approach:
Tsankov Kamak to be realized as Joint Implementation (JI)-Project
based on the Kyoto Protocol
• Memorandum of Understanding: Sept. 2nd, 2002
Ministry of Environment, Austria – Bulgaria
• Pilot Project: November 2002
Tsankov Kamak declared as Pilot Project between Austria & Bulgaria
• Supply Contracts: signed Oct. 1st, 2003
• Credit Agreements: signed Nov. 14th, 2003, Financial Closing 4/2004
Deal of the Year, awarded by Deal of the Year, awarded by EuromoneyEuromoney/Trade Finance Magazine/Trade Finance Magazine

310
16Global Export and Sales Finance
VA TECH Finance GmbH
Financing
EXPORT CREDIT AGREEMENT- EUR 100 mio. loan
- 5 commercial banks
- Tenor: 16 years
- ECA: Cover of 5 Export Credit Agencies (A, CZ, D, F, S)
COMMERCIAL CREDIT AGREEMENTS- 4 loans, totaling to EUR 120 mio.
- 1 commercial bank
- Tenor: 7 years
17Global Export and Sales Finance
VA TECH Finance GmbH
Collateral structure
a mixture of structured security package consisting of,
inter alia, Bulgarian government involvement, various
escrow accounts, pledge of assets, mortgage of the
site, promissory notes,…

311
18Global Export and Sales Finance
VA TECH Finance GmbH
BASELINE STUDY: elaborated by Austrian Consultant- international Validation- official recognition as JI-project
EMISSION REDUCTION PURCHASE AGREEMENT:
concluded between NEK and Kommunalkredit for transfer of ERUs � revenues serve as collateral!
EMISSION REDUCTION UNITS (ERUs):
Upon commercial operation (2008), ERUs will be generated and purchased by the Republic of Austria (approx. 200.000 ERUs/year).
KYOTO PROTOCOL ASPECTS
19
Global Export and Sales Finance
VA TECH Finance GmbH
Paym
ent o
f
inte
rest,
prin
cip
al
Emission
Payments
off shore
escrow accounts
MEER, MoF Pledge
Agreement
4 annual payments
(KYOTO-) FINANCING STRUCTURE
Em
ission
Reductio
n
Purch
ase
Agre
em
ent
Em
ission
Certifica
tes
Base
Line
Study
(BLS)
Kommunalkredit
KWI
DNV
validation
of BLS
info for
BLS
NEK(Bulgarian Utility
company)
Austrian
Supplier’s Group
OeKB ECA
lenders
G3G1
AgreementsS
uppl
yco
ntra
cts
Comm.
lenders
intercreditor agreement
Loan
reinsurance
VA TECH FINANCE GmbH & Co

312
20Global Export and Sales Finance
VA TECH Finance GmbH
JI/CDM is a win-win situation for both parties!
AUSTRIA
• 1st JI/CDM project
• export increase
• tax income
• job creation
• higher OeKB cover
MEUR 5 � MEUR 80!!!
BULGARIA
• green, clear energy
• reduction of CO2-Emissions
• job creation
• know-how transfer
• overcome barriers
• WWTP Devin
Excellent cooperation between both countries:Ministries, Embassies, Trade Commissions, Banks,…..
21Global Export and Sales Finance
VA TECH Finance GmbH
CONTACT DETAILS:
VA TECH FINANCEOliver WALTER+43-1-8920903 23

313
UNDP approach to transforming markets for energy efficiency
Mr. Vladimr Litvak, UNDP
Mr. Vladimir Litvak, Regional Team Leader, Energy and Environment, UNDP, discussedUNDP’s efforts to transform markets for energy efficiency, involvement in CDM projects and itsactivities as an implementing agency for GEF. He highlighted CDM activities that contribute toUNDP’s wider development goals to address climate change and increase sustainable development,such as its activities in capacity building in developing countries, establishing designated nationalauthorities, and developing CDM strategies, pipelines and new projects.
UNDP Approach to Transforming Markets for Energy Efficiency
Vladimir Litvak, UNDP

314
Global Environment Facility, period 2006-2010 :
US$1 Billion for Climate Change Mitigation in
Developing Countries & Economies in Transition
�The GEF is the Financial Mechanism of the UNFCCC Convention
�GEF projects focus on policy, legal and institutional reforms (environmental fiscal reform, resource pricing, access to information, property and land tenure rights, etc. ) in order to remove barriers and transform markets.
�UNDP is one of GEF implementing agencies
GEF Mitigation Mission
To develop and transform the markets for energy and mobility in developing countries and economies in transition so that over the long term, they will be able to grow and operate efficiently toward a less carbon-intensive path.

315
GEF Approach to MT
barriers that require attention generally relate to five market characteristics: policy; finance; business skills; information; and technology. The GEF’sapproach to market transformation focuses on removing barriers related to these five pillars or dimensions of the markets being addressed.
GEF role in stimulating MT
GEF – Phase I
Carbon Finance – Phase II
Adoption of Innovations: Market
Transformation
Time
Sa
tura
tion
%
Early Entry-Phase I
Market Take-off- Phase II
Market Saturation or Maturity-Phase III

316
GEF EE Programming
• Energy Efficient Buildings
Scope: This program area covers the entire spectrum of the building sector, including the building envelope and the energy-consuming systems and appliances used in buildings for heating, cooling, lighting, as well as household appliances and office equipment.
Evolution: The initial focus will continue to be on appliances, with support to lighting and refrigerators phasing out. Emphasis will shift to building efficiency over the course of GEF 4.
Carbon finance may be useful to “incentivize” replication or accelerate market dissemination.
GEF EE Programming
• Energy Efficiency in Industry
Scope: This program covers the energy systems in industrial manufacturing and processing, including combustion, steam, process heat, combined heat and power, electricity generation, and other public utilities. Adoption of an appropriate energy pricing framework is essential to ensure project effectiveness.
Evolution: this programming area is expected to evolve into focused, sector-specific, technology transfer programs focusing on GHG-intensive industries. This programming area may be also used totest potential modalities for sector-specific or technology-specific GHG mitigation programs for use in GEF-4 and beyond.
Carbon finance may be useful to create incentives for replication to accelerate market saturation.

317
UNDP GEF to UNDP EF
• Combining and sequencing ODA, GEF and carbon finance
• Linkage to UNDP core development work
• Development co-benefits
• MDG Carbon Facility: programmatic CDM/JI?

318
Industrial system energy efficiency: potential and opportunity
Ms. Aimee McKane, LBNL
Ms. Aimee McKane discussed building a market for IEE services and the importance of identifyingwhere business and public policy intersect. She highlighted the benefits of public-private partner-ships and stressed that the public and private benefits of potential projects need to be identified upfront.
Building a Market for Industrial Energy Efficiency Services
March 20, 2007
Vienna, Austria
Aimee McKane, Lawrence Berkeley National Laboratory
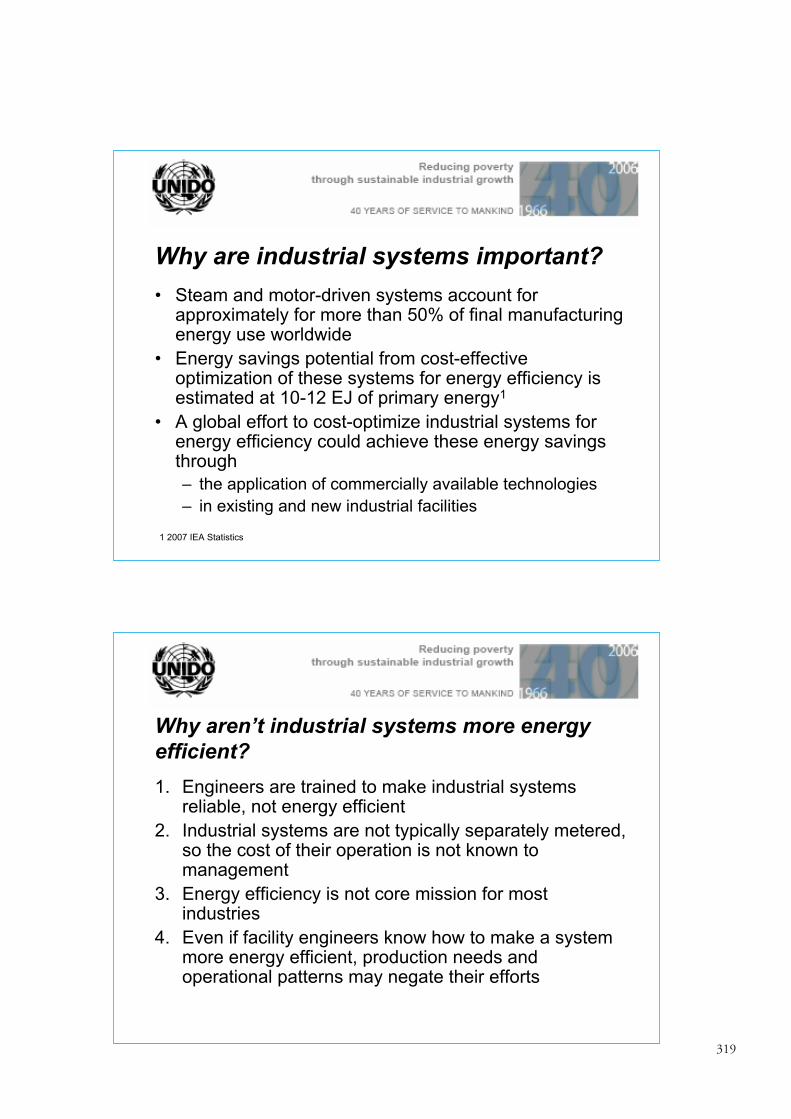
319
Why aren’t industrial systems more energy efficient?1. Engineers are trained to make industrial systems
reliable, not energy efficient
2. Industrial systems are not typically separately metered, so the cost of their operation is not known to management
3. Energy efficiency is not core mission for most industries
4. Even if facility engineers know how to make a system more energy efficient, production needs and operational patterns may negate their efforts
Why are industrial systems important?• Steam and motor-driven systems account for
approximately for more than 50% of final manufacturing energy use worldwide
• Energy savings potential from cost-effective optimization of these systems for energy efficiency is estimated at 10-12 EJ of primary energy1
• A global effort to cost-optimize industrial systems for energy efficiency could achieve these energy savings through – the application of commercially available technologies
– in existing and new industrial facilities
1 2007 IEA Statistics
320
Role of Government• Level the playing field
– Develop and issue standards that support a market transition to more energy efficiency industrial systems
• Energy management standards• System standards/protocols
• Design program with industry– Work with both end use and supplier companies to build in both
energy efficiency and business benefits
• Build capabilities– Provide training and technical assistance to develop the
necessary skills
• Develop supporting policies– Publicity and recognition – Financial incentives
What makes industrial energy efficiency so challenging?• Energy use in industry is much more related to
operational practices than the commercial & residential sectors
• Energy use in industry changes with variations in production volume and product mix
• Industrial energy efficiency is not a product that can be bought and installed
• Industrial energy efficiency involves changing a corporate culture

321
Role of suppliersIndustrial Equipment Suppliers• Have close relationships with their industrial customers over
a long period of time
– relied on for emergency response & maintenance
– valued source of expert advice
• Can have an important role in encouraging plants to optimize their industrial systems
• Can discourage industrial facilities from changing traditional, inefficient practices
Partnership engages industrial suppliers by helping them to identify a business opportunity in more energy efficient practices
Role of industry (end use)• Management commitment to managing energy
• Establish an energy management plan
• Empower an energy team to implement the plan and comply w/standard
• Be open to changing traditional practices
• Measure and document progress
• Participate in recognition programs
• Support financial incentives that require validated energy savings

322
Partnering as a Business Opportunity
Equipment Supplier as ESCO
• Suppliers trained in system optimization
• Offer customers a package of system services rather than components and maintenance
• Supplier advantages:
– Existing customer relationship
– More robust financial rating than many ESCOs
– Detailed knowledge required to develop cost-effective contracts
Role of ESCOsEnergy Service Companies (ESCOs)• Provide customers with a range of services to develop
energy efficiency projects
• Offer industrial facilities the potential to develop projects “off budget”
• Are under-represented in industrial markets
– Typically trained in commercial/residential
– Tend to focus on “cross-over” measures like lighting and district heating or develop a narrow area of specialty
Partnership could bring additional financial resources to system optimization projects, especially in developing countries

323
Structuring Effective Partnerships• Purpose:
– Characterize the public benefit (in this case energy efficiency, GHG emission reduction)
– Work with companies to identify the intersecting private interests that have the potential to carry the desired actions forward
• Key Questions:– What is the potential contribution of each participant in
the collaboration (why are they desirable partners)?
– What is their initial motivation to join the collaboration?
– What are their primary drivers?
– What do they hope to gain from their participation?
Utility Companies• In the US, utility companies have been very effective
partners– Since the 1980s, many states have rewarded utilities for
conserving energy in lieu of new power plant construction
– Utility restructuring has created some challenges
– Many states have sustained or re-entered the market for energy efficiency through the levy of public benefit charges
• Utilities typically assign account representatives to service large industrial customers– Offer financial incentives for system assessments and energy
efficiency projects
– Sponsor system optimization training
• Frequently have deeper pockets than state government

324
How partnership can workGovernment can:
• Develop partnerships through “organizations of interest”
– Industrial companies with multiple facilities and supply chains
– Trade associations- supplier and end user
– Utilities
– State governments
– Energy efficiency NGOs
• Develop tailored agreements toward a common goal
– Offer “brand affiliation”
– Define the scope, expectations, and the period
– Be consistent
– Reward results
Key QuestionsAs a result of the proposed partnership
• What will take place to promote greater energy efficiency?
– Is it better than business-as-usual?
– Can the results be measured?
If these questions cannot be answered, the public benefit has not been identified
• Is industry willing to invest (time, money, staff, expertise) in the proposed activities of the partnership?
• How this activity be sustained over time with limited investment of public resources?
If these questions cannot be answered, the business benefit has not been identified

325
US DOE Allied Partner ProgramPeak of operation (1997-2004)
• ~ 200 Allied Partners with signed agreements
• Voluntary, no fee
• Included associations, suppliers, utilities, states, energy efficiency organizations
• Allied Partners – Distributed more than 10 times the amount of USDOE
information annually than any other program element
– Most frequent host for training sessions
– Generated 2/3 of program energy savings
Developing a partnership networkGovernment signs agreement w/
trade associationOne to one
One to many
Many to many
Association invites members to
become active participants and
to align with the “brand”
Active, affiliated member
companies work with customers
or employees
Hundreds of organizations
Thousands of organizations
One organization
326
Aimee T. McKane
Lawrence Berkeley National Laboratory
P.O. Box 790
Latham, NY 12110
USA
518 782 7002
For more information:
Benefits
• Cost-effective outreach on a limited budget
• Leads to widespread implementation
• Built-in exit strategy
Trade-offs• Loss of control (perceived or real)
• Potential for diluting program message
• Need to maintain contact with the partners

327
10.2 Discussions
Participants stressed that energy efficiency projects must be made more attractive to financial insti-tutions. Noting that commercial institutions respond to changes in the market and cannot beexpected to lead the market, one participant said the energy efficiency sector must present propos-als to attract investment. Another participant noted the increased support for energy efficiency andcarbon market projects from merchant and investment banks. Some participants said that publicand institutional perceptions act as a barrier to energy efficiency projects and proposed the alterna-tive term “energy optimization” and approaching energy efficiency projects from an energy securityperspective to increase appeal.
back to
first page

back to
first page

329
11. Annex I: List of participants
Country Name
Albania Ms. Emira Fida Mr. Laci Hysni Ms. Mirela Kamberi Mr. Zija Kamberi
Austria Mr. Karl Fiala Mr. Miles Fischer Mr. Hiroshi Fujiwara Mr. Michael Haslinger Mr. Peter Jenkins Mr. Peter Franz Koegler Mr. Peter Pembleton Mr. Oliver Percl Mr. Vladimir Stehlik Mr. Christian Steinreiber Mr. Oliver Walter Ms. Evelin Walzer Mr. Daniel Weisser Mr. Wolfgan Wetzre Ms. Gertraud Wollansky
Azerbaijan Mr. Emin Teymurov
Brazil Mr. A.Valadares Mello Mr. G. Alves Soares
Bulgaria Ms. Daniala Stoycheva
China Mr. Li Tienen
Croatia Mr. Tonko Curko Ms. Vesna Kolega
Denmark Ms. Chia-Chin Cheng Mr. Adrian Lema
Egypt Mr. Ihab Elmassry Ms. S.Hisham Fouad Mr. Ezzat Lewis Hannalla Agaiby Mrs. Lydia Mohamed Kamel Elewa
back to contents page

330
France Mr. Philippe Bosse Mr. Paul Waide
Georgia Ms. Marina Shvangiradze
Germany Mr. Martin Burian Ms. Renate Duckat Ms. Ayse Frey Mr. Thomas Grammig Mr. Stefan Guldin Mr. Daisuke Hayashi Mr. Patrick Matschoss Mr. Sudhir Sharma Mr. Sam Warburton
Iran (Islamic Rep. of) Mr. N. Mohammadreza Omidkhah
Italy Mr. Paolo Bertoldi Mr. Daniel Rossi
Japan Ms. Kaori Hayashi Mr. Taiki Kuroda Prof. M. Kurushima
Kenya Mr. James Wakaba
Macedonia Ms. Elena Bucevska Mr. Nikolov Igor Mr. Marin Kocov
Malta Mr. Marco Cremona
Malysia Mr. Krishna V.S. Kannan
Moldova Mr. Andrei Percium Mr. Vasile Scorpan
Netherlands Mr. Stefan Bakker Mr. Sytze Dijkstra Mr. Maarten Neelis
Nigeria Mr. Kasimu Bayero Mr. Okey Oramah
Peru Mr. Luis Ugarelli
Philippines Ms. Alice Herrera
Portugal Mr. Anibal De Almeida
Republic of Korea Mr. Kwon Yong-Seok
Senegal Mr. Ndiaye Cheikh Sylla
Serbia Ms. Danijela Bozanic Ms. Antonela Solujic Mr. Miroslav Spasojevic
331
Slovakia Mr. Stanislav Kucirek Mr. Vladimir Litvak
South Africa Mr. Ian Lane
Spain Mr. José Luis Tejera
Sweden Mr. Gunner Hovstadius
Switzerland Mr. Edwin Aalders Dr. Wolfram Kägi Mr. Stefan Kessler Ms. Stefanie Steiener
Thailand Mr. Tiep Nguyen
Tunisia Mr. Amel Bida Mr. Mongi Bida
UK Mr. Lorand Farkas Mr. Hervé Gueguen Mr. Jerald Jones Ms. Janet Kidner Mr. Tony Lamb Mr. Mario Merchan Ms. Eva Snajdrova
Ukraine Ms. Olga Gassan-zade
USA Ms. Anne Arquit Niederberger Ms. Melanie Ashton Ms. Ingrid Barnsley Ms. Martina Bosi Ms. Christiana FigueresMs. Jonathan Manley Ms. Heather McGeory Ms. Aimee McKane Mr. Williams Meffert Mr. Wayne Perry

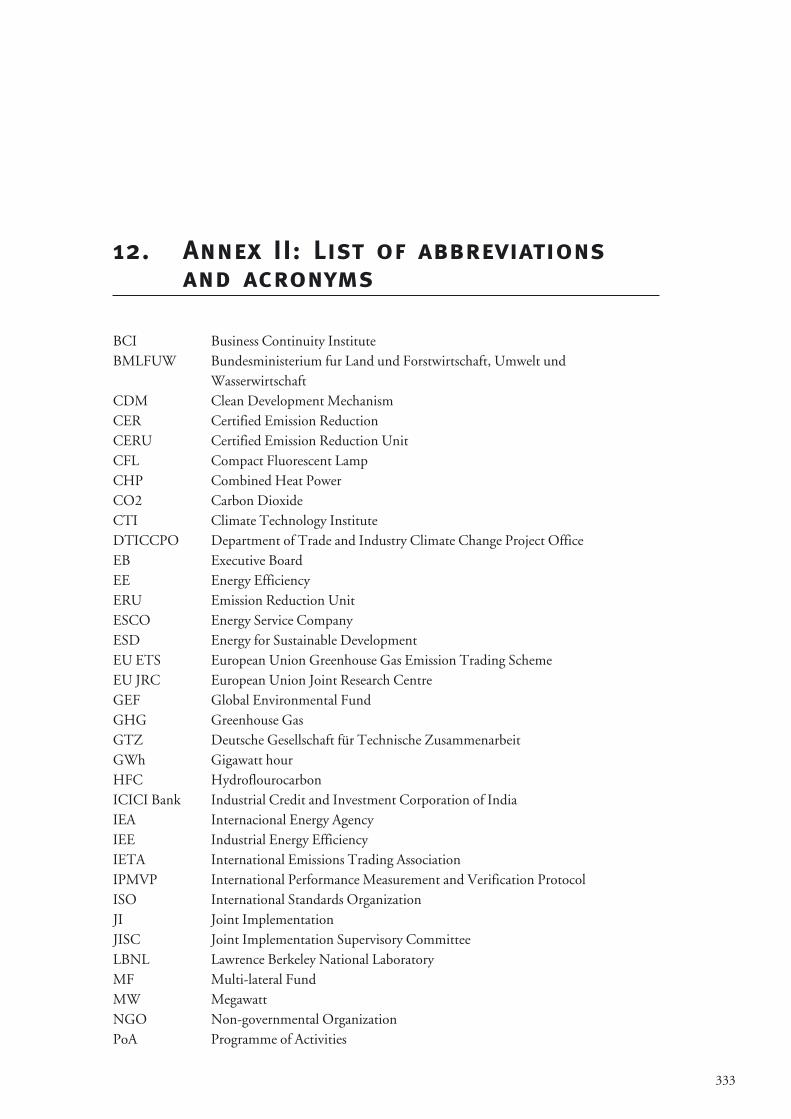
333
12. Annex II: List of abbreviationsand acronyms
BCI Business Continuity InstituteBMLFUW Bundesministerium fur Land und Forstwirtschaft, Umwelt und
WasserwirtschaftCDM Clean Development MechanismCER Certified Emission ReductionCERU Certified Emission Reduction UnitCFL Compact Fluorescent Lamp CHP Combined Heat PowerCO2 Carbon DioxideCTI Climate Technology InstituteDTICCPO Department of Trade and Industry Climate Change Project OfficeEB Executive BoardEE Energy EfficiencyERU Emission Reduction UnitESCO Energy Service CompanyESD Energy for Sustainable DevelopmentEU ETS European Union Greenhouse Gas Emission Trading SchemeEU JRC European Union Joint Research CentreGEF Global Environmental FundGHG Greenhouse GasGTZ Deutsche Gesellschaft für Technische ZusammenarbeitGWh Gigawatt hourHFC HydroflourocarbonICICI Bank Industrial Credit and Investment Corporation of IndiaIEA Internacional Energy AgencyIEE Industrial Energy EfficiencyIETA International Emissions Trading AssociationIPMVP International Performance Measurement and Verification ProtocolISO International Standards OrganizationJI Joint ImplementationJISC Joint Implementation Supervisory CommitteeLBNL Lawrence Berkeley National LaboratoryMF Multi-lateral FundMW MegawattNGO Non-governmental OrganizationPoA Programme of Activities

334
PDD Project Design DocumentPTC UNIDO Programme Development & Technical Cooperation DivisionREEEP Renewable Energy & Energy Efficiency PartnershipSSC Small-scaleUK United KingdomUNDP United Nations Development ProgrammeUNEP United Nations Environment ProgrammeUNFCCC United Nations Framework Convention on Climate ChangeUNIDO United Nations Industrial DevelopmentWADE World Alliance for Decentralized Energy
335
13. Annex III: Seminar on energyefficiency projects in the CDM and JIagenda
Day 1, March 19, 2007
8:30- 9:30 Registration9:30- 10:10 Welcoming remarks/opening session
Keynote presentations/statements:
Welcoming address: � Mr. D. Piskounov, MD, PTC, UNIDO � H.E. John Malcom Macgregor, Ambassador Permanent Representative,
UK � Dr. Mr. Karl Fiala, CTI� Dr. Gertraud Wollansky, BMLFUW
Keynote statement:� Dr. Peter Jenkins, REEEP
Introduction of agenda:� Ms. Marina Ploutakhina, UNIDO/PTC/Energy efficiency and climate
change
10:45 - 11:00 Break
11:00 - 12:30 Overview of the status of energy efficiency under the CDM and JI
Panel session I: Overview of carbon markets
Themes:� Key market characteristics (size, depth, liquidity, volatility, participants,
other)� Market demand, market differentiation and CDM and JI price� Energy efficiency in the carbon market� Carbon markets trends
Panel coordinator: Mr. Edwin Aalders, IETA

336
Panel participants:� Mr. Herve Gueguen, EDF Trading � Ms. Eva Snajdrova, Carbon Capital Markets � Ms. Olga Gassan-zade, PointCarbon � Ms. Heather McGeory, Natsource � Mr. Paul Waide, IEA
Discussions
12:30-14:00 Lunch
14:00 - 15:30 Panel session II: Status of energy efficiency under CDM and JI
Themes:� Approved methodologies and challenges� Energy efficiency project pipeline � Lessons learned� Performance vs. potential� Calls for public inputs: comments and inputs on EE in CDM
Panel coordinator: Marina Ploutakhina, UNIDO
Panel participants:� Mr. Adrian Lema, UNEP Risoe Centre on Energy, Climate and
Sustainable Development� Mr. Sudhir Sharma, UNFCCC Secretariat� Ms. Daniela Stoycheva, JISC� Ms. Gertraud Wollansky, BMLFUW� Ms. Marina Shvangiradze, Georgia, Accreditation Panel Member
Discussions
15:30-16:00 Break
16:00 - 17:30 Panel session III: Lessons learned and barriers to energy efficiency in CDM /JI
Themes:� Review of barriers� Systems approach� Baselines: data availability and other pitfalls in development� Tools for CDM/EE development
Panel coordinator: Mr. Bob Williams, UNIDO/PTC/ Energy efficiency and climate change
Panel participants:� Ms. Ayse Frey, TUV Süd� Mr. Michael Haslinger, Pöyry Energy� Mr. Peter Koegler, Austrian JI/CDM programme� Ms. Aimee McKane, LBNL/ Mr. Wayne Perry Kaeser Compressors � Mr. Michael Bess, ESD� Prof. Morihiro Kurushima, CTI

337
Discussions 19:00 - 21:00 Cocktail Reception – VIC Restaurant, Mozart Room
Hosted by UK Trade and Investment
Day 2, March 20, 2007
9:00 - 10:30 Panel session IV: New approaches to CDM / JI
Themes:� Programmes of activities: Advantages for energy efficiency?� Scope for aggregation under Type II SSC methodologies� Bundling� Methodology development for programmatic activities
Panel coordinator: Dr. Patrick Matschoss, German Advisory Council on theEnvironment
Panel participants:� Mr. Paolo Bertoldi, EU-JRC � Ms. Christiana Figueres, CDM Executive Board � Mr. Thomas Grammig, GTZ� Mr. Luis Ugarelli, BCI � Mr. Daisuke Hayashi, Perspective GmbH� Ms. Stefanie Steiner, BSS
Discussions
10:30 - 11:00 Break
11:00 - 12:30 Panel session V: Methodologies for electric motor-driven systems
Themes:� Potential greenhouse gas reductions from industrial electric motor systems
in buildings and industry� Proposed methodologies� Key methodological challenges� Prospect under small-scale methodologies and PoA� CDM / JI programme and project design
Panel coordinator: Dr. Anne Arquit Niederberger, A+B International (sustainableenergy advisors)
Panel participants:� Ms. Martina Bosi, World Bank (NM0197 chillers) � Mr. Ian Lane, Energy Cybernetics� Mr. Maarten Neelis, Ecofys (motors) � Prof. Anibal T. de Almeida, University of Coimbra
Discussions

338
12:30-13:30 Lunch
13:30 -15:00 Discussion groups
� Group 1: Programmes of activities and energy efficiency
Facilitator: Dr. Patrick Matschoss, German Advisory Council on theEnvironment
� Group 2: Energy efficiency methodology issues and tools. Facilitator: Mr.Sudhir Sharma, UNFCCC Secretariat
� Group 3: CHP in CDM, Facilitator: Mr. Sytze Dijkstra, WADE� Group 4: Linking Montreal and Kyoto: chiller demonstration projects
and CDM
Facilitator: Mr. Stefan Kessler, Infras
� Group 5: Linking the EE und CDM/JI expert communities: CDM EENetwork
Facilitator: Dr. Anne Arquit Niederberger, A+B International (sustainable energyadvisors)
15:00-15:30 Break
15:30 - 16:30 Reports from the discussion groups
10-minute summaries from each group
16:30 - 17:00 Break
What to look out for after 2012
17:00 - 18:00 Panel session VI: Transforming markets for energy efficiency
Themes:� Scenarios of role of energy efficiency in realizing mitigation potential � Key ingredients to a market transformation strategy� Future prospects for EE in CDM/JI� Interplay of environmental markets & energy efficiency� Financing energy efficiency� Other
Panel coordinator: Mr. Paolo Bertoldi, EU-JRC Panel Participants
Panel participants:� Mr. Ralf Luken, UNIDO Consultant � Mr. Jed Jones, DTI CCPO � Dr. Marianne Moscoso-Osterkorn, REEEP� Mr. Oliver Walters, VA Tech Finance GmbH � Mr. Vladimr Litvak, UNDP� Ms. Aimee McKane, LBNL
18:00 - 18:30 Concluding session

339
14. Annex IV: Papers
Energy efficiency in CDM - Ms. Anne Arquit Niederberger - Policy Solutions
Way forward for CDM energy efficiency projects - Mr. Patrick Matschoss - German AdvisoryCouncil on the Environment
Clean development though cogeneration - Ms. Sytze Dijkstra – WADE
Lessons from submission and approval process of methodologies - Mr. Daisuke Hayashi -Perspectives Climate Change GmbH
Energy efficient lighting projects in the CDM - Carbon Finance Unit - World Bank

340
Energy efficiency in CDM - Ms. Anne Arquit Niederberger - PolicySolutions
22 March 2007
– 1 –
UNIDO/CTI/UK Trade & Investment Seminar Energy Efficiency Projects in CDM and JI19-20 March 2007, Vienna
Seminar Issue Paper Prepared for UNIDO by Anne Arquit Niederberger, Policy Solutions ([email protected])
Introduction UNIDO, in cooperation with the Climate Technology Initiative (CTI) and UK Trade and Investment, will hold a seminar on "Energy Efficiency Projects in CDM and JI” in Vienna, Austria, on 19 and 20 March, 2007. The objective of the seminar is to provide a forum for business and industry to advance their understanding of the methodological issues surrounding energy efficiency projects/programmes under the flexibility mechanisms of the Kyoto Protocol, namely the Clean Development Mechanism (CDM) and Joint Implementation (JI).
This paper is prepared to facilitate discussion and knowledge sharing among experts It is stuctured around a set of nine theses, which can be explored during the workshop panel and discussion sessions.
Thesis 1End-use energy efficiency is crucial for climate mitigation and Parties expect the CDM to promote it
It has become abundantly clear that the current trend in greenhouse gas emissions is unsustainable (the IEA (2006) anticipates more than a doubling of energy-related CO2emissions from 1990 to 2030 under its Reference Scenario). Equally troubling is that most of the emissions growth over the next decades is expected to take place in the developing world.
Recent energy scenarios (e.g., IEA, IPCC, WBCSD) converge in demonstrating that demand-side energy efficiency will have to carry most of the weight in climate mitigation in the nextdecades, if we are to limit emissions sufficiently to stabilize atmospheric concentrations. In the latest IEA Alternative Policy Scenario, which assumes the use of existing technologies, implemented only through additional policies currently planned or under discussion in each country, end-use efficiency accounts for 65% of energy-related CO2 abatement in 2030 (IEA, 2006). This means that if we do not succeed in overcoming market failures and breaking down barriers to introducing energy efficient technologies and practices in industry and transforming global markets for high-efficiency equipment, products and services, the price of climate mitigation will be much higher.
Investment in end-use energy efficiency is not only crucial from the perspective of climate protection; it can make an important contribution to economic and social development in all countries (Arquit Niederberger et al., 2007). A more energy and resource efficient economycan improve the competitiveness of domestic enterprises, lower the cost of doing business in a given country and moderate the rise in commodity and consumer prices (e.g., as a result of reducing oil imports). For developing countries facing the challenge of providing adequate energy services to growing populations and economies, investments in energy efficiencyimprovements have the added benefit of creating jobs and being much quicker and cheaper toimplement than building new supply capacity (Spalding Fecher and Roy, 2004).

341
22 March 2007
– 2 –
Creating framework conditions that put cost-effective investments in energy efficiencyimprovements on an equal footing with investment in energy supply as one option to meet the energy needs of end-users, can offer them a number of advantages, including:
� Improved access to and reliability of energy services; � Lower and less volatile energy bills; � Improved private sector competitiveness as a result of improved overall productivity /
process efficiency; � Avoidance of pollutant and greenhouse gas emissions that are damaging to humans,
infrastructure and ecosystems.
However, significant, well-documented barriers to investment in high-efficiency equipment and practices are widespread, even in the most advanced economies, and these can be particularly pronounced in the developing country context: knowledge of energy-saving potential in industry and other sectors is lacking; access to capital can be a challenge in cases where capital markets are not well developed to support the efficiency market; the motivations and decision criteria of those who make investment / procurement decisions (i.e., up-front capital cost of equipment) and those who pay energy bills are often conflicting; retrofits may incur additional planning expense, can require factories to be shut down and may not function flawlessly from the outset; a strong policy, regulatory and enforcement regime and incentives to make energy conservation efforts profitable are lacking.
The challenge of ensuring that billions of energy end-users, mostly in poor countries, make additional up-front investments in energy efficient technologies is daunting (despite the attractiveness of such investments on a least lifecycle cost basis), but there is a range of regulations, market mechanisms and other policies and measures to promote the necessarymarket transformation. The Kyoto Protocol’s flexibility mechanisms, the Clean Development Mechanism (CDM) and Joint Implementation (JI), can address primarily financial barriers. Anumber of countries – for example, China – have made energy efficiency a CDM priority.
Yet the CDM has only managed to catalyze approximately two dozen demand-side efficiencyprojects across all sectors, which collectively will reduce greenhouse gas emissions by about 300 kt CO2e per year (of the order of 3 Mt CO2e cumulatively through 2015). This is an insignificant amount, compared with the vast potential for cost-effective energy efficiencyimprovement. With energy efficiency currently at the top of the political agenda around the globe, there is a desire to make the carbon markets work for energy efficiency, recognizing that CDM/JI are only one part of the necessary market transformation process.
Thesis 2The Kyoto Mechanisms have largely failed to stimulate industrial end-use efficiency
The sustainable development benefits of improved energy efficiency are widelyacknowledged, yet the Clean Development Mechanism has failed so far to live up to its potential to promote more efficient technologies (Arquit Niederberger & Spalding-Fecher, 2006; Hayashi & Michaelowa, 2007). Among the 563 CDM projects approved up to 22March 20071, captive industrial cogeneration projects (i.e., power plants built to generate electricity primarily for the facility's own use) and use of waste heat or gas to deliver heat/power (which are sometimes classified as energy efficiency projects) are well-represented, but only five large-scale2 and six small-scale projects – out of a total number of
1 http://cdm.unfccc.int/Projects/projsearch.html 2 Simplified modalities and procedures have been adopted for small-scale project activities. For an energy efficiency project or program to qualify as small-scale, it must result in less than 60 GWh of

342
22 March 2007
– 3 –
277 and 286, respectively – are aimed at improving the efficiency of energy end-use (this is referred to as “Sectoral Scope 3”, energy demand3).
The approved energy efficiency projects in the industrial sector are listed in Table 1. These 19 projects – representing only 3% of the total number of registered CDM projects – are estimated to reduce greenhouse gas emissions by < 300 kt CO2e per year, a miniscule share of global energy efficiency potential. This is reflected by their limited geographical distribution (all but two projects in India), range of applied technologies and tendency to be small-scale.
Table 1. Registered Industrial End-Use Efficiency Projects
Project ID Title Host Party Sector Methodology
Full-Size CDM Projects
CDM0123 Energy efficiency through installation of modified CO2 removal system in Ammonia Plant
India Chemicals AM0018
CDM0261 Energy efficiency through steam optimization projects at RIL, Hazira India Petrochemicals AM0018
CDM0340 Reduction in steam consumption in stripperreboilers through process modifications India Petrochemicals AM0018
CDM0677 Optimization of steam consumption by applyingretrofit measures in blow heat recovery system India Paper AM0018
CDM0679 Optimization of steam consumption at the evaporator India Paper AM0018
Small-Scale CDM Projects
CDM0255 Demand-side energy efficiency programme in the ‘Humidification Towers’ of Jaya Shree Textiles
India Textiles AMS-II.C
CDM0262 Energy efficiency projects - Steam systemupgradation at the manufacturing unit of Birla Tyres
India Petrochemicals AMS-II.D.
CDM0445 Demand side energy conservation & reduction measures at IPCL – Gandhar Complex India Petrochemicals AMS-II.D.
CDM0568 GHG Emission Reductions through EnergyEfficiency Improvements India Cement AMS-II.D.
CDM0582 India - Vertical Shaft Brick Kiln Cluster Project India Building materials AMS-II.D.
CDM0701 Energy efficiency project in the Ramla CementPlant in Israel through instalment of new grindingtechnology
India Cement AMS-II.D.
CDM0745 Demand side energy conservation and reductionmeasures at ITC Tribeni Unit India Paper AMS-II.D.
CDM0757 Factory energy-efficiency improvement project inMalaysia (MAPREC, PRDM, PSCDDM,PAVCJM, PCM)
Malaysia Manufacturing AMS-II.D. (bundle)
CDM0759 Factory energy-efficiency improvement project inMalaysia (PHAAM, PCOM (PJ), PCOM (SA),PEDMA, MEDEM)
Malaysia Manufacturing AMS-II.D. (bundle)
CDM0777 Energy Efficiency Improvement in Electric Arc Furnace at Indian Seamless Metal Tube Limited(ISMT), Jejuri, Maharashtra
India Iron & steel AMS-II.D.
CDM0806 Demand side energy efficiency programmes for specific technologies at ITC Bhadrachalam pulpand paper making facility in India
India Paper AMS-II.D.
CDM0850
Installation of Plate Type Heat Exchanger for preheating combustion air of primary reformer and reducing heat loss to atmosphere through flue gases at Indo Gulf Fertilisers (A Unit of Aditya Birla Group), Jagdishpur
India Chemicals AMS-II.D.
energy savings annually. All other activities are classified as large-scale. For more on small-scale CDM, refer to Thesis 4. 3 Annex 1 lists the Sectoral Scopes defined under the CDM.

343
22 March 2007
– 4 –
CDM0858 Grasim Cement: Energy efficiency by up-gradation of clinker cooler in cement manufacturing India Cement AMS-II.D.
CDM0932 Energy Efficiency Measures At Paper ProductionPlant India Paper AMS-II.D.
(Source: http://cdm.unfccc.int/Projects/projsearch.html, categories: Energy Demand, Manufacturing Industries – end-use energy efficiency)
The pipeline for energy efficiency projects, however, is expanding rapidly. The UNEP Risoe Centre on Energy, Climate and Sustainable Development (URC) periodically publishes a compilation of projects at each stage of the CDM pipeline, including projects that have been: � registered by the CDM Executive Board (see previous section); � validated by a Designated Operational Entity (DOE) and requested registration by the
CDM Executive Board; � submitted to a DOE for validation.
In the most recent compilation from 15 March 2007 (URC, 2007), energy efficiency projects4
represent roughly 12% (196) of the total of 1571 projects in the CDM project pipeline (at least submitted to a DOE for validation). In terms of cumulative CERs that would be delivered bythe projects in the pipeline, however, the share of energy efficiency projects is only 7% (about 120 Mt CO2e). The majority of these proposed projects are hosted by Indian entities and over 80% (162 projects) are in the industrial sector.
Over half of the projects in the pipleline attributed to the industrial energy efficiency category involve recovery and use of waste heat/gas, and the vast majority of these use the consolidated methodology ACM0004. Just over one-third of the industrial energy efficiencyprojects are small-scale (<60 GWh of savings per year).5 It is clear that the CDM is onlymaking a very small contribution to promotion of energy efficiency, despite significant potential for improvement in developing countries worldwide.
Thesis 3A lack of viable, broadly-applicable approved methodologies is a barrier to energy efficiency CDM
One of the barriers that energy efficiency projects face under the CDM is a lack of suitable approved baseline and monitoring methodologies for large-scale projects. The approval of CDM methodologies generally takes a “case law” approach: Once a methodology has been approved by the CDM Executive Board, it is valid for use by any project developer to prepare new CDM Project Design Documents for official CDM project registration. It is therefore important to get a critical mass of methodologies approved rapidly that can serve as a basis for energy demand CDM project development across key sectors and applications.
Table 2 provides an overview of CDM Executive Board decisions on proposed new methodologies for industrial energy efficiency projects. Only three full-scale methodologies for demand-side industrial energy efficiency (Sectoral Scope 3) have made the cut6:
4 Note that this figure is much lower when the selection is limited to projects that use Sectoral Scope 3(demand-side efficiency) methodologies. The classification used in the UNEP-URC compilationincludes both supply and end-use efficiency under the groupings "EE Supply side", "Energydistribution", EE Service", "EE Industry", "EE Households", and "Transport". 5 For a more detailed pipeline analysis, refer to Hayashi and Michaelowa (2007). 6 The designation of Sectoral Scope is taken from the UNFCCC web site for approved projects andfrom the information provided by the developer of the rejected and "B"-case (revisions required)methodologies. Note that there is some inconsistency in these designations, but for full-scale methodologies, cogeneration and waste heat/gas utilization methodologies are generally excluded from

344
22 March 2007
– 5 –
� AM0017 (steam system efficiency at refineries) � AM0018 (steam system optimization) � AM0038 (energy efficiency of electric arc furnaces)
Table 2. Overview of CDM Methodology Approval and Rejection for Demand-Side Energy Efficiency Projects/Programs applicable to Industry
Methodology Type Approved Rejected Under Consideration
Consolidated none n/a n/a Large-Scale � AM0017 (steam system
efficiency at refineries) � AM0018 (steam system
optimization) � AM0038 (energy
efficiency of electric arcfurnaces)
� NM0086 (petrochemical industry)
� NM0092-rev (smelter upgrade)
� NM0099 / NM0101 / NM0137 / NM0154 (cement)
� NM0100 (unitary equipment replacement)
� NM0118-rev (breweryoptimization)
� NM0119 (process energyintegration)
� NM0169 (efficient utilization of energy in the form of fuel, power and steam)
� NM0182 (advanced SCADA control systems & enegy management)
� NM0197 (replacement of electrical equipment with variable load)
� NM0195 (steam turbine replacement)
Small-Scale � AMSII-C (specific technologies)
� AMSII-D (industrial facilities)
� AMSII-E (buildings)
n/a n/a
Source: http://cdm.unfccc.int/methodologies/PAmethodologies/approved.html and http://cdm.unfccc.int/methodologies/PAmethodologies/publicview.html
Unfortunately, it is difficult to distill the key ingredients shared by these approved methodologies (beyond their focus on the discretionary retrofit market and application of a baseline approach that determines the emissions baseline from existing actual or historical emissions). There is a lack of top-down guidance, consistency and predictablility that discourages methodology development. Over all, the energy efficiency category has suffered the highest rejection rate by the Executive Board (Hayashi & Michaelowa, 2007).
To be sure, the quality of new methodology proposals has varied widely; some proposed new methodologies were simply not prepared well enough to meet the demands of the CDM. Yet there were also many thoughtful and professional attempts to draft credible methodologies that were rejected, which appears to have discouraged the development of new methodologies(in the last four new methodology submission rounds combined, only two Sectoral Scope 3 methodologies were proposed).
The CDM Executive Board has given a number of common reasons for the rejection of new methodologies for energy efficiency projects. These can be summarized7 as a failure to:
� Select an appropriate project scope or specify how methodology can be applied indifferent sectors
� Provide a procedure to select baseline scenario (even though retrofit projects often apply the historical emissions approach to setting the baseline)
this category. AM0038 has been included here, even though it is in Sectoral Scope 4 (Manufacturing Industries), due to the nature of the methodology. 7 Refer to Arquit Niederberger and Spalding-Fecher (2006) for details.

345
22 March 2007
– 6 –
� Clearly define the project boundary, (e.g., geographical boundary, greenhouse gas sources included/excluded, ownership).
� Specify data/assumptions and explain how to determine if these are adequate, reliable and conservative
� Consider autonomous energy efficiency improvements, account for planned replacement and address free riders
� Take into account factors unrelated to energy efficiency measures that can affect future emissions
� Distinguish between energy efficiency markets (i.e., discretionary retrofit; planned replacement (“lost opportunity”); new equipment markets)
� Give full consideration to the potential for leakage � Provide adequate guidance on developing a monitoring plan � Provide level of methodological specificity sufficient to allow DOE to verify
reductions
In addition, there have been a plethora of unique issues with individual proposed new methodologies, such as failure to: implement changes requested by the Methodology Panel; justify the need for a complex methodology (when simpler, more robust and/or readilyverifiable methods are available); limit use of small-scale operating margin methodology for determining grid electricity factors to projects that do not exceed the small-scale energysaving limit; address planned industrial process changes; provide a methodology to handle variable load applications; treat plants or buildings individually; differentiate electricityemission factors, based on distribution of end-use equipment within project boundary (i.e., use regional rather than national grid emission factors); adequately evaluate uncertainties; account for rebound effects; demonstrate that efficiency gains are significant relative to uncertainty (signal-to-noise ratio).
Due to the “case law” approach to full-scale methodologies, as opposed to small-scale methodologies (which have been prepared by the Small-Scale Working Group and approved by the CDM Executive Board), the onus of developing methodologies has fallen on individual project developers. As a result, the sectoral scope of approved methodologies reflects the market niches of larger developers (e.g., landfill methane and renewable power) and/or the investment criteria of buyers, in particular, low risk, large volume and low cost CERs (whichdrove HFC-22 destruction projects).
There has been little incentive for developers to invest in methodologies for energy efficiency(Sectoral Scope 3), not the least because private investors expect higher returns from non-CO2greenhouse gas projects, but also because of the lack of guidance on how end-use efficiencymethodologies must be designed to receive approval, which creates great uncertainty. There is no common understanding of what constitutes a good or best practice energy efficiency CDM methodology, and large inconsistency in the decision-making process, particularly with gross-to-net adjustments (refer to Thesis 6 for an in-depth discussion).
As a result of the challenges faced by energy efficiency methodologies, widely applicable methodologies for sectors, program types and technologies with large greenhouse gas emissions from energy end-use, such as energy-intensive industry or industrial motors8 are lacking. Two proposed new industrial energy efficiency methodologies have received preliminary recommendations from the CDM Meth Panel and are currently under revision (see Table 2). If NM0197 is ultimately approved, it could open the door for industrial energyefficiency improvements to at least those electric motor systems that are easily monitored.
8 Electric motor systems are responsible for 70% of industrial electricity demand and have an average cost-effective efficiency improvement potential of 25-30% (SEEEM, 2006).

346
22 March 2007
– 7 –
A gaping hole in the coverage of the approved industrial energy efficiency methodologies for full-size projects is that all of the methodologies approved to date only apply to the retrofit market (and apply the baseline approach that relies on “existing actual or historical emissions”). Given the double-digit growth rates in many industrial sectors, particularly in emerging economies, the lack of methodologies applicable to new installations means that we are missing an important opportunity to leverage CDM to ensure adoption of state-of-the-art energy management practices and systems that will have a significant operating lifetime.
Another observation is that even though a methodology might ultimately have received EB approval, it is not necessarily viable in practice. AM0018 is the only one of the approved industrial Sectoral Scope 3 methodologies that has actually led to projects being registered (5 projects, with two more currently reqesting registration).
Thesis 4Most industrial efficiency projects could be conducted under the new 60 GWh limit for small-scale CDM (SSC)
The CDM Executive Board has provided a suite of small-scale CDM (SSC) energy efficiencymethodologies (that apply to “Type II project activities”; Table 2 lists the SSC methodologies relevant to the industry sector). To qualify as a Type II small-scale project, a CDM activity must result in less than 60 GWh of energy savings annually. In addition to being eligible to apply pre-approved, simplified methodologies, SSC project activities can follow simplified modalities and procedures – which include a simplified PDD and provisions for environmental impact analysis, as well as lower registration fees and other special arrangements – with a view to reducing the transaction costs associated with preparing and implementing CDM projects.
While a large number of small-scale projects have been registered in other project categories,industrial energy demand projects account for only 13 registered small-scale CDM projects (less than 5% of the total), all but one of which use methodology AMS II-D (see Table 2).
The decision by the Parties to the Kyoto Protocol in November 2006 to raise the limit for small-scale energy efficiency activities from 15 GWh to 60 GWh has a significant impact on the scope of industrial energy efficiency activities that fall under the SSC rules and, hence, the transaction costs for industrial energy effiency CDM projects. In the industry sector, an individual factory might have an electricity consumption of the order of between 1 and 100 GWh annually. This means that three large factories (or 300 small factories) could be bundled together in a single small-scale project or program to improve the efficiency of energy use by20%.
Taking the example of industrial electric motor systems (Arquit Niederberger & Brunner, in press), the 60 GWh electricity savings can come from a combination of efficiency measures that might affect the coefficient of performance of the motor, operating conditions (e.g., hours per year) or the load split across the range of motor size. A motor system of any size (between 1 kW and 20 MW) running 3000 hours per year and delivering 30% efficiency gains would qualify as a small-scale CDM project (equivalent of < 60 GWh energy savings).
The resulting total load of motors to be improved is between 2000 and 6000 kWe. The load can then be attributed to individual motor systems within the same project boundary. Given the distribution of motor size, CDM projects will likely target the most common standard motor sizes between 5 kW and 500 kW. A CDM motor project that resulted in 30% efficiencygains for 100 large (500 kW) or 10 000 smaller pieces of equipment (5 kW) operating 4000 hours annually would still qualify under the SSC rules (Arquit Niederberger & Brunner, in press). This calculation illustrates the significance of the new SSC limits for motor and other industrial system efficiency initiatives under the CDM.

347
22 March 2007
– 8 –
Given the relatively small scale of the vast majority of motor systems, even under the SSC rules, transaction costs associated with PDD preparation and determining project emissions remain a key consideration in CDM project viability. Fortunately, the small-scale methodologies allow for energy efficiency programs to be implemented under a single Project Design Document (PDD):
� under AMS II.D., a single PDD is applicable to "any energy efficiency and fuel switching measure implemented at a single industrial facility";
� AMS II.E. only requires a single PDD applicable to "any energy efficiency and fuel switching measure implemented at a single building…or group of similar buildings" and
� AMS II.C. allows "programs that encourage the adoption of energy-efficient equipment…at many sites" to be submitted under a single PDD.
Thesis 5Barriers to SSC industrial energy efficiency projects/programs remain
Given that SSC methodologies applicable to the industry sector have been approved, whyaren't we seeing more projects being developed, with the exception of India (which is the only country with registered industrial energy efficiency projects)? There are a number of possible explanations, for example:
� Lack of awareness of energy efficiency opportunities in host country industrial sector � Unfamiliarity with CDM and scope for SSC CDM � Challenge of structuring deals, so that the CDM revenue stream can help address the
important up-front capital (and sunk) cost barriers � Simplified methodologies put the burden of documentation and PDD preparation on
the individual enterprise, without much guidance, and demands human resources that might not be readily available, particularly in SMEs
� CER income may not cover the true transaction, business interruption and sunk costs involved, and is often less than the cost savings from reduced energy demand, which can be substantial (Arquit Niederberger & Brunner, in press); there is a sense thatCDM is "not worth the effort".
In addition to addressing methodological issues, awareness-raising is a key challenge. Relevant institutions (e.g., UNIDO, World Bank, UNDP, GEF, in partnership with local industry associations) should establish programs to assist industry in taking advantage of the CDM, preferably piggy-backing onto existing programs to provide energy audits, training and other market transformation activities. There is also a need for funds (e.g., dedicated energy efficiency lending facilities, revolving funds or ESCO structures) and programmatic approaches to ease the administrative burden on individual enterprises and make funds available to cover up-front capital costs. The energy efficiency financing facilities established by the IFC in several countries could be a model.
Finally, the potential to leverage CDM funds in support of energy efficiency incentive programs, typically run by governments and utilities, remains to be explored. There is a pervasive lack of awareness of the Kyoto Mechanisms among agencies responsible for energy efficiency, utility regulation and demand-side management in many countries and little cross-fertilization between the energy efficiency expert community and the climate change / CDM world9.
9 This issue is also raised in Thesis 7 and Thesis 8.

348
22 March 2007
– 9 –
Thesis 6The nature of dispersed energy efficiency projects / programs raises particular methodological challenges
Energy efficiency projects/programs have many characteristics that differentiate them fromthose in other sectoral scopes. At a fundamental level, energy savings from energy efficiencyprojects cannot be measured as they can for energy supply projects, such as renewable energy projects. The savings are equal to baseline energy consumption less the consumption associated with the new project, with the understanding that baseline consumption is a hypothetical value that cannot be directly measured. It is essential to acknowledge this fact and to recognize that that energy savings and greenhouse gas mitigation impacts of energyefficiency projects therefore represent “negotiated” values, as baselines must be stated, inferred, calculated, or simulated. The UNIDO workshop can explore how to deal with the following unique methodological challenges that have been encountered by end-use efficiency efforts:
Non-financial barriers, additionality and CDM To qualify for CDM registration, a project/program of activities must demonstrate additionality, that is, it must reduce anthropogenic emissions of greenhouse gases by sources below those that would have occurred in the absence of the registered CDM project activity. In considering project additionality, the three major energy efficiency markets should be treated separately (see Table 3). There are generally greater barriers to discretionary retrofits of existing, well-functioning systems than there are to planned equipment replacements or new installations10 (see the following section for a discussion). In the field of energyefficiency projects, the targeted efficiency market thus has implications for the selection of an appropriate baseline approach, which, in turn, determines the significance of barrier analysis for baseline scenario selection and additionality determination.
Table 3. Energy Efficiency Markets
Market Definition Discretionary retrofit Decision to prematurely replace existing technology with high-efficiency
equipment for the primary purpose of improving energy efficiency Planned replacement Decision to replace existing technology at the end of its useful lifetime (e.g.,
failure, replacement schedule) with high-efficiency equipmentNew installations Decision to select high-efficiency equipment over other alternatives at the
time of new installations
For discretionary retrofits, baseline approach 48a11 is the obvious choice, since these projects are replacing existing, functioning equipment before the end of its useful lifetime. For discretionary energy efficiency retrofits, the key to demonstrating additionality is for project proponents to provide convincing evidence that the retrofit was indeed discretionary and not a planned replacement, i.e., the project/program of activities was undertaken with the primaryaim of reducing greenhouse gas emissions.
10 The small-scale methodologies are applicable to all three efficiency markets. 11 The baseline approaches defined in sub-paragraphs 48 (a) to (c) of the CDM modalities andprocedures are: existing actual or historical emissions, as applicable (48a); emissions from a technologythat represents an economically attractive course of action, taking into account barriers to investment(48b); the average emissions of similar project activities undertaken in the previous five years, insimilar social, economic, environmental and technological circumstances, and whose performance is among the top 20 per cent of their category (48c).

349
22 March 2007
– 10 –
The planned replacement and new installations efficiency markets pose other issues for additionality assessment, since these generally involve new investment decisions12. The fact that investment in high-efficiency industrial equipment, consumer appliances or lighting is cost-effective by some measure (such as least lifecycle cost) should not be taken to mean that end-use efficiency projects are non-additional. On the contrary, the fact that such investments are not being made, despite their cost-effectiveness and often short payback periods, is evidence of significant barriers in the marketplace. Under its "Save Energy Now" program, energy assessments of 200 industrial facilities in the United States in 2006 uncovered 52 trillion Btu in annual natural gas savings potential13 (equivalent to 3.3 million tons CO2 per year) – over 80% of which represented activities with payback periods of less than two years (40% with payback periods of less than 9 months). Decisions taken by the CDM Executive Board and Meth Panel do not reflect this reality; even though investment analysis is not mandated by the approved additionality tool, application of both the barrier and investment analysis has been recommended to those trying to devise new energy efficiencymethodologies (Hayashi & Michaelowa, 2007).
Furthermore, both the additionality tool and the combined tool to identify the baseline scenario and demonstrate additionality14 give examples of barriers that could prevent alternative scenarios in the absence of CDM, namely investment barriers, technological barriers and barriers due to prevailing practice. However, these do not include the major barriers facing energy efficiency projects. It would be helpful to highlight examples of typical barriers to energy efficiency projects/programs, such as those mentioned above, as well as for the CDM Executive Board to provide tools and guidance on documentation requirements to demonstrate barriers. It should not be necessary for each project developer to provide individual documentation of prevalent barriers to demand-side efficiency, when these have been well documented by energy efficiency experts and reliable institutions, such as the International Energy Agency and governments.
As defined, the combined tool explicitly is not applicable "where one or more baseline alternatives are not available options to project participants", which is generally the case under energy efficiency programs. According to the tool, a program to disseminate or encourage the use of energy efficient appliances by multiple end-users could not use the combined tool, because a credible and plausible alternative to the project activity could be that the end-users (i.e. third parties) continue to use existing appliances and/or start using more efficient appliances – which are not available options to the project participants. Existing protocols to quantify energy savings from end-use efficiency improvements typically distinguish between gross energy (emission) savings at the site level (i.e., the difference between the baseline and project emissions) and net savings that actually occur at the electricity generating unit. Factors commonly considered in determining net savings include increased savings due to lower T&D losses, decreased savings due to non-additional free riders, increased savings due to spillover effects, and secondary effects (e.g., leakage, rebound effect, activity shifting)15. It would be highly recommended to try to address these issues systematically and comparably – rather than at the point of baseline definition. A number of these factors have caused problems in methodology approval and are discussed in detail below. Clear guidance on what needs to be taken into account to determine net energy savingsand emission reductions and the methods to do so should be provided.
Quantification protocols also provide for baseline adjustments for changes in independent variables – both routine adjustments such as for weather in the case of space heating/cooling
12 This is not always the case, for example, when replacement equipment has been purchased inadvance. 13 See http://www.eere.energy.gov/industry/saveenergynow/partners/results.cfm14 Tools available at http://cdm.unfccc.int/methodologies/PAmethodologies/approved.html15 Steve Schiller, personal communication (March 2007).

350
22 March 2007
– 11 –
projects or for changes in the level of industrial production, which can be monitored and should therefore be included in monitoring plans, and non-routine adjustments such as a change in product line. The latter are typically addressed only as they occur. Adopting this terminology and these practices could add a great deal of transparency to the whole CDM methodology process and make it consistent with existing energy efficiency programs, especially those that might also link to carbon markets, such as white certificate schemes. Issues related to baseline adjustment have also been the cause of methodology rejection and are described below.
Another issue related to additionality testing for energy efficiency projects is the difficulty of performing the common practice test in Step 4 of the tool for assessment and demonstration of additionality. This step requires project participants to identify similar projects in the sameregion/country and to explain why they are different from the proposed CDM project activity.For a single project site or technology, this analysis is relatively straightforward; but for a project or program with a large number of sites, pieces of equipment or even different technologies, as is common in the end-use energy efficiency sector, this is problematic (Sathaye, 2006).
Baseline data availability, monitoring and transaction costs One of the biggest barriers to energy efficiency CDM – and to assessing the impacts of all demand-side management programs – is the difficulty of ensuring credibility while keeping the transaction costs associated with determining baseline and project emissions at viable levels. In contrast to emissions associated with fossil power generation, which can be calculated based on fuel use data and CO2 emission factors, determining emissions reductions from demand-side energy efficiency projects and programs is less straightforward.
Energy efficiency projects/programs under the CDM result in reduced demand for electricityor other forms of energy with respect to the baseline to produce the same energy service. For large-scale efficiency retrofit projects, some of the necessary baseline data might already be available as a result of normal monitoring processes (e.g., fuel use), and collecting anyadditional baseline data required by the CDM (e.g., hours of operation, load factor) is generally neither technologically nor economically prohibitive. However, the vast majority of energy efficiency improvements in terms of numbers will be smaller rather than larger and will derive from all three efficiency markets. When considering industrial electric motors, for example, a higher percentage of efficiency gains is possible as motor size decreases, and thereare more small and medium-sized motors than larger ones. In addition, as is the case for all types of CDM projects that result in a reduction in demand for grid electricity, it is often a challenge to obtain the necessary data to calculate grid emission factors accurately.
Some projects are quite simple to monitor directly, such as the retrofit of a single water pumping system, and there are few exogenous factors (independent variables) that would affect the energy demand of the system and require baseline adjustment. Other systems, however, are far more complex. One unsuccessful methodology tried to address energyefficiency improvements by a food retailer. Emission reductions were to be measured bytracking changes in electricity use recorded on electricity bills. However, the Meth Panel rejected the methodology for a number of reasons. Some of these were quite specific to the type of business and location of the project activities, for example, failure to account for anychanges in the composition (e.g., a greater share of frozen/chilled food in supermarkets as opposed to other types of commercial facilities) and location of shops (climatic impacts on energy demand for cooling). Clear guidance on when and how routine and non-routine baseline adjustments are required is needed, and such issues should be treated independentlyof baseline selection.

351
22 March 2007
– 12 –
Monitoring costs can be a significant barrier to dispersed CDM projects in energy efficiency. One approach that has received mixed reviews from the Meth Panel is the use of systemsimulation models, which has been widely applied to complex building and industrial process effiency programs outside of the CDM. If a set of such tools for key applications could be pre-approved by the Meth Panel, this would be very helpful. Many such tools are in use to assist with estimating energy saving potential and could be adapted for CDM use.
Autonomous efficiency improvements In numerous cases, proposed new baseline and monitoring methodologies for energyefficiency activities have been rejected for their failure to account for autonomous efficiencyimprovement trends in the baseline (i.e., rate of historical improvement in energy efficiencyof equipment that is attributed to technological innovation not driven by energy efficiencypolicies/programs). Even more importantly, this issue has been dealt with inconsistently. Some approved methodologies do not address autonomous efficiency trends at all (e.g., AM0020), whereas numerous other proposed methodologies were criticized and rejected, in part, for their failure to take efficiency improvement trends into account (although no guidance on how to do so has been provided). More consistent decision-making and clearer guidance on this point (that differentiates baseline approaches and efficiency markets) would be extremely helpful in promoting end-use efficiency under the CDM.
Since the CDM is project-based, it can be argued that autonomous efficiency improvement need not be taken into account. In the case of discretionary retrofit projects, an owner has the option of doing nothing (leaving the existing technology in place until its planned replacement), or replacing existing equipment sooner than necessary with high-efficiencytechnology. If a project is a truly discretionary retrofit, then there is no trend in efficiencyimprovement in the baseline at the project level. This general rule could be applied to projects that use baseline approach 48a and have a non-renewable crediting period. It is misguided to require elaborate control group studies or market analyses that may not be relevant to the decision process at the level of an individual project owner.
The baseline approach 48c inherently addresses the efficiency trend issue, since it defines baseline emissions in terms of average emissions of similar project activities undertaken in the previous five years and requires that only projects whose performance is among the top 20 per cent are taken into account. Therefore there is no need for correction factors to be determined by elaborate control groups or uncertain trend analyses when approach 48c is selected. Unfortunately, as shown above, this approach is very difficult to apply to actual projects, including energy efficiency projects, because of the difficulty in determining the appropriate benchmark.
In any case, it is nearly impossible to determine with any degree of rigor what the rate of historical improvement in energy efficiency of equipment is that can be attributed to tech-nological innovation not driven by energy efficiency policies/programs, or even how to defineit in a way that is relevant at the project level. Such a complex analytical exercise certainlyexceeds the capabilities of individual project developers. If there have been any major technology jumps, provisions for reassessing the baseline under methodologies that select a renewable crediting period should take this into account and would be adequate. We should always bear in mind the order of magnitude that we are talking about and consider whether addressing an issue such as "autonomous improvement" will enhance rigor or increase uncertainty.
Gross-to-net adjustments: Free riders/spillover effects & secondary effects Under the CDM methodology approval process, concerns have also been raised about “free riders”. The concept of "free riders" and "free drivers" (spillover effects) is not mentioned in the CDM rules and procedures. A free rider is an efficiency program participant who would

352
22 March 2007
– 13 –
have implemented the program measure or practice in the absence of the program; whereas free drivers do not participate in the CDM program, but adopt efficiency measures because of it, for example, as a result of increased awareness of efficiency opportunities (Geller & Attali, 2005).
The concept of additionality does not exclude such free rider/free driver effects; it merelyrequires that emissions under the project activity or program of activities in the aggregate arelower than they would have been without the CDM activity (i.e., lower than the emissions in the baseline scenario). As indicated above, free riders / spillovers, secondary effects (e.g., leakage, rebound effects) and electrical transmission and distribution losses are not a project-level baseline issue, but represent factors that are generally taken into account at the level of the program when making gross-to-net adjustments.
Free rider/spillover effects are notoriously difficult to quantify, with wildly different estimates from different experts using different approaches (Geller & Attali, 2005; Gillingham, Newell & Palmer, 2004). Methods of determining free rider and spillover effects in conjunction with financial incentives include surveys/interviews with program participants and non-participants;determining whether an investment would also be profitable without financial support (where profitability is judged based on the payback period required by the investor); and research on quasi-control groups (SAVE, 2001). Some of these approaches are being tested in proposed new baseline and monitoring methodologies and have been subject to Meth Panel scrutiny,but it is too early to say whether they will be accepted by the CDM Executive Board and whether they will be viable in practice. One methodology tried to use a survey/self-declaration, but this approach was rejected (NM0157).
It is also possible to design energy efficiency promotion programs so as to minimize potential free riders (and maximize positive spillovers). Bad experiences in the USA with programs to provide direct financial incentives to purchasers of efficient industrial equipment, for example,have encouraged a shift towards programs that target equipment distributors, rather than end-users (Benkhart, 2006). Under such programs, distributors that stock and market efficient equipment above status quo levels are rewarded for their performance. In general, the fraction of free riders would probably be lower in the discretionary retrofit market than in the new or replacement markets, because the barriers to retiring equipment prematurely go beyond financial considerations.
There are numerous examples of existing energy efficiency programs that recommend only minimal or no evaluation of free rider and spillover issues, due to the general desirability of energy efficiency improvements, the tendency for both effects to occur (and therefore cancel each other out), a lack of agreement on appropriate methodologies, and the difficulty and expense of such assessments. Other programs have assigned default gross-to-net conversion factors to be used for different types of energy saving measures16.
Similarly, most efficiency program evaluation protocols do not recommend inclusion of secondary effects in evaluation analyses, since these tend to be negligible for energyefficiency projects. In any case, gross-to-net adjustments should not be considered at the level of the project baseline and require a consistent, top-down approach applied to all eligible end-use energy projects.
16 See, for example, the User’s guide to the Conservation Verification Protocols (Washington DC: USEnvironmental Protection Agency, April 1996).

353
22 March 2007
– 14 –
Efficiency markets: New installations, planned replacement, discretionary (early) retrofit With the exception of AM0017 – which has yet to be applied to a registered CDM project – the approved energy demand methodologies target energy efficiency improvements that result from discretionary retrofits by the project owner to their existing, properly functioningequipment or systems. Thus there is a huge gap in coverage, both of the planned replacement market (i.e., replacement of equipment at the end of its useful lifetime, such as when steamtraps fail, which is the specific situation addressed by AM0017) and of the new installations market (e.g., expanding an existing or building a new facility/system). Particularly in developing countries with rapidly growing and industrializing economies, the new installations market represents the key opportunity for cost-effective energy efficiencyimprovement.
Methodology developers have not always stated clearly which efficiency market their methodology targets, and in some cases different efficiency markets were targeted implicitly, without respecting the relevant guidance from the Executive Board: The “Guidance regarding the treatment of ‘existing’ and ‘newly built’ facilities” states that, if a proposed CDM project activity seeks to retrofit or otherwise modify an existing facility, the baseline may refer to the characteristics (i.e. emissions) of the existing facility only to the extent that the project activity does not increase the output or lifetime of the existing facility. For any increase of output or lifetime of the facility which is due to the project activity, a different baseline shall apply.” This text lumps discretionary retrofits and planned replacements together under “existing facilities”, but as described in the previous Section, baseline approach 48a might rarely be appropriate for planned replacements.
The guidance to methodology developers could be improved by defining the three different efficiency markets – discretionary retrofit, planned replacement, new installations – and byrequiring that those submitting proposed methodologies for Sectoral Scope 3 indicate which efficiency market their methodology targets. This could be incorporated into a revision of the respective form for proposed new methodologies or could be included in the “Technical Guidelines for Development of New Baseline and Monitoring Methodologies” discussed laterin this paper.
In addition, the draft baseline scenario selection tool (BSST) and the additionality tool need to reflect the distinction in energy efficiency markets. All of the approved methodologies targeting the discretionary retrofit market have appropriately used baseline approach 48a, which defines the baseline as actual or historical emissions. Yet the draft baseline scenario selection tool requires analysis of alternative scenarios. To be applicable to approach 48a, the BSST should state that the list of alternatives to be determined in Step 1 may include only the status quo and the proposed project not undertaken as a CDM project, if baseline approach 48a (actual or historical situation) is used (World Bank, 2006b). The status quo under baseline approach 48a is to use the existing equipment until its planned replacement. Because this approach to baseline scenario selection is different than what would normally be considered for energy supply projects, the draft baseline scenario selection tool (see section 4.2.4) is not appropriate for methodologies in this market/sub-sector without modification.
For the discretionary retrofit market, approach 48a is a good match with the decision facing project owners on the ground: to either continue with business-as-usual, or to invest in more efficient technology, before the existing technology needs to be replaced. The methodological challenges are to provide clear guidance on excluding planned retrofits and to agree on whether and how to address autonomous efficiency improvements in the baseline and to minimize the level of free ridership in project/program design, both of which are discussed in separate sections, below.

354
22 March 2007
– 15 –
For the planned replacement and new installations markets, more work needs to be done toexplore the applicability of the three baseline approaches (48a/48b/48c). It would appear that each of these approaches could be applicable to the planned replacement market, depending on the situation. In this market, the project owner knows that equipment must be replaced; he/she may use replacement equipment already purchased or purchase any equipment available on the market. If replacement equipment has already been purchased, for example, if a chemical plant keeps an inventory of spare electric motors to prevent plant downtime whenmotors fail, this would represent an obvious baseline (under approach 48a), since not employing this equipment would represent a sunk cost.
If the equipment purchase decision is wide open, however – as is also the case for the new installations efficiency market – another approach is needed. The alternatives offered in sub-paragraphs 48b and 48c of the CDM modalities and procedures are difficult to apply toenergy efficiency projects, which may explain the lack of approved methodologies for the planned replacement and new installations markets. Approach 48b requires that a baseline technology be defined, which represents an economically attractive course of action, taking into account barriers to investment. As stated above, however, there is great economic potential for energy efficiency improvement, but other barriers prevent the uptake of efficient technologies. The fact that there remains vast potential for fossil fuel and electricity end-use efficiency improvement in the industrial sector of OECD countries with payback periods of less than two years demonstrates the prevalence and persistence of these barriers, even when technology standards are in place and net cost savings on a life-cycle basis are substantial. Applying the draft baseline scenario selection tool could actually be helpful for this case, as the barrier analysis could make an investment analysis unnecessary. Although the 48b approach should take into account “barriers to investment” it is not at all clear how this is to be done in practice, and more guidance, targeted at energy efficiency projects is needed.
Approach 48c defines baseline emissions in terms of average emissions of similar project activities undertaken in the past (i.e., within the previous five years, in similar social, economic, environmental and technological circumstances) and whose performance is among the top 20 per cent of their category. For large, discrete pieces of end-use equipment in industry, such as a boiler in a power plant or a kiln in a cement plant, this approach could work, but many energy efficiency opportunities are associated with small, dispersed efficiency improvements for which comparable performance data are simply not available, not the least because the specific setting in which a given end-use technology is deployed can be very diverse. This is the same challenge as applying Step 4 of the additionality tool (see previous section).
Thus new baseline approaches applicable to the planned replacement and new installations markets may be required to open the door for CDM to promote energy efficiency in these important markets across end-use sectors. Benchmarking, reference to minimum efficiencyperformance standards and standardization of operating parameters need to be explored. New efforts to develop standards to certify the energy performance of industrial plants could assist with benchmarking and should flow directly into the CDM methodological toolbox.
For each of the three efficiency markets, it would be helpful to develop generic methodological approaches that could result in better methodological guidance for demand-side energy efficiency projects/programs or “methodology modules”.
Discrete equipment vs. systems approach Whereas the energy efficiency of some types of equipment is relatively independent, more often than not, taking a more systematic approach can uncover greater energy-saving potential – and ensure that any technological fixes result in sustained savings. In the case of industrial electric motor systems, the difference is striking. Based on Motor Challenge programs in

355
22 March 2007
– 16 –
North America and Europe, it is widely agreed that upgrading the efficiency of the motor alone captures only roughly 10% of the energy-saving potential (with the rest attributed to proper dimensioning of the motor; use of adjustable-speed drives, where appropriate; efficient end-use equipment, such as fans, pumps, compressors, or traction systems; and optimization of pipes, ducts, belts, and gears).
Although methodologies have been approved that take both a systems (AM0018, AM0020) and a discrete equipment approach (AM0017), methodologies for some complex types of systems have been rejected (e.g., building efficiency, cement plant efficiency). One reason is that it is difficult to demonstrate that the energy savings achieved are attributable to the CDM activity alone, rather than to other factors (e.g., NM0120, NM0137). Due to a lack of approved methodologies, other project developers have chosen to focus on the retrofit of discrete equipment to avoid methodological difficulties of addressing complete systems (NM0100), even though much greater energy savings would be possible by taking a systems approach (and also addressing the new equipment market, where it is much easier to consider complete systems). Furthermore, taking a systems approach – particularly when implemented in the context of a comprehensive energy management system – promises greater permanence of energy savings and greenhouse gas emission reductions than one-time equipment replacement (McKane, 2007).
There is no easy fix to this dilemma. It will be important to develop a consensus on international best practice for the determination of energy savings from different types of energy efficiency projects and programs that could lead to the adoption by the CDM Executive Board of consolidated methodologies for important systems. Industrial electric motor systems in industry and the tertiary sector (buildings, municipal infrastructure), for example, account for at least 40% of electricity demand worldwide (SEEEM, 2006), yet no approved methodology exists to support high-efficiency motor systems. We will discuss several new proposals for motor methodologies at the UNIDO Seminar.
Thesis 7Energy efficiency experts should play a much greater role inthe CDM
Linked to the previous thesis, it is crucial to build on the large body of existing knowledge on international protocols/best practice that has been built since the 1973 oil crisis. This requires engaging government regulators and industry energy efficiency experts (incl. utilities, ESCOs, technology providers, end-users) with experience in the implementation and evaluation of public and private energy efficiency regulatory, incentive, contracting, training, and audit programs. Ideally, a “community of practice” on energy efficiency CDM would be built.
There is an urgent need for top-down guidance on key energy efficiency design issues, including:
� Emission reduction quantification methodologies: Most energy efficiencyprograms/protocols offer a menu of approved options that can be selected by the project proponents, typically including (i) use of default abatement factors ("deemed savings" approach), (ii) calculated (engineering) methods for discrete equipment/systems, sometimes in conjunction default efficiencies and other parameters, (iii) before/after metering/modeling, typically applied to more complex systems, such as buildings and (iv) sometimes, reliance on energy monitoring plans audited by third parties (this is the approach followed under JI Track 2).
� Baseline adjustment requirements/techniques for routine and non-routine factors
� Decisions on whether it is necessary and, if so, how to treat "gross-to-net" energy saving issues (including leakage, rebound effects, free riders, spillovers)

356
22 March 2007
– 17 –
� Definition of related default abatement factors, efficiencies and other parameters to enhance transparency, consistency and certainty.
Such issues are not new to CDM, and regulators have made decisions in the context of existing regulatory programs about how to handle them. This experience could be synthsized to come up with common methodologies, tools and default factors for Sectoral Scope 3 CDM. The previous practice under the CDM – with the exception of small-scale and sink-related methodologies – has been to derive guidance and tools based on bottom-up submissions. However, since there are so few approved Sectoral Scope 3 methodologies to draw from, and the approval process has been inconsistent, a top-down approach that draws on methodologies for demand efficiency projects already available outside of the CDM world is urgently needed.
A great deal of work has been done internationally, by national governments, energy agencies, utilities and other private actors, and by NGOs to devise measurement and verification protocols for energy efficiency activities, and these have been used in a range of regulatoryprograms, including cap and trade programs (see Table 4 for some examples, including programs in Canada, Italy, UK, USA). All of these stakeholders need to be brought together in a rapid process to propose good practice monitoring and verification approaches for keysectors and technologies under the CDM.

357
2 2 M
arch
200
7
– 1 8
–
Tab
le 4
. Ong
o ing
Mon
itori
ng, E
valu
atio
n, R
e por
ting,
Ver
ifica
tion
and
Cer
t ific
atio
n ( M
ER
VC
) Act
ivit i
esfo
r E
nerg
y E
ffi c
ienc
y
Con
veni
ng
Or g
aniz
atio
n(s )
T
it le
of In
itia t
ive
Obj
ect iv
eFo
cus
Key
Del
i ver
able
s
STA
ND
AR
DS
/ GU
IDA
NC
E
ASH
RA
E G
uide
line
14-2
002
Prov
ide
guid
elin
es fo
r rel
iabl
y m
easu
ring
the
ener
gy a
nd d
eman
dsa
ving
s due
tobu
ildin
gen
ergy
man
agem
ent p
roje
cts
(usi
ng p
re-r
etro
fit/p
ost-r
etro
fit d
ata)
Ener
gy d
eman
d re
duct
ions
inre
side
ntia
l, co
mm
erci
al a
nd
indu
stria
l bui
ldin
gs
Gui
delin
e 14
-200
2 "M
easu
rem
ent o
fEn
ergy
and
Dem
and
Savi
ngs"
Effic
ienc
yV
alua
tion
Org
aniz
atio
n
Inte
rnat
iona
l Pe
rfor
man
ce
Mea
sure
men
t &
Ver
ifica
tion
Prot
ocol
To d
evel
op a
nd p
rom
ote
the
use
ofst
anda
rdiz
ed p
roto
cols
, met
hods
and
tool
s to
qua
ntify
and
man
age
the
perf
orm
ance
ris
k an
d be
nefit
s ass
ocia
ted
with
end
-use
en
ergy
effi
cien
cy, r
enew
able
ene
rgy
and
wat
er e
ffic
ienc
y bu
sine
ss tr
ansa
ctio
ns
Dev
elop
men
t ofm
onito
ring
&ve
rific
atio
n pr
otoc
ols
IPM
VP
Vol
ume
I pro
vide
s gen
eral
gu
idan
ce fo
r ene
rgy
effic
ienc
y M
&V
fo
r bui
ldin
gs a
nd in
dust
ry. V
olum
eII
I add
ress
es n
ew c
onst
ruct
ion
Inte
rnat
iona
l En
ergy
Age
ncy
IEA
Dem
and-
Side
Man
agem
ent
Prog
ram
To d
evel
op, t
est,
and
prom
ote
anev
alua
tion
guid
eboo
k fo
r gov
ernm
enta
l an
d no
n-go
vern
men
tal E
nerg
y Ef
ficie
ncy
Prog
ram
mes
and
als
o fo
r (ut
ility
) DSM
pr
ogra
mm
es ta
rget
ed to
war
ds e
nerg
y en
d-us
ers a
nd fo
cuss
ed o
n G
HG
redu
ctio
ns to
mee
t Kyo
to's
targ
ets
Gui
danc
e on
eva
luat
ion
ofD
SM
prog
ram
sEv
alua
tion
Gui
debo
ok o
n D
SM a
ndEE
Pro
gram
s rel
ated
to K
yoto
targ
ets
Inte
rnat
iona
l St
anda
rds
Org
aniz
atio
n
ISO
140
64-2
Inte
rnat
iona
l St
anda
rd fo
rG
reen
hous
e G
as
Acc
ount
ing*
Dev
elop
inte
rnat
iona
l sta
ndar
d fo
r qu
antif
icat
ion,
mon
itorin
g an
d ac
coun
ting
for G
HG
redu
ctio
n pr
ojec
ts
Proj
ect-b
ased
em
issi
on re
duct
ions
fr
om a
llse
ctor
s
Inte
rnat
iona
l Sta
ndar
d fo
rqu
antif
icat
ion,
mon
itorin
g an
d ac
coun
ting
for G
HG
redu
ctio
n pr
ojec
ts
EU S
AV
E Sp
ecifi
c A
ctio
ns fo
r V
igor
ous E
nerg
yEf
ficie
ncy
Prog
ram
To d
isse
min
ate
eval
uatio
n th
eory
and
thus
indi
rect
lyhe
lp re
duce
the
over
all C
O2
emis
sion
s and
impr
ove
ener
gy e
ffici
ency
Dem
and-
side
man
agem
ent p
rogr
ams
and
the
ener
gy se
rvic
e pr
ovid
erin
dust
ry
Euro
pean
Ex-
Post
Eva
luat
ion
Gui
debo
ok fo
rDSM
and
EE
Serv
ice
Prog
ram
mes
WR
I/WB
CSD
G
HG
Pro
toco
l for
Pr
ojec
t Acc
ount
ing
Dev
elop
pro
ject
acc
ount
ing
fram
ewor
kth
at is
pro
gram
-neu
tral a
nd c
ompa
tible
w
ith th
e C
DM
as w
ell a
s oth
er p
rogr
ams
Proj
ect-b
ased
em
issi
on re
duct
ions
fr
om a
llse
ctor
s G
HG
Pro
toco
l for
Pro
ject
Acc
ount
ing
WB
CSD
CO
2 Acc
ount
ing
and
Rep
ortin
g St
anda
rdfo
r the
Cem
ent
Indu
stry
To p
rovi
de a
har
mon
ized
met
hodo
logy
for
calc
ulat
ing
CO
2 em
issi
ons,
with
a v
iew
to
repo
rting
Emis
sion
inve
ntor
ies &
repo
rting
for
the
cem
ent s
ecto
rC
emen
t CO
2 Pro
toco
l
REG
ULA
TOR
Y P
RO
GR
AM
S / P
RO
TOC
OLS
Cal
iforn
ia C
limat
e A
ctio
n R
egis
tryC
CA
R E
mis
sion
R
educ
tion
Prot
ocol
s
Dev
elop
pro
toco
ls fo
rqua
ntify
ing
emis
sion
redu
ctio
ns fr
om p
roje
cts
(dra
win
gon
WR
I pro
toco
l eff
ort)
Perf
orm
ance
stan
dard
s app
roac
hes
Prot
ocol
s for
quan
tifyi
ngem
issi
on
redu
ctio
ns fr
om p
roje
cts(
inpr
epar
a-tio
n)

358
2 2 M
arch
200
7
– 1 9
–
It al y
T r
adab
le E
ner g
yE f
fi cie
n cy
(Whi
teC
ertif
icat
e) S
chem
e
Prov
ide
g uid
e li n
es f o
r de m
a nd -
side
ef
f icie
ncy
p roj
ect e
ligib
ilit y
and
q ua n
tific
ati o
n
Inte
rven
t ions
or p
r oj e
cts t
ore
duce
co
n su m
pti o
n o f
pri m
ary
ener
gy v
i a
redu
cing
fina
l ele
ctri c
ityor
gas
con s
u mpt
i on
o r o
t her
mea
sure
s.
Line
e g u
ida
per l
a pr
epar
azio
n e,
esec
uzio
ne e
va l
u taz
ione
dei
pro
getti
di
cui
all ’
artic
olo
5 , c
o mm
a 1,
dei
decr
eti m
inis
teri a
li 24
apr
ile 2
001
e pe
r la
def in
izi o
n e d
ei c
r iter
i e d
elle
m
o da l
ità p
er il
r il a
s ci o
dei
tito
li di
ef
ficie
nza
ener
geti c
a
Japa
n M
ETI
Futu
re C
DM
Pro
ject
D
evel
opm
ent o
fCD
M m
etho
dolo
gies
inpr
evio
usly
und
erre
pres
ente
d ar
eas
Met
hodo
logi
es fo
r:(i)
ene
rgy
effic
ienc
yan
d (ii
) tra
nspo
rtatio
nse
ctor
CD
M
Met
hodo
logi
es su
bmitt
ed to
CD
M E
B
for a
ppro
val
NSW
/ A
CT
(Aus
tralia
)
NSW
Gre
enho
use
Gas
Aba
tem
ent
Sche
me
(als
o ap
plie
s to
para
llel
AC
T sc
hem
e)
Rul
es fo
r cre
atio
n an
d m
etho
ds fo
r ca
lcul
atio
n of
NSW
Gre
enho
use
Aba
tem
ent C
ertif
icat
es
Gre
enho
use
gas e
mis
sion
redu
ctio
ns
from
vario
us a
ctiv
ities
, inc
ludi
ngin
crea
sed
effic
ienc
y of
ele
ctric
ityco
nsum
ptio
n an
d re
duct
ion
inel
ectri
city
cons
umpt
ion
whe
re th
ere
is n
o ne
gativ
e ef
fect
on
prod
uctio
n or
serv
ice
leve
ls
Gre
enho
use
Gas
Ben
chm
ark
Rul
e (D
eman
d Si
deA
bate
men
t) N
o. 3
of
2003
Ont
ario
Pro
vinc
ial
Gov
ernm
ent
Ont
ario
SO
2 an
d N
Ox
Trad
ing
Prog
ram
Emis
sion
Red
uctio
n C
redi
t cre
atio
n,
reco
rdin
g an
d tra
nsfe
r rul
es, r
ules
for
rene
wab
le e
nerg
y pr
ojec
ts a
ndco
nser
vatio
n pr
ojec
ts, a
nd ru
les f
orth
e op
erat
ion
of
the
Ont
ario
Em
issi
ons T
radi
ng R
egis
try
Proj
ect-b
ased
dire
ct S
O2/
NO
x re
duct
ions
or d
ispl
acem
ent o
f coa
l-fir
ed g
rid e
lect
ricity
by
EE/R
Epr
ojec
ts
Ont
ario
Em
issi
ons T
radi
ng C
ode
(det
aile
d ru
les,
incl
udin
g St
anda
rdM
etho
dfo
r "Em
issi
on R
educ
tions
fr
om E
nerg
y C
onse
rvat
ion
thro
ugh
Proc
ess E
ffici
enci
es"
and
for
"Dis
plac
emen
t of E
lect
ricity
from
Con
serv
atio
n Pr
ojec
ts")
UK
Ener
gy E
ffici
ency
Com
mitm
ent 2
005
–20
08
Prov
ide
guid
ance
on
quan
tifyi
ng e
nerg
yef
ficie
ncy
impr
ovem
ent a
nd b
est p
ract
ice
guid
elin
es fo
r eac
h ty
pe o
f act
ion
unde
r EE
C2
Util
ity D
SM p
rogr
ams t
oim
prov
een
ergy
effi
cien
cy in
dom
estic
pr
oper
ties (
insu
latio
n, li
ghtin
g,he
atin
g an
d ap
plia
nces
, Com
bine
d H
eat a
nd P
ower
, fue
l sw
itchi
ng)
Ener
gy E
ffici
ency
Com
mitm
ent
2005
-200
8: T
echn
ical
Gui
danc
e M
anua
l Iss
ue 1
(stip
ulat
ed v
alue
s /
calc
ulat
ion
spre
adsh
eet)
US
EPA
Nat
iona
l Ene
rgy
Effic
ienc
y A
ctio
n Pl
an
Cre
ate
a M
odel
Gui
de to
pro
vide
bas
ic
proc
ess a
nd te
chni
cal g
uida
nce
on
eval
uatio
n is
sues
and
requ
irem
ents
, whi
ch
can
be u
sed
by in
divi
dual
juris
dict
ions
to
esta
blis
h th
eir o
wn
eval
uatio
nre
quire
men
ts
Ener
gysa
ving
s & a
void
ed e
mis
sion
s as
soci
ated
with
ene
rgy
effic
ienc
ypr
ogra
msi
mpl
emen
ted
by st
ates
, ci
ties,
utili
ties,
priv
ate
com
pani
es,
etc.
Mod
el E
nerg
y Ef
ficie
ncy
Prog
ram
Eval
uatio
n G
uide
US
EPA
NO
x SI
P C
all
Gui
danc
e on
EE/
RE
Set-A
side
G
uida
nce
to N
Ox
SIP
Cal
l sta
keho
lder
s EE
pro
ject
sand
pro
gram
s tha
tre
duce
ele
ctric
ityge
nera
tion
Gui
de o
n ev
alua
tion,
mea
sure
men
tan
d ve
rific
atio
n of
elec
trici
ty sa
ving
s fo
r det
erm
inin
g em
issi
on re
duct
ions
fr
om E
E/R
Eac
tions

359
2 2 M
arch
200
7
– 2 0
–
US
Stat
es
Reg
iona
lG
r een
hou s
e G
as
Initi
ativ
e (R
GG
I)
CO
2 B
u dg e
t T r
adin
g Pr
o gr a
m
Mod
e l ru
le f o
r par
ticip
atin
g St
ates
to u
se
in e
stab
lishi
ng th
eir S
tate
CO
2 B
u dge
t Tr
adin
g Pr
ogra
m,w
hich
is d
esi g
ned
to
stab
il ize
and
then
redu
ce a
nth r
opog
eni c
em
issi
o ns o
f CO
2 in
an
econ
o mi c
ally
ef
f icie
nt m
a nne
r
Five
bro
ad o
ff set
cat
egor
ies,
incl
u din
g r e
duct
ion
or a
void
a nce
of
CO
2 em
issi
o ns f
r om
n at u
r al g
as,o
il ,or
pro
pane
end
use
com
b ust
i on
due
to e
ndu s
e en
ergy
effi
cien
cy in
bu
ildin
gs
Reg
iona
l Gre
enho
use
Ga s
I niti
ativ
e M
odel
Rul
e, in
clud
i ng
rule
s on
CO
2o f
f set
allo
wa n
c es

360
22 March 2007
– 21 –
Thesis 8Modalities for CDM Programs of Activities should reflect the nature of programs that target energy efficiency
Programmatic CDM is a new concept, derived from the decision of the Parties to the KyotoProtocol in December 2005 that:
“a local/regional/national policy or standard cannot be considered as a clean development mechanism project activity, but that project activities under a programme of activities can be registered as a single
clean development mechanism project activity” provided that CDM methodological requirements are met. In other words, the adoption of apolicy or standard in and of itself cannot be submitted as a CDM project, but the activities that constitute the actual implementation of that policy or standard – such as an incentive program for equipment that meets a voluntary high-efficiency level – can be submitted as a single CDM project activity in the form of a program.
For the industry sector, this could mean, for example, that companies participate in voluntaryprograms, such as rebate or tax credit programs or challenge programs that motivate enterprises to voluntarily adopt and implement energy management standards or energy intensity targets.
A typical approach that has been used to quantify the energy savings from financial incentive programs is to specify these ex ante, based on a hypothetical comparison between the energyefficient technology and a technology baseline (e.g., a legally mandated energy performancestandard). This approach has been used in the United States, for example, to promote high-efficiency motors (NEMA Premium), with the benchmark assumed to be the Energy Policy Act minimum standard for the given motor size, assuming hours of operation that reflect industrysector practice. The Database for Energy Efficient Resources (DEER) – compiled by theCalifornia Public Utilities Commission and the California Energy Commission, with support and input from utilities and other interested stakeholders – provides estimates of the energy-savingspotential for selected energy-efficient technologies and measures in residential and nonresidential applications (http://eega.cpuc.ca.gov/deer). The database contains information on typical measures – those commonly installed in the marketplace – and data on the costs and benefits ofmore energy-efficient measures.
Other countries, including Italy (Pavan, 2006), the United Kingdom (Defra, 2007) and a range of US States (Nadel, 2006) are using deemed values in the context of utility efficiency requirements and/or white certificate programs. Australian governments (New South Wales (NSW, 2003) andAustralian Capital Territory) offer a similar default abatement factor method, as well as default efficiency improvement values that can be used to calculate emission reductions for a discrete equipment, process, or system. All of these programs include industrial motors among theequipment that can use stipulated values. It is conceivable to envision CDM-supported programs to provide incentives for utilities to implement demand-side management programs. A decisionby the Parties to the Kyoto Protocol to allow the use of stipulated abatement factors or default efficiency values could pave the way for many types of energy efficiency CDM projects.
Voluntary challenge programs are typically comprehensive, treating a sector or enterprise as a black box and relying on self-reporting at the level of the enterprise, based on guidelines. More attention needs to be devoted to appropriate methodologies for such programs, which are also being established increasingly in developing countries. The 1000-enterprise program in China is an example. An increasing number of countries (including China, Denmark, Ireland, Sweden, andthe USA) are developing energy management standards for industrial energy management

361
22 March 2007
– 22 –
systems, and the USA is also developing standardized assessment protocols for major industrial systems (incl. pumping, compressed air, steam, process heating), which can support quantifi-cation of energy savings and plant certification programs (McKane, 2007). Such methodologicaltools could be used in the CDM context to address complex industrial systems, where the greatest potential for sustained energy savings and greenhouse gas emission reductions lies.
Other types of highly-effective demand-side efficiency programs for which appropriate metho-dologies have yet to be approved include programs that facilitate compliance with mandatory orvoluntary standards or codes. NM0159-rev was unfortunately rejected, mainly because the Meth Panel and Executive Board did not accept that emission reductions can be attributed to the implementation of an efficiency testing, consumer labelling and quality assurance program, basedon the case of air conditioners in Ghana. A review of this decision by an energy efficiency"community of practice" (Thesis 7) could determine whether the proposed methodology reflects measurement and quantification good practice, or whether there is any practical alternative approach that would better address the concerns of the CDM bodies. If not, either the ExecutiveBoard itself or the Parties to the Kyoto Protocol might want to overturn the original decision. Governments around the world are using taxpayer money to implement standard/code and label programs and have documented their effectiveness; best practices adopted for such assessments should be adequate under the CDM.
Thesis 9Rigor must be balanced against results
Uncertainty is inherent to energy efficiency projects under CDM/JI. A key question that needs to be answered by policymakers is the acceptable level of rigor that should apply to end-use energyefficiency projects and how to achieve it. Rigor is a term used to encompass the issues ofuncertainty and error for monitoring & verification activities and is defined as the level of expected reliability of energy, and thus emission, reductions (EPA, forthcoming). The responsible CDM bodies are requiring great effort to address non-routine baseline adjustments up-front, as well as gross-to-net adjustments, without providing top-down guidance. It is not at all clear that this approach is making results more accurate and precise, given the lack of guidance and the limited capacity of individual project developers to address such complex issues.
Yet one thing is certain: Methodologies for end-use energy efficiency projects and programs are having a very difficult time receiving approval, preventing meaningful volumes of greenhousegas reductions being generated from end-use efficiency projects/programs under the CDM.
If this is not the intent of the Parties to the Protocol, then appropriate means to ensure an acceptable level of rigor – that can maintain the environmental integrity of the Kyoto Protocol overall, while encouraging energy efficiency – must be defined top down. In doing so, we shouldstart from current good practice, as reflected in existing regulations and protocols that govern requirements to monitor energy efficiency activities, and be realistic about the level of accuracythat can be achieved and still be viable. Utility DSM programs, incentive programs for energyefficient products, equipment and services and white certificate schemes all must quantifyemissions reductions. The programs in place in OECD and other countries, and the methodologies that they employ (such as those listed in Table 4), should be the starting point. These protocols provide useful top-down guidance on difficult issues that have often been treated unsystematically and inconsistently under the CDM, such as baseline selection, routine and non-routine baseline adjustment for independent variables and gross-to-net adjustments (incl. free riders, spillovers, leakage, rebound effects).

362
22 March 2007
– 23 –
In this discussion, it is important to keep in mind that allowances to Annex I Parties and compliance with commitments are based on national greenhouse gas inventories. Theseinventories are improving, but still contain significant room for error. Nonetheless JI employs much less cumbersome procedures than the CDM. For Track 1 JI, there is no third-party scrutinyat all, since Parties involved in the transaction have emission caps, which is assumed to guarantee a zero-sum outcome for the climate system. Track 2 JI is similar conceptually to CDM, as it must be applied when the host Party does not meet the eligibility requirements for Track 1, including having a national system for tracking greenhouse gas emissions and a national registry to tracktransaction that comply with guidelines. In other words, if the inventory or tracking systems arenot rigorous/in place and therefore cannot guarantee a zero-sum outcome for the climate systemfrom JI transactions (which is analagous to the situation under the CDM), then the Track 2 verification procedure must be followed.
JI verification merely requires determination by an independent entity of whether a project and the ensuing reductions of anthropogenic emissions by sources or enhancements of anthropogenic removals by sinks meet the relevant requirements (i.e., approved by the Parties involved; additional; appropriate baseline and monitoring plan; documentation on environmental impacts, and, if impacts are considered significant, environmental impact assessment undertaken inaccordance with procedures as required by the host Party). This determination is based on a Project Design Document that outlines how the baseline is determined and the emissions reductions calculated. While CDM methodologies can be used, there is no requirement to use specific methodologies approved ex ante. Determinations are final and projects are automatically approved after 45 days, unless a review is requested. This basic procedure is similar to that adopted under a number of other regulatory programs listed in Table 4.
Adopting pragmatic, good practice procedures for Sectoral Scope 3 and related end-use efficiencyCDM activities – similar to those applied under Track 2 JI and other existing regulatory programsaround the world – might mean that some CERs are issued for business-as-usual activities, thus meaning that the overall emission mitigation achieved on a global basis is slightly less thanprojected. But it is doubtful whether the current practice offers greater rigor and certainty, and, with rapidly growing emissions in developing countries and an ongoing process to continuously strengthen Parties' emission reduction obligations over time, less complexity with respect to gross-to-net adjustments might be justified to spur the massive investment in energy efficiency that is needed urgently in developing countries. Investments in outdated equipment are being made every day and will dictate high energy demand for decades. This seems an unnecessaryprice to pay to fool ourselves into thinking that we can guarantee certainty in quantifying energyefficiency project impacts under the CDM.
After all, barriers to energy efficiency investment are real and prevalent, even in OECD countries.

363
22 March 2007
– 24 –
ANNEX 1CDM Sectoral Scopes
This list of sectoral scopes is based on the list of sectors and sources contained in Annex A of the Kyoto Protocol. For some of these scopes, there is partial overlap.
Designation Sectoral Scope Industrial Sectors
1 Energy industries (renewable - / non-renewable sources) 2 Energy distribution3 Energy demand4 Manufacturing industries5 Chemical industry6 Construction7 Transport 8 Mining/Mineral production9 Metal production
Sources 10 Fugitive emissions from fuels (solid, oil and gas) 11 Fugitive emissions from production and consumption of halocarbons and
sulphur hexafluoride12 Solvents use 13 Waste handling and disposal 14 Afforestation and reforestation 15 Agriculture

364
22 March 2007
– 25 –
REFERENCES
Arquit Niederberger, A., and C. Brunner (in press) Promotion of high-efficiency electric motor systems under the Clean Development Mechanism, Proc. of EEMODS 2007 (Beijing, China, 10-13 June 2007).
Arquit Niederberger, A., C. Brunner, K. Jiang, Y. Chen (2007) Energy efficiency in China: Thebusiness case for mining an untapped resource, Greener Management International.
Arquit Niederberger, A., and R. Spalding-Fecher (2006) Demand-side energy efficiencypromotion under the Clean Development Mechanism: lessons learned and future prospects. Energy for Sustainable Development X(4), 45-58.
Benkhart, B. (2006) NEMA Premium motor transformation programmes in the United States. Presentation at the IEA Industrial Electric Motor Systems Workshop, 15-16 May 2006, Paris.
Defra (UK Department for Environment, Food and Rural Affairs) (2007) Energy, cost and carbon saving calculations for the draft EEC 2008-11 Illustrative Mix: Energy EfficiencyCommitment 2008-11 (London: UK Department for Environment, Food and Rural Affairs).
EPA (US Environmental Protection Agency) (forthcoming) Creating an Energy Efficiency andRenewable Energy Set-Aside in the NOx Budget Trading Program: Evaluation, Measurement and Verification of Electricity Savings for Determining Emission Reductions from Energy Efficiency and Renewable Energy Actions (Washington: US Environmental Protection Agency).
Geller, H., and S. Attali (2005) The Experience with Energy Efficiency Policies and Programmes in IEA Countries: Learning from the Critics. IEA Information Paper (Paris: International EnergyAgency).
Gillingham, K., Newell, R.G., and K. Palmer (2004) Retrospective Examination of Demand-SideEnergy Efficiency Policies (Washington, DC: Resources for the Future).
Hayashi, D., and A. Michaelowa (2007) Lessons from submission and approval process of large-scale energy efficiency CDM methodologies. Paper prepared for the UNIDO/CTI/UK Investment and Trade Seminar on Energy Efficiency Projects in CDM and JI, 19-20 March 2007, Vienna.
IEA (International Energy Agency) (2006) World Energy Outlook 2006 (Paris: Organisation for Economic Co-operation & Development/International Energy Agency).
McKane, A. (2007) Industrial Energy Management: Issues Paper. Paper prepared for UNIDO Expert Group Meeting on Using Energy Management Standards to Stimulate Persistent Application of Energy Efficiency in Industry, 21-22 March 2007, Vienna.
Nadel, S. (2006) Energy efficiency resource standards: experience and recommendations. ACEEE Report E063 (Washington: American Council for an Energy Efficient Economy).
NSW (New South Wales) (2003) Greenhouse Gas Benchmark Rule (Demand Side Abatement), No. 3 of 2003
Pavan, M. (2006) New trends in energy regulation: the integration of command and controlapproaches, tariff regulation and artificial markets for demand-side resources. Proceedings ofthe 29th International Conference of the Internaional Association for Energy Economics (IAEE), 7-10 June 2006.
Sathaye, G. (2006) A Comment: Determining additionality for bundled energy efficiency projects.Submitted to UNFCCC website in response to call for public inputs on additionality. Accessed27 March 2006.

365
22 March 2007
– 26 –
SAVE (European Commission Specific Actions for Vigorous Energy Efficiency Program) (2001) European Ex-Post Evaluation Guidebook for DSM and EE Service Programmes (Brussels:European Commission).
SEEEM (Standards for Energy Efficiency of Electric Motor Systems) (2006) MarketTransformation to Promote Efficient Motor Systems (Zurich: SEEEM).
Spalding-Fecher, R., and J. Roy, et al. (2004) Potential for energy efficiency: Developing nations Encyclopedia of Energy 5, 117-133.
URC (UN Environment Program Risoe Centre on Energy, Climate and Sustainable Development) (2006) CDM Pipeline Overview (http://cd4cdm.org/Publications/CDMpipeline.xls)

366
Way forward for CDM energy efficiency projects - Mr. PatrickMatschoss - German Advisory Council on the Environment
- 1 -
UNIDO Issue Paper
Way forward for CDM Energy Efficiency Projects: A review of
programmatic, sectoral and bundling approaches to CDM as ways
for development of CDM projects
CTI-Workshop on Energy Efficiency in the CDM
19-20 March 2007
UNIDO, Vienna
Prepared by
Patrick Matschoss
1. Introduction
The CDM has a dual objective of reducing GHG on the one hand and contributing to the host
countries’ sustainable development on the other. End-use energy efficiency projects create
high sustainable development benefits as they reduce energy poverty. Furthermore, energy
efficiency often generates emission reductions at low costs. Despite these facts, they are also
particularly under-represented in the portfolio of current or proposed CDM-projects. The
majority of CER stem from projects that generate high volumes of CER that produce only
little sustainable development benefits such as emission reductions from landfills.
2. Barriers to energy efficiency in the CDM
The under-representation of energy efficiency projects in the CDM is due to a number of
reasons. First of all the investor is financially rewarded only for the emission reductions but
not for the contribution to sustainable development. (Ellis et al. 2007).
Despite their large potential energy efficiency projects often generate fewer CER per project
than, e. g., (non CO2-) emission reductions from landfill projects. This is due to the fact that

367
- 2 -
savings from end-use efficiency are often dispersed and therefore small at a single project site.
Transaction costs on the other hand are partly fix as they related to the registration,
verification and certification procedure. This means a relatively higher burden for energy
efficiency CDM projects.
Boosting transaction costs even further, especially energy efficiency projects face a number of
additional methodological difficulties. The market(s) for energy efficiency is multi faceted
making energy efficiency CDM projects particularly complicated. Niederberger et al. (2006)
distinguish three markets for energy efficiency, namely (i) disretionary retrofit, (ii) planned
replacement and (iii) new installations (p. 56). Discretionary retrofit relates to the decision to
prematurely replace existing technology in order to raise end-use energy efficiency. Planned
replacement relates to replacements that would have taken place anyhow (failure, end of
lifetime). The last category relates to the choice of equipment for new installations. For
proving additionality, for instance, proponents of CDM projects need to provide evidence that
in the first case the retrofit is indeed discretionary and not a planned replacement. That is, it
would not have taken place in the absence of CDM. If, for the second case the planned
replacement appears cost-effective, barrier analysis will have to show that the investments
would not have taken place in the absence of the CDM project. This is also be true for new
installations.
Additional problems occur when it comes to validating emission reductions ex ante. Consider
energy savings from a household appliance labelling project. In addition to being very
dispersed and involving a large number of households it is inherently unsure to estimate ex
ante the household’s behaviour in terms of (i) how many will buy the new appliance, (ii)
when they buy it and (iii) if they do it due to the labelling activity.
The examples show that there is not only a need to lower transaction costs for CDM projects
in general but for energy efficiency CDM in particular – especially in light of the above
mentioned benefits of energy efficiency CDM. Therefore, the under-representation of these
desired projects resulted in various efforts to reduce transaction cost. These are small-scale
CDM, bundling and most recently the programmatic CDM.
3. Small-scale CDM and sectoral crediting mechanisms

368368
- 3 -
As mentioned above, transaction costs for smaller projects are relatively higher. Therefore,
the COP/MOP, by decisions 21/CP.8 and 4/CMP.1, issued further guidance for the CDM and
allowed for “simplified modalities and procedures for small-scale CDM project activities”
(SSC). A basic difference to large-scale projects is that simplified baseline and monitoring
methodologies are provided by the CDM Executive Board. That is, the bottom-up approached
pursued for large scale projects, where baseline methodologies are developed by the project
developers themselves, is turned around. Furthermore, a simplified PDD is provided for SSC
(UNFCCC 2002, pp. 18-25, 2006, pp. 43-52).
The decisions foresee three different types of activities. Type I relates to renewable energy
projects, Type II to energy efficiency projects and Type II to other emission reduction projects
including methane reduction/recovery and emission reduction from cars. Each Type entails a
number of methods. Table 1 lists the Type II methodologies relating to energy efficiency
improvement. The Appendix lists all Type-II projects that are at least in the stage of
validation.
Originally, the total saving was set at maximum of 15 GWh in order to be eligible for small-
scale (UNFCCC 2002, pp. 18-25, 2006, pp. 43-52). However, this boundary has been
criticised for being much too low for the creation of viable projects. It has therefore been
suggested to raise the limit by an order of magnitude, that is, to 150 GWh (World Bank
2006b). The CDM Executive Board at its 29th (CDM-EB-29) partly followed that
recommendation by deciding to raise the limit to 60 GWh (CDM-EB-29 2006).
Table 1
Approved Methodologies for Small-Scale Energy Efficiency Projects (Type II)
AMS-II.A. Supply side energy efficiency improvements – transmission and distribution
AMS-II.B. Supply side energy efficiency improvements – generation
AMS-II.C. Demand-side energy efficiency programs for specific technologies
AMS-II.D. Efficiency and fuel switching measures for industrial facilities
AMS-II.E. Efficiency and fuel switching measures for buildings
AMS-II.F. Efficiency and fuel switching measures for agricultural facilities and activities
Source: UNFCCC 2007
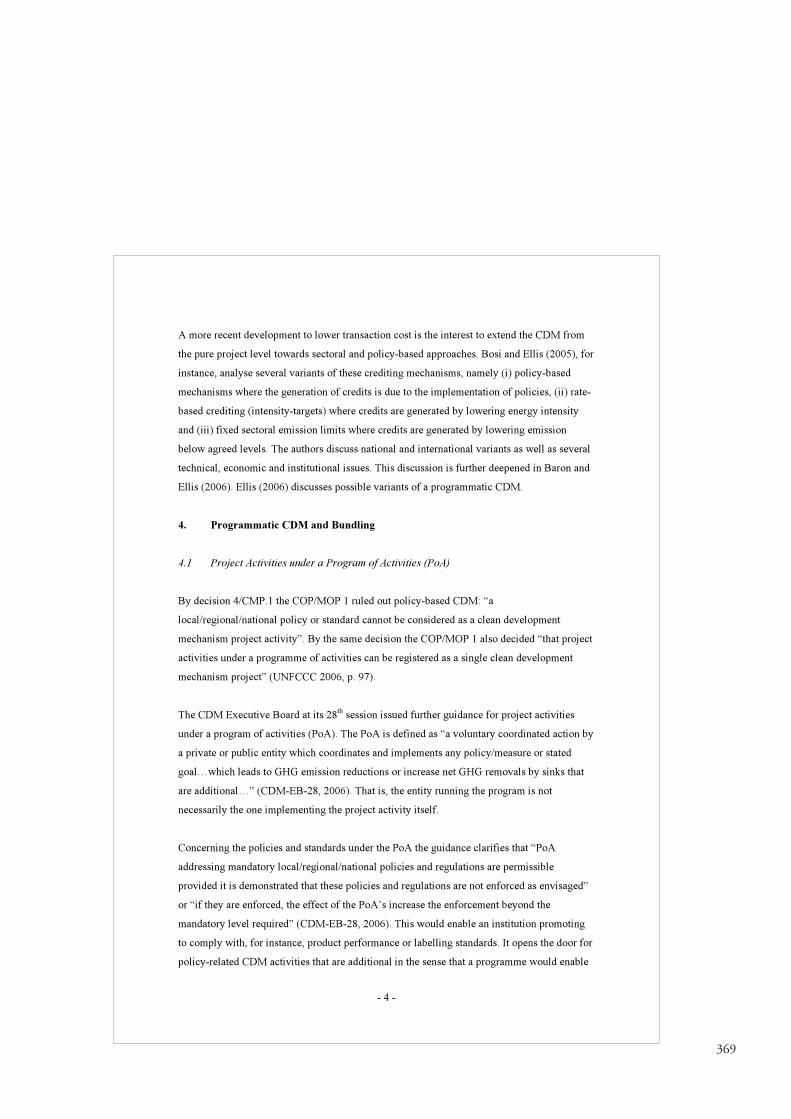
369
- 4 -
A more recent development to lower transaction cost is the interest to extend the CDM from
the pure project level towards sectoral and policy-based approaches. Bosi and Ellis (2005), for
instance, analyse several variants of these crediting mechanisms, namely (i) policy-based
mechanisms where the generation of credits is due to the implementation of policies, (ii) rate-
based crediting (intensity-targets) where credits are generated by lowering energy intensity
and (iii) fixed sectoral emission limits where credits are generated by lowering emission
below agreed levels. The authors discuss national and international variants as well as several
technical, economic and institutional issues. This discussion is further deepened in Baron and
Ellis (2006). Ellis (2006) discusses possible variants of a programmatic CDM.
4. Programmatic CDM and Bundling
4.1 Project Activities under a Program of Activities (PoA)
By decision 4/CMP.1 the COP/MOP 1 ruled out policy-based CDM: “a
local/regional/national policy or standard cannot be considered as a clean development
mechanism project activity”. By the same decision the COP/MOP 1 also decided “that project
activities under a programme of activities can be registered as a single clean development
mechanism project” (UNFCCC 2006, p. 97).
The CDM Executive Board at its 28th session issued further guidance for project activities
under a program of activities (PoA). The PoA is defined as “a voluntary coordinated action by
a private or public entity which coordinates and implements any policy/measure or stated
goal…which leads to GHG emission reductions or increase net GHG removals by sinks that
are additional…” (CDM-EB-28, 2006). That is, the entity running the program is not
necessarily the one implementing the project activity itself.
Concerning the policies and standards under the PoA the guidance clarifies that “PoA
addressing mandatory local/regional/national policies and regulations are permissible
provided it is demonstrated that these policies and regulations are not enforced as envisaged”
or “if they are enforced, the effect of the PoA’s increase the enforcement beyond the
mandatory level required” (CDM-EB-28, 2006). This would enable an institution promoting
to comply with, for instance, product performance or labelling standards. It opens the door for
policy-related CDM activities that are additional in the sense that a programme would enable

370
- 5 -
implementation of a (non-binding or poorly enforced) regulation that would not have occurred
in the absence of the program.
PoA’s must be registered with approved baseline and monitoring methodologies (AM) and
they involve one type of technology or measure. Within the PoA’s duration (max. 30 yrs)
CDM project activities (CPA) – using the PoA’s particular AM and technology/measure –
may be added at any time as long as each CPA is unambiguously identified, defined and
localized and as long as the CDM EB is informed of each new CPA within a PoA. At its
submission the PoA must demonstrate what information it will require from each CPA in
order to ensure that they all comply with the principles of the CDM (definition of leakage,
additionality, baseline emissions etc.). The CPAs use “normal” CDM crediting periods (3x7
or 1x10 years) but they must end at the end of the PoA’s duration. Furthermore, the CPA must
not be registered as an individual CDM project or as another PoA’s CPA. (CDM-EB-28
2006). The crediting periods for CDM projects are laid out in decision 3/CMP.1, that is in the
“Modalities and procedures” for the CDM (UNFCCC 2006, pp. 6-29).
Concerning physical boundaries, the PoA may extend to more than one non-annex I host
country as long as all participating countries confirm that the CPA in their country contributes
to sustainable development. Furthermore, all net reductions for each CPA need to be “real
and measurable” (CDM-EB-28 2006).
4.2 Distinction between project bundles and PoA
Bundling CDM projects and PoA represent the same basic idea. That is, transaction costs that
are partly independent of the project size shall be distributed more widely in order to reduce
the overhead costs for each single CER.
Bundling for SSC was introduced together with SSC CDM projects themselves by decisions
21/CP.8 and 4/CMP.1. Bundled projects share one project design document and one
validation report, are registered and verified together (UNFCCC 2006, p. 45). That is, during
the whole process of validation, verification and certification the bundle is treated as one.
However, the idea of bundling is also attractive for large-scale projects. Therefore, the
COP/MOP allowed for bundling by stating in decision 4/CMP.1 that it “recognizes that large-
scale project activities under the clean development mechanism can be bundled if they are

371
- 6 -
validated and registered as one clean development mechanism project activity” (UNFCCC
2006, p. 97).
However, there are some differences between project bundles and PoA as summarized by
World Bank (2006a). A Project bundles represents a number of individual CDM projects with
pre-defined baselines, reductions etc. submitted together for registration. In contrast, the PoA
as a framework is registered as one CDM project for one predetermined type of activities. The
number of activities and actual GHG reduction is estimated but unknown beforehand and not
necessarily executed by the PoA operator itself. The sum of activities and related reductions
of GHG – once determined afterwards at verification – constitute the single CDM project as a
PoA.
4.3 PoA: the way forward?
Taken together, the idea of PoA combines several elements from SSC, sectoral crediting and
bundling. The bundling component/principle that originated from SSC, distributes transaction
costs more widely and therefore lowers the burden for each CER. The fact that PoA is not
limited to 60 GWh as the SSC allows to distribute overhead costs even further. Due to the
nature of the PoA the estimation of emission reduction is less stringent ex ante and since the
overhead is carried by the PoA itself, it is easier for the individual CPA to start. The fact that
CPA may start at any time within the program may significantly reduce the organizational
burden, especially in the presence of many stakeholders/participants. That is, there is no need
for a “concerted action” as with bundles where the whole bundle has to start at once. This
makes PoA especially suitable for a high number of very dispersed micro activities with an
unknown timing of the uptake of the single activity ex ante. For example, this may be the case
for campaigns or promotional activities for the replacement of light bulbs for CFL or a
labelling scheme for electric appliances with a view of changing the development within a
whole sector.
These characteristics of PoA may give rise to much wider applications of crediting and may
reap the potentials of energy efficiency that currently represent lost opportunities. However,
so far there is only very limited experience with PoA and actual workability will depend to a
large degree on the details of administration and implementation.

372
- 7 -
4. Review of programmatic CDM pipeline with regard to energy efficiency
4.1 Methodologies for PoA
A PoA is not a method in itself. However, the above mentioned characteristics may require
taking into account the special circumstances of the PoA. Furthermore, the decisions on PoA
are still quite recent. Therefore, the development of methodologies for PoA is still in its
infancy. Tables 2 and 3 list recently approved or still pending methodologies for large scale
energy efficiency projects that either target or appear suitable for PoA.
Table 2
Selected Newly Approved Methodologies for Energy Efficiency
Approved Method
(formerly new
method)
Name & Project Approved
(recomm. for
approval) at
AM0046
(NM0150-rev)
Distribution of efficient light bulbs to households
(Ghana efficient lighting retrofit project)
EB-29
(MP-25)
AM0044
(NM0144-rev)
Energy efficiency improvement projects: boiler
rehabilitation or replacement in industrial and
district heating sectors
(Energy efficiency improvements carried out by an
Energy Service Company (ESCO) in Ulaanbaatar,
Mongolia
EB-28
(MP-24)
AM0038
(NM0146)
Methodology for improved electrical energy
efficiency of an existing submerged electric arc
furnace used for the production of SiMn
(Transalloys Manganese Alloy Smelter Energy
Efficiency Project in South Africa)
EB-26
(MP-22)
AM0031
(NM0105)
Bus Rapid Transit System for Bogotá, Columbia:
TransMilenio Phase II to IV
EB-25
(MP-21)
Source:
CDM-EB meeting reports: http://cdm.unfccc.int/EB/index.html

373
- 8 -
MP meeting reports: http://cdm.unfccc.int/Panels/meth/index.html
Table 3
Status of Selected New Methodologies for Energy Efficiency under Consideration
Method Name & Project Status
NM0141-rev Displacing grid/off-grid steam and electricity
generation with less carbon intensive fuels in
Aba, Nigeria
MP-25: preliminary
recommendation
NM0157-rev Open-DSM type CDM for Green Lighting in
Shijiazhuang city, China
MP-25: C
NM0159-rev Implementation of an Efficiency Testing,
Consumer Labeling and Quality-Assurance
Program for Air Conditioners in Ghana
MP-25: C
NM0171 Use of Hydro Heavy Fuel Oil Technology
(HHFOT) to improve energy efficiency at a
power plant in Pakistan
MP-25:WIP
NM0195 Rama Newsprint and Paper Limited energy
efficiency project, India
MP-25: preliminary
recommendation
NM0197 India – Accelerated Chiller replacement
program
MP-25: preliminary
recommendation
NM0200 Fuel switch project for generation of cleaner
power
MP-25: preliminary
recommendation
NM0202 AzDRES Power Plant Energy Efficiency and
change in fuel mix
MP-25: preliminary
recommendation
NM0201 Cosipar Transport Modal Shift Project MP-25: preliminary
recommendation
NM0165 Feed switchover from Naphta to Natural Gas
(NG) at Phulpur plant of IFFCO
EB-26: B
EB: A = approval; B = possible reconsideration; C = non-approval
MP: recommended for A, B or C
Source:

374
- 9 -
CDM-EB meeting reports: http://cdm.unfccc.int/EB/index.html
MP meeting reports: http://cdm.unfccc.int/Panels/meth/index.html
So far (March 2007), there are only two approved large-scale methodologies that are
specifically designed to carry out programs of activities. Approved methodology AM0046 as
shown in table 2 is designed to administer a program for the replacement of “normal” light
bulbs with compact fluorescent lamps (CFL). Approved methodology AM0044 (table 2) aims
at retrofitting or replacing old boilers used for heating in industry or district heating. So far,
none of the underlying projects has reached the validation stage.
Other methodologies aiming at programmatic types of CDM are the “Open-DSM type CDM
for Green Lighting” (NM0157-rev) and “Implementation of an Efficiency Testing, Consumer
Labelling and Quality-Assurance Program for Air Conditioners” (NM0159-rev). However,
the Methodologies Panel recommended non-approval for both methodologies. At the time of
writing no final recommendation was available on the methodology for the “Accelerated
Chiller replacement program” (NM0197).
4.2 Project Examples
The underlying project of approved methodology AM0046 is the “Ghana efficient lighting
retrofit project” that is not yet validated (Figueres and Bosi 2006). As laid out in Annex 2 of
CDM-EB-29 (2006) the project activity is implemented by a project coordinator who is the
project participant. It is foreseen that the project coordinator runs a campaign to replace
inefficient light bulbs in households for more efficient CFL. The project coordinator donates
or sells the CFL at a reduced price to households who have to turn in their old light bulbs in
return. This may be done either directly or via designated distribution points. In accordance
with the definition of a PoA above the household that is actually executing the emission
reduction activity (using the more efficient CFL) is not the project participant. Instead, the
coordinator running the program is. All participating households need to be connected to the
electricity grid. Together with all power plant connected to that grid they determine the spatial
boundary of the PoA.
Methodology AM0046 uses baseline approach 48 (a) “Existing actual or historical emissions,
as applicable” of the “Modalities and procedures for the CDM” (UNFCCC 2006, pp. 6-29).

375
- 10 -
The baseline scenario is the utilization of the currently used light bulbs with a certain rate of
autonomous replacement. The use of the light bulb in the absence of the project is determined
by monitoring a control group (baseline sample group, BSG). Therefore, any policy and
measure affecting the use of light appliances is reflected in the baseline scenario. Leakage,
could occur if the freed light bulbs would be used elsewhere. That is, emissions would rise
due to the project activity. Therefore the collected lamps need to be scrapped and an
independent verifier needs to check whether the number of distributed CFL corresponds with
the number of scrapped light bulbs.
Approved methodology AM0044 is laid out in Annex 1 of CDM-EB-28 (2006). The
underlying project is “Energy efficiency improvements carried out by an Energy Service
Company (ESCO) in Ulaanbaatar, Mongolia”. An Energy Service Company (ESCO) shall
increase energy efficiency by retrofitting or replacing old boilers ahead of the end of their life
time. The project focuses solely on energy efficiency excluding fuel switch. The methodology
uses baseline methodology 48 (b) “Emissions from a technology that represents an
economically attractive course of action, taking into account barriers to investment” of the
“Modalities and procedures for the CDM” (UNFCCC 2006, pp. 6-29). The installed capacity
of each baseline and respective boiler shall be determined using a performance test.
Concerning small-scale projects there are already some registered projects as can be seen in
Appendix A. Using methodology AMS-II.B (see table 1) there is already a retrofit program
for decentralized heating stations in Mongolia. The “Kuyasa low-cost urban housing energy
upgrade is an efficient lighting project in Cape Town, South Africa using AMS-II.C. The
“Karnataka CDM Photovoltaic Lighting Programme” is at the validation stage as well and
also uses AMS-II.C but its main focus is on solar energy using AMS-I.A.
5. Conclusions
The CDM in general and energy efficiency related CDM in particular faces a number of
barriers. This has led to an under-representation of CDM projects related to energy efficiency
in the CDM portfolio. Since increased energy efficiency has high development benefits as it
contributes to reducing energy poverty this has triggered sustained criticism leading to new
models of the CDM that try to reduce transaction costs, inter alia by moving away from its
project-based nature. These include bundles of small- and large-scale CDM, some ideas on

376
- 11 -
sectoral crediting mechanisms and – most recently – project activities under a program of
activities whereas the latter combines features of the former. PoA have been only recently
established by COP/MOP1 and further specified by the CDM Executive Board in Dec 2006.
So far there are only two methodologies for running a large scale CDM program of activities.
A few more methods are currently being considered by the CDM Executive Board and its
Methodologies Panel. However, approval is uncertain.
Therefore, the programmatic CDM still has to prove its success. If it succeeds, however, it
could make a valuable contribution to broaden the crediting of greenhouse gas emission
reductions. This is especially true with regards to end-use efficiency improvements that
currently still represent lost opportunities in terms of lost low-cost reduction possibilities and
high sustainable development benefits.
References
Baron, R., Ellis, J. 2006, Sectoral Crediting Mechanisms for Generating Greenhouse Gas
Mitigation: Institutional and Operational Issues, OECD/IEA Information Paper, Paris
Bosi, M., Ellis, J. 2005, Exploring Options for “Sectoral Crediting Mechanisms”, OECD/IEA
Information Paper, Paris
CDM-EB-28 2006, Guidance on the registration of project activities under a programme of
activities as a single CDM project activity (Version 01), EB 28 Meeting report, Annex 15,
http://cdm.unfccc.int/EB/index.html
CDM-EB-29 2006, CDM-EB-29 meeting report, http://cdm.unfccc.int/EB/index.html
Ellis, J. 2006, Issues Related to a Programme of Activities under the CDM, OECD/IEA
Information Paper, Paris
Ellis, J., Winkler, H., Corfee-Morlot, J., Gagnon-Lebrun, F. 2007, CDM: Taking Stock and
Looking Forward, Energy Policy 35, 15-28
Figueres, C., Bosi, M. 2006, Achieving Greenhouse Gas Emission Reductions in Developing
Countries through Energy Efficient Lighting Projects in the Clean Development Mechanism
(CDM), Worldbank, Washington D. C.
Niederberger, A. A., Spalding-Fecher, R. 2006, Demand-side energy efficiency promotion
under the Clean Development Mechanism: lessons learned and future prospects, Energy for
Sustainable Development X, Nr. 4

377
- 12 -
UNFCCC 2002, Report of the Conference of the Parties on its eighth session, held at New
Delhi from 23 October to 1 November 2002. Part Two: Action taken by the Conference of
the Parties at its eighth session. Decisions adopted by the Conference of the Parties
(continued), http://unfccc.int/resource/docs/cop8/07a03.pdf
UNFCCC 2006, Report of the Conference of the Parties serving as the meeting of the Parties
to the Kyoto Protocol on its first session, held at Montreal from 28 November to 10
December 2005. Part Two: Action taken by the Conference of the Parties serving as the
meeting of the Parties to the Kyoto Protocol at its first session. Decisions adopted by the
Conference of the Parties serving as the meeting of the Parties to the Kyoto Protocol.
http://cdm.unfccc.int/Reference/COPMOP/08a01.pdf
UNFCCC 2007, Approved SSC Methodologies,
http://cdm.unfccc.int/methodologies/SSCmethodologies/approved.html
Umamaheswaran, K., Michaelowa, A. 2006, Additionality and Sustainable Development
Issues Regarding CDM Projects in Energy Efficiency Sector, HWWA Discussion Paper
346, HWWA, Hamburg
World Bank 2006a, Definition of Policy and Programme of Activities, Submission of the
World Bank o the CDM Executive Board, 15 June 2006,
http://carbonfinance.org/Router.cfm?Page=Methodology&mt=Papers
World Bank 2006b, Methodological barriers to develop energy efficiency projects under
simplified modalities and procedures for small-scale CDM project activities, Submission of
the World Bank o the CDM Executive Board, 10 August 2006,
http://carbonfinance.org/Router.cfm?Page=Methodology&mt=Papers

378
- 13
-
Appe
ndix
: Exc
erpt
from
Ris
oe C
DM
Pipe
line
over
view
(upd
ated
1 F
eb 2
007)
Sour
ce: h
ttp://
ww
w.u
nepr
isoe
.org
/
Smal
l-Sca
le p
roje
cts
Type
II. B
.ID
Ref
.Ti
tleH
ost c
ount
rySt
atus
Type
Met
hodo
logy
CD
M01
3326
6Th
erm
al e
ffici
ency
impr
ovem
ent i
nitia
tives
in c
oal f
ired
boile
r sys
tem
Indi
aR
egis
tere
dEE
sup
ply
side
AMS-
II.B.
CD
M03
1047
9E
nerg
y E
ffici
ency
Mea
sure
s at
a T
herm
al P
ower
Gen
erat
ing
Sta
tion
Of C
ESC
-lim
ited,
BBG
SIn
dia
Reg
iste
red
EE s
uppl
y si
deAM
S-II.
B.
CD
M03
3368
6Im
prov
emen
t in
ener
gy c
onsu
mpt
ion
of a
Hot
el
Indi
aR
egis
tere
dEE
ser
vice
AMS-
II.B.
+AM
S-II.
E.C
DM
0613
706
Sup
ply
side
ene
rgy
effic
ienc
y im
prov
emen
ts in
ste
am g
ener
atio
n at
C
SL
by C
hem
plas
t San
mar
Ltd
.In
dia
Reg
iste
red
EE s
uppl
y si
deAM
S-II.
B.
CD
M05
7429
5A
retro
fit p
rogr
amm
e fo
r dec
entra
lised
hea
ting
stat
ions
in M
ongo
liaM
ongo
liaR
egis
tere
dEE
sup
ply
side
AMS-
II.B.
CD
M03
6177
5W
est N
ile E
lect
rific
atio
n Pr
ojec
t (W
NEP
)U
gand
aR
eg. r
eque
stH
ydro
AMS-
I.D.+
AMS-
II.B.
CD
M02
1482
1Ef
ficie
ncy
impr
ovem
ent o
f Tur
bine
Gen
erat
or to
redu
ce fo
ssil
fuel
co
nsum
ptio
n in
the
Coa
l fire
d bo
iler s
yste
mIn
dia
Reg
. req
uest
EE s
uppl
y si
deAM
S-II.
B.
CD
M14
8084
7U
p-gr
adat
ion
of G
as T
urbi
ne 1
(GT
1) a
nd G
as T
urbi
ne 2
(GT
2) a
t co -
gene
ratio
n pl
ant o
f Haz
ira G
as P
roce
ssin
g C
ompl
ex (H
GPC
) of O
il an
d N
atur
al G
as C
orpo
ratio
n Li
mite
d (O
NG
C)
Indi
aR
eg. r
eque
stEE
indu
stry
AMS-
II.B.
CD
M03
60E
nerg
y ef
ficie
ncy
thro
ugh
redu
ctio
n in
aux
iliary
con
sum
ptio
n at
a
Ther
mal
Pow
er G
ener
atin
g St
atio
n In
dia
At v
alid
atio
nEE
sup
ply
side
AMS-
II.B.
CD
M04
08S
uppl
y si
de e
nerg
y ef
ficie
ncy
mea
sure
s at
Tat
a C
hem
ical
s Lt
d,
Mith
apur
Indi
aAt
val
idat
ion
EE s
uppl
y si
deAM
S-II.
B.
CD
M10
89Im
prov
emen
t in
ener
gy e
ffici
ency
of s
team
gen
erat
ion
and
pow
erco
nsum
ptio
n at
Rec
ron
Syst
hetic
s Li
mite
d, A
llaha
bad
Indi
aAt
val
idat
ion
EE s
uppl
y si
deAM
S-II.
B.+A
MS-
II.D
.
CD
M14
72Bo
iler e
ffici
ency
impr
ovem
ent a
nd fu
el s
witc
h to
bio
mas
s in
co
gene
ratio
n pl
ants
at A
tul L
td.
Indi
aAt
Val
idat
ion
Biom
ass
ener
gyAC
M6+
AMS-
II.B.

379
- 14
-
Exce
rpt f
rom
Ris
oe C
DM
Pip
elin
e ov
ervi
ew (c
ontd
., up
date
d 1
Feb
2007
)
Smal
l-Sca
le p
roje
cts
Type
II. C
.ID
Ref
.Ti
tleH
ost c
ount
rySt
atus
Type
Met
hodo
logy
CD
M00
5079
Kuya
sa lo
w-c
ost u
rban
hou
sing
ene
rgy
upgr
ade
proj
ect,
Kha
yelit
sha
Sou
th A
frica
Reg
iste
red
EE
hou
seho
lds
AM
S-I.
C.+
AM
S-
II.C
.+AM
S-II.
E.C
DM
0238
255
Dem
and-
side
ene
rgy
effic
ienc
y pr
ogra
mm
e in
the
‘Hum
idifi
catio
n To
wer
s’ o
f Jay
a Sh
ree
Text
iles
Indi
aR
egis
tere
dE
E in
dust
ryAM
S-II
.C.
CD
M02
20G
HG
redu
ctio
n by
impl
emen
ting
ener
gy e
ffici
ent p
loug
h sh
are
mix
erte
chno
logy
in s
oap
man
ufac
turin
g at
Hin
dust
an L
ever
Lim
ited
Indi
aAt
val
idat
ion
EE in
dust
ryAM
S-II.
C.
CD
M03
80E
nerg
y ef
ficie
ncy
and
fuel
sw
itchi
ng m
easu
res
in th
e ca
ustic
sod
a an
d so
dium
cya
nide
pla
nt a
t Vad
odar
a co
mpl
ex o
f GAC
L In
dia
At v
alid
atio
nEE
indu
stry
AMS-
II.C
.
CD
M04
07D
eman
d si
de e
nerg
y ef
ficie
ncy
impr
ovem
ent m
easu
res
at T
ata
Che
mic
als
Ltd,
Mith
apur
Indi
aAt
val
idat
ion
EE in
dust
ryAM
S-II.
C.
CD
M07
21E
nerg
y ef
ficie
ncy
mea
sure
s in
a s
ugar
pla
nt b
y G
MR
Indu
strie
s Lt
d (G
IDL)
Indi
aAt
val
idat
ion
EE in
dust
ryAM
S-II.
C.
CD
M09
58Ka
rnat
aka
CD
M P
hoto
volta
ic L
ight
ing
Prog
ram
me
Indi
aAt
val
idat
ion
Sola
rAM
S-I.A
.+AM
S-II.
C.

380
- 15
-
Exce
rpt f
rom
Ris
oe C
DM
Pip
elin
e ov
ervi
ew (c
ontd
. upd
ated
1 F
eb 2
007)
Smal
l-Sca
le p
roje
cts
Type
II. D
.ID
Ref
.Ti
tleH
ost c
ount
rySt
atus
Type
Met
hodo
logy
CD
M02
1526
2En
ergy
effi
cien
cy p
roje
cts
- Ste
am s
yste
m u
pgra
datio
n at
the
man
ufac
turin
g un
it of
Birl
a Ty
res
Indi
aR
egis
tere
dEE
indu
stry
AMS-
II.D
.
CD
M05
7638
9W
aste
hea
t rec
over
y pr
ojec
t pro
ject
bas
ed o
n te
chno
logy
upg
rada
tion
at A
pollo
Tyr
es, V
adod
ara,
Indi
a In
dia
Reg
iste
red
EE in
dust
ryAM
S-II.
D.
CD
M04
3944
5D
eman
d si
de e
nerg
y co
nser
vatio
n &
redu
ctio
n m
easu
res
at IP
CL
– G
andh
ar C
ompl
exIn
dia
Reg
iste
red
EE in
dust
ryAM
S-II.
D.
CD
M03
0256
8G
HG
Em
issi
on R
educ
tions
thro
ugh
Ene
rgy
Effi
cien
cy Im
prov
emen
tsIn
dia
Reg
iste
red
EE
indu
stry
AMS
-II.D
.
CD
M03
5958
2In
dia
- Ver
tical
Sha
ft Br
ick
Kiln
Clu
ster
Pro
ject
In
dia
Reg
iste
red
EE in
dust
ryAM
S-II.
D.
CD
M03
3368
6Im
prov
emen
t in
ener
gy c
onsu
mpt
ion
of a
Hot
el
Indi
aR
egis
tere
dE
E s
ervi
ceA
MS
-II.B
.+A
MS
-II.E
.C
DM
0701
701
Ene
rgy
effic
ienc
y pr
ojec
t in
the
Ram
la C
emen
t Pla
nt in
Isra
el th
roug
h in
stal
men
t of n
ewgr
indi
ng te
chno
logy
Isra
elR
egis
tere
dEE
indu
stry
AMS-
I.D.+
AMS-
II.D
.
CD
M04
2874
5D
eman
d si
de e
nerg
y co
nser
vatio
n an
d re
duct
ion
mea
sure
s at
ITC
Tr
iben
i Uni
t In
dia
Reg
iste
red
EE in
dust
ryAM
S-II.
D.
CD
M04
4075
8A
ltern
ate
arra
ngem
ent f
or p
rehe
atin
g fu
el N
GIn
dia
Reg
iste
red
EE
indu
stry
AMS
-II.D
.C
DM
0932
777
Ene
rgy
Effi
cien
cy Im
prov
emen
t in
Ele
ctric
Arc
Fur
nace
at I
ndia
n S
eam
less
Met
al T
ube
Lim
ited
(ISM
T), J
ejur
i, M
ahar
asht
raIn
dia
Reg
iste
red
EE
indu
stry
AMS
-II.D
.
CD
M09
3079
4R
educ
ing
heat
loss
into
atm
osph
ere
alon
g w
ith th
e flu
e ga
ses
byut
ilizin
g it
for p
rehe
atin
g of
com
bust
ion
air o
f ser
vice
boi
ler a
t Ind
o-G
ulf F
ertil
iser
s(A
uni
t of A
dity
a Bi
rla N
uvo
Lim
ited)
, Jag
dish
pur
Indi
aR
egis
tere
dEE
indu
stry
AMS-
II.D
.
CD
M03
6550
0E
ffici
ent u
tiliz
atio
n of
was
te h
eat a
nd n
atur
al g
as a
t the
Dah
ej c
ompl
exof
GAC
L In
dia
Cor
rect
ion
requ
est
EE in
dust
ryAM
S-II.
D.
CD
M04
4158
7In
stal
latio
n of
Add
ition
al U
rea
Tray
s in
Ure
a R
eact
ors
(11/
21- R
01)
Indi
aC
orre
ctio
n re
ques
tEE
indu
stry
AMS-
II.D
.
CD
M06
1968
5M
odifi
catio
n of
Clin
ker C
oole
r for
Ene
rgy
Effic
ienc
y Im
prov
emen
t in
Cem
ent m
anuf
actu
ring
at B
inan
i Cem
ents
Indi
aR
eque
st
revi
ewEE
indu
stry
AMS-
II.D
.
CD
M07
2870
7In
dia-
FaL-
G B
rick
and
Bloc
ks P
roje
ct N
o.1
Indi
aR
eque
st
revi
ewEE
indu
stry
AMS-
II.D
.
CD
M05
0675
7Fa
ctor
y en
ergy
-effi
cien
cy im
prov
emen
t pro
ject
in M
alay
sia
(MAP
REC
, P
RD
M, P
SC
DD
M, P
AV
CJM
, PC
M)
Mal
aysi
aR
eg. r
eque
stEE
indu
stry
AMS-
II.D
.

381
- 16
-
Exce
rpt f
rom
Ris
oe C
DM
Pip
elin
e ov
ervi
ew (c
ontd
. upd
ated
1 F
eb 2
007)
Smal
l-Sca
le p
roje
cts
Type
II. D
. (co
ntd.
)C
DM
0508
759
Fact
ory
ener
gy-e
ffici
ency
impr
ovem
ent p
roje
ct in
Mal
aysi
a (P
HA
AM
, P
CO
M (P
J), P
CO
M (S
A),
PE
DM
A, M
ED
EM
)M
alay
sia
Reg
. req
uest
EE in
dust
ryAM
S-II.
D.
CD
M04
2980
6D
eman
d si
de e
nerg
y ef
ficie
ncy
prog
ram
mes
for s
peci
fic te
chno
logi
esat
ITC
Bha
drac
hala
m p
ulp
and
pape
r mak
ing
faci
lity
Indi
aR
eg. r
eque
stEE
indu
stry
AMS-
II.D
.+AM
S-I.D
.
CD
M08
5581
4W
aste
hea
t rec
over
y fro
m P
roce
ss G
as C
ompr
esso
rs (P
GC
s),
Mum
bai h
igh
sout
h an
d us
ing
the
reco
vere
d he
at to
hea
t pro
cess
heat
ing
oil.
Indi
aR
eg. r
eque
stEE
indu
stry
AMS-
II.D
.
CD
M13
32Ya
ntai
Coa
l-Fire
d Bo
iler E
nerg
y Ef
ficie
ncy
Proj
ect
Chi
naAt
val
idat
ion
EE s
ervi
ceAM
S-II.
D.+
AMS-
II.E.
CD
M03
79En
ergy
effi
cien
cy m
easu
res
at c
emen
t pro
duct
ion
plan
tIn
dia
At v
alid
atio
nEE
indu
stry
AMS-
II.D
.C
DM
0394
Ene
rgy
Effi
cien
cy M
easu
res
at C
emen
t Pro
duct
ion
Pla
nt in
Cen
tral
Indi
aIn
dia
At v
alid
atio
nEE
indu
stry
AMS-
II.D
.
CD
M04
45E
nerg
y ef
ficie
ncy-
Use
of T
urbi
ne e
xhau
st w
aste
hea
t in
was
te h
eat
reco
very
gen
erat
or to
pro
duce
ste
am a
t Sam
tel C
olor
Ltd
in
Gha
ziab
ad, U
ttar P
rade
sh
Indi
aAt
val
idat
ion
EE in
dust
ryAM
S-II.
D.
CD
M04
46E
nerg
y ef
ficie
ncy-
Use
of e
ngin
e ex
haus
t was
te h
eat i
n w
aste
hea
t re
cove
ry s
yste
m to
pro
duce
hot
wat
er a
t Sam
cor G
lass
Lim
ited
at
Kot
a, R
ajas
than
Indi
aAt
val
idat
ion
EE in
dust
ryAM
S-II.
D.
CD
M04
47R
epla
cem
ent o
f BFW
pum
p tu
rbin
e (T
P 60
1B) b
y El
ectri
c M
otor
Indi
aAt
val
idat
ion
EE in
dust
ryAM
S-II.
D.
CD
M05
53E
nerg
y ef
ficie
ncy
mea
sure
s at
pap
er p
rodu
ctio
n pl
ant a
t AP
PM
in
Andh
ra P
rade
shIn
dia
At v
alid
atio
nEE
indu
stry
AMS-
II.D
.
CD
M05
54Lo
w G
rade
Ore
(LG
O) b
enef
icia
tion
by R
ajas
than
Sta
te M
ines
&
Min
eral
s Li
mite
dIn
dia
At v
alid
atio
nEE
indu
stry
AMS-
II.D
.
CD
M06
27Fu
el e
ffici
ency
impr
ovem
ent i
n gl
ass
mel
ting
Indi
aAt
val
idat
ion
EE in
dust
ryAM
S-II.
D.
CD
M07
04E
nerg
y ef
ficie
ncy
proj
ect –
Tat
a M
otor
s Lt
d.In
dia
At v
alid
atio
nEE
indu
stry
AMS
-II.D
.C
DM
0927
Inst
alla
tion
of P
late
Typ
e H
eat E
xcha
nger
for p
rehe
atin
g co
mbu
stio
n ai
r of p
rimar
y re
form
er a
nd re
duci
ng h
eat l
oss
to a
tmos
pher
e th
roug
h flu
e ga
ses
at In
do G
ulf F
ertil
iser
s (A
Uni
t of A
dity
a Bi
rla G
roup
), Ja
gdis
hpur
.
Indi
aAt
val
idat
ion
EE in
dust
ryAM
S-II.
D.
CD
M10
57V
ikra
m C
emen
t: E
nerg
y ef
ficie
ncy
by u
p-gr
adat
ion
of c
linke
r coo
ler i
n ce
men
t man
ufac
turin
gIn
dia
At v
alid
atio
nEE
indu
stry
AMS-
II.D
.
CD
M10
70C
onde
nsat
e R
ecov
ery
from
Rev
ampi
ng o
f Fal
ling
Film
Eva
pora
tor a
nd
Inst
alla
tion
of N
ew C
onde
nser
at B
ILT-
Sew
aIn
dia
At v
alid
atio
nEE
indu
stry
AMS-
II.D
.

382
- 17
-
Exce
rpt f
rom
Ris
oe C
DM
Pip
elin
e ov
ervi
ew (c
ontd
. upd
ated
1 F
eb 2
007)
Smal
l-Sca
le p
roje
cts
Type
II. D
. (co
ntd.
)C
DM
1072
Effi
cien
cy Im
prov
emen
t in
the
Blo
w H
eat R
ecov
ery
Sys
tem
at B
ILT-
Sew
aIn
dia
At v
alid
atio
nEE
indu
stry
AMS-
II.D
.
CD
M10
76D
eman
d si
de e
nerg
y ef
ficie
ncy
proj
ects
at R
IL-P
G.
Indi
aA
t val
idat
ion
EE in
dust
ryA
MS
-II.D
.C
DM
1089
Impr
ovem
ent i
n en
ergy
effi
cien
cy o
f ste
am g
ener
atio
n an
d po
wer
cons
umpt
ion
at R
ecro
n Sy
sthe
tics
Lim
ited,
Alla
haba
dIn
dia
At v
alid
atio
nEE
sup
ply
side
AMS-
II.B.
+AM
S-II.
D.
CD
M11
02G
rasi
m C
emen
t:Ene
rgy
effic
ienc
y by
up-
grad
ing
a cl
inke
r coo
lier i
n ce
men
t man
ufac
turin
gIn
dia
At v
alid
atio
nEE
indu
stry
AMS-
II.D
.
CD
M11
03G
HG
em
issi
on re
duct
ion
by e
nerg
y ef
ficie
ncy
impr
ovem
ent o
f clin
ker
cool
er in
cem
ent m
anuf
actu
ring
at R
ajas
hree
Cem
ent
Indi
aAt
val
idat
ion
EE in
dust
ryAM
S-II.
D.
CD
M11
38D
eman
d si
de e
nerg
y ef
ficie
ncy
proj
ect a
t IP
CL-
Vado
dara
Com
plex
.In
dia
At v
alid
atio
nEE
indu
stry
AMS
-II.D
.C
DM
1195
Ene
rgy
Effi
cien
cy Im
prov
emen
t in
Ther
mos
ettin
g pr
oces
s at
Indo
R
ama
Synt
hetic
s (In
dia)
Lim
ited,
But
ibor
i, M
ahar
asht
raIn
dia
At v
alid
atio
nEE
indu
stry
AMS-
II.D
.
CD
M11
97R
educ
tion
in S
peci
fic S
team
Con
sum
ptio
n O
f Vap
our A
bsor
ptio
n C
hille
rs a
t Ind
o R
ama
Synt
hetic
s (In
dia)
Lim
ited,
But
ibor
i, D
istt
– N
agpu
r, M
ahar
asht
ra
Indi
aAt
val
idat
ion
EE in
dust
ryAM
S-II.
D.
CD
M12
36E
nerg
y ef
ficie
ncy
by p
urge
gas
reco
very
at N
agot
hane
Man
ufac
turin
g C
ompl
ex o
f IP
CL
Indi
aAt
val
idat
ion
EE in
dust
ryAM
S-II.
D.
CD
M12
98E
nerg
y E
ffici
ency
Impr
ovem
ent t
hrou
gh re
plac
emen
t of R
ecup
erat
ive
Hea
t Exc
hang
er b
y R
egen
erat
ive
Hea
t Exc
hang
er in
the
Bla
st
Furn
ace
Sect
ion
Indi
aAt
Val
idat
ion
EE in
dust
ryAM
S-II.
D.
CD
M13
72En
ergy
effi
cien
cy m
easu
res
at F
ertil
izer
uni
t of T
ata
Che
mic
als
Ltd.
at
Hal
dia,
Wes
t Ben
gal
Indi
aAt
Val
idat
ion
EE in
dust
ryAM
S-II.
D.
CD
M13
75In
dia-
FaL-
G B
rick
and
Bloc
ks P
roje
ct N
o.2
Indi
aAt
Val
idat
ion
EE in
dust
ryAM
S-II.
D.
CD
M14
27E
nerg
y E
ffici
ency
Mea
sure
s at
Aut
omot
ive
Div
isio
n &
Far
m S
ecto
rD
ivis
ion
of M
ahin
dra
& M
ahin
dra
(M&M
) Ltd
.In
dia
At V
alid
atio
nEE
Indu
stry
AMS-
II.D
.
CD
M14
32En
ergy
Effi
cien
cy Im
prov
emen
t by
Inst
allin
g H
igh
Effic
ienc
y W
alki
ng
beam
furn
ace
at M
ahin
dra
Ugi
ne S
teel
Com
pany
Lim
ited
(MU
SC
O),
Jagd
ishn
agar
, Kho
poli,
Mah
aras
htra
Indi
aAt
Val
idat
ion
EE In
dust
ryAM
S-II.
D.
CD
M14
33In
stal
latio
n of
an
Ene
rgy
Effi
cien
t Ele
ctric
Arc
Fur
nace
at M
ahin
dra
Ugi
ne S
teel
Com
pany
Lim
ited
(MU
SCO
), Ja
gdis
hnag
ar, K
hopo
li,
Mah
aras
htra
Indi
aAt
Val
idat
ion
EE In
dust
ryAM
S-II.
D.
CD
M14
67En
ergy
effi
cien
cy im
prov
emen
t in
pow
er g
ener
atio
n at
Saj
jan
Indi
a Li
mite
d, A
nkhl
eshw
ar, G
ujar
atIn
dia
At V
alid
atio
nEE
Indu
stry
AMS-
II.D
.

383
- 18
-
Exce
rpt f
rom
Ris
oe C
DM
Pip
elin
e ov
ervi
ew (c
ontd
. upd
ated
1 F
eb 2
007)
Smal
l-Sca
le p
roje
cts
Type
II. D
. (co
ntd.
)C
DM
1478
Ther
mal
ene
rgy
effic
ienc
y im
prov
emen
t in
the
stea
m c
ycle
of s
ugar
prod
uctio
n pr
oces
sIn
dia
At V
alid
atio
nEE
Indu
stry
AMS-
II.D
.
CD
M07
50En
ergy
effi
cien
cy im
prov
emen
t pro
ject
at a
bee
r bre
wer
y in
Lao
PD
RLa
o PD
RAt
val
idat
ion
EE in
dust
ryAM
S-I.C
.+AM
S-II.
D
CD
M08
91Th
e m
odel
pro
ject
for r
enov
atio
n to
incr
ease
the
effic
ient
use
of
ener
gy in
bre
wer
yVi
etna
mAt
val
idat
ion
EE in
dust
ryAM
S-II.
D.
CD
M05
07Fa
ctor
y en
ergy
-effi
cien
cy im
prov
emen
t pro
ject
in M
alay
sia
(MTP
DM
)M
alay
sia
With
draw
nE
E in
dust
ryAM
S-II.
D.
CD
M04
8631
7E
lDor
ado
Ener
gy E
ffici
ency
Pro
ject
Mex
ico
Rej
ecte
dE
E in
dust
ryAM
S-II.
D.
CD
M04
8731
1La
zaro
Ene
rgy
Effic
ienc
y Pr
ojec
tM
exic
oR
ejec
ted
EE in
dust
ryAM
S-II.
D.
Smal
l-Sca
le p
roje
cts
Type
II. E
.ID
Ref
.Ti
tleH
ost c
ount
rySt
atus
Type
Met
hodo
logy
CD
M02
2615
9M
oldo
va b
iom
ass
heat
ing
in ru
ral c
omm
uniti
es p
roje
ct-n
o.1
Mol
dova
Reg
iste
red
EE h
ouse
hold
sAM
S-I.C
.+AM
S-II.
E.+A
MS-
III.B
.C
DM
0231
160
Mol
dova
bio
mas
s he
atin
g in
rura
l com
mun
ities
pro
ject
-no.
2M
oldo
vaR
egis
tere
dEE
hou
seho
lds
AMS-
I.C.+
AMS-
II.E.
+AM
S-III
.B.
CD
M02
2717
3M
oldo
va e
nerg
y co
nser
vatio
n an
d G
HG
em
issi
on re
duct
ion
Mol
dova
Reg
iste
red
EE s
ervi
ceAM
S-II.
E.+A
MS-
III.B
.
CD
M08
38Pã
o de
Açú
car –
Dem
and
side
ele
ctric
ity m
anag
emen
t – P
DD
1Br
azil
At v
alid
atio
nE
E Se
rvic
eAM
S-I.D
.+AM
S-II.
E.C
DM
0844
Pão
de A
çúca
r – D
eman
d si
de e
lect
ricity
man
agem
ent –
PD
D 5
Braz
ilAt
val
idat
ion
EE
Serv
ice
AMS-
I.D.+
AMS-
II.E.
CD
M08
45Pã
o de
Açú
car –
Dem
and
side
ele
ctric
ity m
anag
emen
t – P
DD
6Br
azil
At v
alid
atio
nE
E Se
rvic
eAM
S-I.D
.+AM
S-II.
E.C
DM
0847
Pão
de
Açúc
ar –
Dem
and
side
ele
ctric
ity m
anag
emen
t – P
DD
2Br
azil
At v
alid
atio
nEE
Ser
vice
AMS-
I.D.+
AMS-
II.E.
CD
M08
48P
ão d
e Aç
úcar
– D
eman
d si
de e
lect
ricity
man
agem
ent –
PD
D 7
Braz
ilAt
val
idat
ion
EE S
ervi
ceAM
S-I.D
.+AM
S-II.
E.C
DM
0849
Pão
de
Açúc
ar –
Dem
and
side
ele
ctric
ity m
anag
emen
t – P
DD
8Br
azil
At v
alid
atio
nEE
Ser
vice
AMS-
I.D.+
AMS-
II.E.
CD
M08
51Pã
o de
Açú
car –
Dem
and
side
ele
ctric
ity m
anag
emen
t – P
DD
3Br
azil
At v
alid
atio
nE
E Se
rvic
eAM
S-I.D
.+AM
S-II.
E.C
DM
0853
Pão
de
Açúc
ar –
Dem
and
side
ele
ctric
ity m
anag
emen
t – P
DD
4Br
azil
At v
alid
atio
nEE
Ser
vice
AMS-
I.D.+
AMS-
II.E.
CD
M13
32Ya
ntai
Coa
l-Fire
d Bo
iler E
nerg
y Ef
ficie
ncy
Proj
ect
Chi
naAt
val
idat
ion
EE s
ervi
ceAM
S-II.
D.+
AMS-
II.E.
Smal
l-Sca
le p
roje
cts
Type
II. F
.ID
Ref
.Ti
tleH
ost c
ount
rySt
atus
Type
Met
hodo
logy
CD
M09
51N
orth
east
Cae
té M
ills Ir
rigat
ion
Proj
ect (
NEC
MIP
)Br
azil
At v
alid
atio
nFo
ssil
fuel
sw
itch
AMS-
II.F.

384
1
Clean Development through Cogeneration
Combined Heat and Power Generation Projects in the Clean Development Mechanism
World Alliance for Decentralised Energy (WADE)
Sytze Dijkstra, Research Executive
October 2006
www.localpower.org
Paper submitted to the UNIDO/CTI/UK Trade and Investment Seminar on Energy Efficiency
Projects in CDM and JI
Vienna, 19 – 22 March 2007
Clean development though cogeneration - Ms. Sytze Dijkstra – WADE

385
2
About WADE
WADE is a non-profit research and advocacy organization that was established in June 20
to accelerate the worldwide deployment of decentralized energy (DE) systems. WADE is now
backed by national cogeneration and DE organizations, DE companies and providers, as
as a range of national governments. In total, WADE’s direct and indirect membership s
includes over 200 organizations around the world.
WADE believes that the wider use of DE is a key solution to bringing about the cost-effective
modernization and development of the world’s electricity systems. WADE’s goal is to i
the overall proportion of DE in the world’s electricity generation mix. To work towards its
WADE undertakes a growing range of research and other actions on behalf of its suppor
and members:
♦ WADE carries out promotional activities and research to document all aspects
DE, including policy, regulatory, economic and environmental aspects in key
countries and regions.
♦ WADE works to extend the international network of national DE and cogenerati
organizations. Current WADE network members represent Australia, Brazil,
Canada, China, Europe, India and the US. We are continually working to extend
this network.
♦ WADE provides a forum for DE companies and organizations to convene and
communicate.
♦ WADE jointly produces an industry journal: “Cogeneration and On-Site Power”
(published by Pennwell in association with WADE).
Acknowledgements
Alexander Lüchinger, Managing Partner; and Brett Orlando Director Carbon Finance, Facto
Consulting+Management
Dave Schnaars, Manager Environmental Strategies, Solar Turbines
Nathaniel Steeghs, Project Origination, EcoSecurities UK

386
3
Executive Summary
Combined Heat and Power (CHP) applications provide cost-effective opportunities for
reducing greenhouse gas (GHG) emissions in developing countries. This makes them high
suitable for Clean Development Mechanism (CDM) projects.
TRENDS IN REGISTRATION OF CHP PROJECTS IN THE CDM
Cumulative emissions reductions from registered CHP projects
0
500
1000
1500
2000
2500
3000
3500
4000
Sep-05 Oct-05 Nov-05 Dec-05 Jan-06 Feb-06 Mar-06 Apr-06May-06 Jun-06 Jul-06Aug-06 Sep-06
Months
Emissions reduction (kt/yr)
Registered projects
On 30 September 2006, 66 out of 326 registered CDM projects involved cogeneration (20
Emission reductions from these reached over 3.5 Mt/yr, rising steadily. The average size of
cogeneration projects is 54,000 t/yr. Most cogeneration CDM projects are in food-
manufacturing and large industry in India and Brazil, but more industrial sectors and
are becoming involved.
CDM potential in BrazilBrazil
In Brazil the CDM has been
supported strongly by the
government, and 26 cogeneration
projects were registered by 30
September 2006, mostly bagasse-
CHP. Many opportunities for projects
in the sugar sector still exist, but
potentials for CHP applications in oil-
refineries and industry are also
considerable.
Brazil - CHP and CDM Potentials
0
500
1000
1500
2000
2500
3000
3500
4000
4500
Bagasse
CHP
Oil RefiningChemicals Steel Pulp and
P aper
Rice mills
Sector
CHP Potential (MWe)
0
1
2
3
4
5
6
7
CDM Potential Mt/yr)
CHP Potential
CDM Potential

387
4
CDM potential in ChinaChina
China has been slow in
implementing the CDM, and only one
CHP project was registered on 30
September 2006. Industry and power
generation are the main sectors for
CHP in the CDM, with further
opportunities in biomass-fired CHP.
However, the strong centralised set-
up and lack of clarity about China’s
CDM procedures are barriers to
achieving this potential.
China - CHP and CDM Potentials
0
500
1000
1500
2000
2500
3000
3500
4000
4500
5000
Power Oil
Refining
Steel Pulp and
Paper
Cement Food
sector
Landfill
gas
Coal-bed
methaneSector
CHP Potential (MWe)
0
2
4
6
8
10
12
14
16
18
CDM Potential (Mt/yr)CHP Potential
CDM Potential
CDM potential in IndiaIndia
India represents over one-third of
CHP projects in the CDM. Initially
most applications were bagasse-
CHP, but industrial waste-heat
cogeneration is becoming more
significant. Sugar manufacturing is
likely to remain important for CDM
cogeneration projects, but in the long
term the larger potential is in major
industries, including steel, fertilisers
and cement.
India - CHP and CDM Potentials
0
500
1000
1500
2000
2500
3000
3500
Sugar Iron &
Steel
B everagesRice millsTextiles P ulp &
Paper
Cement Fertiliser
Sector
CHP Potential (MWe)
0
1
2
3
4
5
6
7
8
CDM Potential (Mt/yr)CHP Potential
CDM Potential
Present Status
The present status of CHP projects in the CDM show their suitability, but the CDM is
early stage, so several opportunities have not been realised yet, and certain unresolved
issues remain. Neglected opportunities for CHP projects include applications in build
emission reductions from avoided network losses; and cogeneration replacing combined
cycle power plants. The main outstanding issues are the creation of additional emission quota
through the CDM; the difficulty of proving additionality of the CDM project; uncertai
post-Kyoto arrangements; and risks associated with carbon market developments.
Potential
The overall potential for the CDM is large, though, and cogeneration can play a major part
its future development. Consequently there has been much interest in participating in
CDM from project developers, equipment manufacturers, governments, investors and
brokers. However, many of these players do not have the time or expertise to analyse th
rules and procedures of the CDM, and assess how they can benefit from the CDM.
This report aims to provide a practical guide for developing CHP projects in the CDM
explains the specific procedures considerations for cogeneration projects, describes the
current status, and assesses their future potential. Country profiles for Brazil, Chi
give country-specific information and projections for these important CDM markets.

388
5
Clean Development through Cogeneration
Combined Heat and Power Projects in the Clean Development
Mechanism
About WADE .............................................................................2
Executive Summary.........................................................................3
Combined Heat and Power Projects in the Clean Development Mechanism..................................5
1. Introduction............................................................................6
2. The Clean Development Mechanism..........................................................7
2.1 Introduction..........................................................................7
2.2 General Principles of the Clean Development Mechanism...........................................7
2.3 Organisational Structure of the Clean Development Mechanism.......................................9
2.4 The Carbon Market......................................................................11
2.5 Economics of the Clean Development Mechanism................................................12
3. CDM Project Cycle for Combined Heat and Power Projects.........................................17
3.1 Introduction..........................................................................17
3.2The CDM project cycle...................................................................18
3.3 Special Considerations for CHP projects......................................................23
4. Status and Prospects for Combined Heat and Power Projects in the Clean Development
Mechanism...............................................................................31
4.1 Introduction..........................................................................31
4.2 Overall trends of CHP projects in the CDM....................................................32
4.3 Country Profile – Brazil...................................................................35
4.4 Country Profile – China...................................................................40
4.5 Country Profile – India...................................................................46
4.6 Neglected CHP project opportunities.........................................................51
4.7 Outstanding issues for the CDM............................................................52
5. Conclusion.............................................................................55
Glossary.................................................................................56
Acknowledgements.........................................................................2
CDM Information, Links and Sources...........................................................58

389
6
1. IntroductionCogeneration is a cost-effective way of reducing CO2 emissions from power generation. The
combined use of the heat and power outputs of the generation process increases its
efficiency, and thereby reduces the fuel input and emission output. As a decentralise
(DE) technology, cogeneration also reduces transmission and distribution (T&D) losses.
Cogeneration is a flexible technology, which can use various fuels, and be adapted to
circumstances. The possibility of using biomass fuels or agricultural residues makes
Combined Heat and Power (CHP) particularly effective in reducing CO2 emissions.
Cogeneration technologies are well established, and therefore reliable and competitiv
most markets. Cogeneration is therefore a prime candidate technology for carbon emiss
reduction projects.
The Clean Development Mechanism (CDM) is part of the Kyoto Protocol for reducing glob
greenhouse gas (GHG) emissions to mitigate anthropogenic Climate Change. Opportunitie
for emission reduction are generally large in developing countries, so that these can be met at
lower costs than in developed countries. The CDM recognises this, and provides an
opportunity for developed countries (Annex I) to meet part of their GHG emission targ
through projects in developing countries (non-Annex I). This benefits Annex I countries by
reducing the cost required to meet their emission target, and benefits non-Annex I countries
by facilitating investment and technology transfer and sustainable development. Overa
approach aims to ensure that GHG emission targets are met quickly and cost-effectively.
CHP technologies are well suited for CDM projects, because they are generally economi
attractive and technologically mature and reliable, so that they contribute directly
aim of reducing GHG emissions cost-effectively. Furthermore, they are flexible and can be
adapted to local circumstances. In developing countries cogeneration can easily be in
in many industries, including food-processing, taking advantage of the biomass residues of
the production process. This has the dual benefits of lowering fuel costs and solving
issue. Cogeneration projects address both energy supply-side and demand-side, and
therefore have a wider impact than most CDM technologies. Furthermore, they provide a
long-term solution, as the resulting CO2 savings are reliable and predictable over the project’s
lifetime, unlike some other project types.
This report discusses the implementation of CHP projects within the CDM. It aims to p
practical guide for CDM project participants, outlining the CDM’s organisational struct
(Chapter 2), and describes the project cycle for cogeneration projects (Chapter 3). L
outline the present status of CHP in the CDM and country-specific information for Brazil,
China and India (Chapter 4).

390
7
2. The Clean Development Mechanism
2.1 Introduction
The Clean Development Mechanism (CDM) is part of the Kyoto Protocol, adopted in 1997
the 3rd Conference of the Parties (COP) to the United Nations Framework Convention on
Climate Change (UNFCCC). The CDM itself was decided on at the 7th COP in Marrakech in
2001, as outlined in the Marrakech Accords. The Kyoto Protocol aims to stabilise GHG
concentrations in the atmosphere to a level that would prevent dangerous anthropogenic
interference with the climate system. The target for the first commitment period (200-2012) is
to reduce global GHG emissions to 5% below 1990 levels. Reduction targets differ betw
parties to the conference, reflecting their ‘common but differentiated responsibilities’, so that
Annex I countries will reduce their emissions, while no such commitments exist yet fo-
Annex I countries.
The CDM, together with Joint Implementation and International Emissions Trading, is oof
the three market mechanisms that enables Annex I countries to meet their targets in t
cost-effective way1. The CDM procedures were approved and adopted during the 11th COP in
Montreal in 2005. Through the CDM, Annex I parties help implementing GHG emission
reduction projects in non-Annex I countries, for which they will obtain emission reduction
credits. These credits, Certified Emissions Reduction (CER) can then be used to contr
meeting the Annex I country’s target. Annex II countries also benefit through the investment
and technology transfer that are part of the project implementation.
This chapter will give an overview of the working of the CDM. First, it describes the
principles, the project types included, and how emission reductions are measured and verified
(Section 2.2). Then it will explain the organisational structure of the CDM (Section
discuss the carbon market (Section 2.4) economics of the CDM (Section 2.5).
2.2 General Principles of the Clean Development Mechanism
PRINCIPLES
FIGURE 1GENERAL CONCEPT OF T HE CDM
INSTITUTE FOR GLOBAL ENVIRONMENTAL STRAT EGIES, CDM IN CHARTS, 2006
1 The Kyoto Mechanisms are Emission Trading, the Clean Development Mechanism and Joint Implementation.

391
8
The Clean Development Mechanism (CDM) allows Annex I countries of the Kyoto Protocol
meet part of their GHG emission reduction target through projects in non-Annex I countries.
By funding and implementing projects, the Annex I country reduces GHG emissions in th
non-Annex I country. The emissions saving, expressed in Certified Emission Reduction
credits, will be added to the total emission cap of the Annex I country, helping it to meets
target (figure 1). In effect, this increases the total Annex I emission allowance, be-
Annex I countries do not have emissions reduction targets.
The CDM is based on three global principles:
1. Participation of the project partners is voluntary.
2. The project results in real, measurable and long term benefits related to th
mitigation of climate change.
3. The reduction of emissions through the CDM project must be additional to
reductions that would occur without the CDM project (Additionality principle).
The implication of principle 2 is that the emission reductions that can reasonable be
to the project activity must be directly quantifiable, and long-term. The Additionality principle
implies that the project would not be implemented in absence of CDM revenue, because
economic or other barriers, and contributes to a net reduction in emissions from a co
baseline scenario, in which the project would not happen.
PROJECT TYPES
TABLE 1TYPES OF CDM PROJECT S
Type I. Renewable Energy Projects
♦ I-A. Electricity generation by the user♦ I-B. Mechanical energy for the user♦ I-C. Thermal energy for the user♦ I-D. Renewable electricity generation for a gridType II. Energy Efficiency Improvement Projects
♦ Supply side, Demand side and Fuel switchingType III. Other Projects
♦ Methane recovery, Transport, Agriculture and Land use
Any project reducing GHG emissions is eligible for the CDM, but they are classified i
categories (table 1). Cogeneration projects are normally classified as Type I, category A
D, depending on the main energy output of the project. However, in specific cases
cogeneration can be considered as part of Type II or Type III projects too. For examp
industrial waste-heat recovery and power generation project (bottom-cycle CHP) could
include replacing boilers by CHP generators, and therefore be Type II. Cogeneration p
can be combined with fuel switching, for instance from oil to bagasse in a sugar mill. As for
Type III projects, methane recovered from a landfill can be used as fuel for CHP gene
SMALL-SCALE CDM PROJECTS (SCC)
Small-scale CDM projects are a special category, for which the registration, validatio
verification procedures have been simplified to reduce the procedural cost relative to the
project costs. For instance, a number of SCCs can be bundled in a single application
SCCs have special simplified baseline and monitoring methodologies. A project qualifi

392
9
SCC project if the energy output or energy efficiency gain is smaller than 15MW. For
example, a microturbine application using biogas from agricultural waste, with an ins
capacity of 2 MWe would qualify as a SCC.
2.3 Organisational Structure of the Clean Development Mechanism
CDM PROJECT PARTICIPANTS
Various participants are involved in the development of CDM projects (table 2).
TABLE 2PARTIES INVOLVED IN THE CDM
Global National Project
♦ Conference of the Parties
(COP
♦ CDM Executive Board (EB)
♦ Designated National
Authority (DNA)
♦ Annex I Party
♦ Non-Annex I Party
♦ Investors (CER buyers)
Designated Operational Entity (DOE)
The parties involved in the CDM have different motives for participating in CDM proje
♦ Annex I countries: cost-effective way of meeting their emission reduction
commitment
♦ Non-Annex I countries: local sustainable development and climate change
mitigation.
♦ Host-country participants: CER revenues
♦ Annex I participants: business opportunities and a corporate social responsi
strategy.
♦ Investors: investment opportunities in sustainable energy projects
♦ Institutional investors: investment opportunities, portfolio diversification
socially responsible investments2.
♦ Equipment manufacturers: indirect benefits from news market for renewable
energy and energy efficiency equipment, application of emerging technologies
and opportunities for developing special CDM packages.
CDM EXECUTIVE BOARD (CDM-EB)
At a global level, the COP has the overall authority over the CDM, but the CDM Execut
Board (EB) carries out its actual operation. The EB is responsible for the accreditat
Designated Operational Entities (DOE) and methodologies, keeps a project registry,
publishes technical reports, and issues CERs. These tasks are delegated to two Panels and
two Working Groups, which set procedures and offer guidance in their field of experti
Accreditation Panel, responsible for accrediting methodologies, is assisted by the
Accreditation Team. A separate Registration Team of the EB processes the applications for
2 Getulio Vargas, The Clean Development Mechanism – A Brazilian Implementation Guide, 2002.
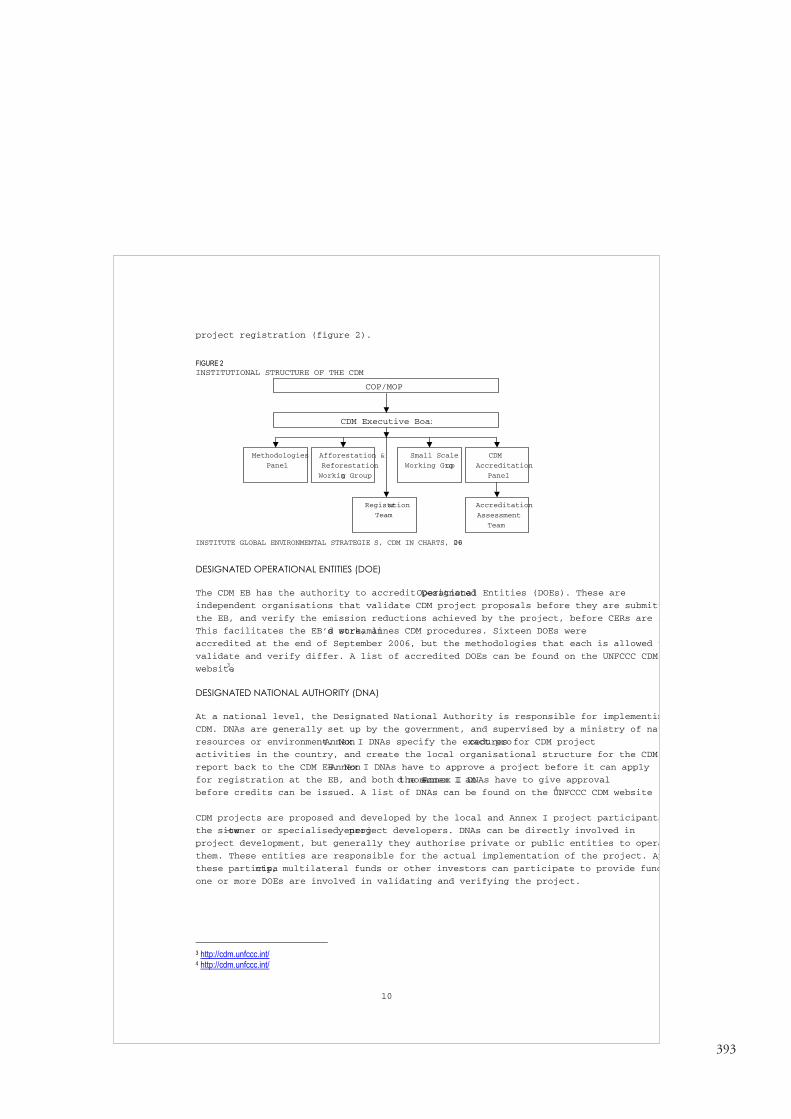
393
10
project registration (figure 2).
FIGURE 2INSTITUTIONAL STRUCTURE OF THE CDM
INSTITUTE GLOBAL ENVIRONMENTAL STRATEGIE S, CDM IN CHARTS, 2006
DESIGNATED OPERATIONAL ENTITIES (DOE)
The CDM EB has the authority to accredit Designated Operational Entities (DOEs). These are
independent organisations that validate CDM project proposals before they are submitt
the EB, and verify the emission reductions achieved by the project, before CERs are i
This facilitates the EB’s work, and streamlines CDM procedures. Sixteen DOEs were
accredited at the end of September 2006, but the methodologies that each is allowed t
validate and verify differ. A list of accredited DOEs can be found on the UNFCCC CDM
website3.
DESIGNATED NATIONAL AUTHORITY (DNA)
At a national level, the Designated National Authority is responsible for implementin
CDM. DNAs are generally set up by the government, and supervised by a ministry of nat
resources or environment. Non-Annex I DNAs specify the exact procedures for CDM project
activities in the country, and create the local organisational structure for the CDM
report back to the CDM EB. Non-Annex I DNAs have to approve a project before it can apply
for registration at the EB, and both the Annex I and non-Annex I DNAs have to give approval
before credits can be issued. A list of DNAs can be found on the UNFCCC CDM website4.
CDM projects are proposed and developed by the local and Annex I project participants
the site-owner or specialised energy project developers. DNAs can be directly involved in
project development, but generally they authorise private or public entities to opera
them. These entities are responsible for the actual implementation of the project. Ap
these participants, multilateral funds or other investors can participate to provide fund
one or more DOEs are involved in validating and verifying the project.
3 http://cdm.unfccc.int/4 http://cdm.unfccc.int/
CDM Executive Boar
COP/MOP
Methodologies
Panel
Afforestation &
Reforestation
Working Group
Accreditation
Assessment
Team
Small Scale
Working Group
Registration
Team
CDM
Accreditation
Panel

394
11
2.4 The Carbon Market
WHAT IS THE CARBON MARKET?
The carbon market, which was established as part of the Kyoto Protocol, is the business of
buying and selling greenhouse gas emissions. The main trading unit is one metric tonn
carbon dioxide equivalent (t CO2e). Two commodities are traded in this market:
♦ Emissions allowances: allowances to emit GHG allocated to companies by
national governments of Annex I countries. Companies that emit less than the
allowances can sell these to companies emitting more than their allocation,
trading companies. In the European Union Emission Trading Scheme (EU ETS)
the allowances are called EU Allowances (EUAs).
♦ Project-based emissions reductions: emission reduction generated by project
activities, which are certified by an independent auditor. Certificates are
Certified Emission Reductions (CERs) or Emission Reduction Units (ERUs),
depending on the origin. CDM projects generated CERs.
The carbon market covers the three Kyoto Mechanisms: the CDM, for emission reduction
projects in non-Annex I countries; Joint Implementation, for emission reduction projects in
Annex I countries for which the emission reductions are credited to another country t
host country; and International Emission Trading, for direct trading of emission allo
between Annex I countries.
SIZE OF THE CARBON MARKET
The carbon market is growing at an extraordinary pace. In 2005, about 800 Mt CO2 eq. was
transacted with a value of 9.4 billion (INR 527 billion) according to Point Carbon (Carbon
2006). This is an eight-fold increase in volume and 25 times more financial value than the
previous year. The CDM represented 400 Mt CO2 eq., with a total value of 1.9 billion.
This rapid growth can be explained by accelerating government efforts to implement th
Kyoto Protocol and the start of the European Union Emissions Trading Scheme (EU ETS) in
particular. The EU ETS limits the emissions of 10,000 large-scale emitters in the 25 EU
Member States to 2.2 billion t CO2 eq., allowing reduce emissions internally, or trade
allowances with other emitters to meet their quota. Emitters may also purchase CERs / ERUs
from CDM / JI under certain conditions.
Several European financial institutions have set up procurement vehicles designed to
purchase CERs / ERUs directly from project developers and sell them to emitters under the
EU ETS. Similar vehicles have been set up in Japan. In addition to private sector funds,
publicly funded government-led procurement programmes have been set up throughout
Europe and in Japan to purchase CERs from project developers in order to support nati
level compliance efforts under the Protocol. Over 3 billion in total has been raised in private
and public funds in Europe and Japan to purchase CERs at the time of writing.
PRICES FOR CERS
Point Carbon, a news provider for the carbon market, estimated that the volume weighted
average price for the 400 million CERs transacted in 2005 was 7 / t CO2e. This is a marked

395
12
increase from 2004 and 2003, when CERs traded for around 4-5 / t CO2e, as shown in
Figure 3, and is driven by increased demand from Europe and Japan.
FIGURE 3: HISTORICAL CER PRICES
POINT CARBON, 2006.
The range of CER prices reflects differences in the delivery. CERs that are available
immediate delivery are priced in the range of 12- 15, whereas for future delivery are
discounted about 10-12. There are also price differences between countries. Generally,
sellers in China and other countries are willing to accept lower prices than those in
2.5 Economics of the Clean Development Mechanism
GENERAL ECONOMICS OF CDM PROJECTS
In many respects the economics of CDM projects are the same as that of other energy
projects. Project planning, implementation and operation costs are similar, as are no
project profits. However, CDM projects incur a range of additional costs associated w the
documentation, application, registration and transaction procedures of the CDM (figur
CDM projects also differ from ordinary projects because of the additionality requirem
which states that the project would not be economically attractive in absence of the CDM. The
value added to the project by the CDM (i.e. the CER value) aims to bridge this gap, b
additional risk involved still poses barriers for obtaining funding for CDM projects
CDM RELATED COSTS
The CDM procedures add to the overall project costs in several ways. At the preparation
phase there are the costs for preparing a Project Design Document (PDD) and other
documentation, requiring research and administrative work. Validation, verification a
certification by a DOE entail certain costs, and the CDM EB also requires a registration fee f
CDM projects. Furthermore, the purchase agreement for the CERs needs to be arranged,
with associated legal and contractual costs. During project operation the monitoring
requirement of the CDM adds to operational costs. The broker for the sale of CERs general
also incurs a success fee of 5-10% of the total value. Finally, the CDM EB, and possibly the
host DNA, takes a share of the proceeds of CDM projects. Table 3 summarises these cos
and their estimated values. Generally these costs constitute around 12% of total proje

396
13
FIGURE 4 :COSTS AND OUTPUTS OF A CDM PROJECT
WADE, 2006
for small projects, and 3% for large projects5. Project participants normally incur these costs,
but the distribution of the costs over the various partners depends on the arrangement
between them.
TABLE 3:COSTS RELATED TO THE CDM REQUIREMENTS
CDM Project Cycle Carbon Transaction Consultant’s Estimate of Costs (US$)
Up-Front Costs:
1. Feasibility Assessment 5,000 – 20,000
2. Preparation of the PDD 25,000 – 40,000
3. Registration 10,000
4. Validation 10,000 – 15,000
5. Legal Work 20,000 – 25,000
Total Up-Front Costs 70,000 – 110,000
Operational Phase Costs
1. Sale of CERs Success fee of 5 – 10% of CER value
2. Risk Mitigation 1 – 3% of CER value annually
3. Monitoring and Verification 3,000 – 15,000 per year
ECOSECURITIES, 2003; QUOTED IN UNEP ENERGY AND ENVIRONMENT G ROUP, THE CDM – A USER’S GUIDE, 2003.
FINANCING STRUCTURES FOR CDM PROJECTS
Different transaction structures for the sale of CERs from CDM projects are possible
depending on the type of project and project participants. The relationship between t
seller and CER purchaser is vital in this. CER purchasers are generally large multinationals
with extensive experience in project financing, while CER sellers are often small loc
industries or community groups, with little financial expertise. It is therefore esse
a reliable and fair legal agreement between the two. Figure 5 outlines popular financing
mechanisms, using some price examples.
5 UNEP Energy and Environment Group, The CDM – A User’s Guide, 2003
Normal Project Costs
- Planning costs
- Capital costs
- Operation costs
CDM Related Costs
- Project design costs
- CDM procedural costs
- CER transaction costs
Normal
Project
Profits
CERs
Eligible CDM
Project

397
14
FIGURE 5:POSSIBLE TRANSACTION STRUCTURES FOR CDM PROJECT INCLUDE
♦ Upfront payment for future stream of CERs
Upfront payment is attractive for small developers, generally lacking funds to carry the investment. This clearly establishes additionality, directly removing a barrier to the project. Purchasers often require a share oupfront payment to mitigate the risks.
♦ Forward contract for delivery of CERs at
fixed prices
In this common structure the seller agrees to deliver a fixed number of CERs at the end of the contract, wpurchaser will buy on delivery at an agreed price. It reduces risks for both parties, but is complicated period is not the same as the CDM crediting period.
♦ Forward contract for delivery of CERs at
floating prices
This structure is similar to the previous, but the price paid on delivery of the CERs is based on a markethan advance agreement. This is attractive for sellers who expect carbon prices to rise, but most buyers prefer f-price contracts.
♦ Option payment for future delivery of CERs
For maximal flexibility buyers may prefer to buy an option on CERs purchases in the future. This requires n up-front payment for the option, and a purchase of CERs at a fixed price if the option is taken. Sellers may be lesell their CERs, though, increasing risks.
♦ Future spot market trades
Sellers may choose to sell their CERs on the open market in a one-off transaction without previous commitments. This gives both buyers and sellers much flexibility, but sellers risk not being able to find purchasers f
UNEP ENERGY AND ENVI RONMENT GROUP, THE C DM – A USER’S GUIDE, 2003.
CDM PROJECT RISKS
Investors will always evaluate a project in terms of its economic viability and risks
projects this is the viability and risks of the project itself, but for CDM projects
assessment must account for the CER value and associated risks too. CDM-related risks are:
♦ Registration risk
♦ Performance risk
♦ Counter-party risk
♦ Market risk
Registration Risk
Registration risk refers to the likelihood that the project will not be validated by
registered by the CDM EB. There can be several reasons for this to happen:
♦ Non-approval of a new baseline methodology

398
15
♦ Unsuccessful validation of methodology of calculating emission reductions
♦ Non-approval by the host country
♦ Request for review at registration by CDM-EB
♦ Request for review at CER issuance by CDM-EB
These risks are directly related to the CDM project cycle, and will therefore be high
when this is discussed in detail below.
Performance Risk
In addition to registration risk, CDM projects pose risks similar to those faced by conventional
projects, representing technological and financial uncertainties. All of these risks will in turn
influence whether the project will produce the volume of emissions reductions that ar
estimated in the PDD. Typical risks include:
♦ Delays in Commissioning: Will the project start as planned?
♦ Unreliability of Fuel Resource Supply: Will sufficient fuel be available at
price for the project throughout its lifetime?
♦ Breakdown in Technology: Will the technology remain reliable throughout the
project lifetime?
♦ Unreliable Financial Flows: Will the project face problems through unreliabl
cash-flows?
For cogeneration projects technological risks are smaller than for other project type
is a mature technology. CHP projects using biomass residues generally also have low fuel-
supply risks.
Counter-party Risk
The CERs from projects are generally transacted through forward contracts in which th
Buyer agrees to pay the Seller for delivery of a specific volume of CERs on a specifi at
a price negotiated at the time of initial contract. Because contracts are private agr
between two parties there is always a risk that a party may default on its side of th
agreement. Some of the issues relating to the likelihood of default are:
♦ Insolvency: Will the project proponent remain financially solvent for the du
of the contract?
♦ Fraud / Wilful misconduct: Will the Buyer and the Seller follow through on t
contract?
♦ Political and Regulatory Instability: W ill changes in the political situation in the
host-country affect the CDM project performance?
For CDM projects the risk of wilful misconduct can be higher than for other projects
of the potential of dissatisfaction with the price negotiated in the forward contract sell-
side the project developer commits to deliver the CERs at a pre-negotiated price but if market
changes, and CER price goes up significantly in relation to the price in the contract
has a strong incentive to default on the contract at the time of delivery and transact in the
open market. The same is true from the Buyer’s perspective in the event that CER pric
below the price negotiated in the contract.

399
16
Political risk of the host-country is similar to non-CDM projects, but it is further complicated by
the issue of legal status and rights of ownership of the CERs.As a general rule the CERs
arise from activities within a project, it is assumed that they belong to the owner o
in the absence of an agreement to the contrary. The owner of the project therefore has the
right to the CERs and the right to transfer them as an exercise of the right of owner
However, arrangements differ between host countries.
From the buying countries’ perspective there is a risk that CERs will not be fully convertible,
with other compliance units. This issue is relevant within the EU ETS which allows re
emitters to purchase CERs and use them for compliance only under certain conditions.
EU has stipulated, for instance, that hydro-electric projects above 20MW must meet certain
environmental and social criteria before the CERs from such projects can be used for
compliance purposes.
Even more importantly, some Member Statues have proposed placing an upper limit on th
amount of CERs that can be used by regulated emitters for compliance in the EU ETS. If
limits were put in place, the attractiveness of CERs would be reduced and a Buyer may be
tempted to default on its contract or renegotiate a lower price with the Seller since are
no longer equivalent with EUAs.
Market Risk
In addition to the uncertainty in financial flows faced by conventional project devel
projects face an additional risk associated with the income they will receive from th
CERs, based on carbon market developments.
CER prices are determined by the supply and demand in the market for emissions reduct
Since market conditions change, prices fluctuate and as a result project developers a
certain of the additional income they will earn from CER sales. This can endanger the viability
of CDM projects, if they rely heavily on the CER revenue.

400
17
3. CDM Project Cycle for Combined Heat and Power Projects
3.1 Introduction
CHP technologies can deliver GHG reductions from energy generation, and are therefore
eligible for the CDM. Cogeneration projects are attractive, because in many developin
countries their potential is large. However, the procedures and requirements for plan
developing and implementing cogeneration projects in the CDM can be complicated and
cumbersome, particularly for non-experts. It is therefore important that the procedures are
clear and that information about these is easily available for project developers.
The CDM project cycle is similar for all project types, and much information is available on the
standard procedures, both from the UNFCCC and from research organisations. Every proj
type and technology has its own particularities, though. It is therefore important to
these in detail, and provide technology specific information for project developers. In
particularly, applicable baseline methodologies, accredited DOEs and monitoring
requirements for specific topic types are invaluable. This chapter discusses the issu
relevant to cogeneration systems.
This chapter will first describe the general CDM project cycle (Section 3.2), and the
specific issues and questions for developing CHP projects and drafting a PDD, includi
baselines and additionality assessment (Section 3.3).

401
18
3.2The CDM project cycle
Figure 6 outlines the CDM project cycle, showing the seven stages, and the participan
involved and documents produced at each stage.
FIGURE 6The CDM project Cycle
WADE, 2006; BASED ON IGES, CDM IN CHARTS, 2006; AND DTI, A CLIMATE CHANGE PROJECTS OFF ICE GUIDE, 2004
1. Screening and Planning a CDM Project
Developers interested in registering their project for the CDM must first check that
the criteria of the CDM. The additionality of the GHG emissions savings over the baseline is
especially important for a project to be eligible.
2. Preparing the Project Design Document (PDD)
The PDD is the standardised application format for CDM projects, available from the C
EB. The PDD describes the project activity, the baseline methodology and additionality of the
project, the monitoring methodology, and the project’s contribution to sustainable
development. The PDD is the central part of a CDM registration application, and will
Party
1. Screening and
Planning CDM Project
Project Sta
PP
Output
7. Issuance of CERs CDM -EB CERs
2. Preparing the Project
Design Document (PDD)
PP Project Design
Document
3. National Approval of
Involved Parties
DNA
PP
Letter of Approval
4. Validation and
Registration
DOE 1 Validation Re
CDM -EB
5. CDM Project Activity
and Monitoring
PP Monitoring Report
6. Verification and
Certification
DOE 2 Verification
Certification Reports
Measurable emissi
savings & additionality
Baseline & monitoring
methodologies
Host-country approval
Validation of pro
methodologies
Monitor emissions
from the project
Verify emissi
reductions

402
19
be explained in more detail.
A CDM Project Design Document has a standard format, and consists of 7 sections (tabl
It is important to follow the proscribed structure in order to apply for CDM registra
successfully. The CDM Project Design Document form outlines the structure, and is available
from the UNFCCC website6.
TABLE 4:ELEMENTS OF A CDM PR OJECT DESIGN DOCUMEN T
A. Description of the Project Activity
B. Application of the Baseline Methodology
C. Crediting Period
D. Application of the Monitoring Methodology and Plan
E. Estimation of the GHG Emissions by Sources
F. Environmental Impacts
G. Stakeholder Comments
UNFCCC CDM, PROJECT DESIGN DOCUMENT FORM
A. Description of the project activity
The Project Design Document starts with a description of the project, covering its location, its
aims, the local circumstances, the technology used and the type of project activity.
B. Baselines and additionality
The baseline methodology explains how
the project activity will be compared with
baseline scenarios “that reasonably
represent the anthropogenic emissions by
sources of greenhouse gases that would
occur in the absence of the proposed
project activity”7. The baseline
methodology describes how to establish
this baseline, against which the GHG
emission savings of the CDM project can
be measured (figure 7). This is the
foundation of establishing the additionality
of the CDM project, and is therefore
essential for project approval.
The baseline methodology should be project specific, cover all significant emissions
project boundary that are in control of the project participants and can reasonable b
attributed to the project. These should be adjusted for leakage – anthropogenic emissions of
GHG outside the project boundary that can be reasonable attributed to the CDM project
activity. The baseline should reflect local standards and policies, to give a reasona
business-as-usual case. The methodology and data used should be transparent, and
specified in the PDD.
The CDM EB has approved standard baseline methodologies for various types of projects
These can be used directly and applied to comparable projects. Alternatively, a proje
proponent can propose a new methodology, which needs to be approved by the CDM EB.
Baseline methodologies generally take one of three approaches:
6 http://cdm.unfccc.int/Reference/Documents/cdmpdd/English/CDM_PDD.pdf7 UNFCCC, CDM Modalities and Procedures, paragraph 44.
FIGURE 7:BASELINE EMISSIONS AND ADDITIONALITY
INSTITUTE FOR GLOBAL ENVIRONMENTAL STRATEGIES, CDM IN CHARTS, 2006
Additional

403
20
♦ Using actual or historical GHG emissions (i.e. extrapolation)
♦ Using the emissions data of a technology that represents an economically
attractive course of action (e.g. Cost Benefit Analysis)
♦ Using the emissions data from similar projects undertaken in the previous 5
years, in similar social, economic, environmental and economic circumstances
A number of baseline methodologies have been proposed for cogeneration projects, so
generally it should be possible to find a methodology applicable to a new CHP project
Consolidated methodologies are general versions of project-specific methodologies, so they
are easy to replicate. Approved methodologies are project-specific, but this can be an
advantage if used for projects with similar circumstances. Each baseline methodology
outlines the criteria for its application. Table 5 outlines baseline methodologies us
cogeneration projects. Most cogeneration projects to date have use methodology AM0015,
which has now been replaced by ACM0006.
TABLE 5:CDM METHODOLOGIES FO R COGENERATION PROJE CTS
Methodology Name Applicability to CHP projects
Emission Reduction Comments
Consolidated Methodology
ACM0001 Consolidated baseline methodology for landfill gas project activities
Landfill gas capture CHP projects
Methane capture and grid-electricity displacement
Not used for cogeneration projects yet
ACM0004 Consolidated baseline methodology for waste gas and/or heat and/or pressure for power generation
Industrial waste heat recovery for heat and power generation
Displacement of on-site generated electricity or grid electricity
ACM0006 Consolidated baseline methodology for grid-connected electricity generation from biomass residues
Grid-connected biomass CHP projects
Displacement of grid electricity
Replaces AM0004 and AM0015
ACM0008 Consolidated baseline methodology for coal bed methane and coal mine methane capture and use for power (electrical or motive) and heat and/or destruction by flaring
CHP projects using coal-bed methane
Methane capture and grid electricity displacement
Not used for cogeneration projects yet
Specific Methodologies
AM0007 Analysis of the least-cost fuel option for seasonally-operating biomass cogeneration plants
Refurbishment and fuel-switching for biomass CHP projects
Technological improvement and/or fuel-switching
Refurbishment only
AM0014 Natural gas-based package cogeneration
Non grid-connected natural-gas fired CHP projects
CHP replacing separate heat and power generation
Cogeneration system must be owned by third party
AM0024 Baseline Methodology for GHG reductions through waste heat recovery and utilisation for power generation at cement plants
Waste heat recoveryfor heat and power generation in cement plants
Displacement of grid electricity
UNFCCC, APPROVED BAS ELINE AND MONITORING METHODOLOGIES, 25 JULY 2006

404
21
The additionality of CDM projects is
established in comparison with the
baseline scenarios. Firstly, the PDD
should show that the project activity is
not one of the baseline options. This is
the case if the project is not the most
economically attractive option, it is not
common practice, it is not economically
viable without CDM registration, or faces
other barriers. Secondly, additionality
requires that the estimated GHG
emissions of the project activity are
lower than any of the baseline cases.
The UNFCCC has developed the ‘Tool
for Demonstrating Additionality’, which is
available on the UNFCCC CDM
website8. Figure 8 illustrates the steps
outlined by this tool.
C. Crediting period
The crediting period for a CDM project,
during which CERs are issued, is either
7 years, with the possibility to renew
twice, or 10 years without the possibility
of renewal.
D. Monitoring methodologies
Monitoring methodologies explain how the GHG emissions from the project activity will be
measured during implementation and operation. Monitoring methodologies are part of
baseline methodologies, so the choice of baseline methodology also determines the
monitoring methodology. They are approved by the CDM EB in the same way as baseline
methodologies are. New monitoring methodologies can also be submitted for approval.
Monitoring methodologies for energy generation projects generally require measuring t
used for electricity and heat generation from the project activity, as well as the electrici
heat output of the process. These then serve to calculate the emissions reductions fr
project activities and the baseline alternatives.
E. Estimation of the GHG Emissions by Source
In the PDD the project proponent must give an initial estimate of the GHG emissions b
source for the project scenario and baseline alternatives. This enables the calculati
expected emissions reductions from the project, based on the formulas described in the
baseline methodology.
For energy generation GHG emissions from the project activities are normally calculat
fuel-consumption basis, while baseline emissions are based on the electricity and heat
and the alternative processes through which these would be generated.
8 http://cdm.unfccc.int/methodologies/PAmethodologies/AdditionalityTools/Additionality_tool.pdf
FIGURE 8:ADDITIONALITY ASSESSMENT PROCESS FOR CDM PROJECTS
MINISTRY OF THE ENVIRONMENT JAPAN AND GLOBAL ENVIRONMENT CENTER F OUNDATION, CDM MANUA L FOR PROJECT DEVELOPE RS AND POLICY MAKERS , 2005.

405
22
F. Environmental Impacts
In the PDD the project proponent must indicate the environmental impacts of the proje
activity other than GHG emissions. For example, a project that includes the creation
oil plantation could reduce GHG emissions, but entail the clear cutting of virgin for
thereby affect biodiversity. A project using sewage waste as energy source could impr
water quality by reducing the sewage effluent that is discharged. Both positive and negative
impacts should be included.
G. Stakeholder Consultation
The project proponent must consult various local stakeholders during the project deve
process, and account for their involvement and feedback in the PDD. Any concerns rais by
stakeholders must be addressed in the project’s design. Consultation takes place thro
the project scooping and development stage.
3. Obtaining National Approval
Once the PDD is ready it must be approved by the host country, for which the project
participants submit the PDD to the DNA. The DNA will check if the project complies wi
local procedures and regulation. There is therefore the possibility that the host cou
grant or delay host country approval such that the project cannot go forward, which is part of
the registration risk of CDM projects (see Registration Risk, Section 2.5).
4. Validation and Registration
After the project is approved by the host-country DNA, the PDD and letter of approval from
the host country are submitted to a DOE, which will validate the PDD and the methodologies
proposed. The DOE will evaluate whether the project proponent: 1) has calculated the
baseline in a conservative and transparent manner and made a reasonable estimate of t
volume of emissions reductions; and 2) convincingly demonstrated that the project is
additional. There is a risk that the project is not validated if the baseline calcula
inappropriate or inaccurate, or if the project is not deemed to be additional (see Reon
Risk, Section 2.5). Once validated, the DOE will send the PDD, letter of approval and
Validation Report to the CDM EB for registration.
5. Project Activity and Monitoring
The participants can now proceed with the project activity, while monitoring the emission
reductions during operation for the Monitoring Report.
6. Verification and Certification
At the end of the CDM credit period the project participants submit the Monitoring re
DOE for verification of the achieved emission savings. The DOE produces Verification and
Certification Reports, which its sends to the CDM EB with a request for issuing the C
7. Issuance of CERs
The CDM EB issues the CERs to the Annex I party involved in the project.

406
23
1. Screening and Planning CDM Project
Project Sta
7. Issuance of CERs
2. Preparing the Project Design Document (PDD)
3. National Approval of Involved Parties
4. Validation and Registration
5. CDM Project Actand Monitoring
6. Verification and Certification
Measurable
emissions savings
Baseline
methodology
Host-country
approval
Validation of
methodology
Monitor emissions
from the project
Verify emissions
reductions
IssueConsiderations for C
Projects
CHP methodologies: AM0007,
AM0016, ACM0004, ACM000
Consider host DNA’s priority
areas
All registered DOEs accr
for type-I project validation
Required data: fuel use and
electricity generation
DOEs accredited for type-I
project verification: E0003,
E0005, E0009, E0010, E0021
Additionality: no CHP
Project type: I Energy Industries
3.3 Special Considerations for CHP projects
Figure 9 illustrates the issues addressed above, and highlights the main points relev
cogeneration projects in the flow chart of the CDM process.
FIGURE 9:FLOW CHART FOR CHP P ROJECTS IN THE CDM
WADE, 2006
The following section specifies the issues relevant for cogeneration projects in the CDM. It
lists common questions that may be asked by project participants, answers these. It a
highlights specifics for cogeneration, and gives examples.
1. Screening and Planning a CDM Project
Considerations for CHP: Additionality – No CHP in the baseline scenario
Is the project eligiblefor CDM?
A project is eligible for CDM if it satisfies the three global criteria (voluntary
real and measurable emissions savings, additionality), and the host-country’s criteria for
sustainable development.
Can the project benefit from CDM?
The additionality requirement means that the project cost/benefit balance of the p

407
24
activities is generally negative without CER revenue. For the project to be economically
viable with CDM revenue, this must outweigh the CDM-related costs, and the net CDM
benefit must exceed the negative project cost/benefit balance. Things to consider
The size of the project (for larger projects CDM costs are relatively smaller)
The CER delivery risk (if delivery is uncertain, viability may suffer)
The CER delivery timing (inappropriate timing can lead to cash-flow problems)
Is the project big enough to benefit from CDM?
For large projects the CDM-related costs represent a smaller share of the total project
costs, reducing their impact on overall viability. Projects with emission savings
50,000 t CO2-eq over the project lifetime are generally considered economically
attractive9. Smaller projects can be viable, but are more affected by unforeseen changes
in costs and revenues. To reduce the impact of the CDM costs, small projects can
register through simplified Small CDM procedures, and can be bundled together.
2. Preparing the Project Design Document (PDD)
Considerations for CHP: CHP methodologies: AM0007, AM0016, ACM0004, ACM0006
In which languages can a PDD be written?
All PDDs must be written in English for the CDM-EB. Some countries also require a
translation in the national language for national approval.
A. Description of the project activity
Should the project register as a normal CDM project or a small CDM project?
CHP projects with an installed capacity smaller than 15 MWe can register through t
simplified procedures of Small CDM.
What are the project types appropriate for CHP?
CHP projects normally fall within type I: Energy Industries. For small projects,
cogeneration for on-site use only is classified as I-A (Electrical energy for the user) or I-C
(Thermal energy for the user), depending on whether the project is heat-driven or
electricity-driven. CHP for export to the grid falls under I-D (Renewable electricity
generation for a grid). A project can be registered in more than one category. For
example, a CHP project could be both I-A and I-C.
Can the project be registered without an Annex I party involved?
It is not necessary to have secured involvement of an Annex I party, who will buy
CERs when registering a CDM project. However, the CER revenue is less certain if n
purchasing contact has been agreed on yet, so risks are higher.
What should the technology description include?
The technology description usually contrasts the prevalent local practice or curre
technology on-site with the best technology available. This helps establishing the
additionality of the project later on. For biomass CHP the standard technology is
Rankine Cycle Steam Turbine, which can be compared to a boiler for combustion of
biomass for heat only, combined with grid electricity.
B. Baselines and additonality
Is it best to use an approved baseline methodology, or propose a new methodology?
Proposing, submitting and registering a methodology is a time-consuming, work-intensive
and expensive programme, so if possible, it is easier to use an existing approved

408
25
me thodology. This facilitates finding a DOE approved to validate the project PDD,
reduces registration risks (see Registration Risk, Section 2.5). Proposed new
methodologies are not always approved, as by June 2006 the CDM-EB had received
proposals for 170 methodologies, but approved only 50, with 40 were under considerati
and 65 rejected10. So project developers should check the available approved and
consolidated methodologies to see which is applicable to their project. If no sui
baseline methodology exists, a new methodology will have to be prepared and register
More information on how to do this can be found in the CDM User Manual11.
Which approved baseline methodology is most appropriate for CHP projects?
A methodology is suitable for a cogeneration project if the project satisfied the applicati
criteria listed in the methodology description. In addition, methodologies that ha
used for comparable projects are generally very useful, as they also show how it c
applied. For instance, for a bagasse cogeneration project at a sugar-processing factory in
China could use baselines of similar registered projects in Brazil.
How is the additionality of the project activity demonstrated?
The best way to demonstrate the additionality of a project is by using the UNFCCC ‘Tool
for Demonstrating Additionality’, developed by the UNFCCC12.
How are project alternative scenarios identified?
Alternative scenarios to be considered in the baseline include: the same project o
the CDM; other projects that deliver the same energy outputs and services; and
continuation of the current situation13. For CHP projects alternatives must indicate how
heat and power are normally generated. This can be the use of grid-electricity or the
separate generation of heat and power on-site. All alternatives must comply with existing
legislation.
What existing laws and regulations should be considered for the baseline?
Four types of legislation should be considered in the baseline methodology14:
Type E+: Legislation that gives competitive advantages to more GHG-intensive practices
Type E-: Legislation that gives competitive advantages to less GHG-intensive practices
Type L-: Sectoral mandatory regulations that internalise environmental externalitie
incidentally reduce GHG emission
Tyoe L+: Sectoral mandatory regulations that internalise environmental externaliti
prevent implementation of less GHG-intensive technologies
How are barriers to the project activity identified?
The CDM project activity must face barriers to meet the additionality requirement of the
CDM. There are three steps in assessing these barriers15:
1. Investment analysis: the project is not a financially attractive option.
2. Barrier analysis: the project cannot secure investment, infrastructure or the local skill-
base is insufficient, or the project is ‘the first of its kind’.
3. Common practice analysis: similar projects are not already occurring in the are
Investment analysis provides the strongest case for additionality. For cogeneratio
projects the fact that there is no previous expertise with such projects in the co
sector can also be important.
9 Michelowa and Stronznik, 2002.10 Brett Orlando, Factor Consulting+Management, personal communication, 2006.11 Ministry of the Environment Japan and Global Environment Center Foundation, CDM Manual for Project Developers and Policy Makers, 2005. 12 Available from the UNFCCC CDM website: www.cdm.unfccc.int13 UNFCCC, Tool for the demonstration and assessment of additionality (version 2), 2005.14 UNEP Energy and Environment Group, The CDM – A User’s Guide, 2003.15 UNFCCC, Tool for the demonstration and assessment of additionality (version 2), 2005.

409
26
How can be shown that the project removes these barriers?
The final step in proving additionality is showing that the benefits of the CDM remove the
barriers identified. The primary benefit is the CER revenue, but also the opportun
attract new players able to provide funding or technical expertise, and reduced
investment risks. Cogeneration projects are often cost-effective, making additionality
difficult to prove. In such cases additionality assessment can focus on the up-front capital
required, which is often unavailable to small manufacturers. Projects can sometime
achieve the required rate of return to pay back commercial loans, unless CER revenue is
included. Baseline methodology AM0007 proves additionality by showing that biomas
not the cheapest available fuel for cogeneration.
How is the project boundary defined?
The project boundary is defined so that it covers all emissions that can reasonably be
considered direct result of the project activities. Emissions not directly result
project are outside the boundary. For cogeneration projects emissions within the
boundary include those from the generation process and heat and electricity distribution.
Is there any leakage from the project?
Leakage is the net change of anthropogenic emissions by sources of GHG, which occu
outside the project boundary, and which is measurable and attributable to the CDM
project activity. Generally this means imports and exports of fuels. For cogeneratio
projects, particularly biomass-fired ones, the transport of biomass is normally the main
type of leakage, assuming that the transport vehicles run on fossil fuel.
C. Crediting period
What crediting period is most appropriate for the project?
Crediting periods can be 7 years, with the option to renew twice, or fixed for a m
of 10 years. The crediting period can only start after the start of the project, a
extend beyond its operational lifetime. The choice of crediting period depends on t
project’s lifetime and expected timing of delivery of emission savings. The projec
developer will clearly aim to choose the crediting period that optimises the CER r
Fixed-term crediting periods are useful for short projects, or projects with high f
uncertainty. Renewal crediting periods are suitable for long-term projects, such as CHP,
for which the local circumstances may change. At renewal, the baseline methodology and
alternatives must be re-validated by a DOE, and can therefore be adapted to reflect
changes. This also adds to the CDM-related costs, though.
D. Monitoring methodologies
What does monitoring require from the project developer?
Monitoring of a CDM project requires the collection and archiving of three kinds of da
estimate or measurement of GHG emissions from the project activity; measurement o
electricity and heat output of the project activity; calculation of emissions from
baseline; and identification of emissions outside the project boundary. All the data m
be archived and kept until two years after the end of the crediting period. For CH
projects the project developer is responsible to measure the GHG emissions from th
cogeneration system.
E. Estimation of the GHG Emissions by Source
How are the GHG emissions from CHP projects calculated?
GHG emissions from the project activity are calculated according to the formula sp
in the baseline methodology. For cogeneration projects this is generally this is done on a
fuel-input basis, taking into account the efficiency and operational conditions of

410
27
technology used (for instance in AM0007).
How are the GHG emissions from the baseline options calculated?
GHG emissions from the baseline are calculated according to the formula specified in t
baseline methodology. For CHP projects baseline emissions can be calculated from
heat and electricity output of the project, and the GHG emission factor of the bas-
technologies used to generate these. Different baseline alternatives can therefore hav
different total GHG emissions.
What is the total GHG emission saving from the project?
The GHG emission saving of the project is the difference between the baseline emis
and the project emissions.
F. Environmental Impacts
What impacts of the project should be considered?
All impacts that are considered significant must be included in this section. To e
which impacts are significant the developer can conduct an Environmental Impact
Assessment. The required procedures, and the definition of sustainable developmen
differ between host-countries, so the assessment must follow local guidelines.
Assessments done for similar projects are a useful source of information. For CHP
projects possible impacts include air pollution, soil degradation, biodiversity im
socio-economic impacts such as employment or displacement.
G. Stakeholder Consultation
What are the requirements for stakeholder consultation?
Stakeholder consultations are required for CDM projects. Responses from stakeholders
must be collected, reviewed, and incorporated in the PDD. These requirements vary
between countries, so it is important to check with the DNA.
How does the consultation process usually take place?
The process normally has five stages:
1. Identify important stakeholders;
2. Devise a consultation programme;
3. Invite comments;
4. Record comments;
5. Produce a written consultation report.
At the validation of the CDM project, the DOE can request a copy of the consultation
report.
Which stakeholders should I approach for consultation?
Local stakeholders must be actively approached. Consultation meetings are an effec
way of involving them in project development. Local stakeholders that should be
approached include local residents, local authorities and community groups. Intern
stakeholders do not need to be actively approached, but can be invited to comment
correspondence.
3. Obtaining National Approval
Considerations for CHP: Consider host-country’s national priority areas
How do project proponents apply for host-country approval?
The project proponent applies for host-country approval by submitting to the DNA the
PDD, an application form, and, if necessary, additional information requested.
How does the approval process work?

411
28
The Marrakech Accords do not offer guidance on host-country approval, apart from the
requirement for a written approval document, so the exact procedures and requirem
vary between countries.
How long does the approval process take?
The length of the approval process depends on the country procedures and on the ty
project. Generally approval takes two to three months, unless additional informat
requested.
What is the best way to ensure approval for a CHP project?
To ensure a CHP project is approved by the host-country it is important to thoroughly
check the DNA’s requirements. Host-country approval assesses the project’s compliance
to local laws, regulations, and national sustainability criteria. Many countries have
indicated priority areas for CDM projects, so if CHP is one of these, this can be
emphasised. Support and involvement of local organisations also bolsters the proj
proposal.
4. Validation and Registration
Considerations for CHP: All registered DOEs accredited for type-I project validation
Which DOE is most appropriate to validate the project?
Different DOEs are approved for validating of different baseline methodologies. Th
choice of DOE therefore primarily depends on the methodology chosen. All DOEs
registerer are accredited for type-I project validation. Other considerations can include
previous experience of the DOE in the host-country, or with similar projects and the
validation costs charged. Some DNAs have established their own DOEs, and require
projects to be validated by a DOE based in the country itself.
What are the responsibilities of the project proponent during the validation process
The project proponent must arrange and pay for the validation process. For application
for validation the PDD and written host-country approval must be submitted to the DOE.
What are the responsibilities of the DOE during the validation process?
The DOE will assess the PDD, check whether it complies with the CDM requirements,
and validate the baseline scenarios, additionality, and emission reductions formu
the PDD. The DOE writes a validation report, which it must make available for 30
public consultation, and records comments.
How long does the validation and registration process take?
The time of the validation period depends on the DOE, but generally not less than
months should be reserved for it, as the validation report must be publicly avail
least 30 days. Project registration takes 8 weeks. If no objections from the CDM-EB have
been made within that period, the project is officially registered. For small-scale projects
this period is reduced to 4 weeks.
5. Project Activity and Monitoring
Considerations for CHP: Monitoring data requirements– fuel use and electricity generation
When can the project activity start?
The start date of project operation can be chosen as is convenient for the parties
involved. It is not necessary to wait for project registration for the CDM. Howev
projects that have not been approved yet, there is a risk of failing to meet the CD
criteria, and therefore not receiving any CER revenue. The choice of start date c

412
29
influenced by the desired start of the crediting period.
Can a project still register for CDM if it has already started?
Projects that have been started between 1 January 2000 and 18 November 2004 can
request retroactive credits, if they have submitted a new methodology or requeste
validation with a DOE before 31 December 2005, and are registered by the CDM-EB no
later than 31 December 2006. Projects that have not requested for validation yet
eligible for retroactive credits.
How should data be processed and stored?
All monitoring data must be stored electronically and kept until 2 years after the end of the
crediting period.
What information should the monitoring report include?
The information required for the monitoring report is specified in the chosen meth
6. Verification and Certification
Considerations for CHP: DOEs accredited for type-I project verification – E0003, E0005,
E0009, E0010, E0021
Which DOE is most suitable for project verification?
The DOE that validated the PDD cannot verify the project emission reductions, so
another DOE accredited for the chosen methodology must be selected.
What does the verification process require from the project developer?
For verification of the GHG emission reductions the project developer must submit
monitoring report to the DOE, and pay for verification. The monitoring report will be made
publicly available on the CDM website.
How does the DOE verify the GHG emission savings?
The DOE checks if the submitted information meets the requirements of the monitori
methodology, verifies the monitoring results to check that the methodology has been
applied correctly, and determines the GHG emission reductions achieved by the pro
activity. If necessary, the DOE can conduct site-visits or request additional information. It
can also recommend changes to the monitoring methodology for future applications. All
information is included in the verification report, which will be made publicly av
How are the emission reductions from a verified project certified?
The DOE certifies the amount of CERs based on the verification report. This is made
publicly available and submitted to the CDM-EB. CERs are issued if no requests for
review are made within 15 days.
How long does the Verification and Certification process take?
The time required for the verification and certification process depends on the DOE.
There are no specific guidelines or time limits.
7. Issuance of CERs
When will the CERs be issued?
CERs are issued each time GHG emissions reductions are verified and certified. The
project developer can choose when and how often to have this done. Clearly, more
frequent verification increases the verification costs, but it ensures a steady i
revenue from CERs. A single verification is cheaper, but also reduce the occasion
are issued and can be sold. The choice depends therefore on the cash flow of the
project, and on the CER purchasing agreement with the buyer.
What happens if the project is unable to deliver the emissions reductions?

413
30
If the project fails to deliver its emission savings, the verification report will recognise this,
and no emission reductions will be certified.
Who owns the CERs?
The regulations and laws of the host country determine the ownership arrangements
CERs are normally issued to the project proponents, but the national government c
claim national ownership. If the project proponents receive the CERs, their legal
ownership is determined by the contractual arrangements between the project propon
investors, and CER buyers.

414
31
4. Status and Prospects for Combined Heat and Power Projects in the Clean Development Mechanism
4.1 Introduction
CHP projects are considered an attractive option for CDM activities, and registration
projects has been increasing. Most are in the sugar industry in India and Brazil. The
for CHP in developing countries is large, the expertise is available, and interest is r
the trend is likely to continue. Cogeneration projects could therefore represent a la
of the GHG emissions reductions from the CDM in the future, and facilitate significant
investment in the power sector of developing countries.
The Clean Development Mechanism has only just been adopted, and the first commitment
period has not yet started, so a number of outstanding issues and potential barriers
projects remain. There are concerns about the reliability of measuring and verifying GH
emissions savings from CDM projects, and about the long-term effectiveness of CDM
measures. The paperwork and bureaucracy involved in CDM project registration is the m
barrier for project developers, while investors are worried about the risks of CDM pro
financing, due to uncertainties in deliverability of CERs and carbon market developme
This chapter will discuss the prospects of CHP projects in the CDM, based on current trends
and future projections (Sections 4.2 to 4.5). It will also discuss neglected CDM oppo
for cogeneration (Section 4.6) and outstanding issues (Section 4.7).
Sections 4.3 to 4.5 are country profiles for Brazil, China and India. These describe the
organisational structure and procedures of the CDM in these countries, and provide th
status and projections in different sectors. The CDM and CHP potentials and projectio
these country profiles are based on different sources, which may have different approaches,
but the data presented aim to give a consistent overview. The cogeneration potentials
market projections and technical potential, while the CDM potential shows the total G
reduction potential. In the cases where either of these was unavailable, it has been derived
from the other figure. Combining the cogeneration and CDM potentials in the same grap
allows the reader to assess the importance of CHP for GHG mitigation within that sect

415
32
4.2 Overall trends of CHP projects in the CDM
The total number of cogeneration projects registered for the CDM by the end of Septem
2006 was 66, out of 326 (20%). This has been increasing by about seven per month, exc
in March, when the Brazilian DNA released 19 projects for registration.
FIGURE 10:TRENDS IN REGISTRATION OF CHP PROJECTS IN THE CDM
Cumulative emissions reductions from registered CHP projects
0
500
1000
1500
2000
2500
3000
3500
4000
Sep-05 Oct-05Nov-05 Dec-05 Jan-06 Feb-06 Mar-06 Apr-06May-06 Jun-06 Jul-06Aug-06 Sep-06
Months
Emissions reduction (kt/yr)
Registered projects
WADE, 2006
The total registered emissions reductions from cogeneration projects are increasing b
roughly 350,000 t/yr each month. Again March shows a sharp increase due to the 19 Brazilian
projects, and in June four large industrial projects raised the total emission reduct
registered significantly. The total amount of registered emissions reductions from CH
end of September 2006 was 3,574,148 t/yr, out of more than 580 Mt/yr. The average
emissions reductions per project are therefore 54,154 t/yr (figure 11).
FIGURE 11:REGISTERED CHP PROJE CTS IN THE CDM BY SIZE
FIGURE 12:EMISSION REDUCTIONS FROM CDM -REGISTERED CHP PROJE CTS BY SECTOR
Emissions reduction size of registered CHP projects
0
2
4
6
8
10
12
14
16
<10 10 to 2020 to 3030 to 4040 to 5050 to 6060 to 70 >70
Size of project (kt emissions reduction/yr)
Number of projects
Registered projects
Emission reductions from registered CHP projects
25%
4%
20%
2%
33%
3%
13%
Sugar
Paper
Iron & Steel
Textile
Food
Power
Other
WADE, 2006
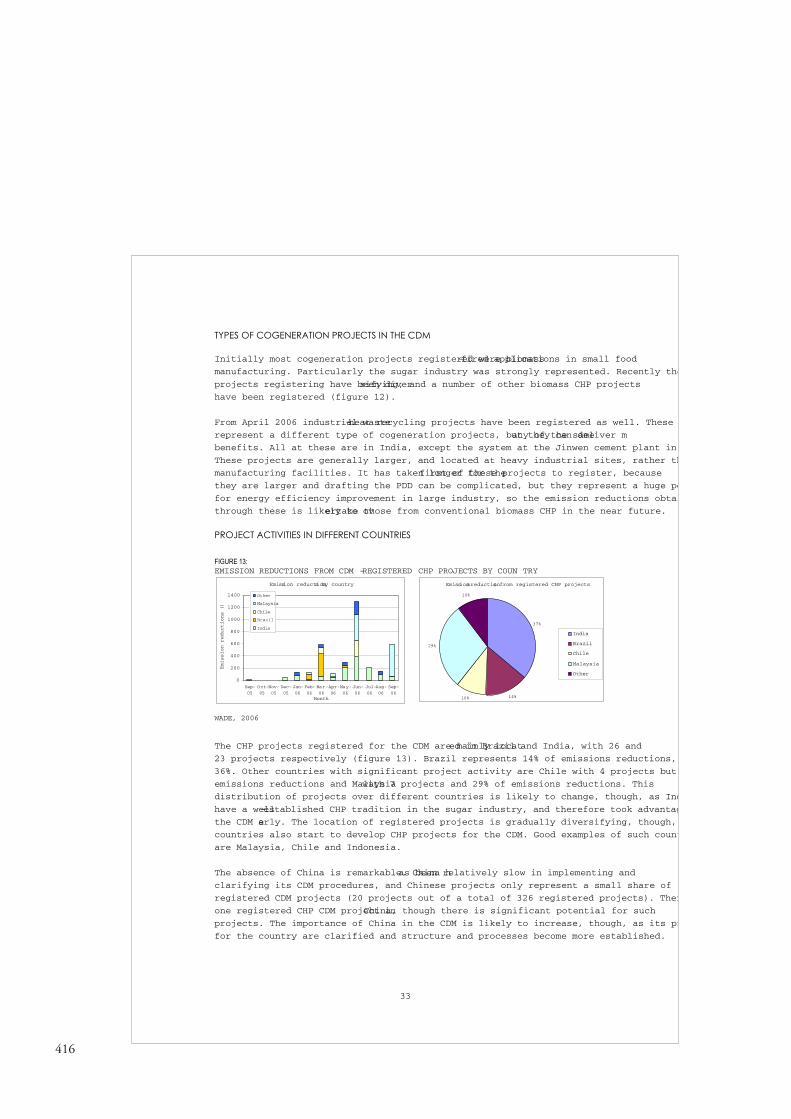
416
33
TYPES OF COGENERATION PROJECTS IN THE CDM
Initially most cogeneration projects registered were biomass-fired applications in small food
manufacturing. Particularly the sugar industry was strongly represented. Recently the
projects registering have been diversifying, and a number of other biomass CHP projects
have been registered (figure 12).
From April 2006 industrial waste-heat recycling projects have been registered as well. These
represent a different type of cogeneration projects, but they can deliver many of the same
benefits. All at these are in India, except the system at the Jinwen cement plant in
These projects are generally larger, and located at heavy industrial sites, rather th
manufacturing facilities. It has taken longer for the first of these projects to register, because
they are larger and drafting the PDD can be complicated, but they represent a huge po
for energy efficiency improvement in large industry, so the emission reductions obtai
through these is likely to overtake those from conventional biomass CHP in the near future.
PROJECT ACTIVITIES IN DIFFERENT COUNTRIES
FIGURE 13:EMISSION REDUCTIONS FROM CDM -REGISTERED CHP PROJECTS BY COUN TRY
Emission reductions by country
0
200
400
600
800
1000
1200
1400
Sep-
05
Oct-
05
Nov-
05
Dec-
05
Jan-
06
Feb-
06
Mar-
06
Apr-
06
May-
06
Jun-
06
Jul-
06
Aug-
06
Sep-
06Month
Emission reductions (k
Other
Malaysia
Chile
Brazil
India
Emissions reductions from registered CHP projects
37%
14%10%
29%
10%
India
Brazil
Chile
Malaysia
Other
WADE, 2006
The CHP projects registered for the CDM are mainly located in Brazil and India, with 26 and
23 projects respectively (figure 13). Brazil represents 14% of emissions reductions,
36%. Other countries with significant project activity are Chile with 4 projects but
emissions reductions and Malaysia with 7 projects and 29% of emissions reductions. This
distribution of projects over different countries is likely to change, though, as Ind
have a well-established CHP tradition in the sugar industry, and therefore took advantag
the CDM early. The location of registered projects is gradually diversifying, though,
countries also start to develop CHP projects for the CDM. Good examples of such count
are Malaysia, Chile and Indonesia.
The absence of China is remarkable. China has been relatively slow in implementing and
clarifying its CDM procedures, and Chinese projects only represent a small share of
registered CDM projects (20 projects out of a total of 326 registered projects). Ther
one registered CHP CDM project in China, though there is significant potential for such
projects. The importance of China in the CDM is likely to increase, though, as its pr
for the country are clarified and structure and processes become more established.

417
34
CER MARKET DEVELOPMENTS
The size of the CER market is growing as well as the CDM project registration. The CE
from CDM projects are traded in the general carbon market, which also include emissio
reduction credits from the Joint Implementation mechanism (JI) and the European Union
Emission Trading Scheme (EU ETS). Trade in CERs from CDM is still small compared to E
Allowances (EUAs, the ETS’s emission reduction unit). Presently there is no mechanism
place to make CERs from CDM projects compatible with EUAs for trading in the EU ETS.
Projections for the size of the CER market vary widely, from 270 Mt CO2 eq to over 1000 Mt
CO 2 eq. in 201016, with Pointcarbon giving an average of 610 Mt. Estimates for the CDM
component of this range from under 100 Mt CO2 eq to over 700 Mt CO2 eq, representing 30-
40% of the total carbon market17.
The main supply of CERs comes from energy efficiency improvement projects, renewable
energy projects, and industrial projects. Cogeneration projects will represent a sign
share of these. Demand for CERs comes primarily from the EU-15, particularly the
Netherlands and Spain, with Japan and Canada as the other main buyers18. Most analysts
expect demand to exceed supply, as the total emission reductions required are general
more than double the projected supply.
The price of CERs is subject to uncertainties. The carbon price of EUAs in the ETS wa
around 25/t C until May 2006, when the prices fell to around 16/t C. The expected prices for
CERs from CDM projects are lower, though, because of added uncertainties. CER prices
depend on the project type and contractual arrangements. Currently typical prices are
range of 10 – 12 per ton C, but there future projections vary. The initial estimates pr
prices of $2/t CO2 eq. to $3/t CO2 eq. ($6.7 - $10/t C)19, but present price trends suggest
higher prices. Projects that involve much capacity building require prices of $3/t CO2 eq to
$5/t CO2 eq ($10 – $16.7/tC), so these would be viable if current developments continue.
The main threats to a stable high CER price are the absence of the US from the Kyoto
agreements, and the large amount of excess emission quota from former Soviet countrie
However, even at low prices the annual value of CER trade is in the range of $2.9 mil
$4.3 million.
16 The Delphi Group et al., Analysis of the International Market for Certified Emissions Reductions, 2004.17 Dhakal, S. CDM Market: Size, Barriers and Prospects. 2001; Jotzo, F. and Michaelowa, A. Estimating the CDM Market under the Bonn Agreement. 2001.18 The Delphi Group et al., Analysis of the International Market for Certified Emissions Reductions, 2004.19 Jotzo, F. and Michaelowa, A. Estimating the CDM Market under the Bonn Agreement. 2001.

418
35
4.3 Country Profile – Brazil
GENERAL INFORMATION
Ratification: 23 July 2002
Reason for Ratification: Brazil was one of the countries proposing the CDM, because it ca
benefit through investment and technology transfer through GHG reduction projects.
Priorities:
♦ Renewable energy sources
♦ Energy efficiency/conservation
♦ Reforestation and establishment of new forests
♦ Other emission reduction projects: landfill projects and agriculture project
Total GHG emissions: 2,081 Mt CO2 eq (1994)
CDM IN BRAZIL
Organisational structure
CDM regulation in Brazil is part of its wider Climate Change Programme. The Brazilian
is the Interministerial Commission on Global Change (CIMGC), established in 1999 to
coordinate the government’s activities in combating climate change. It is chaired by the
ministry of Science and Technology, and includes representatives from several other
ministries (table 6).
TABLE 6: THE NCA BODIES, MEMBERS AND TASKS
Body Represented Parties Responsibilities
CIMGC Ministry of Science and Technology (president)
Ministry of Environment (vice-president)
Ministry of Foreign Affairs
Ministry of Agriculture and Food Supply
Ministry of Transport
Ministry of Mines and Energy
Ministry of Planning
Ministry of Budgeting and Management
Ministry of Development, Industry and Commerce
Civil House of the Presidency of the Republic
• Set national climate change policies, including CDM
• National authorisation of CDM projects
• Report to the UNFCCC-EB
• Information dissemination
BFCC CIMGC
Government
Private sector
NGOs
Academics
• Discuss climate change policy, including CDM, with a wider range of stakeholders
Getulio Vargas, The Clean Development Mechanism – A Brazilian Implementation Guide, 2002
Other relevant organisations
The CIMGC works with representatives from government, private sector, NGOs and local
communities through the Brazilian Forum on Climate Change (BFCC). The BFCC is the mai
platform for other organisations involved in the CDM in Brazil to contribute to the C
process in the country.

419
36
In 2000 the Ministry of Environment established the Integrated Studies Centre on
Environment and Climate Change (Centro Clima), which supports the Brazilian climate
change programme through research, information dissemination and stakeholder
participation.
The Brazilian National Fund for the Environment, established in 1989, and the Brazili
National Development Bank are governmental organisations involved in funding CDM
projects. Ecosecurities Ltd is a private finance and trading company, which has been
active in financing Brazilian CDM projects.
Sustainability Criteria
The Brazilian government has set out clear priorities for the CDM, including sustaina
criteria for project eligibility. Four types of projects are ineligible for CDM: foreects
other than forestation and reforestation; nuclear energy projects; unsustainable biom
projects; and hydropower projects larger than 30 MW. For cogeneration projects the th
categories is particularly important, as it stresses that for biomass-CHP projects the source of
biomass must be sustainable.
TABLE 7:SUSTAINABILITY CRITERIA FOR CDM PROJECTS IN BRAZILCategory Criteria
Environmental Sustainability Mitigation of global GHG emissions
Local environmental sustainability
Economic Sustainability Contribution to the sustainability of balance of payments
Contribution to macro-economic stability
Cost effectiveness
Social Sustainability Net employment generation
Impacts on rent distribution
Technological Sustainability Contribution to technological self-reliance
Ministry of Science and Technology Brazil, CDM Project Eligibility Criteria, 2006.
The sustainability criteria for eligible projects are shown in table 7. In Brazil the
on the economic benefits of CDM projects for the local and national economy. This is
highlighted by three additional criteria, which have multiplying potential:
♦ Internalisation of the possible CER revenue in the national economy
♦ Possibility of regional integrity or interaction with other planned activiti
♦ Potential of technological innovation
Country approval application process
For application for national approval for a CDM project the project proponent must su
documents shown in table 8 to the CIMGC, both in electronic and paper format. The
description of the project’s contribution to sustainable development must directly addr
environmental sustainability criteria, and be based on the PDD or other relevant work
Invitation letters must include letters addressed to the City Hall, the City Council, the State
and Municipal Environmental Agencies, the Brazilian Forum of NGOs, the Public Prosecu
Office, and Community Associations. The declaration of the project participants shoul

420
37
the organisation in charge of the project, the means of communicating with the CIMGC, and
the commitment to sending the distribution document of the CERs when they are issued
Statement of DOE must prove that the DOE that will validate the project is approved b
CDM -EB, and that the DOE is located in Brazil, because the CIMGC will not accept validation
or verification by foreign DOEs.
TABLE 8:REQUIRED DOCUMENTATI ON FOR NATIONAL APPR OVAL IN BRAZIL
• PDD (English)
• Project Design Document (DCP), translated in Portugese
• Description of the project’s contribution to sustainable development (Annex III)
• Invitation letters for comments from stakeholders
• Validation report (English version and Portuguese translation
• Declaration of the project participants
• Conformity with the Environmental and Labour Legislation
• Statement of DOE
• Additional documents (optional)
MINISTRY OF SCIENCE AND TECHNOLOGY BRAZI L, 2006.
The CIMGC will check the eligibility of the proposed project based on the submitted
documents, and assess whether the project fulfils the global and national CDM criteria. They
also evaluate the PDD before it is submitted to the CDM-EB. There is no indication of the
length of the approval process.
Government Incentives
The Brazilian government has a range of policies to promote energy efficiency and cle
energy generation, some of which are directly related to cogeneration (table x). The
Programme to Encourage Alternative Sources of Electricity (PROINFA) is the most signi
of these, and aims to develop 3300 MWe of renewable energy capacity, 1100 MWe of which
biomass fired. Feed-in tariffs are guaranteed by the government to support the developmen
of this capacity, and the tariff for 2005 was R$132/MWh. Other policies relate to ene
efficiency and renewable, but are also relevant to cogeneration, including:
Cogeneration and Independent Power Production
• Law 10848 sets efficiency standards for electricity generation, and creates incentives for electricitybuy electricity from CHP plants.
• Programme to Encourage Alternative Sources of Electricity (PROINFA) (2002)
• VAT reduction on cogeneration equipment in some states
• Independent Power Producers are legally permitted to sell electricity to licensed electricity supply clarge electricity users, consumers of cogenerated electricity, and consumer co-operatives.
Energy Efficiency
• The Brazilian National Electricity Conservation Programme (PROCEL) promotes electricity savings on botdemand side and supply side.
Renewable Energy
• The Energy Reallocation Mechanism allows producers of renewable energy technologies, including biomass cogeneration to establish central dispatching systems in order to mitigate financial risks.
• The Global Reversion Reserve, managed by Electrobras, promotes renewable energy projects.
Financial and legal arrangements
There have been proposals in Brazil to establish a national CDM financing institution
would provide initial funding for CDM projects. The institution would pay project pro
certain price for the emission reductions, and then keep the CER portfolios to offer to buyers
abroad. This would facilitate the purchase of Brazilian CERs by foreign parties, redu

421
38
CER risk for project proponents, and allow for fast tracking of Brazilian CDM project
POTENTIAL FOR CHP PROJECTS IN THE CDM INBRAZIL
Cogeneration status and potential
At present only 3.3% of total electricity generation
in Brazil is from cogeneration, and cogeneration
facilities represent 4.4% of installed capacity20.
However, in the sugar sector and oil and gas
sector there is considerable experience with CHP
projects, particularly in Sao Paolo state. These
are also the sectors with the largest potential for
further CHP development (table 9).
CDM status and potential in Brazil
TABLE 10: CDM STATUS IN BRAZIL
Approved Projects Installed Capacity (MWe)
GHG Emissions Reductions (t/yr)
All CDM projects 71 - 14,320,881
CHP projects
Sugar
Steel
26
25
1
1066.1
991.1
75
506,962
462,936
44,026
UNFCCC, 2006
The Brazilian government has actively promoted CDM projects, and sees it as a major
opportunity to develop sustainable energy resources. As a result, 71 projects have been
registered; more than one third are CHP projects, mostly bagasse-fired (table 10). This
dominance of bagasse-CHP reflects the technological expertise and economic attractivenes
of these projects, as well as the large potential for energy efficiency improvements through
cogeneration in small food-processing facilities.
The potential for further cogeneration projects in the CDM in Brazil is substantial
Biomass-fired projects in the food sector will remain attractive due to the large potential and
existing expertise. There is further potential for CDM projects in the sugar sector,
attractive projects have already been registered. In addition, rice-husk based cogeneration is
also attractive for CDM cogeneration projects in Brazil.
Energy efficiency measures in large industries provide a more significant and long-term
potential for CDM cogeneration projects in Brazil. The most significant sector is oil
where there is a considerable cost-effective potential for heat-recovery, cogeneration and
methane capture and utilisation: installing CHP systems at refineries can lead to ene
savings of up to 30%21. Realising this requires on the possibility to export to the grid t
cost-effective, so the directly marketable potential is still limited. Other sectors with larg
potentials are the pulp and paper industry and the chemical industry. In the Iron and
20 WADE, DE World Survey 2006.21 Center for Clean Air Policy, Identifying Investment Opportunities for the Clean Development Mechanism in Brazil’s Industrial Sector, 2001.
TABLE 9:CHP POTENTIAL IN BRAZIL BY SECTOR
Sector Potential (MWe)
Sugar 4,020
Oil and gas 4,283
Chemicals 1,581
Pulp and paper 1,740
Steel 875
Rice mills 1,200
UNIDO INVESTORS GUIDE, 2003

422
39
sector large energy efficiency savings can be made, but only a relatively small part
cost-effective22.
FIGURE 14: CDM POTENTIAL IN BRAZIL
Brazil - CHP and CDM Potentials
0
500
1000
1500
2000
2500
3000
3500
4000
4500
Bagasse
CHP
Oil RefiningChemicals Steel P ulp and
P aper
Rice mills
Sector
CHP Potential (MWe)
0
1
2
3
4
5
6
7
CDM Potential Mt/yr)
CHP Potential
CDM Potential
CENTER FOR CLEAN AIR POLICY, 2001; WADE, 2004; UNIDO INVESTORS GUIDE, 2003.
The potential for GHG emissions reductions in the power sector through cogeneration i
Brazil is relatively small, because most of the country’s electricity is generated by hydropowe
Drivers Barriers
• Large potential for cogeneration sugar sector and major industries
• Guaranteed feed-in tariffs through PROINFA
• Energy Law 10,848 sets efficiency index and creates market for cogeneration
• Strong government support for CDM
• Low electricity prices not reflective of true environmental costs
• Insufficient gas distribution infrastructure
• Centralised governance of CDM procedures
• Requirement to use Brazil-based DOE for validation and verification
Prospects
In the near future bagasse cogeneration is likely to remain the main source of CDM pr
in Brazil. Opportunities in larger industries, like petrochemicals, will probably be
next, diversifying the types of CHP projects registered for the CDM. The CDM’s organisational
structure in Brazil is very centralised, and the application process can be cumbersom
However, as the country originally proposing the CDM in Kyoto in 1997, Brazil recogni
can benefit significantly, and will strongly stimulate the realisation of this potential.
22 Center for Clean Air Policy, Identifying Investment Opportunities for the Clean Development Mechanism in Brazil’s Industrial Sector, 2001.

423
40
4.4 Country Profile – China
GENERAL INFORMATION
Ratification: 30 August 2002
Reason for Ratification: CDM considered a major opportunity to reduce GHG emissions and
increase the efficiency of China’s fossil-fuel based energy sector.
Priorities:
♦ Energy efficiency
♦ Renewable energy
♦ Methane recovery and utilisation
Total GHG Emissions: 3650 Mt CO2 eq (2004)
CDM IN CHINA
Organisational structure
The CDM in China is regulated through the Measures for Operation and Management of
Clean Development Mechanism Projects in China, (12 October 2005), which specified the
National Development and Reform Commission (NDRC) as the country’s DNA, supervised by
the National Coordination Committee on Climate Change (NCCC) and the National CDM
Board (NCB).
TABLE 11: THE CDM BODIES, MEMB ERS AND TASKS IN CHINA
Body Represented Parties Responsibilities
NCCC NDRC (chair)
Ministry of Foreign Affairs (vice chair)
Ministry of Science and Technology
State Environmental Protection Administration
China Meteorological Administration
• Review national CDM policies
• Approve members of NCB
• Review other relevant issues
NCB NDRC (chair)
Ministry of Foreign Affairs (vice chair)
Ministry of Science and Technology
State Environmental Protection Administration
China Meteorological Administration
Ministry of Agriculture
• Review project applications
• Report overall progress of CDM activities to NCCC
• Recommend interim measures
NDRC • Assess and approve project applications
• Supervise implementation of CDM projects
• Establish CDM management institute
INSTITUTE FOR GLOBAL ENVIRONMENTAL STRAT EGIES, CDM COUNTRY GUIDE FOR CHINA, 2005.
The NDRC is central in the CDM process in China, and manages the involvement of the
relevant ministries and other government organisations (table 11). It functions as a one-stop-
shop for project application and approval, and regulates the implementation of CDM pr
in China through the CDM Management Institute.
Other relevant organisations
The main parties involved in the CDM in China are state-organisations, both at national and

424
41
local level. However, any foreign company doing business in China needs to work with
partner company, and the applicant for CDM endorsement must be a Chinese company, so
CDM projects necessary involve local industries and manufacturers as well.
Sustainability Criteria
TABLE 12:SUSTAINABILITY CRITERIA FOR CDM PROJECTS IN CHINA
Category Criteria
Environmental Sustainability Reduce GHG emissions
Maintain resource sustainability and avoid degradation
Maintain biodiversity
Economic Sustainability Additional investment consistent with needs of the people
Funding additional to ODA
Social Sustainability Alleviate poverty by generating employment
Remove social disparities
Contribute to the provision of basic amenities
Technological Sustainability Transfer of environmentally safe and sound technologies
INSTITUTE FOR GLOBAL ENVIRONMENTAL STRAT EGIES, CDM COUNTRY GUIDE FOR CHINA, 2005.
The Chinese government’s sustainable development strategy emphasises the harmonic
development of the economy, society and the environment (table 12). Social aspects ar
important, but for CDM projects the focus is on the environmental criteria. Projects
evaluated primarily on the basis of their impact in the three designated priority areas: energy
efficiency; renewable energy; and methane recovery. The NDRC focuses on CO2 and CH4,
rather than the other four GHG. Cogeneration projects improve energy efficiency of
generation, and can use renewable fuels or recovered methane, so they are suitable for
meeting these criteria.
Country approval application process
TABLE 13:REQUIRED DOCUMENTATI ON FOR NATIONAL APPR OVAL IN CHINA
• CDM project application letter
• Completed application form
• PDD
• General information on project construction and financing
• Certificate of the applicant’s enterprise status
INSTITUTE FOR GLOBAL ENVIRONMENTAL STRAT EGIES, CDM COUNTRY GUIDE FOR CHINA, 2005.
The NDRC regulates the CER value for Chinese CDM projects, to avoid unacceptably low
prices. Project developers must indicate the CER price agreed with the buyer in their
application. However, without government approval it is difficult to find a buyer. To
‘catch-22’, the NDRC has an initial screening process to provide preliminary endorsement for
projects before they are officially approved.
To apply for national approval in China the project developer must submit the require
documentation to the NDRC (table 13). After endorsement, the NDRC will review the PDD
and consult experts to reach its decision, which is communicated to the project devel

425
42
within 50 days. If further review is
needed, additional information may be
requested, but otherwise an approval
letter is issued (Figure 15).
After registration by the CDM-EB the
project developer must notify the NDRC
within 10 days. During project operation
the developer must submit the
implementation report and monitoring
reports to the NDRC, so that the NDRC
can check that the project meets the
criteria set for CDM projects.
Government Incentives
The Chinese government has been
increasing its support for energy
efficiency and renewable energy in
recognition of their importance for the
country’s development. The adoption of
market-based economic mechanisms
also stimulates energy efficiency, and
renewable energy has enjoyed long-
term government support, despite the
absence of a comprehensive support
policy. Government incentives relevant
to CDM cogeneration projects are:
Energy Efficiency
• Favourable pricing for Independent Power Producers
• 2-year tax-breaks for cogenerators and energy-saving generators
• Favourable rates on loans for energy efficiency projects (30% lower on average)
• Graded quotas for energy consumption in key industries
Renewable Energy
• Subsidies (overhead, R&D, capital costs, project support)
• Reduced VAT and income tax rates
• Favourable custom duties for biogas equipment
Financial and legal arrangements
The NDRC regulates the CER price for Chinese CDM projects to ensure that it does not
below a set minimum. This aims to secure a good CER revenue for Chinese projects, but
also complicates the contractual arrangements between the project developer and the CER
buyer. To guarantee the minimum set price there needs to be an advance contract, whic
specifies this price before a project can apply for national approval. However, contr
hard to agree without national approval, and rules out certain CER contract types, like ma
price based agreements. This complicates the implementation of CDM projects in China
FIGURE 15:THE CDM PROJECT APPR OVAL PROCESS IN CHINA
INSTITUTE FOR GLOBAL ENVIRONMENTAL STRATEGIES, CDM COUN TRY GUIDE FOR CHINA, 2005.

426
43
The Chinese banking system is traditionally centralised and state dominated, but it i
gradually being restructured and Chinese banks are increasingly able to provide financi
and services to foreign investors. However, for CDM financing the problem remains tha
knowledge concentrated in government offices, not banks. This situation is gradually
improving, and as a result of the government’s encouragement of Foreign Direct Invest
(FDI)\ different kinds of financing available from Chinese and international instituti
However, the complicated international and national rules pose a major obstacle.
The Measures for Operation and Management
of Clean Development Mechanism Projects in
China specify that the CER revenues from
CDM projects belong to the Chinese
government and enterprises implementing the
project. The government fixes the distribution
proportions of the revenue and before the
fixation, the revenue shall belong to
enterprises. The CER revenue is subject to
government levies (table 14), additional to
normal taxes for foreign-led projects.
POTENTIAL FOR CHP PROJECTS IN THE CDM INCHINA
Cogeneration status and potential
The present installed cogeneration capacity in
China is 48.1 GWe, 10,9% of total capacity, which
generates 10% of the country’s electricity23. There
is still ample potential for further cogeneration
development, though, to as much as 80 GWe by
2015. Table 15 shows the potential for a number
of industrial sectors.
CDM status and potential in China
TABLE 16: CDM STATUS IN CHINA
Approved Projects Installed Capacity (MWe)
GHG Emissions Reductions (t/yr)
All CDM projects 20 - 36,806,034
CHP projects 1 13.2 105,894
WADE, 2006
The number of registered CDM projects in China is surprisingly small (20 out of 334),
considering that the country is thought to represent half of the global CDM potential
Projects in China are generally large, though, with an average of over 1.8 Mt/yr. The one CHP
project registered is a waste-heat-driven electricity generation project in a cement plant.
23 WADE, DE World Survey 2006.
TABLE 14: LEVIES ON CER REVENUE IN CHINA
GHG Regulated base price +
HFC and PFC 65%
N2O 30%
Other 2%
INSTITUTE FOR GLOBAL ENVIRONMENTAL STRATEGIES, CDM COUN TRY GUIDE FOR CHINA, 2005.
TABLE 15:CHP POTENTIAL IN CHINA BY SECTOR
Sector Potential (MWe)
Power 3,800
Oil and gas 260
Chemicals 1,000
Pulp and paper 102
Steel 115
Cement 246
Biomass 5,500
Coal-bed methane 500
Landfill gas 800
WADE, 2004; KEIO, 2003; IGES, 2005.

427
44
Figure 16 illustrates that the cogeneration and CDM potentials in China are large. Bi
availability and potential is significant, but the main sectors for CHP in China are industry and
power generation. Industrial cogeneration projects are generally large, and therefore
economically attractive, both for the project’s basic profitability and the potential
revenue. In the power sector many old power stations need to be upgraded, and new plants
are being built to meet growing electricity demand, providing opportunities for using
FIGURE 16: CDM potential in China
China - CHP and CDM Potentials
0
500
1000
1500
2000
2500
3000
3500
4000
4500
5000
Power Oil
Refining
Steel Pulp and
P aper
Cement Food
sector
Landfill
gas
Coal-bed
methaneSector
CHP Potential (MWe)
0
2
4
6
8
10
12
14
16
18
CDM Potential (Mt/yr)CHP Potential (2010)
CDM Potential
WORLD BANK, 2005; IGES, 2005; WADE, 2004; KEIO, 2003.
The large potential for CDM projects in industrial energy efficiency reflects the large ene
demand of China’s industries (70% of total energy consumption) and inefficient produc
standards. Cogeneration and heat recovery can contribute significantly to increasing
efficiencies, so that they are attractive CDM projects. The main industrial sectors for
cogeneration projects are steel (14% of industrial energy use), chemicals (16% of ind
energy use), pulp and paper, textiles, non-ferrous metals, and building-materials (23% of
industrial energy use). The government has realised this and is promoting initiatives
improve the energy efficiency of the economy.
Biomass-fired cogeneration also provides opportunities for CDM projects, particularly
areas, where wood residues, bagasse or crop stalks are available. In 2004 only 2.0 GWe
biomass-fired capacity was installed, but estimates indicate that this can increase to
in 202024.
Drivers Barriers
• Rapidly rising energy demand
• Power market restructuring
• Large CDM potential
• Government’s CDM policies prioritise energy projects
• Large potential for industrial efficiency improvement through CHP
• Continued government control of power sector and slow liberalisation
• Project developer must be local company
• Government ownership of CER revenue
• CER price regulation
• Lack of financing opportunities for CDM
24 Institute for Global Environmental Strategies, CDM Country Guide for China, 2005.

428
45
Prospects
The potential for CDM projects in China is the largest of any country in the world: a
of the global CER potential. A large part of the potential can be achieved through CHP
application in industrial energy efficiency and power generation projects. However, C
project implementation has been remarkably slow, with only 20 approved projects so fa
strong centralised control of the CDM process in China plays a major role in this, as well as
lack of funding for projects due to uncertainty and risks for potential investors. CD
implementation in China will undoubtedly accelerate in the future, but further clarif
liberalisation of CDM regulation in China is important.

429
6
1. IntroductionCogeneration is a cost-effective way of reducing CO2 emissions from power generation. The
combined use of the heat and power outputs of the generation process increases its
efficiency, and thereby reduces the fuel input and emission output. As a decentralise
(DE) technology, cogeneration also reduces transmission and distribution (T&D) losses.
Cogeneration is a flexible technology, which can use various fuels, and be adapted to
circumstances. The possibility of using biomass fuels or agricultural residues makes
Combined Heat and Power (CHP) particularly effective in reducing CO2 emissions.
Cogeneration technologies are well established, and therefore reliable and competitiv
most markets. Cogeneration is therefore a prime candidate technology for carbon emiss
reduction projects.
The Clean Development Mechanism (CDM) is part of the Kyoto Protocol for reducing glob
greenhouse gas (GHG) emissions to mitigate anthropogenic Climate Change. Opportunitie
for emission reduction are generally large in developing countries, so that these can be met at
lower costs than in developed countries. The CDM recognises this, and provides an
opportunity for developed countries (Annex I) to meet part of their GHG emission targ
through projects in developing countries (non-Annex I). This benefits Annex I countries by
reducing the cost required to meet their emission target, and benefits non-Annex I countries
by facilitating investment and technology transfer and sustainable development. Overa
approach aims to ensure that GHG emission targets are met quickly and cost-effectively.
CHP technologies are well suited for CDM projects, because they are generally economi
attractive and technologically mature and reliable, so that they contribute directly
aim of reducing GHG emissions cost-effectively. Furthermore, they are flexible and can be
adapted to local circumstances. In developing countries cogeneration can easily be in
in many industries, including food-processing, taking advantage of the biomass residues of
the production process. This has the dual benefits of lowering fuel costs and solving
issue. Cogeneration projects address both energy supply-side and demand-side, and
therefore have a wider impact than most CDM technologies. Furthermore, they provide a
long-term solution, as the resulting CO2 savings are reliable and predictable over the project’s
lifetime, unlike some other project types.
This report discusses the implementation of CHP projects within the CDM. It aims to p
practical guide for CDM project participants, outlining the CDM’s organisational struct
(Chapter 2), and describes the project cycle for cogeneration projects (Chapter 3). L
outline the present status of CHP in the CDM and country-specific information for Brazil,
China and India (Chapter 4).

430
47
Other relevant organizations
Currently the only India-based DOE accredited for project validation and emission reduction
verification is the Indian Council for Forestry Research and Education, which only deals with
afforestation projects. However, the NCA is expected to establish DOEs in other secto
well to support local projects and reduce procedural costs. These would be relevant f
cogeneration projects.
Most CDM projects in India are small-scale projects, which require bundling to keep CDM-
related costs down. Several local bundling organisations have therefore emerged, most
notably the Small Industries Development Bank of India and National Bank for Agriculture and
Rural Development. These banks have strong links to small food production and process
and can therefore provide valuable services for CHP projects in the sugar industry an
food manufacturing.
The NCA has been working closely with other stakeholders through sectoral initiatives,
education and training. Organisations currently involved in the CDM in India include
industry bodies, NGOs, Consulting firms, ESCOs, private and public sector companies,
International development organisations and International lending institutions.
Sustainability Criteria
TABLE 18:SUSTAINABILITY CRITERIA FOR CDM PROJECTS IN INDIACategory Criteria
Environmental Sustainability Environmental Impact Assessment
Economic Sustainability Additional investment consistent with local needs
Social Sustainability Generate employment
Remove social disparities
Improve quality of life
Technological Sustainability Technology transfer
INSTITUTE FOR GLOBAL ENVIRONMENTAL STRAT EGIES, CDM COUNTRY GUIDE FOR CHINA, 2005.
The sustainability criteria used by the NCA to evaluate submitted CDM projects focus
social benefits of the project (table 18). CDM projects are expected to have a direct
effect on the lives of the local community, and promote development. This shows the
importance of using local skills and resources, and working with local partners. It a
suggests that CHP projects in food manufacturing using local biomass, like the sugar
industry, are well-positioned for CDM approval.
The economic criterion for additional investment is also important, and implies that th-
related investment must be additional to normal Official Development Assistance (ODA
Country approval application process
Table 19 shows the documents required for submitting a project for CDM approval in India. A
Project Concept Note, as well as the PDD must be submitted, together with any support
documents.

431
48
TABLE 19:REQUIRED DOCUMENTATI ON FOR NATIONAL APPR OVAL IN INDIA
Electronic copy of the Project Concept Note (PCN)
Electronic copy of the PDD
20 hard copies of the PCN and PDD each
Supporting documents
Two CDs containing all information
Cover letter signed by the project developers
INSTITUTE FOR GLOBAL ENVIRONMENTAL STRAT EGIES, CDM COUNTRY GUIDE FOR CHINA, 2005.
The documents submitted are
circulated among the members of the
NCA for initial evaluation, and the
developer is invited to present the
proposal, so that NCA members can
ask for clarification. Simultaneously
NCA members and experts assess
the PDD in detail, producing an
assessment report (figure 17). The
NCA will check that the CER revenue
is additional to ODA (i.e. they are not
sold to an organisation using ODA
funds). Once the NCA is satisfied,
Host Country Approval is granted.
There is no indication of the length of
the process.
Government Incentives
The Indian government considers the
CDM as a promising opportunity to
achieve its sustainable development
goals and attract foreign investment.
It therefore offers a number of
incentives to promote CDM projects
in the country. For CHP projects the
most important of these are:
Biomass cogeneration incentives
• National Programme on Promotion of Biomas Power/Bagasse-based CHP (capital grants and interest subsidies)
• 80% depreciation on cogeneration equipment may be claimed in first year
• 5-year tax holiday with 30% exemption for projects with power purchase agreement
Renewable Energy
• Customs duty for RE projects <50MW of 20% ad valorem
• Central sales tax exemption, and general sales tax exemption in certain states
• Minimum purchase rates of Rs. 2.25 per unit (all renewable energy sources)
• Encouragement of bundling to bring down transaction costs
• Incentives to promote rural energy generation and village electrification
Financial and legal arrangements
The general investment climate in India is good, which facilitates Foreign Direct Inv
(FDI) in CDM projects. The governments promotes FDI through the Foreign Investment
FIGURE 17: THE PROJECT APPROVAL PROCESS IN INDIA
INSTITUTE FOR GLOBAL ENVIRONMENTAL STRAT EGIES, CDM COUNTRY GUIDE FO R CHINA, 2005.

432
49
Promotion Board and Foreign Investment Implementation Authority. No government approv
is needed, Indian capital markets are freely accessible, and tax incentives are avail
investment in the power sector.
A more problematic issue is the legal status of CERs in Indian law. They are defined
“intangible assets that can be traded and transferred”, but their ownership is not cl
defined. Investors have avoided this uncertainty through clear contractual arrangements with
the project developers about the ownership rights of the CERs. However, the taxation
CERs is still unclear too, hampering CDM investment.
POTENTIAL FOR CHP PROJECTS IN THE CDM ININDIA
Cogeneration status and potential
In India CHP facilities represent 16% of total
installed capacity (18.7 GWe), and generate
12.1% of the country’s electricity25. Most of this is
located in food manufacturing plants, particularly
in the sugar sector. There is therefore already a
strong tradition and expertise with bagasse
cogeneration, but in other sectors cogeneration is
also used. The total potential for cogeneration is
estimated at 20,000 MWe, most of which is in the
food processing sector (table 20).
CDM status and potential in India
TABLE 21: CDM STATUS IN INDIA
Approved Projects Installed Capacity (MWe)
GHG Emissions Reductions (t/yr)
All CDM projects 104 - 10,975,109
CHP projects 23 298.5 1,295,246
Sugar 8 91.8 340,526
Iron and Steel 7 158 653,466
Textiles 3 13.0 75,804
Pulp and Paper 1 3.0 14,744
Other 4 32.7 210,706
WADE, 2006
India represents almost one-third of all registered CDM projects, and over one-third of
registered CHP projects. Initially most projects were in sugar mills, but throughout
range of projects has diversified (table 21). The sugar sector still has most registered pro
but represents only 26% of GHG emissions reductions from approved projects, as most
projects are small Since May various waste-heat driven energy generation projects in industry
have been registered, lead by the iron and steel sector, which now represents over hal
registered emission reductions.
25 WADE, DE World Survey 2006.
TABLE 20:CHP POTENTIAL IN INDIA BY SECTOR
Sector Potential (MWe)
Sugar 3,000
Iron and Steel 1,000
Dairies, Breweries and Distilleries
2,500
Pulp and paper 800
Rice mills 1,100
Textiles 800
Cement 800
Fertiliser 1,200
MNES ANNUAL REPORT, 2004.

433
50
FIGURE 18: CDM POTENTIAL IN INDIA
India - CHP and CDM Potentials
0
500
1000
1500
2000
2500
3000
3500
Sugar Iron &
Steel
BeveragesRice millsTextiles Pulp &
Paper
Cement Fertiliser
Sector
CHP Potential (MWe)
0
1
2
3
4
5
6
7
8
CDM Potential (Mt/yr)CHP Potential
CDM Potential
INSTITUTE FOR GLOBAL ENVIRONMENTAL STRAT EGIES, CDM COUNTRY GUIDE FOR CHINA, 2005.
Figure 18 shows that the CDM potential mirrors energy use in India: 65-70% of India’s total
energy use by 7 sectors: cement, pulp & paper, fertiliser, iron & steel, textiles, al
refineries, all of which can benefit from CHP. The food sector is still the most significant, but
many large industrial energy recovery projects are attractive as well. For food-processing
cogeneration represents a large share of the CDM potential, while for industrial ener
efficiency many more technologies and measures can deliver emission reductions, so
cogeneration is a smaller segment of the total potential. However, potentials in indu
generally larger, so the opportunities for CHP are still significant.
Drivers Barriers
• Large demand for new generation capacity
• Low reliability of grid electricity
• Strong government support for CDM
• Good investment climate
• No clear time-limit on approval process
• No clarity on ownership rights of CERs
• Uncertainty about the taxation of CERs
• CDM transaction costs
Prospects
The potential for cogeneration projects in the CDM in India is substantial, particularly
industrial and food manufacturing applications. Furthermore, the long tradition of ba
CHP makes such projects relatively low-risk. However, there is no clarity yet about the legal
and fiscal status of CERs, and the approval process and related costs. This needs to
resolved to reduce risks and make CDM more attractive for investors.

434
51
4.6 Neglected CHP project opportunities
The number of registered cogeneration projects in the CDM has been gradually increasing,
representing around 20% of all projects, including biomass-fired applications in food-
processing and waste heat recycling in industry. There are many more possible applica
of cogeneration in the CDM, though, which are maybe not as established as the current
project types, but represent large future opportunities nonetheless. Below three such
neglected opportunities are discussed briefly.
COGENERATION IN BUILDINGS AND CCHP APPLICATIONS
Building-integrated CHP (BCHP) is not as common as industrial cogeneration applications,
but it can deliver similar benefits. The on-site generation of heat and power, rather than using
heat-only boilers and grid electricity can reduce energy costs and increase supply rel
residential and commercial buildings, just as it does for industrial plants. Building
represent a significant portion of a country’s energy consumption, so the overall pot
large. Furthermore, buildings are well suited for CCHP systems as well, because much of the
energy consumed is often for cooling purposes. WADE research has indicated that the
potential emission reductions from BCHP in China are 135 Mt CO2 eq/yr in 2020, and 40 Mt
CO 2 eq/yr in 2020 in India26.
BCHP projects can easily be made eligible for the CDM. The emission reductions compared
to a baseline of continued use of grid electricity and heat-only boilers can be calculated in
very much the same way as for other natural gas cogeneration projects (methodology
AM0014). The case for additionality is possibly even stronger than for industrial cogen
projects, because BCHP and CCHP are less common, and can face more significant cost
barriers and regulatory obstacles.
EMISSION REDUCTIONS FROM ON-SITE GENERATION
One of the main advantages of cogeneration and other on-site generation is the avoidance of
losses in the electricity network. However, most approved methodologies for CHP proje
assume that this is negligible, and no emission reductions are credited for this. It uld be
possible, though, to develop a methodology that includes the emission reductions resu
from avoided network losses due to on-site generation of electricity. The calculation of
emission reductions can be based on the total amount of grid electricity used, the average
T&D losses of the local electricity network, and the average CO2 emission factor of the grid
electricity, as shown in the example below.
Calculating the CO2 emission reductions from avoided T&D losses
This simplified example considers the CO2 emission reductions from a hypothetical on-site
generation project at an industrial facility in India. If we assume the facility curr
GWh/yr of grid electricity, local network losses are 20% and the average emission fac
the supplied electricity is 600t CO2/GWh, then the resulting emission reductions from on-site
generation of the same amount of electricity are:
40 GWh/yr * 0.20 * 600 t CO2/GWh = 4800 t CO2/yr
26 WADE, Building Integrated Cooling, Heat and Power for Cost-Effective Carbon Mitigation, 2005.

435
52
The example shows that the emission reductions from avoided T&D losses are relatively
small, unless the total electricity consumption and gird losses are large. Emission r
through on-site generation are therefore maybe not attractive as a stand-alone methodology,
but it can form an important part of other methodologies for on-site generation projects. The
incorporation of T&D losses in other methodologies would recognise one of the key ben
of on-site generation, and the additional emission reductions could improve the econom
viability of decentralised energy projects.
COGENERATION REPLACING CCGT
Cogeneration projects currently registered for the CDM have particularly focussed on
CHP, so that fossil-fuel cogeneration has been very much neglected. There is one
methodology for natural-gas based cogeneration (AM0014), but this is a very specific case,
and the only relevant project in Chile has not been submitted to the CDM-EB yet. The
potential for emission reductions from fossil-fuel CHP projects is significant, but for the
number of applications to rise a general methodology for fossil-fuel cogeneration projects is
required.
A methodology for fossil-fuel based cogeneration can be based on methodology AM0014, but
it would also make sense to develop a methodology for CHP replacing CCGT, as there is
already a methodology for conversions from single cycle to combined cycle power genera
(ACM0007). The upgrade from CCGT to cogeneration is a similar improvement of efficien
of the generation system, so that the new methodology could be based on the existing
methodology.
4.7 Outstanding issues for the CDM
The CDM has only been operating for less than a year, so many of the procedures are s
being developed, and the experience of implementing projects is limited. This means t
there are some issues that have not been resolved fully, and need to be clarified to make
CDM successful.
THE CDM CREATES ADDITIONAL EMISSION ALLOWANCES
FIGURE 19:CERS AS ADDITIONAL EMISSION ALLOWANCES
WADE, 2006, ADAPTED FROM INSTITUTE FOR GLOBAL ENVIRONMENTAL STRATEGIE S
One problem with the CDM is that it creates additional emission allowances for Annex
countries on top of the targets set by the Kyoto protocol. This results from the fact
CERs are added to the total emission cap of the Annex I countr

436
53
project host countries do not have emission reduction targets, so any emission reductions
from a CDM project are effectively raising the emission target for the Annex I countr
involved, because it does not have to make those reductions at home anymore (figure 1
The response to this claim is that globally it is unimportant where the emission reductions are
made, so reductions in the emission growth from non-Annex I countries are equally significant
as reductions in Annex I countries. However, the additional emission allowances creat
the CDM still undermine the conceptual aims of the Kyoto Protocol, and can harm the
credibility of the mechanism and the CER market.
ADDITIONALITY OF CDM PROJECTS DIFFICULT TO PROVE
The most problematic aspect of the CDM is the additionality principle, for several re
Firstly, additionality must be proven in comparison with baseline alternatives. However, t
alternatives to the project activity will not be implemented, and are therefore hypot
scenarios. It is possible to make reasonable assumptions for these baselines, but even then it
is possible that the actual scenario in the absence of the project activity would hav
different.
Secondly, the methodologies for comparing baselines with the project activity to esta
additionality entail many uncertainties. The strongest part of additionality assessment is the
economic analysis, but even here many of the input data must be based on assumptions
instance, capital investment costs can often be estimated relatively accurately, but
costs, and particularly fuel costs are fairly unpredictable. For other additionality assess
methods, like barrier assessment, the results are more speculative. It is very diffic
that a project faces particularly barriers for implementation, and that the removal of these
particular barriers would make the project viable, and that the CDM would remove these
barriers. In reality barriers to project implementation are multi-dimensional, and they are
linked and influence each other. The removal of a single barrier may therefore be necessary
for project viability, but it is hard to prove that it is sufficient.
Due to these problems in establishing project additionality it is likely that some CD
are not strictly additional, particularly projects that have been operating before the CDM
became operational in 2005. The fact that these project were already implemented sugg
that they are the baseline, rather than an additional alternative.
POLITICAL UNCERTAINTY: POST-KYOTO ARRANGEMENTS
The future development of the CDM is generally thought to be promising, but a number of
uncertainties remain. On a political level it is not yet clear what kind of climate c
agreement will emerge in 2012 after the first commitment period of the Kyoto Protocol
Negotiations are still taking place, and the main questions are whether the US will be
involved, and whether developing countries will adopt emission caps. American partici
would be a huge boost for the CDM, as it would raise the expected demand for CERs, an
increase prices. The effect of emission caps for developing countries is more complica
predict, because emission reductions currently in the CDM would then also have be use
meeting targets in the host countries themselves. This would not have to mean the end of the
CDM, but it would be more like the Joint Implementation mechanism. It is therefore
conceivable that the two will merge in the future.

437
54
Whatever happens after Kyoto, any future global climate agreement is likely to includ
international trading and project implementation mechanisms such as JI and CDM, because
these are supported by all major parties in the negotiations.
FINANCIAL UNCERTAINTY: CARBON MARKETS AND CARBON PRICES
For investors the main problem with the CDM is its financial uncertainty. The risks related to
the CDM’s procedures, their costs, and the CER delivery risk still put off many finan
organisations from investing in CDM projects. For project developers the availability
funding is therefore limited, a problem the CDM was supposed to solve.
The future development of the carbon market is a second issue for investors. The esti
for the size market range widely, as do projections of carbon prices. The supply of C
mostly determined by the functioning of the CDM mechanisms and the carbon price, because
the potential for emission reduction projects in non-Annex I countries is huge. The demand
depends mostly on the emission caps set for Annex I countries, and the potential to m
these at home. Both demand and supply obviously influence the carbon price. For instance,
when the US announced not to ratify the Kyoto Protocol the projections for carbon pri
suddenly fell, because demand for CERs from the US would have been large. Furthermore
when it became clear in May 2006 that the emission caps for industries within the EU ETS
were much more generous than intended, the European carbon price fell, because supply
emission allowances was much larger than previously thought.
In the context of the uncertainties in future carbon market trends it is important to realise t
the CDM is not the only source of emission reduction certificates, and must therefore
with other sources. Annex I countries have various options for meeting their reductio
Initially they will try to meet their commitments at home, if cost-effective. If it is deemed
necessary to buy emission reductions abroad they can use the CDM or the JI, but they
also directly buy reduction certificates from other Annex I countries that manage to reduce
emissions below their target. However, the mechanisms making emission reduction
certificates from the different schemes compatible still need to be specified to crea
carbon market.
There are large amounts of emission reduction certificates available from former Soviet
countries, as their targets are based on their emissions before the break-up of the USSR.
These targets are therefore much higher than their actual projected emissions, so the
have many emission reduction credits available to sell to other Annex I countries. This ‘ho
is a major concern for the future development of the CDM, because it not only represe
competing source of emission reductions, but also undermines the credibility of the c
market.
Much of the current uncertainties of the CDM are the ‘toothing problems’ experienced
new global initiative. They can be resolved as project experience increases, the CDM
procedures become established, and trust in CER markets becomes stronger. To make this
happen it is important that all parties involved in the CDM have the political will t
towards the aim of the mechanism, and to make it a success.

55
5. ConclusionThe CDM provides a major opportunity for cogeneration projects in developing countries. The
necessary conditions for cogeneration often do exist in these places, but project
implementation is hampered by lack of experience or resources. The CDM can alleviate
problems by facilitating knowledge and technology transfer from Annex I countries, and giving
the projects an additional source of revenue through CERs.
The CDM EB has established the general procedures for the CDM, though details still h
be specified. After initial screening of the project activity, the developers must compose a
PDD, explaining the activity and its impacts, identifying the alternative scenarios,
establishing baseline methodologies and additionality. The PDD then has to be approve
the host country and validated by a DOE before it can be registered at the EB. During the
project activity the developer has to monitor the emissions from the project based on
methodology of the PDD, in order to calculate the achieved emission reductions. Once
are verified by a DOE and certified by the CDM EB, CERs are issued, and can be sold to
Annex I parties.
Currently the number of cogeneration projects in the CDM is about 20% of all register
projects, but most are smaller than the average CDM projects, so their share of emiss
reductions is smaller. Brazil and India are leading in implementing CHP projects, but more
countries are becoming involved. Most early projects were in small food manufacturing
and biomass fired, but recently a number of large industrial waste-heat recycling projects
have been registered too.
The potential for future cogeneration projects in the CDM is significant. Developing
have both large CDM and CHP potentials, and many projects can be readily implemented
The main two existing opportunities are biomass-based cogeneration in the food-processing
sector, and industrial energy efficiency improvements through cogeneration, as shown
cogeneration projects already registered. A number of different CHP project types als
significant potential in the CDM, including building-integrated CHP, but these have so far
been neglected. In addition to India and Brazil the main potential for cogeneration p
the CDM is in China, mostly in large industry. Other countries, like Indonesia and Ch
also attractive for developing cogeneration projects.
The overall prospects of the CDM in general, and cogeneration projects within it, are
very positive, and the mechanism will undoubtedly continue to grow as the global carb
market expands. The CDM still faces a number of issues, though, primarily relating to th
reliability of the additionality assessment and the uncertainties involved in the pro
These issues can be solved, though, and as the CDM matures confidence in the system w
grow. The main challenge to achieve this is to get all players involved working toward
overall aims of the CDM: reducing global carbon emissions and promoting sustainable
development.

439
56
Glossary
Additionality Principle– The requirement for CDM projects that ‘the reduction of emissions
through the CDM project must be additional to reductions that would occur wi
the CDM project’.
Annex I country– Country signed up to the Kyoto Protocol that has a GHG emission cap.
Baseline Methodology– Methodology for assessing the scenario and emissions for a
project in absence of the CDM project activity.
Certified Emission Reduction (CER)– Tradable emission reduction certificates issued to
CDM projects for GHG emission reductions achieved.
Clean Development Mechanism (CDM)– Mechanism that allows Annex I countries to meet
part of their emission reductions through projects in non-Annex I countries.
CDM Executive Board (CDM-EB) – International supervisory board for the CDM, operated
by the UNFCCC.
Combined Heat and Power (CHP)– The combined thermal generation of heat and electricity
for local use.
CO 2 equivalent (CO2-eq)– The effective global warming effect of a GHG expressed in the
amount of CO2 with equivalent warming effect.
Conference of the Parties (COP)– Annual meeting of the Parties of the Kyoto Protocol.
Since ratification of the Protocol in 2005, this is combined with the Meetin
Parties (MOP) of countries that have ratified the treaty.
Crediting Period– The period over which CERs are issued for a CDM project.
Decentralised Energy (DE)– Electricity generation at the point of use.
Designated National Authority (DNA)– National supervisory organisation, which regulates
and manages the CDM procedures and implementation in a county.
Designated Operational Entity (DOE)– Independent organisation accredited by the CDM-
EB to validate the baseline methodology for CDM projects, and verify the emi
reductions achieved.
EU Emissions Trading Scheme (EU ETS)– European market-based mechanism that
distributes emission quota between major GHG emitting industries, and allows
trade between these to meet emission caps cost-effectively.
First Commitment Period– First period during which Annex I countries must meet their
emission caps (2008 – 2012).
Greenhouse Gas (GHG)– Chemical substance, which has a net positive global warming
effect when released into the atmosphere. GHGs covered by the Kyoto Protocol
are: CO2, CH4, N2O, HFCs, PFCs and SF6.
‘Hot air’– Excessive emission quota of former Soviet Union countries, which do not account
for the sharp reduction in economic output during the collapse of communism.
Joint Implementation (JI)– Mechanism that allows Annex I countries to meet part of their
emission reductions through projects in other Annex I countries.
Kyoto Protocol– International agreement adopted at the 3rd COP in Kyoto in 1997, which
quantifies emission reduction targets and establishes the mechanisms to redu
global GHG emissions.
Leakage – ‘Net change of GHG emissions which occurs outside the project boundary and
which is measurable and attributable to the CDM project activity’.
Marrakech Accords– Agreements adopted during the 1st meeting of the CDM-EB at COP 7
in 2001 in Marrakech, which specify the procedures and rules for the CDM.
Monitoring Methodology– Methodology for monitoring the GHG emissions from CDM

440
57
projects during project operation, including measurement of data required fo
calculating the GHGs that would have been emitted in absence of the project
activity.
Non-Annex I country- Country signed up to the Kyoto Protocol that does not have a GHG
emission cap.
Project Boundary– ‘All anthropogenic GHG emissions by sources under control of the
project participants that are significant and reasonable attributable to the
project activity’,
Project Design Document (PDD)– Standard document describing the project activity,
baseline methodology and emission reduction calculations for CDM projects.
Project Validation– Evaluation of the PDD of a CDM projects by a DOE, which checks its
compliance with CDM procedures and requirements.
Project Verification– Evaluation of the Monitoring Report of a CDM project by a DOE, whic
checks the emission reductions achieved by the project.
Small CDM project (SCC)– CDM project with a energy output or efficiency gain equivalent
to 15MW.
United Nations Framework Convention on Climate Change (UNFCCC)– International
convention, which aims for ‘stabilisation of GHG concentrations in the atmos
at a level that would prevent dangerous anthropogenic interference with the
climate system’.

441
58
CDM Information, Links and Sources
Comissão Interministerial de Mudança Global do Clima (CIMGC)– Brazilian DNA, with
country-specific information for Brazil.
www.mct.gov.br
CD4CDM – Online platform for CDM capacity building, established by the UN Environmen
Programme and the RISO Centre. The site gives access to a large range of publications
CDM procedures, baseline methodologies, economic issues and environmental impacts.
Probably the most useful source for CDM project proponents.
http://cd4cdm.org
CDM Brazil– Online platform established by the Environmental Department of the German
Chamber of Commerce with information about the CDM in Brazil.
http://www.ahk.org.br/cdmbrazil
CDM India– Website of India’s National CDM Authority, providing all information requi
developing CDM projects in the country.
http://cdmindia.nic.in/
China Office of National Coordination Committee on Climate Change– The Chinese
government’s CDM website with information about China’s CDM procedures.
http://cdm.ccchina.gov.cn/english
Institute for Global Environmental Strategies (IGES)– IGES has done extensive research
on the CDM, and published a wide range of useful documents, including general guidanc
documents and CDM studies for Asian countries.
http://www.iges.or.jp
Kyoto Mechanims Information Platform– Online Platform hosted by the Kyoto
Mechanisms Acceleration Platform of the Japanese government. Informtion includes CDM
news, introductory guides, and links to other sources.
http://www.kyomecha.org
Pembina Institute for Appropriate Development– The Pembina Institute has published
both general guides and country-specific documents on the CDM.
http://www.pembina.org
Point Carbon– The main source for information on the CER and carbon market, including
price trends and future potentials. Much of the information is for subscribers only,
http://www.pointcarbon.com
United Nations Framework Convention on Climate Change (UNFCCC)– The UNFCCC
CDM website provides guidance of all CDM procedures and regulations, an up-to-date
overview of registered projects, and information about country DNAs and accredited DOEs.
http://cdm.unfccc.int/

442
1
Lessons from submission and approval process of large-scale energy efficiency CDM methodologies
Perspectives Climate Change GmbHDaisuke Hayashi, Axel Michaelowa January [email protected] www.perspectives.cc
Paper submitted to the UNIDO/CTI/UK Trade and Investment Seminar on Energy EfficiencyProjects in CDM and JI Vienna, 19 – 22 March 2007
Lessons from submission and approval process of methodologies -Mr. Daisuke Hayashi - Perspectives Climate Change GmbH

443
2
Lessons from submission and approval process of large-scale energy efficiency CDM methodologies
Daisuke Hayashia,*, Axel Michaelowaa
a Perspectives Climate Change, Bei der Apostelkirche, 20257 Hamburg, Germany
Abstract: The Clean Development Mechanism (CDM) so far has failed to mobilize asubstantial amount of energy efficiency projects. As of December 2006, less than 4%of credits come from this category. This is due to the fact that only a fewmethodologies for setting of baselines and monitoring project emissions have been approved by the CDM Executive Board (EB). While energy efficiency methodologies have the highest share of methodology submissions, they also suffer from the highest rejection rate. Just 27% of energy efficiency methodology submissions have been approved or consolidated. The applicability of those methodologies is typically narrow and the requirements for monitoring are heavy. Industrial efficiency improvements (e.g. waste heat recovery) are covered relatively well, whereas there are glaring gaps with regards to electricity generation and transmission as well astransport. Demand-side management in households and commercial buildings so far has not been covered either. The Methodology Panel (MP)/ EB have not been willing to accept empirical models and performance benchmarks as a basis for baseline emission determination. We see some inconsistencies in decision-making of the MP/EB particularly with respect to the underlying baseline approach, treatment of rebound effects and endogenous energy efficiency improvement, and additionality assessment of programmatic CDM. A key challenge for energy efficiency projects isdetermination of additionality; attempts to focus on the barrier analysis only have been rejected by the MP/ EB. A new challenge comes up in the context of programmatic CDM which could give a boost to demand-side activities if the rules are less cumbersome than those for single projects. Here, the application of the additionality test again becomes crucial.
Key words: Clean Development Mechanism, Energy efficiency improvement,Baseline and monitoring methodology, Additionality
Acknowledgement: This paper was prepared for the “Future CDM” project, funded by Ministry of Economy, Trade, and Industry (METI), Japan.
* Corresponding author. Tel: +49 40 87 88 07 56; fax: +49 89 14 88 28 08 22. E-mail address: [email protected] (D. Hayashi).

444
3
1. Introduction
The CDM has failed so far to live up to its potential for materializing the vast opportunities of energy efficiency improvement in non-Annex I countries. As ofDecember 2006, 469 projects have been registered by the EB, only 50 of which areenergy efficiency projects. Dwarfed by projects which reduce industrial gas emissions, e.g. HFC-23 and N2O, the share of CER generation till 2012 from registered energyefficiency projects is only 3.6%, or 25 MtCO2eq.
Figure 1. Number of and CERs till 2012 from registered projects by project type (December 2006) Source: UNFCCC (2006a) and authors’ calculation
Energy efficiency CDM projects have faced several major challenges, notably regarding baseline and monitoring methodology development and additionality assessment. Project developers have so far focused on methodologies that do not generate problems with additionality assessment, have low costs of data collection, and restrict applicability of the methodology to a very specific project type and host country. Consequently, methodologies for complex project types with severalemissions streams, several locations, indirect effects and a wide project boundary have not been submitted. Energy efficiency methodologies, especially demand-sideones, typically fall into such a complex category. This has lead to the highest rejectionrate of energy efficiency methodologies among all types of methodologies submitted to the EB. Moreover, technologies which generate revenues through products that can be sold on the market, including energy efficient technologies by saving energy, have had problems in demonstrating additionality (see Michaelowa and Hayashi 2006).
This paper analyzes the submission and approval process of energy efficiency methodologies and gives recommendations regarding future methodology development and additionality assessment of energy efficiency projects.
Forestry1Industrial gases
14
Fuel switch10
Renewable energyfor user
17
Energy efficiency50
Fugitive emissions147
Renewable electricity for grid
230
Forestry0.0%
Industrial gases62.2%
Renewable energyfor user1.2%
Energy efficiency3.6%
Fuel switch0.5%
Renewable electricity for grid
14.8%
Fugitive emissions17.7%
Number of registered projects, 469 CERs till 2012 from registered projects, 697 MtCO2eq

445
4
2. Overview of small-scale energy efficiency methodologies
There are currently 21 small-scale (SSC) methodologies approved by the EB, of which six are applicable to energy efficiency projects:
1. AMS-II.A.: Supply side energy efficiency improvements for transmission and distribution;
2. AMS-II.B.: Supply side energy efficiency improvements – generation; 3. AMS-II.C.: Demand-side programmes for specific technologies; 4. AMS-II.D.: Energy efficiency and fuel switching measures for industrial
facilities;5. AMS-II.E.: Energy efficiency and fuel switching measures for buildings; and 6. AMS-II.F.: Energy efficiency and fuel switching measures for agricultural
facilities and activities.
No new SSC energy efficiency methodologies have been approved since the lastanalysis in August 2005 (see Müller-Pelzer and Michaelowa 2005).1 While they haverepeatedly been revised, the revisions only reflect changes in the methods to calculate the electricity grid emission factor and definition of thresholds for SSC projects. Therefore, the following analysis will focus on the submission and approval processof large-scale energy efficiency methodologies.
3. Overview of large-scale energy efficiency methodologies
This chapter gives an overview of large-scale energy efficiency methodologies, first, in form of a summary and then in a detailed evaluation to give a thorough picture of these methodologies.
3.1. Evaluation status of large-scale methodologies
As of December 2006, 202 large-scale New Methodologies (NMs) had been submitted to the EB. After evaluation of these submitted methodologies, the EB has made available 38 Approved Methodologies (AMs) and 10 Approved Consolidated Methodologies (ACMs). Figure 2 shows a wide variety of submitted methodology types. However, most of them are designed for a specific technology/ measure or a host country. As discussed above, only a few widely applicable methodologies have been approved so far.
Importantly, the energy efficiency category has received the largest number of methodology submissions (81) as well as the highest rejection rate by the EB (48%). Despite the continuous efforts of the methodology developers, the rejection rate has not been improved significantly over time. Because application of AMs or ACMs is mandatory to submit CDM projects to the EB, the lack of suitable methodologies hasbeen a major hurdle for energy efficiency projects. The next section will focus onlarge-scale methodologies for energy efficiency projects and give an overview of their submission and approval status.
1 Refer to Müller-Pelzer and Michaelowa (2005) for lessons from approved SSC methodologies.

446
5
0
10
20
30
40
50
60
70
80
90
Energyefficiency
Fugitiveemissions
Renewableelectricity for
grid
Renewableenergy for user
Industrial gases Fuel switch Misc.
PendingWithdrawnConsolidatedRejected (C)Revision (B)Approved (A)
Figure 2. Status of large-scale methodology evaluation (December 2006) Source: UNFCCC (2006b) and authors’ calculation
3.2. Evaluation status of large-scale energy efficiency methodologies
As of December 2006, the following 81 methodologies had been submitted for energy efficiency project activities (including 16 resubmissions upon C ratings). In Table 1, these methodologies are categorized into seven types according to the six SSC energy efficiency methodology categories with an addition of “energy efficiency and fuelswitching measures for transport.”2
Out of the 81 energy efficiency methodologies submitted, 13 have been approved as AMs (A ratings), nine consolidated to ACMs, 39 rejected (C ratings), two withdrawn, and 18 are still in process. The last category includes nine methodologies which the EB has not made final decisions on (pending) and nine methodologies where theproject participants have received B ratings.
2 Transport methodologies are commonly much broader than “energy efficiency and fuel switching.”However, the category is set as specified for convenience.

447
6
Table 1. Status of large-scale energy efficiency methodology evaluation (December 2006)
Methodology Status Typea
NM0003: Construction of new methanol production plant (called: M 5000) C 4NM0017-rev: Steam efficiency improvements by replacing steam traps and reusing hot-water condensate
A (AM0017) 4
NM0018-rev: MGM baseline methodology for natural gas based package cogeneration
A (AM0014) 2
NM0031-rev2: OSIL baseline methodology for electricity generation projects from utilization of waste heat from waste gases
Consolidated(ACM0004) 4
NM0033: Baseline methodology for cement kiln replacement Withdrawn 4
NM0037-rev: IGFL baseline methodology for steam optimisation system A (AM0018) 4
NM0042-rev: Water pumping efficiency improvement A (AM0020) 4
NM0044: Power factor improvements C 4 NM0045-rev2: BCL methodology for GHG emission reduction in cementindustry
Consolidated(ACM0005) 4
NM0046: Simplified project-level least cost and scenario analysis for the rehabilitation of district heating systems C 1
NM0047-rev: Baseline methodology for project activities that substitute Ordinary Portland Cement (OPC) with blended cement/ fossil fuels withalternative fuels in cement kilns
Consolidated(ACM0005) 4
NM0049: Combined margin methodology applied to electricity grid (BOF gas waste heat recovery) C 4
NM0052: Public transport sector energy efficiency and modal change baseline C 7
NM0058: Heat supply baseline in China for district heating based on surplus heat from power production C 1
NM0059: Methodology for energy co-generation from steel making gasrecovery C 4
NM0064: Methodology for electronic energy consumption reduction in steel making process C 4
NM0070: Open cycle to combined cycle gas turbine conversion connectedto an economically dispatched, centrally controlled grid
Consolidated(ACM0007) 2
NM0071-rev: Avoiding flaring of waste gases from steel manufacturingoperations and its utilization for substituting GHG intensive fuel in power generating units and/ or generating power to supply to grid
C 43
NM0072: Energy efficiency through mandatory national-level appliancestandards Withdrawn 3
NM0074: Baseline methodology for technological improvements in industry C 4 NM0077: Fuel switching and changes in self-generation and/ or cogeneration at an industrial facility C 4
NM0078-rev: Conversion from single-cycle to combined-cycle power generation
Consolidated(ACM0007) 2
NM0079-rev: Baseline methodology for greenhouse gas reductions through waste heat recovery and utilisation for power generation at cement plants
A (AM0024) 4
NM0080-rev: Baseline methodology for grid connected electricity generation plants using non-renewable and less GHG intensive fuel
A (AM0029) 2
NM0086: Baseline methodology for project activities involving energy efficiency, self-generation, cogeneration, and/ or fuel switching measures atan industrial facility
C 4
NM0087: Baseline methodology for electricity generation using waste heatrecovery in sponge iron plants
Consolidated(ACM0004) 4
NM0088: Baseline methodology for electricity production from waste energy recovery in an industrial or manufacturing process
Consolidated(ACM0004) 4
3 Resubmission of NM0049.

448
7
NM0089: CECL methodology for power generation for captive use, which is grid connected, using non-renewable and less GHG intensive fuels C 2
NM0092-rev: Baseline methodology for energy efficiency on electricity and fossil fuel consumption through technological improvements in the metal production industry through smelting
C 4
NM0095: Methodology for increase of additive percentage in PPC blendedcement
Consolidated(ACM0005) 4
NM0096: Energy efficiency improvements in district heating production and distribution C 14
NM0097: Improvement in recovery of waste biomass from process streams and use of that biomass in energy generation C 4
NM0099: Energy efficiency improvement in process and manufacturing industries C 4
NM0100: Activities for the promotion of electricity efficiency, through the replacement of unitary equipment, by parties that are not the energy consumers
C 3
NM0101: Grasim baseline methodology for the energy efficiency improvement in the heat conversion and heat transfer equipment system C 4
NM0103: Baseline methodology for district heating rehabilitation, possibly reducing use of in house devices C 15
NM0105-rev: Baseline methodology for bus rapid transit projects A (AM0031) 76
NM0106: Baseline methodology for optimization of clinker use in the cement industry through investment in grinding technology
Consolidated(ACM0005) 47
NM0107-rev: Baseline methodology for waste gas-based cogenerationsystem for power and steam generation
A (AM0032)
2 and4
NM0112-rev: Increased electricity generation from existing hydropower stations through decision support system optimization C 2
NM0113: Gas powered combined cycle cogeneration replacing coal based steam generation and grid electricity C 2 and
4 NM0114: Improved efficiency of electrical power system generation through advanced SCADA control systems and related Energy ManagementProtocol
C 2
NM0116: Reduction in the use of OPC for concrete mix preparation C 4 NM0118-rev: Introduction of integrated demand-side energy saving systemfor existing beer brewing system C 4
NM0119: Baseline methodology for energy integration project activities involving energy efficiency, self-generation, and/ or cogeneration measures at an industrial facility
C 48
NM0120: Demand-side electricity management for food retailers, supermarkets, hypermarkets, shopping centers and other similar commercialactivities
C 5
NM0122: Cogeneration at an industrial facility C 49
NM0123-rev: Methodology for use of non-carbonated calcium sources inthe raw mix for cement processing
A (AM33) 4
NM0128: Baseline methodology for modal shifting in industry for product/feedstocks C 7
NM0136: Reduction of technical losses in electricity distribution systems C 1NM0137: Energy efficiency improvements in cement industry C 410
NM0138-rev: Fuel switching from coal and/ or petroleum fuels to naturalgas and cogeneration at an industrial facility C 4
4 Resubmission of NM0058. 5 Resubmission of NM0046. 6 Resubmission of NM0052. 7 Resubmission of NM0074. 8 Resubmission of NM0086. 9 Resubmission of NM0077. 10 Resubmission of NM0099.

449
8
NM0141-rev: New cogeneration facilities supplying electricity and/ or steam to multiple customers B 2
NM0144-rev: Energy efficiency improvements carried out by an Energy Service Company (ESCO) through boiler rehabilitation or replacement
A (AM0044)
4 and5
NM0146: Baseline methodology for improved electrical energy efficiencyof an existing submerged electric arc furnace used for the production of silicomanganese
A (AM0038) 4
NM0150-rev: Lighting retrofit for residential use B 3 NM0153: Baseline methodology for grid connected electricity generationplants using Natural Gas (NG) / Liquefied Natural Gas (LNG) fuels
A (AM0029) 2
NM0154: Grasim baseline methodology for the energy efficiency improvement in the heat conversion and heat transfer equipment system B 411
NM0155-rev: Baseline methodology for waste gas and/or heat utilization B 4NM0157-rev: Methodology for DSM program switching from incandescentlamps to CFLs B 3
NM0158: GHG emissions reductions in urban transportation projects that affect specific routes or bus corridors or fleets of buses including where fuel usage is changed
C 7
NM0159-rev: Activities to increase market penetration of energy efficient appliances B 312
NM0160: Cogeneration at an industrial facility B 413
NM0161: Baseline methodology for gas powered cogeneration for anindustrial facility B 414
NM0163: Baseline methodology for project activities using alternative materials in clinker manufacturing to reduce GHG emissions in a cement kiln
A (AM0040) 4
NM0169: Baseline methodology for reducing GHG emission by efficientutilization of energy in the form of fuel, power and steam C 4
NM0171: Energy efficiency improvement through oil/ water emulsiontechnology incorporated into an oil-fired thermal and/ or electricity powerproduction facility
Pending 2
NM0177: Utilization of coke oven gas for cogeneration C 4NM0179: Waste gas and/ or waste heat utilization for ‘process steam’ generation or ‘process steam and power’ generation in an industrial facility Pending 4
NM0181: Introduction of a new primary district heating system B 115
NM0182: Improved efficiency of electrical power system generation through advanced SCADA control systems and related Energy ManagementProtocol Software (EMS)
C 216
NM0183: Baseline methodology for the GHG avoidance project through environment friendly technology in refinery/ petrochemical process C 4
NM0184: Improved heat rates and capacity enhancement of power plantthrough retrofit of equipment(s) such as retrofit of existing gas turbine for inlet air cooling
C 2
NM0186: Increased electricity generation from existing hydropower stationsthrough Decision Support System optimization Pending 217
NM0190: Baseline methodology for heavy fuel-oil trigeneration C 4 NM0192: Baseline and monitoring methodology for the recovery andutilization of waste gas in refinery facilities Pending 4
NM0195: Methodology for efficiency improvement in electricity generation by steam turbine replacement in a production facility where process steam is required for production
Pending 2
11 Resubmission of NM0101. 12 Resubmission of NM0072. 13 Resubmission of NM0122. 14 Resubmission of NM0113. 15 Resubmission of NM0096. 16 Resubmission of NM0114. 17 Resubmission of NM0112.

450
9
NM0197: Power saving through accelerated replacement of electrical equipment with variable load under a program of activities Pending 3
NM0199: GHG emission reductions through reduced energy consumptionof the furnace due to enhanced heat content of the raw material(s) input(s) to the furnace
Pending 4
NM0201: Modal shift for the transport of bulk goods within a two node network Pending 718
NM0202: Power plant rehabilitation and/ or energy efficiency improvement combined with an optional change in fuel mix Pending 2
a Methodology type definitions
1. Supply side energy efficiency improvements for transmission and distribution 2. Supply side energy efficiency improvements - generation 3. Demand-side programmes for specific technologies 4. Energy efficiency and fuel switching measures for industrial facilities 5. Energy efficiency and fuel switching measures for buildings 6. Energy efficiency and fuel switching measures for agricultural facilities and activities 7. Energy efficiency and fuel switching measures for transport Source: UNFCCC (2006b) and authors’ categorization
The number of energy efficiency methodologies by evaluation status is summarized in Table 3. Around three quarters of the energy efficiency methodologies have been submitted in category 4 (energy efficiency and fuel switching measures for industrial facilities) and 2 (supply side energy efficiency improvements - generation) together. The category 4 is the only category where the submissions have been relatively successful. However, again, applicability of the methodologies of this category is usually limited to a specific technology. Attempts to achieve wider applicability incorporating multiple technologies or measurements have been unsuccessful so far(e.g. NM0099, NM0119, NM0137). Category 2 takes the second position. Themethodologies of the category also follow the trend of narrow applicability so far. An exception is AM0029, which is applicable to new installation of natural-gas power plant(s) and has been applied by as many as 14 projects since its approval in May 2006.
Methodology submissions to other categories have been limited. Category 3 (demand-side programmes for specific technologies) has received only six submissions, all of which are applicable to energy efficient equipment for buildings, e.g. efficient lightbulbs and room air conditioners. Although a programmatic approach is essential for this kind of projects (and the first methodology for this category, NM0072, wassubmitted long back in November 2004), a clear guidance on the definition of “a programme of activities under the CDM” had not been given by the EB until its 28th
meeting in December 2006 (see UNFCCC 2006c). This has lead to great confusion among stakeholders and tardy development of demand-side energy efficiency methodologies. Category 7 (energy efficiency and fuel switching measures fortransport) has also lagged behind due to a complex nature of transport projects. Although AM0031 has become available in July 2007, its applicability is very specific to the project attached to the methodology (BRT Bogotá, Colombia: TransMilenio Phase II to IV). Consequently, AM0031 has not been applied to any other projects so far.
18 Resubmission of NM0128.

451
10
Table 3. Number of large-scale energy efficiency methodologies by evaluation status (December 2006)
Methodology type Submitted AM ACM 1: Supply side energy efficiency improvements for transmission and distribution
6 - -
2: Supply side energy efficiency improvements – generation
16 2.5 1
3: Demand-side programmes for specific technologies 6 - -
4: Energy efficiency and fuel switching measures for industrial facilities
46.5 8 2
5: Energy efficiency and fuel switching measures for buildings
1.5 0.5 -
6: Energy efficiency and fuel switching measures for agricultural facilities and activities
0 - -
7: Energy efficiency and fuel switching measures for transport
5 1 -
Sum 81 12 3 Note: “2 and 4” or “4 and 5” is allocated to methodology type 2, 4, and 5 respectively with 0.5 points.NM0107, NM0113, and AM0032 are of the former category. NM0144 and AM0044 are of the latter.Source: UNFCCC (2006b) and authors’ categorization
4. Analysis of submission and approval process of large-scale energy efficiency methodologies
Based on the analysis of the submission and approval process of large-scale energy efficiency methodologies, this chapter will discuss lessons learned from the experience focusing on i) applicability, ii) baseline approach, iii) baseline scenarioselection and additionality assessment, and iv) emission reductions calculation. The analysis will mainly focus on lessons specific to energy efficiency methodologies, based on the submission and approval process from August 2005 to December 2006. For more generic methodological issues (e.g. transparency, conservativeness, formatting, and other basic methodological rules) or earlier lessons specific to energy efficiency methodologies, refer to Müller-Pelzer and Michaelowa (2005). In addition, preliminary analysis will be given to methodologies for energy efficiency CDM programmes, which have recently gained great momentum.
4.1. Applicability
As discussed above, applicability of energy efficiency methodologies has typically been limited to a specific technology or measurement. Such a bottom-up approach,based on engineering analysis of each relevant component, allows for accurate calculation of emission reductions and has been preferred by the MP/ EB. Again, a drawback of this approach is that a methodology tends to have technology-/ measurement-specific applicability by nature. Although a majority of energy efficiency methodologies are based on the bottom-up approach, several attempts to achieve wider applicability have also been observed. These can be categorized into i) empirical model approach and ii) performance parameter approach.
Examples of the empirical model approach are NM0119 and NM0122. Both of them employ an empirical model (as opposed to the bottom-up engineering approach as a “theoretical” model) to estimate the baseline emissions. For example, NM0119

452
11
applies regression analysis assuming that there is a relationship between the fuel use in the baseline scenario and the production of an industrial facility. Such an approach can “skip” each production component but is likely to face difficulty in attributing emission reductions to the project activity. Although the approach is attractive in terms of simplicity and wider applicability (because it does not require process-specific analysis; e.g. NM0119 is applicable to any energy efficiency improvementmeasurements in industrial facilities that produce only one product), the MP/ EB have taken unfavourable decisions on such an approach mainly due to inappropriate establishment of causality between emission reductions and the project activity.
Another approach for wider applicability is based on performance parameters. An example of performance parameters is specific electrical/ thermal energy consumption measured as final electricity/ thermal energy consumption divided by quantity of production (NM0120 for building electrical efficiency, NM0099 and NM0137 forcement plant efficiency). Such performance parameters are typically estimated based on historical performance data (e.g. three years for NM0120 and one year for NM0137). Endogenous energy efficiency improvement in the baseline scenario is not considered at all in NM0120. NM0137 takes into consideration such effects by choosing a baseline scenario with an endogenous efficiency improvement rate based on a historical trend (although guidance to justify the historical improvement trend is vague). These attempts have failed mainly because of improper treatment of causality between emission reductions and the project activities. For example, although NM0099 and NM0137 are designed for project activities reducing emissions through energy efficiency measures, the proposed methodologies also account for emission reductions that result from activities other than efficiency measures, such as changes in a clinker factor or product/ fuel mix. In addition, the lack of proper consideration of endogenous energy efficiency improvements is another critical issue of these methodologies.
These experiences give an insight into development of widely applicable energy efficiency methodologies. Facility-level-bundling (or complex type methodologies), which bundles multiple processes at a facility into one methodology, is essential to achieve wider applicability. However, it is important to note that such an approach islikely to fail unless it is built on bottom-up engineering model, not an empirical one, and endogenous energy efficiency improvement is properly taken into account.
4.2. Baseline approach
A majority of the energy efficiency methodologies has aimed at retrofit or replacement activities of existing equipment. Consequently, most of the methodologies are based on the baseline approach 48.a (historical emissions). The share of the approach 48.b (emissions of an economically attractive course of action, taking into account barriers to investment) is much lower due to the lack of methodologies designed for new installations. The approach 48.c (emissions of the top 20% of similar project activities undertaken in the previous five years) has hardly been applied successfully mainly due to difficulties in data collection (from potential competitors) and definition of “a similar circumstance” (e.g. NM0003, NM0116).

453
12
Table 4. Number and share of baseline approaches applied to large-scale energy efficiency methodologies (December 2006)
Submitted AM/ACM 48.a 61 75.3% 10 66.7% 48.b 19 23.5% 5 33.3% 48.c 1 1.2% 0 0.0% Sum 81 100.0% 15 100.0%
Note: “48.a or 48.b” is allocated to 48.a and 48.b respectively with 0.5 points. ACM0004 andACM0007 are of this category.Source: UNFCCC (2006b) and authors’ calculation
Wrong choice of a baseline approach has been one of the reasons for rejection of methodology submissions (see Müller-Pelzer and Michaelowa 2005). In most cases, the use of 48.a has been supported by the MP/ EB for retrofit or replacement projects, while 48.b for new installation projects. However, the MP/ EB have occasionally taken different stances on the baseline approach choice. For example, NM0136 is considered as a methodology for discretionary retrofit energy efficiency projects (see below for the definition). Against its choice of the baseline approach 48.a, the MP recommended 48.b stating “48.a is more appropriate to projects that derive no financial benefits other than the carbon income.” If such reasoning is always applied, all the energy efficiency projects have to be based on 48.b, which is not necessarily reasonable. Another example is NM0159 which is based on 48.a. The MP also recommended 48.a even though NM0159 is only applicable to end-of-lifereplacement. At the end of technical lifetime of equipment, the equipment purchase decision is usually widely open and 48.b suits better to such a situation than 48.a does.
UNFCCC (2006d) states that “project participants proposing new baselinemethodologies shall ensure consistency between the determination of additionality of a project activity and the determination of a baseline scenario” and “ensureconsistency between baseline scenario derived by this procedure and the procedure and formulae used to calculate the baseline emissions.” As per these guidelines, project participants shall ensure consistency among i) baseline scenario selection, ii) calculation of the baseline emissions, and iii) demonstration of additionality. Becausea baseline approach, in principle, serves as a basis for calculation of the baseline emissions, it is considered to determine how the above three procedures should becarried out. Therefore, to avoid further confusion, it is important to reconsider which baseline approach should be applied in the context of energy efficiency CDM projects.
Niederberger and Spalding-Fecher (2006) proposed distinction among three energy efficiency markets: i) discretionary retrofit, ii) planned replacement, and iii) new installations markets. The discretionary retrofit market serves for decisions to prematurely replace existing technology with high-efficiency equipment for theprimary purpose of improving energy efficiency. The planned replacement marketconcerns decisions to replace existing technology at the end of its useful lifetime (e.g., failure, replacement schedule) with high-efficiency equipment. The new installations market is for decisions to select high-efficiency equipment over other alternatives at atime of new installation.
Different baseline approaches are required for the three different energy efficiency markets. First of all, 48.a is recommended for discretionary retrofit since such a project is replacing existing, functioning equipment before the end of its technical

454
13
lifetime. As for the planned replacement, 48.b is generally the most suitable baseline approach since it generally involves new investment decisions. However, if replacement equipment has already been purchased, 48.a may become moreappropriate since not employing the already purchased equipment would represent a sunk cost. Lastly, 48.b is the first choice for new installations since the equipmentpurchase decision is widely open and there is no historical data for such projects by nature (see Niederberger and Spalding-Fecher 2006). Applicability of 48.c is difficult to assess because the experience is scarce so far. It would lend itself mainly to the market for new installations where one could look at the market for comparable new technologies. But it could also be applicable for a situation where one looks at a retrofit/ replacement activity if there is a common characteristic of a retrofit/ replacement (e.g. “normally technology x is replaced after 10 years with technology y”) and data for the retrofitted/ replaced technology are available. As long asnecessary data is available and the choice does not lead to less conservative calculation of the baseline emissions than 48.a or 48.b does (i.e. cherry picking of a baseline approach to reap more CERs is most likely rejected by the MP/ EB), 48.c can also play a role. It is important to note that 48.c can readily address a rebound effect issue (see below for detailed discussion) where historical data is not available. Emissions from an increased output level due to energy efficiency improvement mustbe taken into account in calculation of the baseline emissions. The problem with 48.b-based new installation energy efficiency projects is that they tend to set an output level of the baseline scenario equal to the one of the project activity since suchprojects do not have historical output data (i.e. no consideration of rebound effects). 48.c could solve this problem by taking an output level of “similar” project activitiesalthough such an approach has never been applied successfully so far. A summary of baseline approach choice for the three different energy efficiency markets is given in Table 5.
Table 5. Suitable baseline approach for different energy efficiency project types Energy efficiency project type Suitable baseline approach
Discretionary retrofit 48.a is preferable. 48.c is also applicable if necessary data is available and the choice does not lead to less conservative calculation of the baseline emissions than 48.a does.
Planned replacement 48.b is preferable (a possible exception is a case where replacement equipment has already been purchased. In such a case, 48.a might be more preferable). 48.c is also applicableif necessary data is available and the choice does not lead toless conservative calculation of the baseline emissions than 48.b does.
New installations 48.b is preferable. 48.c is also applicable if necessary data is available and the choice does not lead to less conservative calculation of the baseline emissions than 48.b does.
Source: Adopted from Niederberger and Spalding-Fecher (2006)
4.3. Baseline scenario selection and additionality assessment
Energy efficiency projects are often economically/ financially viable even without CER revenues. Due to the limited contribution of CER revenues to the overall project finance, such projects have faced difficulty with demonstrating additionality. As a consequence, project participants have attempted to exclude the investment analysis from baseline scenario selection and additionality assessment. The examples are NM0119, NM0122, and NM0136 which are all based on the baseline approach 48.a

455
14
and suggested application of the barrier analysis only. None of these attempts havebeen supported by the MP/ EB. A partial use of the additionality tool (i.e. predominantly exclusion of the investment analysis in the context of energy efficiency projects) has triggered second thoughts of the MP/ EB and become one of the majorreasons for methodology rejections. Although it is not mandated by the additionality tool, application of both the barrier and investment analysis has been the first priorityrecommendation by the MP/ EB.
Compared to the investment analysis, the barrier analysis tends to be more qualitative and subjective, hence prone to more gaming. In the case where barriers exist to all the alternatives, demonstrating the barriers to the alternative chosen as the result are clearly “less likely” to prevent this alternative than the barriers affecting the other alternatives is considered invalid (e.g. the MP recommendation on NM0136). In case of an inconclusive result of the barrier analysis, methodologies have to provide a way to come up with a single result e.g. either by the investment analysis or the choice of a scenario with the lowest emissions (e.g. NM0141). However, although a combination of the barrier and investment analysis can be conclusive, energy efficiency projects are likely to face difficulty in passing the investment analysis. Also, the barrieranalysis complemented by the choice of a scenario with the lowest emissions is conclusive, but the result is likely to be the project activity itself if the option is not screened out by the barrier analysis.
In order to systemize the baseline scenario selection and additionality assessment process, the combined tool to identify the baseline scenario and demonstrateadditionality (the combined tool) has established a flow chart to select the most plausible baseline scenario and demonstrate additionality (see UNFCCC 2006e). Itbasically sets two options in case the barrier analysis is not conclusive. First, if the remaining alternatives include the project undertaken without the CDM, project participants should apply the investment analysis to single out an alternative. Second, if the remaining alternatives do not include the project undertaken without the CDM, project participants can either apply the investment analysis or choose the baseline scenario alternative with the least emissions. Here again, the barrier analysis plays a key role especially in the context of energy efficiency projects, where the investment analysis is likely to end up with unfavourable results for the project activities.
Niederberger and Spalding-Fecher (2006) argues that major barriers to energy efficiency projects can be that capital investment decisions are generally not made on the basis of what is cost effective, but rather on the basis of which investment bearsthe least risk and will give the greatest/ most rapid return on investment. Also, those who purchase energy-using capital equipment or appliances are often not the ones who pay energy bills. Therefore, their main concern is a low equipment purchaseprice, not operating costs such as energy bills.
In order to incorporate the barriers mentioned above and overcome the additionality challenge which energy efficiency projects have been facing with, additionality assessment has to be streamlined by defining one-step criteria and simple barrier analysis as far as possible. Also, the investment analysis has to take into account the risk premium which projects in developing countries face with. Possible options couldbe additionality assessment based on i) a list of “first of its kind” technologies, ii) aninternal rate of return below the lending rate of commercial banks for the maximum

456
15
loan duration available for private debtors at the date of PDD submission, and iii) a payback period commonly used as cut-off for projects in the associated economic sector in the host country. For more details, refer to Michaelowa (2005).
Another upcoming problem is additionality assessment of projects which employ afacility-level-bundling approach. Such an approach typically incorporates multiple processes at a facility into one methodology (e.g. NM0099, NM0122, NM0137). Therefore, additionality assessment can be applied either at a facility level or each production process level. Although the experience with this kind of approach is scarce,a general lesson can be drawn from the methodology submission and approval process so far. The MP/ EB have been very cautious in establishment of causality between the emission reductions and project activity (e.g. the MP recommendation on NM0137 and NM0159). Also, the EB guidance on programmatic CDM clearly states that a programme of activities must demonstrate that the emission reductions for each project activity under the programme are uniquely attributable to the programme (see UNFCCC 2006c. For further discussion, see Section 4.5.3.). If the MP/ EB areconsistent, it would mean that each component of a bundle of activities at an industrial facility would have to show additionality, which is likely to be difficult.
4.4. Emission reductions calculation
There are three major methodological challenges which energy efficiency methodologies have continuously been faced with: i) remaining technical lifetime of existing equipment, ii) output increase by the project activity, and iii) endogenousenergy efficiency improvement in the baseline scenario.
4.4.1. Remaining technical lifetime of existing equipment
The EB, at its eighth meeting, gave guidance on the treatment of existing and newly built facilities, stating that “the baseline may refer to the characteristics (i.e.emissions) of the existing facility only to the extent that the project activity does notincrease the output or lifetime of the existing facility (see UNFCCC 2003).” The 22nd
meeting of the EB gave further guidance on treatment of the technical lifetime of plants and equipment (see UNFCCC 2005a). However, despite the EB guidance, many energy efficiency methodologies have failed to take into account the issue properly (e.g. NM0118, NM0119, NM0141, NM0169, NM0171).
A solution could be to either i) limit the applicability to the case where the retrofitundertaken does not increase the technical lifetime of existing equipment (e.g. NM0163, NM0171, AM0040, ACM0009), or ii) determine the remaining technical lifetime of existing equipment without any retrofit and issue CERs only as long as the this technical lifetime would not be reached by the facility (e.g. NM0144, the MPrecommendation on NM0184). In the latter approach, the methodology has to clearly describe the procedure to estimate the technical lifetime of existing equipment (fordetailed guidance, see UNFCCC 2005a).
4.4.2. Output increase by the project activity
There are two types of output increase caused by the project activities: i) capacity expansion by the project activity and ii) rebound effects due to an increased energy

457
16
efficiency level. In either case, as discussed above, the baseline may refer to thecharacteristics (i.e. emissions) of the existing facility only to the extent that the projectactivity does not increase the output of the existing facility. For any increase of output of the facility which is due to the project activity, a different baseline shall apply (seeUNFCCC 2003).
Capacity expansion
Two approaches have been applied so far to address emissions from output increaseby capacity expansion due to the project activity: i) to limit the applicability to thecase where the retrofit undertaken does not expand the capacity of existing equipment(e.g. NM0163, NM0171, AM0040, ACM0009), or ii) not to claim for CERs for emission reductions associated with project activity output above the maximum capacity of existing equipment.
The former is very similar to the first approach addressing the remaining technical lifetime issue discussed above. An example of the latter can be found in AM0044. It applies a capping factor (i.e. “average historic thermal energy output from the baseline boiler” divided by “thermal energy output by the project boilers”) so thatproject participants do not claim for CERs for reduction of emissions from fuelconsumption associated with any thermal energy output above the maximum capacity of the baseline boilers.
Rebound effects
The MP/ EB have occasionally given recommendations to consider emissions from an increased output level caused by energy efficiency improvement by the project activity (i.e. rebound effects). However, clear and consistent methodological guidance is lacking and decisions by the MP/ EB have been extremely inconsistent. Although some large-scale energy efficiency methodologies have been rejected because theydid not take into account rebound effects (e.g. NM0096, NM0103), SSC energy efficiency methodologies do not consider rebound effects and project with serious rebound effects (e.g. Kuyasa low-cost urban housing energy upgrade project) hasbeen registered. In addition, a few large-scale energy efficiency AMs also lack of appropriate treatment of this issue (e.g. AM0020, AM0029).
The issue poses another debatable question: rebound effects and suppressed demand. In the case of many developing countries, any rebound effect resulting from energy efficiency projects is often linked to situations of suppressed demand due to insufficient supply (see Figueres and Bosi 2006). There is a view that meeting suppressed demand through an energy efficiency project activity should not bepenalized because the CDM is to promote sustainable development in developing countries (see James 2005). To avoid further confusion, more clarification/consistency is needed on treatment of rebound effects by the MP/ EB.
4.4.3. Endogenous energy efficiency improvement in the baseline scenario
Over time, baseline emission might be reduced by a certain percentage due to modernisation, better maintenance and new equipment installations, etc. In most cases, the MP/ EB have recommended to take into account such endogenous energy

458
17
efficiency improvement in the baseline emission calculation (e.g. the MP recommendations on NM0120 and NM0136). However, again, the MP/ EB decisionshave sometimes been inconsistent. For example, NM0042 was approved as AM0020 even though it did not consider any endogenous energy efficiency improvement.
Possible approaches to tackle this issue are application of i) a default factor for endogenous energy efficiency improvement, ii) benchmarking (e.g. based on 48.c or other criteria), and iii) a project and baseline sample group approach. The first approach was employed by NM0137, which applied a default factor for endogenous energy efficiency improvement based on regressions analysis on a historical energy efficiency improvement rate. However, the methodology was rejected because of the lack of guidance as to the time periods over which a trend in performance must exist in order to justify its reflection in the baseline. Also, in case of a deteriorating energy efficiency trend, the MP rejected the application of historical (deteriorating) trend and recommended the use of a constant baseline emission level based on data for the yearprior to project start (see the MP recommendation on NM0137).
The second approach is benchmarking. If ex-post monitoring is applied, 48.cinherently addresses this issue because it calculates the baseline emissions as the average emission of similar project activities undertaken in the previous five years, in similar circumstances, and whose performance is among the top 20% of their category (but no example of successful application so far). Another example of benchmarking is ACM0005, which sets the benchmark of a clinker to cement ratio (c/c ratio) for baseline emission calculation as the lowest value among the following three options: i) the production-weighted-average of the five highest c/c ratio for the relevant cementtype in the region, ii) the production-weighted-average c/c ratio in the top 20% (in terms of share of additives) of the total production of the blended cement type in the region, and iii) the c/c ratio of the relevant cement type produced in the proposed project activity plant before the implementation of the CDM project activity, if applicable.
The third approach is a project and baseline sample group approach, or (quasi-) random experimentation. This is applied in NM0150 and it basically accounts for “continuation of the current practice + endogenous energy efficiency improvement” by setting a control group, which receives no intervention by the project activity, and an intervention group, which is given the project intervention (see Rossi et al. 2004 or Cook and Campbell 1979 for further details of (quasi-)random experimentation methods). Although the approach, based on statistical sampling, is relatively complicated, it can address the issue in the most rigorous manner among the three approaches.
4.5. Programmatic approach
The EB has issued guidance on programmatic CDM in December 2006 (seeUNFCCC 2006c). Due to the nature of many activities for energy efficiency improvement where small technologies (e.g. lighting equipment, electric motors) are distributed and installed in large numbers, the programmatic approach could become crucial for the role of energy efficiency projects under the CDM.

459
18
4.5.1. Evolution of programmatic CDM
Programmatic CDM is not a new phenomenon. As mentioned above, the first methodology of this category, NM0072, was submitted long back in November 2004. The methodology, which addresses a mandatory energy efficiency standard for room air conditioners in Ghana, opened a long-standing discussion on whether local/regional/ national policy or standard can be considered as a CDM project activity. The 1st session of the Conference of the Parties serving as the Meeting of the Kyoto Protocol (COP/ MOP1) in December 2005 decided that “a local/ regional/ nationalpolicy or standard cannot be considered as a CDM project activity, but that project activities under a programme of activities can be registered as a single CDM projectactivity (see UNFCCC 2005b).”
Since the COP/ MOP1 decision, programmatic CDM has gained greater momentum, driven by the expectation that the approach could mobilize more CDM projects with higher sustainable development benefits such as energy efficiency and renewable energy projects. The MP/ EB have worked on guidance related to the registration of project activities under a programme of activities as a single CDM project activity and recently finalized its work. Among the several existing methodologies for programmatic CDM activities, this section gives an overview of NM0150 and NM0157, both of which were developed for energy efficiency improvement of light bulbs.
NM0150 is designed for distribution of compact fluorescent lamps (CFLs) by donation or sales at a reduced price (not via a retailer). As mentioned above, themethodology employs a project and baseline sample group approach, or quasi-random experimentation, which is based on a statistical sampling method. The baseline sample group, or the control group, is given compensation for not participating in the programme. On the other hand, the project sample group, or the intervention group, is distributed CFLs to replace less energy efficient lighting appliances currently in use. Additionality assessment is to be conducted on the CFL distributor level (i.e. on the programme level). The selected major issues raised by the MP are i) lack of appropriate description of the method to establish the control group, ii) risk of manipulation in the control group (e.g. by giving incentives not to use CFLs through the crediting period), and iii) potential leakage (e.g. through export of CFLs to Annex I countries, re-use of incandescent lamps, and residential and/ or non-residential free-riders). The additionality assessment only on the programme level was not criticized by the MP.
NM0157 is designed for distribution of CFLs through a general retail channel. As opposed to the quasi-random experimentation approach employed by NM0150, themethodology calculates emission reductions based on a technology penetration approach. The approach compares penetration rates with and without the proposed CDM activity. Those penetration rates are monitored ex-post by using the “unbiased” questionnaire to the customers of the CFLs, which is aimed to identify the customer’s purpose of purchase.19 In order to exclude free-riders, a swapping method, i.e. to introduce new CFLs by swapping usable incandescent lamps, as well as confirmation
19 “Unbiased” implies that the subsidy for answering the questionnaire is to be provided whatever the answer is (see NM0157).

460
19
of usability of the incandescent lamps (less efficient light bulbs used in the baseline scenario) by the unbiased questionnaire is applied. Additionality assessment is to be conducted both i) on the individual participant level and ii) on the programme level. The selected major issues raised by the MP are i) lack of full description of the “unbiased survey,” ii) doubtful additionality assessment both on the individual participant level (because of the lack of check on reliability of the survey answers)and on the programme level (it is not appropriate to automatically assumeadditionality of the programme based on the fact that the subsidy is provided by theCER revenue; this kind of programme could benefit from non-CDM-based subsidies), and iii) potential leakage through the same channels pointed out in the MP recommendation on NM0150.
From these two examples, some general lessons can be drawn. Firstly, programmaticCDM may require relatively complex and sophisticated emission reduction calculation methods (e.g. (quasi-)random experimentation or technology penetration rate approaches). Full description of the methods shall be given in methodologies. In addition, it is important to ensure that the intermediary (i.e. programme coordinator) has enough capacity to carry out such complicated methods (otherwise, theprogramme will face problems at a time of verification). Secondly, additionality assessment (to exclude free-rider effects) needs careful consideration. It is not very clear yet on which level additionality assessment must be conducted: on the programme level, on the individual participant level, or both?
4.5.2. Emission reductions calculation
In calculation of emission reductions of a programme, two elements play a crucial role: i) free riders and ii) spill over. Taking a CFL distribution programme as anexample, free riders, who would have installed CFLs anyway, act to decrease the gross energy savings of the programme. On the contrary, spill over increases the gross energy savings of the programme by accounting for the influence the programme has had on the market. Such influence is a combination of the following three types of spill over:
1. Within project spill over: Participants purchased CFLs through the programme;
2. Outside project spill over: Participants purchased additional CFLs through other outlets;
3. Non-participant spill over: Non-participants were induced to purchase CFLs because of suggestions from participants, greater availability in the marketplace, etc.
The effect of free riders and spill over is aggregated to the net-to-gross ratio (NTG),which represents the share of the programme’s gross energy savings that can be properly attributed to the programme’s influence (see Skumatz and Howlett 2006).The NTG is mathematically expressed as follows:
NTG = (1-FR) × (1+SO) where: FR is the share of free riders (fraction); and SO is the share of spill over (fraction).
461
20
Even if programmes employ the same technology, the NTG can vary significantly depending on programme designs. For example, a nationwide study of CFL programmes in the U.S. shows variations of i) free rider estimates ranging from 1-50%, ii) spill over estimates from 8-32%, and iii) the NTG from 80-91% (seeSkumatz and Howlett 2006). This example shows the importance of well-designed programme evaluation methods to properly calculate emission reductions by the programme. In the CDM context, only the free rider effect has attracted much attention so far, apparently because underestimation of actual emission reductions in non-Annex I countries would positively contributes to the environmental integrity of the Kyoto Protocol. However, if project participants do not want to unnecessarily giveaway their emission reductions (which is normally the case), they have to contemplate proper estimation of spill over as well.
Importantly, methodologies for estimation of free riders and spill over are usually complicated and likely to involve high transaction costs. Such methodologies includecomparison of programme participants and non-participants by a (quasi-)random experimentation method (e.g. NM0150). Another approach could be to determinetrends in autonomous market penetration of high-efficiency equipment targeted by the CDM programme (e.g. NM0157). However, considering the fact that the MP/ EBhave hardly supported simple extrapolation of historical trends so far, such an approach needs careful consideration. It may be questionable to assume that pasttrends are a good indication of future trends (see Niederberger and Spalding-Fecher2006).
4.5.3. Additionality assessment
Additionality can principally be assessed at two levels in the context of a programme: i) on the level of an intermediary who organizes the programme and ii) on the level of the actors who actually install/ use the efficient technology. The problem is that investment analysis tends to apply on the intermediary level, whereas the activity level is usually characterized mainly by non-monetary barriers (e.g. lack of trust in the new technology, lack of information, lack of servicing in case of failure).
The EB is still making up its mind whether additionality has to be assessed on both levels. The guidance states that the programme of activities (PoA: on the programme level) shall ensure that additionality is unambiguously defined for each CDM program activity (CPA; on the individual participant level) within the PoA (see UNFCCC2006c). However, it lacks of clear guidance on the aggregation level of a CPA. Is each light bulb replaced by a PoA considered as an individual CPA and must project participants weed out every single non-additional light bulb replacement? In addition,the guidance does not explicitly state the need of additionality assessment on the programme level.
The MP/ EB decisions on this issue have been inconsistent. First of all, as discussed above, the EB guidance on programmatic CDM clearly requires additionality assessment on the individual participant level, but not explicitly states the need of additionality assessment on the programme level. Secondly, in the case of NM0150 which conducts additionality assessment only on the programme level, the MP did not raise any issues on which level additionality assessment should be carrier out. Thirdly,

462
21
however, the MP recommendation on NM0198, which relates to a project type similar to demand-side energy efficiency (distribution of efficiency increasing technology to farmers), asks for additionality assessment on the two levels: i) on the choice of the individual farmer on a particular fertilizing technique and ii) on the choice of the distributor to carry out the inoculant rebate/ subsidy program. This suggests that the two-tiered additionality assessment would be required for programmatic CDM.Clearer and more consistent guidance on additionality assessment of programmatic CDM is essential to fully realize its potential.
Experience with evaluation of demand-side management programmes in the U.S. has shown that it is extremely difficult and expensive to assess additionality on the actor level. Thus, Trexler et al. (2006) and Sathaye (2006) have proposed aggregated additionality assessment, which discounts emission reductions of the programme by the percentage of ex-ante estimated non-additional activities in the programme. Theproblem with that suggestion is that both non-additional and additional activities would receive the same amount of CERs; the non-additional ones would thus crowd out the additional ones. A solution might be to allow aggregated additionality assessment if the programme intermediary can show that he has measures in place to deter non-additional activities.
5. Conclusions
Energy efficiency methodologies have so far been the stepchildren of the CDM. They have been assessed very critically by the MP/ EB and their success rate has been verylimited. Those that managed to come through suffer from narrow applicability criteria and cover only a part of potentially interesting project types. Although facility-level-bundling could be a way to achieve wider applicability, such an approach is likely to follow a difficult track as far as the existing methodology submission and approvalprocess tells. The baseline approach of “20% best comparable technology,” which was originally thought to be applicable to energy efficiency projects, so far is almostnot used due to heavy data collection and difficulty in setting “similar” circumstances. Moreover, practices used in demand-side management programmes such as empiricalmodelling or performance benchmarking have not been accepted. The MP/ EB are still grappling with key concepts such as rebound effects and endogenous energy efficiency improvement. It remains to be seen whether the rules on programmaticCDM will be set in a way that reduces the barriers for the implementation of energyefficiency projects under the CDM.

463
22
References
Cook T.D., Campbell D.T. Quasi-experimentation: Design & analysis issues for fieldsettings. Chicago: Rand McNally College Publishing Company, 1979.
Niederberger A.A., Spalding-Fecher R. Demand-side energy efficiency promotion under the Clean Development Mechanism: Lessons learned and futureprospects. Energy for Sustainable Development 2006;X(4):51-64.
Michaelowa A. CDM: Current status and possibilities for reform, HWWI Research Paper No.3. Hamburg: HWWI, 2005.
Michaelowa A., Hayashi D. How institutional innovations in climate policy impact on mitigation technology choice in developing countries – the case of the CDM. Presented at the workshop “Market, Institutions, and Innovation-related Services.” Hamburg: Universität Hamburg, 2006. See also:
http://www.cgg.uni-hamburg.de/english/contributions.html
Müller-Pelzer F., Michaelowa A. Lessons from the submission and approval process of energy efficiency CDM baseline and monitoring methodologies, HWWIResearch Paper No.1. Hamburg: HWWI, 2005.
James K. Methodological issues arising across different types of energy efficiency projects. Presented at “Expert workshop on CDM methodologies and technical issues associated with power generation and power saving project activities.” Montreal: World Bank, 2005. See also: http://carbonfinance.org/docs/Kevin_James_Quality_Tonnes_Presentation_Montreal_ee_Dec_05.ppt
Rossi P.H., Lipsey M.W., Freeman H.E. Evaluation: A systematic approach (seventh edition). Thousand Oaks, CA: SAGE Publications, 2004.
Sathaye J. Energy efficiency project activities observations about CDM: Policies and programs. Presented at “The 12th session of the Conference of the Parties to the Climate Change Convention (COP12).” Nairobi: UNFCCC, 2006.
Skumatz L.A., Howlett O. Findings and “gaps” in CFL evaluation research: Review of the existing literature. Superior, CO: Skumatz Economic ResearchAssociates (SERA), 2006. See also: http://mail.mtprog.com/CD_Layout/Day_2_22.06.06/1115-1300/ID109_Skumatz3_final.pdf
Trexler M.C., Broekhoff, D.J., Kosloff, L.H. A statistically driven approach to offset-based GHG additionality determinations: What can we learn. SustainableDevelopment Law and Policy 2006;VI(2):30-40.
UNFCCC. EB08 meeting report Annex 1: Clarifications on issues relating to baselineand monitoring methodologies. Bonn: UNFCCC, 2003. See also: http://cdm.unfccc.int/EB/008/repan1.pdf

464
23
UNFCCC. EB22 meeting report Annex2: Guidance regarding methodological issues. Bonn: UNFCCC, 2005a. See also: http://cdm.unfccc.int/EB/022/eb22_repan2.pdf
UNFCCC. FCCC/KP/CMP/2005/L.7: Report of the EB of the CDM and election of members of the EB. Montreal: UNFCCC, 2005b. See also: http://unfccc.int/resource/docs/2005/cmp1/eng/l07.pdf
UNFCCC. CDM project activities registered. Bonn: UNFCCC, 2006a. See also: http://cdm.unfccc.int/Projects/registered.html
UNFCCC. CDM baseline and monitoring methodologies. Bonn: UNFCCC, 2006b. See also: http://cdm.unfccc.int/methodologies
UNFCCC. EB28 meeting report Annex 15: Guidance on the registration of project activities under a programme of activities as a single CDM project activity(version 01). Bonn: UNFCCC, 2006c. See also:http://cdm.unfccc.int/EB/028/eb28_repan15.pdf
UNFCCC. Guidelines for completing the Project Design Document (CDM-PDD), and the proposed New Baseline and Monitoring Methodologies (CDM-NM)(version 06). Bonn: UNFCCC, 2006d. See also: http://cdm.unfccc.int/EB/025/eb25_repan16.pdf
UNFCCC. EB27 meeting report Annex 9: Combined tool to identify the baseline scenario and demonstrate additionality. Bonn: UNFCCC; 2006e. See also: http://cdm.unfccc.int/EB/027/eb27_repan09.pdf

465
- i -
The Carbon Finance Unit at the World Bank
ACHIEVING GREENHOUSE GAS EMISSION REDUCTIONS IN DEVELOPING COUNTRIES THROUGH ENERGY EFFICIENT LIGHTING PROJECTS IN THE CLEAN DEVELOPMENT
MECHANISM (CDM)
Christiana Figueres and Martina Bosi
November 2006
The electronic version of this paper can be downloaded from the World Bank's Carbon Finance website (www.carbonfinance.org)
Energy efficient lighting projects in the CDM - Carbon Finance Unit -World Bank

466
- ii -
CONTENTS
CONTENTS ..................................................................................................... ii
ABSTRACT......................................................................................................iii
ACKNOWLEDGEMENTS .......................................................................................iii
INTRODUCTION................................................................................................ 1
1. POTENTIAL FOR GHG REDUCTION THROUGH EFFICIENT LIGHTING ............................ 2
2. PROGRAMS TO PROMOTE EFFICIENT LIGHTING..................................................... 2
3. BARRIERS TO EFFICIENT LIGHTING ................................................................... 3
4. INTEGRATING THE CDM INTO EFFICIENT LIGHTING PROGRAMS ................................. 4
5. METHODOLOGICAL ISSUES FOR ASSESSING EFFICIENT LIGHTING PROJECTS UNDER THE CDM......................................................................................................... 5
6. EXAMPLES OF CDM IN EFFICIENT LIGHTING PROGRAMS .......................................... 9
7. CONCLUSION .............................................................................................10
ANNEX I: OVERVIEW OF RESOURCES FOR THE ASSESSMENT OF EFFICIENT LIGHTING PROJECTS ................................................................................................11
ANNEX II: GLOSSARY OF CDM TERMS USED.............................................................12
REFERENCES..................................................................................................13
DISCLAIMER This paper was prepared by Ms. Christiana Figueres (independent consultant) and Ms. Martina Bosi (World Bank Carbon Finance Unit). The findings, interpretations, and conclusions expressed in this paper are entirely those of the authors. They do not necessarily represent the view of the World Bank, its Executive Directors, or the countries they represent, or the view ofthe Carbon Finance Unit (CFU) or of the Participants in any of the carbon funds the CFU manages. They should in no way be taken to represent the official view of any institution with which the authors are associated.

467
- iii -
ABSTRACT
Energy efficiency can help address the challenge of increasing access to modern energy services, reduce the need for capital-intensive supplyinvestments as well as mitigating climate change. Efficient lighting is a promising sector for improving the adequacy and reliability of power systemsand reducing emissions in developing countries. However, these measures are hardly represented in the CDM portfolio. The COP/MOP decision to includeprograms of activities in the CDM could open the door to the implementation ofa large number of energy efficiency projects in developing countries. Since GHG reductions are essentially the emission equivalent of energy savings, the CDM can benefit from long established energy efficiency methodologies for quantifying energy savings and fulfilling CDM methodological requirements. The integration of the CDM into energy efficiency programs could help spur a necessary transformation in the lighting market.
ACKNOWLEDGEMENTS The authors would like to thank the following experts and colleagues for their valuable input to this paper: Anne Arquit Niederberger, Brian Dawson, Johannes Heister, Peter Johansen, BenoitLebot, Luiz Maurer, Michael Philips, Klaus Oppermann, Mahesh Sharma, Russell Sturm, Ed Vine,Paul Waide, and Stephen Wiel.

468
- 1 -
INTRODUCTION The World Bank’s “Clean Energy and Development: Towards an Investment Framework” (2006)1 notes that one of today’s greatest sustainable development challenges isaccelerating access to reliable and affordable modern energy services to the estimated 1.6 billion people in developing countries that are currently lacking it, while addressing the threat posed by climate change. There is no silver bullet and a suite of measures and technologies will be necessary. However, improvements in energy efficiency, both at production and end-user level, are a fundamental part of the solution.
Energy efficiency can reduce the need for capital-intensive supply investments and is one of the most promising sectors for improving the adequacy and reliability of power systems, increasing energy security and reducingemissions in developing countries. Unfortunately, these energy efficient options are not common practice due to well-documented market failures and barriers.
In the medium term, what is likely needed is a planned phasing out of the least energy efficient lighting techniques and systematic dissemination of the most efficienttechnologies, akin to the process under theMontreal Protocol. In the meantime, the KyotoProtocol’s Clean Development Mechanism (CDM) could channel carbon finance to cover the cost of some of the programs that wouldeventually bring about the desired markettransformation. The CDM could help these projects overcome some of the barriers facinggreater energy efficiency. However, theinternational emission reduction market has bypassed this opportunity to reduce emissionsand contribute to sustainable development.Out of the 1,276 projects currently in the CDMpipeline, 174 are energy efficiency projects (mostly industrial efficiency), representing 9.7% of the expected annual certified emissionreductions (CERs) of the market.2 Among those
1 Document produced by the World Bank in response to the Communiqué on Climate Change, Clean Energy and Sustainable Development resulting from the Gleneagles G8 Presidential Summit of 2005.
2Calculated based on CD4CDM website updated October 20, 2006 (http://www.cd4cdm.org/)
there are only 4 projects targeting end-use applications. This is possibly due to the greater complexity of implementing and administering end-user energy efficiency projects thattypically involve a large number of users in different sites, compared to the more common single-site CDM project activities that dominatethe CDM pipeline. It may also be due to theCDM-related transaction costs and uncertaintyregarding structuring/designing these activitiesas an eligible project activity under the CDM. Fortunately, the COP/MOP 1 decision to include“programs of activities” in the CDM, and theensuing expected guidance from the CDM Executive Board, have the potential to open the door to the implementation of more energy efficiency (EE) projects in developing countries.
There are several end-use applications around the world where the CDM could help stimulate greater energy efficiency, contribute to sustainable development and reduce GHGemissions, such as household appliances, air conditioning, heat and water pumps as well as buildings. This paper addresses the opportunityto use the financial leverage of the CDM to facilitate end-user energy efficiency projects.It focuses specifically on the efficient lighting sector as a promising sector3, given (i) the potential of national or regional programs todeliver the volume of GHG reductions necessary for a feasible CDM project; (ii) the possibility to monitor GHG reductions based on metered energy savings; and (iii) the broadapplicability of efficient lighting projectsthroughout the developing world. The paperhighlights the potential for GHG reductions from energy efficient lighting and notes howestablished efficient lighting methodologies and practices can be used to comply with CDM methodological requirements. The purpose ofthe paper is to show the complementarities and synergies between the implementation of energy efficiency measures and the CDM.
3 There are also other interesting energy efficiencyopportunities in other sectors which need to be further examined.

469
- 2 -
1. POTENTIAL FOR GHG REDUCTION THROUGH EFFICIENT LIGHTING
Although frequently overlooked, the lighting sector is a major source of GHG emissions. World-wide, grid-based lighting is responsiblefor 19% of total global electricity consumption(IEA 2006). Annual emissions from the lighting sector currently reach almost 1,900 MtCO2, equivalent to 70% of the emissions of the world’s passenger vehicles and three times more than aviation emissions. Over the pastdecade, global demand for electric lightingincreased at an annual rate of 1.8% in industrialized countries and 3.6% in developing countries. Over the next 25 years, demand will continue to grow. By 2030 developing countriesare expected to account for 60% of globallighting electricity demand due to newconstruction, ongoing electrification, and risingillumination levels.
Hence, the International Energy Agency (IEA) concludes that there is a “very large cost-effective potential to reduce energy demandand GHG emissions through more energyefficient lighting” (IEA 2006). It estimates that approximately 735 TWh and 456 MtCO2 couldbe reduced in non-OECD countries (or 385 Mt CO2 excluding former Soviet Union countries)by 20204, representing one half of theworldwide savings potential. At least part of these savings could be realized under the CDM.
The universe of lighting includes different markets: indoor lighting (domestic andcommercial/industrial), outdoor lighting(street, external building, stadiums, etc.) and vehicle lighting (the latter not considered further in this paper). Lighting energy can be saved in many ways, including (i) improving the efficiency of the light source; (ii) improving the efficiency of the specific component of lightingsystem, typically the ballast; (iii) improving the efficiency of the luminaries; (iv) improving theefficiency of the control gear deployed; and (v) making better use of daylight inside built environment.
4 From the IEA World Energy Outlook’s Reference Scenario(IEA 2004).
The general lack of implementation of thesemeasures “reflects the fact that although thereare already many cost-effective energy efficient lighting technologies available on themarket, they are currently underutilized.Despite substantial improvements in averagelighting-system efficiency, inefficient systems and practice are still commonplace” (IEA 2006).As further elaborated below, energy efficientlighting faces various barriers, some of whichthe CDM could help to overcome.
2. PROGRAMS TO PROMOTE EFFICIENT LIGHTING
Governments have been implementing EE lighting programs since the energy crisis of the1970’s. Multilateral institutions such as theWorld Bank, the International FinanceCorporation (IFC), the Global EnvironmentFacility (GEF), and the United Nations Development Program (UNDP) have promoted efficient lighting programs in developing countries. Today all industrialized countries and some developing countries have various sorts of EE programs for lighting, differing innature, scope and effectiveness. The most common types are: - Energy labels, ratings and certification
schemes used to inform consumers about the energy use, energy costs and environmental consequences of their intended lighting purchase by far the most widely spread type of EE program.
- Minimum energy performance standards(MEPS) that determine (voluntary or mandatory) minimum efficiency levels forlighting products sold in a particular country or region.
- Building codes that either set explicitlighting installation specifications, orindirectly include lighting in the general building energy performance specifications.
- Bulk procurement programs that seek to lower the information gathering andpurchasing costs of large quantities ofequipment and lighting systems.
- Financial and fiscal incentives in the form ofeither a rebate or a tax deduction, to motivate consumers to purchase energy-efficient lighting equipment.
- Performance contracts executed by energyservice companies (ESCOs) that on the basis

470
- 3 -
of a mutually agreed energy baseline, assisttheir customers to reduce energy costs and share the savings.
- Market transformation programs that seekto positively influence consumer behavior and market trends on a voluntary basis through a combination of labeling, building certification, technical support, and incentive schemes.
- Utility driven EE programs.
3. BARRIERS TO EFFICIENTLIGHTING
The slow uptake of efficient lighting (and energy efficiency in general) is one of the mostdiscussed ironies in the electricity industry.Technological developments over the past 30 years enable today’s investments in efficientlighting retrofits to enjoy short payback periods and high internal rates of return. Compact fluorescent lamps (CFLs), for example, are nowoften sold in bulk for little more than one dollar apiece. In the face of rising oil prices and increasing power shortages in developing countries, EE in general, and efficient lighting in particular, are clearly cost-effectivestrategies. And yet, this economic rationale has not led to a mainstreaming of efficient lightingsystems in practice.5 Traditional cost-benefitanalyses are typically not applied to individual lighting decisions. Indeed, while rationaleconomic behavior suggests that users would bebetter served by efficient lighting with lower life cycle costs, there are many reasons whythis does not actually occur. Impeding factors and market failures differ by end-use sector, but they tend to fall into six broad areas that are well documented, and thus here only listed in Box 1. Moreover, it is important to keep in mind that even for seemingly cost-effectiveprojects, these may not be undertaken due to their relatively high opportunity cost, i.e. the possibility to invest in other, more attractiveactivities/projects, especially in cases.
5 This is also true in the case of industrialized countries, where there is still significant potential for energy efficient improvements.
BOX 1. MAIN BARRIERS TO ENERGY EFFICIENT LIGHTING IN DEVELOPING COUNTRIES
1. Policy Barriers a Lack of institutional capacity, particularly at
national level, to implement EE programs in the end-use sector
b Energy efficient technologies, including lighting, is not given due consideration at the fiscal policy level
c Lax, if any, Minimum Energy Performance for most end-use equipment.
d Pricing of electricity below costs and poorrecovery of electricity bills.
2. Finance Barriers a Price sensitivity of the lighting market b No financial incentive for manufacturers to
invest in energy efficiency c Lack of financial incentives and mechanisms
to promote EE products in the market d Financial misalignment or split incentives:
those who make the decision on EEinvestments are often not the final users who pay the energy bill
3. Business and Management Barriers a Manufacturers uncertainty about market
demand of high efficiency models b Lack of resources amongst small-scale
manufacturers for developing and marketing energy efficient products
4. Information Barriers a Lack of awareness about residential sector
energy end-use, and therefore the energy efficiency potential, amongst consumers as well as the policy makers
b Lack of information about the precise energy saving potential from energy efficient lighting
c Lack of information about state-of-the-art energy efficient design and manufacturing of energy efficient lighting system.
5. Technology Barriers a Limited access to the state of the art energy
efficiency technology among manufacturers b Lack of EE driven applied R&D by the
manufacturers as well as the government labs and research institutes
c Lack of adequately equipped and staffed independent test labs for energy efficiencytesting of lighting system
d Limited experience of energy efficiency testing amongst engineers
6. Common Practice Barrier a Lack of trust of new equipment b Local customs and inertial behavior working to
maintain the status quo in the design, selection and operation of energy-using equipment.

471
- 4 -
4. INTEGRATING THE CDM INTO EFFICIENT LIGHTING PROGRAMS
The CDM cannot overcome all these barriers,but as a financial instrument, the CDM can help meet some of the above financial and otherchallenges. In addition to the usual energy savings, the CDM provides energy efficiencyprojects with a new asset (emission reductions)which has market value that can be converted into an additional income flow.
This second source of income is key to thedissemination of efficient lighting because itcan help close the financial gap created by the split incentives, whereby those who invest inthe lighting system and who want to keep upfront costs low, are frequently not those who will use the system in the long term and wouldbe benefited by efficient systems that have lowlife cycle costs. Although CERs are the emission reduction equivalent of the energysavings, the income from the sale of CERs need not flow to those who benefit from the energysavings, but rather can be intentionallydirected to the cost centers of the project,thus providing the missing financial link. Underthe CDM, projects consisting of programs ofactivities could enable the revenue flows of theCERs to go to the entity which implements theefficiency program in order to defray the costsof the program, while the consumer/end-useris, as usual, benefited by the energy savings. Several concrete examples can illustrate this: (A) Projected income from the CERs could beused by the producers of high efficiency bulbs and lighting systems to lower the net cost ofproduction, thus diminishing the cost todistributors, retailers, and consumers. (B) Thecost incurred by landlords and developers toimprove lighting installations could be offset by CERs. (C) The steady income flow from the saleof CERs could help fund the incentive scheme for consumers to purchase and install the moreefficient equipment. Finally, (D) the up-front cost of setting up and running a labeling and testing program or implementing minimumenergy performance standards would be covered by front-loading the payment of futureCER flows. It is also important to recognize thecontribution that CDM can make to a project interms of hard currency. Experience thus far in
carbon finance highlights the fact that financialinstitutions may be more open to financing CDMoperations if at least one income stream is inhard currency, as CERs are paid in US dollars orEuros (CDCF 2004). Thus by bridging thefinancial disconnect in a few ways, the CDM can help accelerate the implementation of efficient lighting programs in developing countries.
The COP/MOP 1 decision to include “programsof activities” (See Box 2) opens the door tointegrating the CDM into energy efficiencyactivities.
BOX 2. PROGRAMS OF ACTIVITIES UNDER THE CDM
The inclusion of “programs of activities” under theCDM was decided at COP/MOP 1 in November, 2005.At its 27th meeting in November, 2006, the ExecutiveBoard of the CDM considered the following components for the definition of a program, with a final decision expected at its next meeting on 12-15December 2006:
- Multiple sites: The program involves several project activities within a country or several countries.
- Legal nature: each individual project activity is voluntary. Mandatory GHG-mitigation optionsimplemented by each project activity may beallowed if the policy or standard is not otherwiseenforced.
- Additionality: each project activity has a direct, real and measurable impact on emissionreductions.
- Traceability: each project activity must beidentifiable at either the validation or verification stage, including by sound sampling techniques.
- Coordinating entity: the entity providing the technical or financial assistance can be private or public.
- Actors implementing the GHG-reducing activities: they are not necessarily the same asthe coordinating entity, and they enter intoagreements with the coordinating entity in order to prevent double counting.
- Project types: a program can involve various project types, as long as each project type appliesan approved CDM baseline and monitoring methodology.
The following section highlights some of thekey methodological issues that need to be

472
- 5 -
addressed by efficient lighting projects from the perspective of the CDM modalities andprocedures, and suggests how current EE lighting practices can be used to comply with the CDM methodological requirements.
5. METHODOLOGICAL ISSUES FOR ASSESSING EFFICIENTLIGHTING PROJECTS UNDER THE CDM
At the core of the CDM modalities and procedures is the accurate quantification of emission reductions. Since in energy efficiencyprojects emission reductions are essentially the emission equivalent of energy savings, the CDMcan benefit from long established energyefficiency methodologies for quantifying energy savings. Fortunately, “a wide range ofevaluation methodologies has been developedand refined over the past 30 years to estimateenergy savings with acceptable levels of precision. These evaluation techniques have featured many sophisticated methods torigorously assess energy efficiency impacts,including quasi-experimental methods where program participants are compared to acomparison group of non-participants, directmeasurements of ‘before and after’ energyuse, estimation of ‘free riders’, utility bill analysis with adjustments for variations inweather and other factors where appropriate,accounting for the persistence of energy savings through measure retention studies andanalyses of energy usage over time, and the analysis of program spillover and market transformation. All of these concepts are well established and widely used to estimate the energy savings of energy efficiency programs” (Vine et al. forthcoming).
Under the CDM, a number of project design and eligibility issues need to be addressed/reflected by projects seeking to beregistered as programs of activities, as outlinedin Box 2. The key methodological issues that need to be addressed by project activities seeking to reduce GHG emissions throughimprovements in lighting efficiency include (a)project boundary, (b) baseline, (c) additionality, (d) predictability, (e) free riders and positive spillover, (f) rebound effects and
suppressed demand, (g) double counting, (h) leakage, and (i) monitoring.
(a) Project boundary
The boundary of an efficient lighting program is the physical location of the targeted replacement or installation activities plus thegrid supplying the electricity saved. Thelocations of the individual activities can be spread over an area, a city, a region or thewhole country, depending on the design of theprogram. In some programs the exact locationof the individual lighting activities is known at the outset (e.g. specific public sector buildings or specific municipal lighting systems). Inother programs, the geographic coverage of theprogram is known at the outset, but not thespecific location of the individual GHG reducingactions (e.g. a program of incentives toimprove public street lighting in a region orcountry). In these cases, the targetedgeographic coverage of the program (city, province or country) is made explicit and isconsidered fixed for the duration of thecrediting period. The exact locations whereactual emission reductions occur over time(e.g. cities where outdoor lighting is actually increased from 10 lumens per watt to 20, 50 or 100 lumens per watt) are determined ex post.
(b) Baseline
For purposes of the CDM, emission reductionsare the difference between a counterfactualbaseline emission level and the actual projectemissions. The counterfactual baselinescenario is defined at the time of projectvalidation. The calculation of the respectivebaseline emissions is based on a baseline‘methodology’ - either an existing (alreadyapproved methodology by the CDM ExecutiveBoard6), or a new methodology developedspecifically for the project (also requiring theapproval of the CDM EB).
The lighting sector could include different types of energy efficiency project activities under the CDM; as a result, a single baseline methodology may not cover all types of lighting projects. Baseline methodologies for efficient lighting projects could reflect three different
6 A list and description of all approved CDM methodologies can be found on the UNFCCC website: http://cdm.unfccc.int/methodologies

473
- 6 -
markets: discretionary retrofit, plannedreplacement, and new installations (for a fulldiscussion see Arquit Niederberger andSpalding-Fecher, 2006). For discretionaryretrofits (premature replacement of existingtechnology for the primary purpose of improving energy efficiency), the baselinescenario of efficient lighting programs would usually be the existing actual or historical emissions, in the absence of theimplementation of the program. The baseline emissions are the emissions associated with the energy use that would have occurred in the absence of the EE project. The baseline energyuse is derived as is typically done for energyefficiency projects through an energy audit of existing conditions; it is then multiplied by an emission factor determined with base year electricity use data and characteristics of thepower plants supplying the electricity. Thebaseline of planned replacement projects(spurred by the decision to replace existingtechnology at the end of its lifetime with highefficiency equipment) and new constructionprojects (decision to install high-efficiencyequipment at the time of construction) mustrefer to the energy use – and related emissions - that would occur without the CDM projects, e.g. referring to cases similar to the CDMproject but where the intended EE program has not been performed (i.e. “common practice”).
(c) Additionality
“A CDM project is additional if anthropogenic emissions of greenhouse gases by sources arereduced below those that would have occurred in the absence of the registered CDM projectactivity” (UNFCCC decision 17/CP.7). The additionality of a CDM project can be demonstrated in any of three ways: (i) economic/financial analysis (the project is notthe least cost option/most attractive option); (ii) barrier analysis (without the CDM the project could not be realized due to lack of finance or non availability of technologies orother resources or due to lack of appropriate incentives or information), or (iii) an indicationthat the project is not common practice in the host country. In the case of discretionary retrofits, the sale of the CERs may be the onlysource of cash income to the project implementer. As a result, additionality can be demonstrated by the fact that without the CERrevenues the entity implementing the programwould lack the resources to disseminate the
efficient lighting equipment, or to establish the necessary controls to ensure thatmanufacturers are complying with the standards and labeling requirements.7 In the case of planned replacement or new construction, the demonstration of additionality must again be seen from theperspective of those who fund and implementthe program. While efficient lighting is the least cost option from the perspective of theeventual energy bill payer, it is clearly not theleast cost option from the perspective of thebuilders/developers and landlords who take the decision on the investment.
(d) Predictability of emission reductions
An issue that is often raised in the context of most energy efficiency projects is how well ex-ante estimates of energy savings compare withthe ex-post measurement of the achievedsavings. In the case of CDM efficient lightingprojects, the issue is the required comparison of the expected emission reductions (forecasted prior to the installation of theefficient lighting equipment and typically based on engineering calculations) to the actualachieved reductions (based on post-implementation monitoring and verification). Once again, the efficiency industry has addressed this. “Energy savings projections noware much more accurate than they used to be, because we have decades of data from experience in the field. Also, withimprovements in program design over the years, especially toward increasing markettransformation and “spillover” effects, it is not at all uncommon for programs now to have realization rates8 in excess of 100%” (Vine et al, forthcoming). It remains to be seen howdependable energy saving projections turn out to be in the context of the CDM, but in anyevent, it is important to underscore that CERs are issued only after emission reductions have been actually verified (ex-post), and are thusindependent of projections.
7 This reflects the reality of most developing nations that are just introducing EE measures. In countries that are already on the verge of market transformation such as China, the demonstration of additionality may need to take into account expected trends and barriers to further market penetration.
8 The realization rate is calculated as the ex-post estimate of net savings divided by the ex-ante estimate of net savings. Net savings refer to the program impacts over-and-above naturally occurring energy efficiency.

474
- 7 -
(e) Free riders and positive spill over9
For certain programs, it is possible that some ofthe individual actions implemented might not be additional even if the program is demonstrated to be additional. These individual actions are considered “free riders”.The energy efficiency industry has for a longtime evaluated free riders, either explicitly or implicitly (Wiel and McMahon 2005). Explicitevaluations can be made using a control group,econometric methods, participant surveys, review of documents in business decision processes, payback comparisons, andengineering modeling. Implicit evaluations areoften made comparing the target users’ behavior to that in other regions or in othercountries where there are similar baselineconditions and no program in place (Wiel andMcMahon 2005). Not all of the approaches aresuitable for a given program, and the approaches differ with respect to their cost and the accuracy of their estimates. A program of activities needs to specify the proposedapproach used to estimate the emissionreductions attributed to free riders as part of the proposed baseline and monitoring methodology. All other emission reductionswould be deemed additional.
Independently of how free riders are measured,in many efficiency projects free riders aremore than offset by positive project spillover, i.e. additional energy efficiency impacts thatresult from the project, but are viewed as indirect rather than direct impacts. In these projects, actual reductions in energy use aregreater than those strictly attributed to theproject activity (Vine and Sathaye 1999, Quality Tonnes 2005). In efficient lightingprograms, positive spillover effects can occurthrough a variety of channels including: anindividual hearing about the benefits of the efficient equipment and deciding to purchase iton his/her own (“free drivers”); or programparticipants that, based on positive experience with the equipment, exchange additionalequipment beyond the maximum allotted per user by the program, or continue to purchase and use equipment with higher efficiency afterthe program’s end. Spillover is an unintended but welcome consequence of energy efficiency
9 For a more elaborate definition of these concepts, see, for example IEA 2003 (p. 160).
programs, and could make free riders a nonissue.
(f) Rebound effect and suppressed demand
The rebound effect refers to the increase in the demand for energy services (heating,refrigeration, lighting, etc.) when the cost of the service declines as a result of technical improvements in energy efficiency. Theargument is that because of the lower cost, consumers and businesses change their behavior, e.g. raise thermostat levels in thewinter; cool their buildings more in the summer; buy more appliances and/or operate them more frequently, thus eroding the savings from energy efficiency. There is a large bodyof literature suggesting that the rebound effectis indeed real in many situations and that it varies among countries and socioeconomicincome levels, but that it does not usually wipe out projected savings. Empirical evidencesuggests that the size of the rebound effect is small to moderate, with the exact magnitudedependent on the location, sector of theeconomy, and end-use. The rebound effect for residential lighting in industrialized countries has been shown to vary between 5-12%, whilethat for commercial lighting varies between 0-2% (IEA 2005:6). In efficient lighting CDMprojects the energy savings of lighting projects could be adjusted for the level of rebound effect (e.g. through an agreed default discountfactor that could be the midpoint of the variousestimates), thereby avoiding the cost of measuring the rebound in each individual project.
However, in the case of many developing countries, it is important to recognize that any rebound effect resulting from projectsimproving energy efficiency is often linked to situations of suppressed demand due to insufficient supply. At a December 2005 WorldBank-organized expert workshop discussing CDMmethodologies and issues associated withenergy efficiency, it was largely felt that “since CDM is promoting sustainabledevelopment, meeting suppressed demandthrough an energy efficiency project activityshould not be penalized.” (Quality Tonnes 2005). This would be consistent with the CDM modalities and procedures which stipulate that“the baseline may include a scenario wherefuture anthropogenic emissions by sources areprojected to rise above current levels…” (Para

475
- 8 -
46 of the CDM modalities and procedures10), as well as the treatment of suppressed demand in the context of CDM methodologies for powergeneration projects using renewable energy(see Approved Consolidated Methodology ACM00211 and Report of the 22nd meeting ofthe CDM Executive Board, Annex 2) where the activity level in the project scenario is used todetermine the activity level in the baseline scenario.
(g) Double counting
Under the CDM, double counting of emissionreductions must be avoided. Efficient lighting programs involve various stakeholder groups,all of which in theory could claim ownership of the energy savings and the associated CERs: the manufacturers of the technology, theintermediaries (wholesalers, retailers, utilities, etc.) the consumers (who may or may not pay the lighting energy bill), the entity thatmanages the financing, etc. However, double counting can be avoided by stipulating that the entity running the program is the only one authorized to claim CERs for the program, inorder to defray the costs of running the program. The other potential claimants would have to cede their claims to this entity in a separate agreement or in the agreementregarding the distribution of CERs. The avoidance of double counting must be checkedby a Designated Operational Entity (i.e. the entity designated to validate proposed CDM project activities as well as to verify and certify emission reductions). In the case of twoprograms that overlap geographically, the firstprogram to be registered must delineate its boundary. Any subsequent program wanting to claim credit for its actions within thatboundary, must prove that it is additional anddifferent to the first project, and does notclaim ERs that occur due to the first program.
(h) Leakage
Leakage is the net change of GHG emissionsoutside the CDM project boundary that is
10 Text of the 2001 Marrakech Accords (FCCC/CP/2001/13/Add.1) can be found on the UNFCCC website (www.unfccc.int).
11 ACM0002 is the "consolidated baseline methodology for grid-connected electricity generation from renewable sources", which can be found on the UNFCCC website (http://cdm.unfccc.int/methodologies/PAmethodologies/approved.html)
measurable and attributable to the CDM project activity. A CDM project activity mustestimate the associated leakage, and if it occurs, deduct the net leakage from theemission reductions achieved within the project boundary. In efficient lightingprograms, any leakage would mostly come fromthe unauthorized recycling of still functioning lighting equipment that has been displaced bythe more efficient equipment. Strictly speaking, in order to minimize leakage,efficient lighting programs that replace equipment would likely need to include a monitored scrapping component that ensuresthat replaced equipment is not used byothers12. However, from a scarce resources and development point of view, one might question the advisability of destroying functioningequipment in countries where there is evidenceof unmet demand and elastic supply.13 Fromthis perspective the methodological challengewould be to structure the project such thatleakage is minimized to ensure GHG reductionsas a result of the CDM project activity butlamps are not destroyed. More research mightbe warranted to better understand substitution effects in a developing country context.
(i) Monitoring and verification
Monitoring and verification are key to ensuringthat CERs correspond to actual emissionreductions. Emission reductions from single-site projects are rather straight-forward tomonitor and verify. Efficient lighting programsthat typically involve a large number of activities at different sites over a period of time require a feasible - but still rigorous andeffective - approach. For such projects,monitoring can be done through statisticallyrobust sampling techniques. A sampling plan can be used to select the sites to be monitored and to extrapolate the monitored results to thefull program with an acceptable level of statistical precision. Sampling is already part ofthe approved CDM methodologies for somesmall and large-scale CDM project activities.Depending upon the measures implemented,the energy savings, and hence emissionreductions, may be monitored by combinations
12 Ensuring safe disposal could address the environmental problem associated with the mercury content of light bulbs and waste material created by the destruction.
13 On the margin, replaced equipment could replace even less efficient equipment.

476
- 9 -
of metering and calculations, billing analysis,and/or use of models, as has been credibly done by the ESCO community for years (Vine etal, forthcoming).
The vast experience with EE programs worldwide over the past fifteen years has produced a series of widely acceptedmonitoring protocols.14 Since energy savings are easily translated into the equivalent GHG reductions - using CO2 emission factors for the relevant grid or source of power (e.g. see the CDM Approved Consolidated MethodologyACM0002) - these protocols can be effectivelyincorporated into monitoring methodologies forCDM programs of activities. The International Performance Measurement and VerificationProtocol (IPMVP)15 is perhaps the internationally preferred approach formonitoring and evaluating energy efficiencyprojects. The Protocol offers four options for calculating energy savings depending on the type of energy conservation measure. While the IPMVP is not detailed enough to serve as a CDMmonitoring methodology, it does provide acommon conceptual framework andterminology as a basis for the specific CDMmethodology that must be developed for eachtype of EE measure.
6. EXAMPLES OF CDM IN EFFICIENT LIGHTING PROGRAMS
There is currently only one registered CDM project where efficient lighting is being used as a source of CERs. The Kuyasa energy upgradeproject16 focuses on retrofitting existing low-cost urban housing in Cape Town, South Africa with energy efficient installations. The small-scale project has three components: insulatedceilings, solar water heater installation, andenergy efficient lighting. In the lighting component, two incandescent lamps arereplaced with two CFLs in each participating
14 See Hirst and Reed, 1991; Vine and Sathaye, 1999; FEMP,2000; IPMVP, 1996-2004; ASHRAE, 2002; and TecMarketWorks Framework Team, 2004.
15 http://www.ipmvp.org
16 See the UNFCCC CDM website: http://cdm.unfccc.int/Projects/DB/DNV- CUK1121165382.34/view.html
household, and income from the CERs is used tocover the cost of the replacement. The project uses an approved small scale CDM methodology (i.e. Demand-side energy efficiencyprogrammes for specific technologies AMS-II-C) for the lighting component. The proponents arenow considering upscaling this project to include 2 million homes.
At the time of writing, two other efficientlighting projects had been submitted for review: (i) an Efficiency Lighting Retrofitproject in Ghana, that intends to replaceincandescent lamps with labeled CFLs in 20,000 households, and (ii) the Green Lighting project in Shijiazhuang City, China, that intends toincrease the penetration of CFLs by using the CER revenues to lower the purchase price of CFLs. Both of these projects are large-scale,and there is no approved large-scale CDMmethodology for efficient lighting. Hence, eachof the projects has submitted a proposed newmethodology, currently under consideration onthe part of the Methodology Panel and theExecutive Board of the CDM. If they are approved they will provide helpful guidance onthe methodological issues discussed above.
The upcoming guidance will affect the CDM’s potential to stimulate GHG reductions throughhigher energy efficiency in lighting. Given thebarriers facing EE lighting and the dispersed nature and often small individual size of the activities to be covered by lighting programs,guidance covering the following elements would likely be most helpful in paving the way for a potential take-off of EE lighting activitiesin developing countries under the CDM: - Clear and practical implementation of the
COP/MOP1 decision on Programs ofActivities;
- Simple (without compromising environmental integrity) and broadlyapplicable (consolidated or standardized) baseline and monitoring methodologies,which can build on established efficient lighting methodologies and practices.
- Provisions to take into account - and notpenalize - situations of suppressed demandfor energy services.
- A practical means of addressing potentialfree-ridership, taking into account the often greater spill-over effect.
- Additionality assessment which takes intoaccount the barriers and market failures

477
- 10 -
facing EE projects and the fact thattraditional financial analysis of EE activitiesmay not appropriately address the costs of these barriers and market failures.
7. CONCLUSION Energy efficiency is one of the most promisingsectors for making energy more affordable, improving energy security and reducingemissions in developing countries. End-use energy efficiency accounts for about 50% of energy-related abatement potentials identified in International Energy Agency analyses such asthe World Energy Outlook (2004) and the Energy Technology Perspectives (2006). As discussed, the adoption of energy efficient options is not common practice because ofwell-documented market failures, and largelybecause they have thus far not received thesame attention as renewable energy ingovernment energy policies and in the lending portfolio of the multilateral banking system.
Energy efficient lighting could contribute to the long term objective of stabilizing greenhousegas concentrations in the atmosphere, particularly if the global lighting market is transformed to high efficiency. The CDM cannotachieve this on its own, but it could jump startsome of the programs that lead to the desired market transformation.
In the meantime, the greater complexity of implementing end-user energy efficiencyprojects, and the uncertainty as to their “fit” under the CDM prior to the inclusion of programs has kept the proportion of energyefficiency projects in the CDM pipeline verylow. It is hoped that the new option of “programs of activities” in the CDM will openthe door to the implementation of a larger number of end-user energy efficiency projects in developing countries, serving as a learning ground for future energy markettransformations.
Established efficient lighting practices can be used in new methodologies that comply with CDM requirements. The development of rigorous evaluation practices and protocols,along with years of experience in assessing the impacts and results of energy efficiencyprograms, has done much to improve the ability
to accurately estimate program impacts on energy use. Experience has shown that the only effective way to accelerate the efficient use of energy is to combine the “push” of minimumperformance standards with the “pull” from financial mechanisms. By integrating the CDMinto energy efficiency programs, the market value of the CERs can facilitate both the pushand the pull.

478
- 11 -
ANNEX I OVERVIEW OF RESOURCES FOR THE ASSESSMENT OF EFFICIENT LIGHTING PROJECTS
1- Standards and labeling programs:
Collaborative Labeling and Appliance Standards Program (CLASP) An outgrowth ofLawrence Berkeley National Laboratory andsupported by UNDP/GEF, CLASP is an independent global technical non profitinstitution that promotes efficiency standardsand labels worldwide. The CLASP Handbook forEnergy Efficient Labels and Standards is theleading guidebook on how to establish labeling and/or standard setting programs. Authored by Stephen Wiel, and James McMahon, EnergyEfficient Labels and Standards: A Guidebook for Appliances, Equipment and Lighting ispublished by Collaborative Labeling and Appliance Standards Program, Washington DC, February 2005 and available for download at nocost. It is available in English, Chinese, Koreanand Spanish.
Further information: www.clasponline.org
2- Certification of equipment:
Efficient Lighting Initiative (ELI) Facilitated by the International Finance Corporation (IFC) with funding from the GEF, ELI is a voluntaryinternational program that certifies the qualityand efficiency of lighting products. It isoperated by a non-profit organization, the ELI Quality Certification Institute, whose mission isto provide a transparent mechanism for certifying the quality and efficiency of lightingproducts sold worldwide. Lighting manufacturers can submit their products to theELI Quality Certification Institute, and if the products comply with the ELI specifications,they may bear the ELI “Green Leaf” logo. So far the ELI Quality Certification Institute has developed technical specifications for self-ballasted compact fluorescent lamps, double-capped fluorescent lamps, and fluorescent lamp ballasts.
Further information: www.efficientlighting.net
3- Monitoring and verification:
International Performance Measurement andVerification Protocol (IPMVP) The mostpreferred approach for monitoring andevaluating energy efficiency projects. It is the result of approximately 20,000 hours contributed by over 300 experts worldwide overan eight-year period. North America’s energyservice companies have adopted the IPMVP asthe industry standard approach to measurement and verification. Translated into 10 languages, it is used in over 30 countries as the basis for quantifying, monitoring andverifying energy savings, the ultimate purposeof energy efficiency programs. The IPMVP centers around two components: (1) verifyingproper installation and the measure’s potentialto generate savings; and (2) measuring actual savings. The protocol offers four options forcalculating energy savings depending on the type of energy conservation measure.
Further information: www.ipmvp.org

479
- 12 -
ANNEX II GLOSSARY OF CDM TERMS USED
(as defined by Methodology Panel andapproved by the Executive Board of the CDM)
Baseline: The scenario that reasonablyrepresents the anthropogenic emissions bysources of greenhouse gases that would occur in the absence of the proposed project activity.
Baseline Methodology: A methodology is anapplication of a baseline approach, defined in paragraph 48 of the CDM modalities andprocedures, to an individual project activity(reflecting aspects such as sector and region).
Certified Emission Reductions (CER): A "certified emission reduction" or "CER" is a unitissued pursuant to Article 12 and requirementsthere under, as well as the relevant provisions in these modalities and procedures, and is equal to one metric tonne of carbon dioxideequivalent, calculated using global warming potentials defined by decision 2/CP.3 or assubsequently revised in accordance with Article 5 of the Kyoto Protocol.
Designated Operational Entity (DOE): An entity designated by the COP/MOP based onthe recommendation by the CDM executiveboard as qualified to validate proposed CDM project activities as well as verify and certifyreductions in anthropogenic emissions by sources of greenhouse gasses. A designatedoperational entity shall perform validation or verification and certification.
Issuance of Certified Emissions Reductions:Issuance refers to forwarding the CERs to theregistry accounts of project participantsinvolved in a project activity.
Leakage: The net change of anthropogenicemissions by sources of greenhouse gases whichoccurs outside the project boundary, and which is measurable and attributable to the CDM project activity.
Monitoring methodology: A monitoringmethodology refers to the method used byproject participants for collection and archiving
of all relevant data necessary for the implementation of monitoring plan.
Small scale project activities: There arethree types of small scale project activities: - Type I: Renewable energy project
activities with a maximum output capacity of 15 MW (or an appropriate equivalent);
- Type II: Energy efficiency improvementproject activities, which reduce energyconsumption, on the supply and/or demandside, by up to a maximum of 60 GWh per year (or an appropriate equivalent);
- Type III: Other project activities that result in emission reduction of less than or equal to 60 ktCO2e annually.
Small scale project activities follow simplifiedmodalities and procedures as defined byDecision 21/CP.8.

480
- 13 -
REFERENCES Arquit Niederberger, A., and R. Spalding
Fecher, Demand -side energy efficiencypromotion under the Clean Development Mechanism: Lessons learned and future prospects. Energy for Sustainable Development,(in press), 2006.
California Public Utilities Commission (CPUC). California Evaluation Protocols: Technical, Methodological, and Reporting Requirements for Evaluation Professionals, San Francisco, CA, 2006.
Community Development Carbon Fund (CDCF), Annual Report 2004, 2004 (www.carbonfinance.org)
Figueres, C. with Econergy International Corp. and Margaree Consultant Inc., Programmatic CDM Project Activities: Eligibility, Methodological Requirements and Implementation, Carbon Finance Unit of the World Bank, November 2005
Heister, J., P. Karani, K. Poore, C. Sinha, R. Selrod: "The World Bank's Experience with the Activities Implemented Jointly Pilot Phase", Chapter 11 in Dixon, Robert editor, The UN Framework Convention on Climate Change Activities Implemented Jointly Pilot: Experiences Learned and Lessons Learned. Kluwer Academic Publishers. 1999
Hirst, E. and J. Reed, Handbook of Evaluation of Utility DSM Programs, Oak Ridge National Laboratory, 1991
International Energy Agency, Cool Appliances: Policy Strategies for Energy-Efficient Homes. Paris, France. 2003
International Energy Agency, Light’s Labour’s Lost. Paris, France 2006
International Energy Agency, The Experience with Energy Efficiency Policies and Programmes in IEA Countries: Learning from the Critics. Paris, France 2005
International Energy Agency, World Energy Outlook 2004, Paris, France. 2004
OECD/IEA, Energy Efficiency Case Study in Emission Baselines: Estimating the Unknown. Paris, France. 2000
Quality Tonnes, Expert Workshop on CDMMethodologies and technical Issues Associatedwith Power generation and Power Saving Project Activities, prepared for the World Bank Carbon Finance Unit, December 2005.
Vine, E. and J. Sathaye, Guidelines for the Monitoring, Evaluation, Reporting, Verification, and Certification of Energy-Efficiency Projects For Climate ChangeMitigation, LBNL-41543 Lawrence Berkeley National Laboratory, Berkeley, CA, 1999
Vine, E., M. Kushler and D. York, “Myth #14: Energy Efficiency Measures are Not Reliable, Predictable, or Enforceable,” in B. K. Sovacool and M. A. Brown (eds.), Energy and American Society: Fourteen Myths, Springer Press, New York, forthcoming.
Wiel, S. and J. McMahon, Energy Efficient Labels and Standards: A Guidebook for Appliances, Equipment and Lighting, Collaborative Labeling and Appliance Standards Program, Washington DC, February 2005.
World Bank, Clean Energy and Development: Towards an Investment Framework. 2006
www.apec-esis.org International CFL Harmonization Initiative
www.ashrae.org American Society of Heating, Refrigerating and Air-Conditioning Engineers
www.carbonfinance.org Carbon Finance Unit of the World Bank
www.cd4cdm.org Capacity Building for the Clean Development Mechanism
www.clasponline.org Collaborative Labeling and Appliance Standards Program
www1.eere.energy.gov/femp Federal Energy Management Program
www.efficientlighting.net The EfficientLighting Initiative

481
- 14 -
www.eu-greenlight.org European Union Green Light
www.gefweb.org Global Environment Facility
www.ipmvp.org International Performance Measurement and Verification Protocol
www.undp.org United Nations Development Programme

back to
first page