industrial refrigeration consortium ... - irc.wisc.edu
TRANSCRIPT

BACK TO BASICS:PIPE INSULATION
Todd Jekel, Ph.D., P.E.Assistant Director, IRC
INDUSTRIAL REFRIGERATION CONSORTIUM
RESEARCH & TECHNOLOGY FORUM
MAY 2-3, 2012

• Basics of insulation & insulation systems1
• Industry insulation recommendations2
• Annual energy simulation3
• Conclusions4
Overview
INSULATION BASICS

Why do we insulate piping?
• Preserve the refrigerant state by limiting heat loss or gain
• Limit temperatures of jacketing to– protect personnel (high temperature)– protect product/space/system (low temperature)
from free water (condensation) or weight (ice formation)
• Protect the underlying piping from corrosion by keeping the piping cold & dry (vapor retarder)

How Insulation Works• Uses low thermal conductivity materials• Material manufactured
with trapped bubbles oflow thermal conductivityblowing agents
• Reduction of surface temperature relative to ambient further reduces convection & radiation and inhibits condensation & ice growth

Heat Transfer
• One-dimensional, steady-state, conduction heat transfer in cylindrical coordinates
��𝑄 =2𝜋𝜋𝜋𝜋𝜋𝜋 � 𝑇𝑇𝑠𝑠,1 − 𝑇𝑇𝑠𝑠,2
ln ⁄𝑑𝑑2 𝑑𝑑1• 𝜋𝜋 is a property of the insulation chosen• 𝑑𝑑2 = 𝑑𝑑1 + 2 � 𝑡𝑡• ��𝑄 is a heat rate, i.e. units of Btu/hr, tons, kWt
d2
d1
TS,2TS,1
k

Heat Transfer, continued
• Convection𝑄𝑄𝑐𝑐 = ℎ � 𝐴𝐴2 � 𝑇𝑇𝑠𝑠,2 − 𝑇𝑇𝑜𝑜
– ℎ is a property of the orientation, diameter, velocity, and temperatures
– 𝐴𝐴2 = 𝜋𝜋 � 𝑑𝑑1 + 2 � 𝑡𝑡 � 𝜋𝜋– 𝑄𝑄𝑐𝑐 is a heat rate, i.e. units of Btu/hr, tons, kWt
hk
𝑄𝑄𝑐𝑐
TS,2

Heat Transfer, continued
• Radiation𝑄𝑄𝑟𝑟 = 𝜀𝜀 � 𝜎𝜎 � 𝐴𝐴2 � 𝑇𝑇𝑠𝑠,2
4 − 𝑇𝑇𝑜𝑜4
– 𝑄𝑄𝑟𝑟 is a heat rate, i.e. units of Btu/hr, tons, kWt
– 𝜀𝜀 is the surface emittance– 𝜎𝜎 is the Stefan Boltzmann constant– 𝐴𝐴2 = 𝜋𝜋 � 𝑑𝑑1 + 2 � 𝑡𝑡 � 𝜋𝜋

Heat Transfer, cont.
• Increasing the insulation thickness– increases the conduction resistance, reducing
heat transfer & surface temperature relative to surroundings
– increases the area over which convection & radiation acts, increasing relative heat transfer
– Does an “optimum” exist?
• Energy Balance on jacket surface��𝑄 = 𝑄𝑄𝑐𝑐 + 𝑄𝑄𝑟𝑟

Design Analysis
• Assumptions:– Ambient conditions: quiescent, 95°F, outdoors– Pipe at uniform temperature– Insulation 𝜋𝜋 = 0.0195 Btu/hr-ft-°F– Aluminum jacket (weathered) 𝜀𝜀= 0.3
𝑄𝑄𝑟𝑟 ��𝑄𝑐𝑐
��𝑄
𝑇𝑇𝑜𝑜
𝑇𝑇𝑠𝑠,1
𝑇𝑇𝑠𝑠,2
𝑑𝑑2
𝑑𝑑1

Analysis (Load v. 8” Pipe Temperature)

Analysis (Load v. 4” Pipe Temperature)
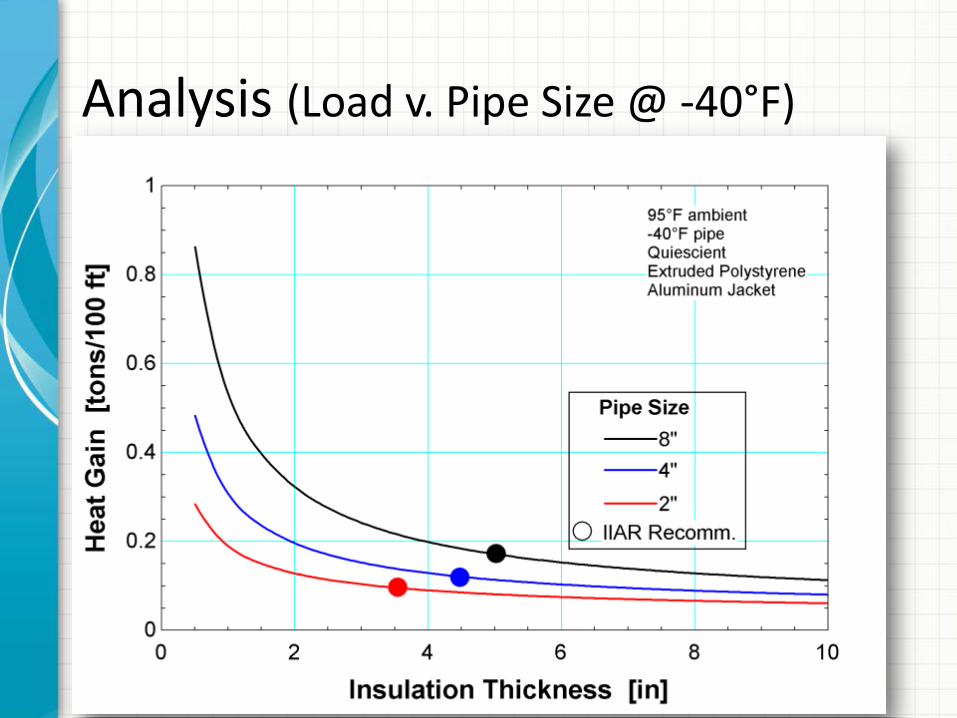
Analysis (Load v. Pipe Size @ -40°F)
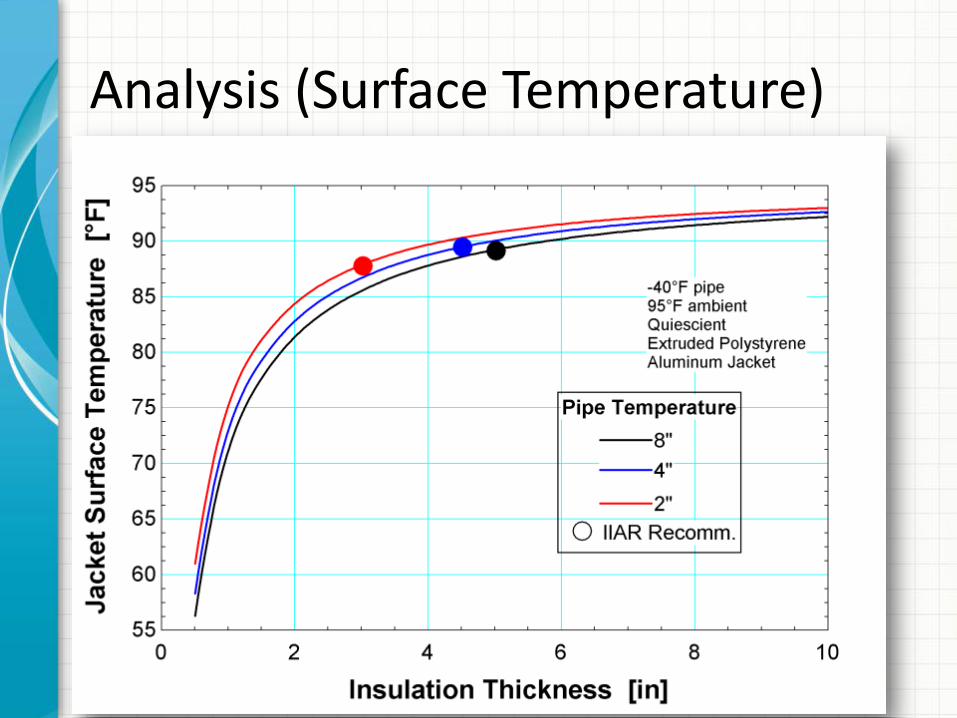
Analysis (Surface Temperature)

Analysis

Observations
• Used NAIMA’s 3EPlus (v. 4) to verify the analysis with good agreement
• For the range of insulation thicknesses in our industry, an “optimum” insulation thickness doesn’t occur

INDUSTRYRECOMMENDATIONS
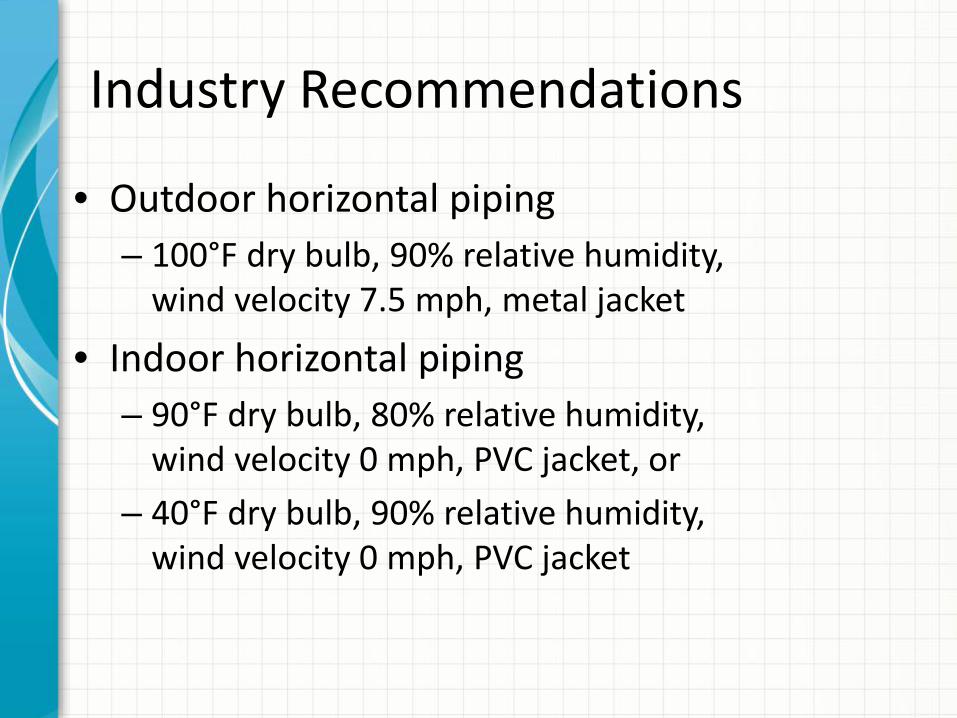
Industry Recommendations
• Outdoor horizontal piping– 100°F dry bulb, 90% relative humidity,
wind velocity 7.5 mph, metal jacket
• Indoor horizontal piping– 90°F dry bulb, 80% relative humidity,
wind velocity 0 mph, PVC jacket, or– 40°F dry bulb, 90% relative humidity,
wind velocity 0 mph, PVC jacket

IIAR Recommended Thickness
Nominal Pipe Size (in)
Service Temperature (°F)
-40 -20 0 +20 +40
2 3.5 3 3 2.5 2
2-½ 3.5 3 3 2.5 2.5
3 4 3.5 3.5 3 2.5
4 4.5 3.5 3.5 3 2.5
5 4.5 4 3.5 3 2.5
6 4.5 4.5 3.5 3 2.5
8 5 4.5 4.5 3 2.5
10 5.5 5 4.5 3.5 3
12 5.5 5 4.5 3.5 3
Table 7-3 IIAR Ammonia Refrigeration Piping HandbookExtruded Polystyrene insulation on outdoor piping

IIAR Recommended Thickness
Nominal Pipe Size (in)
Service Temperature (°F)
-40 -20 0 +20 +40
2 2.5 2 2 1.5 1.5
2-½ 2.5 2 2 1.5 1.5
3 2.5 2.5 2 2 1.5
4 3 2.5 2 2 1.5
5 3 2.5 2.5 2 1.5
6 3 2.5 2.5 2 1.5
8 3 2.5 2.5 2 1.5
10 3 3 2.5 2 1.5
12 3.5 3 2.5 2 1.5
Table 7-4 IIAR Ammonia Refrigeration Piping HandbookExtruded Polystyrene insulation on indoor piping (90°F)

IIAR Recommended Thickness
Nominal Pipe Size (in)
Service Temperature (°F)
-40 -20 0 +10
2 4 3 2 2
2-½ 4 3 2 2
3 4 3.5 2.5 2
4 4.5 3.5 2.5 2
5 4.5 3.5 2.5 2
6 4.5 4 3 2
8 5 4 3 2.5
10 5 4 3 2.5
12 5.5 4.5 3 2.5
Table 7-5 IIAR Ammonia Refrigeration Piping HandbookExtruded Polystyrene insulation on indoor piping (40°F)

SIMULATION

Energy Analysis
• Previous analysis was for design conditions, but what about the energy impact over the year?
• To estimate that, will need– Weather data, including wind & solar– Model that accounts for the solar gain– Refrigeration system efficiency

Weather Values
• Data excerpt for Madison, WI TMY2 dataMonth Day Hour GHR DB DP WS
Btu/hr-ft2 °F °F mph1 1 6 0.00 34.0 28.9 13.871 1 7 0.00 33.6 29.7 13.201 1 8 2.54 33.4 30.2 12.301 1 9 12.05 33.1 30.0 11.631 1 10 26.31 33.4 30.9 10.741 1 11 43.11 33.6 31.5 10.07
• Descriptions– GHR = Global Horizontal Radiation (solar),
Btu/hr-ft2-F– DB = Dry bulb temperature, deg F– DP = Dewpoint temperature, deg F– WS = Wind speed, mph

Model Description
• Split insulation in half– Upper half is exposed to solar radiation– Lower half is not– Both halves get the same convection coefficient
• Horizontal cylinder in cross-flow or natural convection depending on wind speed
• Hourly calculation to determine the total load on the piping due to heat gain through insulation
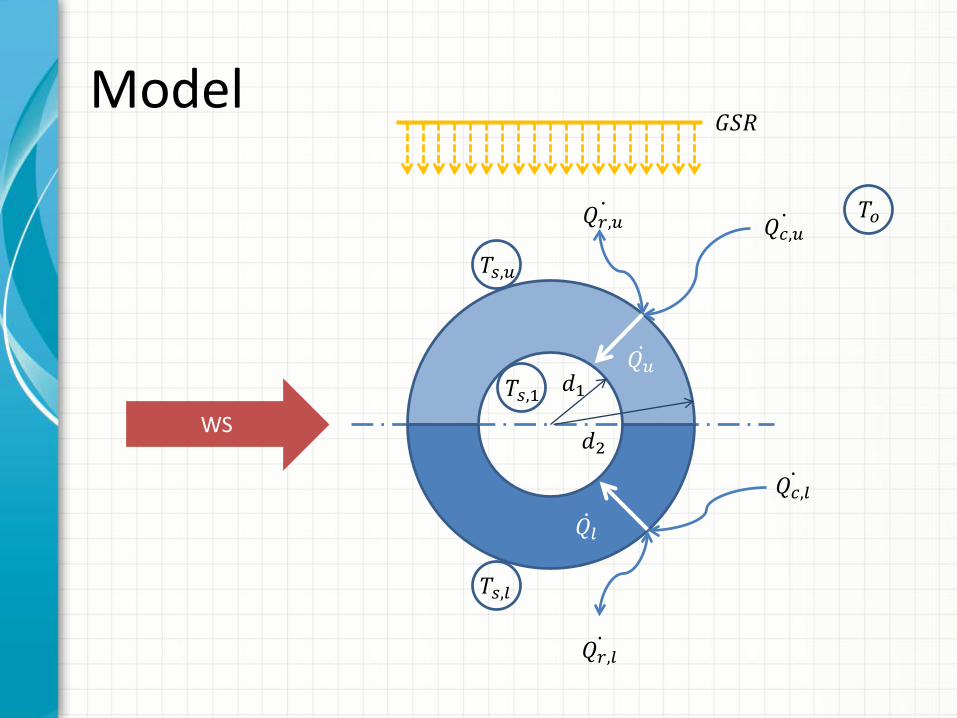
Model
𝑄𝑄𝑟𝑟,𝑢𝑢 𝑄𝑄𝑐𝑐,𝑢𝑢
𝑄𝑄𝑢𝑢
𝑇𝑇𝑜𝑜
𝑇𝑇𝑠𝑠,1
𝑇𝑇𝑠𝑠,𝑢𝑢
𝑑𝑑2
𝑑𝑑1
��𝑄𝑙𝑙
𝑄𝑄𝑟𝑟,𝑙𝑙
𝑄𝑄𝑐𝑐,𝑙𝑙
𝑇𝑇𝑠𝑠,𝑙𝑙
𝐺𝐺𝐺𝐺𝐺𝐺
WS

Refrigeration System Efficiency

Results for Piping @ -40°FPipe Size [in] Insulation
Thickness[in]
Annual HeatGain [ton-hrs
per 100 ft]
Annual Cost per 100 ft
8” 5” 1,014 $180
8” 3” 1,456 $260
4” 4.5” 707 $125
4” 3” 907 $160
2” 3.5” 562 $100
2” 3” 610 $110
Assumptions• Madison, WI• 2.4 HP/ton• $0.10/kWh
Pipe Size [in] Insulation Thickness
[in]
Annual HeatGain [ton-hrs
per 100 ft]
Annual Cost per 100 ft
8” 5” 3,730 $670
Failed Insulation Estimate†
Properly Maintained Insulation Estimate
† Factor of 2 loss of insulation thermal conductivity on top, factor of 6 on the bottom

Results for Piping @ +20°FPipe Size [in] Insulation
Thickness[in]
Annual HeatGain [ton-hrs
per 100 ft]
Annual Cost per 100 ft
8” 3” 540 $36
4” 3” 224 $22
2” 2.5” 165 $16
Assumptions• Madison, WI• 0.9 HP/ton• $0.10/kWh
Pipe Size [in] Insulation Thickness
[in]
Annual HeatGain [ton-hrs
per 100 ft]
Annual Cost per 100 ft
8” 3” 1,826 $120
Failed Insulation Estimate†
Properly Maintained Insulation Estimate
† Factor of 2 loss of insulation thermal conductivity on top, factor of 6 on the bottom

Results for Piping @ -40°FPipe Size [in] Insulation
Thickness[in]
Annual HeatGain [ton-hrs
per 100 ft]
Annual Cost per 100 ft
8” 5” 1,340 $240
8” 3” 1,920 $340
4” 4.5” 935 $170
4” 3” 1,200 $215
2” 3.5” 740 $135
2” 3” 805 $145
Assumptions• Tampa, FL• 2.4 HP/ton• $0.10/kWh
Pipe Size [in] Insulation Thickness
[in]
Annual HeatGain [ton-hrs
per 100 ft]
Annual Cost per 100 ft
8” 5” 4,900 $880
Failed Insulation Estimate†
Properly Maintained Insulation Estimate
† Factor of 2 loss of insulation thermal conductivity on top, factor of 6 on the bottom

Results for Piping @ +20°FPipe Size [in] Insulation
Thickness[in]
Annual HeatGain [ton-hrs
per 100 ft]
Annual Cost per 100 ft
8” 3” 1,010 $68
4” 3” 625 $42
2” 2.5” 465 $31
Assumptions• Tampa, FL• 0.9 HP/ton• $0.10/kWh
Pipe Size [in] Insulation Thickness
[in]
Annual HeatGain [ton-hrs
per 100 ft]
Annual Cost per 100 ft
8” 3” 3,460 $230
Failed Insulation Estimate†
Properly Maintained Insulation Estimate
† Factor of 2 loss of insulation thermal conductivity on top, factor of 6 on the bottom
Conclusions
• IF insulation system is properly maintained the parasitic load is relatively low
• Failed insulation systems NOT ONLY effect the heat load, BUT ALSO put the underlying piping at increased risk for corrosion

Resources
• IIAR Ammonia Refrigeration Piping Handbook, Chapter 7
• ASHRAE 2010 Refrigeration Handbook, Chapter 10
• NAIMA 3EPlus (http://www.pipeinsulation.org/)

QUESTIONS?