industry betas us
TRANSCRIPT
8/3/2019 Industry Betas US
http://slidepdf.com/reader/full/industry-betas-us 1/2
1 R.C. Ybañez • UP College of Business Administration
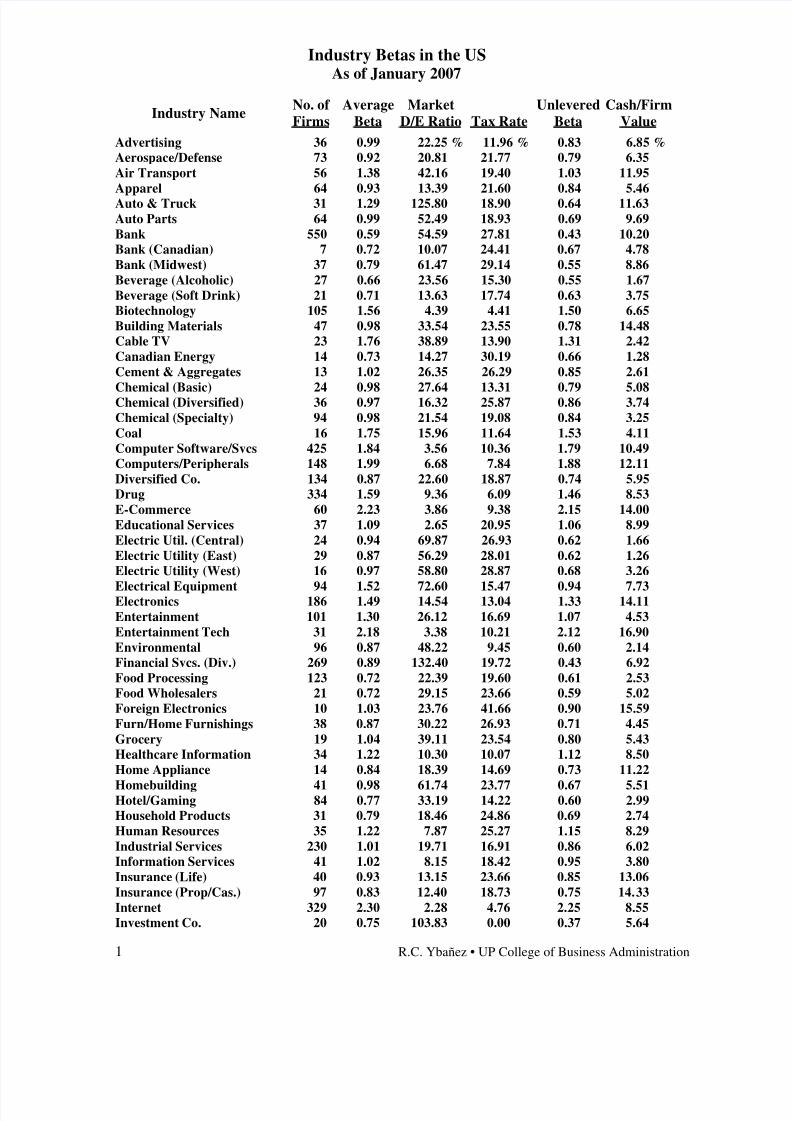
Industry Betas in the USAs of January 2007
Industry NameNo. of
Firms
Average
Beta
Market
D/E Ratio
Tax Rate
Unlevered
Beta
Cash/Firm
Value
Advertising 36 0.99 22.25 % 11.96 % 0.83 6.85 %
Aerospace/Defense 73 0.92 20.81 21.77 0.79 6.35
Air Transport 56 1.38 42.16 19.40 1.03 11.95
Apparel 64 0.93 13.39 21.60 0.84 5.46
Auto & Truck 31 1.29 125.80 18.90 0.64 11.63
Auto Parts 64 0.99 52.49 18.93 0.69 9.69
Bank 550 0.59 54.59 27.81 0.43 10.20
Bank (Canadian) 7 0.72 10.07 24.41 0.67 4.78
Bank (Midwest) 37 0.79 61.47 29.14 0.55 8.86
Beverage (Alcoholic) 27 0.66 23.56 15.30 0.55 1.67
Beverage (Soft Drink) 21 0.71 13.63 17.74 0.63 3.75
Biotechnology 105 1.56 4.39 4.41 1.50 6.65
Building Materials 47 0.98 33.54 23.55 0.78 14.48
Cable TV 23 1.76 38.89 13.90 1.31 2.42
Canadian Energy 14 0.73 14.27 30.19 0.66 1.28
Cement & Aggregates 13 1.02 26.35 26.29 0.85 2.61
Chemical (Basic) 24 0.98 27.64 13.31 0.79 5.08Chemical (Diversified) 36 0.97 16.32 25.87 0.86 3.74
Chemical (Specialty) 94 0.98 21.54 19.08 0.84 3.25
Coal 16 1.75 15.96 11.64 1.53 4.11
Computer Software/Svcs 425 1.84 3.56 10.36 1.79 10.49
Computers/Peripherals 148 1.99 6.68 7.84 1.88 12.11
Diversified Co. 134 0.87 22.60 18.87 0.74 5.95
Drug 334 1.59 9.36 6.09 1.46 8.53
E-Commerce 60 2.23 3.86 9.38 2.15 14.00
Educational Services 37 1.09 2.65 20.95 1.06 8.99
Electric Util. (Central) 24 0.94 69.87 26.93 0.62 1.66
Electric Utility (East) 29 0.87 56.29 28.01 0.62 1.26
Electric Utility (West) 16 0.97 58.80 28.87 0.68 3.26
Electrical Equipment 94 1.52 72.60 15.47 0.94 7.73Electronics 186 1.49 14.54 13.04 1.33 14.11
Entertainment 101 1.30 26.12 16.69 1.07 4.53
Entertainment Tech 31 2.18 3.38 10.21 2.12 16.90
Environmental 96 0.87 48.22 9.45 0.60 2.14
Financial Svcs. (Div.) 269 0.89 132.40 19.72 0.43 6.92
Food Processing 123 0.72 22.39 19.60 0.61 2.53
Food Wholesalers 21 0.72 29.15 23.66 0.59 5.02
Foreign Electronics 10 1.03 23.76 41.66 0.90 15.59
Furn/Home Furnishings 38 0.87 30.22 26.93 0.71 4.45
Grocery 19 1.04 39.11 23.54 0.80 5.43
Healthcare Information 34 1.22 10.30 10.07 1.12 8.50
Home Appliance 14 0.84 18.39 14.69 0.73 11.22
Homebuilding 41 0.98 61.74 23.77 0.67 5.51Hotel/Gaming 84 0.77 33.19 14.22 0.60 2.99
Household Products 31 0.79 18.46 24.86 0.69 2.74
Human Resources 35 1.22 7.87 25.27 1.15 8.29
Industrial Services 230 1.01 19.71 16.91 0.86 6.02
Information Services 41 1.02 8.15 18.42 0.95 3.80
Insurance (Life) 40 0.93 13.15 23.66 0.85 13.06
Insurance (Prop/Cas.) 97 0.83 12.40 18.73 0.75 14.33
Internet 329 2.30 2.28 4.76 2.25 8.55
Investment Co. 20 0.75 103.83 0.00 0.37 5.64

8/3/2019 Industry Betas US
http://slidepdf.com/reader/full/industry-betas-us 2/2
2 R.C. Ybañez • UP College of Business Administration
Industry NameNo. of
Firms
Average
Beta
Market
D/E Ratio
Tax Rate
Unlevered
Beta
Cash/Firm
Value
Investment Co.(Foreign) 15 1.21 4.09 2.49 1.16 2.53
Machinery 139 1.01 31.26 20.52 0.81 4.62
Manuf. Housing/RV 19 0.99 19.00 19.77 0.86 11.03
Maritime 46 0.86 60.09 5.91 0.55 4.39
Medical Services 186 0.94 17.47 17.17 0.82 11.80
Medical Supplies 279 1.11 6.47 13.16 1.05 6.74
Metal Fabricating 37 1.01 15.88 24.89 0.91 3.46
Metals & Mining (Div.) 82 1.04 8.74 7.81 0.96 3.22Natural Gas (Distrib.) 30 0.73 60.93 30.18 0.51 2.60
Natural Gas (Div.) 34 1.01 40.33 22.04 0.77 3.91
Newspaper 18 0.76 30.08 24.85 0.62 1.53
Office Equip/Supplies 26 1.02 24.34 29.99 0.87 6.01
Oilfield Svcs/Equip. 110 1.05 11.72 21.42 0.96 4.33
Packaging & Container 36 0.87 55.22 25.40 0.61 3.60
Paper/Forest Products 42 0.84 56.50 15.72 0.57 5.38
Petroleum (Integrated) 30 0.96 9.00 29.47 0.90 5.16
Petroleum (Producing) 178 0.88 13.69 14.79 0.79 1.71
Pharmacy Services 20 0.93 9.04 27.16 0.88 3.59
Power 41 2.39 17.83 6.84 2.05 1.76
Precious Metals 67 0.90 7.10 6.54 0.84 4.65
Precision Instrument 104 1.71 8.97 17.07 1.59 13.52Publishing 50 0.89 32.54 18.02 0.70 3.76
R.E.I.T. 143 0.77 63.99 1.41 0.47 4.65
Railroad 20 0.96 29.86 23.61 0.78 1.98
Recreation 84 1.12 20.04 18.03 0.96 4.94
Restaurant 81 0.80 15.21 19.13 0.71 4.14
Retail (Special Lines) 164 0.98 8.43 23.42 0.92 9.15
Retail Automotive 15 1.04 34.98 34.85 0.84 4.60
Retail Building Supply 9 0.95 5.82 27.35 0.91 1.26
Retail Store 51 0.94 16.61 21.10 0.83 4.47
Securities Brokerage 32 1.29 155.35 21.27 0.58 25.89
Semiconductor 124 2.92 4.97 10.47 2.79 12.37
Semiconductor Equip 14 2.95 7.53 21.31 2.78 18.08
Shoe 24 1.08 3.64 28.93 1.05 8.36
Steel (General) 30 1.16 14.62 29.85 1.05 7.35
Steel (Integrated) 16 1.50 23.62 18.09 1.26 9.77
Telecom. Equipment 136 2.35 5.28 10.38 2.24 14.60
Telecom. Services 173 1.43 32.64 12.90 1.11 3.55
Thrift 248 0.56 22.62 25.14 0.48 11.25
Tire & Rubber 10 0.96 14.18 5.94 0.85 6.11
Tobacco 11 0.79 17.06 26.74 0.70 4.02
Toiletries/Cosmetics 21 0.83 18.06 20.95 0.72 4.94
Trucking 38 0.98 40.58 30.50 0.77 5.40
Utility (Foreign) 6 1.00 62.76 11.52 0.64 3.70
Water Utility 16 0.73 48.86 29.78 0.54 0.70
Wireless Networking 73 2.41 17.70 9.93 2.08 6.50
Other 1 1.06 2.45 0.00 1.03 1.44
Market 7,657 1.14 32.11 % 16.40 % 0.90 7.53 %
Source: Aswath Damoraran, based on Value Line database
http://pages.stern.nyu.edu/~adamodar/New_Home_Page/datafile/Betas.html
Note: Beta from regression of weekly stock returns against NYSE Composite, past 5 years.
Tax rate is tax/taxable income, in the absence of info on the more appropriate
measure, the marginal income tax rate.