industry evaluations of the status and prospects for … evaluations of the status and prospects for...
TRANSCRIPT
1
Program on Dairy Markets and Policy Research Paper Series Industry Evaluations of the Status and Prospects for the Burgeoning New York Greek-style Yogurt Industry
Research Paper Number RP13-01
October 2013
Robert D. Boynton and Andrew M. Novakovic•
ABSTRACT
The production of Greek yogurt has nearly quadrupled from 2008 to 2013 in New York. In the last decade, Greek yogurt has gone from being a relatively obscure product imported from Greece to New York City to an exciting new product that is transforming the retail dairy case, spinning off a host of new products, and capturing the imaginations of consumers around the country.
The paper is the first of two that will look at the phenomenon of the Greek yogurt boom. In this paper, the focus is on what we know about this relatively new industry and how we can explain and understand its relationship to the New York dairy sector in particular. The study looks at publicly available data but also relies on interviews of yogurt manufacturers and milk suppliers operating in New York.
Long a significant player in the yogurt category, New York rapidly moved to become the dominant player in the Greek yogurt segment and is now the leading manufacturer of yogurt in the U.S. The large farm milk production sector in New York is an important factor in the development of this product segment, but the proximity of this large production area relative to the demographically large, rich and diverse populations centers of the northern Atlantic coast is even more important. The new Greek yogurt category has strong appeal and should be a durable feature in U.S. dairy markets, but this is not without challenges to maintaining and strengthening New York's role in this burgeoning sector.
*The authors are on the faculty of Cornell University in the Charles H. Dyson School of Applied Economics and
Management. Robert Boynton is an Adjunct Professor. Andrew Novakovic is The E.V. Baker Professor of Agricultural Economics. The Research Paper series is intended for academic papers that develop new insights or rigorous explorations of dairy market economics or policy. The authors reserve all copyrights on this paper.
2
TABLE OF CONTENTS
ABSTRACT........................................................................................................................ 1
TABLE OF CONTENTS...................................................................................................... 2
LIST OF TABLES................................................................................................................ 4
LIST OF FIGURES ............................................................................................................. 4
INTRODUCTION AND OBJECTIVES OF THE STUDY ..................................................... 5
General Design of the Cornell Yogurt Market Study ................................................... 7
Methodology ............................................................................................................... 7
DESCRIPTION OF THE YOGURT INDUSTRY.................................................................. 8
What is Greek Yogurt? ................................................................................................ 8
Available Data on Yogurt Production, Milk Usage, and Consumption .................. 11
Yogurt Production ................................................................................................ 13
Yogurt Consumption ............................................................................................ 17
Foodservice and Other-Than-Retail Sales ............................................................. 19
Share of Stomach and Share of Market ................................................................. 20
The Importance of Milk Production .......................................................................... 21
New York Production Characteristics Compared to Other States .......................... 21
Milk Production Dynamics Within New York....................................................... 24
Large New York Milk Producing Counties ............................................................ 25
Characteristics of New York Milk Production Regions .......................................... 28
New York Production Regions Compared to the Rest of the U.S........................... 32
OBSERVATIONS ON THE GREEK YOGURT INDUSTRY................................................ 33
General Observations about Development of the Greek Yogurt Industry in NY....... 33
Yogurt Plant Siting Factors.................................................................................... 33
The Rich and Varying Nature of Greek Yogurt Companies ................................... 36
Observations on the State of the Greek Yogurt Industry in New York and the Northeast............................................................................................................. 36
Farmers Have Positive Attitude Toward Greek Yogurt .......................................... 36
Demand Growth Expected to Continue ................................................................ 37

3
Greek Yogurt is Not Expected to Have a Federal Standard of Identity Soon .......... 38
The Yogurt Case is Cluttered at Best and Confusing at Worst................................ 39
Barriers to Entry Have Increased........................................................................... 42
Acid Whey Disposal is a Major Cost Factor.......................................................... 42
Competition is Increasing and Not All May Survive.............................................. 43
Greek Yogurt Industry in NY Has Affected Cream and Butter Markets .................. 44
Observations on the Future of the Greek Yogurt Industry in NY .............................. 44
New York Will Remain the Largest Greek Yogurt Manufacturing State ................. 44
Greek Yogurt Demand Will Continue to Grow, But.............................................. 46
Improvements in Handling Acid Whey are Badly Needed.................................... 47
The Role of States and Universities....................................................................... 47
CONCLUSIONS AND FUTURE RESEARCH NEEDS........................................................ 48
APPENDIX 1: NEW YORK COUNTY MAP .................................................................... 50
APPENDIX 2: NEW YORK COUNTIES BY PRODUCTION REGIONS ........................... 50

4
LIST OF TABLES
Table 1. Processors Interviewed For This Research........................................................... 8
Table 2. Production Characteristics of Selected Leading Milk Producing States, 2012 .... 23
Table 3. Production Characteristics of Selected Leading Milk Producing States,
2003 to 2012 ................................................................................................... 24
Table 4. Selected Production Statistics for New York and Six Regions. ........................... 29
Table 5. Greek Yogurt Marketed in New York Supermarkets (following). ........................ 40
LIST OF FIGURES
Figure 1. National Annual Production Of Fresh Yogurt, Pounds, 1989 To 2012 ............. 13
Figure 2. Production of Fresh Yogurt by Regions of the US, monthly expressed as
pounds per day.............................................................................................. 14
Figure 4. Seasonality in Fresh Yogurt Production, Daily Average Production as
Percent of Annual Average ............................................................................ 15
Figure 5. Seasonality in Production of Selected Dairy Products, daily average per
month as a percentage of annual, 2012 ......................................................... 15
Figure 6. Production of Fresh Yogurt, Annual, NEW YORK AND California, pounds...... 17
Figure 7. Milk Production, Selected Leading States, 1924-2012 ..................................... 22
Figure 8. New York County Milk Production, 2010 (pounds of milk).............................. 25
Figure 9. Long Term Average Growth Rates in Milk Production by County, New York,
1975 to 2010 (absolute rate of change, e.g., .01 equals 1%).......................... 26
Figure 10. Recent Average Growth Rates in Milk Production by County, New York,
2006 to 2010 (absolute rate of change, e.g., .01 equals 1%).......................... 27
Figure 11. Milk Production Regions of New York, by Common Growth Characteristics* 30
Figure 12. Milk Production Density in Counties of the U.S., 2001-2011. * ..................... 32

5
INTRODUCTION AND OBJECTIVES OF THE STUDY
On 15 August 2012, New York Governor Andrew Cuomo convened a New York Yogurt Summit, bringing together a select group of NY dairy industry leaders "to hear ideas from industry leaders, farmers and other stakeholders to help ensure that the yogurt industry continues to grow and create jobs in New York."1
The Governor's press release (op cit.) conveys the contextual background and apparent challenge that gave rise to this unusual and rare intervention by the Governor:
Since 2000, the number of yogurt processing plants in New York has increased from 14 to 29 today. From 2005 to 2011, New York's yogurt plants doubled in production. Over the same time period, the amount of milk used to make yogurt in New York increased dramatically from 158 million pounds to about 1.2 billion pounds. Most of the increase in yogurt production is due to the introduction and production of Greek style yogurt, which requires three times more milk than traditional yogurt.
In 2011, New York’s dairy manufacturers employed 8,070 people with total wages of $414 million, a 14 percent increase from 2005. The gradual increase of yogurt production in New York has had a positive effect on businesses throughout state, not only for the yogurt industry, but also for dairy farms, produce manufacturers and local communities across New York…...
“The yogurt industry is a true success story in New York and today's yogurt summit is a prime example of how state government is going above and beyond to actively work with the industry to help it grow in New York and create jobs in New York,” said Governor Cuomo. “As an entrepreneurial government, we brought all the stakeholders to the table to help the dairy industry and yogurt producers enhance their relationship so it is both beneficial to the companies and to the state. New York will do everything it can to facilitate a strong, prosperous partnership. We want the yogurt business to do well, and continue to thrive in New York.”
Many ideas were presented and discussed at the summit. As a first step of the ongoing conversations with the industry, Governor Cuomo announced at the Summit that the state will take new actions to help dairy farmers increase the size of their herds and therefore increase production in order to ensure that the yogurt economic boom continues in New York.
{emphasis added by the authors}
As indicated above, the entrepreneurial growth in the value-added segment of the dairy sector is seen as an all too rare business opportunity to bring jobs to rural Upstate
1 http://www.governor.ny.gov/press/08152012-nys-yogurt-summit

6
New York as well as strengthen and grow the single largest subsector of NY agriculture. With the preeminent goal of maintaining this new sector and enhancing its future growth, sluggish growth in farm milk production was identified as perhaps the key limiting factor. Since the Summit, the Governor and others in State government have been working to:
1) modify NY's regulations for so-called mid-size CAFO's – Concentrated Animal Feeding Operations, to make it easier for NY smaller to mid-sized dairy farms to expand2
2) "lower energy costs by increasing and incentivizing the construction and use of anaerobic digesters which turn waste produced on the farm into energy that can be used by the farmers", specifically the "New York State Energy Research and Development Authority (NYSERDA) will double the maximum incentive amount from $1 million to up to $2 million per installation for farmers to install equipment on their farms that turns organic waste produced by cows into electricity"3 and
3) Create a new "Dairy Acceleration Program (DAP) that will provide grants and coordinate funding and technical programs to help farmers interested in expanding their operations or increasing their efficiency." Specifically, DAP will provide grants of up to $5,000 per dairy farm for:
a. Financial analysis,
b. Strategic planning for growth,
c. Executing business plans to expand, or
d. Other operational needs of the farm, such as adoption of Best Management Practices, new techniques/technologies for growth or engineering and design for expansion.
2 Federal EPA regulations define CAFOs based on numbers of mature dairy cows. 700 or more mature cows are
considered a Large CAFO. A medium CAFO is bounded as 200 or more but fewer than 700. http://www.epa.gov/npdes/pubs/sector_table.pdf Under the authorizing language of the Clean Water Act, States are delegated the responsibility to ensure a State Pollutant Discharge Elimination System (SPDES) General Permit is issued in accord with the Federal law. Large CAFOs are required to get a Permit. Medium CAFOs or smaller farms are required to get SPDES permit if they pose a risk to water quality. In response to the Summit, the NYS Department of Environmental Conservation modified its regulations for medium CAFOs having 200-299 mature cows. The modification to the New York regulations did not attempt to change the definition of a medium CAFO, per se. Rather it modified the handling of medium CAFOs having 200-299 mature cows by stating that they would be held to the provisions required for small CAFOs provided they do not have discharges covered under the Act. http://www.dec.ny.gov/docs/water_pdf/neweclcafopermit.pdf This change only impacts New York farms who 1) are currently smaller than 200 cows, 2) want to expand to no more than 299 cows, and 3) will not be discharging pollutants in violation of the Clean Water Act.
3 http://www.governor.ny.gov/press/02012013-dairy-farmers-initiative

7
General Design of the Cornell Yogurt Market Study
In light of these initiatives and interests, a number of projects and efforts have been initiated by the College of Agriculture and Life Sciences at Cornell University and Cornell Cooperative Extension designed to understand the rapid growth in Greek yogurt production capacity in NY and address challenges faced by yogurt processors and dairy farmers as they work to meet this rapidly growing demand.
This research paper reports on one such project intended to better understand the phenomena that is Greek yogurt in NY and the US. Specifically, the objective of the study reported here is to better understand and quantify the recent growth in the Greek-style yogurt market in the US and the production of yogurt in NY-based plants.
A second study, led by Charles Nicholson and Andrew Novakovic, will project scenarios of market growth in the intermediate term, by regions of the US, and the possible participation of NY based firms in that growth. It will also estimate the likely locus of plant location and milk sourcing under alternative projections of market growth and milk availability, with a particular focus on NY-based milk production and processing.
Methodology
Publicly available data will be the primary source of information on the recent evolution of the Greek-style yogurt sector, including both milk supply and yogurt demand. Personal interviews of industry leaders were conducted to provide insights into the current market structure, challenges facing the Greek yogurt industry in NY and the US, and illuminate likely growth scenarios in terms of product demand and processing capacity. Over a 3-month period, eight (8) yogurt manufacturers (14 executives) were interviewed (see Table 1).4
It was not the authors’ intention to interview all yogurt processors in the Northeast or the US but rather to talk with a representative cross-section of firms producing yogurt, and Greek yogurt in particular. Of the leading processors of Greek yogurt in the US, only Fage and Yoplait were not interviewed. The authors requested an interview with Greek yogurt pioneer, Fage, but were denied. An interview with Yoplait was not requested inasmuch as the authors determined that a good cross-section of the sector had consented to an interview. The authors estimate that the eight firms interviewed processed well over half of the Greek yogurt made in the US at the time of the interviews.
It should be noted that an executive’s decision to grant the authors an interview does not imply endorsement of the author's views, interpretation, or conclusions, but interviewees did have an opportunity to comment on a pre-publication draft.
4 Most interviews lasted 1.5 – 2 hours. Both authors participated in 6 of the 8 interviews; only Boynton
participated in the other 2 interviews.

8
Table 1. Processors Interviewed For This Research
Processor Yogurt Plant Location(s)
Individual(s) Interviewed Title
Interview Location
Inter-view Date
Make Greek
Yogurt? Agri-
Mark/Cabot Creamery
Cabot, VT Richard Stammer
President, CEO Methuen,
MA 8/03/
13 Yes
Alpina Foods, Inc.
Batavia, NY Roger
Parkhurst Dir. Of Operations
Batavia, NY
24/01/13
Yes
Byrne Dairy East Syracuse, NY Bill Byrne Chairman of Board East
Syracuse, NY
23/01/13 No
Chobani New Berlin, NY and Twin Falls,
ID
James R. McConeghy CFO
New York, NY
7/03/13 Yes
Minster, OH; Ft. Worth, TX
Mike Neuwirth
Sr. Director, Public Relations
Dannon W. Jordan, UT; Stonyfield Farms,
NH
David Lainchbury
VP Sourcing & Supplier Development, No.
America
By phone 6/02/
13 Yes
Jeff Kaneb Exec. VP
H.P. Hood Vernon, NY Mike Suever
Sr. VP, R&D, Purchasing, Milk
Procurement
Orlando, FL
29/01/13 Yes
Kevin Williams
VP, Supply Chain Müller Quaker Dairy
(PepsiCo) Batavia, NY
Scott Gilmore
Dir. of Public Relations & Communications
Batavia, NY
5/03/13
Yes
Jay Jaskiewicz
Sr. Director, Commercial Operations
Joe Duscher VP Commercial Division
Jim Murphy VP, QA and R&D
Upstate Niagara
Cooperative, Inc.
North Lawrence, NY and West Seneca, NY
Kim Pickard Dudley
GM Membership Div. & Chief Economist
Batavia, NY
20/12/12
Yes
DESCRIPTION OF THE YOGURT INDUSTRY
What is Greek Yogurt?
In his magnum opus on fermented dairy foods, Frank Kosikowski, the late Professor of Food Science at Cornell, introduced the section on yogurt with these words:5
A cursory look into the fascinating world of early humanity shows consumption of naturally soured milk as a staple….The souring of milk was
5 F.V. Kosikowski and V.V. Mistry, Cheese and Fermented Milk Foods, Vol. 1: Origins and Principles, (self-
published, third edition, 1997), p.87.

9
eventually refined and incessant curiosity about the agents causing fermentation led to the discovery of bacteria and to a basic food, yogurt, now rapidly achieving worldwide popularity.
No one knows exactly where or how yogurt (yoghurt, yahourth) originated, but apparently when the goat first was domesticated in Mesopotamia about 5000 B.C., her milk, stored warm in gourds in that hot climate, naturally formed a curd. Someone with sufficient courage tasted this clabbered mass and rendered a favorable verdict. History was observed in the making and yogurt was on its way. Yogurt is a dairy6 product produced by bacterial fermentation of the lactose
component of cow’s milk that has been heated to high temperatures to create the desired texture. The particular bacteria that lead to yogurt may be naturally present in milk or added as a culture. In the modern commercial setting, selection of bacterial starter cultures can be highly proprietary and result in unique flavor, texture, or nutritional profiles.
The fermentation process produces lactic acid that in turn causes milk proteins (primarily casein) to change their physical structure. In yogurt, the structure becomes a viscous liquid. The combination of the changes in physical structure and the conversion of lactose to lactic acid produces yogurt’s characteristic texture and tangy taste.
Strained (also referred to as drained) yogurt begins as described above but adds a step in which liquid whey (containing water, lactose, some protein and minerals) is caused or allowed to drain out of the yogurt mass, resulting in a yogurt with thicker consistency and a more tart taste (more acidic) than unstrained yogurt. Strained yogurt contains a higher percentage of protein than unstrained yogurt simply because of the removal of a significant portion of the whey (mostly water). As the word implies, straining traditionally occurs by placing the yogurt into a cloth or paper filter and simply allowing it to naturally drain for a period of time. High volume production of strained yogurt (the scale of plant where the vast majority of the yogurt sold in the U.S. is made) employs centrifugation to “spin” the yogurt mass and force out the liquid whey more rapidly. Purists argue that a centrifuged yogurt is not a true or traditional strained yogurt, but the yogurt products resulting from both processes typically use the same ingredients and have very similar nutritional characteristics.7 So far, there seems no consumer interest in making a distinction between straining and centrifuging. In this paper, the authors will use the term “strained yogurt” to include both traditional strained as well as centrifuged yogurt.
Strained yogurt is typical of the Mediterranean region, including North Africa, Southern Europe, and West Asia. In the US, we have come to generically refer to this type 6 While yogurt can be made from the milk of goats, sheep, buffalo and the like, in this paper yogurt will always
refer to a product made from cow’s milk. 7 See Table 5 later in this report, which shows ingredients and nutritional information for several Greek
yogurts, including Fage (strained), Chobani (centrifuged), and Dannon/Oikos (fortified. All of which have strong market positions

10
of yogurt as Greek yogurt. Perhaps this is because of the generally positive image of Greek cuisine in New York City and the importance of the Greek dairy company Fage in introducing their strained yogurt product, made in Greece, to New York markets beginning in 1998. Like many dairy products, there is a federal standard of identity for yogurt,8 but strained or Greek yogurt is not a uniquely defined product. In other words, any company that proclaims its product to be Greek yogurt must conform to the federal standard for yogurt but the claim of being Greek is a connotation, not a well-defined designation. 9
Following the European penchant for geographic designations, some believe that yogurt can only be labeled Greek if it is made in Greece.10 This holds sway in Europe, but not in the U.S. For some in the dairy community, "Greek yogurt" connotes that the product is made with a process similar to traditional straining – either actually straining or centrifugation, but there are also products labeled as Greek, or with suggestive names of that sort, which do not involve "straining". These products aim to produce a product with similar sensory and nutrient characteristics using different processes. There is also a controversy in the industry about labeling non-strained products as "Greek" (cf. Chobani's point of view11). A recent court case concluded that there was no legal basis for requiring that only strained yogurt could be labeled "Greek yogurt".12
For manufacturers who want to mimic the consistency and protein content of strained yogurts, a popular input used to increase the solids content of conventional yogurt is UF retentate or Milk Protein Concentrate (MPC). Ultra-filtration (UF), a high technology straining process, results in two streams of product – retentate and permeate. The retentate has a high concentration of milk proteins that when dried is referred to as Milk Protein Concentrate or MPC13 The UF retentate or dried MPC can then be added to
8 http://milkfacts.info/Milk%20Processing/Yogurt%20Production.htm 9 USDA announced in April 2013 that it approved new Commercial Item Description (CID) for yogurt. The CID
is a designation used in federal procurement programs, as referenced below. http://www.ams.usda.gov/AMSv1.0/ams.fetchTemplateData.do?template=TemplateN&navID=CommercialIte
mDescriptions&rightNav1=CommercialItemDescriptions&topNav=&leftNav=GradingCertificationandVerification&page=CommercialItemDescription&resultType=&acct=procsdgrdcert
The new yogurt CID specifies two new types: regular and high protein. Additionally, the high protein type includes two subtypes: strained and not strained. The new CID allows the US government to differentiate these types and subtypes when it seeks to purchase yogurt for any federal use, either in a federal cafeteria or for a federal program, such as a school feeding program. While this CID provides a new benchmark by which to measure product labels or names, it does not in and of itself constitute a regulation of the use of the word "strained" on a label. Moreover, it does not directly refer to "Greek" as a type or subtype in the CID.
10 http://www.thelawyer.com/news-and-analysis/practice-areas/litigation/high-court-smoothes-out-greek-yoghurt-food-fight/3003554.article
11 http://chobani.com/goreal/ 12 http://www.khlaw.com/showpublication.aspx?Show=6057 13 MPC can be used in liquid or dry form. Typically, if it is manufactured in the plant, it is used as wet solids. If
it is purchased from another manufacturer it will be as dry solids, to reduce the cost of shipping.
11
fresh milk prior to yogurt making.14 Another alternative is to use a similar product derived from cheese whey, called Whey Protein Concentrate (WPC).
As a general rule, dairy protein concentrates (MPC and WPC) are added to achieve higher protein content, similar to that of strained yogurts. This usually, by itself, does not result in the same viscosity or thickness as strained yogurt. Thus, it is also common that other food grade, non-dairy thickening agents such as starches or gelatins are added to such yogurts. Consumers should be able to determine whether the product is strained or not by examining the Ingredient Statement; strained yogurts will not typically include ingredients such as whey protein concentrate, milk protein concentrate, modified food starch, gelatin, and/or pectin. Some dairy industry members use the term Greek Style yogurt to identify products that have similar sensory and nutritional profiles but which are not "strained".15 The choice of names is a subject of some controversy within the yogurt and dairy industry.16
In this report, we will use the term “Greek Yogurt” to include both strained and non-strained products and without regard to the ingredients used. By adopting this approach, the authors are using the two most commonly cited consumer characteristics to identify Greek yogurt: a higher protein content and thicker consistency than regular yogurt—not the manufacturing process employed or ingredients used. We will not use the term “Greek Style yogurt”, and products so labeled by their manufacturers are included under our use of the term “Greek yogurt”. We do so for economy in writing about a broad category of products. It is not a comment on, or endorsement of, what should or should not be labeled in a certain way.
In a related but different distinction, some companies produce varieties, types and styles of yogurt in addition to Greek yogurt or in combination with a Greek Style. These yogurt products might most often be described as premium yogurts, commanding a higher price than regular yogurt (but not necessarily higher than Greek yogurt) on the basis of some combination of their taste, packaging, ingredients used (or not used), thickness, and the like. Premium yogurts often involve high quality or more exotic inclusions, have higher fat contents, refrain from homogenization, or involve some physical process for texture (such as whipping). Depending on the product range in the companies that were interviewed, in this report, Greek yogurt and premium yogurt products will sometimes be grouped together for the purpose of discussion and this will be clearly noted.
Available Data on Yogurt Production, Milk Usage, and Consumption
14 A manufacturing advantage of using ultra-filtration rather than straining or centrifuging the yogurt product
is that the resulting whey (permeate) from ultra-filtration is nearly pH neutral and can be further processed into other food and feeds stuffs. Whey from strained yogurt is acidic (pH 4.4 – 4.7) and poses unique challenges in disposing of, or further processing, the whey. Acid whey is discussed later in this report. Using milk or whey protein solids also puts less stress or dependency on local milk supplies. It is generally advantageous to minimize shipping costs, but the fact remains that MPC and WPC are widely available from national and foreign sources.
15 http://www.nywellnessguide.com/content/what-exactly-greek-yogurt 16 http://www.startribune.com/business/162301436.html?refer=y

12
Although not reaching back quite as far as 5000 B.C., yogurt production has no doubt been a part of the US dairy landscape for a long time. However, commercial production of yogurt did not reach sufficient scale to justify collecting specific data on the industry until the 1980s.
The first USDA production estimates were made in January 1989. Since then, the level of product and geographic detail of these estimates has varied, in part because of the growth in both scale and complexity of the sector but also in part due to falling plant numbers in some states that constrain USDA reporting of state-level data. Currently the National Agricultural Statistics Service (NASS) data are reported in five categories, four related to frozen yogurt. The non-frozen yogurt category is labeled "Yogurt, plain and flavored" and includes spoonable and drinkable types.
California and New York provide yogurt production data through their state statistics or regulatory programs.
Federal Milk Marketing Orders keep track of milk and milk ingredients used to produce Class II products, one of which is yogurt. Some summary data are typically available from Federal Order areas that report milk usage in yogurt production, although the reporting format and level of aggregation is not uniform across areas.
Thus, from one perspective, there is quite a bit of public data about yogurt production, but the data are sufficiently jumbled to make it challenging to put together consistent data sets that span a long period of time. Inasmuch as yogurt is not a storable product (beyond basic pipeline stocks), USDA equates production with "disappearance". In other words, it is generally assumed that all product that is produced "disappears" in commercial channels within days or weeks of production. In this sense, production is considered a reasonable proxy for consumption. While the general intuition here is sensible, if a bit simple, obviously this tells us nothing about the channels through which yogurt passes, how much is consumed in the household, or the like.
Private data on yogurt sales are typically based on surveys of sales through major retail outlets or surveys of household panels reporting on consumption or purchases. These data provide important glimpses into market trends and consumption patterns, and in some ways provide much more detail and texture than USDA data. However, they do not have the same broad, national, regional, or state scope that the public data provide. They tend to be most useful in describing trends, shares relative to competing products, or per capita consumption.
The Bureau of Labor Statistics (BLS) is generally responsible for collecting retail and wholesale price data, as part of its consumer and producer price surveys. BLS reported estimates of the monthly retail price for 8 oz. cups of spoonable yogurt from 1980 to early 2003. There were a number of years with no or partial reporting. The BLS began reporting wholesale level prices for spoonable yogurt, as part of its Producer Price Index, in December 2011. Given the incompleteness of these data, no further examination of them will be made here.

13
Having provided some of the more important caveats about the nature of the data available, the following section describes the empirical measurements we have of the yogurt market.
Yogurt Production
Figure 1 shows the national data for annual production of yogurt since 1989 and the number of plants reporting yogurt production to USDA each year. Note that the plant number is indeed for reporting facilities, not companies.
FIGURE 1. NATIONAL ANNUAL PRODUCTION OF FRESH YOGURT, POUNDS, 1989 TO 2012
Ignoring the (unexplained) blip in plant numbers in 1993, the first half of this data suggest that yogurt production was increasing in an environment of plant consolidation. Quite possibly this reflects the growing importance of specialized yogurt processing facilities and the increasing dominance of major brands. Whatever the reason, the story changes in the 21st Century. The growth in yogurt production accelerated, and the number of plants producing yogurt climbed over 50%, from 80 in 2000 to 131 in 2012. We know that some of these new plants are in fact new entrants, new companies. We also know that some are new facilities built by large companies that want to expand their production capacity, probably moving into new geographic markets as well.
NASS collects data on yogurt production by region. The definition of regions and the degree of aggregation has changed over time. Generally, the regional detail has declined
0
20
40
60
80
100
120
140
160
180
200
0
500,000,000
1,000,000,000
1,500,000,000
2,000,000,000
2,500,000,000
3,000,000,000
3,500,000,000
4,000,000,000
4,500,000,000
5,000,000,000
Production Plants
14
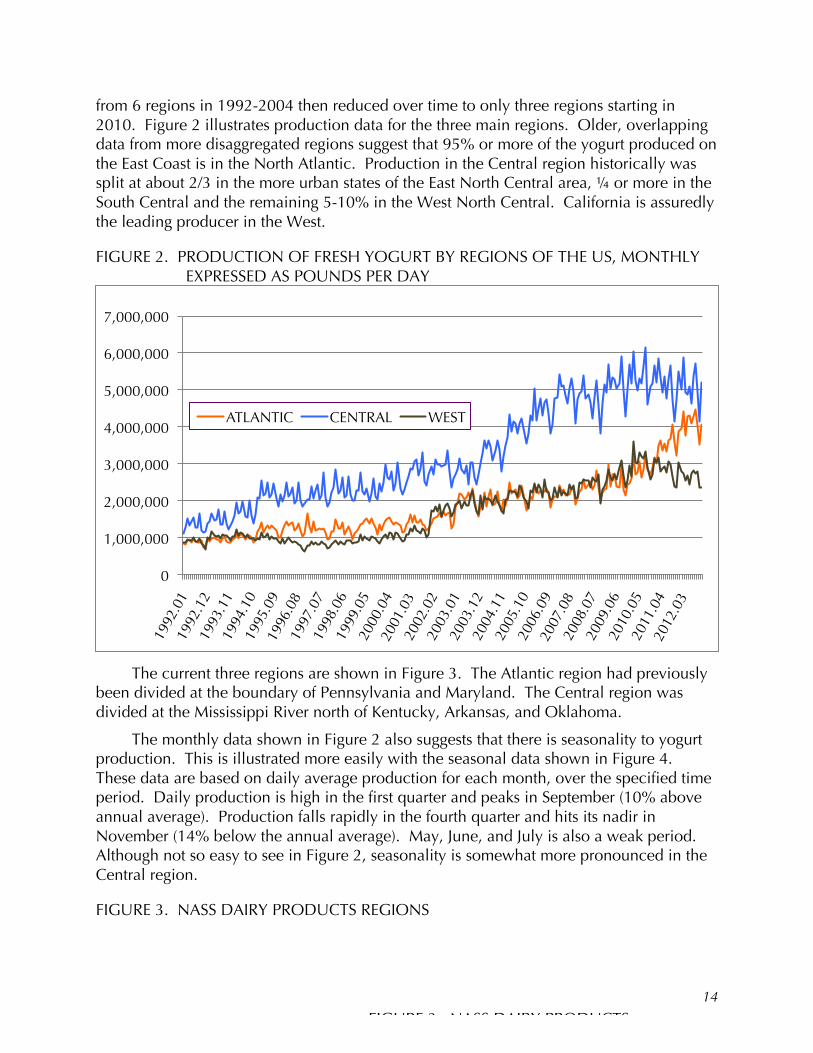
from 6 regions in 1992-2004 then reduced over time to only three regions starting in 2010. Figure 2 illustrates production data for the three main regions. Older, overlapping data from more disaggregated regions suggest that 95% or more of the yogurt produced on the East Coast is in the North Atlantic. Production in the Central region historically was split at about 2/3 in the more urban states of the East North Central area, ¼ or more in the South Central and the remaining 5-10% in the West North Central. California is assuredly the leading producer in the West.
FIGURE 2. PRODUCTION OF FRESH YOGURT BY REGIONS OF THE US, MONTHLY EXPRESSED AS POUNDS PER DAY
The current three regions are shown in Figure 3. The Atlantic region had previously
been divided at the boundary of Pennsylvania and Maryland. The Central region was divided at the Mississippi River north of Kentucky, Arkansas, and Oklahoma.
The monthly data shown in Figure 2 also suggests that there is seasonality to yogurt production. This is illustrated more easily with the seasonal data shown in Figure 4. These data are based on daily average production for each month, over the specified time period. Daily production is high in the first quarter and peaks in September (10% above annual average). Production falls rapidly in the fourth quarter and hits its nadir in November (14% below the annual average). May, June, and July is also a weak period. Although not so easy to see in Figure 2, seasonality is somewhat more pronounced in the Central region.
FIGURE 3. NASS DAIRY PRODUCTS REGIONS
0
1,000,000
2,000,000
3,000,000
4,000,000
5,000,000
6,000,000
7,000,000
ATLANTIC CENTRAL WEST
FIGURE 3. NASS DAIRY PRODUCTS REGIONS

15
By comparison, seasonality in yogurt production may be more pronounced than in other major dairy product lines, or farm milk production itself. This is illustrated in Figure 5, in which all numbers are adjusted to a daily average.
Farm milk production has a systematic seasonality driven primarily by the natural biology of cows. Milk production peaks in the early Spring and bottoms in the early Fall. Natural cheese production follows a very similar pattern. Fluid milk and yogurt exhibit stronger and nearly opposing patterns. Fluid milk has a deeper trough in the Summer and its Fall peak is slightly lower and delayed. Yogurt's swing from a September high to a November low is more dramatic and quick, but for the first seven months of the year, it closely parallels farm milk production, as does natural cheese.
FIGURE 4. SEASONALITY IN FRESH YOGURT PRODUCTION, DAILY AVERAGE PRODUCTION AS PERCENT OF ANNUAL AVERAGE
FIGURE 5. SEASONALITY IN PRODUCTION OF SELECTED DAIRY PRODUCTS, DAILY
0.80
0.85
0.90
0.95
1.00
1.05
1.10
1.15
JAN FEB MAR APR MAY JUN JUL AUG SEP OCT NOV DEC
25 year average
2012 average

16
AVERAGE PER MONTH AS A PERCENTAGE OF ANNUAL, 2012
The regional data in Figure 2, also show a general decline in production in the Central and West regions beginning in 2010, whereas production trends upward more rapidly in the Atlantic region. This suggests the displacement of conventional yogurt sales as Greek yogurts rapidly penetrated the market. This is further suggested in Figure 6, which shows data for California and New York.
These data indicate that New York 1) had a "hockey stick" surge in yogurt production beginning in 2009 and 2) this surge and a softening of production in California last year led to New York becoming the leading yogurt producing state in 2012.17 Last year, California represented 13% of US yogurt production and New York accounted for almost 16%. As was the case in New York after 2008, the big increase in California production in 2002 was due to a new plant coming online. It is assuredly the case that the switching of ranks in 2012 occurred due to the growth of Greek yogurt consumption and New York's leading production of those products. California yogurt makers have been slow to respond to the switch from conventional yogurt styles to the Greek styles. This is also evident in Figure 2, which shows a rise in Atlantic region yogurt production, while Central and West regions declined in the last four years. An important mitigating factor in the
17 Insofar as there aren't estimates for other states, individually, it is not possible to prove this claim; however, it
is a safe bet that no other state produces more yogurt than NY or CA.
7.0%
7.5%
8.0%
8.5%
9.0%
9.5%
10.0%
JAN FEB MAR APR MAY JUN JUL AUG SEP OCT NOV DEC
FARM MILK FRESH YOGURT
ALL CHEESE FARM MILK USED IN CLASS I

17
West is the opening of a new yogurt plant in Idaho by Chobani. The Idaho plant is fully operational in 2013 and will be one of, if not the, largest single yogurt plants in the US.
FIGURE 6. PRODUCTION OF FRESH YOGURT, ANNUAL, NEW YORK AND CALIFORNIA, POUNDS
Yogurt Consumption
As discussed above, USDA data generally assume that yogurt production is a reasonable proxy for gross consumption; because, storage of this perishable product is only for a short duration and does not vary substantially independent of production quantities. This means that the USDA data provides only the grossest indication of consumption. For the purposes of this paper in particular, it is also notable that there are no USDA data on Greek yogurt production or consumption.
Information on Greek yogurt sales can be purchased from market research firms, such as Nielsen18 and IRI's InfoScan19. The authors do not have general access to this kind of proprietary data; however, some data from these types of sources is publicly available and we will examine it here.
18 http://www.nielsen.com/us/en/nielsen-solutions/nielsen-measurement/nielsen-retail-measurement.html 19 http://www.iriworldwide.com/SolutionsandServices/Detail.aspx?ProductID=181
0
100,000,000
200,000,000
300,000,000
400,000,000
500,000,000
600,000,000
700,000,000
800,000,000
California New York

18
Data from Fall 2012 indicates that retail yogurt sales occur primarily in grocery stores (about 2/3 of all retail sales). Drug stores represent almost all of the remaining 1/3, with a small fraction sold in club and other stores. IRI Panel Data (as reported by DMI) show that 83% of all US households bought some kind of yogurt in 2012, representing no change from 2011. Adult males represented 25% of total in-home yogurt consumption in 2012, with women representing 52% and children and teenagers the balance ("NPD National Eating Trends", provided by DMI).
Greek yogurts have shown phenomenal growth. In 2012, Greek yogurt sales were 34% of total yogurt dollar sales and 22.5% of total yogurt volume sales (IRI Yogurt Database, multi-outlet, provided by DMI). Greek yogurt sales by volume were only 2% of total yogurt sales as recently as 2009, according to this same IRI Yogurt Database. This same DMI-provided data for multi-unit supermarket sales show that non-Greek yogurt fell 10.1% by volume from 2011 to 2012 while Greek yogurt volume rose 71.4% in this same one-year period.
Yogurt drinks and tubes sales also grew but on a much smaller base. Sales in larger volume tubs also were showing strong growth. Indications are that consumers are seeking club packs (8-12 individual servings of 5 or 6 ounces packed together in boxes) as a way to reduce item cost, as well as buying larger tubs (1 or 2 pounds). Both packaging types bode well for increased sales in club stores (Sam's Club, Costco, BJs) and similar discount type retail outlets although such larger packs are not strictly limited to club stores.
As another measure of consumer's seeking lower price points, private label sales of yogurt, generally, are gaining share; however, private label only accounts for about 15% of total yogurt sales and probably even less in the Greek yogurt category. While most industry participants and analysts believe private/store brand Greek yogurt will grow faster than the brands as the category matures, the IRI Yogurt Database provided by DMI showed a 0.8% decline in private/store brands of all yogurt in the first few months of 2013 while branded Greek yogurt grew 3.3%.
These same data also indicate that low-fat and nonfat yogurts, generally, are the most preferred by consumers, representing 90-95% of all yogurt sales, with nearly equal shares. Although a small share, there is some indication that whole milk or full fat yogurts are increasing their share, perhaps as more "premium" products are being introduced, especially as dessert items, usually in smaller containers (3.5 to 5 ounces). The previously cited IRI data showed that in 2012, while full fat yogurts represented only 7% of the total yogurt category, its share was up 18% over 2011.
Shortly after the boom began in Greek yogurt (circa. 2010), market analysis indicated that sales were primarily from two types of customers. One was women who were already yogurt eaters but switched from conventional yogurt to Greek. The second were (mostly) men who saw Greek yogurt as a new sports nutrition product. These men were new consumers who were not switching from conventional yogurt but rather were substituting Greek yogurt for other types of protein supplements. In both cases, there is a cannibalization of dairy product sales. It is likely that new Greek yogurt products increased the overall usage of milk. In the case of switching from conventional to Greek

19
yogurt, milk usage would increase considerably even if consumers ate the same volume of yogurt because strained yogurt uses 3 to 4 times more milk that conventional yogurt. In the case of sports nutrition, sales of whey protein products, in particular, may have suffered from the adoption of Greek yogurt, but the dairy content of a cup of yogurt is certainly higher than that of an energy bar or even a protein fortified smoothie.
Greek yogurt is also touted as a substitute for chip and vegetable dips (either plain or as a base), sour cream, buttermilk, cream, and other cooking uses.20 Fage, in particular, is a company that touts the use of its yogurt in cooking in the U.S.21 Other brands quickly picked up this marketing strategy.
Thus, Greek yogurt has shown strong appeal across several consumer categories: 1) dieters, 2) health conscious, 3) athletes, 4) gourmands, and 5) home chefs. Consumers who enjoy Greek yogurt most commonly refer to its healthfulness (healthy, high protein good for you, less sugar, calcium), texture (thicker, fuller, creamier, rich), and taste (love, best, amazing, awesome).
So, is Greek yogurt a fad that will soon run its course or a new product category that will become an enduring part of the US food landscape? All indications point to the latter, indeed, the bigger question is what is the ongoing upside potential for this category. As is true across the spectrum of dairy products, the US consumer is a prodigious consumer of yogurt and other dairy products as a share of total, global consumption, but per capita U.S. consumption falls well behind European consumers. USDA estimates that per capita consumption of yogurt in the US has skyrocketed from about 2 pounds in 1975 to about 14 pounds today, but that remains well below the approximately 60 pounds consumed in Germany and France or even the 20 pounds in Canada. Datamonitor Database provided by DMI measures per capita consumption in constant dollar terms. They report that in 2012, US per capita spending on all yogurt was $21.10 while in Europe the figure was $41.00. Datamonitor also noted that 20 European countries have greater per capita spending on yogurt than does the US.
Foodservice and Other-Than-Retail Sales
Data above are largely derived from retail sales information. Greek yogurt is penetrating foodservice as well. This is both in terms of direct consumption and in cooking and food preparations. Production of bulk-size containers and the development of private label products point in the direction of expanding foodservice and food manufacturing uses. Indeed some companies report developing a Greek yogurt product line at the request of their foodservice customers. The recent effort to develop a new CID for sales to the federal government is yet another aspect of developing products for foodservice uses, especially the large school cafeteria market. Since yogurt moves through the retail supply chain more quickly than the foodservice chain, it has been 20 http://www.foodrepublic.com/2012/09/18/dos-and-donts-cooking-greek-yogurt. http://greekfood.about.com/od/guiderecommendations/tp/yogurt_spectrum.htm http://myurbannutrition.com/10-unique-and-healthy-recipes-using-greek-yogurt/ 21 cf. (http://www.fageusa.com/recipes/

20
necessary for manufacturers to offer a 60-90 day shelf life product for the foodservice market.
Share of Stomach and Share of Market
Insofar as most of us cannot eat more of something without eating less of something else, it is valuable to understand what consumers are switching from when they choose to eat or eat more Greek yogurt. As mentioned above, there are indications that much of the Greek yogurt consumption is coming at the expense of other dairy products, in particular conventional yogurt.
Market shares are evolving as mainstream yogurt manufacturers, such as industry leaders Dannon (Oikos)22 and General Mills (Yoplait Greek)23 scurry to introduce new products to compete with the two companies that originally defined the category – Fage24 and Chobani25. Specific share data are not routinely available to the general public, but at least through mid 2013 Chobani has been acknowledged as the category leader with a market share of 40-50 percent. Fage was originally a strong but distant second place with perhaps half as much market share, but Dannon has made strong gains with its Oikos26, Light and Fit Greek, and Activia Greek brands. Indications are that in 2012, Dannon captured second place in Greek yogurt market share.
According to private industry reports, Chobani continues to be the leading brand in the Greek yogurt space, but Dannon's three Greek yogurt brands challenge Chobani for total company sales. Regardless of the precise numbers at this moment, it is to be expected that competition in this expanding product market will be vigorous, with new line extensions and further product and market development. This juggling and jockeying is typical of new product introductions that redefine a market space.
So far General Mills27 has been less successful in finding the right formula for a Greek product. This has no doubt been an important factor in Dannon replacing Yoplait as the leading yogurt brand, with total yogurt market shares in 2012 of 28% and 26% respectively. In 2011, Yoplait enjoyed a leading 32% share of total yogurt sales. Other companies, such as Stonyfield,28 Cabot Farms,29 and Greek Gods,30 have established a small but firm footing in the Greek yogurt category, and there continue to be new entrants.
22 http://www.oikosyogurt.com 23 http://yoplait.com/products/yoplaitgreekyogurt 24 http://www.fageusa.com 25 http://chobani.com/who-we-are/ 26 Oikos is produced by Dannon under a licensing agreement with Stonyfield Farm Inc., of which Group Danone
is a majority owner 27 In an August 2013 Advertising Age article, it was reported that for its Yoplait Greek Yogurt line, Yoplait is
switching to a traditional straining method (from use of a thickening additive), fully blending the fruit, and offering a Greek yogurt with a milder taste profile (less sour notes). Yoplait’s Greek 100 calorie line has always been a strained yogurt.
28 http://www.stonyfield.com/products/yogurt/greek/nonfat/plain

21
Alpina is a Colombian company that started as a maker of European style cheeses in 1945.31 It began producing yogurt in Colombia in 1950. In 2012 it opened a yogurt plant in western New York, its first investment in the United States. It has introduced a handful of yogurt products, including Alpina Revive, a strained yogurt product. The Alpina product is differentiated, at least in part, by offering its Revive product in a package that uses a top cap to hold mixable, dry inclusions, such as granola.
On a larger scale, PepsiCo and The Theo Müller Group, one of the largest dairy companies in Europe, have joined together in a joint venture called Müller Quaker Dairy32. Their yogurt manufacturing facility in Batavia, New York opened in Spring 2013 in western New York and has the capacity to become one of the largest yogurt producers in the US. It is focused on defining a premium yogurt product line that includes a Greek-Style yogurt. PepsiCo has operated the largest dairy company in Russia since it acquired Wimm-Bill-Dann in 2011. The MQD venture marks PepsiCo's first dairy enterprise in the US and Theo Müller's first dairy enterprise outside of Europe. Hence, this new enterprise combines a strong set of skills but in a new market setting for both companies.
The Importance of Milk Production
The availability of milk, which involves both physical amounts and cost of acquisition, has always been a key if not leading consideration in dairy plant siting or expansion decisions. The recent experience with newly built Greek yogurt plants is no different. However, the circumstances of milk production within and without New York offer a fascinating glimpse into the relative importance of this siting factor and the extent to which it is well researched or understood by manufacturers who are new to New York or the Northeast. In the next section, New York's relative position and attributes will be compared to other selected states. In addition, New York county data will be examined to better illuminate and understand the very considerable difference in milk production dynamics within New York
New York Production Characteristics Compared to Other States
New York dairy farms have long represented a major source of milk production in the US. Although other states have expanded milk production more rapidly in the last 100 years, New York has been and remains one of the major milk producing states, and the leading milk producing state in one of the leading regions of the U.S. The size and relative growth rates of selected leading milk producing states are illustrated in Figure 7. These are large milk producing states and span major milk producing regions of the U.S.
29 http://www.cabotcheese.coop/greek/ 30 http://www.greekgodsyogurt.com/html/ 31 http://www.alpinaus.com 32 http://mullerquaker.com/home Quaker Oats, Co. merged with PepsiCo in 2001 and has operated as a division
of the larger corporation.

22
FIGURE 7. MILK PRODUCTION, SELECTED LEADING STATES, 1924-2012
The story of the two leading milk-producing states in the Northeast points to the need for continuing investment as a prerequisite to industry vitality. Enjoying the considerable and undeniable advantage of nearness to the much envied and lucrative consumer markets of the middle to northern Atlantic Coast, the dairy sector in those states from Maryland to Maine has a built-in marketing cost advantage. However, this cost advantage was significantly eroded as the real cost of fuel, in particular, and transportation, in general, shrank dramatically over the last 40 years. Combined with improvements in refrigeration and packaging technologies, dairy markets became more functionally national in scope, even for more perishable products. Even the very good farmers of the Northeast found it difficult to compete with Midwestern dairy farmers who had a similar production system but produced homegrown feeds more cheaply and in greater abundance, or with western producers who had a very different but very low cost production system. The story of New York includes farmers within the state who adapted quite well to that challenge and others who did not. This will be discussed in the next section.
Tables 2 and 3 complete the section on New York's milk production characteristics relative to other states.
0
20,000,000
40,000,000
60,000,000
80,000,000
100,000,000
120,000,000 an
nual
ave
rage
pou
nds
per
day
NY PA WI MI TX ID CA

23
TABLE 2. PRODUCTION CHARACTERISTICS OF SELECTED LEADING MILK PRODUCING STATES, 2012
State Milk Production Milk
Production per Cow
Licensed Herds*
Milk Production
per Lic. Herd
Cows per Lic. Herd
mil. lbs. lbs lbs NY 13,196,000,000 21,633 5,150 2,562,330 118 PA 10,493,000,000 19,576 7,140 1,469,608 75 WI 27,224,000,000 21,436 11,490 2,369,365 111 MI 8,889,000,000 23,704 2,130 4,173,239 176 TX 9,596,000,000 22,009 500 19,192,000 872 ID 13,558,000,000 23,376 565 23,996,460 1,027 CA 41,801,000,000 23,457 1,650 25,333,939 1,080 * Dairy farms must be inspected and approved to sell milk in commercial markets. These are
"licensed herds". As such, they are marginally fewer than the number of farms that possess dairy cows, but this data has been popularly used as an indicator of the "number of dairy farms" in the last decade.
The production per cow and herd size data shown in Table 2 adds further texture beyond the shear size of milk production in these states. The intensive production systems of the western states are reflected in the high yields and large herds in those states; however, New York, Wisconsin, and Michigan are notable. Although each state has herd sizes as much as a tenth the average of the western states, milk producers in these traditional milk-producing areas achieve a very respectable level of productivity. Michigan in particular is a state whose dairy farmers are long known for being progressive and taking full advantage of the considerable agronomic advantages of that northern state, as well as its own proximity to its significant urban areas. All of these states would catch the eye of a national or international company that is interested in looking for a strong milk production sector that is well located relative to consumer markets.
The recent trajectories of these states are shown in Table 3, which shows average annual growth rates from 2003 to 2012. Production data are adjusted to a daily basis to account for leap years.
Milk production growth in the last 10 years ranges from barely above zero in Pennsylvania to 5 and 6 percent in Idaho and Texas. New York's growth is one of the least impressive on the list, and less than the more recently beleaguered California. However, these data also illustrate the importance of the two key pathways to growth, improved productivity (milk production per licensed herd) and larger farms (cows per licensed herd).

24
TABLE 3. PRODUCTION CHARACTERISTICS OF SELECTED LEADING MILK PRODUCING STATES, 2003 TO 2012
Average Annual Growth Rate ,2003 to 2012
State Milk
Production
Milk Production per Cow
Licensed Herds
Milk Production
per Lic. Herd
Cows per Lic. Herd
percent per year, adjusted to daily average NY 1.1% 2.2% -2.9% 4.1% 1.9% PA 0.2% 0.9% -2.7% 2.9% 2.0% WI 2.2% 2.1% -3.9% 6.4% 4.2% MI 3.8% 1.3% -3.1% 7.1% 5.8% TX 6.2% 2.5% -5.6% 12.6% 10.0% ID 5.0% 0.8% -3.4% 8.7% 7.9% CA 1.8% 1.2% -2.4% 4.4% 3.1%
All of these states have had persistent reductions in herds, generally around 3% per year, and drought-besieged Texas has had declines averaging over 5%. What are striking are the greater differences in growth in farm size compared to improvements in yield. The sharper declines in herd numbers in Texas clearly eliminated the poorer milk producers to a greater extent. It is the only state that improved its production per cow by a higher percentage than New York's farmers, although Wisconsin is very close. If one looks at the size of the average herd, growth in New York is least on this list, followed closely by Pennsylvania, which is nearly in a disinvestment condition. Thus, if one uses these selected states as benchmarks against which to measure New York's attributes as a milk sourcing area, it is clear that scale of milk production is but one factor to define a region's production advantages. Among these states New York can be identified as a state that, in its entirety, is getting better more than it is getting bigger.
Milk Production Dynamics Within New York
Saying that New York is a major milk producing state or one that gets better more than bigger belies the very different production situations across the state. Outside of the NY metropolitan area, every county has dairy cows, but the size of the local industry and its growth trends vary vastly. In this section, several aspects of New York milk production by county will be illustrated.33
It makes sense to consider four (4) factors when evaluating milk production characteristics within the State.
One is the density of production – how much milk is produced over a given geographic area. This obviously relates to how far a plant needs to reach in order to acquire enough milk to fill their capacity. 33 County level data on milk production was last collected for 2010.

25
An obvious second is the number of plants competing for milk in the same region.
Beyond milk volume, another question is what is the track record or potential for growth in production. Past growth does not necessarily predict future growth but it is a logical indicator. New and expanding companies have an obvious interest in growing in an area where their primary input is also expanding.
A fourth and closely related consideration is what are the drivers or manifestations of production growth. Milk production can grow (or decline) in several ways: 1) there may be new (or fewer) farms, 2) there may be larger (or smaller) farms, and 3) there may be more (or less) productive farms. The common situation for the U.S. is that there are fewer farms, and they have more cows and higher yields per cow.
The description of milk production changes in the following section is not exhaustive but it should be indicative of the colorful tapestry of changes we observe in New York.
Large New York Milk Producing Counties34
County milk production volume for 2010 is illustrated in Figure 8. The largest milk producing counties are St. Lawrence (3), Jefferson (4), and Lewis (6) in northern New York
FIGURE 8. NEW YORK COUNTY MILK PRODUCTION, 2010 (POUNDS OF MILK). and Wyoming (1), Cayuga (2), and Genesee (5) in western New York. Recognizing that counties have a considerable range in size, the density of production gives a bit different ranking by county. By production per square mile, the three western counties rank 1 to 3, with Wyoming about twice the density of Cayuga. The three northern New York counties rank 14, 18 and 22 and reverse their order (Lewis, Jefferson, and St. Lawrence). Ranked by density, Montgomery (4) and Washington (11), in the Capital district area show their

26
prominence as milk producing areas, as well as many of the counties in western New York but also Onondaga (8), Madison (9), Cortland (10), and Tompkins (12) in central New York.
The implications of this are simply that New York enjoys a number of locations that represent local concentrations of milk production. Western and northern New York standout as regional concentrations, but there are other locations in the central and eastern parts of the State that have smaller volumes but significant densities of milk production.
It is useful and very illuminating to look at growth around New York. Figures 9 and 10 illustrate the longer and near term growth dynamics within New York.
FIGURE 9. LONG TERM AVERAGE GROWTH RATES IN MILK PRODUCTION BY COUNTY, NEW YORK, 1975 TO 2010 (ABSOLUTE RATE OF CHANGE, E.G., .01 EQUALS 1%).
34 The base map for the graphics shown in this section does not include county names. For reference for the
interested reader, a New York map that identifies counties is provided in Appendix 1.

27
FIGURE 10. RECENT AVERAGE GROWTH RATES IN MILK PRODUCTION BY COUNTY, NEW YORK, 2006 TO 2010 (ABSOLUTE RATE OF CHANGE, E.G., .01 EQUALS 1%).
The longer-term production growth rates shown in Figure 9 are the simple arithmetic averages of annual percentage changes in production, adjusted to a daily basis, for the period 1975 to 2010. The range in average long-term growth is -3% to +4% per year. That is a wide range for an annual average, but, perhaps even more dramatically, the number of counties that have declined nearly equal the number that have increased. More specifically, 18 counties have declined by an annual average of 0.5% or more since 1975, 20 counties have increased by 0.5% or more, and 12 counties have hovered in between, with either a slight increase or decrease. (The remaining 12 New York counties are in New York City, Long Island, or the Adirondacks.)
The very balanced split among counties growing, holding their own, or declining is reflected in the very tepid 0.7% average annual growth in production for the State over that same time period. The growing counties have added more production than was lost by the declining counties, but not by much. By the same token, this tepid growth at the state level masks the wide range in production change across the State.
Figure 9 also illustrates that the counties with significant growth are primarily in western New York, although it should also be noted that three counties in northern New York and Saratoga in the Capital District area also have grown over this long time period.

28
More recent growth trends add further texture to the picture of New York county production dynamics. Figure 10 illustrates average annual production growth rates from 2006 to 2010. This is the beginning of the period of expansion in the yogurt industry, but the untimely demise of county level data prevents us from more fully exploring county production patterns beyond 2010.
Although the near term and longer term growth patterns have much in common – strength in western New York and to a lesser extent northern New York – there are also differences. The relative growth rates in western New York remain the most impressive but specific counties show different degrees of growth. Counties that showed early growth are lessening their pace (e.g. Wyoming). Counties that had less growth early on are catching up (e.g., Livingston). Some that had early growth are keeping that pace (e.g., Ontario and Cayuga).
Counties in other regions have also shown changes in growth patterns over time. Although not as high a rate of growth as some of the western counties, Saratoga, Fulton and Montgomery have enjoyed a recent resurgence. Perhaps not coincidentally, this is in the area of one of the expansions in plant capacity. Clinton, Franklin and St. Lawrence have continued to grow, but so has Jefferson County more recently. It is perhaps not coincidental that there has been an expansion and stabilization of cheese processing capacity, respectively, on the eastern and western ends of northern New York in the last 10 years as well.
While there is at least anecdotal evidence to associate the prospering of a milk production area with strength of processing, there are exceptions. The original Chobani plant is located in Chenango County. Chenango and neighboring Madison and Cortland counties are in decline. Broome County has shown some growth but on a small base.
These data indicate that there are very important differences in milk production growth patterns around New York. They also show that milk production growth is associated with stabilization or growth in milk processing capacity in an area, but there are two caveats. First, there are exceptions to this apparent rule. Second, it is not clear to what extent milk processors are attracted to areas with production growth vs. growth occurs in areas to which processors have made a commitment to stay, expand or enter. Both situations are clearly in evidence. Both conditions would be viewed as very positive signs for a local dairy industry. What is less clear is to what degree there is a cause and effect relationship in either direction.
Characteristics of New York Milk Production Regions
The county level data provide insights about milk production patterns around the state; however, even the largest counties do not exist as isolated supply areas. There is no standard boundary on the scale of a large dairy plant, and most people in the industry would probably put a different boundary for a large yogurt plant vs. a large cheese plant.

29
For the sake of discussion, let's say that a large scale plant, the kind that a major dairy company might likely want to build in a green-field project, would start at 4 million pounds of milk per day (there are a number of plants that have been built recently that are twice that size or larger). In New York, the largest milk-producing county – Wyoming – produces over 3 million pounds of milk per day. The State total is 34 million pounds. By our arbitrary measure, New York could accommodate 8-9 "large" dairy plants. No county produces enough milk for one such plant and 20 counties produce between 1 and 10 percent of that amount.
Milk production characteristics for regions of the State have been selected to represent a reasonably similar group of counties by growth rates. Table 4 reports summary statistics for the regions. The regions are shown in Figure 11.
Regions shown in Table 4 are contiguous counties grouped according to similarities in longer term and recent growth rates. These counties also tend to be quite similar in terms of milk production density and yield (production per cow). New York State is shown to provide a comparison with a statewide total or average. New York data exclude a small amount of production in Essex County, which is grouped in the Adirondacks and the areas associated with the Metropolitan New York and Adirondacks regions. Half of
TABLE 4. SELECTED PRODUCTION STATISTICS FOR NEW YORK AND SIX REGIONS.
PRODUCTION, 2010 PRODUCTION
GROWTH YIELD GROWTH
REGION
Total per
Cow
per Square Mile
1975 to 2010
2006 to 2010
1975 to 2010
2006 to 2010
1000 lbs pounds average annual percentage
NEW YORK STATE
12,713,000 20,807 283 0.7% 1.4% 1.9% 2.5%
WESTERN NY 4,934,000 22,633 609 2.7% 5.2% 1.9% 2.8%
NORTHERN NY 2,509,500 21,106 286 1.2% 1.2% 2.2% 3.7%
NORTH CAPITAL
947,500 20,962 360 0.7% 0.4% 1.9% 0.7%
WESTERN FRINGE
1,422,500 18,668 178 -0.1% -1.6% 1.7% 0.8%
GREATER SE NY 2,697,900 18,906 159 -1.0% -3.1% 1.6% 1.6%
ADIRONDACKS too little to report
METROPOLITAN NY not applicable

30
Herkimer County is also excluded from the statewide landmass to approximately account for the portion of the county that is in the Adirondack Park.
FIGURE 11. MILK PRODUCTION REGIONS OF NEW YORK, BY COMMON GROWTH CHARACTERISTICS*
* Northern NY is shaded in green. The North Capital is purple. Greater Southeastern NY is shaded in tan. Western NY is dark blue. The Western Fringe is light blue. The Adirondack is light grey. Metropolitan NY is dark grey.
Western New York stands out as a region of both large and dense milk production, with a production per square mile more than twice the New York average. It is also the leading region in terms of production per cow, with a 10% advantage over the state average. Western New York has over twice the annual average long-term growth rate of its nearest rival since 1975 and over four times the recent production growth rate. It has experienced productivity growth more in line with the state average, which means that almost half of the growth in production has come from herd expansions. Western New York contains a number of major dairy plants, including plants in Genesee and Monroe. The two newest yogurt plants – Müller/Quaker and Alpina are located in Genesee County. Using the (arbitrary) 4-million pound/day benchmark for a large dairy plant, Western New York could accommodate three such plants.
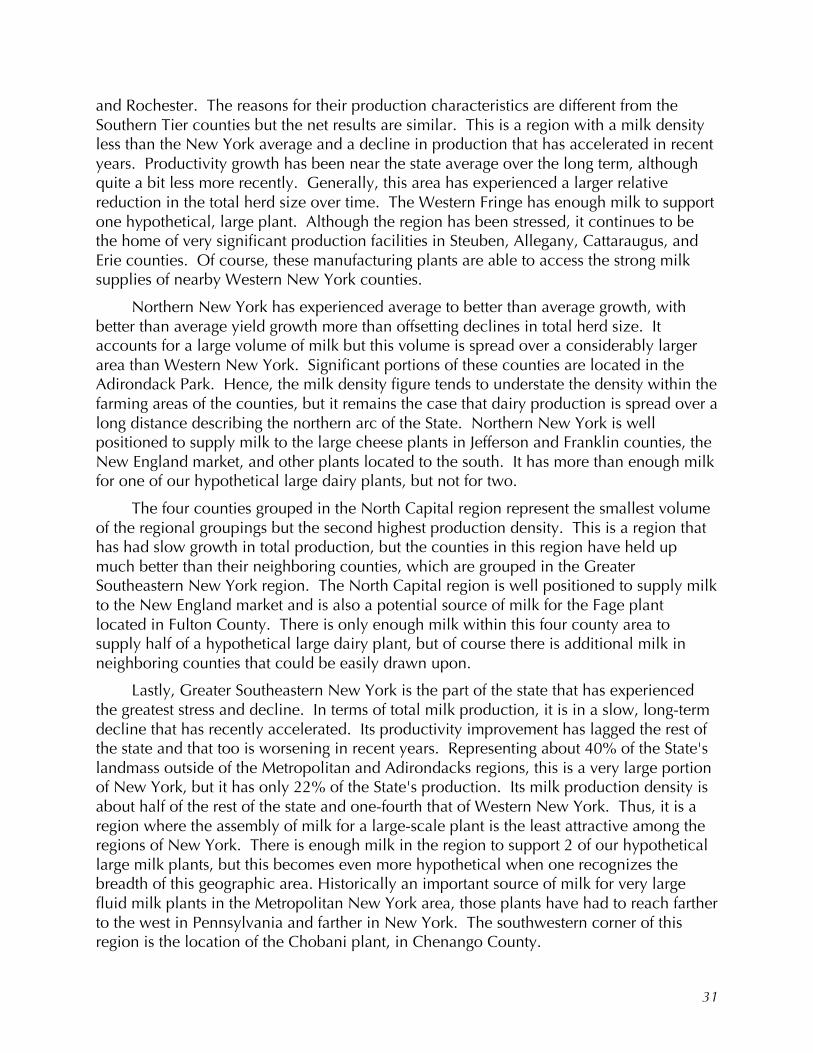
The Western Fringe is a group of counties that surround the Western New York region. The Southern Tier, in particular, includes a group of counties historically known for a significant volume of production but facing greater production challenges over time. The counties to the east and north of Western New York are the urban areas of Buffalo
31
and Rochester. The reasons for their production characteristics are different from the Southern Tier counties but the net results are similar. This is a region with a milk density less than the New York average and a decline in production that has accelerated in recent years. Productivity growth has been near the state average over the long term, although quite a bit less more recently. Generally, this area has experienced a larger relative reduction in the total herd size over time. The Western Fringe has enough milk to support one hypothetical, large plant. Although the region has been stressed, it continues to be the home of very significant production facilities in Steuben, Allegany, Cattaraugus, and Erie counties. Of course, these manufacturing plants are able to access the strong milk supplies of nearby Western New York counties.
Northern New York has experienced average to better than average growth, with better than average yield growth more than offsetting declines in total herd size. It accounts for a large volume of milk but this volume is spread over a considerably larger area than Western New York. Significant portions of these counties are located in the Adirondack Park. Hence, the milk density figure tends to understate the density within the farming areas of the counties, but it remains the case that dairy production is spread over a long distance describing the northern arc of the State. Northern New York is well positioned to supply milk to the large cheese plants in Jefferson and Franklin counties, the New England market, and other plants located to the south. It has more than enough milk for one of our hypothetical large dairy plants, but not for two.
The four counties grouped in the North Capital region represent the smallest volume of the regional groupings but the second highest production density. This is a region that has had slow growth in total production, but the counties in this region have held up much better than their neighboring counties, which are grouped in the Greater Southeastern New York region. The North Capital region is well positioned to supply milk to the New England market and is also a potential source of milk for the Fage plant located in Fulton County. There is only enough milk within this four county area to supply half of a hypothetical large dairy plant, but of course there is additional milk in neighboring counties that could be easily drawn upon.
Lastly, Greater Southeastern New York is the part of the state that has experienced the greatest stress and decline. In terms of total milk production, it is in a slow, long-term decline that has recently accelerated. Its productivity improvement has lagged the rest of the state and that too is worsening in recent years. Representing about 40% of the State's landmass outside of the Metropolitan and Adirondacks regions, this is a very large portion of New York, but it has only 22% of the State's production. Its milk production density is about half of the rest of the state and one-fourth that of Western New York. Thus, it is a region where the assembly of milk for a large-scale plant is the least attractive among the regions of New York. There is enough milk in the region to support 2 of our hypothetical large milk plants, but this becomes even more hypothetical when one recognizes the breadth of this geographic area. Historically an important source of milk for very large fluid milk plants in the Metropolitan New York area, those plants have had to reach farther to the west in Pennsylvania and farther in New York. The southwestern corner of this region is the location of the Chobani plant, in Chenango County.

32
New York Production Regions Compared to the Rest of the U.S.
The data in Figure 7 suggested that New York's milk production growth has been relatively unimpressive compared to leading milk producing states in the Upper Midwest and West. As should be obvious now, the production situation in New York is not made entirely clear by looking at state-level data. Dr. Mark Stephenson of the University of Wisconsin created the map shown as Figure 12. It is a "heat map" that shows changes in the density of production around the U.S. The map is constructed at the county-level, using county production data where those are available and imputing production from census data on cow numbers elsewhere.
FIGURE 12. MILK PRODUCTION DENSITY IN COUNTIES OF THE U.S., 2001-2011. *
* The red line shows the western movement of the "centroid" of U.S. milk production since 1960.
The map nicely illustrates that western New York stands out as one of the leading and notable production "hot spots" in the U.S., rivaling the similar production areas of western Michigan and eastern Wisconsin as well as the geographically larger hot spots in southeastern Idaho, the Central Valley of California and the New Mexico-Texas border. For dairy plants looking to expand, these areas stand out as large and growing in milk production.
Again, it is also true that each of these hot spot areas beg the question to what extent are these areas of historical production strength to which plants are attracted vs. to what
1960
1970
19801990
20002010
Largest Increase = 2,596,898kg/km!
Largest Decline = 295,363kg/km!
33
extent does plant construction and expansion encourage milk production growth in an area. Central Valley, eastern Wisconsin, and western New York are good examples of strong milk production areas that are able to sustain and slowly grow processing capacity. Eastern Michigan, northeastern Indiana, the New Mexico-Texas border, southeastern Idaho, western Kansas, the Yakima Valley area of Washington, and northwestern Colorado are good examples of areas where the growth in milk production has gone more hand-in-hand with new plant construction. Part of this narrative is that new construction of modern and very large scale dairy plants is understandably easier in locations that have dairy potential but which are not already populated with many, and often smaller, farms and competing plants.
OBSERVATIONS ON THE GREEK YOGURT INDUSTRY
In the subsections that follow, the authors draw on information provided by the executives interviewed for this study, referenced secondary data, and their own knowledge and understanding of the US dairy industry in offering observations on the Greek yogurt industry in New York and the US. Our observations are broken down into three categories: Development of the Greek Yogurt Industry in NY; State of the Greek Yogurt Industry in New York and the Northeast; and Future of the Greek Yogurt Industry in New York and the Northeast.
As chronicled above, there has been unprecedented growth in the production of Greek yogurt in New York, with several large investments in new yogurt processing facilities and production growth as illustrated in Figure 4. A major purpose of this study is to understand why so much of all new Greek yogurt capacity was built in New York. We begin with some general observations related to the companies involved in the yogurt sector and general criteria and strategies for plant siting.
General Observations about Development of the Greek Yogurt Industry in NY
Yogurt Plant Siting Factors
Some of the most frequently cited factors that affect where any new manufacturing facility is built include: proximity to large, or unique markets; proximity to, and favorable pricing of, major raw materials; labor quality and availability; available tax or other forms of investment incentives; a location that is shovel-ready (quick start-up); availability of water, power and other key infrastructure components; and favorable factors related to disposal or treatment of manufacturing by-products or wastes. These and other plant location factors were discussed with all interviewees. Although a quantitative analysis of these factors is possible and would typically be undertaken by individual companies, our discussion is based on more qualitative information obtained from the interviewees.
Virtually all interviewees confirmed directly or indirectly that their new or expanded yogurt facilities were located in New York due primarily to the state’s (1) proximity to large, dense population centers along the east coast with the highest per capita

34
consumption of yogurt in the U.S.35 and (2) large milk production volume. Some interviewees noted that their New York location gives them quick access to the interstate highway system and allows cost competitive distribution of their products as far west as Chicago, as well as throughout the East Coast.
The authors discussed milk supply considerations in considerable detail with all interviewees. They all cited the availability of an ample milk supply as a key consideration in their plant location decision, but most of them appeared to have done relatively little in-depth analysis of milk production trends by state or region, the underlying cost of milk production, factors and trends within or among states, the long term availability of milk at competitive prices, or future factors that might affect dairy farm profitability and production growth. For most processors, it seemed to be enough that New York is a large milk producing state, and they could identify one or more cooperatives willing to supply them needed milk requirements (and/or milk components, such as skim milk) in the first year or so of the plant’s start-up.
None of these processors indicated they had negotiated a long-term milk supply relationship with their supplier(s). The authors believe that Greek yogurt processors likely concluded that in a major milk producing state, a plant producing a premium product (read, high margin) could effectively compete for needed milk supply with Class III and IV manufacturers. Suppliers of milk to New York plants indicate that premiums paid on Class II milk are typically similar in magnitude to Class I premiums and larger than Class III premiums and the premiums paid on some Class IV milk. They also indicate that the cost of servicing Class II plants is generally less than costs for Class I plants, which tend to have more difficult delivery requirements.
As to why so much Greek yogurt capacity is in New York State, the authors believe that there is, to some degree, a “follow the leader” mentality at work (Fage and Chobani having chosen NY). By the same token, one could say that the rationale used by the pioneering companies made sense to those that followed: there was ample milk in NY for their operations, NY produced more milk than any surrounding state, and it represented a cost effective distribution point. The authors did not hear from any interviewee that they had substantive discussions with one or more cooperative milk suppliers about the merits of alternative locations in the Northeast, i.e., Pennsylvania, Vermont, or other NE states. However, several companies prior to choosing a NY location considered alternative locations.
One interviewee commented that processors who do not produce a strained Greek yogurt enjoy a significant milk ingredient or procurement cost advantage over those who do. While it is correct that strained Greek yogurt uses at least 2 – 3 times more farm milk,
35 According to DMI Custom Yogurt Database; Symphony IRI Group—US Grocery Sales, for calendar 2011, the
Yogurt Development Index or YDI (essentially a measure of per capita consumption) was highest in the Northeast Region (MD, DE, PA, CT, NJ, RI, MA, NY, VT, NH, & ME) at 143.0 while the Western Region was next highest at 107.0, against a U.S. average of 100.0. This same data source also reported that for Greek yogurt specifically, the YDI in the Northeast Region was 209.0 in 2011 while the Mid-South and West Regions had the next highest indices at 98 and 95, respectively.

35
as a direct ingredient, than non-strained Greek-style yogurt, non-strained Greek yogurt makers must purchase dairy-based ingredients that their strained Greek yogurt processors do not. Calculations, based on processors’ individual formulae, would be required to determine accurate dairy ingredient cost differences.36 While it is theoretically possible that a strained yogurt maker will buy farm milk that is not "local" and a non-strained yogurt maker will buy dried milk or whey proteins that are from local milk, the far greater likelihood is that strained yogurt makers will rely much more heavily on locally produced farm milk for their total raw ingredient mix. Whether or not this is a cost advantage or disadvantage is not something about which a sweeping conclusion can be made. This must also be weighed against the ability of different types of yogurt manufacturers to differentiate their product with consumers, based on either the nature of the process, locality of production, or sensory profile.
Other factors helped to determine where within New York the plant is located. Several interviewees indicated that speed to market was important in their plant location selection, but generally this affected where within New York State they chose to put their plant after New York had been identified as the preferred state. While “speed to market” is a strong consideration for any company wishing to open a processing plant of any kind, in the case of Greek yogurt, being an early entrant in this rapidly growing market offered a company easier market penetration, lower slotting fees, and likely higher margins when demand was significantly outstripping supply. One interviewee cited the existence of a plant that had been mothballed for some time that they could convert to yogurt production quite quickly as the reason for their specific location in the state. Others noted that industrial parks, with the infrastructure and basic permitting already in place, offered significantly faster building sites than raw, “green field” properties. These locations were described as “shovel ready”.
Some yogurt processors mentioned the existence of a quality workforce in close proximity to a plant site as a consideration in their decision but not as important as previously mentioned factors. This suggests a recognition that a certain degree of workforce development will likely be required anywhere.37
Financial incentives for plant investments, often offered by towns, cities and development councils did not seem to be a major consideration in plant location decisions in most cases; however, in two or three cases, a development council’s or municipality’s attitude toward development and their willingness to be a manufacturer’s
36The fact that non-strained Greek yogurt processors rely less on locally-produced milk than traditional,
strained Greek yogurt processors suggests that they are less vulnerable to (or better able to withstand) tight farm milk supplies in their milkshed.
37 Workforce development was an important positive in the citing of Chobani's second plant, in Idaho. This is illustrated in the following news story http://magicvalley.com/news/local/college-of-southern-idaho-to-help-prepare-workers-for-chobani/article_00fb26e7-9afe-570d-b625-1cf32d94db53.html Job training programs also followed the construction of two new plants in western New York: http://www.democratandchronicle.com/article/20130603/BUSINESS/305280077/Batavia-yogurt-plant-opens

36
“partner”, as one interviewee phrased it, proved to be a major differentiator between two competing sites because the “partner” was perceived to be able to shorten the time necessary to get the plant up and running.
The Rich and Varying Nature of Greek Yogurt Companies
Greek/premium yogurt companies represent a new profile for the U.S. dairy industry. The authors were struck by the unique kinds of processors that have populated the Greek yogurt market in the U.S. Their profile is dramatically different and more varied than that found in other dairy product categories. Consider this unique characterization of the major players in this only 6 year-old market:
• Foreign dairy investment by dairy companies with no prior experience in the U.S.—Fage (declined to be interviewed), Alpina, and the Theo Müller Group (partnering with PepsiCo to form Müller Quaker Dairy) are in this category.
• U.S. food companies with no prior U.S. dairy experience—PepsiCo, the Theo Müller Group’s partner in a state-of-the-art premium/Greek –Style yogurt plant in Batavia, New York, is an example of this profile.
• Brand new start-ups with only Greek yogurt production (Chobani). • Joint ventures with domestic and international companies—Müller Quaker
Dairy fits this profile, as does Commonwealth-Ehrmann with Greek yogurt plants in Brattleboro, VT and another scheduled to open by the end of 2013 in Casa Grande, AZ.
• Large, international yogurt companies with dominant positions in the U.S. yogurt market (Dannon/Danone and General Mills/Yoplait) playing catch up with new Greek yogurt manufacturers (like Chobani and Fage).
• At least 2 dairy farmer cooperatives that produce Greek yogurt, 1 doing private label only and another doing both private and own-label Greek yogurt.
• A start-up in New England with some European investment, doing mostly private label Greek yogurt (Commonwealth). This company is reported to be building a second Greek yogurt plant in Arizona in partnership with United Dairymen of Arizona. (We did not interview this company.)
Observations on the State of the Greek Yogurt Industry in New York and the Northeast
Farmers Have Positive Attitude Toward Greek Yogurt
Based on the authors’ interviews of two large cooperatives actively engaged in supplying milk and milk ingredients to Greek yogurt manufacturers (and in the case of one cooperative, making Greek yogurt in their own plants), Northeast farmers have a very positive attitude toward growth in demand for milk for Greek yogurt. Novakovic has estimated that in 2011, milk used to make Greek yogurt added only about $.03/cwt. to farmers’ blend price in Federal Milk Marketing Order No. 1 (less than ¼ of 1% of the

37
blend price).38 In spite of this very modest price effect, Greek yogurt demand is viewed very favorably by farmers in NY and throughout Federal Order No. 1 for the following reasons:
a) Greek yogurt represents high-value, commercial demand with good, long term consumer prospects;
b) From our interviews the authors learned that in general, milk (or milk components) sold to Greek yogurt processors commands a high over-order premium, perhaps even higher than Class I products; (Over-order premiums are a component of the plant pay price above the Federal Order minimum class prices and are negotiated by a dairy cooperative or a cooperative bargaining agency. They are determined by a combination of service costs and competitive conditions in the raw milk marketplace.)
c) If dairy farmers are members of a cooperative that itself makes Greek yogurt, it represents a strong in-house profit/margin opportunity for the cooperative and its members relative to the alternative uses for this milk; and
d) Serving yogurt processors may reduce balancing costs for cooperatives. Milk deliveries to yogurt plants follow farm milk production patterns quite well for the first 7 months of the year while in the last part of the year their demand exhibits a pattern that at least partially offsets opposite movements in the fluid milk sector. The net effect of supplying yogurt processors (and fluid milk processors too) would seem to make for less need to move farm milk in and out of balancing plants in the Fall.
Demand Growth Expected to Continue
Yogurt processors expect continued, strong growth in demand for Greek and premium yogurts in the next five- 10 years. Without exception, all interviewees expected demand for Greek and other premium yogurts to continue to grow strongly in the next five -10 years. “Packaged Facts”39 recently forecast that overall yogurt sales revenue would grow over 27% from 2012 to 2017 and that Greek yogurt would be the major catalyst. All executives interviewed rejected the notion that Greek yogurt was a fad. Additional evidence in support of this belief includes Chobani’s investment in a new Greek yogurt plant that opened in Idaho in December 2012; another New York Greek yogurt processor who has plans for a western U.S. plant within just a few years; and the previously mentioned new Greek yogurt plant being built by Commonwealth and Ehrmann in partnership with United Dairymen of Arizona in Casa Grande, AZ. Reasons given for strong growth expectations were:
1. Relatively low per capita yogurt consumption in the U.S. compared to other high dairy product consumption countries that have a similar social and
38 This is based on the author's calculations using Federal Order 1 price and utilization data. 39 Packaged Facts (division of MarketResearch.com), “The Yogurt Market & Yogurt Innovation: Greek Yogurt &
Beyond”, April 2013.

38
economic profile (most of Europe and Canada). Interviewees see no reason why the gap in per capita yogurt consumption should not close significantly going forward although most stopped short of predicting that U.S. consumption would rise to the levels seen in Europe.
2. Yogurt consumption is expected to be driven by consumers’ desire for improved nutrition; more/better taste; expansion into other day parts or eating occasions (e.g. dessert and late night snacking); and expansion into largely untapped demographic groups (e.g. men and children). The interviewees see Greek and other premium yogurts as the principal vehicle fulfilling this new demand. Some interviewees noted that as yogurt demand expands into other day parts, much of that new volume would go through foodservice channels.40
3. One processor believes that Greek yogurt demand will be bolstered by its positive role in weight management, although that benefit will need to be part of a company’s (or the whole industry’s) product positioning and marketing efforts.
Greek Yogurt is Not Expected to Have a Federal Standard of Identity Soon
There is processor interest in an FDA-adopted standard of identity for Greek yogurt, but the interest is not universal. Some interviewees strongly believe that the integrity of Greek yogurt needs to be protected by a federal standard of identity and without a standard, growth of the category will be hurt as consumers perceive a less than uniform, consistent type of product under the “Greek” banner. Even among those who favor a standard of identity, there is not agreement on which specific characteristics, processes, or ingredients Greek yogurt should be differentiated. As noted earlier in this report, some processors can be described as traditionalists who believe that Greek yogurt should at a minimum be strained and not centrifuged. A slightly less traditional group of processors would support a standard that required Greek yogurt to be either strained or centrifuged. Then there were some processors interviewed who, if they supported a standard of identity at all, would insist that it not require a straining or centrifuging step; these processors, if they would support a standard, would suggest that it be written around nutritional characteristics such as protein level (and not on process or ingredients). The authors encountered some Greek yogurt processors who feel that no standard should be developed, but rather their preference that the marketplace sort out the winning and losing products based on whatever attributes consumer's value.
Everyone interviewed by the authors agreed that the odds of shepherding a Greek yogurt standard of identity through the U.S. Food & Drug Administration would, at best, be a 10+ year process (given FDA’s history in promulgating other dairy and food standards, their tight budget and broadening responsibilities stretching available resources very thin, and their emphasis on the high priority mission of ensuring the safety of
40 It was pointed out by at least one interviewee that effective and economical distribution of yogurt through
foodservice channels requires product with a 90-day shelf life, which until only recently was not widely possible.

39
domestic and imported foods and food ingredients). Given this likely reality, it seems to the authors that it will be up to each Greek and premium yogurt processor to position and market their product offerings to achieve the “identity” they desire. Everyone interviewed by the authors believe that the key to continued growth and development of the Greek yogurt category is continued product differentiation within the Greek and premium yogurt segment, including the expenditure of significant resources to marketing.
The Yogurt Case is Cluttered at Best and Confusing at Worst
The yogurt section of the supermarket dairy case is getting bigger and more confusing for consumers. In a recent Wall Street Journal report,41 this phenomenon was observed, with both positive and negative outcomes typical of the battle for limited retail shelf space:
Over a third of the yogurt in a typical grocery store is now Greek, in varieties from low-fat to fruit-on-the-bottom to tubes for kids. Because shelf space is limited, the Greek squeeze means consumers have had to say goodbye to some varieties of traditional-style yogurt and more obscure flavors…. Pudding cups, margarine and other products with the misfortune of usually sitting near yogurt also are harder to find. The authors and two interviewees share this view. The authors spent several hours
perusing the yogurt section of the dairy case in several upstate New York supermarkets (representing chain grocers). What we observe is that 1) the amount of space allocated to yogurts in the dairy case, is growing by measures of linear feet, 2) this is at the expense of conventional yogurt but also other refrigerated products, and 3) the range of brands, products and SKUs present a daunting visual complexity for the consumer. This complexity is created by all of these factors and attributes:
1. organic or not;
2. large increase in number of facings accommodated by the retailer;
3. wide variety of package sizes;
4. at least 3 different fat levels of yogurt;
5. yogurt for children, breakfast, GI health, etc.; Greek, gluten free, fruit on the bottom, blended,
6. Packaging styles, including individual cup, with or without a “side car” for inclusions, bulk packs, club packs, and dessert sizes.
It is fairly easy to select a particular yogurt product only to later discover it was not exactly what was intended (not by brand, but for example, getting a 2% fat product of brand X when it was brand Xs nonfat product that was desired).
41 "The Greek Yogurt Culture War" by Sarah Nassauer, 3 September 2013. http://online.wsj.com/article/SB10001424127887324886704579052974211438870.html#printMode

40
Several executives interviewed indicated a concern about the complexity of the yogurt case. One interviewee suggested that so-called “shelf-ready” packaging, as is commonly used in Europe, would help “clean up” the yogurt case and at the same time reduce in-store labor to stock and maintain the case. The 5.3 oz. single serve cup seems on its way to becoming the predominant size (over the 6.0 oz. size), but alternative sizes for single serve containers seems to be one way in which brands are trying to differentiate their product, either to reduce the price point or offer the consumer a larger portion. Interviewees offered the prevailing view that the smaller serving size was becoming more popular because it carried a lower price point (not for any reasons related to nutrition labeling).
The authors refer the reader to Table 5, which shows among other characteristics, the single serve package size found for all Greek yogurt brands in two upstate New York supermarket chains: only Chobani, Alpina Revive, and Wegmans' store brand Greek yogurt were in 6.0 oz. packages.
TABLE 5. GREEK YOGURT MARKETED IN NEW YORK SUPERMARKETS (following).

41
Table
5. G
reek
Yogu
rst
Mar
kete
d in N
ew Y
ork
Super
mar
kets
Com
pany
Prod
uct N
ame
Fat C
onte
ntPl
ain
or F
lavo
rSi
zeC
alor
ies
FATS
So
dium
Pota
ssiu
mTo
tal C
arbs
Die
tary
Fib
erSu
gars
Prot
ein
Vit
AV
it C
Vit
D 3
Vit
EC
alci
umIr
on
ozs.
mg
mg
mg
mg
mg
mg
gg
gg
%%
%%
%%
Cho
bani
Cho
bani
0%Pl
ain
610
00
00
080
07
07
180%
0%0%
0%20
%0%
Fage
Fage
Tot
al0%
Plai
n5.
312
00
00
050
017
016
130%
0%0%
0%15
%0%
Dan
non
Oik
os T
radi
tiona
l0%
Plai
n5.
380
00
010
5016
06
06
150%
0%0%
0%15
%0%
Dan
non
Ston
yfie
ld O
ikos
0%Pl
ain
5.3
800
00
060
230
60
615
0%0%
0%0%
20%
0%D
anno
nLi
ght &
Fit
Gre
ek0%
Peac
h *
5.3
800
00
1045
160
80
712
0%0%
0%0%
15%
0%Yo
plai
tYo
plai
t Gre
ek 1
000%
Peac
h *
5.3
100
00
0<
545
014
09
104%
0%20
%0%
10%
0%V
osko
sV
osko
s G
reek
0%Pe
ach
*5.
312
00
00
550
170
160
1512
0%0%
0%0%
15%
0%Yo
Cru
nch
Yopa
!0%
Peac
h5.
311
00
00
090
015
015
110%
0%0%
0%15
%0%
Cab
otC
abot
Gre
ekLo
wfa
t (2%
)Pl
ain
8**
150
53
035
120
011
011
2225
%25
%25
%25
%40
%6%
Alp
ina
Rev
ive
0%Pl
ain
with
Art
emis
Vita
lity
614
03
00
010
50
111
617
0%0%
0%0%
15%
0%M
ulle
r-Q
uake
rG
reek
Cor
ner
Low
fat (
2%)
with
Hon
eyed
Apr
icot
*5.
313
02
10
1580
020
017
90%
0%0%
0%25
%0%
Weg
man
'sG
reek
Yog
urt
0%Pl
ain
690
00
00
6515
08
08
150%
0%0%
0%20
%0%
* **
Table
5. G
reek
Yogu
rst
Mar
kete
d in N
ew Y
ork
Super
mar
kets
Com
pany
Prod
uct N
ame
Fat C
onte
ntPl
ain
or F
lavo
rSi
zeM
ilk,
skim
N
DM
Cul
ture
sW
PCM
PCSu
gar
MFS
Fruc
tose
or
Su
cral
ose
Gel
atin
or
Pect
inV
it A
Vit
D 3
Vit
CV
it E
ozs.
Cho
bani
Cho
bani
0%Pl
ain
6x
xFa
geFa
ge T
otal
0%Pl
ain
5.3
xx
Dan
non
Oik
os T
radi
tiona
l0%
Plai
n5.
3x
xD
anno
nSt
onyf
ield
Oik
os0%
Plai
n5.
3x
xD
anno
nLi
ght &
Fit
Gre
ek0%
Peac
h *
5.3
xx
xx
Yo
plai
tYo
plai
t Gre
ek 1
000%
Peac
h *
5.3
xx
xx
xx
xV
osko
sV
osko
s G
reek
0%Pe
ach
*5.
3x
xx
x
xx
YoC
runc
hYo
pa!
0%Pe
ach
5.3
xx
Cab
otC
abot
Gre
ekLo
wfa
t (2%
)Pl
ain
8**
xx
xx
xx
xx
Alp
ina
Rev
ive
0%Pl
ain
with
Art
emis
Vita
lity
6x
xM
ulle
r-Q
uake
rG
reek
Cor
ner
Low
fat (
2%)
with
Hon
eyed
Apr
icot
*5.
3x
xx
xx
xx
Weg
man
'sG
reek
Yog
urt
0%Pl
ain
6x
x
Plai
n yo
gurt
not
ava
ilabl
e. Y
ogur
t and
frui
t pre
para
tion
ingr
edie
nts
liste
d to
geth
er o
n la
bel;
this
tabl
e in
clud
es b
oth.
All
nutr
ition
al in
form
atio
n ca
lcul
ated
on
8 oz
s. (=
serv
ing
size
)
ING
RED
IEN
TS
NU
TRIT
ION
AL
INFO
RM
ATIO
N

42
Barriers to Entry Have Increased
Slotting allowances represent an increasingly higher barrier to entry for Greek yogurt processors. Four interviewees commented on the rise in slotting allowance levels for Greek yogurt (and other premium yogurts) and the increasing cost of market entry was increasing. Interviewees cited four (4) reasons for higher slotting allowances:
a) Bigger players have entered the Greek/premium yogurt market with enhanced financial ability to pay slotting allowances;
b) There are more Greek/premium yogurt processors now, representing increased competition for shelf space;
c) Refrigerated dairy case growth is limited but brands are proliferating and while Greek/premium yogurts may be able to wrestle some space from other dairy products (due to their higher store margins), shelf space is still tight;
d) Retailers are more “in the driver’s seat” now that there are many Greek yogurt brands, some interviewees observed, and supermarkets see the opportunity to drop poor performing Greek and other premium yogurt labels so they can re-sell those slots.
Acid Whey Disposal is a Major Cost Factor
Every executive interviewed who made strained yogurt noted that disposal of acid whey from strained or spun Greek yogurt is a major cost and processing/disposal challenge.42 At the present time, there is a substantial cost imposed on Greek yogurt processors who strain/centrifuge their yogurt. For every 7,000 gallons of farm milk or 60,200 pounds (about the capacity of an over-the-road milk tanker) that is received by such a Greek yogurt processor, there will be about 4,200 – 4,900 gallons (36,120 – 42,140 pounds) of acid whey to handle as a by-product, according to executives making a strained product. Their options are several but at this stage, all processors interviewed who made strained Greek yogurt indicate that all available, practical options are an added cost, not a source of revenue. Options for acid whey include:
• As animal feed (liquid): it is necessary to find farms that will accept liquid (or evaporated/concentrated) acid whey for use in a total mixed ration. Lactose can replace some corn in the ration. The processor has to pay the farmer a "dumping" or "handling" fee to take the whey as well as pay for transporting it to the farm. This is most viable when farm(s) are nearby to the yogurt facility, but there is also a great advantage to delivering to very large farms; hence, current practices typically involve long hauls.
42 Acid whey, so-named to distinguish it from the whey that is a by-product of cheese-making, is more fully
described and discussed in: Acidity is not a Synonym for Toxicity, PDMP IL13-02, by A.M. Novakovic. http://dairy.wisc.edu/PubPod/Pubs/IL13-02.pdf
43
• As a soil nutrient, applied to farm land: Farmers must be found who will take the liquid, and then it has to be carefully applied to prevent ground or surface water contamination, especially as regards chloride and phosphate loading. The processor pays for this disposal mechanism. Hauling and handling costs are the same or similar for disposal as an animal feed. One interviewee described this option as a public relations/corporate image “time bomb” waiting to damage a brand, due to the potential, perceived or real, for improper handling or excessive application.
• Further processing of the acid whey into one or more products that can be more easily or profitably produced and sold: Examples of this would be animal feed, human food ingredients, and industrial products. Some research has been done on the development of processing options, and there are a variety of businesses offering solutions to strained yogurt manufacturers. Nonetheless, there is not a single solution that is clearly viable or attractive under all circumstances. Challenges in this regard include the high capital cost of the equipment necessary to further process acid whey (economies of scale favor only the very largest Greek yogurt processors), the tendency of acid whey to foul or otherwise compromise the equipment used to evaporate and dry sweet whey from cheese operations; and the lack of significant and organized markets for specialized by-products.
• Use as fuel in an anaerobic digester to produce methane gas and ultimately electricity: Quite likely this would be in an input mix with manure or other wastes. Digesters are an environmentally appealing solution but they are tricky to operate and expensive. They tend to make economic sense only when 1) built quite large, 2) operated at or very near capacity, and 3) have a consistent flow of fairly homogeneous inputs. Generally, they are cost prohibitive for most Greek yogurt processors to build or operate efficiently, but there is work underway in some localities on the feasibility of a common facility that processes the acid whey from two or more Greek yogurt processors in the area. Such digester facilities could be owned by a municipality or by a private entity. In New York State, it may be feasible for digesters to be economically built and operated to serve several Greek, cottage cheese, and or other farm and/or food processing waste streams.
As described earlier, Greek yogurt processors who do not strain/centrifuge their yogurt do not generate acid whey and so avoid the costs and challenges associated with it.
Competition is Increasing and Not All May Survive
Many manufacturers of Greek yogurt have plans for expansion. They know where future plants will be sited (at least in a general sense) and they have a vision of their capacity growth. However, there is also a general feeling among some Greek and premium yogurt processors that over-capacity exists (or soon will) in the U.S. market. Perhaps this is a combination of faith that "they" will succeed but "others" will not. This concern has several facets or manifestations. If some of New York’s new yogurt plants

44
close, either due to outright financial failure or a failure to meet investor’s expectations for competitive returns, milk supply developed over the past several years to meet the voracious needs of the Greek/premium yogurt industry will be displaced and will have to be processed in lower usage classes and may also require longer hauls (paid by farmers) to find plants that will take such milk. There may be a maintenance of existing capacity and production, but hoped for future growth in the industry may not meet current expectations.
Another effect of over-capacity (and increased competition among yogurt processors for shelf space) is reduced prices and margins. There is ample evidence already that wholesale and retail prices have fallen over the past few years as more and more Greek/premium yogurt competitors have entered the market. DMI Custom Database and Symphony IRI Group report that Greek yogurt prices fell from $4.88 per pint to $3.31 between 2006 and 2011, whereas non-Greek yogurt prices rose from $1.50 to $1.75 in this same period43 As prices and margins fall, the possibility of some processors exiting the industry increases.
A related development in the yogurt industry that also puts downward pressure on yogurt prices is the sale of store or private label Greek/premium yogurt products. While private/store brands are not as prevalent in the Greek yogurt segment yet as in other dairy product categories, private/store brands are appearing in increasing numbers, often produced by dairy cooperatives or private dairy companies with wide product portfolios that waited until the Greek yogurt market was clearly not a fad before making the necessary investment to produce Greek yogurt. DMI’s Custom Yogurt Database confirms that private and store brands of Greek yogurt represented 15% of the total U.S. Greek market in 2011, up over the past few years.44
Greek Yogurt Industry in NY Has Affected Cream and Butter Markets
The development of Greek yogurt industry in New York and the Northeast has increased cream availability, thereby improving the profitability of butter manufacturing. This observation came from one cooperative interviewed. Dairy cooperatives with butter making operations have seen increased volume of cream available for churning as Greek yogurt processors (with a market emphasis on low- and non-fat yogurts) generate large volumes of cream. Butter operations in New York and the Northeast not only can operate at higher capacity but the price of cream also has come down.
Observations on the Future of the Greek Yogurt Industry in NY
New York Will Remain the Largest Greek Yogurt Manufacturing State
New York will continue to be the largest producer of Greek yogurt for the foreseeable future. While the growth rate will not continue apace, New York is expected to hold on to its ranking as the premier state for yogurt production (in general) and Greek yogurt, in particular. Several factors contribute to this situation.
43 Private data prepared by Dairy Marketing Inc. 44 ibid.
45
a) Large and generally quite new/modern fixed plant investments already exist in New York and the vast majority of those assets will be employed for many years.
b) Supporting businesses are also being built in New York. Consider the recent announcement by AGRANA Fruit USA that it will build a fruit processing plant in Lysander, New York to serve the growing number and size of dairy product processors (including the Greek and premium yogurt segment) in New York and the Northeast.
c) New York’s proximity to large, high per capita consumption markets—and easy access to the interstate highway system--will help insure that high volume production will continue in the state.
d) Expected continuance of New York’s role as one of the country’s major milk producing states.
Certainly if demand for Greek yogurt continues to grow, additional processing capacity will be built in the western half of the U.S. where milk supplies are large and growing and distribution costs to large western markets can be minimized. And, as mentioned previously, some existing yogurt capacity could be shuttered if financial goals cannot be met due to lower prices and margins, high slotting costs, the large marketing muscle of some Greek yogurt processors, and difficulties in adapting to the uniqueness of the U.S. market, to name a few challenges still facing New York Greek and premium yogurt processors.
One situation to watch for its potential to negatively affect the amount of Greek yogurt processing in central and eastern New York is the recent trend of very low or even negative growth in milk production in most parts of New York except the western third of the state. If this trend continues, yogurt processing in those parts of the state could be limited by the availability of milk but most importantly, by its cost. To the extent the Greek yogurt market grows via un-strained yogurt products, these plants require less fresh, liquid milk than do strained yogurt plants, so un-strained plants would put less strain on milk supplies in any given region of NY. Three interviewees expressed a concern for the long-term competitiveness of New York’s dairy farmers vis-a-vis those in other significant milk producing states. As was discussed in an earlier section, the trajectory and prospects for milk production growth vary widely. The continuation of these trends has significant implications for the cost of procurement for plants located in different parts of the state and how executives view the viability of Greek yogurt plants. Greek and premium yogurt processors should be able to compete with Class III and IV users vying for the same milk supply, but they will also consider their cost of milk relative to other areas of the country.
Many yogurt manufacturers we interviewed have urged New York’s lawmakers and regulators to identify and implement steps that could be taken to improve the competitiveness of New York dairy farmers (with emphasis on regulations that stymie growth in dairy farming operations whether by complicated, time consuming regulations or the cost of complying with environmental, energy, or sustainability regulations). This sentiment is understandably shared by many other processors who have significant

46
investments in New York. Careful thought needs to be given to the very different conditions and needs in the various regions of New York.
Greek Yogurt Demand Will Continue to Grow, But
Demand for Greek yogurt will continue to grow—and grow the overall yogurt category. The growth rate of Greek yogurt over the past 4-5 years will not be sustained at the same level for the next 5 years, and the authors—and if fact, all the executives interviewed--do not expect per capita consumption of yogurt in the U.S. to reach that of Europe, but the upside potential for yogurt consumption is still large. The most rapid growth will occur in those regions where per capita yogurt consumption is lowest (so growth will likely slow in the Northeast and New England). Greek yogurt has cannibalized —and will continue to cannibalize--consumption of other dairy products, including other styles of yogurt and other dairy products, so any Greek yogurt growth will not be without some offsetting declines in other dairy product categories. There is ample anecdotal evidence that Greek yogurt has cannibalized other yogurts, sour cream and cream cheese (in dips and sauces, especially in plain, full fat 2 pound packages), fluid milk (as Greek yogurt displaces breakfast cereal), ice cream (as Greek yogurt makes inroads as a nighttime snack), and other dairy-based and non-dairy based desserts.
Private Label Greek Yogurt Will Grow Strongly
Private label (or store brand) Greek yogurt will experience strong growth in the next 5-10 years. Now that Greek yogurt has established itself as a permanent player in the broader yogurt marketplace, private/store label products will proliferate. Private/store brand Greek yogurt—plain and vanilla flavor in particular, especially in large multi-use packages (1 – 2 lbs. sizes)—will expand the Greek yogurt market by offering the highest value to individual consumers (especially for cooking) and foodservice customers. Most executives interviewed indicated that such products were of comparable taste, texture, and composition to brand name Greek yogurts (plain and vanilla) but were offered at lower prices than the national or regional brands, resulting in a superior value.
For single service Greek yogurt (with fruit or other inclusions, whether or not multi-pack), interviewees thought that more private/store brand products would be offered and would appeal to the cost-conscious consumer, even if not of the same perceived quality as national or regional brands. This additional competition from store/private label Greek yogurt will help bring down the price of all Greek yogurts. No interviewees expressed the view that grocery retailers were likely to invest in their own Greek yogurt processing facilities, leaving the private/store label niche to cooperatives and full line regional dairy product processors.
One interviewee described the U.S. Greek yogurt market as having many similarities to the cheese market: having many market niches that can be exploited to grow the category just as the many varieties, flavors, styles and forms of cheese (both domestic and imported) have done--especially over the past 25 years.
It should be noted that while the major international yogurt processors—Danone and Yoplait—and smaller national and regional brands were very slow to embrace the Greek

47
yogurt wave, they are moving aggressively now to catch up. This bodes well for the overall Greek yogurt category but may be an ominous sign for smaller, less experienced competitors.
No Standard of Identity in the Next 10 Years
There will not be a U.S. standard of identity for Greek yogurt promulgated in the next 10-15 years. While the authors have argued this position in an earlier section of this paper, it bears repeating here in order to emphasize: (a) that there are marketing opportunities for Greek yogurt processors to carve out a niche of their own design (but at considerable marketing expense) and (b) the development of a new federal “Commercial Item Description” or CID does suggest that manufacturers will have ways to differentiate their product and draw attention to the defining attributes of Greek yogurt. This will help to ensure that Greek yogurt used in school lunch and breakfast programs carry higher protein credits than other yogurts (or equal protein credits but at a smaller serving size), and this in turn should serve to create a positive category image as well as introduce younger consumers to the product.
Improvements in Handling Acid Whey are Badly Needed
Breakthroughs in acid whey utilization will be important for Greek yogurt (strained or centrifuged) to continue to grow in the U.S. and further improve overall profitability. Such research results will help reduce the cost of Greek yogurt production (strained/spun). Cost-effective (indeed, revenue-generating or cost-offsetting) ways to use acid whey will increase the viability and growth of the Greek yogurt industry. Land application and animal feeding are not appealing long run solutions for acid whey disposal/use. New technologies or creative application of existing technologies to the further processing of acid whey (into food or feed stuffs) or as a fuel for energy generation hold promise. Already, manufacturers of technologies and processes to use acid whey as a feedstuff to produce commercially valuable feeds are exploring their potential in New York. As noted previously, economies of scale with such technologies suggest their economical application only for the largest Greek yogurt processors, for groups of Greek yogurt and/or other food processors acting together to build and run shared facilities, or municipalities to build and operate digesters for the receipt of acid whey from multiple plants.45
The Role of States and Universities
Both state governments and universities were seen as important in helping to ensure the strength of the milk production sector in New York and the Northeast as well as addressing important concerns of yogurt processors.
Virtually all interviewees hoped that Cornell University could assist Greek yogurt makers with technological breakthroughs in acid whey processing into food or feedstuffs
45 One interviewee indicated that a water district has agreed to build a digester that will accept the acid whey
from their new plant. The Greek yogurt plant currently under construction in Casa Grande, AZ reported received a boost when the city agreed to build a $2.5 million sewer line expansion to carry the plant’s waste stream, paid for with development impact fees (TriValley Central/Arizona City News, 8/16/2013).

48
and/or new, commercially viable uses for acid whey. Where and how academic researchers can move beyond basic research to applicable and practitioner-oriented research is a constant challenge for academia, but there is a strong sense among all parties that there is a role for academia in helping this industry solve manufacturing and product challenges and achieve improvements in product quality and business performance. Although not unique to the Greek yogurt subsector, the rapid expansion of yogurt plants in New York raised awareness of the need for targeted educational and training programs for new employees. It is especially valuable to have programs that provide college-level training in food processing, handling, and safety techniques and concepts
Most interviewees also saw a role for New York State in improving the climate for business across the dairy sector. This relates to broad issues of taxation, including property and income taxes as well as very specific issues related to business development. Specific incentives to build or retain plants are valuable but do not in and of themselves overwhelm basic business climate and product sector attributes. Two specific areas for government involvement that are mentioned span the value chain. One is to reduce disincentives and increase incentives to promote growth in milk production. Another is facilitating the building of large-scale digesters, including the full range of tax and investment incentives that might encourage the building and operation of such facilities.
CONCLUSIONS AND FUTURE RESEARCH NEEDS
I. The selection of New York as the entry point for a new Greek yogurt processing activity was driven by a combination of factors
a. Chief among these is proximity to large urban markets and a potential customer demographic that includes
i. Consumers with previous product experience
ii. Epicures
iii. High income consumers who are better able to experiment with new, higher value products
b. A strong transportation and distribution system, both in terms of its physical and business structures
c. A large volume of milk production in a reasonably small area (high density as well as large volume)
d. A set of current milk users that include buyers who are less well able to compete for, and retain, existing milk production
II. Greek yogurt is not a fad. Its share of total US yogurt volume will continue to rise.
a. It will increase the total volume of milk used in yogurt as well as total yogurt sales on both a volume and dollar basis.
b. But, the increase in Greek yogurt will to a degree cannibalize regular yogurt sales.

49
c. Total yogurt consumption in the US will rise modestly.
III. NY will continue to be a major—and probably the major—producer of Greek yogurt in the US for many years.
a. NY is close to major eastern population centers and
b. Has a large, strong, and relatively new processing capacity for Greek yogurt that will be viable for many years to come.
IV. Without a federal standard of identity, Greek yogurt processors will offer consumers varied approaches to Greek yogurt (strained and unstrained) and different ingredient sets and protein levels. Marketing strategies, advertising and promotion budgets, and product texture/taste will play key roles in determining the winners and losers.
V. NY’s ability to grow its share of Greek yogurt production will depend at least to some degree on consumer choices with respect to styles and brands.
a. If the Greek category remains predominantly defined by branded, strained yogurt, this will strengthen NY's position.
b. If it gravitates more towards a product based on conventional yogurt production with added dairy proteins and thickening agents, then production capacity is more mobile.
c. Somewhat offsetting this is the fact that an augmented conventional yogurt producer in the Northeast will have some procurement advantage because dry milk proteins can be sourced outside of New York, thus putting less pressure on NY’s slowly growing milk supply. This advantage is not unique to a NY processor location.
d. A consumer shift to private-label products would also tend to dilute the advantage of existing New York processors.
As indicated in the introduction, a second study will build on what has been learned from this project. The emphasis of that study will be to project possible category growth scenarios and interface them with alternative scenarios for milk production growth in New York and the U.S. This will be done in the context of a model of the US dairy sector, which has geographic and supply chain detail. Optimal plant location scenarios will be evaluated based on these alternative scenarios and opportunity costs (valuation) of milk in New York will be estimated under the different scenarios.

50
APPENDIX 1: NEW YORK COUNTY MAP
APPENDIX 2: NEW YORK COUNTIES BY PRODUCTION REGIONS
New York Counties are assigned to regions based on their gross production characteristics, as illustrated in Figure 5. The following table identifies each county and its corresponding region.

51
REGION/COUNTY REGION/COUNTY
WESTERN NY GREATER SOUTHEASTERN NY
CAYUGA ALBANY
GENESEE BROOME
LIVINGSTON CHEMUNG
NIAGARA CHENANGO
ONONDAGA COLUMBIA
ONTARIO CORTLAND
SCHUYLER DELAWARE
SENECA DUTCHESS
TOMPKINS GREENE
WAYNE HERKIMER
WYOMING MADISON
YATES ONEIDA
WESTERN FRINGE ORANGE
ALLEGANY OSWEGO
CATTARAUGUS OTSEGO
CHAUTAUQUA RENSSELAER
ERIE SCHENECTADY
MONROE SCHOHARIE
ORLEANS SULLIVAN
STEUBEN TIOGA
NORTHERN NY ULSTER
CLINTON ADIRONDACKS
FRANKLIN ESSEX
JEFFERSON HAMILTON
LEWIS WARREN
ST LAWRENCE METROPOLITAN NY
NORTH CAPITAL BRONX
FULTON KINGS
MONTGOMERY NASSAU
SARATOGA NEW YORK
WASHINGTON PUTNAM
QUEENS
RICHMOND
ROCKLAND
SUFFOLK
WESTCHESTER

52