industry sales review november 2015 · motor cycles 853,257 866,705 1.5% mopeds 61,630 57,832 -6.1%...
TRANSCRIPT
1 | P a g e Industry Performance Review Report of PPAC: November, 2015 www.ppac.org.in
INDUSTRY SALES REVIEW
November 2015

2 | P a g e Industry Performance Review Report of PPAC: November, 2015 www.ppac.org.in
सखं ््या्:्पीपीएसी/पी-4035/सी् 23.12.2015
विषय:्पीपीएसी्की्उद्योग्बिक्री्समीक्षा्रिपोर्ट:् -्निम्िि 2015
नवम्बर 2015 माह की पीपीएसी की उद्योग बबक्री समीक्षा ररपोर्ट भेजते हुए हमें खशुी हो रही है
2. इसे महा ननदेशक, पीपीएसी के अनुमोदन से जारी ककया गया है ।
धन्यवाद
िोहित्डािि्
अपि्ननदेशक्
(मांग्एिं्आर्थटक्अध ््ययन) वितिण:्
पेट्रोलियम्एिं् प्राकृनतक्गसै्मतं्रािय्
ननजी सचिव (राज्य मंत्री- पैट्रोलियम एवं प्राकृनतक गॅस मंत्रािय) सचिव (पीएनजी)
अपर सचिव अपर सचिव एवं ववत त सिाहकार
संयुक त सचिव (ररफाइनरी)
संयुक त सचिव (माके.)
संयुक त सचिव (आईसी) संयुक त सचिव (जनरि) वररष्ठ सिाहकार
ननदेशक (एसएंडपी) / ननदेशक (आरएंडए) ननदेशक (ववतरण/सीसी)
ओएसडी (पेट्रोलियम), नीनत आयोग
उद्योग्
अध यक्ष, आईओसी, / ओएनजीसी, नई ददि िी
अध यक्ष एव ंप्रबंधक ननदेशक- बीपीसी/एिपीसी/गेि
ननदेशक (माके.), आईओसी/ बीपीसी/ एिपीसी/ गेि
महाननदेशक, पैट्रोफेड
प्रबंधक ननदेशक, एनआरएि, गुवाहार्ी
ओएमसी योजना एवं रररे्ि ग्रपु – एिओ
पे्रजजडेंर्, आरआईएि / सीईओ (माके.) इस सार
प्रनतलिवप:्
महा ननदेशक, पीपीएसी
ननदेशक (ववत त) एवं सभी ववभागाध यक्ष, पीपीएसी

3 | P a g e Industry Performance Review Report of PPAC: November, 2015 www.ppac.org.in
No. PPAC/P-4035/C December 23, 2015
Subject: Industry Performance Review Report of PPAC: November, 2015
We are pleased to forward herewith monthly Industry Performance Review
Report of PPAC for the month of November 2015.
2. This issues with the approval of Director General, PPAC.
Thanking you,
Rohit Dawar
Additional Director
(Demand & Economic Studies)
Distribution:
MoP&NG
Industry
Chairman, IOC / ONGC New Delhi
C&MD – BPC / HPC / GAIL
Director (Mkt.), IOC/ BPC / HPC /GAIL
DG, PetroFed
MD, NRL, Guwahati
OMCs Planning & Retail Groups – HO
President, RIL / CEO (Mktg.) Essar
PPAC:
Director General, PPAC
Director (Finance) & HODs, PPAC
PS to MOS( MOP & NG)
Secretary (PNG)
Additional Secretary
Additional Secretary & Financial Advisor
Jt. Secretary (Refinery)
Jt. Secretary (Marketing)
Jt. Secretary (International Cooperation)
Jt. Secretary (General)
Senior Adviser
Director (S&P) / Director (R&A)
Director (Distribution)
OSD (Petroleum), Niti Aayog

4 | P a g e Industry Performance Review Report of PPAC: November, 2015 www.ppac.org.in
This report analyses the trend of consumption of petroleum products in the
country during the month of November, 2015. Data on product-wise monthly
consumption of petroleum products for November, 2015 is uploaded on PPAC
website (www.ppac.org.in).
1.0 CONSUMPTION :
The growth (%) in consumption of petroleum products, category-wise, for the
month of November, 2015 is given in Table-1.
Table-1: Petroleum Products Consumption (Quantity in TMT)
1.1 All Products: The consumption of all petroleum products registered a growth
of 6.4% in November, 2015 as compared to that in November, 2014. Due to
heavy rains and widespread flooding in Tamil Nadu and on account of Diwali
festival, there was subdued consumption of petroleum products during the
month. Except for SKO, Bitumen and other products, all other products recorded
a positive growth. On cumulative basis, a growth of 9.5% was registered for the
period April to November, 2015. SKO and Lubes/Greases are the only products
which have recorded a negative growth of -3.7% and -7.4% respectively during
the period April to November, 2015.
Figure-1: Comparison of monthly POL consumption (MMT) and growth (%) since April, 2014
2.3%
3.5%
7.4%
3.4% 3.7%
6.9%
-2.0%
4.9%
7.5%
3.0%
9.7%
1.4%
9.1%
5.3%
5.4%
8.0%
9.9%
15.2%
17.7%
6.4%
-5%
0%
5%
10%
15%
20%
11.0
11.5
12.0
12.5
13.0
13.5
14.0
14.5
15.0
15.5
16.0Previous Year (MMT) Current Year (MMT) Monthly Growth (%)
PRODUCT % Share Nov 2014 Nov 2015 Growth (%) Products Included
Sensitive Products 14.7% 2,175 2,185 0.5% SKO & LPG
Major decontrolled
Products 72.0% 9,901 10,648 7.5%
HSD, MS, Naphtha,
Lubes, LDO, FO/LSHS,
Bitumen & ATF
Minor decontrolled
Products 13.3% 1,827 1,960 7.3%
Pet. Coke & other
products
Grand Total 100% 13,902 14,793 6.4%
5 | P a g e Industry Performance Review Report of PPAC: November, 2015 www.ppac.org.in
As per IMF World Economic Outlook (updated in October 2015), India’s growth
outlook is brightest in Asia with a 7.3% expansion of the economy forecast for
2015. The country is reaping the benefits of lower oil prices, as India is a net
importer. Lower oil prices raise real disposable income and also help in
containing inflation. Domestic demand in general has been rising on the back of
strengthening fixed investment and industrial production. The policy reforms and
consequent improvement in investments is expected to further strengthen its
growth.
In the month of October, 2015, India’s annual industrial output had hit a 5 year
high of 9.8%. However in the month of November, 2015, India’s manufacturing
sector grew at its weakest pace in over two years as demand and output
continued to soften in November, 2015. The seasonally adjusted Nikkei Services
Business Activity Index pointed to broadly unchanged levels of services activity. It
dropped to a five month low of 50.1 in November, 2015 as compared to 52.6 in
October, 2015.
The Indian economy is much more dependent on consumer spending than on
demand for exports. World Bank estimates that 47% of Indian jobs are in the
agriculture sector and India after having seen two years of back to back
drought, further bad weather could mean job and income losses and could
weaken consumer spending growth.
We analyze the sales recorded by the Industry on the basis of the data
available. Data on direct private imports received from DGCIS, which are
added to the final sales reported by oil companies for estimation of
consumption figures, are available up to September, 2015 and private imports
data for the month of October and November, 2015 is projected based on April
to September, 2015 figures.
Detailed product-wise analysis of growth for November, 2015 is given
in the following sections:
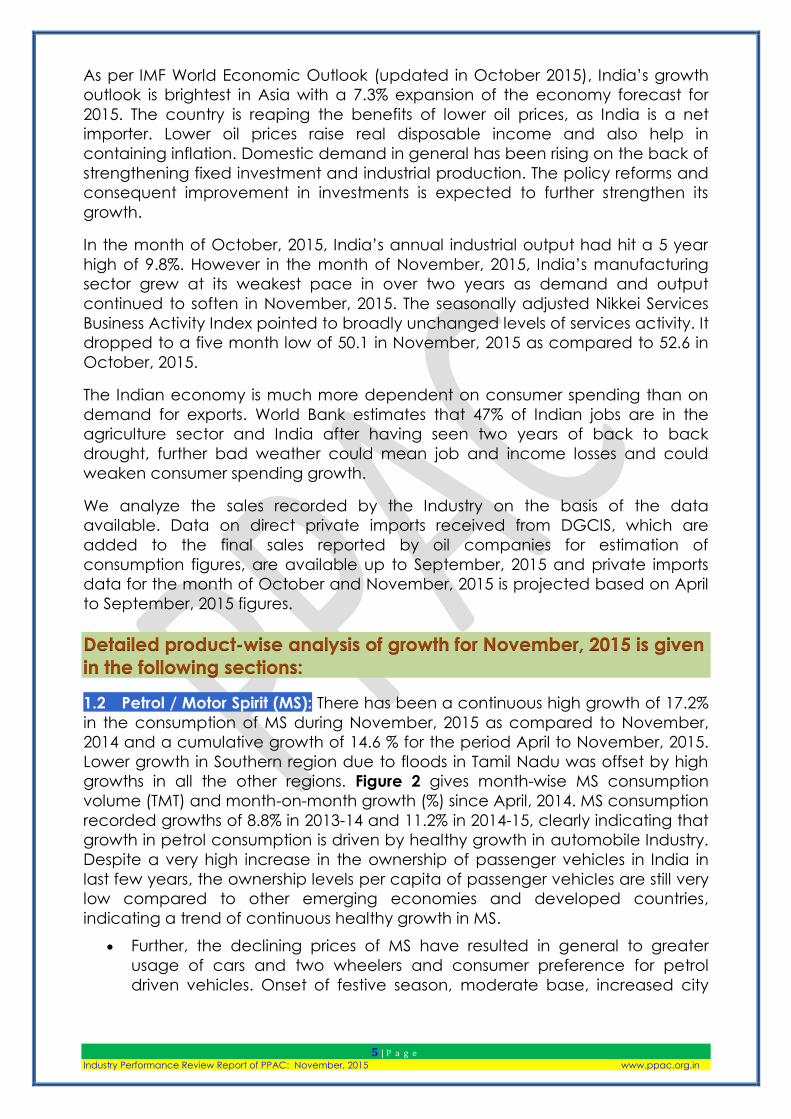
1.2 Petrol / Motor Spirit (MS): There has been a continuous high growth of 17.2%
in the consumption of MS during November, 2015 as compared to November,
2014 and a cumulative growth of 14.6 % for the period April to November, 2015.
Lower growth in Southern region due to floods in Tamil Nadu was offset by high
growths in all the other regions. Figure 2 gives month-wise MS consumption
volume (TMT) and month-on-month growth (%) since April, 2014. MS consumption
recorded growths of 8.8% in 2013-14 and 11.2% in 2014-15, clearly indicating that
growth in petrol consumption is driven by healthy growth in automobile Industry.
Despite a very high increase in the ownership of passenger vehicles in India in
last few years, the ownership levels per capita of passenger vehicles are still very
low compared to other emerging economies and developed countries,
indicating a trend of continuous healthy growth in MS.
Further, the declining prices of MS have resulted in general to greater
usage of cars and two wheelers and consumer preference for petrol
driven vehicles. Onset of festive season, moderate base, increased city

6 | P a g e Industry Performance Review Report of PPAC: November, 2015 www.ppac.org.in
limits and not much of improvement in public transport system also
contributed to improved MS growth. Figure-2: Month wise MS consumption (TMT) and growth (%) since April, 2014
Other factors impacting consumption of MS are:
Festival season was significant for both two wheelers and cars sales, but the
festivities and buoyancy in sales did not last till November, 2015 due to weak
rural demand for motorcycles.
Figure-3: Month-wise sales growth (%) of Indian Automobile Industry since April, 2014
a) Total passenger vehicles (PV) sales: As the automakers announced their
sales numbers for the month of November, 2015, it is amply clear that while
most of them clocked double digit growth year on year, the sharp
momentum seen in October, 2015 did not continue in November, 2015. The
overall passenger vehicles sales registered a growth of 11.4% during
November, 2015, of which passenger cars recorded a growth of 10.4%, while
18.3%
-0.7%
13.8%
5.3%
7.8%
21.6%
10.6%
3.6%
12.1%
17.7%
18.2% 13.1% 18.7%
9.0%
9.7%
12.9%
10.4%
25.4%
14.5%
17.2%
-10%
-5%
0%
5%
10%
15%
20%
25%
30%
35%
0
200
400
600
800
1000
1200
1400
1600
1800
2000
Apr-14 May Jun Jul Aug Sept Oct Nov Dec Jan-15 Feb Mar Apr-15 May Jun Jul Aug Sept Oct Nov
Previous Year (TMT) Current Year (TMT) Monthly Growth (%)
-30
-20
-10
0
10
20
30
Commercial PV 2-Wheelers
%ge Growth
7 | P a g e Industry Performance Review Report of PPAC: November, 2015 www.ppac.org.in
Utility vehicles and vans recorded a growth of 19.7% and 0.7% respectively.
Segment Nov 2014 Nov 2015 Growth (%)
Passenger Cars 156,811 173,111 10.4%
Utility Vehicles 40,851 48,880 19.65%
Vans 14,775 14673 0.69%
Total: Passenger Vehicles (PVs) 212,437 236,664 11.40% Source: SIAM
b) 2-wheeler sales: With domestic sales of 1.32 million units during November,
2015, the sales growth of 1.46% indicates that 2-wheeler segment in the
domestic market lost steam during the month. The motorcycle segment
registered a growth of 1.5% in the month, while the scooter/ scooterette
segment recorded a growth of 2.45%. Moped sales recorded de-growth of
-6.1% during November, 2015.
Segment Nov 2014 Nov 2015 Growth (%)
Scooter / Scooterette 386,547 396,024 2.45%
Motor Cycles 853,257 866,705 1.5%
Mopeds 61,630 57,832 -6.1%
Total: 2-wheelers 1,301,434 1,320,561 1.46% Source: SIAM
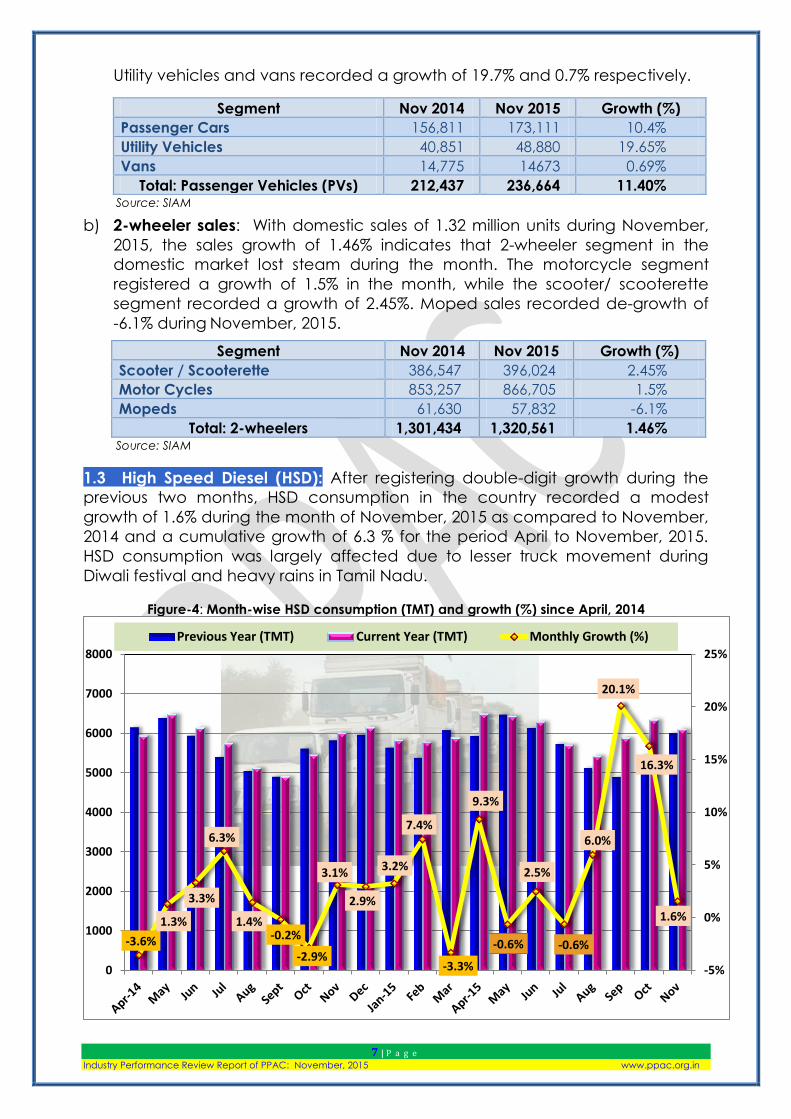
1.3 High Speed Diesel (HSD): After registering double-digit growth during the
previous two months, HSD consumption in the country recorded a modest
growth of 1.6% during the month of November, 2015 as compared to November,
2014 and a cumulative growth of 6.3 % for the period April to November, 2015.
HSD consumption was largely affected due to lesser truck movement during
Diwali festival and heavy rains in Tamil Nadu.
Figure-4: Month-wise HSD consumption (TMT) and growth (%) since April, 2014
-3.6%
1.3%
3.3%
6.3%
1.4% -0.2%
-2.9%
3.1%
2.9%
3.2%
7.4%
-3.3%
9.3%
-0.6%
2.5%
-0.6%
6.0%
20.1%
16.3%
1.6%
-5%
0%
5%
10%
15%
20%
25%
0
1000
2000
3000
4000
5000
6000
7000
8000
Previous Year (TMT) Current Year (TMT) Monthly Growth (%)

8 | P a g e Industry Performance Review Report of PPAC: November, 2015 www.ppac.org.in
Factors affecting diesel consumption are discussed below:
a) Commercial vehicles (CV) sales: The mood in CV Industry continues to
remain buoyant and CV sales registered a growth of 8.6% during the month
of November, 2015.
b) The medium and heavy commercial vehicles sales continued to record an
impressive 24.8 % growth during November, 2015 which is mainly attributed to
the positive sentiments in the economy and rising demand for logistics and
transportation services. Further, ICRA predicts growth in industry during
2016-17 due to improving viability of fleet operators, replacement led
demand and pre-buying ahead of implementation of BS-IV emission norms
and Anti-Lock Braking System.
Segment Nov 2014 Nov 2015 Growth (%)
M&HCVs 16,148 20,145 24.75%
LCVs 31,538 31,621 0.26%
Total: Commercial Vehicles 47,686 51,766 8.56%
Source: SIAM
c) Port traffic: There has been a growth of 0.9% in the port traffic for the month of
November, 2015. On cumulative basis a growth of 3.3% was recorded in the
period April to November, 2015. The growth in port traffic and cargos handled
at major ports during November is mainly due to increase in port traffic at
Paradip, VO Chidambaranar, Mormugao and Kandla . Table-2 below gives
the port-wise performance during the month of November, 2015. The growth
in traffic during April-November, 2015 has been contributed mostly by finished
fertilizer (22.4%), thermal coal (11.8%) and other items of cargo (7.7%) while
there has been a drop in iron ore (-44.3%)and raw fertilizer (-12.7%) cargoes
during the month. Heavy rains and flooding in Tamil Nadu affected cargo
handling at Chennai and Ennore ports.
Table-2: Traffic handled at major ports in November, 2015
TRAFFIC HANDLED AT MAJOR PORTS (TMT)
PORTS November 2014 November 2015 Growth (%):
KOLKATA + HALDIA 3899 3869 -0.8%
PARADIP 5904 6428 8.9%
VISAKHAPATNAM 4677 4611 -1.4%
ENNORE 2726 2359 -13.5%
CHENNAI 4292 3866 -9.9%
V.O. CHIDAMBARANAR 2537 2966 16.9%
COCHIN 1744 1548 -11.2%
NEW MANGALORE 2895 2700 -6.7%
MORMUGAO 1384 1895 36.9%
MUMBAI 5368 5081 -5.3%
JNPT 5218 5218 0%
KANDLA 7889 8432 6.9%
TOTAL: 48533 49873 0.9% Source: IPA

9 | P a g e Industry Performance Review Report of PPAC: November, 2015 www.ppac.org.in
d) Power situation improves: The power deficit position for the month of
November, 2015 is given in Table-3. The power deficit position improved from
-4.1% in November, 2014 to -1.4% during November, 2015. The shortage during
the month improved for all regions. The improved power position may have
led to reduced usage of diesel for back-up power generation.
Table-3: Power deficit: Region-wise position for October, 2015 (% deficit)
States
November 2015 (P) November 2014
Requirement
(MU)
Available
(MU)
Deficit Deficit
(%) MU (%)
North 24,327 23,322 -1,005 -4.1% -6.5%
West 29,437 29,419 -18 -0.1% -1.1%
South 20,671 20,516 -155 -0.7% -5.9%
East 10,224 10,203 -21 -0.2% -1.5%
North-East 1,164 1,142 -22 -1.9% -4.6%
Total 85,823 84,602 -1221 -1.4% -4.1%
Source: Central Electricity Authority (CEA)
Seasonal rainfall scenario: “2015 to be India’s hottest year ever”, says IMD: This
year is not only in line to be the hottest on record globally but also in India.
The country has lived through its hottest September, October and November
months this year, reveals India Meteorological Department's data going back
to 1901.
The countrywide mean temperature in November this year was 1.250C above
normal, the highest-ever for the month since record keeping began. Entire
Southern region (SR) experienced excess spell of rain for the period 1-11-2015
to 30-11-2015, except for Karnataka and Telangana, which received scanty
rainfall which affected HSD consumption in SR.

10 | P a g e Industry Performance Review Report of PPAC: November, 2015 www.ppac.org.in
1.4 Bitumen: After four months of high positive growth, Bitumen consumption
registered a minor de-growth of -2.1% during the month of November, 2015
mainly due to Diwali and Chhatt festivals when workers go to their native places.
Cumulatively there is a growth of 9.8% for the period April to November 2015. Figure 5 gives the month wise Bitumen consumption and growth since April, 2014.
Figure-5: Month-wise Bitumen consumption (TMT) and growth (%) since April, 2014
1.5 LPG: Total LPG consumption continuously, for the last 27 months in a row
recorded a positive growth of 2.8% during November, 2015 and a cumulative
growth of 7.7% was registered for the period April-November, 2015.
LPG-Packed Domestic consumption registered a minor de-growth of -0.3%
for the first time during November, 2015 after registering continuous growth
for 26 months in a row. It is mainly due to high base of the previous year
when consumers started uplifting their quota of 12 cylinders before the
launch of DBTL scheme and a growth of 17.6% was registered during
November 2014. However, during the period April to November 2015, a
growth of 6.0% was registered. During the period April to November 2015
release of 126.8 lakh new connections and 67.9 lakh DBCs has contributed
to growth of LPG packed domestic consumption.
LPG-Packed non-domestic consumption for the eleventh month in a row
registered a growth of 55.9% in November 2015 and cumulative growth of
44.4% during April to November 2015. However, in the same month last
year, de-growth of -15% in November, 2014 and negative growth of
-11.7 % during April to November 2014 was observed. High growth in LPG
Packed Non-Domestic may be attributed to easy availability, low price of
non-domestic LPG and curb in diversion of subsidized domestic cylinders,
pursuant to implementation of DBTL.
3.8%
-3.7%
35.5%
28.4%
17.9%
-0.2%
-15.1%
3.6%
-9.1% -7.0%
1.7%
-4.8% -5.2%
0.3%
-8.6%
16.8%
41.8%
35.0%
63.3%
-2.1%
-20%
-10%
0%
10%
20%
30%
40%
50%
60%
70%
0
100
200
300
400
500
600
700
Previous Year (TMT) Current Year (TMT) Monthly Growth (%)

11 | P a g e Industry Performance Review Report of PPAC: November, 2015 www.ppac.org.in
Bulk LPG recorded a positive growth of 29.5% during November, 2015 and
2.6% during April to November 2015. Last year, in the month of November
2014 a de-growth of -21.3% and in April-November 2014 a growth of 28%
was observed.
Auto LPG for the eleventh month in a row registered a positive growth of
7.9% in November, 2015 and 7.4% during April to November 2015. Last
year in the month of November, 2014, Auto LPG consumption registered
negative growth of -25.8% and April to November 2014 observed negative
growth of -23.9%. Declining trend of last year was mainly due to reduced
gap in the price of MS and Auto LPG. This year growth of Auto LPG is
mainly due to curb in diversion of subsidized domestic cylinders.
Figure-6: Month-wise LPG consumption (TMT) and growth (%) since April, 2014
1.6 Naphtha: consumption recorded a growth of 39.7% during the month of
November, 2015 and a growth of 22.4% on cumulative basis for the period April
to November, 2015. Growth is on account of higher use of Naphtha by
Petrochemical and Fertilizer sectors.
1.7 ATF During November, 2015 the consumption growth in ATF was 14.7% and
on cumulative basis, a growth of 7.3% during the period April to November, 2015
has been recorded. A growth of 26% in domestic air traffic has been reported by
the Directorate General of Civil Aviation’s traffic report for the month of
November, 2015 by flying 7.3 million passengers as compared to 5.8 million
passengers during the same period last year. Also major Indian Air Force exercise
and refueling of Nepal bound airlines in India during the month contributed to
high growth during the month.
9.8%
14.1%
11.6%
4.7%
8.9%
15.9%
7.1%
14.2%
17.6%
10.2% 8.4%
4.9%
9.7%
5.2%
10.0% 10.8%
7.6%
4.2%
12.5%
2.8%
-10%
-5%
0%
5%
10%
15%
20%
0
200
400
600
800
1000
1200
1400
1600
1800
Previous Year (TMT) Current Year (TMT) Monthly Growth (%)

12 | P a g e Industry Performance Review Report of PPAC: November, 2015 www.ppac.org.in
Figure-7: Month-wise ATF consumption (TMT) and growth (%) since April, 2014
1.8 FO/LSHS: FO and LSHS consumption registered a minor growth of 0.4%
during November, 2015. On cumulative basis, there has been growth of 6.9% for
the period April to November, 2015. The growth is mainly from the Fertilizer, Power
and General Trade sectors. While the consumption of LSHS has reduced due to
shift to natural gas by major customers like power and fertilizer industries, it
gained some volume in steel industry sector.
1.9 PETCOKE: Petcoke consumption registered a good growth of 18% during
November, 2015 and a cumulative growth of 22.9% was registered during the
period April to November, 2015.
1.10 LDO: LDO consumption recorded a growth of 11% in the month of
November, 2015 and a growth of 13.7% on cumulative basis for the period April
to November, 2015. LDO month wise demand also fluctuates depending on its
requirement at Power plants for boiler restart as it trips. LDO is also extensively
used in various types of furnaces and increase in manufacturing industries leads
to increase in its consumption.
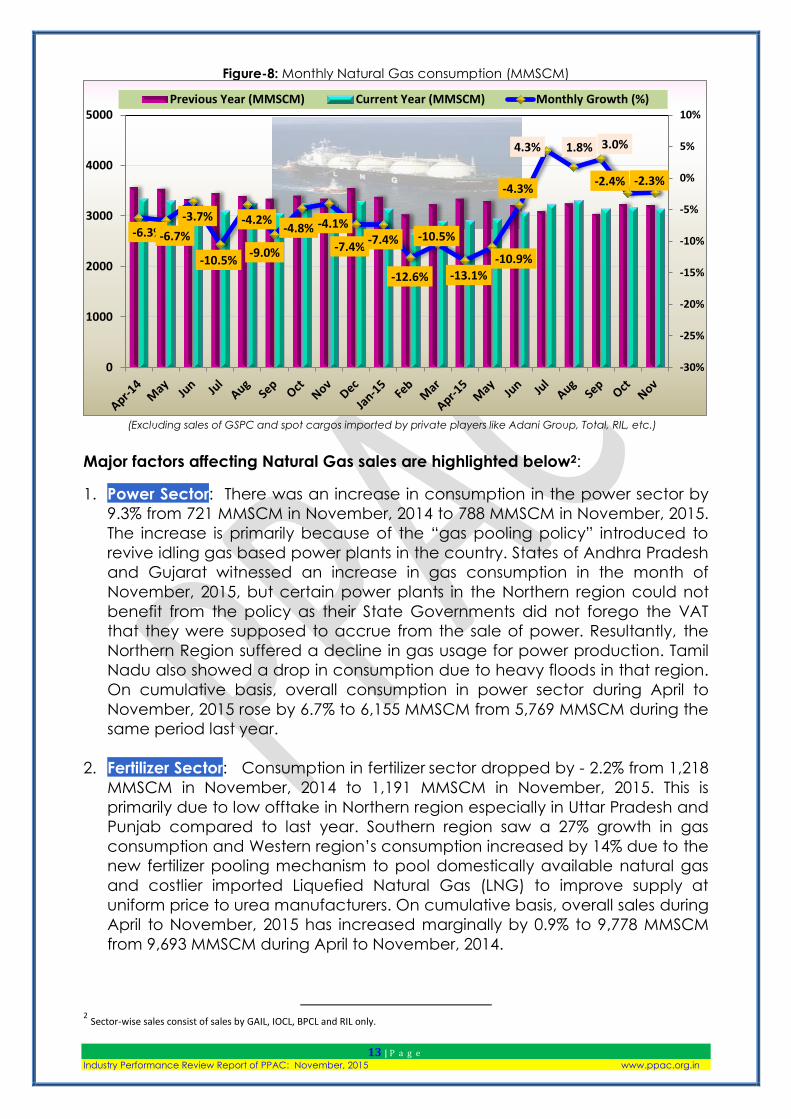
1.11 Natural Gas: On month on month basis, Natural Gas consumption1 saw a
decline of 2.33% for November, 2015 as compared to November, 2014. In terms
of volumes, total consumption for November, 2015 was 3,138 MMSCM as
compared to 3,213 MMSCM during November, 2014. Cumulatively i.e., for the
period April to November, gas sales declined by 4.04% from 25,403 MMSCM in FY
2014-15 to 24,774 MMSCM in FY 2015-16. Natural gas consumption has shown
decline predominantly due to reduction in domestic gas production and lower
off-take of gas in core sectors.
1 Data does not include natural gas sales of GSPC and spot cargoes imported by private players like Adani Group, Total, RIL, etc.
4.9% 4.6%
2.6%
6.4%
9.0%
7.6%
3.2%
-2.8%
-0.8% -1.1%
-0.9%
-0.1%
4.3%
4.0%
8.5%
6.8%
4.8% 4.5%
11.1%
14.7%
-5%
0%
5%
10%
15%
150
200
250
300
350
400
450
500
550
600
Previous Year (MMT) Current Year (MMT) Monthly Growth (%)
13 | P a g e Industry Performance Review Report of PPAC: November, 2015 www.ppac.org.in
Figure-8: Monthly Natural Gas consumption (MMSCM)
(Excluding sales of GSPC and spot cargos imported by private players like Adani Group, Total, RIL, etc.)
Major factors affecting Natural Gas sales are highlighted below2:
1. Power Sector: There was an increase in consumption in the power sector by
9.3% from 721 MMSCM in November, 2014 to 788 MMSCM in November, 2015.
The increase is primarily because of the “gas pooling policy” introduced to
revive idling gas based power plants in the country. States of Andhra Pradesh
and Gujarat witnessed an increase in gas consumption in the month of
November, 2015, but certain power plants in the Northern region could not
benefit from the policy as their State Governments did not forego the VAT
that they were supposed to accrue from the sale of power. Resultantly, the
Northern Region suffered a decline in gas usage for power production. Tamil
Nadu also showed a drop in consumption due to heavy floods in that region.
On cumulative basis, overall consumption in power sector during April to
November, 2015 rose by 6.7% to 6,155 MMSCM from 5,769 MMSCM during the
same period last year.
2. Fertilizer Sector: Consumption in fertilizer sector dropped by - 2.2% from 1,218
MMSCM in November, 2014 to 1,191 MMSCM in November, 2015. This is
primarily due to low offtake in Northern region especially in Uttar Pradesh and
Punjab compared to last year. Southern region saw a 27% growth in gas
consumption and Western region’s consumption increased by 14% due to the
new fertilizer pooling mechanism to pool domestically available natural gas
and costlier imported Liquefied Natural Gas (LNG) to improve supply at
uniform price to urea manufacturers. On cumulative basis, overall sales during
April to November, 2015 has increased marginally by 0.9% to 9,778 MMSCM
from 9,693 MMSCM during April to November, 2014.
2 Sector-wise sales consist of sales by GAIL, IOCL, BPCL and RIL only.
-6.3% -6.7%
-3.7%
-10.5%
-4.2%
-9.0%
-4.8% -4.1%
-7.4% -7.4%
-12.6%
-10.5%
-13.1% -10.9%
-4.3%
4.3% 1.8% 3.0%
-2.4% -2.3%
-30%
-25%
-20%
-15%
-10%
-5%
0%
5%
10%
0
1000
2000
3000
4000
5000Previous Year (MMSCM) Current Year (MMSCM) Monthly Growth (%)

14 | P a g e Industry Performance Review Report of PPAC: November, 2015 www.ppac.org.in
3. City Gas Sector (CGD): CGD sector showed a growth of 8.5% in natural gas
consumption from 333 MMSCM in November, 2014 to 361 MMSCM during
November, 2015 due to increase in off-take by CGD companies in Western
region, primarily in Gujarat. On cumulative basis, consumption declined by
6.9% to 2,650 MMSCM during April to November, 2015 as against 2,846
MMSCM during the same period last year.
4. Internal Consumption (IC): IC registered an increase of 5.0% from 365
MMSCM in November, 2014 to 383 MMSCM during November, 2015 primarily
due to increase in appetite for lower priced spot LNG resulting from the steep
decline of crude oil prices. IOCL was the prime reason behind this increase as
they started to source their gas for consumption in their refineries by
themselves rather than going through an aggregator. On cumulative basis,
consumption during April to November, 2015 has declined by 9.0% to 2,736
MMSCM against 3,008 MMSCM during April to November, 2014.
5. Others Sector: There was overall decline of about 38.2% from 455 MMSCM in
November, 2014 to 281 MMSCM during November, 2015 in sales in ‘Others’
sector which include steel, sponge-iron, refineries (excluding seller’s own
refineries), manufacturing and miscellaneous other industries. The decline in
sales was primarily due to IOCL’s own sourcing of LNG for its Panipat and
Mathura refineries in Northern region (shift from Others to Internal
consumption sector) and lower off-take by IOCL customers in Western region.
On cumulative basis, consumption during April to November, 2015 has
declined by around 16.4% to 2,792 MMSCM against 3,341 MMSCM during the
same period last year.
*******
15 | P a g e Industry Performance Review Report of PPAC: November, 2015 www.ppac.org.in
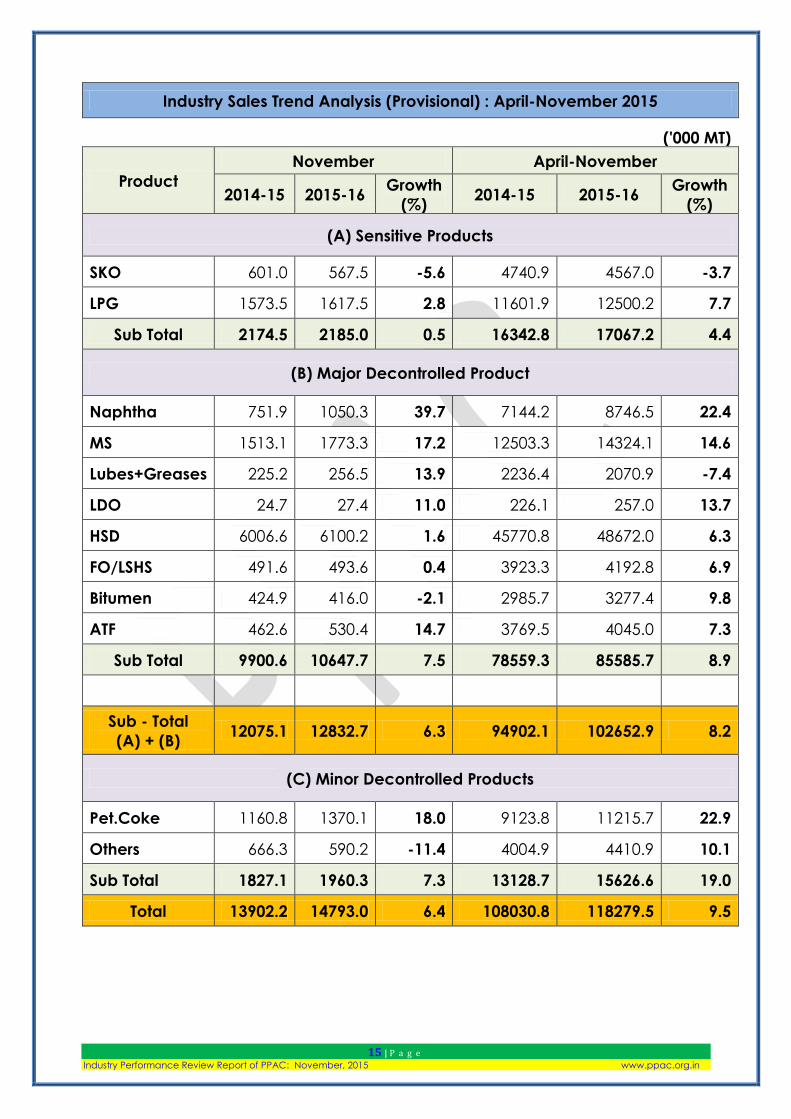
Industry Sales Trend Analysis (Provisional) : April-November 2015
('000 MT)
Product
November April-November
2014-15 2015-16 Growth
(%) 2014-15 2015-16
Growth
(%)
(A) Sensitive Products
SKO 601.0 567.5 -5.6 4740.9 4567.0 -3.7
LPG 1573.5 1617.5 2.8 11601.9 12500.2 7.7
Sub Total 2174.5 2185.0 0.5 16342.8 17067.2 4.4
(B) Major Decontrolled Product
Naphtha 751.9 1050.3 39.7 7144.2 8746.5 22.4
MS 1513.1 1773.3 17.2 12503.3 14324.1 14.6
Lubes+Greases 225.2 256.5 13.9 2236.4 2070.9 -7.4
LDO 24.7 27.4 11.0 226.1 257.0 13.7
HSD 6006.6 6100.2 1.6 45770.8 48672.0 6.3
FO/LSHS 491.6 493.6 0.4 3923.3 4192.8 6.9
Bitumen 424.9 416.0 -2.1 2985.7 3277.4 9.8
ATF 462.6 530.4 14.7 3769.5 4045.0 7.3
Sub Total 9900.6 10647.7 7.5 78559.3 85585.7 8.9
Sub - Total
(A) + (B) 12075.1 12832.7 6.3 94902.1 102652.9 8.2
(C) Minor Decontrolled Products
Pet.Coke 1160.8 1370.1 18.0 9123.8 11215.7 22.9
Others 666.3 590.2 -11.4 4004.9 4410.9 10.1
Sub Total 1827.1 1960.3 7.3 13128.7 15626.6 19.0
Total 13902.2 14793.0 6.4 108030.8 118279.5 9.5