inequalities in health care
TRANSCRIPT

Geographical inequalitiesin health
across the UK

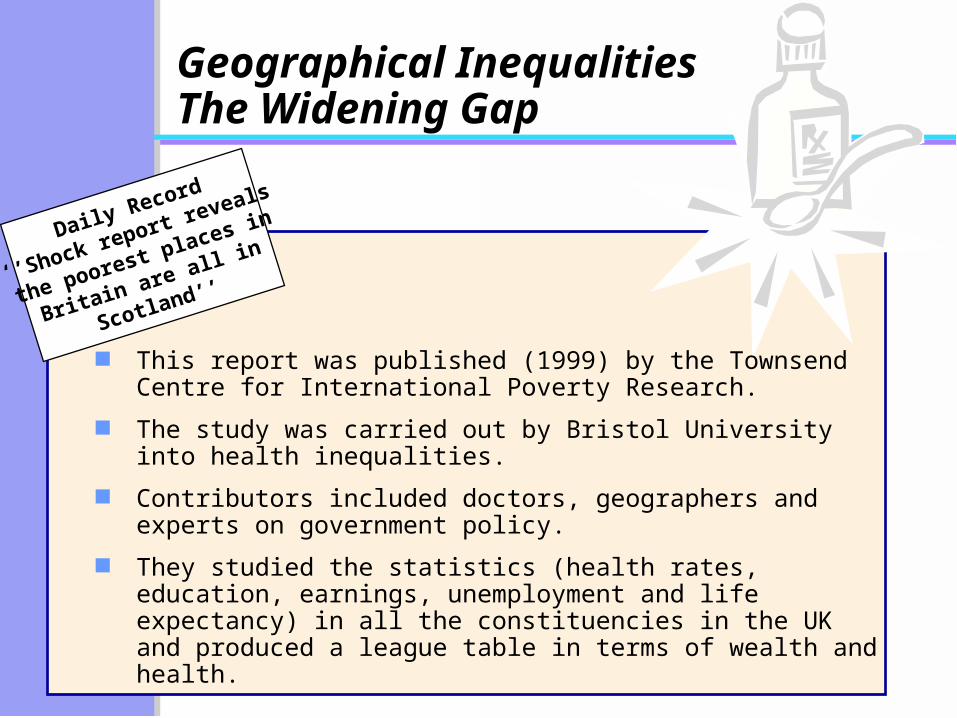
Daily Record
‘’Shock report reveals
the poorest places in
Britain are all in
Scotland’’
Geographical InequalitiesThe Widening Gap
This report was published (1999) by the Townsend Centre for International Poverty Research.
The study was carried out by Bristol University into health inequalities.
Contributors included doctors, geographers and experts on government policy.
They studied the statistics (health rates, education, earnings, unemployment and life expectancy) in all the constituencies in the UK and produced a league table in terms of wealth and health.

Geographical InequalitiesThe Widening Gap
Findings They confirmed that evidence showed there was a
north-south divide in health.
That this gap was widening.
That the six worst health areas in the UK were in Glasgow.
And that the main cause was poverty.

Geographical FindingsThe Widening Gap
Findings The Report identified that geographical inequalities in
ill health existed in the UK on national and regional levels.
A north-south divide exists in terms of the wealth and health of the people.
The poorest places in the UK were in Scotland.
The worst six areas in terms of wealth and health were in Glasgow.
A causal link existed between poverty and ill health.

Page 34, UK Social Issues ISBN 0 948766 62X
Geographical Inequalities
The Widening
Gap
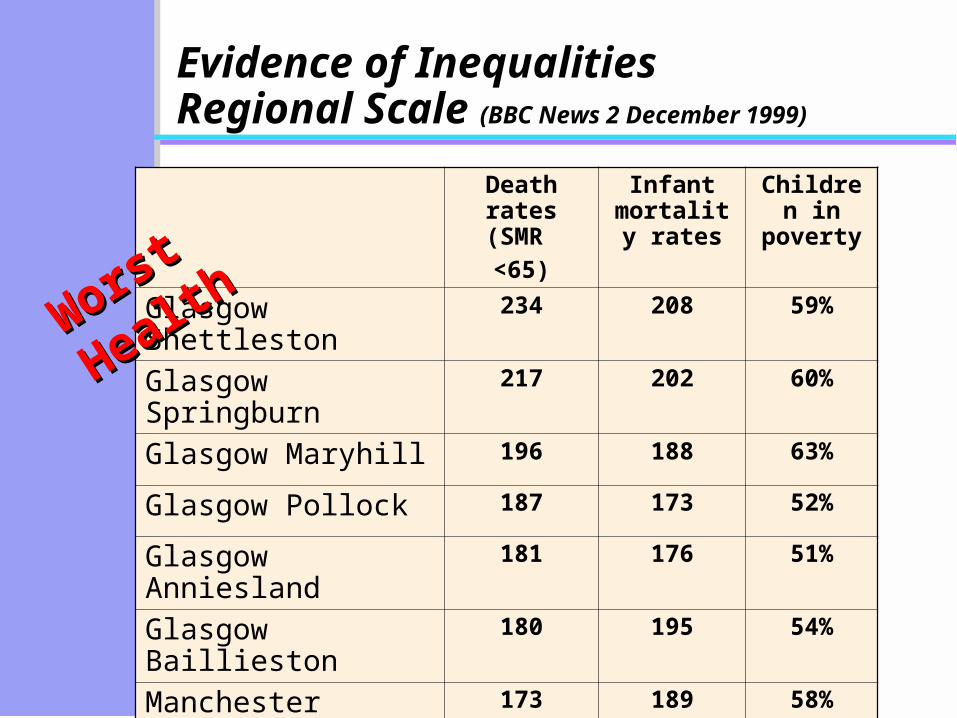
Evidence of InequalitiesRegional Scale (BBC News 2 December 1999)
Death rates (SMR <65)
Infant mortality
rates
Children in
poverty
Glasgow Shettleston 234 208 59%
Glasgow Springburn 217 202 60%
Glasgow Maryhill 196 188 63%
Glasgow Pollock 187 173 52%
Glasgow Anniesland 181 176 51%
Glasgow Baillieston 180 195 54%
Manchester Central 173 189 58%
UK 100 100 27%
Worst Health
Worst Health

Evidence of InequalitiesRegional Scale (BBC News 2 December 1999)
Death rates (SMR
<65)
Infant mortality
rates
Children in
poverty
Wokingham 65 51 5%
Woodspring 65 60 12%
Romsey 65 58 12%
South Cambridgeshire 66 60 13%
South Norfolk 69 57 15%
Northavon 70 50 11%
Buckingham 71 57 11%
UK 100 100 27%
Best Health
Best Health

Geographical InequalitiesThe Widening Gap
Findings
Children living in the worst households were twice as likely to die in infancy as their peers in wealthy areas in the SE of England.
At school they were 1.5 times more likely to fail exams and 3.6 times more likely to fail to get a job when they left. Those who did get jobs earned 25% less.

Glasgow / Edinburgh
Their findings not only identified a north-south divide but also differences Their findings not only identified a north-south divide but also differences between cities.between cities.
Together, Glasgow and Edinburgh produced more than 52% of Together, Glasgow and Edinburgh produced more than 52% of Scotland’s GDP in 1999. Scotland’s GDP in 1999.
But GDP per capita for Edinburgh was 33% higher than that for Glasgow But GDP per capita for Edinburgh was 33% higher than that for Glasgow - in other words, average incomes in Edinburgh are higher. - in other words, average incomes in Edinburgh are higher.
This reflects an era of high unemployment in Glasgow during the ’70s This reflects an era of high unemployment in Glasgow during the ’70s and ’80s and although the situation has much improved in Glasgow, it and ’80s and although the situation has much improved in Glasgow, it has left an accumulated legacy of poverty, social exclusion and ill has left an accumulated legacy of poverty, social exclusion and ill health.health.
On average, people in Edinburgh live On average, people in Edinburgh live 4 years longer4 years longer than people in than people in Glasgow.Glasgow.

GlasgoGlasgoww
The Widening Gap (1999)Regional Difference
The Report identified the worst 6 areas in terms of ill health as being in Glasgow.
– The areas included: Shettleston, Springburn, Maryhill, Pollock, Anniesland, Baillieston and Govan.
Glasgow had Scotland’s– highest infant mortality rate of
103/1000– 34% of people live in poverty– 18.5% of men are unemployed, 13%
chronically sick– in one year, 181 people will have died
under the age of 65, 63% of these deaths could have been avoided.

The Report also highlighted the huge gap in the health of people living in the poorest areas and wealthiest areas of
Glasgow.
Drumchapel Bearsden

Two babies born one mile apart
One in Drumchapel and the other in Kelvinside. The baby born in Drumchapel will most likely be:
– born underweight
– live ten years less
– twice as likely to die before its first birthday
– three times more likely to die of heart disease or bronchitis
– three times more likely to die of breast cancer
– twice as likely to die of lung cancer– four times more likely to suffer from a
psychiatric disorder
– 2.5 times more likely to die before 65.

Recommendation
The publication of The Widening Gap led to immediate calls for urgent action to ease the problems of poverty in Glasgow and this resulted in an increased allocation of funding to Glasgow, especially the most deprived areas.
The Report concluded that ‘’the government would not be able to reduce inequalities across the UK unless it tackled poverty through the redistribution of income and wealth’’.