inequitable measuresthe impact of nclb on · pdf fileschools making adequate yearly progress...
TRANSCRIPT

INEQUITABLE MEASURES…THE IMPACT OF NCLB ON CALIFORNIA SCHOOLS MAKING ADEQUATE YEARLY PROGRESS
Marrio D. Walker B. A., Marymount University, 1995 M. A., Marymount University, 1998
DISSERTATION
Submitted in partial fulfillment of the requirements for the degree of
DOCTOR OF EDUCATION
in
EDUCATIONAL LEADERSHIP
at
CALIFORNIA STATE UNIVERSITY, SACRAMENTO
SPRING
2010

ii
Copyright © 2010 Marrio D. Walker All rights reserved

iii
INEQUITABLE MEASURES…THE IMPACT OF NCLB ON CALIFORNIA SCHOOLS
MAKING ADEQUATE YEARLY PROGRESS
A Dissertation
by
Marrio D. Walker
Approved by Dissertation Committee:
___________________________________ José Chávez, Ed.D, Chairperson
___________________________________
Geni Cowan, PhD
___________________________________ José Cintrón, PhD
SPRING 2010

iv
INEQUITABLE MEASURES…THE IMPACT OF NCLB ON CALIFORNIA SCHOOLS MAKING ADEQUATE YEARLY PROGRESS
Student: Marrio D. Walker I certify that this student has met the requirements for format contained in the University format manual, and that this dissertation is suitable for shelving in the library and credit is to be awarded for the dissertation. ___________________________, Graduate Coordinator _________________ Carlos Nevarez, Ph.D. Date

v
DEDICATION
This dissertation is dedicated to:
My wife Carmen Rene Williams-Walker and daughter Maya Denise Walker
for without their sacrifice and support this work could not have been accomplished.
We did it Bey!
Finally my mother Shirley Elizabeth Thompson, and stepfather Jerome Andre Thompson
who taught me how to read, and in loving memory of my grandmother Shirley Mae
Fergins.
vi
CURRICULUM VITAE NAME OF AUTHOR: Marrio D. Walker
PLACE OF BIRTH: Bellflower, California
GRADUATE AND UNDERGRADUATE SCHOOLS ATTENDED:
Marymount University Marymount University
DEGREES AWARDED:
Master of Science, Education, 1998, Marymount University Bachelor of Arts, Liberal Studies, 1995, Marymount University PROFESSIONAL EXPERIENCE: Principal, Palo Verde Unified School District, Blythe California August 2009-July 2013 Vice Principal, Elk Grove Unified School District, Elk Grove California August 2007- July 2009 Vice Principal, District 60 Pueblo Unified School District, Pueblo Colorado August 2006-July 2007 Principal, Compton Unified School District, Compton California July 2005-July 2006 Vice Principal, Compton Unified School District, Compton California August 2001-July 2005 High School Teacher, Palo Verde Unified School District, July 1999-August 2001
High School Teacher and Counselor, Arlington Unified School District, July 1996- August 1999
AREAS OF SPECIAL INTEREST:
Educational Policy k-14 Organizational Transformation Curriculum Instructional Strategies Early College Models

vii
Abstract
of
INEQUITABLE MEASURES…THE IMPACT OF NCLB ON CALIFORNIA SCHOOLS MAKING ADEQUATE YEARLY PROGRESS
by
Marrio DeJonne’ Walker
Students in California Public Schools are increasingly failing to meet or exceed state proficiency standards found in the No Child Left Behind Accountability Act of 2002. Although there has been growth in every significant subgroup of proficiency in ELA and Mathematics in the state of California to include Students with Disabilities, Socially Economically Disadvantaged and English Language Learners subgroups, increasingly all student subgroups are failing to keep up with the pace needed reach proficiency targets each year. Three consecutive years of statewide descriptive data on NCLB AYP performance targets was collected from the California Department of Education on school years 2007, 2008 and 2009 of some 3,700,000 students and 6000 schools. The findings were although proficiency rates of ELA and Mathematics have grown every year since 2007 for each subgroup on an average of two to four percent, state and federal AYP targets are growing an average of eleven percent each year, making it impossible for subgroups to make targets causing more and more schools to fall into Program Improvement Status and be labeled consistently low performing. AYP targets as they currently exist are unrealistic. Therefore it is recommended that California education legislation be amended to use more equitable measures of performance that include, but are not limited to: proficiency targets based on the trend of growth for each subgroup. That legislation is research led, and that K-12 performance tests be connected to college and career readiness outcomes rather than what currently exists, which is proficiency for proficiency stake.

viii
TABLE OF CONTENTS
Page
Dedication ................................................................................................................... vi
Curriculum Vitae ....................................................................................................... vii
Abstract ..................................................................................................................... viii
List of Tables .............................................................................................................. xii
List of Figures ............................................................................................................ xiii
Chapter
1. INTRODUCTION ................................................................................................. 1
Background ....................................................................................................... 1
Statement of the Problem.................................................................................. 2
Theoretical Framework..................................................................................... 5
Nature of the Study ........................................................................................... 6
Purpose of the Study ......................................................................................... 7
Research Questions........................................................................................... 7
Operational Definitions..................................................................................... 8
Assumptions, Limitations, Scope and Delimitations...................................... 18
2. REVIEW OF THE RELATED LITERATURE ............................................. 19
Introduction..................................................................................................... 19
A Historical Perspective: Education Accountability Legislation ................... 20
Key Issues for Significant Subgroups....................................................... 23
Special Education Legislation................................................................... 24
Special Education Eligibility .................................................................... 34
Learning Disabled..................................................................................... 35
No Child Left Behind................................................................................ 35
Accountability in NCLB........................................................................... 37
Flexibility and Local Control.................................................................... 37
Enhanced Parental Choice ........................................................................ 38

ix
Focus on What Works............................................................................... 39
NCLB Implications and Special Education .............................................. 40
School Accountability............................................................................... 40
Personnel Certification and Licensure ...................................................... 42
Measuring AYP as a Part of Accountability............................................. 44
Conditions for Meeting AYP.................................................................... 46
Safe Harbor and “N-Size”......................................................................... 47
Obama Changes to NCLB ........................................................................ 49
State Accountability: API in the State of California................................. 50
Growth in the API from 2008 to 2009 ...................................................... 50
Met 2008-09 API Growth Targets ............................................................ 51
Federal Accountability: AYP in the State of California ........................... 52
Accountability for Special Education Students in California Schools ..... 54
California Modified Assessment or CMA ................................................ 55
Research-Based Instructional Strategies......................................................... 56
Transformational Practices ............................................................................. 59
Professional Learning Communities (PLCs) ............................................ 61
Staff as a Community................................................................................ 62
Empowerment ........................................................................................... 63
Barriers to Implementation ....................................................................... 64
The Value-Added Approach ..................................................................... 67
State Takeovers......................................................................................... 67
Public School Choice................................................................................ 68
Weak Incentives........................................................................................ 69
Summary ......................................................................................................... 72
3. METHODOLOGY ............................................................................................... 75
Introduction..................................................................................................... 75
Statement of the Problem................................................................................ 76
Research Questions......................................................................................... 77

x
Research Design and Approach ...................................................................... 78
Population and Sampling ................................................................................ 79
Sources of Information ................................................................................... 80
STAR California Standards Test .............................................................. 80
Data Collection ............................................................................................... 82
Data Analysis .................................................................................................. 83
Summary ......................................................................................................... 84
4. DATA COLLECTION AND ANALYSIS........................................................... 86
Introduction..................................................................................................... 86
Description of Sample..................................................................................... 86
Research Tools.......................................................................................... 87
Research Questions................................................................................... 87
Summary ....................................................................................................... 106
5. RESULTS, CONCLUSIONS AND RECOMMENDATIONS.......................... 108
Introduction................................................................................................... 108
Purpose of the Study ..................................................................................... 109
Methodology Review and Research Findings .............................................. 109
Research Question 1 ............................................................................... 110
Research Question 2 ............................................................................... 111
Research Question 3 ............................................................................... 112
Summary of 2008 Statewide AYP Results ..............................................115
Conclusions................................................................................................... 117
Recommendations for Further Study ............................................................ 121
Summary ....................................................................................................... 124
6. APPENDICES .................................................................................................... 127
Appendix A. State of California PSAA of 1999 Flow Chart ........................ 128
Appendix B. University of Wisconsin Logic Model Flow Chart.................. 130
REFERENCES ......................................................................................................... 132

xi
LIST OF TABLES
Table Page 1. Guiding Principles of IDEA............................................................................... 29
2. Sanctions for Failure to Meet AYP Goals in Consecutive Years ...................... 41
3. State PSAA Growth Target Requirements ........................................................ 51
4. NCLB Annual Measurable Objectives for English Language Arts................... 88
5. 2009 AYP ELA Proficiency Data...................................................................... 89
6. 2008 AYP ELA Proficiency Data...................................................................... 91
7. 2007 AYP ELA Proficiency Data...................................................................... 92
8. NCLB Annual Measurable Objectives for Mathematics ................................... 95
9. 2009 AYP Mathematics Proficiency Data......................................................... 96
10. 2008 AYP Mathematics Proficiency Data......................................................... 97
11. 2007 AYP Mathematics Proficiency Data......................................................... 99
12. Rate of Growth Averages for ELA 2007, 2008, 2009 ..................................... 101
13. Rate of Growth Averages for Mathematics 2007, 2008, 2009 ........................ 102
14. 2008-09 Program Improvement (PI) Statewide Summary of Schools ........... 104
15. 2009-10 Program Improvement (PI) Statewide Summary of Schools ............ 104
16. Statewide Program Status for School and LEA Trend ................................... 105
17. Number of Years a School Does not Make AYP ............................................ 114

xii
LIST OF FIGURES
Figure Page 1. 2007 – 2012 ELA Growth Targets..................................................................... 93
2. 2007 – 2012 Math Growth Targets.................................................................. 100
3. Correlation Graph of Actual Targets vs. State AMO and Rise of Schools Going Into Program Improvement...............................................................................105 4. Correlation between the Rise in State AMO targets and the Increase of LEAs Going into Program Improvement ................................................................... 106

1
Chapter 1
INTRODUCTION
Background
The No Child Left Behind Act of 2002 also known as NCLB, is without question,
the most significant piece of social education legislation passed by Congress and signed
into law probably since the Education of All Handicapped Children’s Act of 1975 or the
Individuals with Disabilities Education Act IDEA of 1990. Because it seeks to ensure that
all students are afforded the promise of a K-12 education no matter race, disability, or
socio-economic condition through output measures of performance, choice, and standards
based accountability. Because of NCLB’s social impact and transformational capacity,
the legislation must be viewed as a watershed moment for K-12 public education much
like Civil Rights legislation of the 1960s and 1970s was for minority US citizens. Simply
put it was a game changer. However politically bold or some would argue foolhardy it is
to say that "All Students Will Be Proficient In Reading and Math by 2014," there is a
need to examine the impacts of NCLB policy on schools and districts throughout this
country, to answer the question is the legislation researched based.
Federal policy supporting the development of standards has strongly influenced
educational reform for students with disabilities. Prior to the passage of the 1997
amendments to Individuals with Disabilities Education Act of 2004 or IDEA, federal
policy was primarily concerned with ensuring access to a free and appropriate public
education (FAPE). In clarifying the definition of FAPE, the courts required schools to
2
make available individualized, specially designed instruction and related services
resulting in some educational benefit (National Center for Education Statistics [NCES],
2007). Eventually, the educational benefit standard was expanded to ensure meaningful
progress that could be measured for each student. However when the No Child Left
Behind Act was signed into law in January 2002, there was a sense of optimism that the
legislation would finally lead to the closing of the education achievement gap for various
groups of students. For students with disabilities, the assumption was made that they
would benefit by being held to higher expectations and exposed to more rigorous
curricula. NCLB has, indeed, had a significant impact on the education system and
students in schools, and it has been most successful, perhaps, in bringing to light various
practices and behaviors that were preventing many students from achieving at high
standards. However, there is evidence that the full promise of NCLB has not yet been
achieved.
Statement of the Problem
The promise that all children will achieve higher levels of academic performance
is the foundation of the current educational reform movement. Standards-based reform
began with financial assistance to the states for the development of content and
performance standards, improved teacher quality, and increased school accountability.
The reform movement has evolved to federal corrective action under the No Child Left
Behind Accountability Act (2002) and the Individuals With Disabilities Education Act of
2004 for schools and states that fail to make adequate yearly progress (AYP). The

3
problem however is that too many students with disabilities and increasingly other
student subgroups are not making AYP. Students in California Public Schools are
increasingly failing to meet or exceed state proficiency standards found in the No Child
Left Behind Accountability Act of 2002. In summary AYP target rates as they currently
exist are unrealistic and the pace is unattainable therefore it is recommended that
California education legislation be amended in realignment with proficiency targets based
on the trend of growth for each subgroup and researched based instructional strategies be
included as one of the 46 criteria used in measuring Adequate Yearly Progress.
Many Schools and Districts throughout the country are finding it difficult
keeping up with benchmarks mandated by the No Child Left Behind Act of 2002.
Schools and Districts receiving Title I federal funds must demonstrate paced growth set
by the state based on the proficiency of its students in ELA/Reading and Mathematics.
This dissertation in essence is a policy analysis that examines: (a) How has student
achievement status changed since the reauthorization of NCLB 2002, IDEA 2004, and
the California Public School Accountability Act of 1999? (b) Accountability and school
improvement: What does the research say is best practice? (c) Is it possible for future
legislation to reflect researched based instructional strategies rather than just solely on
end of year cumulative student performance test, and finally (d) using the theoretical
frame work of the Logic Model are performance outcomes of proficiency in reading and
math the right focus.
No Child Left Behind (NCLB) influences all students in general education
programs and students with disabilities who participate in special education programs for

4
some part of their instruction. The accountability provisions included within NCLB may
have the greatest impact on schools (Yell, Katsiyannas & Shiner, 2006). Many disabled
students spend most of their time in regular education classrooms. Congress made certain
that schools would be held accountable for the educational performance of disabled
students by including these students in the accountability system of NCLB. High-stakes
student assessments, which are attached to quality education standards, have been
adopted by numerous states as valid accountability measures (Dufour, 2002). Nearly all
students with disabilities are to be held to the standards for the grade in which the
students are enrolled. These students must also be included in statewide-standardized
assessments with the scores of the disabled students reported not only as a subgroup, but
also as a part of the student group as a whole. Because the disabled student subgroups are
the ones most likely to not to make AYP targets, schools and school districts must pay
attention to the needs and progress of students with disabilities in order to meet these
targets as mandated by NCLB (Buchanan, 2004). According to Allbritten, Mainzer and
Ziegler (2004), “NCLB virtually guarantees that the presence of special education
students in a school will contribute to the school’s failure to make AYP” (p. 157). If the
students with disabilities in a school are not able to meet the proficiency level of students
in their same grade, NCLB penalizes the school and the school district with failure
ratings.
Because students included in the disabled subgroup frequently function below
grade level, these students are most often not able to meet the proficiency level of
students in their same grade. In order for the district and individual schools to meet AYP

5
goals the subgroup of disabled students must meet AYP. It is not known if the ability to
meet AYP for high schools throughout the State of California is affected by the presence
of the disabled students’ subgroup within these schools. The problem then becomes, is
the nature of standardized tests misused to unfairly judge the quality of schools?
Theoretical Framework
The University of Wisconsin has developed a curriculum for program and policy
implementation they call the Logic Model. A logic model is a depiction of a program or
policy showing what the program will do and what it is to accomplish. A series of “if-
then” relationships that, if implemented as intended, lead to the desired outcomes, which
is central to the core of program planning and evaluation. Therefore this policy analysis
will apply the Logic Model to NCLB and the California Public Schools Accountability
Act of 1999 in the areas of Adequate Yearly Progress and Annual Performance Index
both are covered extensively in Chapter 2 of this dissertation. A depiction of the Logic
Model is available for review in the Appendices section and is Appendix B of this
dissertation.
Finally, the conceptual framework of this research is rooted in a deep concern for
ethics and social justice. Seldom do those engaged in crafting, implementing, and
evaluating policy consciously examine and reflect on the ethical issues raised in their
work. In Chapter 5, recommendations for change to No Child Left Behind include adding
the ethical and social frames of Fusarelli, Cooper, and Randall’s work on the four
dimensions of policy theory which include: Normative Dimension – Values and goals.

6
Structural Dimension – Government structures, systems and processes. Constituentive
Dimension – elites and masses ethnic subgroups, and finally the Technical Dimension –
practices: steps and stages, planning, implementation and evaluation of education policy.
In order to craft better policies for better schools, there must be a systemic effort to center
education policies around concerns for equity and social justice. As the above framework
suggests, these values should be at the heart of education policy.
Nature of the Study
The objective of this policy analysis is to determine if current NCLB AYP
proficiency measurements are set too high for Students with Disabilities and other
significant subgroups in California Public Schools. Quantitative research methods will be
applied and used to test this hypothesis. Units of data will be gathered from the California
Department of Education (CDE) on set of variables namely, all districts and public
schools throughout the state of California. The purpose is to determine if State and
Federal legislation meets the policy and program components of the Logic Model. Again
the tenants of the Logic Model seek to ensure that proper inputs are in place to achieve
relevant outcomes of performance measures. A deeper explanation is provided in
Chapters 3 and 5 on the type of quantitative research design used, how the research was
designed, advantages and disadvantages of the experimental designed used and finally,
Chapter 3 outlines instrumentation /materials used, and measures taken to protect the
rights of students.

7
Purpose of the Study
The purpose of this study was to determine if student subgroups are growing at
the rate of proficiency mandated by the No Child Left Behind Act and to demonstrate the
likelihood of schools to exit Program Improvement (PI) once identified. Chapter 2
presents descriptions of federal and California education accountability legislation, and
research on the best ways to improve academic performance and transformational
change. The purpose was to amend and transform currently legislative language to
include researched based practices, and eliminate current state Annual Measurable
Objectives of eleven percent to more realistic annual targets for significant subgroups for
Students with Disabilities, English Learners, SES, and others. Currently, education
legislation uses a “one size fits all approach,” the same measure for all manifested fails to
provide social justice of the individual subgroups and hence produces inequitable
measures. This must change.
Research Questions
1. Are student proficiency rates of English Language Arts or ELA and
Mathematics for significant subgroups in California keeping with the pace of
AYP targets? What is the current pace?
2. What is the likelihood that significant subgroups will hit the 2014 AYP target
of all subgroups will be 100% proficient in ELA and Math based on current
trends?

8
3. What is the likelihood of schools that do not make AYP to go into Program
Improvement and what is the likelihood of schools once in PI to come out?
Operational Definitions
Accountability: The process by which schools and districts are responsive for
student outcomes by requiring review, evaluations, and improvement in student
achievement. The No Child Left Behind (NCLB) Act ties accountability to rewards and
sanctions based upon student performance in regards to standardized tests.
Adjustment for Students with Disabilities (AJ): If a school or LEA does not make
AYP in 2005 solely due to its students with disabilities subgroup not making AMO’s, 20
percentage points were added to the school’s or LEA’s percent proficient for this
subgroup.
Adequate Yearly Progress (AYP): Defined by NCLB, it is an individual state’s
measure of yearly progress toward achieving established state academic standards. AYP
is the minimum level of improvement that schools, school districts, and states must
achieve each year in order to be considered successful.
County Average (CA): For schools with no results on tests used in AYP
calculations or no graduation rate (if applicable), calculations were based on the school
district averages. If no school district values are available, countywide averages are used.
Passed using Confidence Intervals (CI): Small schools and LEA's with fewer than
100 valid scores have adjusted AMOs to account for the small number of test scores.
These schools and LEA's met the adjusted percent proficient criteria using a confidence
interval methodology. Very small schools and LEA’s with fewer than eleven valid scores
9
have adjusted API criteria to account for the very small number of test scores. These
schools and LEA’s met the adjusted API criteria using confidence interval methodology.
CAPA and CAHSEE Only: Schools with CAPA and CAHSEE but no CST results
have participation rates, percent proficient, and APIs based only on CAPA and CAHSEE.
Consequential Validity: Attention of the value implications of test scores as a
basis of our actions and the political and social consequences of using the scores.
Consequential validity recognizes the moral values that are unable to be separated from
science.
Criterion Referenced Tests: Tests that allow users to make score interpretations in
relation to a functional performance level. This type of interpretation is distinguished
from those made in relation to the performance of others. Criterion-referenced
interpretation examples include comparison to cut scores, interpretations based upon
expectancy tables, and interpretations of domain-referenced scores.
CAPA (CP): Schools with only CAPA results have participation rates, percent
proficient, and APIs based only on CAPA.
Descriptive Statistics: Used to describe the main features of a collection of data in
quantitative terms. Descriptive statistics are distinguished from inferential or inductive, in
that descriptive statistics aim to quantitatively summarize a data set, rather than being
used to support inferential statements about the population that the data are thought to
represent. Even when a data analysis draws its main conclusions using inductive
statistical analysis, descriptive statistics are generally presented along with more formal
analyses. For example, in a paper reporting on a study involving human subjects, there

10
typically appears a table giving the overall sample size, sample sizes in important
subgroups (e.g. for each treatment or exposure group), and demographic or clinical
characteristics such as average age, the proportion of subjects with each gender, and the
proportion of subjects with related co-morbidities.
Disabilities: Impairments of a mental or physical nature that substantially limit an
individual in one or more major life activities.
Disaggregated Data: Test results sorted into groups of students by gender, racial
and ethnic minority groups, socio-economic, disability status, or limited English
proficiency.
Equitable Measures: Education policy outcomes that perform a distributive
function, the ensure that (1) the outcome process preserve the dignity and respect of
people, (2) policy outcomes must are connected to both intrinsic and extrinsic value of
individual subgroups, (3) policy outcomes process must ensure the equal consideration of
interest.
Ethnic Subgroups: For the purpose of this research the eleven ethnic subgroups
are defined the way the state of California defines subgroups. It is important to note that
subgroups of: SES – Socially Economically Disadvantage, ELL – English Language
Learners, and SWD – Student’s with Disabilities are composites of all ethnic subgroups
and are reflected in “traditional ethnic subgroups,” i.e., African American, American
Indian, Asian, Filipino, Hispanic-Latino, and White. Again California definition of
subgroups is applied to this study.

11
District Average (DA): For schools with no results on tests used in AYP
calculations or no graduation rate (if applicable), calculations were based on the school
district averages. If no school district values are available, countywide averages are used.
Enrollment less than 50 (EA): Schools or LEA’s with less than 50 students
enrolled do not have participation rate criteria, and "Yes" is shown for school-wide or
LEA-wide in the "Met 2005 AYP Criteria" column on the report.
Enrollment 50 to 99 (ER): Small schools and LEA’s with 50 to 99 enrollments
have slightly adjusted participation rate criteria to account for the small numbers. Schools
or LEA’s with 50 students enrolled met participation rate criteria by having at least 47
students tested. Schools or LEA’s with between 51 and 99 students enrolled met
participation rate criteria by having a school-wide or LEA-wide participation rate of at
least 95 percent, but the rate is rounded up to the nearest whole number (unlike the
standard criteria in which standard rounding is applied to the rate).
Grade 11 Only (G1): High schools without grade ten CAHSEE results and no
grade nine CST results but with grade eleven CST results that include at least 95 percent
tested on CST Math have participation rates, percent proficient, and APIs based on grade
eleven CST results.
Grade 9 Only (G9): High schools without grade ten CAHSEE results but with
grade nine CST results have participation rates, percent proficient, and APIs based on
grade nine CST results.
High-Stakes Assessments: Any assessment for which the results have significant
consequences for students, teachers, schools, and school districts. These stakes may

12
include promotion, retention, graduation, certification, and school/district rewards or
sanctions.
Individuals with Disabilities Education Act of 2004 (IDEA): US federal law that
governs how states and public agencies provide early intervention, special education, and
related services to children with disabilities. It addresses the educational needs of
children with disabilities from birth to age 21 in cases that involve 13 specified categories
of disability. The IDEA is "spending clause" legislation, meaning that it only applies to
those States and their local educational agencies that accept federal funding under the
IDEA. While states declining such funding are not subject to the IDEA, all States have
accepted funding under this statute and are subject to it. Under IDEA 2004:
• Special education and related services should be designed to meet the
unique learning needs of eligible children with disabilities, preschool
through age 21.
• Students with disabilities should be prepared for further education,
employment and independent living.
Individual Education Plan (IEP): Each student who receives special education or
related services must have an Individualized Education Plan (IEP). The purpose of the
IEP is to create educational opportunities that improve the student’s academic
performance. The IEP team, as defined by IDEA, is responsible for developing,
reviewing, and revising the IEP for the student. The team is usually composed of a
general education teacher, a special education teacher, a representative of the local
education authority (LEA), the student, the student’s parent(s), someone who can

13
interpret the instructional implications of evaluation results, and anyone else the parents
or school chooses to invite.
Inequitable Measures: Represents the same Annual Measurable Objectives being
applied to all subgroups within the State of California. In addition, ELL, Students with
Disabilities, and Socially Economically Disadvantaged being lumped together and not
disaggregated by ethnicity and counted.
CAHSEE: Schools with CAHSEE but no STAR or CAPA results have
participation rates, percent proficient, and APIs based only on CAHSEE.
Learning Disability (LD): A disorder in one or more basic psychological
processes involved n understanding or using spoken or written language. The disability
may manifest itself in a flawed ability to listen, think, speak, write, read, spell, or perform
mathematical calculations.
Least Restrictive Environment (LRE): The environment in which opportunities
for integration with non-disabled peers are maximized while also providing the disabled
student with an appropriate education. A special class, separate schooling, or other
removal of children with disabilities from the regular educational environment occurs
only when the nature or severity of the disability is such that education in regular classes
with the use of supplemental aids and services cannot be achieved adequately.
Literacy Score (LS): This is based on the CST California Standards Test – STAR
Reading, norm-referenced test.
Other (OT): In very rare cases, special calculations may have been required due to
unique situations.

14
Manufacturing Line Indexes: Include researched based instructional strategies and
industry standards that work that are cost effective and efficient.
No Child Left Behind (NCLB) Act: Signed into law by President George W. Bush
on January 8, 2002, the law promotes standards-based education reform.
Norm-Referenced Test Interpretations: Score interpretations based upon a
comparison of performance with others in specified reference populations.
Performance Standards: Specific examples and unequivocal definitions of what
students have to know and demonstrate in order to be considered proficient in skills and
knowledge outlined by the content standards.
Pair and Share (PS): California testing begins in grade two. For schools with only
kindergarten and/or grade one, the scores for the schools to which these students
matriculate were used. This is also referred to as “pairing and sharing”. For schools that
do not supply pair and share data, the school district or county values are used (CA or
DA).
California Public Schools Accountability Act 1999 (PSAA): An act passed in
California in 1999 as the first step in developing a comprehensive system to hold
students, schools, and districts accountable for improving student performance. The
program now includes a Standardized Testing and Reporting (STAR) system, testing at
the elementary levels, known as the California Achievement Test (CAT), and a high
school exit exam (CAHSEE) both aligned with academic content standards, plus an
Academic Performance Index (API) for measuring progress. These comprehensive
accountability standards put California in a good position to meet the provisions of the

15
2001 federal law known as (NCLB) and are the components the state uses for measuring
(AYP).
Race to the Top Abbreviated R2T or RTTT: A $4.35 billion incentive program
designed by the United States Department of Education to spur progressive reforms in
state and local district K-12 education. It is funded by the ED Recovery Act as part of the
American Recovery and Reinvestment Act and was announced by President Barack
Obama and Secretary of Education Arne Duncan on July 24th, 2009.
Passed by Safe Harbor (SH): The school, LEA, or subgroup met the criteria for
Safe Harbor, which is an alternate method of meeting the AMO if a school, LEA, or
subgroup shows progress in moving students from scoring at the below proficient level to
the proficient level or above on STAR, CAHSEE, and/or CAPA.
Assumptions, Limitations, Scope and Delimitations
1. This policy analysis is delimited to districts that serve significant subgroup
populations on schools making AYP in the state of California.
2. The study will be delimited to special education students not participating in
alternative assessments and the general education students at the same grade
levels.
3. This study will be delimited to students completing the 2007, 2008, and 2009
California Standardized Test (CST) and California High School Exit
Examination (CAHSEE).
The following limitations were present in this study:

16
1. Data collected in one district or school may not reflect conditions in other
districts or schools.
2. Ethnic Subgroups were defined by California which are not delineated to
reflect variations that exists with the SES, ELL and SWD categories.
3. The No Child Left Behind Act (NCLB) has allowed each state to establish
assessments and accountability systems. The assessments and accountability
systems implemented by California systems are different than in other states.
4. The study is bound to quantitative nature of the study there is a limited ability
to probe why proficiency rates or failure rates existing among student with
disabilities and other subgroups on AYP.
5. This policy analysis is limited to “how many” and “how often” schools with
significant subgroup populations of counties meet California’s AYP
standards.
The following assumptions will be present in this study:
1. All special education students have been found eligible for services based on
the criteria established by the California Department of Education.
2. Accommodations outlined in the Individual Education Plans (IEP) of students
were followed explicitly during CST and CAHSEE administrations.
3. That students' put forth their best efforts as they participated in CST and
CAHSEE administrations.

17
Significance of the Study
The results of this study illustrate the need for precise regulations and educational
reform that extend beyond summative testing as barriers and examples of performance
but rather educational legislation that includes language from sound research practice not
only for special education students but all students and finally academic performance
targets that are relative to individual subgroup growth. To move current legislation
beyond the product of student outcomes on proficiency test in English Language Arts and
Mathematics to more traditional measures of performance such as; attendance, dropout
rates, facilities, and a “manufacturing line” indexes such as teacher knowledge gaps of
instructional strategies, teacher motivational gaps based on weak incentives, and District
and local LEA Organizational gaps of facilities and daily operations. All legislation
should include researched based strategies that have been proven to work and are cost
effective and efficient. Finally a new direction for counting the special needs population
in the accountability process. Inclusion of special education students is essential and
favorable; however, a just, adequate, and suitable system must be in place in order to
access the growth of students with disabilities (National Center on Educational
Outcomes, 2003).

18
Summary
The remainder of this study is divided as follows: Chapter 2, includes the
reviewed relevant literature pertaining to the participation of students with disabilities in
state accountability systems established as a result of No Child Left Behind. An in-depth
review concentrated on the history of special education legislature, special education
eligibility, the No Child Left Behind Act of 2001, and adequate yearly progress. Finally,
Chapter 2 concludes with what the literature states on how accountability and school
improvement should best be applied, and researched based literature on Instruction
Strategies, Transformational Change, and Weak Incentives Theory. Chapter 3 describes
the methodology and design of the quantitative research study. The descriptive non-
experimental study will highlight the California Standardized Test (CST) and the
California High School Exit Exam (CAHSEE), comparing scores of general education
students and special education students. Proficiency rates of special education students
are analyzed and students with disabilities were included and excluded from adequate
yearly progress formula in an effort to determine if their inclusion impacted the ability of
schools to meet adequate yearly progress. Chapter 4 covers data collection, data analysis,
and results. Chapter 5 concludes the study with a summary, conclusions, and
recommendations for further research and educational decisions regarding students with
disabilities in school accountability.
19
Chapter 2
REVIEW OF THE RELATED LITERATURE
Introduction
Chapter 2 is divided into three parts or sections. Section 1 provides an analysis of
literature pertinent to the impact of disabled students and all significant subgroups in the
state accountability systems established on account of No Child Left Behind. A
comprehensive review will focus on a historical view of legislation related to special
education in public schools. In addition, a discussion regarding the determination of
special education eligibility, the No Child Left Behind Act, and the process of measuring
adequate yearly progress as an integral part of accountability measures will be
incorporated within the literature review. Section 2 covers what research suggests, are
best practices for closing the achievement gap through researched based instructional
strategies (Marzano, Pickering & Pollock, 2001; Dufour, 2004; Reeves, 2002; Darling-
Hammond, 2006). Finally, Section 3 provides research on ways to influence
organizational change. First is Transformational Leadership, which is strategic and
equitable leadership practices based on various theories, models, and approaches for
achieving organizational transformation, especially in educational settings. Second, is
Critical Policy Analysis and Action, which is to engage in critical analyses of policy at
the local, state, national, and international level. Specific California and federal policy
environment structures and processes will be examined, particularly those impacting
education and how public policy is generated, potential consequences, ethical dilemmas,

20
social justice, and equity issues. This section is designed to be a direct link informed
analysis of educational policy in order to positively influence educational policy in the K-
12 and or community college settings. Finally, is Data Driven Decision-Making. This
ability to make effective decisions is vital to the successful performance of visionary
transformational leaders. Effective and strategic decision making needs to consider a
multitude of constraints and obstacles, raw data, stakeholder perspectives, and potential
consequences of decision choices.
A Historical Perspective: Education Accountability Legislation
Although improving education through increased accountability has been a
dominant theme of recent education reform, accountability in education is hardly new.
Education reform in the United States has a long tradition of achievement testing, use of
behavioral objectives, and competency-based education. As a reform, accountability
reflects the pressure in systemic reform simultaneously to loosen policies “mandating
inputs while tightening state oversight of outputs (i.e., performance-based assessments)”
(Cibulka & Derlin, 1995, p. 482). In the early half of the twentieth century, accountability
was measured primarily as a function of inputs into the system. Traditional accountability
measures have included class size, staff characteristics, expenditures, resources, and so
on. Staff evaluations tended to reflect input-driven models as well: checklist were used to
evaluate teacher lesson plans, how many times a teacher asked questions, and wrote on
chalkboards (Cooper, 2004).

21
According to Jackson and Cibulka (1991), public demand for greater
accountability in schools, “began to surface in the 1950s, during the Sputnik scare”
(Cooper, 2004, p. 32). The movement continued to build throughout the 1960s and 1970s.
During this period, education policymakers’ interest in theories of business and public
administration, with their attendant emphasis on systems of planning, programming,
budgeting, and management by objective, led state legislatures to enact accountability
legislation – at least seventy-three such laws – between 1963 and 1974 (Rothmann,
1995). Most called for some type of assessment of educational performance (Rothmann,
1995). Accountability measures were also advocated as a result of increasing public
anxiety over perceived declines in student achievement – clearly not just a recent
phenomenon (Rothmann, 1995).
The movement toward greater accountability in education has been one of the
hallmarks of the 1970s (Rich, 1978). In the early 1970s, the goal of accountability
systems was “increased efficiency through better management and improved fiscal
procedures” (Pipho, 1989, p. 662). In essence, more bang for the buck. As Mazzoni
(1995) observed, “Accountability’ for education – and educators – had been the subject
of extensive legislative and regulatory action throughout the 1970s” (p. 53). In the 1970s
and early 1980s, minimum competency test were used as an accountability criterion.
From years 1973 to 1983, the number of states with some form of minimum competency
testing rose, from two to 34 (Crawford, 2001).
Pressure for greater accountability increased with the release in 1983 of A Nation
at Risk (Ginsberg & Berry, 1998). Accountability has been the cornerstone of nearly

22
every major education reform of the last quarter century, including school-based
management (decentralization), state takeovers (recentralization), and the drive for higher
standards and high-stakes testing. Accountability rhetoric is usually couched in terms of
the need to drive up standards (Ouston, 1998). There has been a shift, however, on
measuring student performance and assigning responsibility for results (Pipho, 1998).
One by-product of the renewed emphasis on accountability is a dramatic increase in
testing (Hunter, 1999). Most states rely heavily on commercially available standardized
test, although some states and districts have developed their own test (Linn, 2000).
California is no exception.
Movements of past educational reform will be reviewed leading into the most
current educational reform legislation, which is the No Child Left Behind Act. Adequate
yearly progress, as it particularly relates to California, will be discussed. The chapter will
conclude with an explanation of the accountability ratings given to public schools in the
state of California. The No Child Left Behind Act (NCLB) was signed into law on
January 8, 2002, reauthorizing the Elementary and Secondary Act of 1965, which was the
establishment of the federal framework of how public education is provided throughout
the country. NCLB is built upon that structure with the overall goal of having all students
perform at proficient levels in the areas of reading and mathematics by the year 2014.
NCLB also emphasizes closing the achievement gaps of specific groups of students. The
targeted groups are those of different genders or minority groups; students that are
limited in their proficiency of the English language; economically disadvantaged
students; and disabled students (Schrag, 2003). All of the targeted student subgroups are

23
required to meet the same annual performance goals as all other students. “The provisions
of NCLB that have caused the most controversy AND will most significantly affect
schools and students with disabilities are the requirements related to accountability and
‘adequate yearly progress’ [AYP]” (National Education Association, 2004, p. 11).
Key Issues for Significant Subgroups
NCLB requires states to establish annual achievement objectives for disabled
students. The adequate yearly progress provisions of NCLB necessitate the objectives to
set annual performance targets for all students, with these targets also extending to
students with disabilities. By the end of the 2013 – 2014 school year, all students are
expected to be proficient in reading and mathematics. NCLB requires that ninety percent
of all students with disabilities meet the same proficiency targets as those established for
all other students. The goal is admirable; however, it is unrealistic to hold schools
accountable for ninety percent of disabled students reaching proficiency according to
grade level standards (National Conference of State Legislatures, 2005).
The Individuals with Disabilities Education Act (IDEA) assures all children with
disabilities the right to a free and appropriate public education (FAPE) in the least
restrictive environment (LRE). The use of individualized education programs, or IEPs,
was also reinforced with IDEA ’97. The IEP requires educators and parents to “determine
how best to design an effective individual program of instruction for students with
disabilities and to hold schools accountable for the student’s achievement” (National
Conference of State Legislatures, 2005, p. 26).
24
In order to test the knowledge of students with disabilities aptly, the students were
tested with regular grade level assessments, regular assessments with accommodations,
alternate assessments based in grade-level standards, or alternate assessments based on
alternate achievement standards. IDEA called the last type of assessment out-of-level
standards and assessments. States were urged to include students with disabilities in the
general education curriculum, IDEA acknowledged that doing this was unsuitable for
some children who should be taught and tested according to their ability level rather than
their grade level. By contrast, NCLB allows for only ten percent of the special education
subgroup to be tested according to out-of-level standards. The remaining ninety percent
of the subgroup must be testing according to grade level. “NCLB holds students with
disabilities to unrealistic expectations and risks demoralizing and stigmatizing these
students because special education subgroups have caused many schools to fail to meet
AYP” (National Conference of State Legislatures, 2005, p. 27).
Special Education Legislation
Legislation at the federal level has helped develop the educational futures of
disabled students in the United States. Democratic leaders in the nineteen sixties were at
ease with active federal involvement in public education. Upon defeating Goldwater in
the 1964 presidential election, Lyndon B. Johnson pushed an expansive social agenda.
This agenda included the Elementary and Secondary Act of 1965, the first federal aid
comprehensive package to education (Hess & McGuinn, 2002). The Elementary and
Secondary Education Act or (ESEA), Public Law 89-10, passed in 1965 in order to

25
provide opportunities that were equal for all children and to reinforce and improve the
educational quality of schools in the United States (Nagle, Yunker & Malgren, 2006).
The ESEA became the statutory basis for early special education legislation. Eight
months after ESEA (PL 89-10) was authorized, the law was amended with The
Elementary and Secondary Education Act Amendments of 1965, Public Law 89-313.
This law authorized the first federal grants plan explicitly targeting students with
disabilities. The Amendments sanctioned grants to state agencies in order to educate
children with disabilities in schools and institutions that were operated or supported by
the state (The National Information Center for Children and Youth with Disabilities,
1996).
The first federal grant program functioning at the local school level rather than
state level was recognized with the acceptance of Public Law 89-750, the Elementary and
Secondary Education Act Amendments of 1966. This section of the law became known
also as Title VI. In addition, P.L. 89-750 created an agency in which all programs from
the Office of Education would be managed for disabled children and youth. The agency
was known as the Bureau of Education for the Handicapped, or BEH, and was authorized
with assisting states to implement and monitor programs; provide for demonstration
programs; assess federally funded programs and guide research; provide financial support
for training special educators, regular education teachers, and other personnel or
individuals working with disabled students; and support research and development as
related to educational media (The National Information Center for Children and Youth
with Disabilities, 1996). Finally, PL 89-750 sanctioned the National Advisory Council,

26
which is known today as the National Council on Disability (NCD), a fifteen-member
panel appointed by the President and confirmed by the Senate. The general purpose of the
agency is to “promote policies, programs, practices, and procedures that guarantee equal
opportunity for all people with disabilities, regardless of the nature or severity of the
disability” (National Council on Disability [NCD], n. d.). The NCD also sought to allow
disabled individuals to achieve economic independence, self-sufficient living, and
inclusion within society.
The final special education legislation of the nineteen sixties at the federal level
was Public Law 90-247, also known as the Elementary and Secondary Education Act
Amendments of 1968. This law established a set of programs for the purpose of
supplementing and supporting the improvement of services within special education.
These programs would eventually be known as discretionary and included funding for
regional resource centers, services and centers for children who were deaf and/or blind,
the growth of instructional media programs, sustained special education research, and
funding to establish a center to aid in the improved recruitment of educational personnel
and to circulate information related to opportunities for education of disabled children
(National Information Center for Children and Youth with Disabilities, 1996).
Until the 1970s, disabled children and youth were not willingly included within
public education. Although legislation and programs existed for the purpose of targeting
students with disabilities, these were not obligatory and nothing was in place to mandate
equitable treatment for disabled children and youth in the realm of education (Faircloth,
2004). Two milestone cases occurred in the opening years of the decade, which served to

27
ascertain the rights of the disabled for a public education. Pennsylvania Association for
Retarded Children (PARC) v. Pennsylvania was brought on behalf of mentally retarded
students in the state of Pennsylvania in 1971. The suit alleged that the Equal Protection
Clause of the 14th Amendment to the US Constitution was violated due to the fact that
mentally challenged students were not receiving a public education (Katsiyannis, Yell &
Bradley, 2001). The second case was a class action lawsuit filed by the parents and
guardians of children with a “range of disabilities including behavioral disturbances,
hyperactivity, mental retardation, and physical impairments” (Faircloth, 2004, p. 34). The
plaintiffs in Mills v. Board of Education (1972) claimed the District of Columbia failed to
utilize proper due process when the disabled students were excluded from, public
education. These two court cases highlighted the need for special education legislation on
a national level. Consequently, Congress became progressively more aware of the need to
afford educational services to disabled students. Congress significantly amended existing
laws in 1974 following the rulings in the PARC and Mills cases to include “the goal of
full educational opportunity for students with disabilities” (Katsiyannis et al., 2001, p.
325).
The Education Amendments of 1974, also known as Public Law 93-380, was
passed in 1974 establishing laws crucial to special education. The Amendments of 1974
detailed a number of changes to existing federal education programs established by the
Elementary and Secondary Education Act (ESEA). One of the most imperative
amendments was to Title VI of the ESEA, renamed as the Education of the Handicapped
Act Amendments of 1974. The law required states to institute a “timetable toward

28
achieving full educational opportunity for all children with disabilities” (NICHCY, 1996,
p.5). The Amendments provided routine safeguards to be used in the identification,
evaluation, and placement of disabled children. Although Public Law 94-142 would
replace Public Law 93-380, P.L. 93-380 was valuable for the attention brought on fully
educating all children with disabilities through a major federal program to the states
(NICHCY, 1996).
The Education of the Handicapped Act was amended in 1975 and became the
Education for All Handicapped Children Act (EAHCA), also known as Public Law 94-
142. The objective of the law was to protect the rights of individuals with disabilities.
The requirement from the initial passage of this act was a free appropriate public
education in the least restrictive environment for students with disabilities. Standards
were established regarding effective programs and services for early intervention, special
education, and related services. Prior to P.L. 94-142, numerous states had laws excluding
certain students, including those who were blind, deaf, emotionally disturbed, or mentally
retarded. Schools in the United States educated only one in five students with disabilities
in 1970 (Office of Special Education and Rehabilitative Services, 1988).
The Education for All Handicapped Children Act has gone through numerous
amendments since 1975 and is presently authorized as Public Law 105-17, the
Individuals with Disabilities Education Act (IDEA). Congress passed the Education of
the Handicapped Act Amendments of 1990, or Public Law 101-476, in 1990. The
amendments presented noteworthy changes. The Education of the Handicapped Act was
renamed the Individuals with Disabilities Education Act (IDEA). New discretionary

29
programs were created including programs for transition, improving services for
emotionally disturbed children and youth, and a research and awareness program on
attention deficit disorder. Transition services and assistive technology services were
added as new definitions to IDEA for special education services that are required in the
individualized education program (IEP) of a child or youth. Rehabilitative counseling and
social work services were also presented as related services under the law. In addition,
services and rights under IDEA were extended to more encompass children with autism
and traumatic brain injury (NICHCY, 1996).
According to Turnbull and Turnbull (2000), the Individuals with Disabilities
Education Act is guided by six principles, which make certain that disabled students
receive free and appropriate education as guaranteed by law:
Table 1
Guiding Principles of IDEA
Principle Description
Zero reject No child with a disability may be denied the right to an education regardless of disability
Nondiscriminatory identification and evaluation
Students must be evaluated using multiple forms of assessment which do not present racial or cultural bias
Free and appropriate public education
Dependent on the development and condition of an individualized education program, or an IEP
Least restrictive environment
Distinguished by education with non-disabled peers in a general education setting to the maximum appropriate extent

30
Procedural due process Assuring the right to be informed and
to be heard prior to government action
Parental participation and shared decision- making
The parent(s) must be a part of the IEP team that makes the educational decision for the child.
Congress reauthorized the Individuals with Disabilities Education Act (IDEA) in
1997. The amended law “required that children with disabilities be included in general
state and district-wide assessment programs, with appropriate accommodations and
modifications provided as needed” (Faircloth, 2004, p. 34). Congress noted “research and
experience has demonstrated that the education of children and youth with disabilities can
be made more effective by having high expectations for such children and ensuring their
access in the general curriculum to the maximum extent possible” (as cited in Leake &
Stodden, 2002, p. 5).
Amendments resulting in the IDEA of 1997 also required measurable annual
goals and benchmarks or objectives in the individualized education plan (IEP) of the
student with a disability. The general education teacher is a mandatory part of the IEP
team, with all states required to extend mediation in disputes between parents and the
school district. Discipline procedures were also added to IDEA of 1997 in order to
protect the rights of students with disabilities (Boyle & Weishaar, 2001).
The No Child Left Behind Act, a federal mandate significantly revising the
Elementary and Secondary Education Act of 1965, was signed into law in January of
2002. Congress has amended and added to the original law since its inception in order to

31
raise standards, develop accountability within the law, and provide flexibility to schools
and districts regarding the use of federal education dollars so these entities can continue
to help disadvantaged children (National Education Association, 2004). The No Child
Left Behind Act, also known as NCLB, “significantly challenged the status quo if public
schools and established the US Department of Education as a responsible party for
increasing student achievement in public schools” (Bowen & Rude, 2006, p. 24).
Although NCLB was built upon the foundation of the ESEA of 1965, the law also “adds
four philosophic pillars of its own to ensure that every child – particularly the neediest –
receives a quality education” (Schrag, 2003, p. 1), they are: (1) accountability for
educational results; (2) flexibility in the use of state and local educational funds; (3) The
use of scientifically based research for the purpose of selecting instructional methods and
materials; and (4) Mandating more parental opportunities concerning choice and
involvement are the central themes of the No Child Left Behind Act (Simpson, LaCava &
Graner, 2004).
Almost $400 billion has been spent on public education since 1965. Regardless of
substantial infusions of federal dollars over the past forty years, state and national
appraisal of student progress indicate reading and math achievement has remained
dormant. NCLB has increased the federal role in public education and impacts not only
all students in general education programs, but also students with disabilities who attend
special education programs for any part of their instruction. The law mandates that
schools increase student achievement so that all public school students demonstrate
32
proficiency in reading and math by the end of the 2013 – 2014 school-year (Yell et al.,
2006).
The US House of Representatives approved the Improving Education Results for
Children with Disabilities Act of 2003 on April 30, 2003. The legislation sought to shift
the focus from compliance on complex rules to “producing the academic results children
with disabilities deserve” (Committee on Education and the Workforce, 2003, p. 1). The
Improving Education Results for Children with Disabilities Act presented reforms to
increase accountability and results for children, reduce the paperwork burden for special
education teachers, and provide flexibility for local school districts in the implementation
of early intervention strategies. The Act also seeks to reduce the number of children
misplaced in special education, reduce litigation and enhance rapport between parents
and schools, and align IDEA with the No Child Behind Act signed into law in 2002
(Committee on Education and the Workforce, 2003).
President George W. Bush signed the Individuals with Disabilities Education
Improvement Act (IDEA) of 2004 into law on December 3, 2004. IDEA 2004 sought to
“improve educational results for children with disabilities by providing a performance
driven framework for accountability to ensure that children with disabilities receive a free
appropriate public education” (Yell, Katsiyannas, & Shiner, 2006, p. 36). In addition to
reauthorizing the earlier IDEA legislation, a goal of IDEA 2004 was to align IDEA and
NCLB. The alignment began in 2003 with the Improving Education Results for Children
with Disabilities Act, and improved even further with this legislation. Earlier versions of

33
IDEA required states to establish performance goals for children with disabilities that
were comparable to other goals and standards for children recognized by the state. The
2004 Reauthorization now requires the performance goals for children with disabilities to
be consistent with the definition of adequate yearly progress established for all students
(Gordon, 2006).
Prior to IDEA 2004, states were required to have children with disabilities
participate in local and state assessment programs with appropriate accommodations
when feasible. No Child Behind legislation mandates that students with disabilities
participate in all state and district-wide testing used to ensure educational accountability.
The 2004 Reauthorization indicated that all students with disabilities be included in
standards-based testing for the purposes of evaluating accountability of a school or
district. Accountability provisions within NCLB call for states to test all students in
reading and math every year in grades three through eight. While IDEA 2004 allowed the
option of alternative academic standards for students with disabilities, NCLB enforces a
one percent limit for counting participation in alternative assessments towards academic
progress. Schools and districts may no longer exempt students with disabilities from
standards-based evaluation when calculating the progress of a school (Gordon, 2006).
Although student with disabilities in California are currently do not have to pass
CAHSEE with a 350 or higher in order to receive a high school diploma (California
Department of Education [CDE], 2010).

34
Special Education Eligibility
There are two components that must be apparent in order for a child to be eligible
for special education and related services. A child must be diagnosed with a disability
and it must be determined that the student is in need of special education and related
services. The Individuals with Disabilities Act defined a child with a disability as a child
with mental retardation, hearing impairments, deafness, visual impairments including
blindness, deaf-blindness, speech or language impairments, orthopedic impairments,
serious emotional disturbance, multiple disabilities, traumatic brain injury, autism,
specific learning disabilities, or other health impairments. The IDEA also indicated the
disability must affect the educational performance of the child. The eligibility question is
answered by determining whether the child has a disability defined by the thirteen
categories of the IDEA and also whether the disability impacts the educational
performance of the child in the school environment (Learning Disabilities Association of
America, 2003).
Individual school districts use the criteria for eligibility and procedures for
assessment as delineated by the State Department of Education when determining student
placement within special education. Assessment is required for each disability and
criteria must be met for qualification of services. The existence of a disability does not
necessarily indicate eligibility of a student for special education services under the
Individuals with Disabilities Education Act. Eligibility criterions under the IDEA are
satisfied only if the student has a disability adversely impacting educational performance
and necessitate specially designed instruction.

35
Learning Disabled
According to the US Department of Education (2004), the largest category for
students with a special education disability is that of specific learning disabled. A
learning disability affects the way students of average to above average intelligence
receive, process, or disseminate information and is a permanent disability. The learning
disability impacts the basic skills of reading, writing, or math. The IDEA defines a
specific learning disability as a “disorder in one or more of the basic psychological
processes involved in understanding or using spoken or written language” (Baumel,
2003, p. 1). Academic skills of listening, speaking, reading, writing, and/or mathematics
may be impaired in the learning disabled student. Academic achievement, as measured by
standardized tests, must demonstrate a discrepancy between the ability and the
achievement of a student in order for the student to be eligible for special education
services in the category of specifically learning disabled.
Learning disabilities may arise from neurological and even genetic differences in
the structure of the brain. A specific learning disability is a condition that may impact the
ability of a student to either interpret what is heard or seen or to link information from
different parts of the brain. Difficulties such as these may have a monumental impact on
standardized testing performance because they can hinder learning to read, write, or
perform math operations (Disabilities Rights Advocates, 2001).
No Child Left Behind
During the presidential campaign of 2000, both candidates placed education on
the forefront of their platforms. George W. Bush, the governor of Texas at the time,

36
promoted a national standards-based accountability model founded upon the one
experiencing success in his state. Within days of moving into the Oval Office, President
Bush sent a legislative proposal based on his experience in Texas. The twenty-six-page
document entitled No Child Left Behind focused on four principles. The plan sought to
“increase accountability for student performance, focus on what works, reduce
bureaucracy and increase flexibility, and empower parents” (Hess & Petrilli, 2006, p. 17).
The final legislation is over six hundred pages in length and is perhaps the most
influential educational initiative passed in decades. The No Child Left Behind Act has
altered the focus of federal education policy from emphasis on redistributing and
regulating money to an emphasis on the academic performance of students, schools, and
school districts. The overall mission of NCLB was for all students to achieve proficiency
in reading and mathematics by the year 2014. At the same time, the achievement gaps of
students of different genders or minority groups; economically deprived students or
students who are English language learners; and students with disabilities will be closed
(Schrag, 2003).
NCLB has set the goal of having every student, including students with
disabilities; meet one hundred percent proficiency in reading and math by the end of the
2014 school year. Many states have identified adequate yearly progress standards that are
to be met by students and schools. The progress goals are to be measured by scores on
standardized tests with recognition and rewards given for success and sanctions issued for
failure (Simpson, LaCava & Graner, 2004).

37
Accountability in NCLB
Accountability for stronger results is one of four key principles in the No Child
Left Behind legislation. States are required to create annual assessments for the purpose
of measuring what students know and can do in reading and math in grades three through
eight. The tests, based on established state standards, will follow the performance of all
schools in the nation. Data is to be disaggregated for students by socioeconomic levels,
race, ethnicities, disabilities, and limited English proficiency. The disaggregating of test
scores will “ensure that no child – regardless of his or her background- is left behind”
(US Department of Education, 2002, p. 10).
Annual school report cards will be published for each school, school district, and
state in the nation. The dissemination of report cards, along with explanations of the data,
gives parents the opportunity to make more knowledgeable choices regarding the
education of their children. The report cards will illustrate how well students are meeting
standards, and also show progress in closing achievement gaps among disaggregated
student groups.
Schools and districts that do not make adequate yearly progress, or AYP, toward
state proficiency goals will be first targeted for assistance. Continued failure to meet AYP
goals will subject schools to corrective action and possibly restructuring (US Department
of Education, 2002).
Flexibility and Local Control
States and school districts have unparalleled flexibility in how federal education
funds may be utilized. The aim of NCLB was to allow greater ability for decision making

38
at local and state levels. The act makes it feasible for most school districts to shift as
much as fifty percent of the federal formula grant funds received under the Improving
Teacher Quality State Grants, Educational Technology, Innovative Programs, and Safe
and Drug-Free Schools programs to any one of these programs or to the Title I program
without separate approval. One result will be to allow districts to make use of funds in the
manner most needed, such as the hiring of personnel, improved teacher training,
professional development, or increasing teacher salaries.
NCLB also established state and local flexibility demonstration programs that will
allow selected states and schools districts to:
…consolidate funds received under a variety of federal education programs so
that they can be used for any educational purpose authorized under the
Elementary and Secondary Act, as amended by the NCLB Act in order to assist
them in making adequate yearly progress and narrowing achievement gaps. (US
Department of Education, 2002, p. 10)
Enhanced Parental Choice
Parents with children in schools failing to meet state standards for at least two
consecutive years have the option of transferring their children to another public school
within the district. The district must provide transportation for the transfer, with Title I
funds if needed. Low-income families with children in schools failing to meet state
standards for at least three years qualify for supplemental educational services. These
services may consist of tutoring, after-school services, and summer school programs.

39
Moreover, the NCLB Act allows additional support to parents, educators, and
communities for the creation of new charter schools. Also, students attending persistently
dangerous schools or victims of a violent crime while at school may choose to attend a
safe school within their district.
Options for parental choice are related to the accountability provisions giving
parents information on schools within their community. The requirements for parental
choice and supplemental educational services within NCLB help to improve student
achievement while providing incentives for low-performing schools to get better.
Schools have to increase performance in order to avoid losing students or be subjected to
corrective action (US Department of Education, 2002).
Focus on What Works
The NCLB Act stressed using federal funds to support programs and practices
which have established effectiveness through scientific research. Programs in reading are
an example of this focus. The Reading First program and the Early Reading First
program under the NCLB Act will support scientifically based reading instruction in the
early grades. Funds are available for professional development to strengthen skills and
learn new skills in effective reading instructional methods. After- school programs and
other programs scientifically proven to prevent drug use and reduce violence among
youths will also receive monies. Federal funding will be used for the purpose of
supporting programs and instructional methods shown to improve student learning and
increase achievement (US Department of Education, 2002).

40
NCLB Implications and Special Education
The No Child Left Behind Act (NCLB) of 2002 is predominantly a law for
students in regular education; however, the legislation also represents “a federal
commitment that students with disabilities will receive genuine access to the general
education curriculum” (Albritten et al., 2004, p. 153). While there are four essential
elements of the NCLB legislation, the enactment has considerable implications for
special education policy and practice in regards to school accountability and personnel
certification and licensure (Egnor, 2003).
School Accountability
One of the most important implications of NCLB as the law relates to special
education is the set of graduated accountability measures resulting when students fail to
meet the adequate yearly progress (AYP) standards outlined by the accountability
element. The law calls for schools to meet AYP goals culminating in 100 percent
proficiency in reading and math for all students in grades three through eight by the end
of the 2014 school year (Egnor, 2003). Definitions of AYP are also required to address
the progress of specified subgroups of students, one of which is students with disabilities.
Schools and districts will not be able to meet AYP goals if one or more of the
designated student subgroups fail to meet the established performance goal. NCLB
requires a minimum of ninety-five percent of students in each subgroup to participate in
the assessment measuring AYP (Pierce, 2003). If students with disabilities fail to meet
AYP objectives schools and districts receiving Title I federal funds face increasingly
intrusive governmental sanctions.

41
Table 2
Sanctions for Failure to Meet AYP Goals in Consecutive Years
Years of AYP Failure Required Sanctions
Two years of AYP failure
- Development of a two-year improvement plan - Parents must be given the option of transferring their student to a school within the district that met AYP goals
Three years of AYP failure
- Continue above options - Title I funds may be utilized in order to pay for supplemental services outside of the school day for students identified as disadvantaged
Four years of AYP failure
- Continue above options - District must implement corrective actions such as replacing certain staff, adopting a new curriculum, or extending the school day or year
Five years of AYP failure
- Continue above options - Develop a plan for governance in which the State Department of Education (SDE) takes over the school district
Six years of AYP failure
- Continue above actions - The SDE implements their plan of governance for the district
Special education students, by definition, have disabilities that hinder learning.
Students with disabilities historically perform at lower levels on standardized tests, yet
these students comprise an individual subgroup that is required to meet AYP goals.
NCLB presents improbable expectations for students with disabilities. The legislation
“virtually guarantees that the presence of special education students in a school will
contribute to the school’s failure to meet AYP” (Allbritten et al., 2004, p.157). In
addition, NCLB “risks demoralizing and stigmatizing these students because special
education subgroups have caused many schools to fail to meet AYP” (National

42
Conference of State Legislatures, 2005, p. 27). Ironically, schools with disabled
subgroups are most likely to miss AYP goals, when by definition, students in this
subgroup will not be able to perform at the same level as other students (Buchanan,
2004).
A perceived strength of NCLB was that the legislation requires educators to
acknowledge and strategically address differences in student achievement among
subgroups. A weakness correlating with this strength is the mandate that all subgroups
will achieve 100 percent proficiency by 2014, regardless of the starting achievement
level. The lone goal for all subgroups effectively assures failure for schools and school
districts with large numbers of learning disabled students (Rose, 2004).
Personnel Certification and Licensure
NCLB required that all teachers be not only certified, but also highly qualified by
the end of the 2005-2006 school year. This was a requirement for new hires beginning in
the 2002-2003 year, with a short grace period for teachers already in the field. The highly
qualified stipulation applied to all public school teachers in elementary or secondary
schools teaching a core academic subject. The core academic subjects are English,
reading or language arts, mathematics, science, foreign languages, civics and
government, economics, arts, history, and geography. In order to be considered highly
qualified a teacher has obtained full state certification as a teacher and holds a license to
teach in the state, holds a minimum of a bachelor’s degree, and has demonstrated
competence in each of the academic subject areas taught as required by the state (Egnor,
2003).

43
A special education teacher teaching one of the core subject areas is required to
hold dual certification in special education and the core subject area they teach. Many
special education teachers provide instruction in more than one subject area. According
to the requirements of NCLB, the special education teacher must demonstrate
competence in each academic subject they teach in addition to being certified in the area
of special education. Special education teachers are considered highly qualified, based on
their licensure as a special educator, if they do not provide direct instruction in a core
subject area when teaching students with disabilities. There is no exception for teachers
of students with significant cognitive disabilities. These teachers must meet the
qualifications for special education certification and satisfy requirements for teaching the
core subject areas at the level in which they teach- elementary, middle, or high school.
“Special education teachers must meet highly qualified requirements in every core
subject they teach to their students. These requirements apply whether special education
teachers provide core academic instruction in a regular classroom, a resource room, or
another setting” (Council for Exceptional Children, 2005, p. 10).
Attaining highly qualified status in subject areas has caused more uncertainty than
clarity for special education teachers. The reauthorization of IDEA tried to align special
education laws with the accountability requirements of the NCLB legislation. This means
that in order to be highly qualified, special education teachers are required to be highly
qualified in special education as well as every subject they teach (Samuels, 2005).
In numerous cases, special education teachers have taught a variety of content areas for
years. Teachers such as these may have degrees in both elementary education and special
44
education; nonetheless, if they do not specialize in a core subject area the teachers are not
deemed highly qualified under NCLB (Irons & Harris, 2006).
Measuring AYP as a Part of Accountability
The requirement for adequate yearly progress (AYP) is at the heart of the
accountability system established by the No Child Left Behind (NCLB) legislation and is
the measure by which all schools and school districts are assessed under NCLB. The
accountability system appears to be simple and clear-cut, but a closer look indicates that
it is intricate and differs from state to state. The measurement system visualized in NCLB
requires each state to develop three components that are entwined. According to Hess and
Petrilli (2006), “Standards are the material that students are expected to know;
assessments are the tests used to measure whether they learned the material in the
standards, and accountability is the system of remedies and rewards that recognizes high
performance and addresses poor performance by schools and school districts” (p. 30).
States are required to develop their own standards and create tests reflecting those
standards. Content standards identify what students are expected to know and do by grade
level. Academic achievement standards defining basic, proficient, and advanced levels of
competency are also a part of the requirement. Shaping the definitions for the levels is a
responsibility of each state (Hess & Petrilli, 2006).
The accountability requirements in the No Child Left Behind Act were
established to “close the achievement gap between high- and low-performing children”
(NCLB, 2002, § 6301 (3)). NCLB called for states to devise a “test-based accountability
system that monitors the performance of all public schools and different subgroups of

45
students, including racial and ethnic minorities, low-income children, English language
learners, and students with disabilities” (Sunderman, Kim & Orfield, 2005, p. 23). States
are required to generate benchmarks called annual measurable objectives (AMO) in
reading and mathematics for the purpose of determine whether schools are making
adequate yearly progress (AYP).
While AYP is established on many criteria, the primary aim is to measure
achievement on reading and math tests and to hold schools accountable for the
performance of different subgroups of students. NCLB legislation utilizes AYP to gauge
progress on the way to the goal of having all students proficient in reading and
mathematics by the end of the 2013-2014 school year. Expectations of NCLB are
continual improvements on reading and math assessments and increased achievement of
student groups that customarily do not perform well (Sunderman et al., 2005).
Although AYP was a part of prior legislation, the focus changed in NCLB from
overall student performance to the performance of student subgroups. The law calls for
schools to determine objectives for annual achievement, meet the objectives, and report
the objectives for subgroups, one of which is students with disabilities (Northwest
Regional Educational Laboratory, 2004). “To make AYP, all schools and subgroups must
cross over a single bar of performance, which NCLB defines as proficiency on state
reading and mathematics tests” (Sunderman et al., 2005, p. 27).
The phrase “scientifically based” is used within the NCLB legislation a total of
one hundred eleven times; nonetheless, sound scientific theory does not allow 100% of
the students in a school to meet the same lofty standard, especially when given such a

46
short time frame for achievement. A standard is considered high because of the difficulty
in achieving the criterion. If all students are able to meet proficiency standards, the
standards may be considered low. Although NCLB has established sanctions for schools
with insufficient AYP ratings, it may be statistically impossible to meet the goals
mandated by the law (Mathis, 2004).
Conditions for Meeting AYP
Final NCLB regulations indicate that adequate yearly progress is met upon the
satisfaction of three conditions. First, a minimum of ninety-five percent of students in
each subgroup must participate in state assessments. In order for a subgroup to count as a
valid AYP indicator, the number of included students must be high enough to produce
results that are statistically reliable. Next, the objectives established by the state for all
students must be met or exceeded for all students and each subgroup of students. As a
final condition, there must be progress made toward increasing the graduation rate at the
high school level, and another academic indicator for elementary and middle schools that
is determined by the state (Nagle, Yunker & Malgren, 2006).
States are required to establish specific targets for all students each year in
reading and math. The targets make certain that all students progress toward reaching the
goal of 100 percent proficiency by 2014. Results of the total student population and
results of defined subgroups are tracked and reported to parents, along with the general
public, each year. The subgroups are defined as economically disadvantaged students,
students from racial and ethnic subgroups, students with limited English proficiency, or
students with disabilities (Yell et al., 2006).
47
Test scores of students may be counted multiple times, based on the number of
designated subgroups for which they are counted. Since calculations for AYP are
determined separately for not only all students, but also for subgroups, a single student
may be considered as a part of the disabled students group, the economically
disadvantaged group, the female group, and also the group of all students (Riddle, 2004).
In a school with a small enrollment of students “One student with the right
demographic features, who fails the test could swing a district’s score as much as 3.3%
[given a subgroup size of 30 in each subgroup]” (Jarrell, 2005, p. 68). The chances of a
school or district to meet AYP targets may be negatively impacted by merely a few test
scores. The foundation for the accountability requirements of NCLB is represented by the
percentage of total students in a school and in each subgroup able to meet the proficiency
goals each year. The proficiency goals are referred to as AYP, with the law also outlining
a system of accountability involving rewards or sanctions based on student performance
(Yell et al., 2006). NCLB established the same expectations for all students. Each
subgroup of students is expected to achieve 100% proficiency by 2013-2014. According
to Jehlen (2006), “One glaring example is the requirement that special education children
meet the same standards as children with no disabilities. More schools fail to meet AYP
because of low scores for special education students than any other group” (p. 27).
Safe Harbor and “N-size”
It is possible for a school or school district to meet AYP even if one or more
subgroups fail to meet the proficiency target. The provision is known as the “safe harbor”
provision of NCLB and may be utilized if the number of students in the subgroup is

48
reduced by at least ten percent. The subgroup must also meet the 95% participation rate
and the other grade-level indicator (Pierce, 2003). Schools and districts are allowed to
exclude test scores from subgroups of students small enough to be statistically unreliable
when counted towards the performance of a school. The minimum number for a subgroup
is known as the “N-size” of a group. While this number must be sanctioned by the federal
Department of Education, it varies from state to state (Davis, 2006). States are required to
“consider only whether a given size effectuates the collection of reliable information and
ensures student anonymity” (Stephenson, 2006, p. 171).
A number of states have excluded the disabled student subgroups from
accountability reports by raising the n-size of the subgroup. For example, a school in
Maryland failed to meet AYP because ten special education students did not test
proficient; however, during the same year, a school in Virginia met AYP goals although
the twenty-four disabled students in the school were not proficient. The difference
between AYP achievements in the two states was the n-size of the disabled students’
subgroup. The minimum number for a subgroup was five students in Maryland and fifty
students in Virginia (Stephenson, 2006).
The message sent by NCLB was that schools are liable for student achievement,
and if students fail to improve, schools are held accountable. As indicated by Cohen
(2002), Fletcher (2003), and Olsen (2002), many schools and districts share the belief that
the most challenging obstacle to reaching AYP goals is in increasing the achievement of
students with disabilities. There is a great deal of anxiety that some students with
disabilities would not be able to meet AYP targets no matter the efforts of schools and

49
teachers. Thirty schools in the state of Maryland were unsuccessful in meeting AYP
standards because the schools abided by a federal law that conflicts with NCLB in that
assistance is provided for special needs students during exams. Scores of students having
portions of exams read to them are invalidated under NCLB. An accommodation such as
having an exam read aloud causes the exam to be awarded the lowest score, thus
significantly impacting the scores of students included in the disabled subgroup (National
Education Association, 2003). “The implication for schools is that they risk identification
as failing schools based on the poor performance of students with disabilities” (Nagle et
al., 2006, p. 37).
Obama Changes to NCLB
With election of President Barack Obama new changes in NCLB are being
proposed. On Saturday, March 13, 2010, the Obama administration on called for a broad
overhaul of President George Bush’s No Child Left Behind law, proposing to reshape
divisive provisions that encouraged instructors to teach to tests, narrowed the curriculum,
and labeled one in three American schools as failing. The Obama plan seeks to achieve a
balance, retaining some key features of the Bush-era law, including its requirement for
annual reading and math tests, while proposing far-reaching changes (Dillon, 2010). The
administration would replace the law’s pass-fail school grading system with one that
would measure individual students’ academic growth and judge schools based not on test
scores alone, but also on indicators like pupil attendance, graduation rates and learning
climate. And while the proposal calls for more vigorous interventions in failing schools,
it would also reward top performers and lessen federal interference in tens of thousands

50
of reasonably well-run schools in the middle (Duncan, 2010). In addition, President
Obama would replace the law’s requirement that every American child reach proficiency
in reading and math with a new national target that could prove equally elusive: that all
students should graduate from high school prepared for college and a career (Duncan,
2010).
State Accountability: API in the State of California
Accountability in the state of California starts with State legislation’s Public
Schools Accountability Act (PSAA) of 1999 (Chapter 3, Statutes of 1999), established
the Academic Performance Index (API), which summarizes a school's or a local
educational agency's (LEA) academic performance and progress on statewide
assessments. (An LEA is a school district or county office of education.) The API also is
used as an additional indicator for federal Adequate Yearly Progress (AYP) requirements.
Growth in the API from 2008 to 2009
The 2008 Base API summarizes a school's, an LEA's, or the state's performance
on the Spring 2008 Standardized Testing and Reporting (STAR) Program and 2008
California High School Exit Examination (CAHSEE). It serves as the baseline score, or
starting point, of performance. The 2009 Growth API summarizes a school's, an LEA’s,
or the state's performance on the spring 2009 STAR Program and 2009 CAHSEE. It is
compared to the 2008 Base API to determine growth in the API from 2008 to 2009. The
2008 Base API is subtracted from the 2009 Growth API to determine how much the
school or LEA grew between 2008 and 2009 testing. This number is also referred to as
2008-09 API growth and is included in the 2009 Growth API Report (CDE, 2010).

51
Met 2008-09 API Growth Targets
Met API is for school reports only. This item showed whether the school met the
state API growth targets school-wide and met targets for all student subgroups. A "Yes"
means that the school met its 2008-09 API growth target, and a "No" means it did not. An
"N/A" means that the growth and growth target could not be determined because (1) the
school did not have a valid 2008 Base API, (2) the school had significant demographic
changes between testing years, or (3) the API was considered to be invalid for other
reasons or was not calculated due to missing data. LEA’s and ASAM schools do not have
growth targets and will not have these items on their reports (CDE, 2010).
Table 3
State PSAA Growth Target Requirements
School or Subgroup
2008 Base API 2008-09 Growth Target
200 – 690
5 percent of the difference between the Base API and
the statewide performance target of 800
691 – 795 gain of 5 points
796 gain of 4 points
797 gain of 3 points
798 gain of 2 points
799 gain of 1 point
800 or more must maintain an API of at least 800
Note: On the statewide Summary Report, the state's API was calculated in the
52
same way as the API for a school or an LEA except that the mobility exclusion does not
apply. All students taking the 2008 or 2009 assessments, therefore, are included in the
state's API, with the exception of English learners who have been enrolled in US schools
for less than a year. Table 2 bests illustrates the process what happens if a school or
district fails to meet or makes API growth targets based on the PSAA of 1999.
Federal Accountability: AYP in the State of California
The federal No Child Left Behind (NCLB) Act of 2001 required that California
determine whether or not each public school and local educational agency (LEA) is
making Adequate Yearly Progress (AYP). (An LEA is a school district or county office
of education.) The term “Made AYI” indicated whether a school, an LEA, or the state
made AYP for 2009. The possible values are "Yes" or "No." The report displayed a
"Yes" only if the school, LEA, or state met all of its AYP criteria for 2009, including
requirements for numerically significant subgroups. "No" means results for at least one or
more criteria were below the 2009 targets. “Met ___ of its ___ AYP” Criteria indicates
how many of the AYP criteria were met. Depending on the number of numerically
significant subgroups, a school, an LEA, or the state may be required to meet up to 46
AYP criteria (22 for participation rate, 22 for percent proficient, one for API, and one for
graduation rate) (CDE, 2010).
AYP criteria encompassed four areas: participation rate, percent proficient (also
referred to as Annual Measurable Objectives or AMOs), API as an additional indicator
for AYP, and graduation rate. Each of these four areas has specific requirements.
Participation rate and percent proficient criteria must be met in both English-language
53
arts (ELA) and in mathematics.
“Yes” in a column means that all criteria for the area were met. “No” in a column
means one or more criteria for the area were not met. “Yes by Appeal” in a column
means the school or LEA met the criteria based on approval of its appeal. If Graduation
Rate shows “N/A,” it means the school or LEA did not have students enrolled in grades
nine through twelve.
The participation rate for schools, LEA’s, the state, and numerically significant
subgroups is the rate at which students participated in the assessments used to determine
the percentage of students at or above the proficient level in ELA and mathematics. The
assessments used were the 2009 California Standards Tests (CSTs), grades two through
eight; 2009 California Modified Assessment (CMA), grades three through five; 2009
California Alternate Performance Assessment (CAPA), grades two through eight and ten;
and the 2009 California High School Exit Examination (CAHSEE), grade ten. The
participation rate target is 95 percent.
Schools, LEAs, the state, and numerically significant subgroups must meet
percent proficient targets (or AMOs) in ELA and mathematics on the assessments used in
AYP calculations. The assessments used were the 2009 CSTs, grades two through eight;
2009 CMA, grades three through five; 2009 CAPA, grades two through eight and ten;
and 2009 CAHSEE, grade ten.
The API is used to meet part of the federal AYP requirements under NCLB. A
school, an LEA, or the state must have a minimum API of 650 or have at least one point
growth in the API in addition to meeting the other federal AYP targets (participation rate,

54
percent proficient, and graduation rate) in order to make AYP for 2009. The federal API
requirements differ from the state API requirements.
The Graduation Rate calculation corresponds to the National Center for
Educational Statistics (NCES) four-year completion rate. This rate includes information
on high school graduates and high school dropouts aggregated over a four-year period.
To meet the 2009 graduation rate criteria for AYP, a school, an LEA, or the state must
have a graduation rate of at least 83.1 percent, or improvement in the graduation rate of at
least 0.1 from the previous year, or improvement in the graduation rate of at least 0.2 in
the average two year rate. Graduation rates are calculated and displayed on the 2009 AYP
Report with as few as one student in grades nine through twelve (CDE, 2010).
Accountability for Special Education Students in California Schools
Many states have adopted ways to measure performance and have established
their own accountability systems. It is important to note that State accountability systems
do not supersede the federal accountability measures of NCLB. In addition to federal
mandates of AYP, California schools must report their Annual Performance Index or
API. The API is a single number, ranging from a low of 200 to a high of 1000 that
reflects a school, and LEAs, or a subgroup’s performance level, based on the results of
statewide testing. Its purpose is to measure the academic performance and growth of
schools. The API was established by the PSAA, a landmark state law passed in 1999 that
created a new academic accountability system for K-12 public education in California.
The PSAA established an alternative accountability system for schools serving high-risk
students—the Alternative Schools Accountability Model (ASAM) (CDE, 2010).

55
The API is calculated by converting a student’s performance on statewide
assessments across multiple content areas into points on the API scale. These points are
then averaged across all students and all tests. The result is the API. An API is calculated
for schools, Local Education Agencies or LEAs, and for each numerically significant
subgroup of students at a school or an LEA. The key features of the API include the
following; (1) The API is based on an improvement model. It is used to measure the
academic growth of a school. The API from one year is compared to the API from the
prior year to measure improvement. Each school has an annual target, and all numerically
significant subgroups at a school also have targets; (2) The API requires subgroup
accountability to address the achievement gaps that exist between traditionally higher-
and lower-scoring student subgroups; (3) The API is a cross-sectional look at student
achievement. It does not track individual student progress across years but rather
compares snapshots of school or LEA level achievement results from one year to the
next; and (4) The API is used to rank schools. A school is compared to other schools
statewide and to 100 other schools that have similar demographic characteristics. The
API is currently a school-based requirement only under state law. However, API reports
are provided for LEA’s in order to meet federal requirements under NCLB.
California Modified Assessment or CMA
In April 2007, the US Department of Education (ED) enacted regulations for an
alternate assessment based on modified achievement standards. The CDE, in response to
the federal regulations, developed the CMA; an alternate assessment of the California
content standards based on modified achievement standards for students with an IEP who

56
meet the SBE adopted eligibility criteria. The purpose of the CMA is to allow students to
demonstrate achievement of the content standards in ELA, mathematics, and science
(CDE, 2010).
The CMA was administered statewide beginning in 2008 in grades three through
five in ELA and mathematics and grade five in science. In November 2008, the SBE
approved performance levels for the CMA in grades three through five. CMA results for
these grade levels are included in the API beginning with the 2008 Base API. As with
CAPA results in API reporting, the performance level the student received on the CMA
(far below basic, below basic, basic, proficient, or advanced) was the level that was
included in the API calculations. The addition of CMA into the API does not change the
API test weights, and the same test weights and calculation rules used for the CST also
apply to the CMA (CDE, 2010).
Research-Based Instructional Strategies
Finally, literature on some of the recent trends in the accountability movement
seem to be moving away from strict reliance of both formative and cumulative measures
of assessment to demonstrate to accountability for schools and LEAs. This section will
cover some examples of recent trends, presented first is what the currently literature
states on assessment. Finally, the section will end with what the research states are the
best approaches for organizational accountability for K-12 education.
Overwhelmingly, researchers in the field of education are encouraging teachers in
K-12 to as best practice to use both formative and summative assessments to support

57
instruction: assessment for learning rather than assessment of learning. Students must be
tested for many reasons. There are many noteworthy voices in the field regarding
assessment for example Christine Lyon, Marnie Thompson, and Dylan Williams. But the
heavy hitters in the Field are Doug Reeves, Andy Platt, Richard Clark, Fred Estes,
Richard Defour, Sue Tucker, and most notably Richard Marzano and his work on
classroom instruction that works. This section discusses what they recommend what best
practice is and how to best implement instruction in K-12 to prepare students for
assessment.
In the book Instructional Strategies that Work, Marzano, Pickering and Pollock
(2001) stated that after analyzing data from some 600,000 students and 60,000 teachers in
more than 4000 schools found in the Colman Report, he and his colleagues concluded
that the quality of schooling a student receives accounts for only about ten percent of the
variance in student achievement.
To understand what this means, consider the following example: Assume the
math achievement scores are analyzed for a group of 100 eighth-grade students from four
different schools. These students will no doubt vary greatly in their math achievement.
Some will have very low scores, some very high scores, and some in the middle. The
findings from the Coleman report indicated that only ten percent of these differences are
caused by the quality of the schools these 100 students attend. In other words, going to
the best of the four schools, will change only about ten percent of the differences in
student achievement.

58
A logical question was what influences the other 90 percent? Marzano et al.
(2001) wrote the Colman and his colleagues concluded that the vast majority of
differences in student achievement can be attributed to factors including the student’s
natural ability or aptitude, the socioeconomic status of the student, and the students home
environment. Unfortunately, these are all things that cannot be changed by schools.
Marzano et al. (2001) further stated that a more meaningful interpretation explains that
although schools account for ten percent of student achievement this translates into a
percentile gain of about 23 points. That is, the average student who attends a “good”
school will have a score that is 23 percentile points higher than the average student who
attends a poor school. From this perspective schools definitely can make a difference in
student achievement (Marzano et al., 2001). They found that the instructional strategies
that have a high probability of enhancing student achievement for all students in all
subjects’ areas at all grade levels are in Table 1.
As the work of Marzano et al. (2001) pointed out, there are high leverage
instructional strategies that every teacher should include as part of their lessons that
would improve student performance on high stakes summative testing or benchmark
informative testing. Obviously, such testing should be useful in guiding teaching. Many
schools formally test students at the end of a marking period—that is, every six to ten
weeks—but the information from on such tests is hard to use, for two reasons.
First, only a small amount of testing time can be allotted to each standard or skill
that is covered in the marking period. Consequently, the test is better for monitoring
overall levels of achievement than for diagnosing specific weaknesses.

59
Second, the information arrives too late to be useful. One can use the results to
make broad adjustments to curriculum, such as re-teaching or spending more time on a
unit, or identifying teachers who appear to be especially successful at teaching particular
units. But if educators are serious about using assessment to improve instruction, then
they need more fine-grained assessments, and we need to use the information they yield
to modify instruction as we teach (Leahy, 2008).
Transformational Practices
Another central figure in the field of education is Douglas Reeves. His research
was conducted at the Center for Performance Assessment on; 90/90/90 Schools – Schools
where more than 90 percent of the students are eligible for free and reduced lunch, a
commonly used surrogate for low-income families. More than 90 percent of the students
are from ethnic minorities. More than 90 percent of the students met or achieved high
academic standards, according to independently conducted tests of academic achievement
(Reeves, 2004). This research has been particularly instructive in the evaluation of the
use of standards and assessment. The research included four years of test data (1995
through 1998) with students in a variety of school settings, from elementary through high
school.
Analysis from Reeves’ (2004) work considered data from more than 130,000
students in 228 buildings. The school locations included inner-city urban schools,
suburban schools, and rural schools. The student populations ranged from schools whose

60
populations were overwhelmingly poor and/or minority to schools that were largely
Anglo and/or economically advantaged.
Dr. Reeves (Year) found that there were common characteristics of high
achievement school research on the 90/90/90 Schools, which included both site visits and
analyses of accountability data. The site visits allows the conduction of a categorical
analysis of instructional practices. In the same manner that the authors of In Search Of
Excellence identified, the common practices of excellent organizations sought to identify
the extent to which there was a common set of behaviors exhibited by leaders and
teachers in schools with high achievement, high minority enrollment, and high poverty
levels (Peters & Waterman, 1982). As a result, five characteristics were found to be
common to all 90/90/90 Schools.
1) A focus on academic achievement;
2) Clear curriculum choices;
3) Frequent assessment of student progress and multiple opportunities for
improvement;
4) An emphasis on nonfiction writing; and
5) Collaborative scoring of student work (Reeves, 2000).
Many of the high-poverty schools included students whose skills were
significantly below grade level in academic achievement as they entered the school. The
consistent message of the 90/90/90 Schools was that the penalty for poor performance is
not a low grade, followed by a forced march to the next unit. Rather, student performance
that is less than proficient is followed by multiple opportunities to improve performance.

61
Most of the schools conducted weekly assessments of student progress. It is important to
note that these assessments were not district or state tests, but were assessments
constructed and administered by classroom teachers. The consequence of students
performing badly was not an admonishment to “Wait until next year” but rather the
promise that “You can do better next week” (Reeves, 2004, p. 41). A frequent challenge
to this practice is that students should learn to “get it right the first time” (Reeves, 2004,
p. 41). The flaw in such a statement is the implied assumption that the traditional “one-
shot” (p. 41) assessment is successful in leading students to “get it right the first time”
(Reeves, 2004, p. 41). In fact, when students know that there are no additional
opportunities to succeed, they frequently take teacher feedback on their performance and
stuff it into desks, back packs, and wastebaskets. Students in this scenario are happy with
a “D” and unmotivated by an “F” (Reeves, 2000, p. 41). After all, there is nothing that
they can do about deficient performance anyway. In a classroom assessment scenario, in
which there are multiple opportunities to improve, however, the consequence for poor
performance is not a bad grade and discouragement, but more work, improved
performance, and respect for teacher feedback. In this respect, the use of teacher
evaluations based on assessment scoring guides looked much more like active coaching
after which improvement was required, and much less like final evaluation from which
there was no reprieve (Reeves, 2000).
Professional Learning Communities (PLCs)
Another significant figure on the issue of increasing student achievement is
Richard Dufour (2004) and his work on view schools as composites of “Professional

62
Learning Communities,” is renowned A professional learning community (PLC) is an
extended learning opportunity to collaborative learning among colleagues within a
particular work environment or field. It is often used in schools as a way to organize
teachers into working groups. “When a school or district functions as a PLC, educators
within the organization exists and the fundamental responsibility of those who work with
in it” (Dufour, 2004, p. 204). Dufour stated in order to achieve this purpose, the members
of a PLC create and are guided by a clear and the compelling vision of what the
organization must become in order to help all students learn. Members of a team make
collective commitments clarifying what each member will do to create such an
organization, and they use results-oriented goals to mark their progress. Members work
together to clarify exactly what each student must learn, monitor each student’s learning
on a timely basis, provide systematic interventions that ensure students receive additional
time and support for learning when they struggle, and extend and enrich learning when
students have already mastered the intended outcomes (Dufour, 2006).
Staff as a Community
A PLC is seen as an effective staff development team approach and a powerful
strategy for school change and possible improvement. The idea of community is crucial
to the success of PLCs. The PLC process should be a reflective process where both
individual and community growth is achieved. Among the team there should be a shared
vision of where they want the school to be. In his book The Fifth Discipline, Peter Senge
(1990) commented on shared vision and stated, “The practice of shared vision involves
the skills of unearthing shared ‘pictures of the future’ that foster genuine commitment

63
and enrollment rather than compliance. In mastering this discipline, leaders learn the
counter-productiveness of trying to dictate a vision, no matter how heartfelt” (p. 9).
Collaborative efforts may seem at first to be hard to organize and keep going, yet under
the PLC model of small groups working together within a larger group, the collaborative
teams can be organized as either academic, grade level, or any other sub group that works
well within the framework of what the PLC’s are hoping to accomplish (Norwood, 2007).
Empowerment
Through this commitment and creation of a shared vision the team, including
leaders and participants, becomes empowered to work together and achieve goals. PLCs
are not effective when the team is being told what to do and does not collaborate PLCs
must be a joint venture for it is true that, Top-down mandates and bottom-up energies
need each other (Fallen, 1999). This process involves sharing diverse ideas and making
compromises so that all members are satisfied with the direction in which the
organization is moving.
If schools are to be significantly more effective, they must break from the
industrial model upon which they were created and embrace a new model that
enables them to function as learning organizations. We prefer characterizing
learning organizations as ‘professional learning communities’ for several vital
reasons. While the term ‘organization’ suggests a partnership enhanced by
efficiency, expediency, and mutual interests, ‘community’ places greater
emphasis on relationships, shared ideals, and a strong culture – all factors that are
critical to school improvement. The challenge for educators is to create a

64
community of commitment – a professional learning community.” “It sounds
simple enough, but as the old adage warns, ‘the devil is in the details’. (Dufour,
2005, p. 2)
In an educational setting a PLC may contain people from multiple levels of the
organization who are collaboratively and continually working together for the betterment
of the organization. Peter Senge (2000) believed, “It is no longer sufficient to have one
person learning for the organization” (p. 38). The idea that there was one main decision
maker who controls the organization is not sufficient in today’s school; all people within
the community must work effectively towards common goals. A major principle of PLCs
was that people learn more together than if they were on their own. The idea of team
learning is an interesting concept that teachers work to promote in their classrooms but
often do not practice in their professional lives. Senge (2000) suggested that when teams
learn together there are beneficial results for the organization. It becomes the team, not
the individual that is viewed as the main learning unit. High-quality collaboration has
become no less than an imperative (Gajda, 2007).
Team learning builds upon personal mastery and shared vision. This involved
creating a snapshot of what is important to both individuals and the school community.
Although individuals are responsible for their own actions, feelings and opinions, it is the
common good of the community that guides decision making.
Barriers to Implementation
Many teachers and other educators often feel as if they are pawns in a larger game
of chess where school and district leaders place obstacles that can cause issues in

65
educators doing their job (Buffum & Hinman, 2006). Some of the barriers that were
presented and inhibited the development of PLCs, according to Riley and Stoll (2004),
included subject areas, due to the fact that some educational subjects tended to naturally
take precedence over others. Another obstacle is simply the physical layout of the school
(Buffum & Hinman, 2006).
In the book Turning Research into Results, Clark and Estes (2008) highlighted the
importance of closing organizational performance gaps. It is important to analyze their
work vis a vis No Child Left Behind implementation and the California Public Schools
Accountability Act of 1999 because both of the laws (at the federal and state levels) used
performance test to measure a school’s on district’s effectiveness.
Improving performance ‘The Active Ingredients’, includes an organization
focusing on increasing knowledge, skills, and motivation – and focusing these
assets on organizational goals that are based on performance. Organizations need
to be goal-driven, and currently most performance or work goal systems are not
tied to an organization’s business goals. (Clarke, 2002, p. 41).
The process for arriving at a remedy included setting specific performance goals,
measuring the gap between current achievement and desired performance goal levels, and
determine the cost-benefit of closing each gap, what is the cost of closing the knowledge
gap, motivational gap, and organizational gaps. Clark and Estes (2008) concluded that
the “Big Three” causes of performance gaps must be examined during the analysis
process. They are:
1) People’s knowledge and skills;
66
2) Their motivation to achieve the goal (particularly when compared with other
work goals they must also achieve)
3) Organizational barriers such as a lack of necessary equipment and missing or
inadequate work process (Clark & Estes, 2008, p. 43).
The purpose of individual and team gap analysis was to indentify whether all
employees had adequate knowledge, motivation, and organizational support to achieve
important work goals (Clark, 2002). Given this research, legislation academic reform
must not only look at student outcomes are standardized test but also process by which
Districts, schools, administrators, teachers, support staff , and students are including
analysis of performance on the “Big Three,” knowledge gaps, motivational gaps, and
organizational gaps. Finally Clark and Estes (2008) defined the “Big Three”, this way:
• Knowledge and Skills – In this gap, it is necessary to determine whether
people know how (when, what, why, where, and who) to achieve their
performance goals. Because people are often unaware of their own lack of
knowledge and skills or reluctant to disclose weaknesses, ask for their people.
• Motivation – Motivational causes of gaps are a bit more complex than
knowledge and skill causes simply because fewer performance specialists are
familiar with tem. Even though a significant amount of motivational research
is conducted in organizations rather than in laboratories, the results have not
yet been adequately communicated to people in work settings. In general,
motivation is the internal, psychological process that gets us going, keeps us
moving, and helps us get the job done (Clark & Estes, 2008).

67
• Organizational Barriers – Deal with largely resource levels. Problems such as
missing tools, inadequate facilities, or faulty processes or procedures prevent
or delay work. Often when motivation is ruled out some organizational barrier
may be the culprit (Clark & Estes, 2002).
The goal is for organizations to increase performance and the above gaps are
consistently worked through. This is critical to the sustainability of the organization to
meet or exceed performance targets.
The Value-Added Approach
One of the most contentious issues in accountability is how to report test results.
Some have suggested grouping together districts with similar socioeconomic and
demographic characteristics. However, this approach has been criticized out of fear that it
“lowers expectations or justifies exiting performance differences” (Cibulka & Derlin,
1995, p. 484). Some states have adopted value-added schemes, while others de-
emphasize comparisons by reporting information in alphabetical order. In recent years,
the concept of value-added accountability has become increasingly popular. Under this
system, schools compete with their own previous performance levels, rather than with
each other. This approach balances concerns for equity and excellence by benchmarking
performance on a school-by-school basis (Sergiovanni, Burlingame, Coombs & Thurston,
1999).
State Takeovers
Another trend in accountability is state authority to take over chronically low
performing school districts. According to Swanson and King (1997), “Policies enacted in

68
a number of states between 1983 and the mid 1990s authorized state education agencies
to assume district operations” (p. 246). Twenty-three states currently have mechanism for
state takeover of individual school or entire school districts (Hunter & Swann, 1999). In
some cases such as Chicago, local municipal government is given the power to run the
schools (Hunter & Swann, 1999).
In New Jersey, the state education department may dismiss and replace
democratically elected school bard, superintendent, or district administrators. Of course,
this assumed “that state-level officials can perform better than local officials” (Swanson
& King, 1997, p. 246), a policy assumption that is largely untested. State takeovers are
often based on the erroneous premise that schools are low performing because they are
poorly managed. So far, the results of state takeovers have been mixed. As Hunter and
Swann (1999) pointed out, state governments “often inherit difficult instructional
problems but lack the expertise to solve them” (p. 246).
Public School Choice
A major debate in education is raging over accountability in charter schools.
Thirty-eight states and the District of Columbia have passed charter school laws,
permitting school administrators, teachers, parents, or members of the community to
create their own publicly financed schools. The basic premise of the charter school
movement is that the bureaucratic nature of public education inhibits creativity and
innovation, preventing school professionals from meeting the needs of schoolchildren.
Thus, by freeing professionals from overly intrusive rules and regulations, we can create
more effective, responsive public schools (Cooper, 2004).

69
Weak Incentives
Another problem with currently with be federal legislation (NCLB of 2002) and
state legislation (PSAA and 1999) is incentives are weak in measuring the goal of
proficiency in Math and English Language Arts. To better explain this point this section
turns to the work of Author O’ Sullivan and Steven Sheffrin work on creating strong
incentives in economics. The study of economics in modern societies is mostly concerned
with remunerative incentives rather than moral or coercive incentives — not because the
latter two are unimportant, but rather because remunerative incentives are the main form
of incentives employed in the world of business, whereas moral and coercive incentives
are more characteristic of the sorts of decisions studied by political science and
sociology. It is the position of this researcher that therefore education legislation typically
falls under moral and coercive incentives and needs to be more remunerative. A classic
example of the economic analysis of incentive structures is the famous Walrasian Chart
of supply and demand curves. Economic theory predicts that the market will tend to
move towards the equilibrium price because everyone in the market has a remunerative
incentive to do so: by lowering a price formerly set above the equilibrium, a firm can
attract more customers and make more money; by raising a price formerly set below the
equilibrium, a customer is more able to obtain the good or service they want in the
quantity they desire.
A strong incentive is one that accomplishes the stated goal. If the goal is to
maximize production, then a strong incentive will be one that encourages workers to
produce goods at full capacity. A weak incentive is any incentive below this level.

70
Incentives help people to make the right decision, or the one one would like them
to make. In order to accomplish things to be done in economics they must give the
consumer or the producer incentives, without them, they would have no reason to do
what is asked of them. The same is true in education. Students, as well as teachers, need
to have stronger incentives for performance. By saying teachers can get fired and nothing
for the students being assessed is a weak incentive and currently there is no incentive
other than personally achievement on the STAR assessments. There is, however, for
CAHSEE.
When speaking of accountability and the types of academic accountability in
legislation, one must have strong incentives for the goals they are trying to reach. The
focus of debate, however, centers on what criteria should be used to hold charter schools
accountable to the public. Ostensibly, charter schools have a built-in accountability
mechanism – either they fulfill the terms of their charter or they face sanctions and
closure by the state. Manno, Finn and Vanourek (2000) referred to this as “accountability
via transparency” (p. 473). However, as Fusarelli and Crawford (2001) pointed out in
their introduction “Charter Schools and Accountability Puzzle”, accountability in charter
schools has multiple meanings and usages. According to the authors, accountability in
charter schools involves much more than answering a straightforward technical question
of whether student achievement improves or not. It is “inextricably tied to political,
social, and ethic questions of social justice and equal educational opportunity” (Fusarelli
& Crawford, 2001, p. 107).

71
At least five different types of accountability are found in charter schools
nationwide (to differing degrees, dependent on location): (1) market-based or consumer-
driven accountability (if consumers are not satisfied with the school’s product, the school
will close), (2) achievement-based (via meeting standards and improving test scores), (3)
professional-based (placing substantial control and responsibility means that politics,
political considerations, and pressure pervades all facets of the seemingly neutral,
objective language of accountability, suggesting that decisions as to whether to sanction
charter schools, close tem, renew (or not) their charters, or increase (or not) the number
of charter schools authorized by the state is based more on polities than on any objective
measures of accountability per se (Fusarelli & Crawford, 2001).
The type of accountability system utilized by a school district, state education
department, or federal agency has a significant effect on educational policy practice. For
example, Arizona Charter School policy disregards professional accountability. “There
are no procedures to ensure competence through teacher or charter school accreditation.
Arizona Charter School Legislation did not require either charter school teachers to have
any certification, such as a degree in education from an accredited school, or even a
college degree” (Garn, 2001, p. 589). In his study of accountability in charter schools in
Arizona, Garn (2001) found that “parental choice was the principal accountability
mechanism” (p. 592).
In closing, new research has emerged out the Rice University and the University
of Texas on the impact of the state of Texas, whose standardized, high-stakes test-based
accountability system became the model for the nation’s most comprehensive federal

72
education policy. What was found was that more than 135,000 youth are lost from the
state’s high schools every year. Dropout rates were highest for African American and
Latino youth, (more than 60% for the students that were followed). Findings from this
study, which included analysis of the accountability policy in operation in high-poverty
high schools in a major urban district, analysis of student-level data for more than
271,000 students in that district over a seven-year period under this policy, and extensive
ethnographic analysis of life in schools under the policy, show that the state’s high-stakes
accountability system has a direct impact on the severity of the dropout problem. The
study carried great significance for national education policy because its findings show
that disaggregation of student scores by race does not lead to greater equity, but in fact
puts the most vulnerable youth, the poor, the English language learners, and African
American and Latino children, at risk of being pushed out of their schools so the school
ratings can show “measurable improvement”. High-stakes, test-based accountability leads
not to equitable educational possibilities for youth, but to avoidable losses of these
students from our schools (McNeil, 2009).
Summary
In summary, Chapter 2 was designed to highlight the following: 1) Provide the
historical context in education legislation has evolved to the present day both from the
federal and state levels; 2) Establish what research states are best practices to improve
instruction: and 3), Highlight what research states are the best ways to impact
transformational change from the school, district, LEA, county, and state levels.

73
No matter the form of accountability, be it performance, resource, choice, or
standards-based, the K-12 accountability movement is here to stay. Unfortunately, much
of the accountability rhetoric tends to coalesce around the punitive aspects of
performance-based accountability, which in large measure comprises the No Child Left
Behind Act of 2002 NCLB which uses as its measure for quality control Adequate Yearly
Progress or AYP and State of California’s Public Schools Accountability Act or 1999
which mandates Annual Performance Index or API. Education reform in the United
States has a long tradition of achievement testing, use of objectives, and competency-
based education. It is clear that reform measures that are current in place at both the
federal and state level have served to loosen the mandating of inputs while tightening
state oversight of outputs. This focus leads to general preoccupation with managerial
efficiency in exchange for fewer inputs (Lankford & Wyckoff, 1996). Worse, is that
much of the movement lacks continuity around what constitutes proficiency from the
federal level. States are therefore left with defining what accountability means in their
own ways. Some like the State of California have elected to push the envelope by having
very rigorous standards and high Annual Measurable Objectives AMOs such as 350 is
proficiency in ELA and Math while states like Maryland and Colorado have selected very
low AMOs such as 250 is proficient ELA and Math. Nonetheless, current legislation fails
to ask why outcomes on high stakes testing over traditional measures speak more directly
to the multiple missions of schools throughout the country. Further, why are there no
mandated research-based instructional strategies that serve to transform organization
performance through the process of Professional Learning Communities?

74
There is an overwhelming amount of journal articles on researched based
instruction strategies, transforming organizations, and using data to drive the instructional
cycle. The Obama administration has recently made recommendation for amending
NCLB, some of which included: 1) value-added to assessment individual student
performance of ELA and Math; 2) more funding for K-14 which will mandate schools to
measure outcomes of student graduation rates and career readiness; and 3), the president
will replace language in the law that all students reach proficiency by 2014 in ELA and
Math. Sadly, however, they are not much in terms of mandating proven researched based
strategies against urban, suburban, and rural settings. Clearly, the pendulum is starting to
shift and currently, the significance of this policy analysis is the beginning change and
surely, California can redefine the current accountability to align itself with the research.

75
Chapter 3
METHODOLOGY
Introduction
Chapter 3 provided an explanation of the research methodology chosen to study
the impact of significant subgroups in the state of California making federal Adequate
Yearly Progress AYP and state Annual Performance Index API. A descriptive non-
experimental quantitative research design was used to address the research hypotheses for
this study. Existing datasets made up of the test scores from the 2007, 2008 and 2009
administrations of the STAR, CST, CAHSEE were used. The data was obtained from
California Department of Education office of Data and Statistics using EdData, the
database of students test data. The test data was analyzed using Descriptive Observational
Measurement with statistical measures of averages, both tabled and graphed in order to
determine differences in the performance of the students with disabilities receiving
special education and students in the general population of different subgroups on some
3,700,000 students and over 6000 schools throughout the state of California. The
mathematical formulas for calculating AYP and the absolute performance of selected
schools were also used to determine the impact on schools meeting adequate yearly
progress requirements when the disabled students and other 10 other significant
subgroups were considered.
76
Statement of the Problem
School districts are faced with severe challenges as the No Child Left Behind
legislation is implemented. The law must be followed as the educational needs of all
children are met. Prior practices of measuring the performance of schools, districts, and
students by including all students into one performance measure often-masked subgroup
indexes. Whether a student with a disability, African American, Hispanic, or of low
socio-economic status performance measures were not disaggregated, population
averages of the general student population were the standard before NCLB. This new
frame for school accountability on standardized testing presents issues for schools and
school districts. The requirement to incorporate students with disabilities into an AYP
model based on standardized testing presents uncomfortable issues for schools and school
districts.
The NCLB Act of 2001 asserts the goal of having all students proficient in
reading and mathematics by the end of the 2013-2014 school year. As Special Education
researcher, Candy Richburg (2007) suggested:
It is a formidable challenge for the typical students to attain that level of
achievement; however, NCLB legislation established the same achievement goal
for students including those with disabilities…the marriage of high standards and
accountability for student results has created a high stakes environment for all
schools and school districts throughout the United States. Including the
assessment data of the disabled students’ subgroup may have a tremendous
impact on the ability of schools or districts to meet AYP goals and receive

77
acceptable ratings in regards to accountability measures adopted by individual
states. (p. 43)
This policy analysis seeks to determine if AYP targets are too high and are
unrealistic for all students throughout the state of California. By using descriptive
statewide data the purpose of this study is to lay the foundation for educational reform in
California that will redefine proficiency targets in ELA and Mathematics to individual
subgroup growth rather the current system of AMO’s based on aggregate arbitrary
growth. Finally, to recommend that any legislation must be based on research based
instructional strategies. It is not known if the ability of a school or district to meet AYP is
affected by the presence of disabled student subgroup. This study will examine the
impact of including students with disabilities as a separate subgroup when calculating
adequate yearly progress as well as Annual Measurable Objects AMO ratings in the state
of California.
Research Questions:
The study was guided by the following four research questions:
1. Are student proficiency rates of ELA and Mathematics for significant
subgroups in California keeping with the pace of AYP targets? What is the
current pace?
2. What is the likelihood that significant subgroups will hit the 2014 AYP target
of all subgroups will be 100% proficient in ELA and Math based on current
trends?
78
3. What is the likelihood of schools that do not make AYP to go into Program
Improvement and what is the likelihood of schools once in PI to come out?
Research Design and Approach
Quantitative research was conducted on all student significant subgroups
throughout the state of California. Data was gathered from the Testing and
Accountability Section of the California Department of Education (CDE), the purpose for
gathering the data is to observe and describe the educational phenomena in a manner that
produces organized, statistical results. The research conducted was non-experimental
descriptive design; this approach involved collecting data without manipulating variables,
the non-experimental methods used in this research will include; historical research, and,
finally, observation and analysis of existing data sets found from the CDE office.
Research of this type is an essential area for educators “because there are so many
important but non-manipulative independent variables needing further study in the field
of education” (Johnson, 2001, p. 3). The researcher studies what has already occurred, or
what has happened naturally in order to quantify the results.
This study the researcher has provided an explanation using numerical data
analyzed by mathematical methods. Collection instruments such as standardized tests
were used to gather the quantitative data (Gall, Gall & Borg, 2003). The intent of the
researcher was to provide results that are an accurately representation of the groups being
studied. The existing data set was gathered from the California Standards Test and the
California High School Exit Exam for the years 2007, 2008 and 2009. The quantitative

79
data was analyzed by using an Excel spreadsheet that was calculated the mathematical
formula for determining AYP as outlined by NCLB. The mathematical formula was used
within the state of California was also be utilized with and without data from the disabled
students subgroup in order to explore research question three.
Population and Sampling
Three consecutive years of statewide descriptive data was collected from the
California Department of Education on school years 2007, 2008, and 2009 of more than
3,700,000 students. This sample size was selected based upon the varied demographic
representations such as socioeconomic status and special education population. The CST
scores of Grades 2 through 11, along with CAHSEE scores of tenth grade students, were
used with the scores of general education students compared to those students with the
disabled subgroup for the purpose of evaluating the difference in test performance. The
scores were then analyzed within the formula used to measure percent proficient in order
to determine the impact of student subgroup in relation to predetermined state AYP
Proficiency Targets. The descriptive research involved comparisons between groups
(SWDs, SES’, ELLs), and other ethnic subgroups, a major emphasis is often placed on
the significance level for the hypothesis that all groups are making progress just not at the
rate mandated by NCLB AYP. The data was then tabled and graphed for descriptive
observational value. A t-test was then run to determine if there are was correlation
between Program Improvement PI and proficiency Annual Measurable Objectives
(AMOs). Tabled data tended to clustered and demonstrate subgroup proficiency growth is
80
increased since 2007, however not at the rate to match State and Federal AMO targets.
There was a variability or spread of two to four percent depending on a particular
subgroup. The data of the CST and CAHSEE scores was then used to determine the
absolute performance ratings of high schools as determined by the State of California.
Sources of Information
STAR California Standards Test
The Standardized Testing and Reporting (STAR) Program measures performance
on the California Achievement Test, Sixth Edition Survey (CAT/6 Survey), the
California Content Standards Test and the Spanish Assessment of Basic Education
(SABE/2). The STAR Program is the cornerstone of the California Public Schools
Accountability Act of 1999 (PSAA). The primary goal of the PSAA is to help schools
improve the academic achievement of all students.
Each spring, California students in Grades 2 through 11 must take a series of tests
that comprise the state's STAR program. These must be completed 10 days before or after
85% of a school's year has passed.
The California Standards Tests (CST) is designed to match the state's rigorous
academic content standards for each grade. Grades 2 through 8 tests cover mathematics
and English/language arts (which includes writing in Grades 4 and 7). Grades 9 through
11 cover English/language arts, mathematics, and science. History-social science tests are
added for Grades 8, 10 and 11 as well as science for Grades 5 and 8. Except for writing,
all questions are multiple-choice.

81
California's school accountability system was originally based solely on scores
from the CAT/6. Through the Annual Performance Index (API), the scores drove the
allocation of millions of dollars in intervention and award programs, depending on the
health of the state’s budget.
APIs now include results primarily from the California Standards Tests plus
CAT/6. Results from the California High School Exit Exam (CAHSEE), taken by tenth
graders in the 2001-2002 school years are part of high school APIs. English/language arts
scores count for ten percent and math for five percent.
Student scores on the California Standardized Test (CST) were used to compare
general education students to students with disabilities in Grades 2 through 10. The CST
is a standardized test used to assess California students in grades two through eleven.
Scores from this test, given in the spring of each school year, are used by the state to
determine Adequate Yearly Progress (AYP) of schools. AYP is the indicator of
measurable progress mandated by No Child Left Behind. In order for a school to meet
AYP, each student subgroup represented in the school must meet the established AYP
targets. In addition to the indicator of AYP, the state of California has an established
performance indicator known as the Annual Performance Index (API) that measures the
standards of at least five percent school-wide growth annually, which is based on the
prior years’ performance scores, ranging from 1 to 1000.
The CST includes multiple-choice and constructed response questions depending
on which grade level includes English Language Arts, Mathematics, Science, and Social
Studies. The multiple-choice items provide students with several reasonable responses

82
from which to select and answer. The numbers of the multiple choice items included on a
test varies from by both subject and grade level.
Data Collection
Test scores from the 2007, 2008, and 2009 administrations of the STAR and the
CAHSEE for Grades 2 through 11 were utilized to conduct this study. The data was
gathered through the California State Superintendents Office to clarify the purpose of this
study. Data was obtained from the California Department of Education (2010) database.
This database provided information on State, County, and Districts and was the primary
data source. The process of preparing and collecting the data was done through a three
part data collection plan: (1) the pre-collection phase – identification of observational
cohort groups in this case significant subgroups in Title I school and LEA; (2) collection
phase- case identification of cohort proficiency rates by subgroup over a three year period
against independent (AYP target) and dependent variables (Subgroup actual targets); and
(3) presentation of findings – through dispersion, central tendency, and finally,
association. The purpose of the data collection was to obtain information to keep on
record and establish English Language Arts and Mathematics proficiency rates for
cohorts of students based over three separate years, to make decisions about the need to
adjust Annual Measurable Objective targets for the State of California, to pass
information on to state and federal policymakers for more realistic annual performance
targets as opposed to current targets of eleven percent a year. Finally, to demonstrate the
need for more researched based education legislation.

83
The formal data collection process in this case was the use of existing statewide
data banks it ensures that data gathered is both defined and accurate and that subsequent.
How proficiency rates were established is discussed in the previous section under source
of information to ensure that the findings were valid. The process provided both a
baseline (State Mandated Annual Targets – dependent variable) and from which to
measure actual performance targets (Subgroup cohort targets over three years).
Types of data collection descriptive/observation:
1. By cross sectional looking at relationships of central tendency, dispersion, and
association of subgroups proficiency rates in ELA and Math.
2. By longitudinal to establish subgroup performance trends and patterns to
project out regressively until 2014.
A sample survey data collection method was used of some 3,700,000 students,
Grades 2 through 11. Archival data for the students in this study will be obtained by the
researcher and will be gathered from the CDE test bank STAR and CAHSEE results. The
first step in data collection will be obtaining STAR and CAHSEE scores of all students in
grades two through ten at the participating schools. Scores will be listed for English/
language arts and Mathematics for the purpose of AYP calculation.
Data Analysis
Three focus areas discussed. They are in the form of the following questions.
1. Is there a relationship between Title I Schools in California and the likelihood
of moving into program improvement?

84
2. Are current standards of proficiency based on NCLB realistic to achieve by
the cut-off date of 2014?
3. Accountability ratings in the state of California when the scores of students
within the disabled students’ subgroup are counted and excluded, is there a
difference?
Three consecutive years of statewide descriptive data was collected from the
California Department of Education on school years 2007, 2008, 2009 of more than
3,700,000 students and was used in order to test research questions one through three.
Proficiency rates of ELA and Mathematics were found to have grown every year since
2007. Each subgroup grew an average of two to four percent, narrowing the achievement
gap among each subgroup. Further, statewide proficiency targets are growing on average
of ten percent each year. This rate was faster than the rate of student academic
performance causing AYP failure rates to increase. For the purpose of this study, all
subgroups were analyzed. The researcher determined if there was an impact on schools
meeting adequate yearly progress requirements when the disabled students’ subgroup
were considered as a separate subgroup or included within the “all students” designation.
The quantitative data was analyzed using an Excel spreadsheet, which calculated the
mathematical formula for determining AYP as outlined by NCLB.
Summary
According to the No Child Left Behind legislation all students will be proficient in
reading and mathematics by the end of the 2013 – 2014 school year. While this is a
85
laudable goal, this may an unrealistic expectation to expect all students to meet the same
standards and test score targets. Disabled students have learning disabilities that cause
them to be labeled as students with special needs. Because of these special needs students
in the disabled subgroup many not ever be able to achieve at the same level as regular
education students (Buchanan, 2004). This study utilizes the STAR scores and the
CAHSEE results in Grade 10 of high school students throughout the state of California.
The study explored the impact of the disabled student subgroup when accountability
systems ratings are assigned to individual schools. The results may illustrate the need for
precise regulations and direction for counting the special needs population in the
accountability process and more realistic targets for each significant subgroup.
86
Chapter 4
DATA COLLECTION AND ANAYLSIS
Introduction
The purpose of this study was to determine if there was a significant difference in
AYP targets and actual performance of significant subgroups within the state of
California and to determine if proficiency targets by the state of California in ELA and
Mathematics are unrealistically set. Quantitative data was gathered around four research
questions using ex-post descriptive data covering AYP proficiency rates for 2007, 2008,
and 2009 in ELA and Mathematics and finally Program Improvement rates using excel
tables. AYP target rates as they currently exist, were proven to be unrealistic and the pace
unattainable. It is recommended that California education legislation be amended in
realignment with proficiency targets based on the trend of growth for each subgroup and
researched based instructional strategies be included as one the 46 criteria used in
measuring Adequate Yearly Progress.
Description of Sample
Three consecutive years of statewide descriptive data was collected from the
California Department of Education for school years 2007, 2008 and 2009. In total, there
were approximately 3.7 million students, Grades 2 through 11 in more than 6000 schools.
Proficiency rates of English Language Arts and Mathematics were used. The areas
examined were growth patterns between subgroups starting with special education

87
students, English Language Learners, socio-economically disadvantaged and all
significant ethnic subgroups.
Research Tools
The research tools included the following:
1. Data collection instruments – California Department of Education statewide
data bank on AYP Proficiency Table of English and Mathematics for years
2007, 2008 and 2009.
2. Measures obtained are reported clearly, following standard procedures.
3. Adjustments or revisions to the use of standardized research instruments have
been justified and any effects on the interpretation of findings are clearly
described.
4. Both descriptive and inferential statistics were utilized to explore the research
questions in this study measuring central tendency, dispersion, and
association. The data are described in means, standard deviations, frequencies,
and percentages.
Research Questions
Chapter 4 is structured around the following research questions:
1. Are student proficiency rates of ELA and Mathematics for significant
subgroups in California keeping with the pace of AYP targets? What is the
current pace?

88
2. What is the likelihood that significant subgroups will hit the 2014 AYP target
of all subgroups will be 100% proficient in ELA and Math based on current
trends?
3. What is the likelihood of schools that do not make AYP to go into Program
Improvement and what is the likelihood of schools once in PI to come out?
Tables 5 through 7 represent ELA Longitudinal Proficiency rates of years 2007,
2008, and 2009. Tables 9 through 11 represent Math longitudinal proficiency rates of
years 2007, 2008, and 2009. Tables 12 through 15 represent the statewide rate of growth
findings for ELA and Math. Tables 17 through 18 represent the Statewide Growth of
School and Local Education Agencies LEAs Program Improvement findings.
Table 4 below is a description of the annual AMO targets set by the State of
California in English Language Arts up until 2014. It shows 100% proficiency for all
students. Again, the purpose this chart is to demonstrate what the state and federal
mandates are for schools and districts receiving Federal Title I. Schools and Districts that
do not make targeted growth are subject to Program Improvement placement and are
labeled consistently low achieving which would place them into Program Improvement.
Table 4
NCLB Annual Measurable Objectives for of English Language Arts
2001-2003
2004 - 2007
2007 - 2008
2008- 2009
2009-2010
2010-2011
2011-2012
2012-2013
2013-2014
13% 24.4% 35.2% 46% 56.8% 67.6% 78.4% 89.2% 100%

89
Table 5 provides a look at the proficiency performance of students statewide and
by subgroup in ELA for the year 2009. Statewide for 2009 there was average of 52%
proficient with a variance in proficiency rates depending on the subgroup represented.
Each column is represented by either, A, B, C, D or E. The control group is column (C);
(B) is the sample population; (D) represents that variance in proficiency; and (E)
Independent Variable.
The following tables are broken down by years starting from 2007 – 2009 for
English Language Arts. In the tables you will find proficiency rates:
Table 5
2009 AYP ELA Proficiency Data
2009 AYP ELA Target 45.0%
Groups (A) Valid Scores (B)
# at or above Proficient (C)
% Proficient (D)
Met 09 AYP
Criteria (E)
Statewide 3732251 1941740 52 Yes African American 282074 112041 39.7 No American Indian or Alaska Native 32167 14586 45.3 Yes Asian 318803 237922 74.6 Yes Filipino 107861 74437 69 Yes Hispanic or Latino 1868993 726698 38.9 No Pacific Islander 25015 12462 49.8 Yes White (not of Hispanic origin)
1057889 739404 69.9 Yes
Socioeconomically 2128903 816553 38.4 No

90
Disadvantaged English Learners 1295599 431503 33.3 No Students with Disabilities 417340 125089 30 No
The following includes research Questions 1 through 3 applied to Table 5:
1. Are student proficiency rates of ELA and Mathematics for significant
subgroups in California keeping with the pace of AYP targets? What is the
current pace? Based the above data proficiency rates are rising when observed
over a three year period, 2007, 2008 and 2009.
2. What is the likelihood that significant subgroups will hit the 2014 AYP target
of all subgroups will be 100% proficient in ELA and Math based on current
trends? Based on the data, proficiency rates are rising. Fifty-four percent of
significantly relevant subgroups made targets in 2009 while 45% of
significant subgroups did not make the targets 2009.
Table 6 provides a look at the proficiency performance of students statewide and
by subgroup in ELA for the year 2008. In 2008, there was a statewide average of 48%
while there was a cross sectional variance of proficiency rates depending on the
subgroup.
The control group is column (C); (B) is the sample population; (D) represents that
variance in proficiency; and (E) Independent Variable.

91
Table 6
2008 AYP Proficiency ELA
2008 AYP ELA Target 34.0%
Groups (A) Valid
Scores (B) # at or above Proficient (C)
% Proficient (D)
AYP Criteria (E)
Statewide 3746247 1805021 48.2 Yes African American/ Black (not of Hispanic origin) 286759 101658 35.5 Yes American Indian or Alaska Native
31016 13138 42.4 Yes
Asian 316403 227300 71.8 Yes Filipino 105419 69214 65.7 Yes Hispanic or Latino 1861377 644089 34.6 Yes Pacific Islander 24829 11399 45.9 Yes White (not of Hispanic origin) 1080491 715648 66.2 Yes Socioeconomically Disadvantaged 2083953 704665 33.8 No English Learners 1290289 374528 29 No Students with Disabilities
411575 99253 24.1 No
Research Questions 1 and 2 were applied to Table 6:
1. Are student proficiency rates of ELA and Mathematics for significant
subgroups in California keeping with the pace of AYP targets? What is the

92
current pace? Based the above data proficiency rates are rising when observed
over a three year period of 2007, 2008 and 2009.
2. What is the likelihood that significant subgroups will hit the 2014 AYP target
of all subgroups will be 100% proficient in ELA and Math based on current
trends? Based on the data, proficiency rates are rising. Seventy-two percent of
significantly relevant subgroups made targets in 2008 while 27% of
significant subgroups did not make the targets 2008.
Table 7 provides a look at the proficiency performance of students statewide and
by subgroup in ELA for the year 2007. Statewide for 2007 there was average of 45%
while there was cross sectional variance of proficiency rates depending on the subgroup.
The control group is column (C); (B) is the sample population; (D) represents that
variance in proficiency; and (E) Independent Variable.
Table 7
2007 AYP ELA Proficiency Data
2007 AYP ELA Target 23.0% Groups (A) Valid
Scores (B) # at or above Proficient (C)
% Proficient (D)
AYP Criteria (E)
Statewide 3751893 1705527 45.5 Yes
African American or Black (not of Hispanic origin)
291831 95307 32.7 Yes
American Indian or Alaska Native
31211 12673 40.6 Yes
Asian
312084 215179 68.9 Yes
Filipino 103247 65038 63 Yes

93
Hispanic or Latino 1841933 572416 31.1 Yes
Pacific Islander 24705 10722 43.4 Yes
White (not of Hispanic origin)
1110795 714547 64.3 Yes
Socioeconomically Disadvantaged
2058880 626268 30.4 Yes
English Learners 1281967 330613 25.8 Yes Students with Disabilities
400743 83150 20.7 No
Figure 1 2007 – 2012 ELA Growth Targets
The above graph depicts the subgroup performance rates in English Language
Arts against California State and federal Annual Measurable Objective (AMO) targets for
years 2007 through 2009. Again, State and Federal AMO targets increase at a rate of
eleven percent each year. While subgroup growth targets are increasing at a rate of two to

94
four percent annually. In 2007, ten of eleven subgroups were at or above proficiency
targets, while in 2009, the number of subgroups at above proficiency reduce to just five
to include Asian, White, Filipino, Pacific Islander, and Statewide. If one is to project out
using current growth patterns of subgroups in ELA, by the time 2014 no subgroup would
make the targets.
Research questions 1 through 2 (listed below) were applied to Table 7:
1. Are student proficiency rates of ELA and Mathematics for significant
subgroups in California keeping with the pace of AYP targets? What is the
current pace? Based the above data proficiency rates are rising when
observed over a 3-year period; 2007, 2008 and 2009.
2. What is the likelihood that significant subgroups will hit the 2014 AYP target
of all subgroups will be 100% proficient in ELA and Math based on current
trends? Based on the data, proficiency rates are rising. However, they are not
keeping with the pace set by the state and federal AYP standards. Ninety
percent of significantly relevant subgroups made targets in 2007, while nine
percent of significant subgroups did not make the targets 2007.
The chart below provides a visual independent variable AYP targets in
Mathematics from the start of NCLB legislation in 2001 of 12.8% and ends with 100%
proficiency in 2014. Again, the purpose this chart is to demonstrate what the state and
federal mandates for Title I School and Local Education Agencies must achieve annually
if they are not be labeled consistently low achieving which would place them into
Program Improvement.
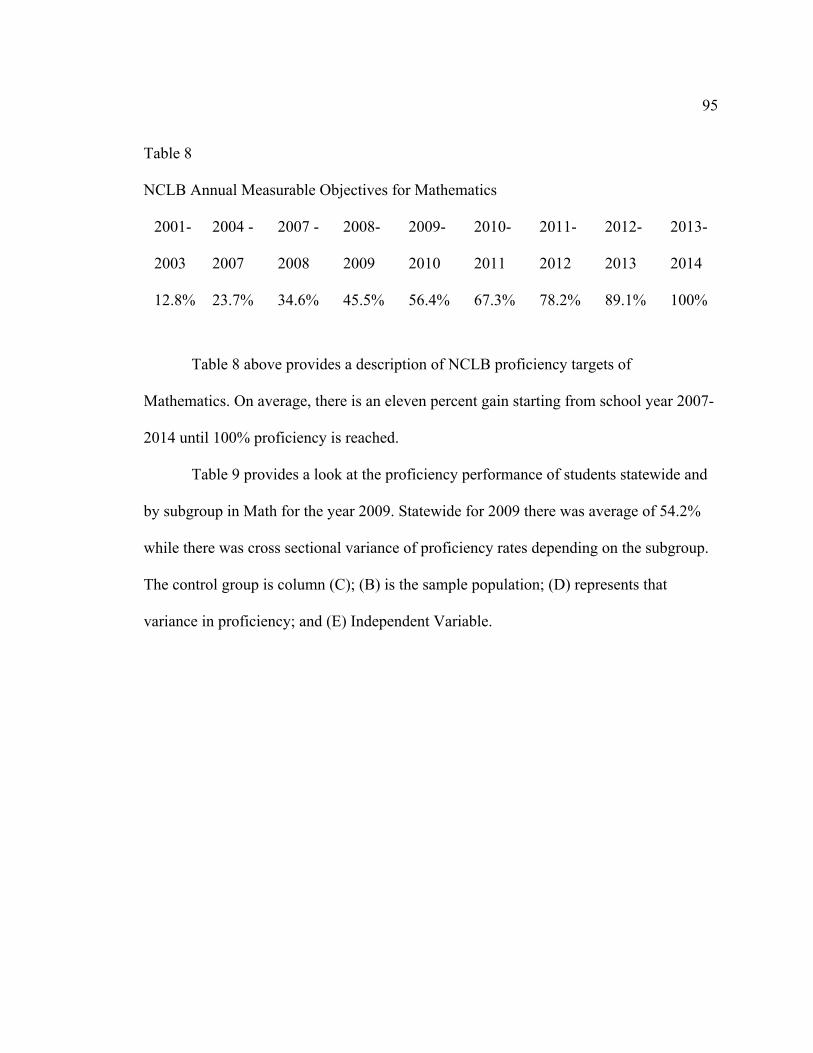
95
Table 8
NCLB Annual Measurable Objectives for Mathematics
2001-
2003
2004 -
2007
2007 -
2008
2008-
2009
2009-
2010
2010-
2011
2011-
2012
2012-
2013
2013-
2014
12.8% 23.7% 34.6% 45.5% 56.4% 67.3% 78.2% 89.1% 100%
Table 8 above provides a description of NCLB proficiency targets of
Mathematics. On average, there is an eleven percent gain starting from school year 2007-
2014 until 100% proficiency is reached.
Table 9 provides a look at the proficiency performance of students statewide and
by subgroup in Math for the year 2009. Statewide for 2009 there was average of 54.2%
while there was cross sectional variance of proficiency rates depending on the subgroup.
The control group is column (C); (B) is the sample population; (D) represents that
variance in proficiency; and (E) Independent Variable.
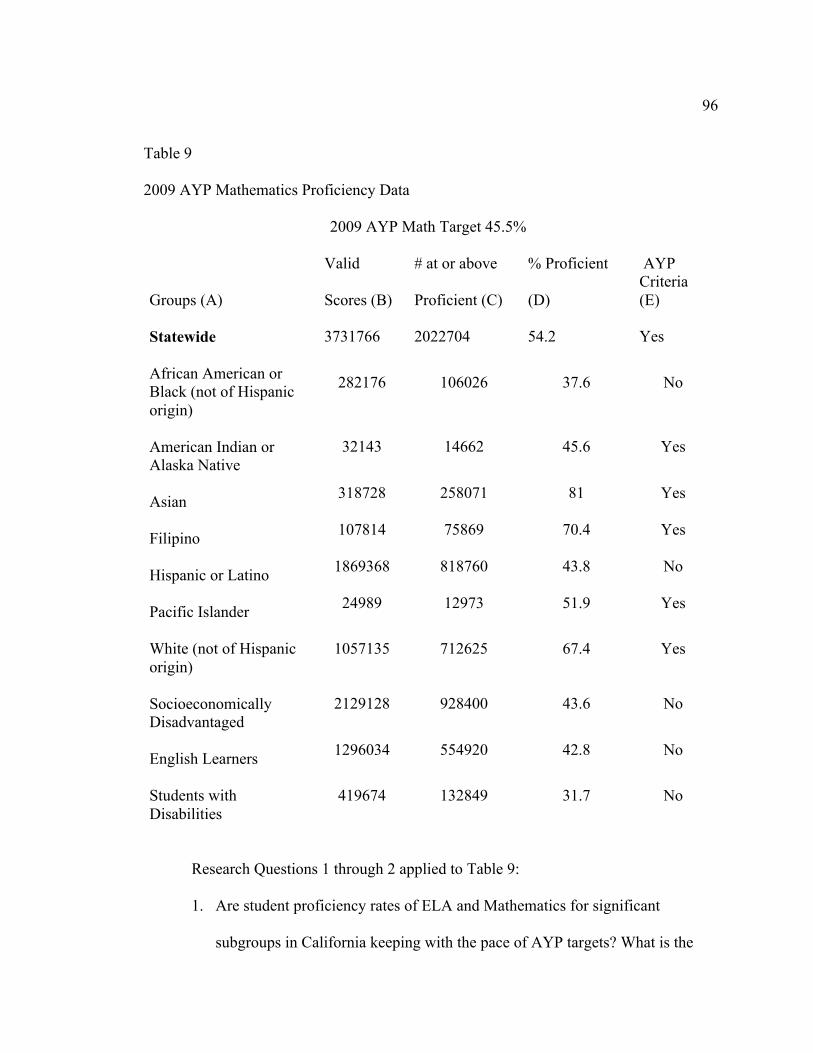
96
Table 9
2009 AYP Mathematics Proficiency Data
2009 AYP Math Target 45.5%
Groups (A)
Valid Scores (B)
# at or above Proficient (C)
% Proficient (D)
AYP Criteria (E)
Statewide 3731766 2022704 54.2 Yes African American or Black (not of Hispanic origin)
282176 106026 37.6 No
American Indian or Alaska Native
32143 14662 45.6 Yes
Asian 318728 258071 81 Yes
Filipino 107814 75869 70.4 Yes
Hispanic or Latino 1869368 818760 43.8 No
Pacific Islander 24989 12973 51.9 Yes
White (not of Hispanic origin)
1057135 712625 67.4 Yes
Socioeconomically Disadvantaged
2129128 928400 43.6 No
English Learners 1296034 554920 42.8 No
Students with Disabilities
419674 132849 31.7 No
Research Questions 1 through 2 applied to Table 9:
1. Are student proficiency rates of ELA and Mathematics for significant
subgroups in California keeping with the pace of AYP targets? What is the

97
current pace? Based the above data proficiency rates are rising when observed
over a three-year period; 2007, 2008 and 2009.
2. What is the likelihood that significant subgroups will hit the 2014 AYP target
of all subgroups will be 100% proficient in ELA and Math based on current
trends? Based on the data, proficiency rates are rising. Fifty-four percent of
significantly relevant subgroups made targets in 2009, while 45% of
significant subgroups did not make the targets in 2009.
Table 10 provides a look at the proficiency performance of students statewide and
by subgroup in Math for the year 2008. Statewide for 2008, there was an average of 51%
while there was a cross-sectional variance of proficiency rates depending on the
subgroup. The control group is column (C); (B) is the sample population; (D) represents
that variance in proficiency; and (E), Independent Variable.
Table 10
2008 AYP Mathematics Proficiency Data
2008 AYP Math Target 34.6%
Groups (A)
Valid Scores (B)
# at or above Proficient (C)
% Proficient (D)
AYP Criteria (E)
Statewide 3747807 1911904 51 Yes African American or Black (not of Hispanic origin)
287060 97601 34 No
American Indian or Alaska Native
31017 13181 42.5 Yes
Asian 316402 249458 78.8 Yes

98
Filipino 105404 71369 67.7 Yes Hispanic or Latino 1862940 745282 40 Yes Pacific Islander 24826 12222 49.2 Yes White (not of Hispanic origin)
1080264 700231 64.8 Yes
Socioeconomically Disadvantaged
2085565 827637 39.7 Yes
English Learners 1291671 498945 38.6 Yes Students with Disabilities
415963 114290 27.5 No
Research Questions 1- 2 applied to Table 10:
1. Are student proficiency rates of ELA and Mathematics for significant subgroups
in California keeping with the pace of AYP targets? What is the current pace?
Based on the above data proficiency rates are rising when observed over a three
year period; 2007, 2008 and 2009.
2. What is the likelihood that significant subgroups will hit the 2014 AYP target of
all subgroups will be 100% proficient in ELA and Math, based on current trends?
Base on the data proficiency rates are rising. In 2008 in Mathematics 81.8% of
significantly relevant subgroups made targets in 2008, while 18.1% of significant
subgroups did not make the 2008 targets.
Table 11 provides a look at the proficiency performance of students statewide and
by subgroup in Math for the year 2007. In 2007, there was a statewide average of 48.5%
while there was cross sectional variance of proficiency rates depending on the subgroup.
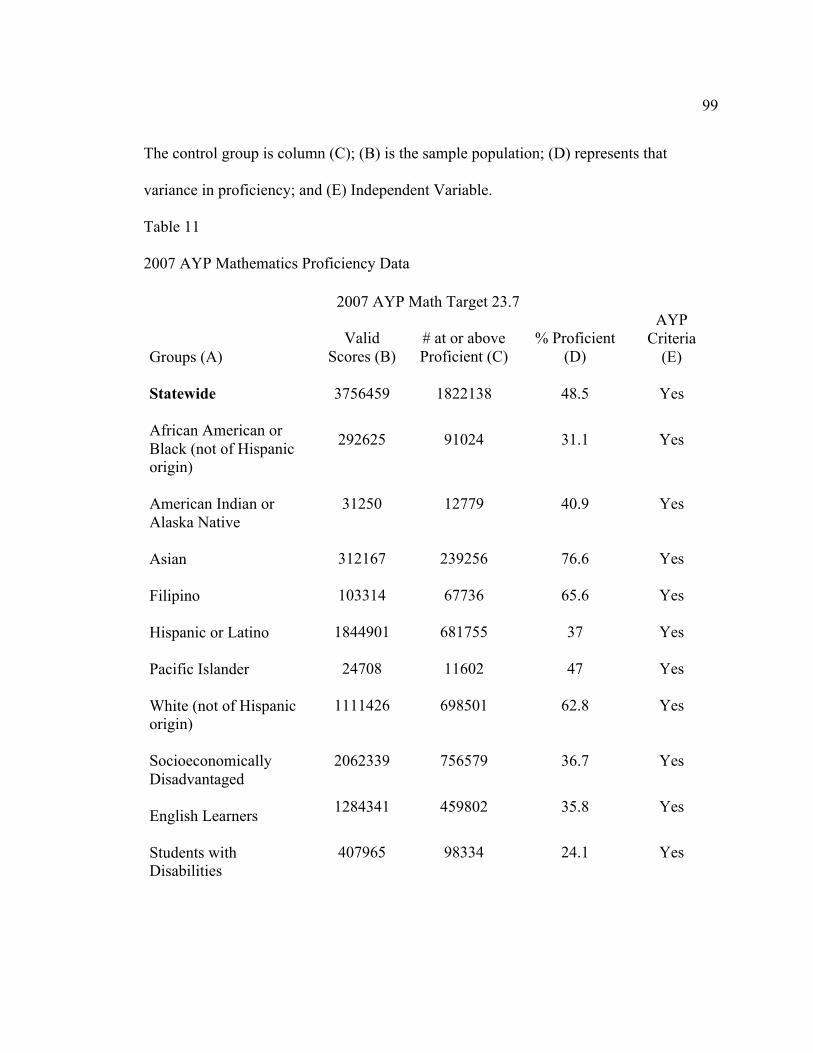
99
The control group is column (C); (B) is the sample population; (D) represents that
variance in proficiency; and (E) Independent Variable.
Table 11
2007 AYP Mathematics Proficiency Data
2007 AYP Math Target 23.7
Groups (A) Valid
Scores (B) # at or above Proficient (C)
% Proficient (D)
AYP Criteria
(E) Statewide 3756459 1822138 48.5 Yes African American or Black (not of Hispanic origin)
292625 91024 31.1 Yes
American Indian or Alaska Native
31250 12779 40.9 Yes
Asian 312167 239256 76.6 Yes Filipino 103314 67736 65.6 Yes Hispanic or Latino 1844901 681755 37 Yes Pacific Islander 24708 11602 47 Yes White (not of Hispanic origin)
1111426 698501 62.8 Yes
Socioeconomically Disadvantaged
2062339 756579 36.7 Yes
English Learners 1284341 459802 35.8 Yes
Students with Disabilities
407965 98334 24.1 Yes

100
Figure 2 2007 – 2012 Math Growth Targets
The above graph depicts the subgroup performance rates in Mathematics against
California State and federal Annual Measurable Objective (AMO) targets for years 2007
through 2009. Again, State and Federal AMO targets increase at a rate of eleven percent
each year, while subgroup growth targets are increasing at an annual rate of two to four
percent. In 2007, ten of the eleven subgroups were at or above proficiency targets while
in2009, the number of subgroups at above proficiency reduced to just five, to include
Asian, White, Filipino, Pacific Islander, and Statewide. If one is to project out using
current growth patterns of subgroups in ELA by the time 2014 no subgroup would make
the targets.
Research questions 1 and 2 for 2007 to 2009 Rate of Growth averages, include the
following:
• Are student proficiency rates of ELA and Mathematics for significant
subgroups in California keeping with the pace of AYP targets? What is the
current pace?

101
• What is the likelihood that significant subgroups will hit the 2014 AYP target
of all subgroups will be 100% proficient in ELA and Math based on current
trends?
Table 12 represents Rate of Growth findings in ELA statewide and by subgroup
for 2007, 2008 and 2009.
Table 12
Rate of Growth Averages for ELA 2007, 2008, 2009
2007-2009 AYP Rate of Growth & Average
Groups 2007 R.O.G. 2008 R.O.G. 2009 Average Increase
Statewide 45.5 2.7 48.2 3.8 52 3.25
African American 32.7 2.8 35.5 4.2 39.7 3.5
American Indian or Alaska Native 40.6 1.8 42.4 3.9 45.3 2.85 Asian 68.9
2.9 71.8 2.8 74.6 2.85
Filipino
63 2.7 65.7 3.3 69 3 Hispanic or Latino 31.1
3.5 34.6 4.3 38.9 3.9
Pacific Islander 43.4
2.5 45.9 3.9 49.8 3.2
White 64.3
1.9 66.2 3.7 69.9 2.8
SES 30.4
3.4 33.8 4.6 38.4 4
English Learners 25.8
3.2 29 4.3 33.3 3.75
SWD 20.7
3.4 24.1 5.9 30 4.65

102
Table 13 represents statewide Rate of Growth findings in Math and by subgroup
for 2007, 2008 and 2009.
Table 13
Rate of Growth Averages for Mathematics; 2007, 2008, 2009
2007-2009 AYP Rate of Growth & Average
Groups 2007 R.O.G. 2008 R.O.G. 2009 Average Increase Statewide 48.5 2.5 51 3.2 54.2 2.85
African American 31.1 2.9 34 3.6 37.6 3.25
American Indian or Alaska Native
40.9 1.6 42.5 3.1 45.6 2.35
Asian 76.6 2.2 78.8 2.2 81 2.2
Filipino 65.6 2.1 67.7 2.7 70.4 2.4
Hispanic or Latino 37 3 40 3.8 43.8 3.4
Pacific Islander 47 2.2 49.2 2.7 51.9 2.45
White 62.8 2 64.8 2.6 67.4 2.3
SES 36.7 3 39.7 6.9 43.6 4.95
English Learners 35.8 2.8 38.6 4.2 42.8 3.5
SWD 24.1 3.4 27.5 7.6 31.7 5.5
Research Question 3 asked what the likelihood of schools are, who do not make
AYP to go into Program Improvement and what is the likelihood of schools once in PI to
come out? In order for a school or LEA to qualify for PI status that school must qualify
and except Title I funds. So, 100% of schools that do not make AYP through hitting

103
proficiency targets will fall into PI. Once in PI, the likelihood of exiting PI in the year
2008-2009 is five percent, a 95% chance that they will remain or advance deeper into
years one through five. For 2009-2010, the likelihood of exiting PI is three percent,
therefore a 97% chance that one will remain or advance deeper into years one through
five, as evidenced by Tables 17 and 18.
Tables 14 and 15 represent school years 2008-2009 and 2009-2010. They present
findings of school and LEA falling into PI as a result of subgroup performance, which is
critical to answering the research question three as to what is the likelihood of schools
who go into PI to exit PI. The State of California only started keeping PI exit data starting
in 2008. Existing data banks were used for observation purposes. The data items
included:
• Year: Represents the level of Program Improvement (PI) implementation.
• Advance in PI: Represents the number of schools or Local Educational
Agencies (LEAs) that moved into PI or the number that moved from the prior
year of PI implementation.
• Remain in PI: Represents the number of schools or LEAs that did not change
the year of PI implementation from 2008-09 to 2009-10.
• Total in PI: Represents the number of schools or LEAs in PI and each year of
implementation, as well as, the number of schools or LEAs that advanced and
remained the same
• Exit PI: Represents the number of schools or LEAs that are no longer in PI.

104
Table 14
2008-09 Program Improvement (PI) Statewide Summary of Schools
Year Advance in PI Remain in PI Total in PI Exit PI
Year 1 264 49 313 61 e=19% Year 2 288 79 367 11 e=3%
Year 3 363 32 395 21 e=5%
Year 4 217 41 258 12 e=5%
Year 5 358 572 930 8 e=1%
Total 1490 773 2263 113 e=5%
Table 15
2009-10 Program Improvement (PI) Statewide Summary of Schools
Year Advance in PI Remain in PI Total in PI Exit PI
Year 1 689 65 754 22 e=3%
Year 2 210 95 305 24 e=8%
Year 3 231 92 323 12 e=4%
Year 4 274 56 330 11 e= 3%
Year 5 180 893 1073 10 e=1%
Total 1584 1201 2785 79 e= 3%
Below, the graph represents a direct 1:1 correlation between Actual AMO
Performance in ELA and Math statewide, NCLB AMO Targets, and Program
Improvement. There was a direct 1:1 correlation between the number of schools
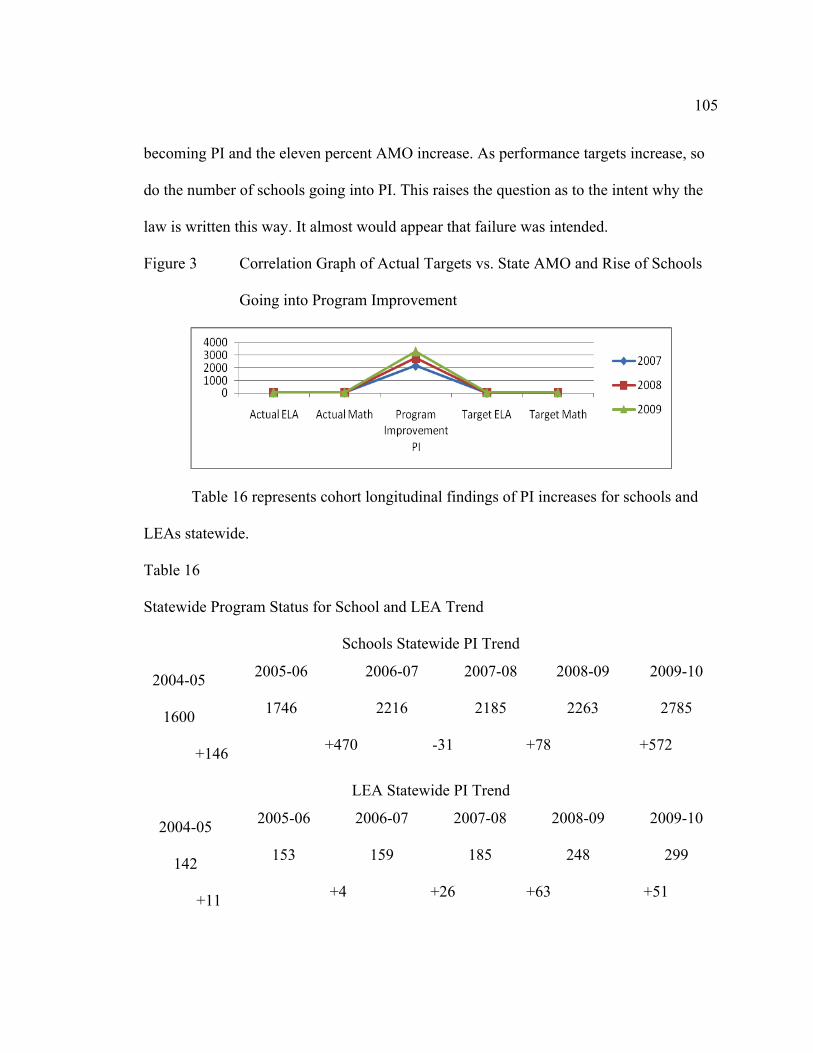
105
becoming PI and the eleven percent AMO increase. As performance targets increase, so
do the number of schools going into PI. This raises the question as to the intent why the
law is written this way. It almost would appear that failure was intended.
Figure 3 Correlation Graph of Actual Targets vs. State AMO and Rise of Schools
Going into Program Improvement
Table 16 represents cohort longitudinal findings of PI increases for schools and
LEAs statewide.
Table 16
Statewide Program Status for School and LEA Trend
Schools Statewide PI Trend
2004-05 2005-06 2006-07 2007-08 2008-09 2009-10
1600 1746 2216 2185 2263 2785
+146 +470 -31 +78 +572
LEA Statewide PI Trend
2004-05 2005-06 2006-07 2007-08 2008-09 2009-10
142 153 159 185 248 299
+11 +4 +26 +63 +51

106
As a result of graphed tables 1-16, there is direct correlation between State and
Federal AMO targets increasing and the number of school and LEAs going into Program
Improvement. Although Actual Performance has increased statewide so has the number
schools going into PI.
Figure 4 Correlation between the Rise in State AMO targets and the Increase of
LEAs going into Program Improvement
Summary
Chapter 4 analyzed the data in research questions one through one through three.
Chapter 5 further breaks down the findings by research questions. There was one
unexpected find, being 31 schools came out of PI as opposed to the years prior that had
and seen consistent increases since 2004-05 of school entering PI. Clearly, schools and
LEAs are having difficulty keeping up with a rapid growth of eleven percent set by the
state and federal government. Since 2005, the California Department of Education (CDE)
has reported accountability results under the Accountability Progress Reporting (APR)
107
system umbrella. Schools are able to view their results under both the state and federal
accountability systems. The Base API represents a recalibration of the API system that
occurs each spring. Also included with the 2007 Base API score are API growth targets
for the school and for every numerically significant subgroup at the school, the school's
statewide rank and its similar schools rank. Finally, Chapter 5 looks at results of the
chapter four date, conclusion and finally recommendations for that can be made to
improve currently education legislation in the state of California and next steps. Chapter
5 concludes with a reflection on the process of putting this work together.

108
Chapter 5
RESULTS, CONCLUSIONS AND RECOMMENDATIONS
Introduction
This research reviewed the impact of the disabled students’ subgroup on the
ability of a school to meet accountability requirements within the No Child Left Behind
legislation. What was found was that all significant subgroups are failing to maintain
pace with the annual measurable objectives set by federal and state mandates. There
were five research questions that were centered around three focus areas, (a) Is there a
relationship between Title I Schools in California and the likelihood of moving into
program improvement, (b) Are current standards of proficiency based on NCLB realistic
to achieve by the cut off date of 2014, and (c) Accountability ratings in the state of
California when the scores of students within the disabled students subgroup are counted
and excluded, is there a difference? These focus areas were addressed with a quantitative
research design utilizing existing datasets of information, along with mathematical
formulas for AYP and accountability rating calculation.
The chapter presents a synopsis for the purpose of the study, revisits methodology
used and analyzes the findings as they relate to the six research questions for the study.
The chapter concludes with a summary and recommendations for further research.

109
Purpose of the Study
The purpose of this study is to determine if student subgroups are growing at the
rate of proficiency mandated by the No Child Left Behind Act and to demonstrate the
likelihood of schools to exit Program Improvement (PI) once identified. Chapter 2
presents descriptions of federal and California education accountability legislation and
research on the best ways to improve academic performance and transformational
change. The purpose was to amend and transform currently legislative language to
include researched based practices, and eliminate current state Annual Measurable
Objectives of eleven percent to more realistic annual targets for significant subgroups for
Students with Disabilities, English Learners, SES, and others. Currently, education
legislation uses a “one size fits all approach”, the same measure for all manifested fails to
provide social justice thereby devaluing individual achievement by making unnatural
comparisons hence producing inequitable measures. This must change.
Methodology Review and Research Findings
A non-experimental descriptive quantitative research design was used to address
the research hypotheses for this study. Existing datasets made up of the test scores from
the 2007, 2008 and 2009 administrations of the California Standards Test or CST and
California High School Exit Examination or CAHSEE were used for Grades 2 through
11. The data was obtained from California Department of Education office of Data and
Statistics using EdData, the database of students test data. The test data was analyzed
using Descriptive Observational Measurement with three statistical measures of, central

110
tendency, dispersion, and association in order to determine differences in the
performance of the students with disabilities receiving special education and ten other
significant subgroups of some 370,000 students and over 6000 schools throughout the
state of California. The mathematical formulas for calculating AYP and the absolute
performance of selected schools were also used to determine the impact on schools
meeting adequate yearly progress requirements when the disabled students and other ten
other significant subgroups were considered. The research findings are organized and
presented in order by question.
Research Question 1
This question asked if student proficiency rates of ELA and Mathematics for
significant subgroups in California kept up with the pace of AYP targets, and what was
the current pace. Based on the data provided in Table 12, proficiency for English
Languages Arts for SWD has been rising consistently at an average rate of 4.63% over
the academic years of 2007, 2008, and 2009 from 20.7% in 2007 to 30 in 2009. The
problem, however, is that SWD students’ rate of growth is not pacing with the Mandates
of NCLB. Of eleven percent for example, 2007’s ELA target was 24.4%, 2008’s target
was 35.2, and 2009’s target was 46%. The impact however, is significant in that CST and
CAHSEE scores of the general education students were significantly higher than those of
the students with almost three times high for Asian students in comparison with SWD
students. However, when examining the central tendency of the SWD and other
significant subgroups student rate of growth was higher for example in ELA from 2007
and 2008, there was an increase in proficiency statewide of 3.4% and in 2008 and 2009,

111
there was an increase of 5.9 %, The same was true in math for 2007 and 2008 at 3.4%
and 2008 and 2009, 7.6% for SWD. Growth was realized by every subgroup, not just at
the eleven percent rate set by the state of California.
Research Question 2
The question asked what was the likelihood that significant subgroups will hit the
2014 AYP target of all subgroups, and will be 100% proficient in ELA and Math, based
on current trends. Based on the data provided in Tables 12 and 15, proficiency rates were
rising for each significant subgroup in both ELA and Math. Statewide ELA proficiency
rates increased and average of 3.25% per year from 2007-2009. ELA proficiency rates
increased for African American Students 3.5%, American Indian or Alaska Natives 2.85,
Asian 2.85%, Filipino three percent, Hispanic or Latino at four percent, Pacific Islander
3.25%, White 2.8%, SES four percent, and ELL at 3.75%. In Mathematics, statewide
proficiency rates increased with an average of 2.85% from 2007-2009, African American
3.25, American Indian or Alaska Native 2.35%, Asian 2.2%, Hispanic or Latino 3.4%,
Pacific Islander 2.45%, White 2.3%, SES 4.95%, and ELL 3.5%. The central tendency
was the same as SWD that there was annual growth in ELA and Math both statewide and
each subgroup of 2-5% will NCLB AYP targets grew at a rate of eleven percent per year.
The dispersion rates for both ELA and Math for all subgroups including SWD fell
between two and five percent with subgroups starting with the highest proficiency rates
(Asian and White students), averaging less growth than subgroups that start out with
lower proficiency experiencing higher growth rates on average. This leads to the
association that as AYP targets increase more and more subgroups will eventually fail to
112
meet mandated targets, causing more and more schools and districts to fall into Program
Improvement. There is less than a .5% chance that any subgroup will hit 100%
proficiency in ELA or Math.
Research Question 3
Question 3 asked what the likelihood was that schools do not make AYP in order
to go into Program Improvement, and what is the likelihood of schools once in PI to
come out. The likelihood of Title I schools in the State of California to go into Program
Improvement is 100% the likelihood that you will come out of PI in 2008 was five
percent with a 95% chance you would remain in PI. In 2009, the likelihood based on
Table 18 that a school would exit PI was three percent, while there was a 97% probability
that the school would remain in PI. Tables 15 through 17 demonstrated a central tendency
for LEA each year as the AYP targets move more and more LEAs are falling into PI as
evidenced in the 2004 there were 142 LEAs identified as PI while in 2009 there were 299
LEA identified as PI this is a difference of 157 newly identified LEAs with a zero exit
rate, this represents a 47% increase in just five years. This is also true for schools
statewide. The central tendency, with the exception of school year 2006 and 2007, has
been an increase of Title schools into PI from 1600 schools in 2004 to 2785 schools in
2009 this is a difference of 1,185 newly identified schools statewide who are now PI, this
represents a 57% increase in over five years. The summary of 2008-09 and 2009-10 PI
Results Schools are identified for PI if they miss AYP in the same content area (ELA or
mathematics) or for the same indicator (API or graduation rate) for two consecutive
years. Once identified for PI a school advances to the next year each time it misses AYP.

113
PI for schools is designed on a five-year timeline. Schools in Year 1 of PI must offer
students an option to attend a non-PI school in the same LEA with paid transportation.
Schools in Year 2 of PI must offer supplemental education services (SES) to eligible
students. There were 6,020 schools that received federal Title I funds in 2007-08. Of
those schools, 2,241 or 37.2% of those are in PI in the following years: Year 1 – 322,
Year 2 – 366, Year 3 – 387, Year 4 – 261, Year 5 – 905. The CDE and for first time
stated reporting the School and LEAs that exited PI starting in 2008-09 and 2009-10
schools.
Over 260 schools are being identified for PI for the first time in 2008-09 after
missing AYP in 2007 and 2008. In addition, 342 schools advanced to Year 5 of PI
(Tables 15 through 17). Schools exit from PI after making AYP for two consecutive
years. In 2008, 116 schools exited from PI after making AYP in 2007 and 2008. An LEA
(school district or county office of education) is identified for PI when, for each of two
consecutive years, it misses AYP in the same content area (ELA or mathematics) LEA-
wide or for any numerically significant subgroup, and does not meet AYP criteria in the
same content area in each grade span (Grades 2-5, Grades 6-8, Grade 10), or does not
make AYP on the same indicator (API or graduation rate) LEA-wide. PI for LEAs is on a
three-year timeline. In 2007-08, 931 LEAs received federal Title I funds. Of those LEAs,
242 or 26.0% were identified for PI for the 2008-09 school year in the following years:
Year 1 – 62, Year 2 – 35, Year 3 – 145.
Of the 62 LEAs in Year 1 of PI, 61 of them were first identified for PI in 2008-09.
Fifty of the previous fifty-two Year 2 PI LEAs advanced to Year 3 in 2008-09 and will

114
face action by the State Board of Education or SBE. In March 2008, the SBE required all
PI Year 3 LEAs to adopt and fully implement a new curriculum. Some of the Year 3
LEAs were also required to contract with a District Assistance and Intervention Team
(DAIT) to assist them in their improvement efforts. One LEA exited from PI after
making AYP for in 2007 and 2008. This has huge financial implications. If a school does
not make AYP Year 1, nothing happens. Table 17 below describes what would take place
in Year 2.
Table 17
Number of Years a School Does not Make AYP
Three School Improvement Year 1
Local Educational Agency (LEA):Provides technical assistance to PI school. Notifies parents of PI status of school and school choice. Sets aside minimum 5% for professional development to meet highly qualified staff requirements. Provides choice to attend another public school in the LEA that is not PI (LEA is responsible for transportation costs.) Establishes peer review process to review revised school plan School: Revises school plan within 3 months to cover 2-year period. Uses 10% of Title I school funds for staff professional development. Implements plan promptly
Four School Improvement Year 2
LEA continues: Technical assistance. Parent notification of PI status of school, school choice, supplemental services. Professional development. School choice. LEA adds: Supplemental educational services to all eligible students. School continues: Plan implementation .Professional development
Five Corrective Action Year 3
LEA continues: Technical assistance. Parent notification of PI status of school, school choice, supplemental services. Professional development. School choice. Supplemental services LEA adds: LEA identifies school for corrective action and does at least one of the following: Replaces school staff. Implements new curriculum. Decreases management authority at school level. Appoints outside expert. Extends school year or day. Restructures internal organizational structure of school. LEA informs parents and public of corrective action and allows comment. LEAs may provide direct technical assistance to school site councils in developing school plans. School continues: Professional development. Collaboration with district to improve student achievement

115
Six Restructuring Year 4
LEA continues: Technical assistance. Parent notification of PI status of school, school choice, supplemental services. Professional development. School choice. Supplemental services . LEA and School add: During Year 4, prepare plan for alternative governance of school. Select one of the following: Reopen school as a charter. Replace all or most staff including principal. Contract with outside entity to manage school. State takeover. Any other major restructuring. LEA provides notice to parents and teachers and allows comment. School continues: Professional development. Collaboration with district to improve student achievement
Seven Restructuring Year 5
LEA continues: Technical assistance. Parent notification of PI status of school, school choice, supplemental services. Professional development. School choice. Supplemental services. LEA and School add: Implement alternative governance plan developed in Year 4. School continues in PI, and LEA offers choice and supplemental services until school makes AYP for two consecutive years. School exits PI after two consecutive years of making AYP.
The state accountability system is an index model that measures improvement in
student achievement from one year to the next. Under the API system, schools are given
credit for improving the overall performance of their students. School growth targets are
set based upon the starting point of the school and are re-set each year depending on the
level of growth each school site shows.
The federal AYP system is often referred to as a "status" model because it
rewards schools for the percent of students the school has scoring at the proficient or
above level on state assessments. No matter where a school began, all schools are
expected to meet the same target.
Summary of 2008 AYP Results Statewide
Every LEA, school and subgroup in California is expected to achieve a 95%
participation rate on ELA and mathematics state assessments used to calculate AYP each

116
year. In addition, all LEAs, schools, and subgroups are expected to meet state targets for
the percentage of students scoring at or above the proficient level. Beginning in 2008,
these state targets increased annually by about eleven percentage points until 2013-14
when 100% of students are expected to be performing at or above the proficient level on
state assessments in both ELA and mathematics.
The participation rate and percent proficient calculations for elementary and
middle schools are based on the CSTs and the CAPA in ELA and mathematics and on the
CAHSEE and the CAPA for grade 10 students in ELA and mathematics for high schools.
The API is an additional AYP indicator for all schools; the graduation rate is only
applicable for schools with enrollment in grades nine through twelve.
In 2008, 52 percent of all schools made all their AYP targets, a decrease of 15
percentage points from 2007 and likely due to the increased AYP percent proficient
targets and the inability to offer flexibility to schools and LEAs that missed AYP only
because of the performance of the SWD group. This flexibility (i.e. the 20% credit) was
offered to schools and LEAs in ELA and mathematics in 2006 and in mathematics in
2007. The percentage of schools making their AYP targets differs by school type with
59% of elementary schools making their AYP targets; 34% of middle schools; and 48%
of high schools. Schools receiving Title I funds meet their AYP targets at a lower rate
than all schools, 44% versus 52%. In 2008, 39 percent of all LEAs made all their AYP
targets, a decrease of 15 percentage points from 2007.

117
Conclusions
In the world of education, increasing accountability tops the agendas of most
policymakers at the state, federal, and local levels. As Garn (2001) notes, “Few people
argue against increasing accountability in public education” (p. 577). Although much of
the research is talking about it, it is by no means clear what they mean when they do. In
the state of California is it clear for what purpose performance-based accountability are
solely used to measure schools and LEAs. Based on current NCLB legislation
presumably school personnel – teachers, administrators, or staff – are not doing their jobs
well or else student achievement would not be so poor. This type of accountability is
punitive, requiring school personnel to be closely watched and monitored (a mindset
based on decade-old assumptions about human nature, discussed by Douglas McGregor
[1960] in Theory X. Related to this purpose is market-based performance accountability
where staff is rewarded for demonstrable gains in student achievement.
Other forms of accountability in current NCLB and PSAA legislation include
standards-based accountability, a type of equity reform where all students are held to the
same standards as evidenced by current state subject frameworks; resource
accountability as evidenced by schools in the fifth year of Program Improvement a
system to ensure that funds are properly allocated and spent; and finally currently both
federal and state legislation in California uses choice-based accountability where schools
are held accountable through the decisions of parents as to which schools their children
will attend if the school is deemed consistently low performing.
Unfortunately, much of the current accountability rhetoric in education tends to
118
coalesce around the punitive aspects of performance-based accountability based on best
practices, and not researched based instructional strategies. As Newmann, King and
Rigdon (1997) noted, “Many politicians and policymakers today link school
accountability and school performance” (p. 41). This reflects in part, a general
preoccupation with managerial efficiency for the purpose of increasing output with less
and less emphasis on inputs.
Whether the results of research Questions 1 and 2 on the pace of significant
subgroups on annual performance targets in AYP or research question 3 on the increase
of California schools statewide moving into PI, the dominant way schools are measured
is through performance based outcomes on standardized testing of CAHSEE and CST of
English Language Arts and Mathematics.
Despite the political popularity of using current performance-based accountability
system in the State of California it is the conclusion of the researcher that the system is
not alignment with research in the following areas:
• Administrators are held accountable for variables not under direct control,
such as student achievement and attendance (187 articles found on Sac States
ERIC database on this topic) (Cibulka, 2001).
• Concerns have arisen about the validity of evaluation instruments and the
evaluation process itself (36 articles mainly concerning Race to the Top)
• Confusion around the role of purpose of testing in accountability assessment
systems (382 articles found on ERIC) (Smith & O’Day, 1991).
• Overreliance on tests fails to accurately or completely measure the varied
missions of schools (Cibulka, 2001).
• The argument that optimal performance results from threats and intimidation

119
is dubious (Reeves, 2004).
• Ambiguity of the terms success and accountability (Webber & Townsend,
2002).
• Encourages teachers to teach to the test, thereby narrowing the curriculum
(Linn, 2000).
Other criticisms of current practice of educational reform include: (1) the system
holds low and already high performing school, LEA, and subgroups with vastly different
needs and student populations, to the same standards; (2) it assumes a cause-effect
relationship exists between teacher and administrator performance and student
performance again the research on this inconclusive; (3) the system unfairly rewards
some teachers and administrators, while unfairly punishing others, using targets of an
eleven percent annual growth that not one subgroup has managed to attain sense the start
of the legislation, again a best practice strategy and not a research based strategy; and (4)
these flaws raise serious scientific and moral questions (Sergiovanni, Burlingame,
Coombs & Thurston, 2004).
Finally, there are three problems with current educational targets set by the State
of California with respect to NCLB AYP and state API: (1) Targets are ever increasing to
the year 2014 as evidenced in Tables 4 and 8; (2) Targets are unrealistic in that the eleven
percent annual growth is not in pacing with two to five percent dispersion data. There
needs to be alignment with subgroup growth trends based on the level of proficiency, for
example Asian students who are at 70% proficiency level should not be held to the same
growth rate of Students with Disabilities who are at 30% proficiency rate; the current
mandate that all students be held to the same annual targets flies in the face of mountains

120
of research on Differentiated Instruction, Culturally Responsive Teaching, and Value
Added Formative Assessment to guide instruction. (3) Annual Measurable Objectives
target of 350 proficiency for high school students needs to be norm referenced so that if
statewide average is 300 hundred then that should be proficient, rather than criterion
reference.
Currently, the State of Maryland uses such a target strategy this allows for more
students to reach proficiency against and within the norm. Maryland, by the way, leads
the country in proficiency rates. Although these suggestions would naturally fall under
recommendation, this researcher decided not to because they represent best practice and
not what the research suggests should be done. The problem with the current system of
accountability in the State of California is that it makes testing the issue, which is the
wrong output to measure. A better and more equitable approach would be to focus on
outputs of graduation rates, dropout rates, career certificated completion rates, or even
community college course completion, all of which speak and connect directly with the
multiple missions of K-12 education. More emphasis on inputs, policymakers need to use
the “if then” relationship of the Logic Model form education draft education law.
Imagine if legislation, inputs such as researched based instructional strategies of Marzano
et al. (2001), or researched based professional development of Professional Learning
Communities (PLCs) by Dufour, or Reeves’s Collective Accountability of that speak to
transforming K-12 and community college culture, or the strong incentives of Eric
Hanushek and his work on the relationship between school resources and student
outcomes, there no telling how far we’d go in the field of K-14 education. Any farmer

121
will tell you that measuring the weight of a pig will not feed it. The current system fails
the social justice test concentrating efforts on outputs i.e., proficiency rates in Reading
and Math as opposed to inputs (proven researched based instructional practices with
outcomes that have high intrinsic value).
Recommendations for Further Study
There were several prospective aspects for future research that emerged as this
study was completed. The recommendation is that quasi-experimental study be conducted
and that study use the program/planning of the Logic Model and be centered around the
four accountability lenses or dimensions found in Cooper, Fusrelli, and Randall’s book
titled “Better Policies Better Schools” four policy dimensions include: (1) Normative
Dimension of Policy, which considers the values of efficiency, effectiveness, and equity.
The recommendation in this area is that the current testing outcomes be realigned in ELA
and Math (proficiency for proficiency sake) to outcomes directly connected to mission of
K-12, industry based standards, and Community College A-G placement test. By doing
this, schools and LEAs would be judged on the efficiency, effectiveness, and equity of a
K-14 model that would value school outcomes that have high intrinsic value and high
market value. (2) Structural Dimension of Policy, which includes the governmental
arrangements, institutional structure, systems, and process that promulgate and support
policies in education. The recommendation is that legislation move away from the current
policy focus of NCLBs outcomes of Annual test of reading and Mathematics to
legislation that emphasizes inputs of researched based instructional strategies to systems

122
that institutionally shape and support K-14 education. An example of this would be the
work of Marzano et al. (2001) and researched based teacher professional development
and example of this would be Dufour’s work on Professional Learning Communities.
This would require a paradigm shift in current “Best Practice thinking” to “Researched
Based Thinking”. The state of California should recognize the importance of legislating
researched based instructional practice; (3) Constituentive Dimension of Policy –
includes use of networks, elites, masses, interest groups, ethnic/gender groups, providers
to participate in the policy making process. Currently legislation in NCLB requires LEAs,
districts, and schools to notify parents through school accountability reports cards for the
purposes of creating an informed public who would, presumably, pressure district
officials to improve low-performing schools. There is little evidence that this has
occurred (Cibulka, 2000). Those most likely to use performance reporting include those
parents already active in schools, the media, and not surprisingly, real estate agents eager
to make their properties more attractive (Cibulka, 2000). The recommendation is that
20% of in-kind private sector services or dollars must match federal and state Title I
funding. LEAs, Districts, and Schools would be required to develop business partners or
foundations that would contribute through a combination of the following; financially,
use of facilities, student job shadowing opportunities, career day speakers, internships,
scholarships, etc. The LEA, district, school would need to show that 20% of it’s overall
federal Title I and state Economic Impact Aid or EIA, would come from the private
sector; and finally (4) Technical Dimension of Policy – includes educational planning,
practice, implementation, and evaluation – the nuts and bolts of policymaking. New

123
systems of accountability are in development throughout the United States. According to
Derlin these new accountability systems have distinguishing characteristics: (1) a shift
from input (process) to output (performance) standards; (2) greater emphasis on what
students should know and be able to do; and (3) a push to link often-fragmented state
polices into a coherent framework (systemic accountability reform). These
aforementioned examples suggest that attention to the technical dimension of
accountability policy is crucial to the effective implementation and ultimate success of
reform strategy. Following are recommendations to ensure that California is successful in
this endeavor:
• A nationwide mission statement with the focus on college and career
readiness
• Traditional measures of student performance must be included into as part of a
school’s Annual Measurable Objective e.g., Attendance, Dropout Rates,
College transfer rates, ROP certification.
• Provide time for teacher planning and staff development
• Offer significant financial rewards to teachers and staff of schools that exceed
district and state performance goals (Hunter & Swann, 1999, pp. 247-248)
• New education legislation must be evaluated for; strength of research,
significance of effect, and magnitude of effect by state statisticians.
• Programs that are to receive funding must be evaluated for capacity to further
develop and bring to scale.
• Based on the Logic Model Local Education Agencies or (LEA), Districts,

124
Schools must include Researched based Instructional Strategies and
transformational organizational change as part of their strategic action plan.
The goal is to legislate professional development as part the yearly action
plan, in the development of an Instructional Cycle.
• Move to individual subgroup targets of performance rather than whole group
targets and have targets based on 85% proficiency cap for each subgroup that
schools will be rewarded for exceeding the cap. Academic growth targets
must be set no higher than two to five percent as base depending on the
subgroup. With statewide proficiency by 2025.
Summary
The No Child Left Behind legislation notably increased the federal role in public
education and has provided an unparalleled increase in federal resources to states in order
to improve low performing schools (National Conference of State Legislatures, 2005). In
return, more accountability is expected from LEAs and state school systems. Schools are
required to increase student testing, publicize test results by subgroup, and have a highly
qualified teacher in each classroom. AYP is to be measured for all students by examining
test results from a combined student population and also from the various subgroups of
students within that population. The scrutiny of each state on test performance is
envisioned to “reach down and differentiate student performance at the closest level
possible” (Ritter & Lucas, 2003, p. 56). The primary goal as made apparent from the title
of the legislation is to ensure that no child is left behind.

125
With the proposed changes to NCLB by the Obama administration now is the
time for states to create more equitable measures for student performance, and the results
of this study are important because they add to the body of literature regarding the
differences in standardized test achievement with respect to average growth rate patterns
between subgroups, including those of disabled students. The research because of its
timing is significant for legislators and policymakers to evaluate and decide the best ways
to produce transformational change that is balanced by social justice for LEA, Districts,
Schools, educators, and all significant student subgroups and their families. These groups
of stakeholders potentially have the power to create changes in No Child Left Behind
based on statistical data. This study also, when placed within a broader conceptual
framework, raises questions regarding the probability of NCLB achieving its main goal
of bringing all students to levels of proficiency in math and reading by the end of the
2013–2014 school year, for not only students receiving special education services but all
significant subgroups.
According to Townsend (2007), initial numbers indicated that at least one-fourth
of the schools in the nation failed to meet the requirements of No Child Left Behind. In
order for a school to meet AYP, every disaggregated subgroup, including the disabled
students subgroup, must meet the AYP target individually. The source of failure for many
schools is the failure of subgroups to meet standards. High numbers of schools have been
branded as not meeting AYP based solely on the performance of the subgroup of disabled
students and increasingly other significant subgroups (Schwartzbeck, 2003). In 2005, the
National Council of State Legislatures (NCSL) Task Force on NCLB provided

126
suggestions in order to improve the progress of students with disabilities. Those
proposals included giving IDEA primacy over IDEA, providing states flexibility in
determining the number of students tested at ability level versus grade level, having states
set starting points and projection paths for a larger number of students with disabilities,
and reevaluating the goal of 100% proficiency by 2014. NCLB places an important focus
on closing the achievement gap and improving educational opportunities for all students.
However, this body of work establishes that there needs to be a value added approach to
student performance relevant to each individual subgroup, that the 100% proficiency
mandate should be removed from legislation, and that standards of student achievement
should be based on researched based data with strength of effect, and magnitude of scale.
Finally, any legislative language that measures student academic achievement should be
based on an ongoing continuum that connects current K-12 performance assessments to
outcomes that are college and career ready and industry standards driven, rather than
simply ELA and Math.

127
Appendices

128
Appendix A
California Public Schools Accountability Flow Chart

129
California Public Schools Accountability Flow Chart

130
Appendix B
University of Wisconsin Logic Model Design

131
University of Wisconsin Logic Model Design

132
References
Allbritten, D., Mainzer, R. & Ziegler, D. (2004). Will students with disabilities be
scapegoats for school failures? Educational Horizons, 82(2), 153-160.
Brown v. Board of Education, 347, US (1954).
Bowen, S. K. & Rude, H. A. (2006, Summer). Assessment and students with disabilities:
Issues and challenges with educational reform. Rural Special Education
Quarterly. 25(3), 24-30.
Boyles, N. & Contadino, D. (1997). The learning differences sourcebook. Retrieved May
12, 2009, from Google Books Web site: http://books.google.com/.
Boyle, J. & Weishaar, M. (2001). Special education law with cases. Boston, MA: Allyn
& Bacon.
Bransford, J. D., et al. (2000). How people learn (Expanded Edition). Washington, DC:
National Academy of Sciences.
Brown, K. M. & Schainker, S. A. (2006). A diamond in the rough: Carat's organizational
and administrative leadership (COAL) Program. Journal of Cases in Educational
Leadership, 9(74), 74-83.
Buchannan, B. (January, 2004).Defining adequate yearly progress. An ASBJ Special
Report. American School Board Journal, 191, 10-13.
Buffum, A. & Hinman, C. (2006). Professional learning communities: reigniting passion
and purpose. Leadership, 35(5), 16-19.
California Department of Education [CDE]. (2010). The office of data and statistics.
Retrieved December 2009, from http://www.ca.cde.ca.gov.
133
Capper, C. A. (Unknown). Educational administration in a pluralistic society: A multi-
paradigm approach. EDD 608 Handout w/o Reference Information, 31-42.
Cibulka, J. G. (1997). Two eras of schooling: The decline of the old order and the
emergence of new organizational form. Education and Urban Society, 29(3), 317-
341.
Cibulka, J. G. & Derlin, R.L. (1995). State educational performance reporting policies in
the US: Accountability’s many faces. International Journal of Education
Research, 23(6), 479-492.
Clark, R. (2002). Turning research into results: A guide to selecting the right
performance solutions. Atlanta, GA: CEP Press.
Clark, R. & Estes, F. (2008). Turning research into results: A guide to selecting the right
performance solutions. Charlotte, NC: Information Age Publishers, Inc.
Cohen, M. (2002, February). Implementing Title I standards, assessments, and
Accountability: Lessons from the past, challenges for the future. Paper presented
for a conference sponsored by the Thomas B. Fordham Foundation. Retrieved
September 13, 2006, from http://www.edexcellence.net/doc/NCLBreport.pdf
Cooper, B. S. (2004). Better policies, better schools: Theories and applications. Saddle
River, NJ: Pearson Education, Inc.
Council for Exceptional Children. (2005). Resources on "highly qualified" requirements
for special educators. Arlington, VA: Council for Exceptional Children.
Crawford, J. R. (2001). Teacher autonomy and accountability in charter schools.
Education and Urban Society, 33(2), 186-200.
134
Darling-Hammond, L. (2006). Powerful teacher education: Lessons from exemplary
programs. San Francisco, CA: Jossey-Bass.
Davis, M. R. (2006, June 21). Ed. dept. to weigh NCLB subgroup issues: Official tells
House panel that no large numbers of scores go uncounted. Education Week.
25(41), 33-35.
DeFour, S. H. (2002). Education reform, high-stakes assessment, and students with
disabilities: One state. Remedial and Special Education. 23(4), 203-11.
DuFour, R. (2004). Schools as Learning Communities. Educational Leadership, 61(8), 6-
11.
Duncan-Andrade, J. (2007). Gangstas, wankstas, and ridas: Defining, developing and
supporting effective teachers in urban schools. International Journal of
Qualitative Studies in Education, 20(6), 617-638.
Egnor, D. (2003).Implications for special education policy and practice. Principal
Leadership. 3(7), 10-13.
Elementary and Secondary Education Act Amendment of 1965, PL 89-313, (1965).
Faircloth, S. C. (2004). Understanding the impact of US federal education policies on the
education of children and youth with disabilities. International Studies in
Educational Administration. 32(2), 32-46.
Fletcher, M. A. (2003). States worry new law sets schools up to fail. The Washington
Post, p.A01.
Fullan, M. (1999). Change forces: The sequel. New York: Falmer Press.

135
Fusarelli, L. D. (in press). Tightly coupled policy for loosely coupled systems:
Educational capacity and organizational change. Journal of Educational
Administration.
Fusarelli, L. D. & Crawford, J. R. (2001). Introduction: Education and the accountability
puzzle. Education and Urban Society, 33(2), 107-112.
Gajda, R. (2007). Evaluating the imperative of intraorganizational collaboration.
American Journal of Evaluation, 28(1), 26-44. Retrieved from
http://aje.sagepub.com/cgi/content/abstract/28/1/26.
Garn, G. A. (2001). Moving from bureaucratic to market accountability: The problem of
imperfect information. Educational Administration Quarterly, 37(4), 571-599.
Ginsberg, R. & Berry, B. (1998). The capability for enhancing accountability. Thousand
Oaks, CA: Corwin Press.
Goodman, D. J. (2000). Motivating people from privileged groups to support social
justice. Teachers College Record, 102(6), 1061-1085.
Gordon, S. (2006). Making sense of inclusion debate under IDEA. Brigham Young
University Education & Law Journal. 1, 189-225.
Hanushek, E. A. (February, 2003). The failure of input-based schooling policies.
Economic Journal, 113, F64-F98.
Heifetz, R. A. & Linsky, M. (2002). Leadership on the line: Staying alive through the
dangers of leading. Boston, MA: Harvard Business School Press.
Hess, F. M. & McGuinn, P. J. (2002). Seeking the mantle of "opportunity": Presidential
politics and the educational metaphor, 1964-2000. Educational Policy, 16(1), 72-

136
95.
Hess, F. & Petrilli, M. (2006). No child left behind primer. New York: Peter Lang
Publishing, Inc.
Holland, H. (2005). Essential information for education policy. Research Points, 3(1), 4.
Retrieved December 18, 2007, from AERA Web site: http://www.aera.net/
uploadedFiles/Journals_and_Publications/Research_Points/RPSummer05.pdf.
Hord, S. M. (1997). Professional Learning Communities: What are they and why are they
important? Issues about Change, 6(1).
Hunter, R. C. & Swann, J. (1999). Leadership turnover and business answerability.
Education and Urban Society, 31(2), 238-254.
Irons, E. J. & Harris, S. (2006). The challenges of no child left behind: Understanding the
issues of excellence, accountability, and choice. Lanham, MD: Rowman &
Littlefield Education.
Jackson, B. L. & Cibulka, J. G. (1991). Leadership turnover and business mobilization:
The changing political ecology of urban school systems: Journal of Education
Policy, 6(5), 71-86.
Jarrell, D. (2005). Five commonsense fixes for NCLB. American School Board Journal,
192(9), 66-67.
Johnson, B. (2001). Toward a new classification of non-experimental quantitative
research. Educational Researcher, 30(2), 3-13.
Katsiyannis, A., Yell, M. L. & Bradley, R. (2001). Reflections on the 25th anniversary of
the individuals with disabilities education act. Remedial and Special Education,

137
22(6), 324-334.
Kingdon, J. W. (1999). America the unusual. Boston, MA: Thompson Higher Education.
Kingdon, J. W. (2003). Agendas, alternatives, and public policies (2nd Ed.). New York:
Longman.
Kulh, G. D. (1994). Student learning outside the classroom: Transcending artificial
boundaries. Washington, DC: The George Washington University.
Lankford, H. & Wyckoff, J. (1996). The allocation of resources to special education and
regular education. In H. F. Ladd, Holding schools accountable: Performance-
based reform in education. Brookings Institution Press.
Linn, R. L. (2000). Assessments and accountability. Educational Researcher, 29(2), 4-16.
Lipman-Blumen, J. (1996). Connective leadership: Managing in a changing world.
Oxford, NY: Oxford University Press.
Manning, T. M. & Bostain, B. (2006). Using benchmark and assessment data to facilitate
institutional change. In New Directions for Community Colleges, (pp. 73-81).
Retrieved May 6, 2009, from Wiley Inter Science Web site: http://
www3.interscience.wiley.com/cgi-bin/fulltext/113374248/PDFSTART.
Manno, B., Finn, C. & Vanourek, G. (2000). Charter school accountability: Problems and
prospects. Educational Policy, 14(4), 473-493.
Marks, H. & Loius, K. (1999). Teacher empowerment and the capacity for organizational
learning. Educational Administration Quarterly, 35(5), 707-750.

138
Marsh, J. A., Pane, J. F. & Hamilton, L. S. (2006). Making sense of data-driven decision
making in education. Rand Education Occasional Paper. Retrieved October 3,
2007, from http://www.rand.org/pubs/occasionalpapers/2006/RAND_OP170.pdf.
Marzano, R. J., Pickering, D. J. & Pollock, J. E. (2001). Classroom instruction that
works: Research-based strategies for increasing student achievement. Alexandria,
VA: Association for Supervision and Curriculum Development.
Mazzoni, T. L. (1993). The changing politics of state education policymaking: A 20-year
Minnesota perspective. Education Evaluation and Policy Analysis, 15(4), 357-
359.
Mathis, W. J. (2004).NCLB and high-stakes accountability: A cure or a symptom of the
disease? Educational Horizons. 82(3), 143-152.
Munro, J. H. (2008a). Organizational leadership: Round table viewpoints. Dubuque, IA:
The McGraw-Hill Companies, Inc.
Munro, J. H. (2008b). Organizational leadership (1st Ed.). London: The McGraw-Hill
Companies, Inc.
Mills v. Board of Education of the District of Columbia, 348 F. Supp. 866 (D.D.C. 1972)
Ministry of Education. (2005). Education for all: The report of the expert panel on
literacy and numeracy instruction for students with special education needs,
kindergarten to grade 6. Retrieved November 16, 2006, from
http://www.edu.gov.on.ca/eng/document/reports/speced/panel/speced.pdf..
Nagle, K., Yunker, C. & Malmgren, K. W. (2006). Students with disabilities and
accountability reform: Challenges identified at the state and local levels. Journal

139
of Disability Policy Studies, 17(1), 28-39.
National Information Center for Children and Youth with Disabilities, [NICHCY].
(1996). News Digest 15: The education of children and youth with special needs:
What do the laws say? Washington, DC: Academy for Educational
Development.
National Center for Education Statistics [NCES]. (2007). National assessment of
educational progress: The nation’s report card. Retrieved November 16, 2009,
from http://nces.ed.gov/nationsreportcard/.
National Center on Educational Outcomes. (2003). Accountability for assessment results
in the no child left behind act: What it means for children with disabilities.
Retrieved July 11, 2006, from
http://education.umn.edu/NCEO/OnlinePubs/NCLBdisabilities.pdf.
National Conference of State Legislatures. (2005). Task force on no child left behind final
report. Washington, DC: National Conference of State Legislatures.
National Council on Disability. (n.d.). At a glance: National council on disability.
Washington, DC: National Council on Disability.
National Education Association [NEA]. (2004). IDEA and NCLB: Intersection of access
and outcomes. Washington, DC: National Education Association.
Newmann, F. M., King, M. B. & Rigdon, M. (1997). Accountability and school
performance: Implication from restructuring schools. Harvard Educational
Review 67(1), 41-74.
No Child Left Behind (NCLB). , 2002, § 6301 (3)).

140
Norwood, J. (2007). Professional Learning Communities to increase student
achievement. Essays in Education, 20, 33-4.
Office of Special Education and Rehabilitative Services. (1988). Summary of existing
legislation affecting persons with disabilities. Washington, DC: Clearinghouse on
Disability Information.
Olsen, L. (2002, April 3). Inadequate yearly gains are predicted. Education Week, 21(29),
1-4.
Ouston, J. (1998). The educational accountability of schools in England and Wales.
Education and international perspectives, (pp. 107-119). Thousand Oaks, CA:
Corwin Press.
Pennsylvania Association for Retarded Children v. Pennsylvania, 343 F. Supp. 279
(E.D. PA. 1972)
Peters, T. J. & Waterman, Jr., R. H. (1982). In search of excellence: Lessons from
America's best-run companies, New York, NY: Harper & Row
Pierce, J. (2003, September). Minimum size of subgroups for adequate yearly progress
(AYP). ECS State Notes: No Child Left Behind. Retrieved October 2, 2006, from
http://www.ecs.org/clearinghouse/49/76/4976.pdf.
Pipho, C. (1989). Accountability comes around again. Phi Delta Kappan, 70(9), 662-663.
Reeves, D. (2000). Accountability in action: A blueprint for learning organizations.
Denver, CO: Advanced Learning Press.
Reeves, D. (2002). Holistic accountability: Serving students, schools, and community.
Thousand Oaks, CA: Corwin Press.

141
Reeves, D. B. (2004). Accountability for learning: How teachers and school leaders can
take charge. Denver, CO: Advanced Learning Press.
Riddle, W. (2004). Adequate yearly progress: Implementation of the no child left behind
act. Washington, DC: Congressional Research Service.
Riley, K. & Stoll, L. (2004). Inside-out and outside-in: Why schools need to think about
communities in new ways. Education Review, 18(1), 34-41.
Rich, J. M. (Ed). (1978). Innovations in education: Reformers and their critics (2nd Ed.).
Boston, MA: Allyn & Bacon.
Rose, L. C. (Winter, 2004). No child left behind: The mathematics of guaranteed failure.
Educational Horizons, 82(3, 121-130.
Rothmann, R. (1995). Measuring up: Standards, assessments, and school reform. San
Francisco, CA: Jossey-Bass.
Samuels, C. A. (2005, April 18). Special education test flexibility detailed. Education
Weekly, 24(37), 22.
Scheurich, J. & Skrla, L. (2003). Leadership for equity and excellence. Thousand Oaks,
CA: Crown Press, Inc.
Schwartzbeck, D. (2003). The ins and outs of implementing NCLB. School
Administrator, 60(7), 47.
Schrag, J. A. (2003). No child left behind and its implications for students with
disabilities. The Special Edge, 16(2), 1, 10-12.
Secondary Education Act Amendments of 1965, Public Law 89-313.

142
Skrla, L. (2001). Toward a new consensus on high academic achievement for all children.
Education and Urban Society, 33(227), 227. Retrieved May 4, 2009, from SAGE
Social Science Collection Web site: http://eus.sagepub.com/cgi/reprint/33/3/227
Senge, P. (1990). The fifth discipline: The art and practice of the learning organization.
New York: Currency Doubleday.
Sergiovanni, T. J. Burlingame, M., Coombs, F. S. & Thurston, P. W. (1999). Educational
governance and administration (4th Ed.). Boston, MA: Allyn & Bacon.
Stephenson, E. (2006). Evading the no child left behind act: State strategies and federal
complicity. Brigham Young University Education & Law Journal, 1, 157-188.
Simpson, R. L., LaCava, P. G. & Graner, P. S. (2004). The no child left behind act:
Challenges and implications for educators. Intervention in School and Clinic, 40(2), 67-
75.
Sunderman, G. L., Kim, J. S. & Orfield, G. (2005). NCLB meets school realities:
Lessons from the field. Thousand Oaks, CA: Corwin Press.
Swanson, A. D. & King, R. A. (1997). School finance: Its economics and politics (2nd
Ed.). White Plains, NY: Longman.
Townsend, N. L. (2007). Framing a ceiling as a floor: The changing definition of learning
disabilities and the conflicting trends in legislation affecting learning disabled
students. Creighton Law Review, 40(2), 229-270.
Turnbull, H. R. & Turnbull, A. P. (2000). Free appropriate public education: The law
and children with disabilities (6th Ed.). Denver, CO: Love Publishing Company.

143
The Wallace Foundation. (2008, June). Becoming a leader: Preparing principals for
today's schools. In N/A (Ed.), Educational Leadership (Perspective). Retrieved
May 4, 2009, from The Wallace Foundation Web site: http://
www.wallacefoundation.org/
Thompson, S., Gregg, L. & Niska, J. (2004). Professional Learning Communities;
Leadership, and student learning. Research in Middle Level Education, 28(1), 35-
54.
US Department of Education. (2004). A guide to education and no child left behind.
Jessup, MD: Education Publications Center.
VanDerLinden, K. E. (2005). Learning to play the game: Professional development and
mentoring. Community College Journal of Research and Practice, 29, 729-743.
Retrieved December 18, 2007, from ERIC Web site: www.eric.ed.gov.
Webb, L. D. & Norton, M. S. (2009). Human resources administration (5th Ed.). Upper
Saddle River, NJ: Pearson Education, Inc. (Original work published 1987)
Yell, M. Y., Katsiyannas, A. & Shiner, J. G. (2006). The no child left behind act,
adequate yearly progress, and students with disabilities. Teaching Exceptional
Children, 38(4), 32-39.
Yukl, G. (2006). Leadership in organizations (6th Ed.). Upper Saddle River, NJ: Pearson
Education, Inc.
Zepeda, S. J. (2008). Professional development: What works? Larchmont, NY: Eye on
Education.