springfield public schools adequate yearly progress 2010 overview
TRANSCRIPT

Springfield Public Schools
Adequate Yearly Progress 2010 Overview

Opening Remarks
Teresa BledsoeManager,
Community Relations

Overview of AYP
Matt GoodmanDirector,
Quality Improvement & Accountability

What is AYP?
• NCLB of 2001 requires all schools, districts and states to show that students are making adequate yearly progress (AYP).
• NCLB requires states to establish targets in the following ways:– Annual Proficiency Target resulting in all
students to score at/above proficient by 2014.– Attendance/Graduation Rates resulting in
an additional indicator.– Participation Rates requiring all students
and student subgroups to meet a 95% participation rate.
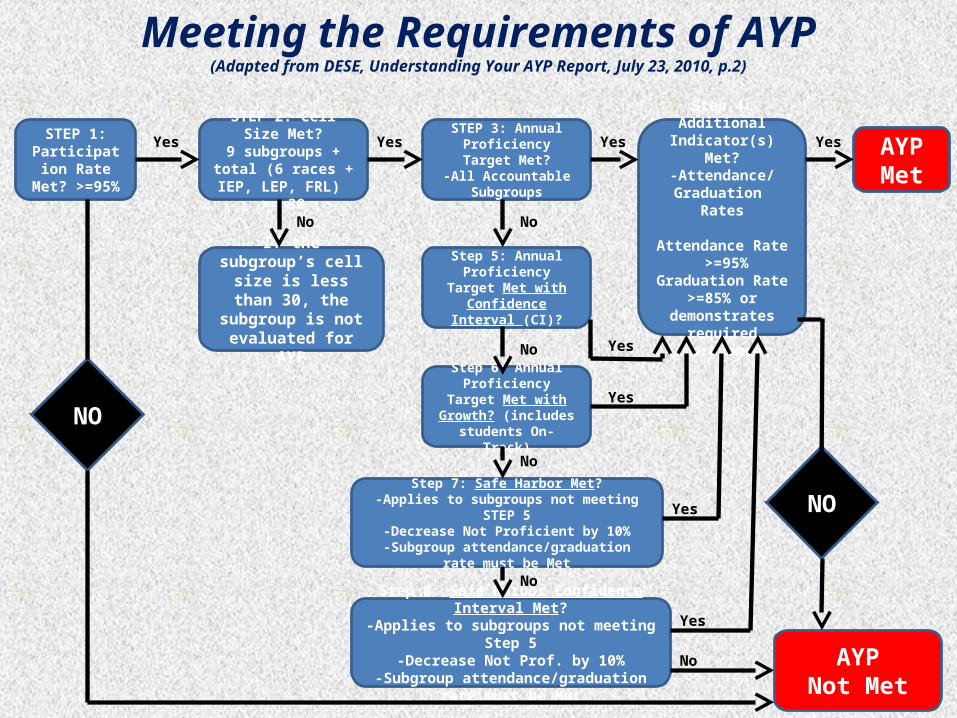
Meeting the Requirements of AYP(Adapted from DESE, Understanding Your AYP Report, July 23, 2010, p.2)
STEP 1:Participation
Rate Met? >=95%
STEP 3: Annual Proficiency Target Met?
-All Accountable Subgroups
STEP 2: Cell Size Met?9 subgroups + total (6 races + IEP, LEP, FRL)
>= 30
Step 4: Additional Indicator(s) Met?
-Attendance/ Graduation Rates
Attendance Rate >=95%
Graduation Rate >=85% or
demonstrates required
improvement
AYP Met
If the subgroup’s cell size is less than 30, the
subgroup is not evaluated for AYP
Step 5: Annual Proficiency Target Met
with Confidence Interval (CI)?
Step 6: Annual Proficiency Target Met with Growth? (includes
students On-Track)
Step 7: Safe Harbor Met?-Applies to subgroups not meeting STEP 5
-Decrease Not Proficient by 10%-Subgroup attendance/graduation rate must be
Met
Step 8: Safe Harbor Confidence Interval Met?-Applies to subgroups not meeting Step 5
-Decrease Not Prof. by 10%-Subgroup attendance/graduation rate must be
MetAYP
Not Met
NO
NO
Yes Yes Yes Yes
No No
No
No
No
No
Yes
Yes
Yes
Yes

Subgroup Categories
1.Total2.Asian/Pacific Islander3.Black4.Hispanic5.American Indian6.White7.Free/Reduced Lunch 8.Individualized Education Plan (IEP)9.Limited English Proficiency (LEP)
To be held accountable for subgroup performance, a subgroup must contain at least 30 students. At the district level, Springfield is accountable for all nine subgroups. Building accountability depends on the cell size of each subgroup.
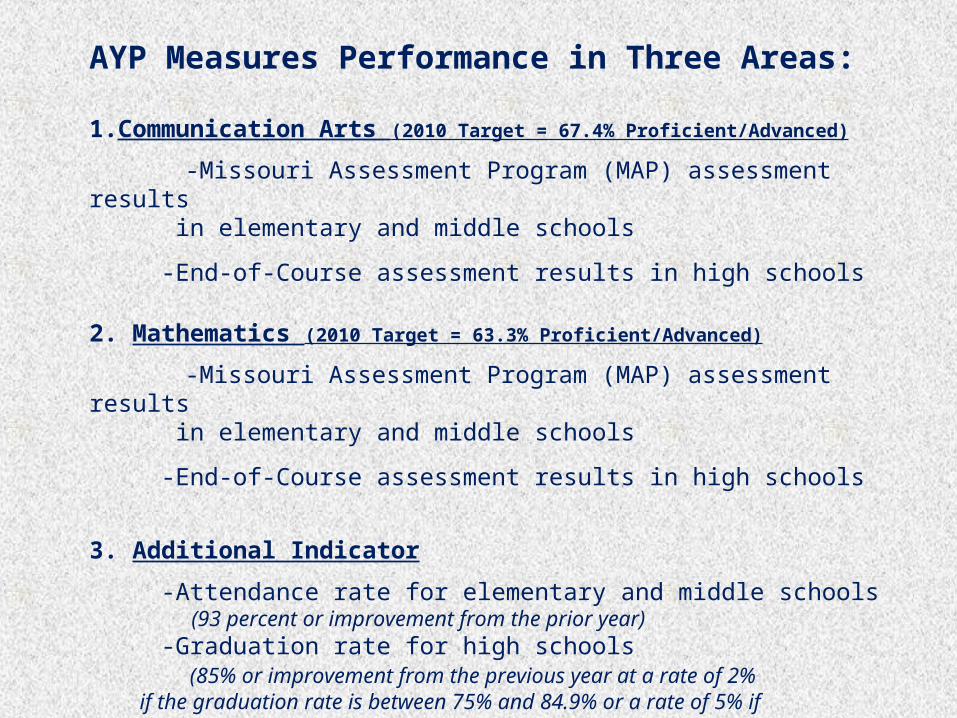
AYP Measures Performance in Three Areas:
1.Communication Arts (2010 Target = 67.4% Proficient/Advanced)
-Missouri Assessment Program (MAP) assessment results in elementary and middle schools
-End-of-Course assessment results in high schools
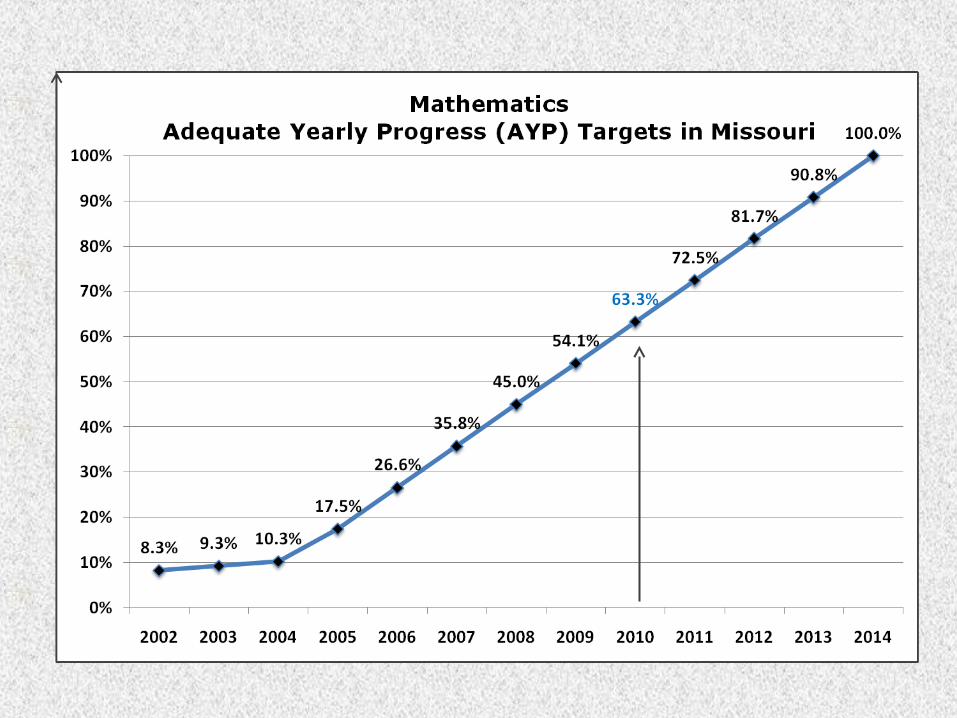
2. Mathematics (2010 Target = 63.3% Proficient/Advanced)
-Missouri Assessment Program (MAP) assessment results in elementary and middle schools
-End-of-Course assessment results in high schools
3. Additional Indicator
-Attendance rate for elementary and middle schools (93 percent or improvement from the prior year) -Graduation rate for high schools (85% or improvement from the previous year at a rate of 2% if the graduation rate is between 75% and 84.9% or a rate of 5% if the graduation rate is below 74.9%)


Confidence Interval
The confidence interval calculation is not a requirement of NCLB. However, the Missouri Department of Elementary and Secondary Education (DESE) uses a confidence interval in order to account for the error inherent in making AYP classifications (“met, not met”) that are based on a targeted percentage of students who must attain proficiency. The use of confidence intervals increases the reliability of these classifications.

Growth Model
•Beginning in 2008, Missouri implemented a growth model to determine AYP.
•The Growth Model provides an opportunity for schools and districts to meet AYP by receiving credit for students who demonstrate improvement over time.
•Student growth targets are established using the student’s first MAP or MAP A baseline. Individual student growth targets determine if each student is “On Track to be Proficient” within four years or by grade 8.
•Students who are “On Track” are added to the students who are Proficient in determining if the AYP Proficiency target is met.

Safe Harbor
NCLB includes a safe harbor provision. If a subgroup of students in a school falls short of the AYP target, a district or building can still meet AYP if the percentage of students who score below the proficient level is decreased by 10% from the previous year.

AYP 2010 Results
Overview of Compilation Table
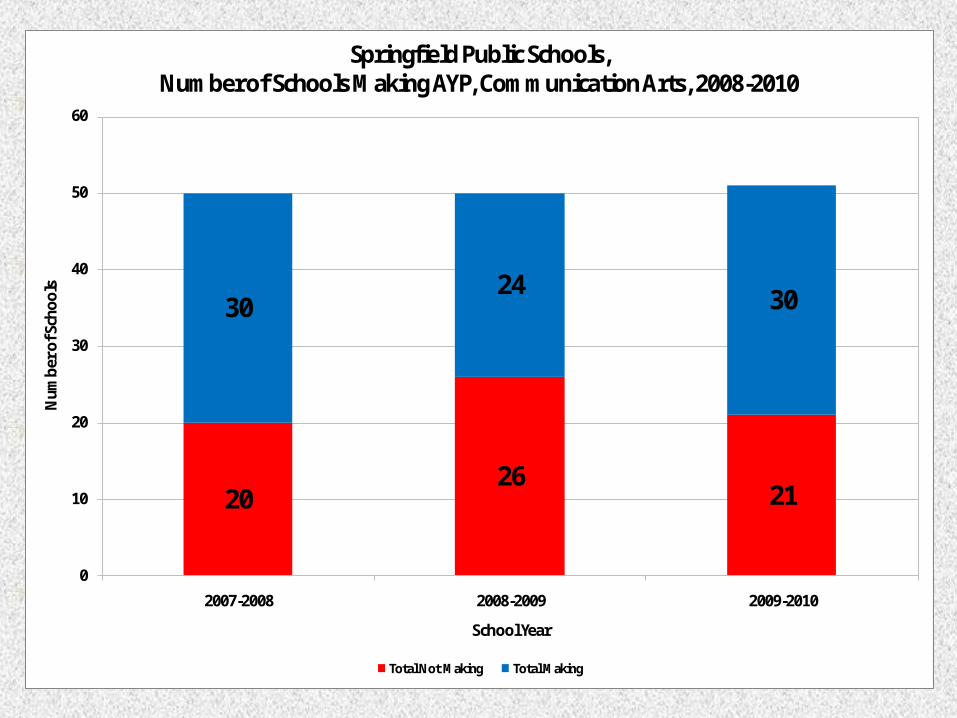
2026
21
3024 30
0
10
20
30
40
50
60
2007-2008 2008-2009 2009-2010
Num
ber o
f Sch
ools
School Year
Springfield Public Schools, Number of Schools Making AYP, Communication Arts, 2008-2010
Total Not Making Total Making

Adequate Yearly Progress (AYP) 2010 Overview - Springfield Public Schools
Communication Arts
Level
Number Buildings
“Met” 2007-2008
(Target = 51.0)
Number Buildings “Met”
2008-2009(Target = 59.2%)
Number Buildings “Met”
2009-2010(Target = 67.4%)
Elementary 26 out of 35 17 out of 35 26 out of 36
Middle School 3 out of 10 3 out of 10 1 out of 10
High School 1 out of 5 4 out of 5 3 out of 5

1320
27
3730
24
0
10
20
30
40
50
60
2007-2008 2008-2009 2009-2010
Num
ber o
f Sch
ools
School Year
Springfield Public Schools, Number of Schools Making AYP, Mathematics, 2008-2010
Total Not Making Total Making
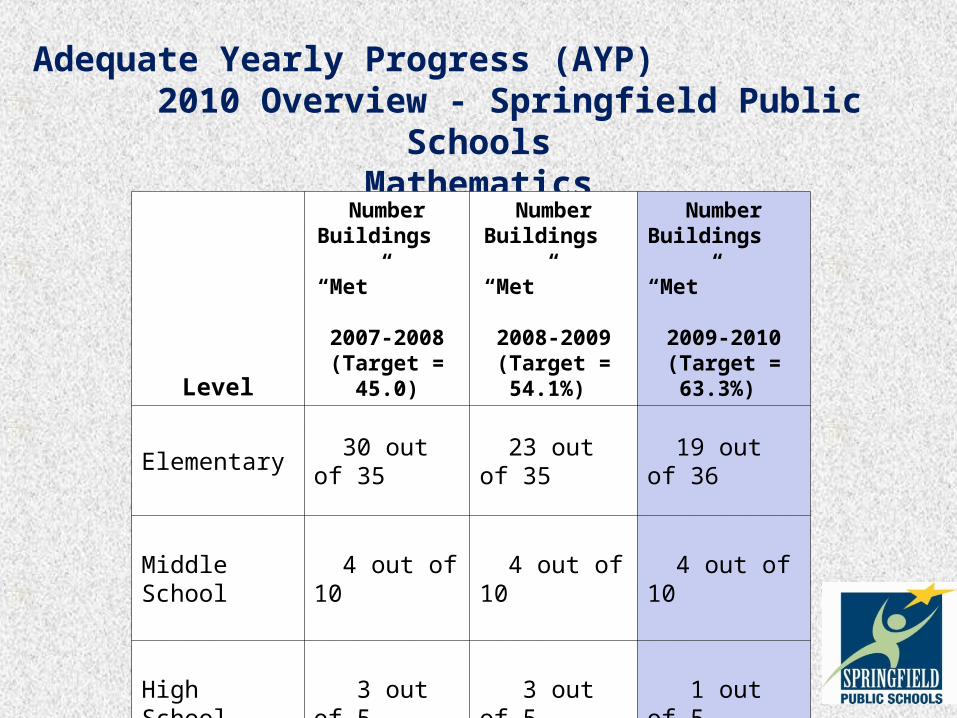
Adequate Yearly Progress (AYP) 2010 Overview - Springfield Public Schools
Mathematics
Level
Number Buildings “Met”
2007-2008(Target = 45.0)
Number Buildings “Met”
2008-2009(Target = 54.1%)
Number Buildings “Met”
2009-2010(Target = 63.3%)
Elementary 30 out of 35 23 out of 35 19 out of 36
Middle School 4 out of 10 4 out of 10 4 out of 10
High School 3 out of 5 3 out of 5 1 out of 5
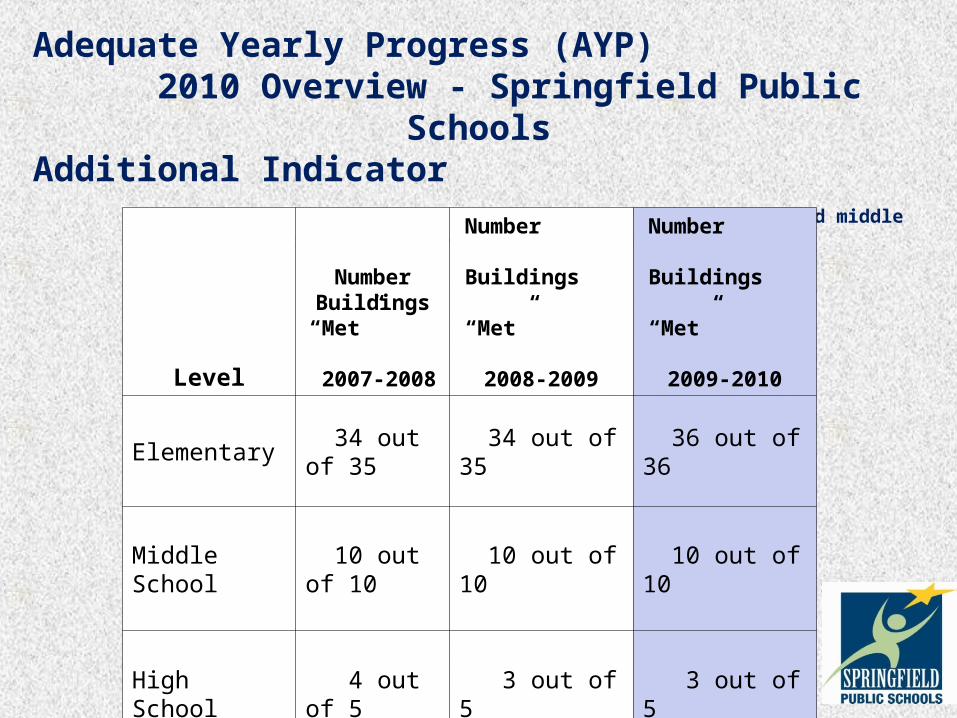
Adequate Yearly Progress (AYP) 2010 Overview - Springfield Public Schools
Additional Indicator (attendance for elementary and middle schools; graduation rate for high schools)
Level
Number Buildings
“Met” 2007-2008
Number Buildings “Met”
2008-2009
Number Buildings “Met”
2009-2010
Elementary 34 out of 35 34 out of 35 36 out of 36
Middle School 10 out of 10 10 out of 10 10 out of 10
High School 4 out of 5 3 out of 5 3 out of 5
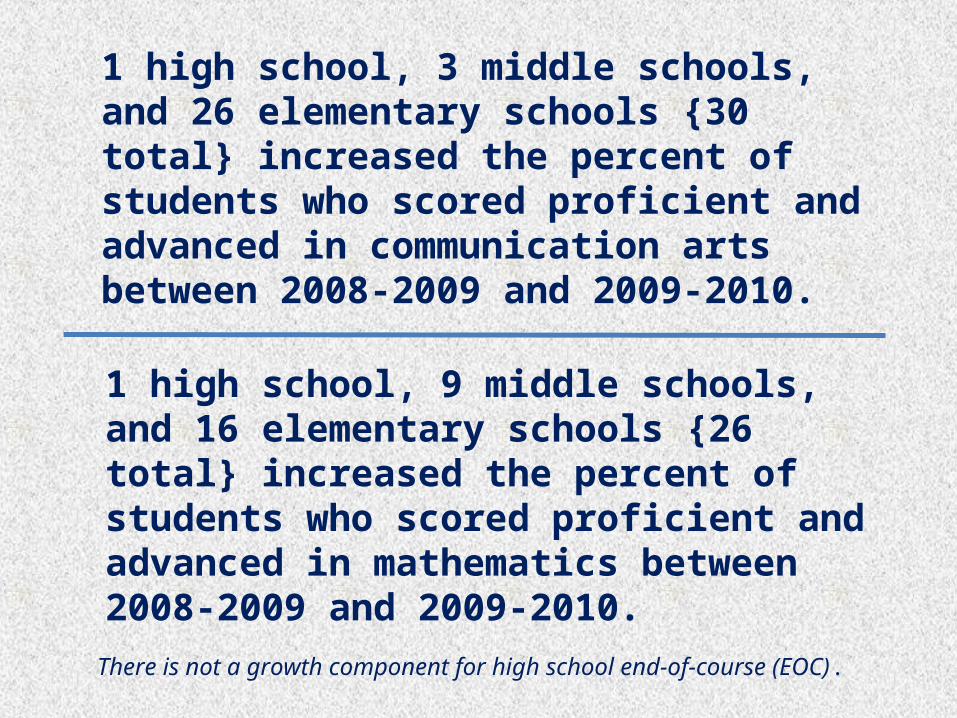
1 high school, 3 middle schools, and 26 elementary schools {30 total} increased the percent of students who scored proficient and advanced in communication arts between 2008-2009 and 2009-2010.
1 high school, 9 middle schools, and 16 elementary schools {26 total} increased the percent of students who scored proficient and advanced in mathematics between 2008-2009 and 2009-2010.
There is not a growth component for high school end-of-course (EOC).

Schools Meeting in 2010 that Did Not in 2009
• Seven schools that did not meet AYP in 2009 achieved AYP in 2010.– Bingham– Boyd– Truman– Watkins– Wilder– York– Wilson’s Creek

Communication Arts

0
10
20
30
40
50
60
70
80
90
100
2002 2003 2004 2005 2006 2007 2008 2009 2010 2011 2012 2013 2014
Perc
ent
School Year
Springfield Public Schools, Communication Arts AYP Results, 2002-2010, School Total
CA Target CA SPS School Total

0
10
20
30
40
50
60
70
80
90
100
2002 2003 2004 2005 2006 2007 2008 2009 2010 2011 2012 2013 2014
Perc
ent
School Year
Springfield Public Schools, Communication Arts AYP Results, 2002-2010, Asian/Pacific Islander
CA Target Asian/PI

0
10
20
30
40
50
60
70
80
90
100
2002 2003 2004 2005 2006 2007 2008 2009 2010 2011 2012 2013 2014
Perc
ent
School Year
Springfield Public Schools, Communication Arts AYP Results, 2002-2010, Black
CA Target Black

0
10
20
30
40
50
60
70
80
90
100
2002 2003 2004 2005 2006 2007 2008 2009 2010 2011 2012 2013 2014
Perc
ent
School Year
Springfield Public Schools, Communication Arts AYP Results, 2002-2010, Hispanic
CA Target Hispanic
0
10
20
30
40
50
60
70
80
90
100
2002 2003 2004 2005 2006 2007 2008 2009 2010 2011 2012 2013 2014
Perc
ent
School Year
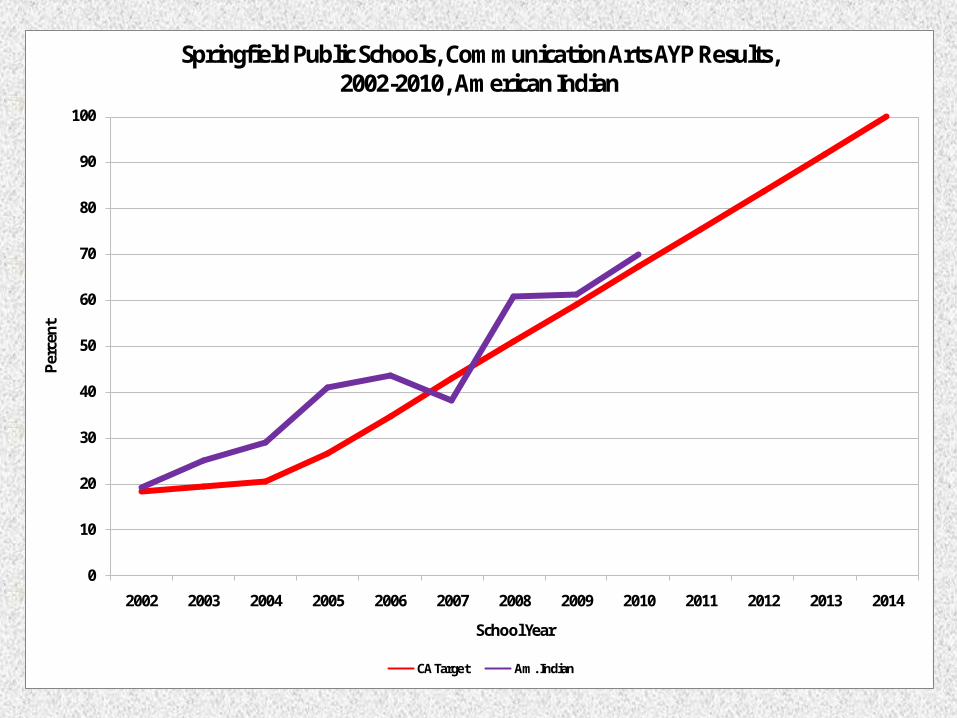
Springfield Public Schools, Communication Arts AYP Results, 2002-2010, American Indian
CA Target Am. Indian

0
10
20
30
40
50
60
70
80
90
100
2002 2003 2004 2005 2006 2007 2008 2009 2010 2011 2012 2013 2014
Perc
ent
School Year
Springfield Public Schools, Communication Arts AYP Results, 2002-2010, White
CA Target White

0
10
20
30
40
50
60
70
80
90
100
2002 2003 2004 2005 2006 2007 2008 2009 2010 2011 2012 2013 2014
Perc
ent
School Year
Springfield Public Schools, Communication Arts AYP Results, 2002-2010, Free/Reduced Lunch
CA Target FRL

0
10
20
30
40
50
60
70
80
90
100
2002 2003 2004 2005 2006 2007 2008 2009 2010 2011 2012 2013 2014
Perc
ent
School Year
Springfield Public Schools, Communication Arts AYP Results, 2002-2010, IEP
CA Target IEP

0
10
20
30
40
50
60
70
80
90
100
2002 2003 2004 2005 2006 2007 2008 2009 2010 2011 2012 2013 2014
Perc
ent
School Year
Springfield Public Schools, Communication Arts AYP Results, 2002-2010, LEP (Limited English Proficient)
CA Target LEP

Math

0
10
20
30
40
50
60
70
80
90
100
2002 2003 2004 2005 2006 2007 2008 2009 2010 2011 2012 2013 2014
Perc
ent
School Year
Springfield Public Schools, Mathematics AYP Results, 2002-2010, School Total
Math Target Math SPS School Total
0
10
20
30
40
50
60
70
80
90
100
2002 2003 2004 2005 2006 2007 2008 2009 2010 2011 2012 2013 2014
Perc
ent
School Year
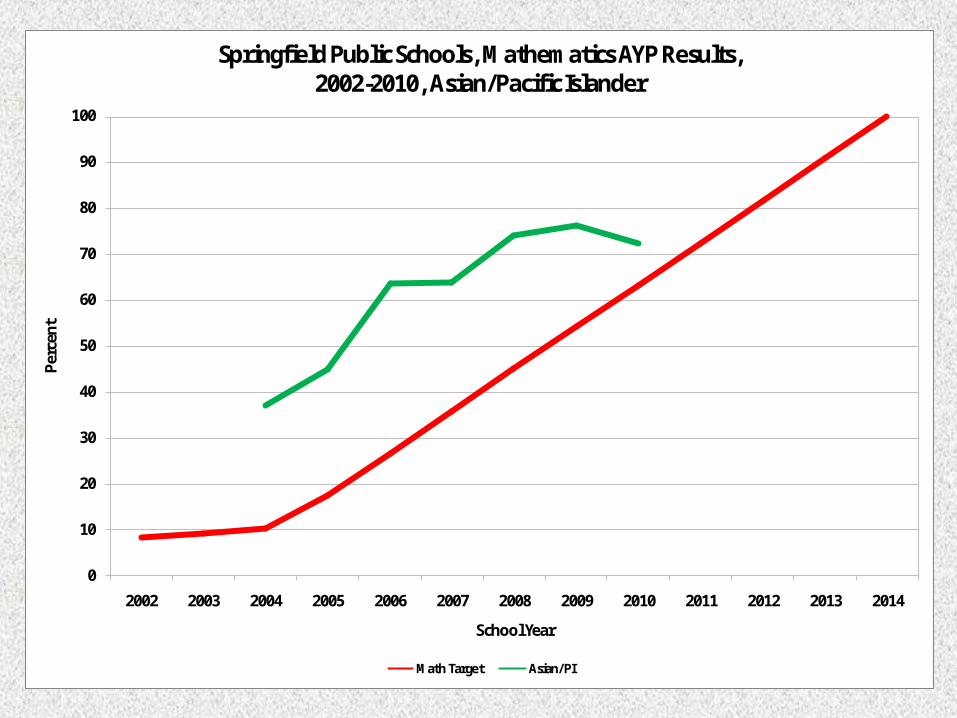
Springfield Public Schools, Mathematics AYP Results, 2002-2010, Asian/Pacific Islander
Math Target Asian/PI
0
10
20
30
40
50
60
70
80
90
100
2002 2003 2004 2005 2006 2007 2008 2009 2010 2011 2012 2013 2014
Perc
ent
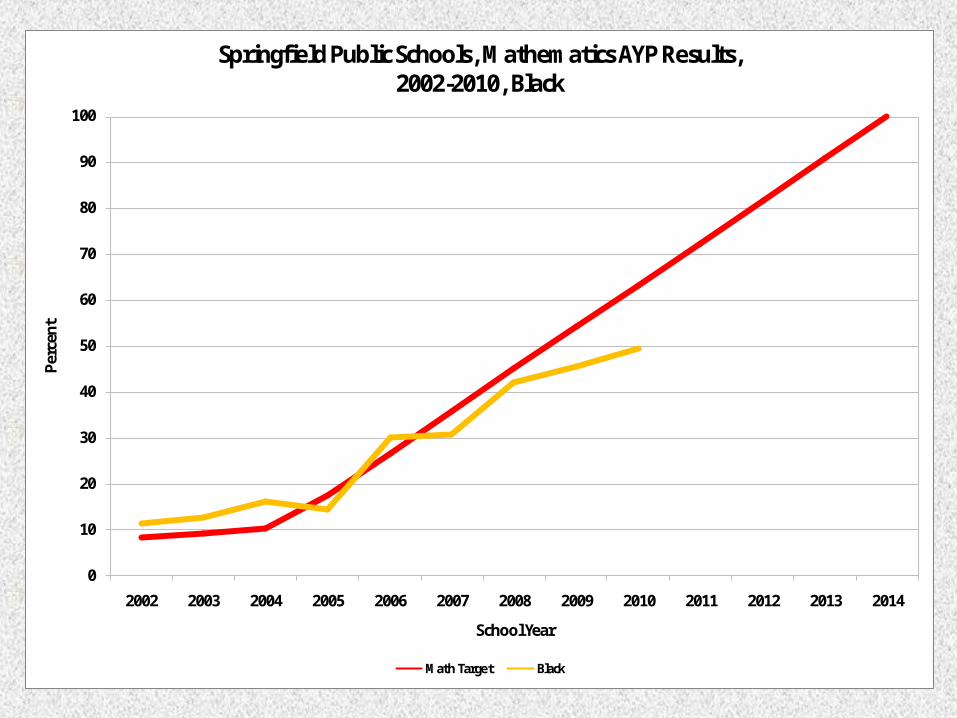
School Year
Springfield Public Schools, Mathematics AYP Results, 2002-2010, Black
Math Target Black

0
10
20
30
40
50
60
70
80
90
100
2002 2003 2004 2005 2006 2007 2008 2009 2010 2011 2012 2013 2014
Perc
ent
School Year
Springfield Public Schools, Mathematics AYP Results, 2002-2010, Hispanic
Math Target Hispanic

0
10
20
30
40
50
60
70
80
90
100
2002 2003 2004 2005 2006 2007 2008 2009 2010 2011 2012 2013 2014
Perc
ent
School Year
Springfield Public Schools, Mathematics AYP Results, 2002-2010, American Indian
Math Target Am. Indian
0
10
20
30
40
50
60
70
80
90
100
2002 2003 2004 2005 2006 2007 2008 2009 2010 2011 2012 2013 2014
Perc
ent
School Year
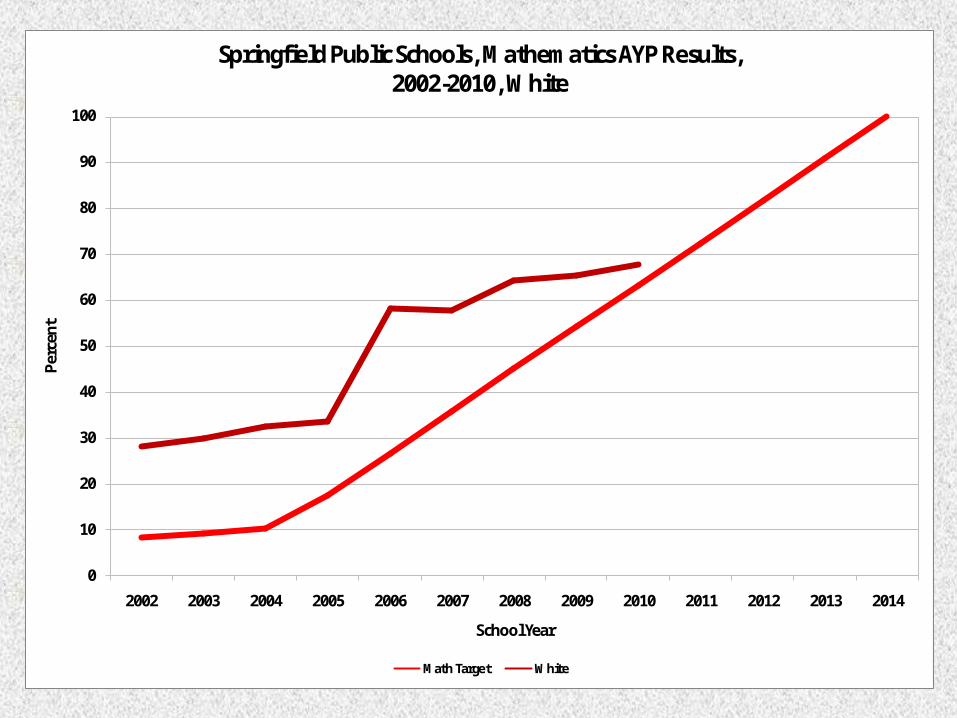
Springfield Public Schools, Mathematics AYP Results, 2002-2010, White
Math Target White
0
10
20
30
40
50
60
70
80
90
100
2002 2003 2004 2005 2006 2007 2008 2009 2010 2011 2012 2013 2014
Perc
ent
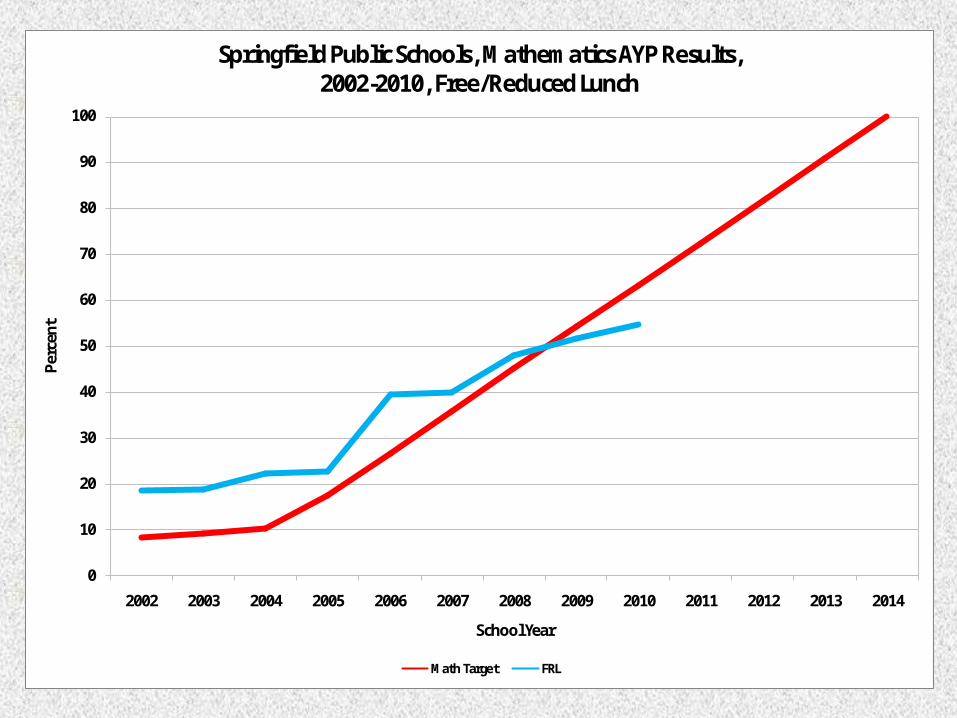
School Year
Springfield Public Schools, Mathematics AYP Results, 2002-2010, Free/Reduced Lunch
Math Target FRL
0
10
20
30
40
50
60
70
80
90
100
2002 2003 2004 2005 2006 2007 2008 2009 2010 2011 2012 2013 2014
Perc
ent
School Year
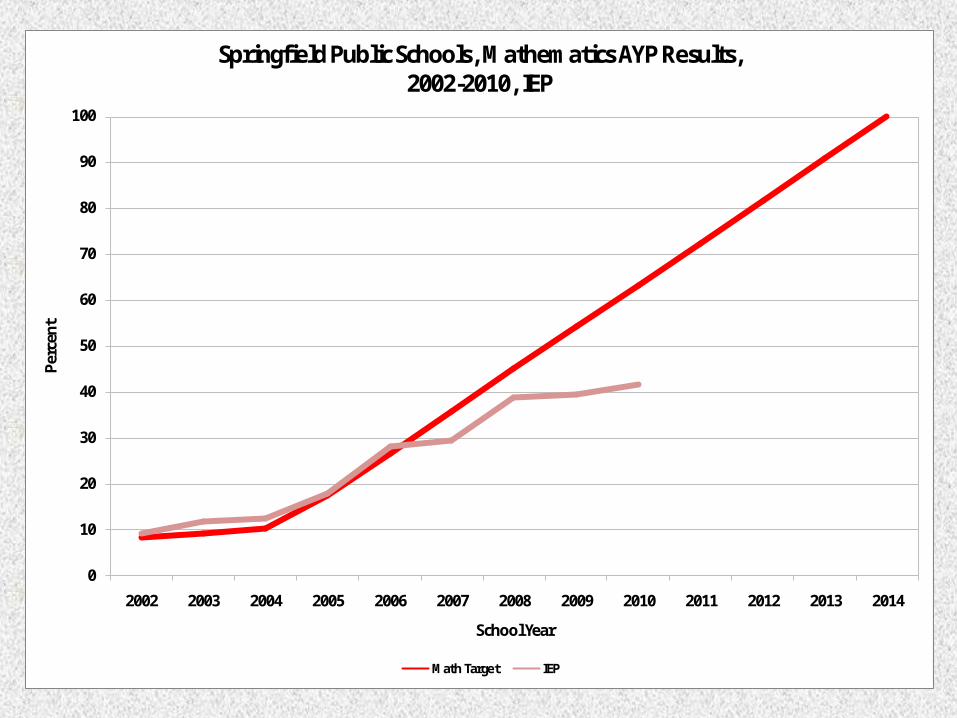
Springfield Public Schools, Mathematics AYP Results, 2002-2010, IEP
Math Target IEP
0
10
20
30
40
50
60
70
80
90
100
2002 2003 2004 2005 2006 2007 2008 2009 2010 2011 2012 2013 2014
Perc
ent
School Year
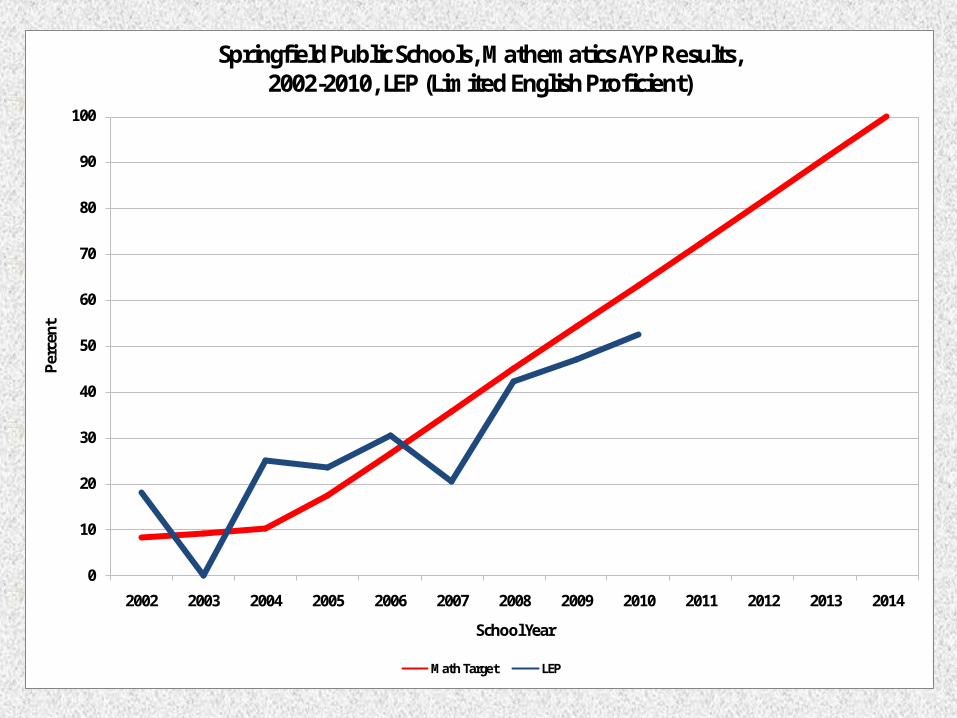
Springfield Public Schools, Mathematics AYP Results, 2002-2010, LEP (Limited English Proficient)
Math Target LEP

Implications of Not Meeting AYP
Brian HubbardDirector,
Title I

The following schools receiving federal Title I funding are identified as needing improvement based on AYP 2010:
Elementary Buildings:1. Boyd Elementary (Level I / delayed) 2. Holland Elementary (Level I) 3. McGregor Elementary (Level IV/restructuring)4. Sunshine Elementary (Level I)5. Twain Elementary (Level I)6. Weaver Elementary (Level I)7. Weller Elementary (Level II)8. Westport Elementary (Level II/delayed)9. Williams Elementary (Level III/corrective action)10. York Elementary (Level II/delayed)
Middle Schools:1. Pipkin Middle School (Level III/corrective action)2. Reed Middle School (Level V/ restructuring)3. Study Middle School (Level III/corrective action)

School Improvement Flowchart

School Improvement Identification
Title I schools are identified as in “School Improvement” when they do not make AYP in the same content area or the additional indicator (attendance rate for schools with grades K-8 and graduation rate for schools with grades 9-12) for two consecutive years.
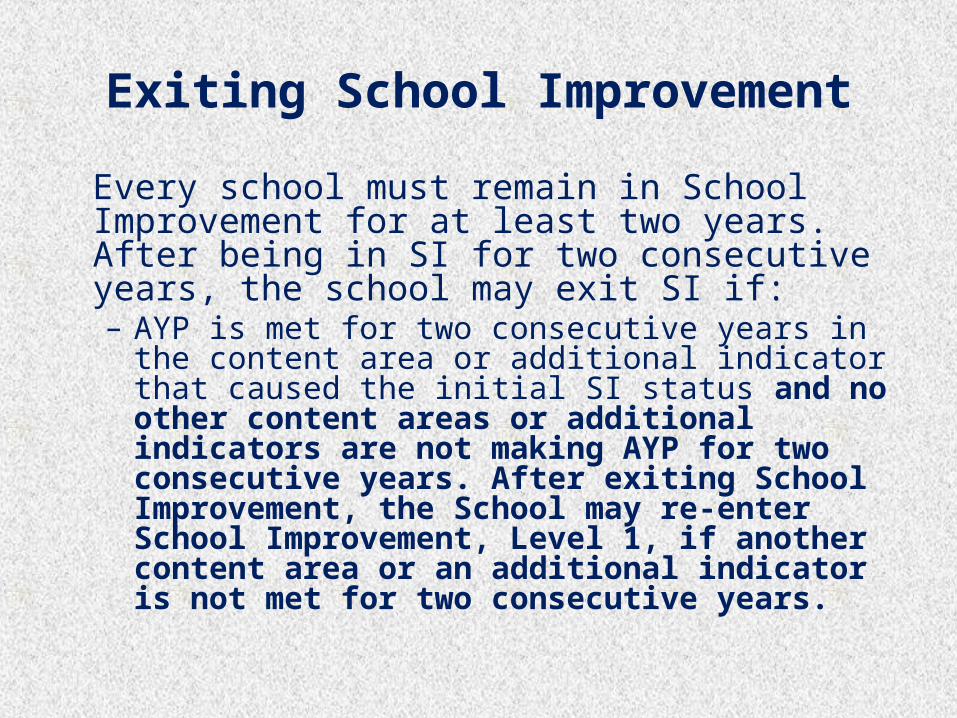
Exiting School Improvement
Every school must remain in School Improvement for at least two years. After being in SI for two consecutive years, the school may exit SI if: – AYP is met for two consecutive years in the
content area or additional indicator that caused the initial SI status and no other content areas or additional indicators are not making AYP for two consecutive years. After exiting School Improvement, the School may re-enter School Improvement, Level 1, if another content area or an additional indicator is not met for two consecutive years.

School Improvement Level 1 (after AYP is not met for 2 consecutive years)
The district must ensure that the identified school implements the following:
1. Develop or revise a school improvement plan2. Notify parents of each child enrolled in the school and provide:
a. The meaning of the notification; b. The reasons for the identification and what the school, district and state are doing to help address the problem; c. Ways parents can become involved in addressing the academic issues that caused the school to be identified for school improvement; d. An explanation of the parent’s option(s) to transfer their child.
4. Offer Public School Choice (PSC) to all students to transfer to another public school within the district.
5. Districts are to include on their web sites information regarding PSC such as parent notification letters and the previous year’s transfer numbers

School Improvement Level 2 (after AYP is not met for 3 years)
Follow the steps from School Improvement Level I along with the following:
• Make Supplemental Educational Services (SES) available to students receiving free/reduced lunch
• Provide SES information on the district website.

School Improvement Level 3 – Corrective Action, Year 1 (after AYP is
not met for 4 years)
Follow the steps from School Improvement Level I along with the following:
• The district is still required to provide school choice and supplemental educational services
• The district is required to take corrective measures: – Possible corrective actions include
implementing a new curriculum, working with outside expert consultants, extending instructional time, or making staff changes.

School Improvement Level 4 – Restructuring, Planning (after AYP
is not met for 5 years)
Follow the steps from School Improvement Level I along with the following:
• The school continues to offer school choice and supplemental educational services
• The district is also required to restructure the school. Restructuring can include replacing staff, contracting with an outside expert consultant, or other major restructuring of the school’s administration and operations.
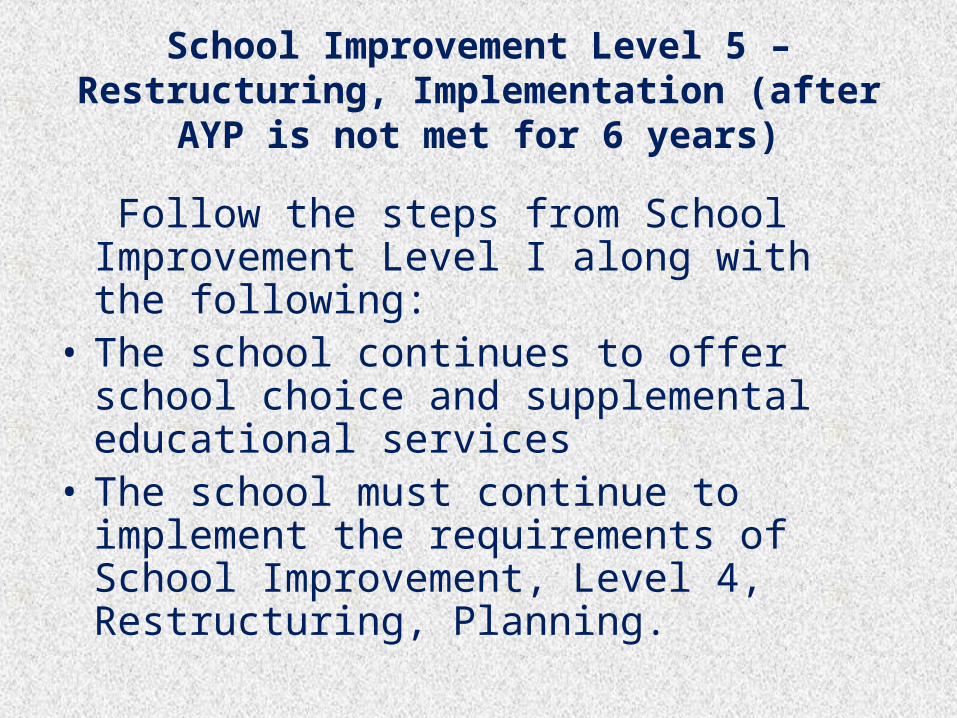
School Improvement Level 5 – Restructuring, Implementation (after
AYP is not met for 6 years)
Follow the steps from School Improvement Level I along with the following:
• The school continues to offer school choice and supplemental educational services
• The school must continue to implement the requirements of School Improvement, Level 4, Restructuring, Planning.

Schools in School Improvement
SI Level I SI Level 2 SI Level 3 SI Level 4 SI Level 5
Central HS* Parkview* (D) Hickory Hills MS*
Hillcrest HS* Reed MS
Boyd (D) Jarrett MS* Pipkin MS McGregor
Holland Pleasant View MS*
Study MS
Mark Twain Weller Williams
Rountree* (D) Westport (D)
Sunshine York (D)
Weaver
•Indicates a Non-Title I Building•(D) indicates the school is in School Improvement, Delayed
Bissett Elementary made AYP for 2 years and came out of School Improvement
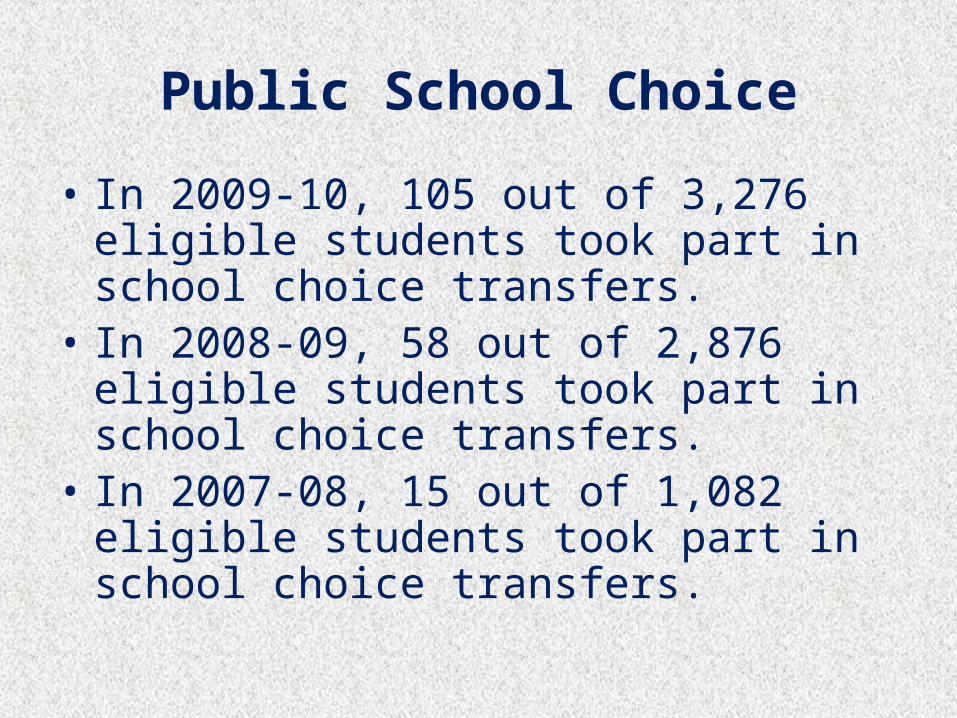
Public School Choice
• In 2009-10, 105 out of 3,276 eligible students took part in school choice transfers.
• In 2008-09, 58 out of 2,876 eligible students took part in school choice transfers.
• In 2007-08, 15 out of 1,082 eligible students took part in school choice transfers.
A Principal’s Viewpoint
Tim ZeiglerPrincipal, Pipkin MS

CARVER CHEROKEE HICKORY HILLS JARRETT PERSHING PIPKINPLEASANT
VIEW REED STUDY
2004 0.084 0.064 0.115 0.124 0.055 0.267 0.083 0.114 0.149
2005 0.092 0.067 0.132 0.131 0.071 0.276 0.078 0.132 0.148
2006 0.105 0.07 0.141 0.14 0.058 0.239 0.095 0.14 0.142
2007 0.114 0.076 0.151 0.166 0.079 0.23 0.109 0.176 0.153
2008 0.113 0.084 0.174 0.183 0.099 0.224 0.088 0.161 0.169
2009 0.112 0.092 0.163 0.202 0.096 0.235 0.1 0.157 0.193
0
0.05
0.1
0.15
0.2
0.25
0.3
Min
orit
y Pe
rcen
tage
Enr
olle
dR12 Middle School Minority Enrollment by School by Year (2004-2009)
2009-2010 F/R at Pipkin ≈78%

18.5
25.3 25.4 23.6
40.6 41.4
51.8 50.2 52
75.5
0
10
20
30
40
50
60
70
80
90
100
2002
2003
2004
2005
2006
2007
2008
2009
2010
2011
2012
2013
2014
Perc
ent P
rofic
ient
and
Adv
ance
dCommunication ArtsPipkin Middle School
All Students Percent Proficient and Advanced
AYP Requirements
To be completed in April 2011

0
10
20
30
40
50
60
70
80
90
100
2002
2003
2004
2005
2006
2007
2008
2009
2010
Prec
ent P
rofic
ient
and
Adv
ance
dCommunication Arts Percent Proficent and AdvancedPipkin Middle School MAP History by Ethnicity Group
Asian/Pac Isl. Black Hispanic American Indian White F/R Lunch IEP

16.512.9
21.7
33.6
48.4 50.654.4
59.764.2
72.5
0
10
20
30
40
50
60
70
80
90
100
2002
2003
2004
2005
2006
2007
2008
2009
2010
2011
2012
2013
2014
Perc
ent P
rofic
ent a
nd A
dvan
ced
MathematicsPipkin Middle School
All Students Percent Proficient and Advanced
AYP Requirements
To be completed in April 2011

0
10
20
30
40
50
60
70
80
90
100
2002
2003
2004
2005
2006
2007
2008
2009
2010
Perc
ent P
rofic
ient
and
Adv
ance
dMathmatics Percent Proficient and Advanced
Pipkin Middle School MAP History by Ethnicity Group
Asian/Pac Isl. Black Hispanic American Indian White F/R Lunch IEP

40.6
48.4
41.4
50.651.8
54.4
47.7
55.9
0
10
20
30
40
50
60
Communication Arts
Mathematics Communication Arts
Mathematics Communication Arts
Mathematics Communication Arts
Mathematics
2006 2007 2008 2009
MAP Percent Proficient and Advanced 2005- 2009
Pipkin and Comparable School
BRITTANY WOODS
CENTER MIDDLE
EASTGATE MIDDLE
GRANDVIEW MIDDLE
JENNINGS JR. HIGH
KENNETT MIDDLE
KIRBY MIDDLE
PIPKIN MIDDLE
R. G. CENTRAL MIDDLE
REED MIDDLE
SIKESTON MIDDLE
SOUTH MIDDLE
SOUTHEAST MIDDLE

91.8
91.1
92.5
91.3 91.491.8
93.794 94.07
90
91
92
93
94
95
96
97
98
99
100
2002
2003
2004
2005
2006
2007
2008
2009
2010
2011
2012
2013
2014
Perc
ent A
tten
ding
Attendance 2002 -- 2010Pipkin Middle School

Questions