infant and maternal health mortality...stressful life events 41.6 12.1 28.8 49.6 10.6 32.3 26.0 21.6...
TRANSCRIPT

Infant and Maternal Health Mortality
Susan Castellano, Maternal and Child Health Section Manager
Child and Family Health Division

Trends Impacting Perinatal Health
1/16/2019 2

The Increasing diversity of Minnesota
0
5
10
15
20
25
30
35
40
45
50
2005 2010 2015 2020 2025 2030 2035
Percent of Total Population Projected to Be Nonwhite or Latino, by Year
Minnesota United States Hennepin County
3Data Source: Minnesota State Demographic Center

Neonatal Abstinence Nationally
1/16/2019
Nationally, the rate of babies born with NAS per 1,000 hospital births was 1.2 in 2000, 1.5 in 2003, 1.96 in 2006, 3.39 in 2009 and 5.8 in
2012. The rate of maternal opiate use per 1,000 hospital births was 1.19 in 2000, 1.26 in 2003, 2.52 in
2006, and 5.63 in 2009.
4
Patrick et. Al., JAMA 2012, Patrick et. Al., Journal of Perinatology.

STDs in MinnesotaRate per 100,000 by Year of Diagnosis, 2007-2017
0
1
2
3
4
5
6
7
8
9
10
0
50
100
150
200
250
300
350
400
450
500
2007 2008 2009 2010 2011 2012 2013 2014 2015 2016 2017
Rate
of P
&S Syp
hilis
Rat
e o
f C
hla
myd
ia a
nd
Go
no
rrh
ea
Chlamydia Gonorrhea P&S* Syphilis
* P&S = Primary and Secondary
Source: Sexually Transmitted Disease (STD) Surveillance Report, MN Dept. of Health, 2017
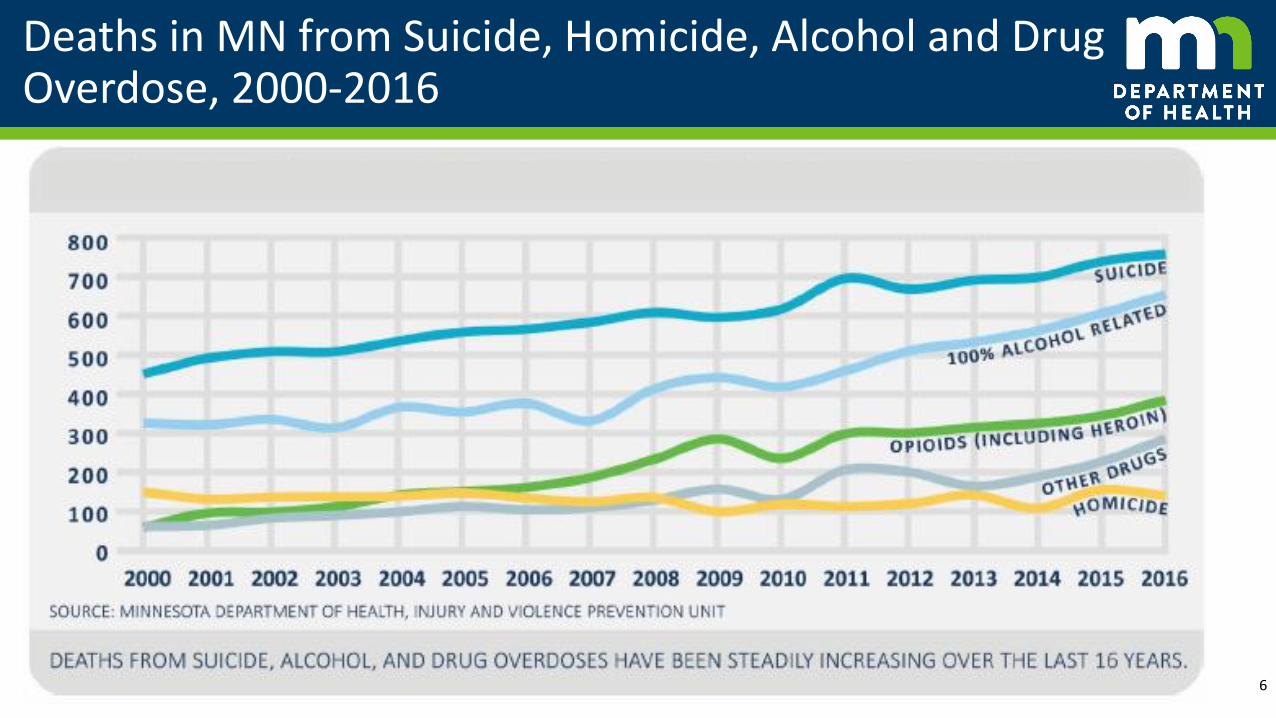
Deaths in MN from Suicide, Homicide, Alcohol and Drug Overdose, 2000-2016
1/16/2019 6

Infant Mortality
1/16/2019 7

Key Fetal/Infant MN Statistics: 2016
8
• Live Births: 69,835
• Number of infant deaths (Infants aged < 1 year): 357
• Number of neonatal deaths (Infants aged < 28 days): 242
• Number of post neonatal deaths (Infants aged 28 days to < 1 year): 115
• Fetal (Stillbirth) deaths (20+ weeks gestation): 420
• Infant mortality rate per 1,000 live births: 5.1
• Fetal mortality rate per 1,000 live births + fetal deaths: 5.3

What Is the Infant Mortality Rate?
1. The infant mortality rate (IMR) is expressed as the number of infant deaths per 1,000 live births.
2. IMR Calculation Example: In 2014, there were 346 infant deaths and 69,916 live births in Minnesota. What was the infant mortality rate?
346/69,916 x 1,000 = 4.9 infant deaths per 1,000 live births
Interpretation: In 2014, the IMR in Minnesota was 4.9 infant deaths per 1,000 live births.
9

Infant Mortality Rates for Selected OECD Countries
5.95.1
4.24.1
4.04.0
3.93.9
3.73.7
3.43.33.33.3
3.23.13.1
2.92.9
2.82.72.7
2.52.52.5
2.32.2
1.71.6
0 1 2 3 4 5 6 7
United States
Slovak Republic
Hungary
Latvia
Greece
Poland
Switzerland
United Kingdom
Denmark
France
Ireland
Belgium
Germany
Netherlands
Australia
Austria
Israel
Italy
Portugal
Luxembourg
Estonia
Korea
Czech Republic
Estonia
Sweden
Norway
Iceland
Finland
Slovenia
Rate per 1,000 Live Births1/16/2019 10
Source: OECD (2018), Infant mortality rates (indicator). doi: 10.1787/83dea506-en (Accessed on 12 March 2018)
29th

Infant Mortality Rates 1996-2015: Minnesota and U.S.
7.2
5.9
5.06.0
0
1
2
3
4
5
6
7
8
1996-1998 1998-2000 2000-2002 2002-2004 2004-2006 2006-2008 2008-2010 2012-2014 2013-2015
Rat
e p
er 1
,00
0 L
ive
Bir
ths
US Minnesota Healthy People 2020 Target
1/16/2019 11Source: National Center for Health Statistics

Infant Mortality Rates by Race/Ethnicity of Mother, Minnesota 2000-20161
0
2
4
6
8
10
12
2000-2004 2001-2005 2002-2006 2003-2007 2004-2008 2005-2009 2006-2010 2007-2011 2008-2012 2009-2013 2010-2014 2011-2015 2012-2016
Rat
e p
er 1
,00
0 L
ive
Bir
ths
Total Black/African American
American Indian or Alaska Native Asian/Pacific Islander
Hispanic* Non-Hispanic White1/16/2019 12
*Hispanic can be of any race1Five-year averages Source: Minnesota Department of Health, Linked Birth/Infant Death File
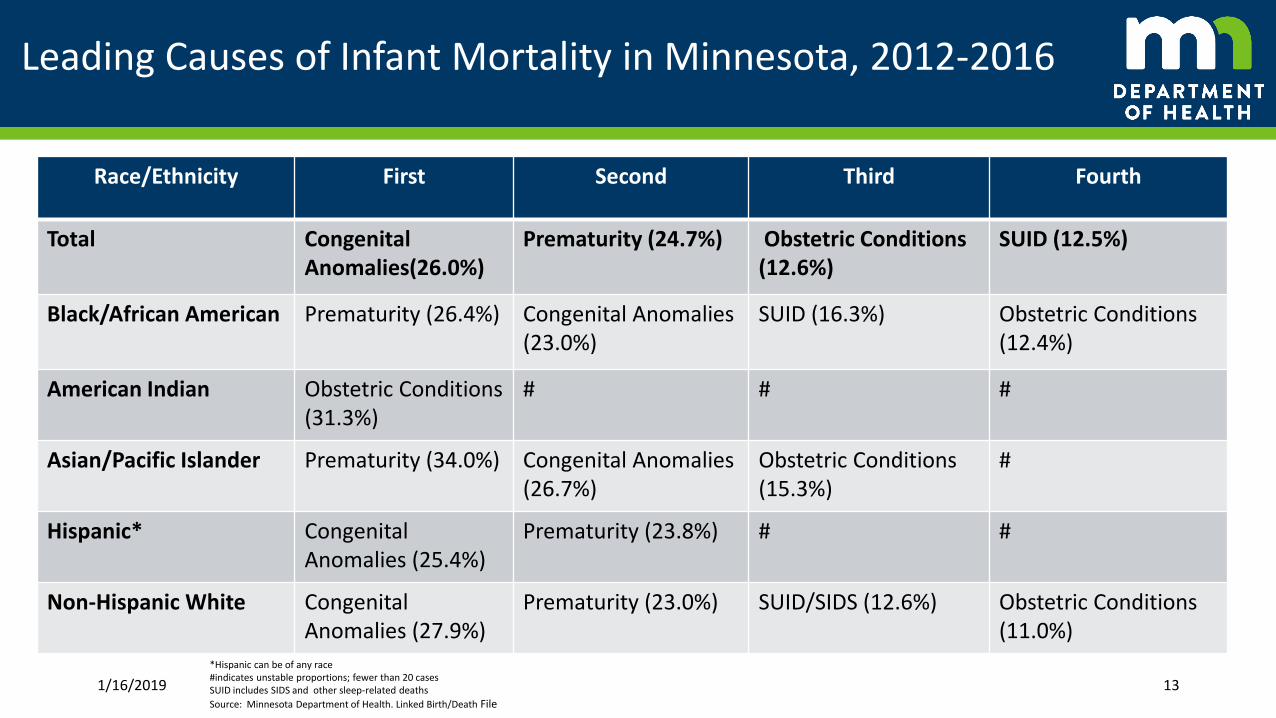
Leading Causes of Infant Mortality in Minnesota, 2012-2016
Race/Ethnicity First Second Third Fourth
Total CongenitalAnomalies(26.0%)
Prematurity (24.7%) Obstetric Conditions (12.6%)
SUID (12.5%)
Black/African American Prematurity (26.4%) Congenital Anomalies (23.0%)
SUID (16.3%) Obstetric Conditions(12.4%)
American Indian Obstetric Conditions (31.3%)
# # #
Asian/Pacific Islander Prematurity (34.0%) Congenital Anomalies (26.7%)
Obstetric Conditions (15.3%)
#
Hispanic* CongenitalAnomalies (25.4%)
Prematurity (23.8%) # #
Non-Hispanic White CongenitalAnomalies (27.9%)
Prematurity (23.0%) SUID/SIDS (12.6%) Obstetric Conditions(11.0%)
1/16/2019 13
*Hispanic can be of any race#indicates unstable proportions; fewer than 20 casesSUID includes SIDS and other sleep-related deaths
Source: Minnesota Department of Health. Linked Birth/Death File

Minnesota Stillbirth rates 2003-2016
4.9
0.0
1.0
2.0
3.0
4.0
5.0
6.0
7.0
2003 2004 2005 2006 2007 2008 2009 2010 2011 2012 2013 2014 2015 2016
Rat
e p
er 1
,00
0 li
ve b
irth
s +
Still
bir
ths
Early (20-27 weeks) Late (28+ weeks) Overall (20+ weeks)
In 2013, the U.S. fetal mortality rate was 6.0 compared to 4.9 in
Minnesota.
Data Source: Minnesota Department of Health, Minnesota Resident Final Fetal Death File

Stillbirth rates by race/ethnicity Minnesota 2006-2016
0.0
2.0
4.0
6.0
8.0
10.0
12.0
14.0
Rat
e p
er 1
,00
0 li
ve b
irth
s +
Still
bir
ths
3-Year Rolling Average
African American/Black
American Indian
Asian/Pacific Islander
Hispanic
Non-Hispanic White
Data Source: Minnesota Department of Health, Minnesota Resident Final Fetal Death File

Once a day =
Many are preventable
1/16/2019 16
Fetal and Infant Mortality Review
1/16/2019 17

History of FIMR in Minnesota
1/16/2019 18
• Statutory authority and resources no longer exists
• Previous statewide American Indian Infant Mortality Review conducted

What is a Fetal and Infant Mortality Review?
1/16/2019 19
Conduct systematic, scientific, and objective review of cases to identify underlying causes, contributing factors and systems-level issues, monitoring trends and changes over time
Case summaries reviewed by an interdisciplinary team, develops recommendations based on themes or patterns in the information
Community Action Team charged with developing and implementing solutions to address systems- and community-level problems
Ultimate goal: avert preventable fetal and infant deaths by improving education, services and community resources via a broad range of policies and interventions

Maternal health

59.0
41.4
33.1
17.2
0.0
10.0
20.0
30.0
40.0
50.0
60.0
PER
1,0
00
FEM
ALE
S A
GES
15
-19
Data Source: Minnesota Resident Final Birth File & US Census Bureau, American Community Survey
Minnesota teen pregnancy rate 1990-2016

Teen Birth by Race/Ethnicity
98.5104.7
52.5
103.4
20.4
37.1
69.6
108.1
40.2
87.6
17.121.1
56.3
91.3
32.5
62.7
14.99.7
32.8
54.6
19.3
32.2
9.43.9
0.0
20.0
40.0
60.0
80.0
100.0
120.0
African American/Black American Indian Asian/Pacific Islander Hispanic Non-Hispanic White Other & Unknown
Rat
e p
er 1
,00
0 F
em
ales
Age
s 1
5-1
9
Minnesota Teen Birth Rate by Race/Ethnicity
2000 2005 2010 2015
22Data Source: Minnesota Resident Final Birth File & US Census Bureau, American Community Survey

Percent Preterm Births by Race/Ethnicity of Mother Minnesota, 2017
9.7
15.2
8.4
9.68.6
12.5
8.9
0
2
4
6
8
10
12
14
16
Black/AfricanAmerican
American Indian Asian/PacificIslander
Hispanic* White Other/Unknown MN Total
Perc
ent
(%)
1/16/2019 23
Notes:*Hispanic can be of any racePreterm births are births that occur before 37 completed weeks of gestation.The data shown are for the percent (%) of all births that are pretermSource: Minnesota Department of Health, Birth File

Percent of Unintended Pregnancies, 2013-2015
24
21% 21%
43%
33%
25%
0%
10%
20%
30%
40%
50%
White Asian African American American Indian Hispanic
Data Source: Minnesota PRAMS

Maternal Depression
• Pregnancy – a vulnerable time for depression
• Research has demonstrated maternal depression can have a significant impact on infant development
• Prevalence of depression in pregnant and post-partum women range from 5%-25% depending on the source of the information and degree of severity. Can be:
• Mild - Baby Blues, 50% - 80%
• Moderate - Postpartum Depression, 10% - 20%
• Severe - Postpartum Psychosis, 0.1% - 0.2%
Source: Screening for perinatal depression. ACOG Committee Opinion No. 757. American College of Obstetricians and Gynecologists. Obstet Gynecol 2018;132:e208-12 25

26Source: Tarlov AR. (1999). Public policy frameworks for improving population health. Ann NY Acad Sci 1999; 896: 281-93.
Determinants of Health

Factors that Influence on Health
27

Experiences During Pregnancy
1/16/2019 28

7.5%
23.9%
28.6%
9.9%
4.0%
0.0%
5.0%
10.0%
15.0%
20.0%
25.0%
30.0%
35.0%
White US born AfricanAmerican
American Indian Hispanic* Other/Unknown
Pe
rce
nt
wit
h <
5 o
r ≥
5 S
tre
sso
rs 5 or more stressors
Source: PRAMS Survey Hispanic Ethnicity may include other racial categories
29
Stressors by Race/Ethnicity for pregnant women Minnesota, 2009-2013
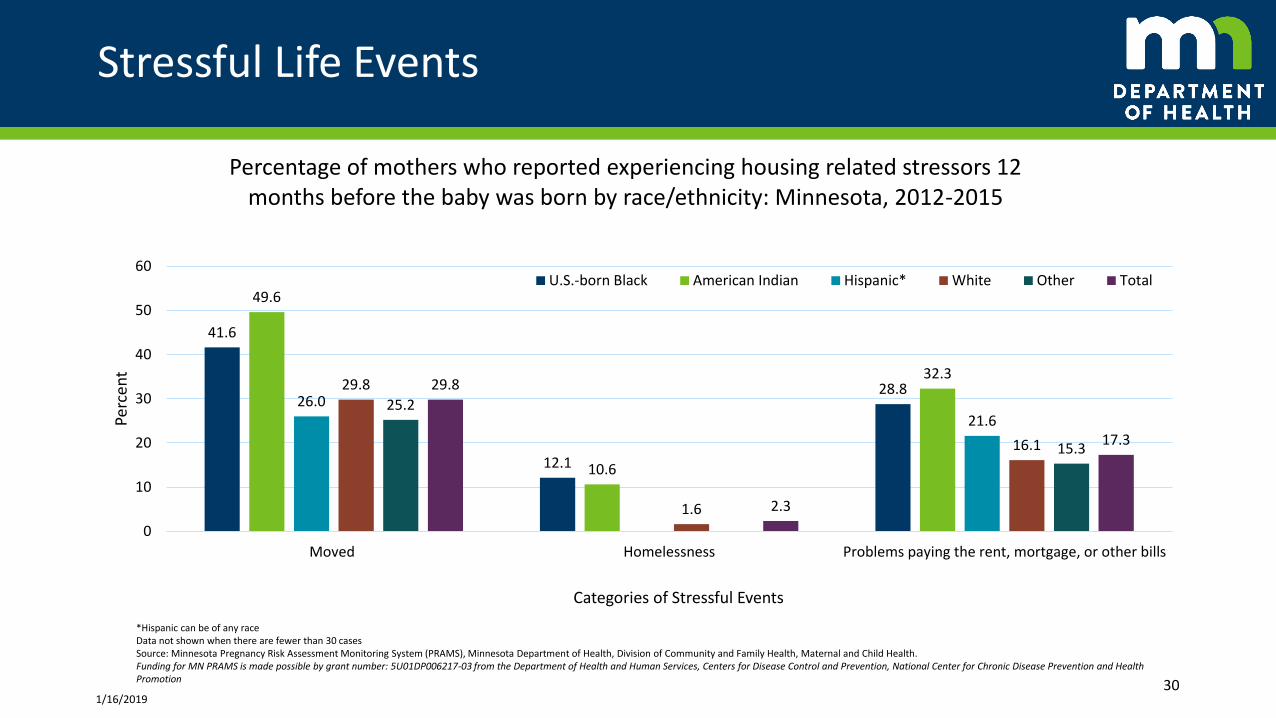
Stressful Life Events
41.6
12.1
28.8
49.6
10.6
32.3
26.021.6
29.8
1.6
16.1
25.2
15.3
29.8
2.3
17.3
0
10
20
30
40
50
60
Moved Homelessness Problems paying the rent, mortgage, or other bills
Perc
ent
Categories of Stressful Events
Percentage of mothers who reported experiencing housing related stressors 12 months before the baby was born by race/ethnicity: Minnesota, 2012-2015
U.S.-born Black American Indian Hispanic* White Other Total
1/16/201930
*Hispanic can be of any raceData not shown when there are fewer than 30 casesSource: Minnesota Pregnancy Risk Assessment Monitoring System (PRAMS), Minnesota Department of Health, Division of Community and Family Health, Maternal and Child Health.Funding for MN PRAMS is made possible by grant number: 5U01DP006217-03 from the Department of Health and Human Services, Centers for Disease Control and Prevention, National Center for Chronic Disease Prevention and Health Promotion
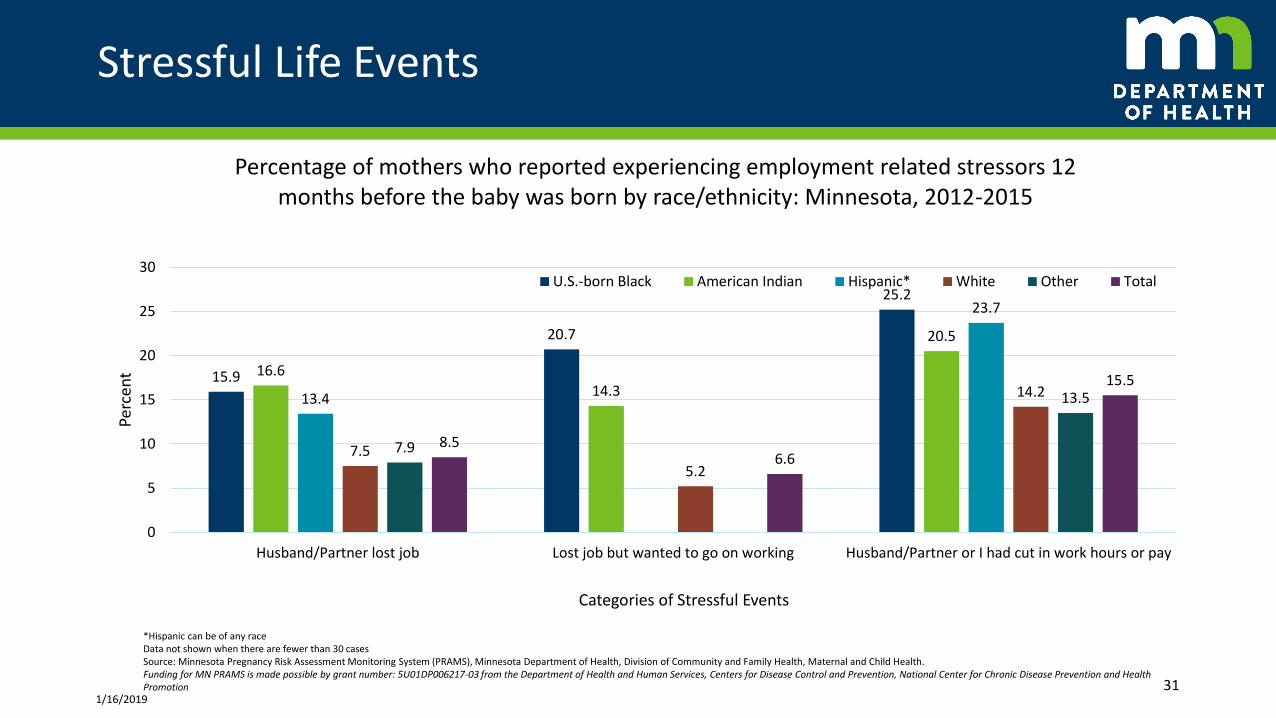
Stressful Life Events
15.9
20.7
25.2
16.6
14.3
20.5
13.4
23.7
7.5
5.2
14.2
7.9
13.5
8.56.6
15.5
0
5
10
15
20
25
30
Husband/Partner lost job Lost job but wanted to go on working Husband/Partner or I had cut in work hours or pay
Perc
ent
Categories of Stressful Events
Percentage of mothers who reported experiencing employment related stressors 12 months before the baby was born by race/ethnicity: Minnesota, 2012-2015
U.S.-born Black American Indian Hispanic* White Other Total
1/16/201931
*Hispanic can be of any raceData not shown when there are fewer than 30 casesSource: Minnesota Pregnancy Risk Assessment Monitoring System (PRAMS), Minnesota Department of Health, Division of Community and Family Health, Maternal and Child Health.Funding for MN PRAMS is made possible by grant number: 5U01DP006217-03 from the Department of Health and Human Services, Centers for Disease Control and Prevention, National Center for Chronic Disease Prevention and Health Promotion

First Trimester Prenatal Care
Early access:
• Healthy People 2020 goal: 77.9% of pregnant women to begin prenatal care in the first trimester
• Only non-Hispanic whites are above this HP goal
1/16/2019 32
0
20
40
60
80
100
2010 2011 2012 2013 2014 2015
Percent of Minnesota Births Starting Prenatal Care in First Trimester, 2010-2015
HP2020 MN African American/Black
American Indian Asian/Pacific Islander Hispanic
Per
cen
tSource: Center for Health Statistics, Minnesota Department of Health 2010-2015

Adequacy of Prenatal Care, Minnesota 2010-2016
33

Percent Reporting No Prenatal Care First TrimesterMinnesota, 2012-2015
1/16/2019 34
*Hispanic can be of any raceSource: Minnesota Pregnancy Risk Assessment Monitoring System (PRAMS), Minnesota Department of Health, Division of Community and Family Health, Maternal and Child Health.
Funding for MN PRAMS is made possible by grant number: 5U01DP006217-03 from the Department of Health and Human Services, Centers for Disease Control and Prevention, National Center for Chronic Disease Prevention and Health Promotion
72.5 68.4 72.6
89.8
72.7
85.2
27.5 31.6 27.4
10.2
27.314.8
0
20
40
60
80
100
US-Born Black American Indian Hispanic* White Other Total
Perc
ent
Yes No

Barriers to Prenatal Care
47.7
24.0
56.3
20.3
29.028.2
16.3
32.8
19.8
6.8
0
10
20
30
40
50
60
70
80
Did not know I was pregnant Didn't have enough money orinsurance to pay for my visits
Didn't have any transportation toget to the clinic/doctor's office
Perc
ent
Percentage of mothers who reported experiencing the following barriers when trying to access prenatal care Minnesota, 2012-2015
U.S.-born Black American Indian Hispanic* White Other Total
----
----
----
----
----
----
----
----
----
----
----
----
----
--
----
----
----
----
----
----
----
----
----
----
----
----
----
---
1/16/2019 35*Note: Hispanic can be of any raceSource: Minnesota Pregnancy Risk Assessment Monitoring System (PRAMS), Minnesota Department of Health, Division of Community and Family Health, Maternal and Child Health

3.8
8.37.9
4.04.5 4.3
0.0
1.0
2.0
3.0
4.0
5.0
6.0
7.0
8.0
9.0
10.0
White Black/AfricanAmerican
American Indian Asian Hispanic* MN Total
Rat
e p
er
1,0
00
Liv
e B
irth
s
*Can be of any raceSource: Minnesota Department of Health, Center for Health Statistics 36
Infant Mortality disparities persist despite first Trimester Prenatal Care Initiation, Minnesota 2009-2013

Experiences after the baby was born
1/16/2019 37

Social Support After Pregnancy
79.484.0 82.781.5
85.3 84.5
73.5
85.0 83.8
92.2 94.9 93.1
58.2
75.2 73.7
86.291.2 89.6
0
10
20
30
40
50
60
70
80
90
100
Someone to loan me $50 Someone to talk to with about my problems Someone to help me if I were sick and needed tobe in bed
Perc
ent
Categories of Stressful Events
Percentage of mothers who reported that they had the following types of social support after their baby was born by race/ethnicity: Minnesota, 2012-2015
U.S.-born Black American Indian Hispanic* White Other Total
1/16/201938
*Hispanic can be of any raceSource: Minnesota Pregnancy Risk Assessment Monitoring System (PRAMS), Minnesota Department of Health, Division of Community and Family Health, Maternal and Child Health.Funding for MN PRAMS is made possible by grant number: 5U01DP006217-03 from the Department of Health and Human Services, Centers for Disease Control and Prevention, National Center for Chronic Disease Prevention and Health Promotion

Social Support After Pregnancy
81.485.585.3 86.7
82.6 81.0
93.7 94.2
79.1 79.0
90.5 90.9
0
10
20
30
40
50
60
70
80
90
100
Someone to take care of my baby Someone to help me if I were tired and feeling frustrated with my new baby
Perc
ent
Categories of Stressful Events
Percentage of mothers who reported that they had the following types of social support after their most recent pregnancies months by race/ethnicity: Minnesota,
2012-2015
U.S.-born Black American Indian Hispanic* White Other Total
1/16/201939
*Hispanic can be of any raceSource: Minnesota Pregnancy Risk Assessment Monitoring System (PRAMS), Minnesota Department of Health, Division of Community and Family Health, Maternal and Child Health.Funding for MN PRAMS is made possible by grant number: 5U01DP006217-03 from the Department of Health and Human Services, Centers for Disease Control and Prevention, National Center for Chronic Disease Prevention and Health Promotion

Maternal Mortality
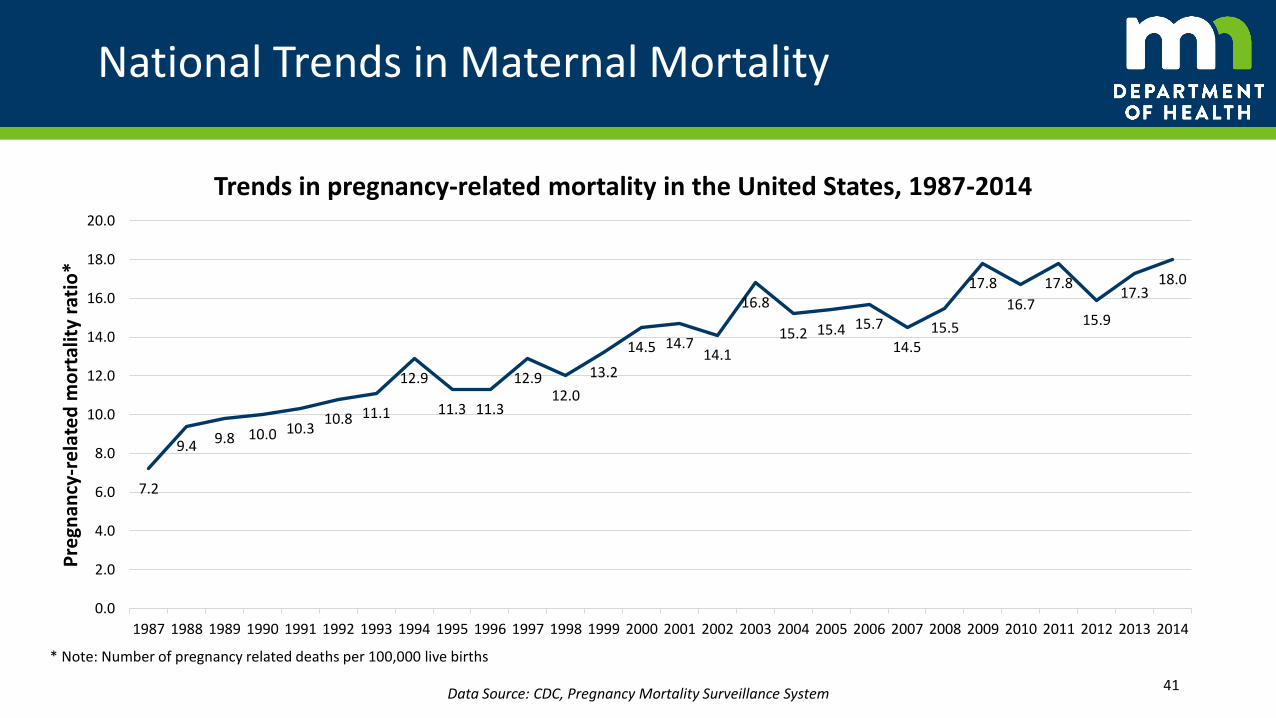
National Trends in Maternal Mortality
7.2
9.4 9.8 10.0 10.310.8 11.1
12.9
11.3 11.3
12.912.0
13.2
14.5 14.714.1
16.8
15.2 15.4 15.7
14.515.5
17.8
16.7
17.8
15.9
17.318.0
0.0
2.0
4.0
6.0
8.0
10.0
12.0
14.0
16.0
18.0
20.0
1987 1988 1989 1990 1991 1992 1993 1994 1995 1996 1997 1998 1999 2000 2001 2002 2003 2004 2005 2006 2007 2008 2009 2010 2011 2012 2013 2014
Pre
gnan
cy-r
ela
ted
mo
rtal
ity
rati
o*
Trends in pregnancy-related mortality in the United States, 1987-2014
41
* Note: Number of pregnancy related deaths per 100,000 live births
Data Source: CDC, Pregnancy Mortality Surveillance System

Maternal Mortality Definitions
• ACOG and CDC definitions
Pregnancy-associated death: The death of a woman while pregnant or within 1 year of termination of pregnancy, irrespective of cause.
Pregnancy-related death: The death of a woman while pregnant or within 1 year of termination of pregnancy, irrespective of the duration and site of the pregnancy, from any cause related to or aggravated by her pregnancy or its management, but not from accidental or incidental causes.
42
Berg, C., Danel, I., Atrash, H., Zane, S., & Bartlett, L. (2001). Strategies to reduce pregnancy-related deaths: From identification and review to action. Centers for Disease Control and Prevention: 1-214

National Maternal Causes of Death
15.2% 14.7%
12.8%11.5%
10.3%9.1%
7.4%
3.8%
5.5%
0.3%0.0%
2.0%
4.0%
6.0%
8.0%
10.0%
12.0%
14.0%
16.0%
Pe
rce
nta
ge o
f al
l pre
gnan
cy-r
ela
ted
de
ath
s Causes of pregnancy-related mortality in the United States, 2011-2014
43
* Note: The cause of death is unknown for 6.5% of all 2011-2014 pregnancy-related deaths.
Data Source: CDC, Pregnancy Mortality Surveillance System
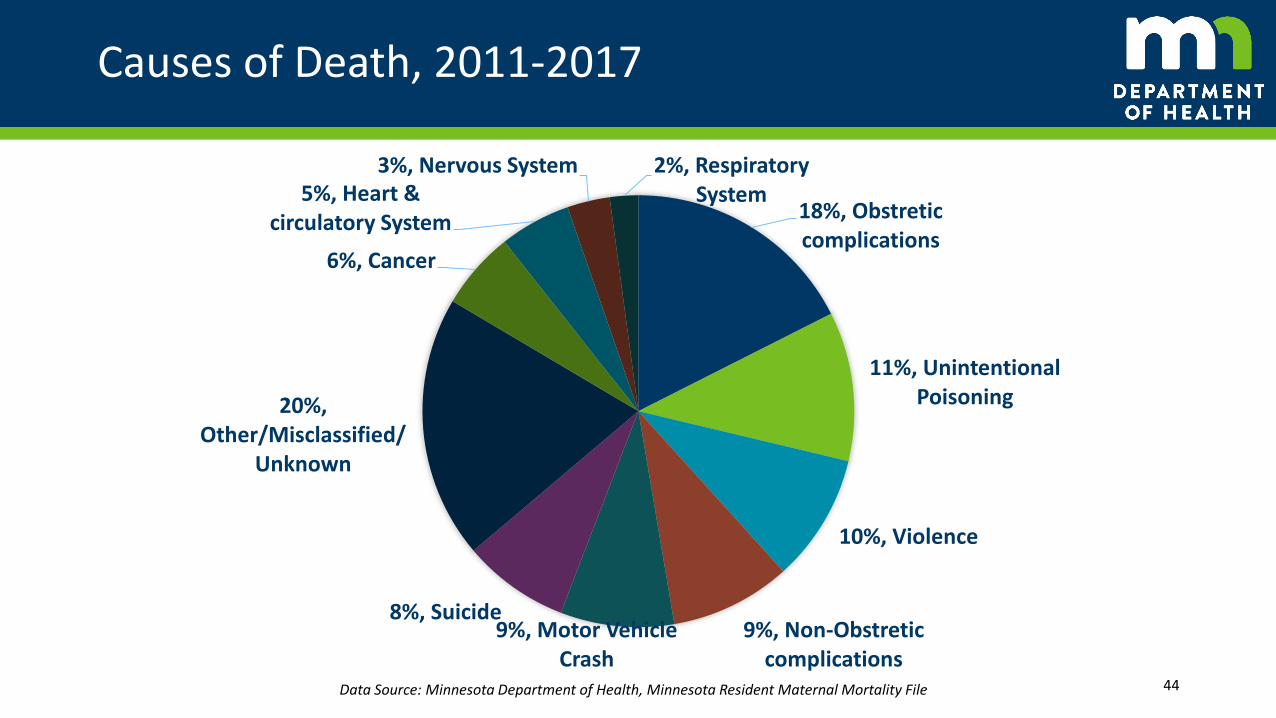
Causes of Death, 2011-2017
18%, Obstretic complications
11%, Unintentional Poisoning
10%, Violence
9%, Non-Obstretic complications
9%, Motor Vehicle Crash
8%, Suicide
20%, Other/Misclassified/
Unknown
6%, Cancer
5%, Heart & circulatory System
3%, Nervous System 2%, Respiratory System
44Data Source: Minnesota Department of Health, Minnesota Resident Maternal Mortality File

Minnesota Maternal Mortality Reviews
• Cases identified: check box on death certificate, clinician reporting and other
• Clinician conducts medical review of each case, develops a summary
• Review team assembles 2-3 times per year to review case summaries, identify causes, contributing factors and trends
• Some state include Morbidity reviews as well, would require statutory authority and resources to include in Minnesota
45
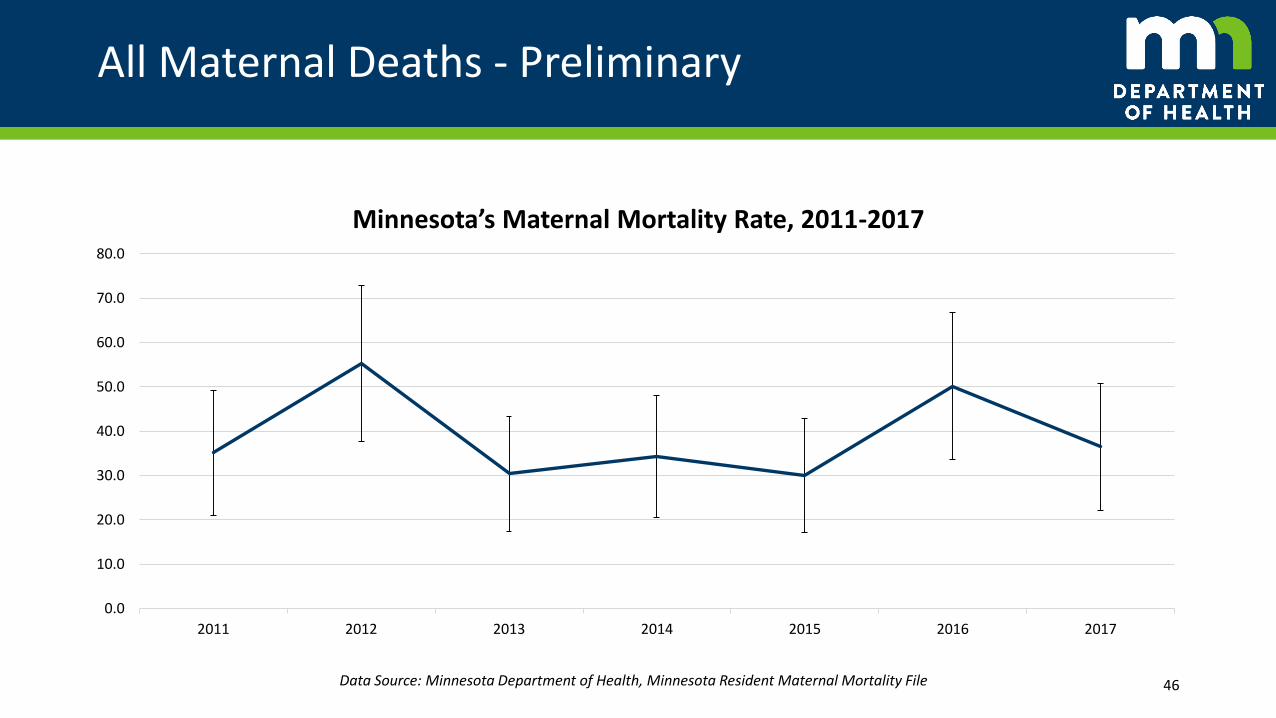
All Maternal Deaths - Preliminary
0.0
10.0
20.0
30.0
40.0
50.0
60.0
70.0
80.0
2011 2012 2013 2014 2015 2016 2017
Minnesota’s Maternal Mortality Rate, 2011-2017
46Data Source: Minnesota Department of Health, Minnesota Resident Maternal Mortality File

Disparities in pregnancy-related mortality, United States 2011-2015
12.4
40.0
17.8
0.0
5.0
10.0
15.0
20.0
25.0
30.0
35.0
40.0
45.0
White Black Other Races
Pre
gnan
cy-r
ela
ted
mo
rtal
ity
rati
o*
Disparities in pregnancy-related mortality in the United States, 2011-2014
47
* Note: Number of pregnancy related deaths per 100,000 live births
Data Source: CDC, Pregnancy Mortality Surveillance System
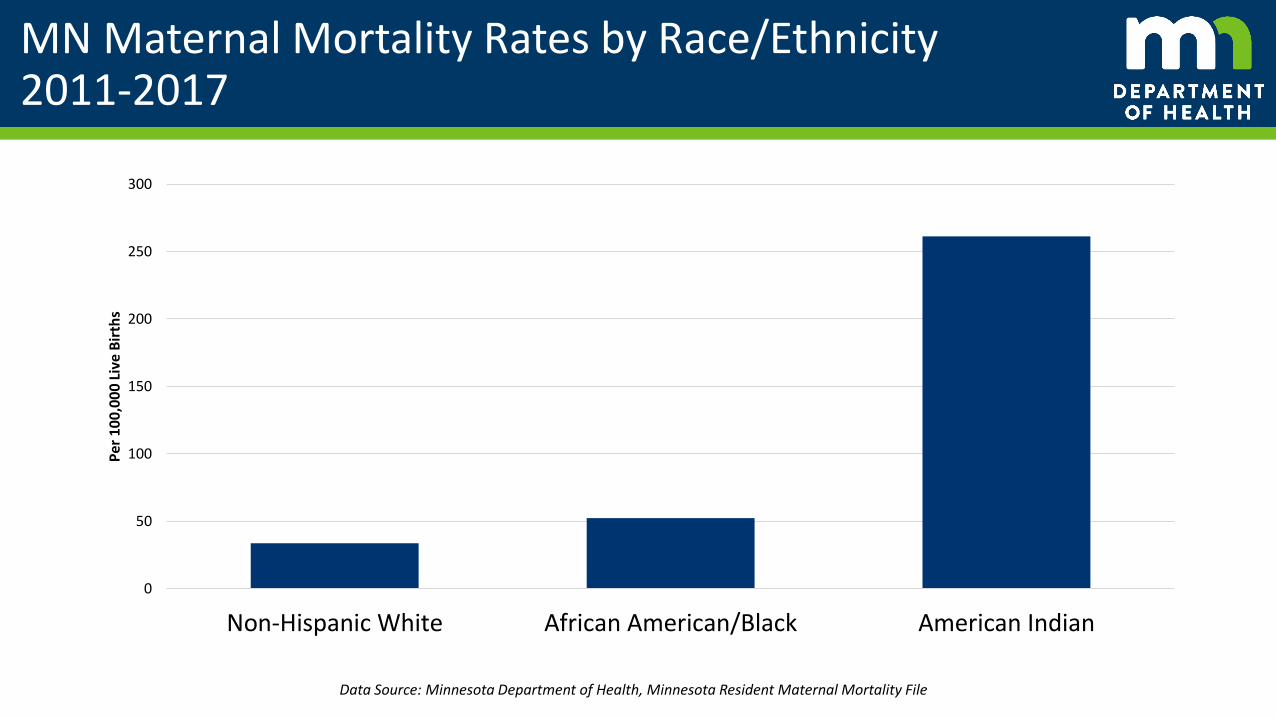
MN Maternal Mortality Rates by Race/Ethnicity2011-2017
0
50
100
150
200
250
300
Non-Hispanic White African American/Black American Indian
Per
10
0,0
00
Liv
e B
irth
s
Data Source: Minnesota Department of Health, Minnesota Resident Maternal Mortality File

Maternal Mortality in Minnesota, 2011- 2017
15%, African American/
Black
12%, American
Indian
4%, Asian/Pacific
Islander
6%, Hispanic
62%, Non-Hispanic
White
1%, Other & Unknown
PROPORTION OF MATERNAL DEATHS11%, African American/
Black2%,
American Indian
8%, Asian/Pacific
Islander
7%, Hispanic
72%, Non-Hispanic
White
1%, Other & Unknown
PROPORTION OF BIRTHS
Data Source: Minnesota Department of Health, Minnesota Resident Maternal Mortality File

MN Place of Maternal Death, 2011-2017
Physical Location
• Inpatient Hospital 40%
• Hospital E.R. / Outpatient 17%
• At Home 26%
• Interstate/Hwy/Road 6%
• In transport to Hospital 1%
• Other 10%
Geographic LocationProportionof Deaths
Proportion of Births
Hennepin County 27% 24%
Ramsey County 9% 11%
Suburbs* 17% 22%
Greater Minnesota
47% 43%
Data Source: Minnesota Department of Health, Minnesota Resident Maternal Mortality File
*Suburbs include: Anoka, Carver, Dakota, Scott, Washington
Thank you Contact information:
Susan Castellano | Maternal and Child Health Section ManagerJoan Brandt | Child and Family Health Division DirectorMira Grice Sheff | State MCH Epidemiologist, PRAMS PIKatie Linde | Women and Infant Health SupervisorMichelle Chiezah | Infant Mortality SpecialistMolly Meyer | Senior Research Scientist
Minnesota Department of [email protected](651) 201-3872
51