infectious diseases attributable to household crowding … · 2 citation: baker mg, mcdonald a,...
TRANSCRIPT

1
Infectious Diseases Attributable to
Household Crowding in New Zealand:
A Systematic Review and Burden of
Disease Estimate
2013
Professor Michael G Baker
Dr Andrea McDonald
Jane Zhang
Professor Philippa Howden-Chapman
He Kainga Oranga / Housing and Health Research Programme
University of Otago, Wellington

2
Citation: Baker MG, McDonald A, Zhang J, Howden-Chapman P. Infectious diseases
attributable to household crowding in New Zealand: A systematic review and burden
of disease estimate. Wellington: He Kainga Oranga/ Housing and Health Research
Programme, University of Otago, 2013.
Published in 2013 by He Kainga Oranga / Housing and Health Research Programme,
University of Otago, PO Box 7343, Wellington South, New Zealand
© 2013. He Kainga Oranga / Housing and Health Research Programme
Report may be quoted freely provided due acknowledgement is given
This document is available on the Housing and Health Research Programme website:
http://www.healthyhousing.org.nz/publications

3
Contents Tables ............................................................................................................................. 5
Figures............................................................................................................................ 7
Acknowledgements ........................................................................................................ 7
1. Executive Summary ............................................................................................... 8
2. Introduction .......................................................................................................... 12
3. Method ................................................................................................................. 14
3.1. Broad approach ............................................................................................ 14
3.2. Search strategy ............................................................................................. 14
3.3. Selection criteria .......................................................................................... 17
3.4. Data collection and analysis......................................................................... 18
3.5. Synthesis of results ...................................................................................... 20
3.6. Risk of bias in individual studies ................................................................. 21
3.7. Risk of bias across studies ........................................................................... 21
3.8. Burden of infectious disease from household crowding .............................. 21
4. Results .................................................................................................................. 23
4.1. Study selection ............................................................................................. 23
4.2. Narrative synthesis ....................................................................................... 26
4.3. Meta-analysis ............................................................................................... 28
4.3.1. Study level limitations ......................................................................... 31
4.4. Enteric infection ........................................................................................... 32
4.4.1. Gastroenteritis meta-analysis ............................................................... 32
4.4.2. Helicobacter pylori infection meta-analysis ........................................ 34
4.4.3. Hepatitis A meta-analysis .................................................................... 38
4.4.4. Giardia and intestinal parasites ............................................................ 39
4.5. Respiratory tract infections .......................................................................... 39
4.5.1. Pneumonia / lower respiratory infection meta-analysis ....................... 39
4.5.2. Bronchiolitis / Respiratory syncytial virus meta-analysis ................... 42
4.5.3. Upper respiratory tract infection meta-analysis ................................... 43
4.5.4. Meningococcal disease meta-analysis ................................................. 45
4.5.5. Haemophilus influenzae meta-analysis................................................ 46
4.5.6. Tuberculosis meta-analysis .................................................................. 48
4.5.7. Otitis media .......................................................................................... 50
4.5.8. Influenza .............................................................................................. 50
4.5.9. Measles, mumps, rubella, and varicella (chicken pox) ........................ 51

4
4.5.10. Rheumatic fever, heart disease and group A streptococcus ................. 51
4.6. Skin and eye infection .................................................................................. 52
4.6.1. Trachoma meta-analysis ...................................................................... 52
4.6.2. Other skin infection and Pediculosis.................................................... 53
4.7. Other infections ............................................................................................ 54
4.8. New Zealand studies .................................................................................... 55
4.9. Burden of infectious disease from household crowding .............................. 57
5. Discussion ............................................................................................................ 63
5.1. Key findings ................................................................................................. 63
5.2. Strengths and Limitations ............................................................................ 65
5.2.1. Biological plausibility .......................................................................... 65
5.2.2. Consistency with other research .......................................................... 65
5.2.3. Lack of intervention studies ................................................................. 66
5.2.4. Review level limitations ...................................................................... 66
5.2.5. Burden of disease limitations ............................................................... 67
5.3. Implications.................................................................................................. 67
5.3.1. Policy response to reduce household crowding ................................... 67
5.3.2. Further research ................................................................................... 69
6. Conclusion ........................................................................................................... 71
7. References ............................................................................................................ 72
5
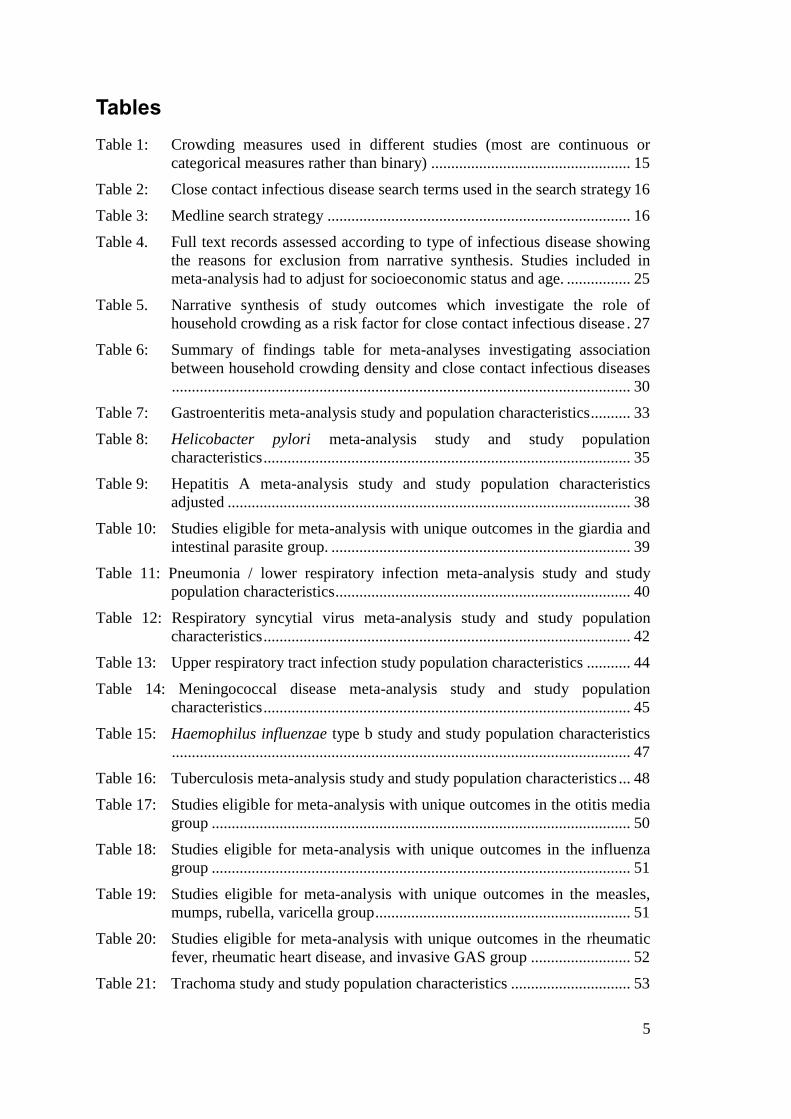
Tables
Table 1: Crowding measures used in different studies (most are continuous or
categorical measures rather than binary) .................................................. 15
Table 2: Close contact infectious disease search terms used in the search strategy 16
Table 3: Medline search strategy ............................................................................ 16
Table 4. Full text records assessed according to type of infectious disease showing
the reasons for exclusion from narrative synthesis. Studies included in
meta-analysis had to adjust for socioeconomic status and age. ................ 25
Table 5. Narrative synthesis of study outcomes which investigate the role of
household crowding as a risk factor for close contact infectious disease . 27
Table 6: Summary of findings table for meta-analyses investigating association
between household crowding density and close contact infectious diseases
................................................................................................................... 30
Table 7: Gastroenteritis meta-analysis study and population characteristics .......... 33
Table 8: Helicobacter pylori meta-analysis study and study population
characteristics ............................................................................................ 35
Table 9: Hepatitis A meta-analysis study and study population characteristics
adjusted ..................................................................................................... 38
Table 10: Studies eligible for meta-analysis with unique outcomes in the giardia and
intestinal parasite group. ........................................................................... 39
Table 11: Pneumonia / lower respiratory infection meta-analysis study and study
population characteristics .......................................................................... 40
Table 12: Respiratory syncytial virus meta-analysis study and study population
characteristics ............................................................................................ 42
Table 13: Upper respiratory tract infection study population characteristics ........... 44
Table 14: Meningococcal disease meta-analysis study and study population
characteristics ............................................................................................ 45
Table 15: Haemophilus influenzae type b study and study population characteristics
................................................................................................................... 47
Table 16: Tuberculosis meta-analysis study and study population characteristics ... 48
Table 17: Studies eligible for meta-analysis with unique outcomes in the otitis media
group ......................................................................................................... 50
Table 18: Studies eligible for meta-analysis with unique outcomes in the influenza
group ......................................................................................................... 51
Table 19: Studies eligible for meta-analysis with unique outcomes in the measles,
mumps, rubella, varicella group ................................................................ 51
Table 20: Studies eligible for meta-analysis with unique outcomes in the rheumatic
fever, rheumatic heart disease, and invasive GAS group ......................... 52
Table 21: Trachoma study and study population characteristics .............................. 53

6
Table 22: Studies eligible for meta-analysis with unique outcomes in the skin
infection and pediculosis (lice) group ....................................................... 53
Table 23: Studies eligible for meta-analysis with unique outcomes in the Epstein
Barr Virus, Herpesvirus group .................................................................. 54
Table 24: Studies eligible for meta-analysis with unique outcomes in multiple
infectious diseases group .......................................................................... 54
Table 25: Estimated burden of infectious disease in New Zealand attributable to
household crowding, 2007-11, total population........................................ 58
Table 26: Estimated burden of infectious disease in New Zealand attributable to
household crowding, 2007-11, European/Other ....................................... 59
Table 27: Estimated burden of infectious disease in New Zealand attributable to
household crowding, 2007-11, for Māori ................................................. 60
Table 28: Estimated burden of infectious disease in New Zealand attributable to
household crowding, 2007-11, Pacific peoples ........................................ 61
Table 28: Estimated burden of infectious disease in New Zealand attributable to
household crowding, 2007-11, Asian peoples .......................................... 62

7
Figures
Figure 1: Proposed relationship between household crowding and infectious disease
risk, including major confounders ............................................................ 13
Figure 2: Identification and selection of eligible studies. ......................................... 24
Figure 3: Gastroenteritis meta-analysis forest plot ................................................... 33
Figure 4: Helicobacter pylori meta-analysis forest plot ........................................... 37
Figure 5: Helicobacter pylori funnel plot ................................................................. 37
Figure 6: Hepatitis A meta-analysis forest plot ........................................................ 38
Figure 7: Pneumonia / lower respiratory infection meta-analysis showing combined
odds ratios and combined rate ratios forest ............................................... 41
Figure 8: Respiratory syncytial virus bronchiolitis meta-analysis forest plot .......... 43
Figure 9: Upper respiratory tract infections meta-analysis showing combined odds
ratios and combined rate ratios forest plots .............................................. 45
Figure 10: Meningococcal disease meta-analysis forest plot ..................................... 46
Figure 11: Haemophilus influenzae type b meta-analysis forest plot ......................... 47
Figure 12: Tuberculosis meta-analysis forest plot ...................................................... 50
Figure 13: Trachoma meta-analysis forest plot .......................................................... 53
Acknowledgements
The He Kainga Oranga/Housing and Health Research Programme at the University of
Otago, Wellington, would like to acknowledge support from Te Kete Hauora, Māori
Health Directorate, Ministry of Health for this project.
We also wish to acknowledge statistical and methodological advice from Dr Vanessa
Jordan.

8
1. Executive Summary
Context
The incidence of serious infectious diseases (IDs), notably respiratory, skin and
enteric infections, is increasing in New Zealand (NZ). Ethnic and socioeconomic
inequalities are large and rising, with markedly higher rates of IDs for Māori and
Pacific peoples relative to European/Other. It is important to identify factors that may
be contributing to this burden of disease, particularly factors that can be modified.
Household crowding is a plausible risk factor for transmission of IDs. Exposure to
household crowding is very unequal across ethnic groups in NZ. The 2006 Census
showed that for children <15 years, exposure to extreme crowding (2+ bedroom
deficit) was 9.9% for Māori and 20.9% for Pacific children compared with 1.8% for
European/Other.
As recently as 2001, a Ministry of Social Policy review of the effects of household
crowding on health concluded that the evidence was inconclusive and more research
was needed. This study therefore aimed to review the literature and summarise the
evidence linking household crowding to IDs to provide a base for estimating the
impact of exposure to household crowding on rates of serious IDs in NZ.
Objective
We aimed to identify and summarise cross-sectional, case-control, cohort and
intervention studies from the international published literature that investigated the
relationship between different degrees of exposure to household crowding density and
the outcome of close contact infectious disease (CCIDs). Studies examining
participants of any age group from any country were eligible.
We then aimed to estimate the impact of exposure to household crowding on the
burden of serious IDs in NZ.
Data Sources
A systematic literature search examined articles published before 8th
July 2012 in
Medline, Embase, Scopus, Web of Science, Index New Zealand, Cochrane Library
and the journal Lancet Infectious Disease. Additional articles were identified by
searching references and expert recommendation.
Study Selection
There were 9,852 articles identified. Based on a review of their abstracts, full texts of
838 studies were obtained for further assessment. Of these, 345 studies were eligible
for the narrative synthesis. And of these, 116 provided odds ratios or risk ratios
adjusted for age and socioeconomic status and were therefore eligible for meta-
analysis. Combined estimates were calculated for ten different categories of CCIDs
based on 82 studies.

9
Data Synthesis
Over half of the identified studies (55%, 189/345) demonstrated a statistically
significant association between greater household crowding and increased risk of
CCID, whereas only 1% (5/345) showed a beneficial effect from crowding. No
randomised trials were identified and only one study investigated a crowding
reduction intervention.
Where a combined estimate was possible, nine out of ten CCID categories
demonstrated a statistically significant association between greater household
crowding and increased disease risk, after taking into account the effect of age and
socioeconomic status. People living in households with the greatest vs. least crowding
density had increased odds of CCID ranging from 1.13 (gastroenteritis) to 3.78 times
greater risk (tuberculosis). More than half of the meta-analyses (6/10) were focussed
on studying how crowding impacts on children, and predominantly children less than
six years old.
Main findings and data quality
This collection of meta-analyses reveals a consistent association between crowding
and a range of CCIDs across a variety of settings and study designs. Meta-analyses
reliant on observational studies are considered low quality evidence for causality and
may be somewhat overstated by reporting bias and incomplete retrieval. However,
narrative review results of a much larger group of studies support the meta-analysis
results.
The most robust meta-analysis effect estimates provided evidence that household
crowding was associated with increased risk of gastroenteritis (OR 1.13, CI 1.01-
1.26), pneumonia / lower respiratory tract infection (LRTI) (OR 1.69, CI 1.34-2.13
and RR 1.36, CI 1.09-1.69), Haemophilus influenzae (Hib) disease (OR 1.74, CI 1.27-
2.37) and respiratory syncytial virus (RSV) bronchiolitis, when cohort (4.44, CI: 2.45-
8.04) and case-control data (OR 1.31, CI: 0.85-2.01) were considered separately.
There were also statistically significant associations between household crowding and
risk of hepatitis A (OR 1.53, CI 1.23-1.90), H. pylori infection (OR 1.82, CI 1.55-
2.14), meningococcal disease (OR 2.13, CI 1.38-3.29), tuberculosis (OR 3.78, CI
1.78-8.13) and trachoma (OR 2.07, CI 1.06-4.06). The later meta-analyses were less
robust due to greater unexplained heterogeneity (where study variability results in
observed effects being more different from each other than would be expected from
chance alone). Although there was a positive association between upper respiratory
tract infection (URTI) and household crowding, this relationship did not reach
statistical significance (OR 1.39, CI 0.69-2.79 and RR 1.63, CI 0.88-3.02). All
estimates may be somewhat overstated due to publication bias (where positive results
are more likely to be published than results of studies that are not statistically
significant).
For five of these outcomes (gastroenteritis, pneumonia, bronchiolitis, Hib disease, and
tuberculosis) there were additional studies that reported unique outcomes so could not
be included in the combined analyses. About half (8/15) of these additional studies
found significant positive associations between the disease in questions and household
crowding. The specific diseases were: toxoplasma gondii infection, typhoid fever,
wheeze associated with RSV, Haemophilus influenzae carriage, tuberculin positivity
(2 studies), and tuberculosis meningitis.

10
This review identified a further 21 eligible studies covering 16 specific infectious
diseases. The outcomes were too heterogeneous to allow for combined estimates. A
majority (13/21) found significant positive associations between the disease in
questions and household crowding. These diseases were: giardiasis, intestinal parasites
(3 studies), influenza-like-illness (2 studies), measles, varicella-zoster infection,
invasive GAS infection, pediculosis, Epstein–Barr virus infection, infectious illness
warranting hospitalisation, and communicable disease symptoms.
The evidence base of high-quality research studies was relatively large for some
important outcomes, such as gastroenteritis and pneumonia, and for some specific
infectious diseases, such as Helicobacter pylori infection, tuberculosis, Hib disease,
meningococcal disease and hepatitis A. For other important diseases the published
evidence base was very small, notably for skin infections and rheumatic fever. For
these conditions, there were insufficient high quality studies to produced combined
estimates of the effect of exposure to household crowding.
Estimated burden of ID from exposure to household crowding
We used a burden of disease (BoD) analysis to estimate the contribution of exposure
to household crowding to the incidence of serious IDs in NZ. This approach used the
effect measures obtained from the meta-analyses, combined with the estimated
prevalence of exposure to household crowding in NZ derived from the 2006 Census,
to estimate the population attributable fraction (PAF) of IDs from household
crowding. These PAFs were applied to hospitalisation incidence data for these IDs
(average annual numbers for 2007-11) to estimate hospitalisations attributed to
household crowding. This approach was repeated for nine categories of IDs (trachoma
was excluded as there is no transmission in New Zealand and URTI was included with
the uncertainty around this estimate reflected by the confidence intervals).
We estimated that 1,343 (CI 182-2843) hospitalisations per year in NZ are attributed
to household crowding. This total is 10% of the 13,680 hospital admissions a year
from these diseases (which represent about one fifth of the total 75,706 annual ID
hospitalisations in NZ over the 2004-08 period1). However, it is important to
recognise that this current analysis was restricted to just nine categories of IDs for
which summary estimates of the contribution of household crowding could be made.
Due to a lack of high quality published studies, no pooled estimates were possible for
many important IDs, such as skin infections and rheumatic fever. In addition, most of
these estimates apply to restricted age groups, further under-estimating the likely
burden of IDs in the total population.
There are very large ethnic inequalities within this disease burden. For
European/Others exposure to household crowding is estimated to cause 331 (CI 20-
779) admissions a year, or 5% of IDs (in the nine disease groups examined). For Asian
peoples exposure to household crowding is estimated to cause 108 (CI 23-206)
admissions a year, or 13% of IDs. For Māori the contribution from household
crowding is higher, with an estimated 790 (CI 106-1540) hospitalisations a year or
17% of ID admissions, and for Pacific peoples the estimated contribution is 692 (CI
136-1184) admissions a year or 25% of ID admissions in the disease groups
examined.
The contribution of exposure to household crowding is particularly large for some
diseases. Meningococcal disease predominantly occurs in children (0-16 years) and

11
the meta-analysis shows that risk is strongly associated with exposure to household
crowding. For Pacific children (where 45% are exposed to household crowding), an
estimated 34% of disease burden and in Māori children (where 28% are exposed to
household crowding) an estimated 23% of disease burden can be attributed to this
exposure. By comparison, the estimate is only 9% in European/Other children (where
only 8% are exposed to household crowding).
Conclusions
The findings of this review support the conclusion that household crowding is a very
important risk factor for transmission of most major categories of close-contact
infectious diseases. Restricting our analysis to the highest quality studies (n=116), and
those where there were multiple published works looking at similar outcomes, allowed
us to produce combined estimates of the effect of household crowding on ten
infectious diseases outcomes. In nine out of ten of these outcomes there was a
statistically significant positive relationship between household crowding and the risk
of disease (and in the remaining one the effect was positive but not statistically
significant).
This systematic review also supports the conclusion that ethnic inequalities in
household crowding in NZ are making a large contribution to inequalities in the risk
of infectious disease. Children are not only disproportionately exposed to household
crowding in NZ, but evidence suggests they may be disproportionately affected by the
consequences of this exposure.
Crowding reduction interventions have potential to reduce the burden of CCIDs in
NZ. The Housing New Zealand Corporation (HNZC) Healthy Housing Programme
included crowding reduction and was associated with a marked decline in
hospitalisation for children participating in the Programme. Policies to improve
housing affordability are suggested in order to address household crowding in NZ.
This includes increasing the number and proportion of social and affordable houses,
improving accessibility to social and affordable housing for all ethnic groups, and
ensuring housing subsidies and supplements are available for low income households
with the most need, particularly large families with children.
Future crowding reduction programmes could be implemented in a way that supports
high quality evaluation thus adding to the very small evidence base we currently have
of intervention studies in this area. The gold standard of evidence for causality would
be from a staggered intervention trial, where one group would be randomly allocated
to a comprehensive crowding reduction programme and a second group would receive
the intervention at a later time.

12
2. Introduction
New Zealand has experienced a marked increase in rates of serious infectious diseases
(IDs), notably respiratory, enteric and skin infections.1 These diseases show
significant inequalities with rates that are more than twice as high for Māori and
Pacific peoples relative to European/Others and almost three times higher for those
living in the most deprived neighbourhoods compared with the least deprived.1 Large
inequalities have been reported for many specific IDs including tuberculosis,2 acute
rheumatic fever,3 meningococcal disease,
4 childhood pneumonia
5 and skin infections.
6
In the 2009 H1N1 influenza pandemic, hospitalisation rates were 3.0 times higher for
Māori and 6.7 times higher for Pacific peoples than for the European/Other ethnic
grouping.7 These inequalities are most marked for close-contact infectious diseases
(CCIDs), those which are transmitted between people.8
Exposure to household crowding in NZ is highly patterned by age, ethnicity and
socioeconomic status.9,10
The distribution of exposure to household crowding is
unequal with higher levels for children relative to adults, and for Māori and Pacific
relative to European/Other.10
Households in rental accommodation are more likely to
be crowded (11%) than those in dwellings owned with a mortgage (4%) or mortgage-
free (2%).11
Many tenants are children, with 45% of HNZC tenants being less than 18
years of age, with a median age of 20 years (compared with the national median age of
36 in 2006).12
Crowding varies by region in NZ with the highest level of household
overcrowding in Manukau City (24% of people), followed by Opotiki and Porirua.
The broad causal pathway linking household crowding to an increased risk of CCIDs
is shown in Figure 1. This figure also shows major health determinants (notably age
and socioeconomic status) that influence the risk of CCIDs through their association
with household crowding and other pathways.
In 2001, a Ministry of Social Policy review of the effects of household crowding on
health concluded that the available evidence was inconclusive and more research was
needed.13
Since then, household crowding has become more widely acknowledged as
an important health determinant. NZ research has identified exposure to household
crowding as an important risk factor for IDs,14
notably meningococcal disease,15
tuberculosis,16
rheumatic fever17
and pneumonia.18
The Ministry of Social
Development included exposure to household crowding as an indicator of economic
wellbeing in all of its annual Social Reports from 2001 to 2010.19
The strength of a systematic review and meta-analysis is that multiple study results
can be combined in a consistent and robust manner. This process minimises the play
of chance, of which small studies are particularly at risk, and reduces bias that may be
introduced by investigators’ inherent beliefs.
This systematic review aimed to identify and summarise the international published
literature from cross-sectional, case-control, cohort and intervention studies that
investigate the relationship between high vs. low household crowding density and a
CCID outcome. Studies examining participants of any age group from any country
were eligible. Meta-analysis was used to summarise the association between crowding
and CCID, independent of age and socioeconomic status.

13
Figure 1: Proposed relationship between household crowding and infectious disease
risk, including major confounders
Factors increasing risk of
infection and progression
to serious disease (eg poor
nutrition, low access to
primary care)
Low SES position /
poverty
High level of household
crowding
Exposure to active
smoking or
environmental tobacco
smoke (ETS)
Increased
risk of close
contact
infectious
disease
Health determinants
Vulnerable age
(particularly
child)
Exposures / Risk factors Health outcome

14
3. Method
3.1. Broad approach
A systematic review of the international literature was conducted to investigate the
association between household crowding density and CCIDs. A transparent search
strategy and predefined set of eligibility criteria were applied to identify the most
relevant studies. The results of the studies were combined both qualitatively (by
narrative synthesis) and quantitatively (by meta-analysis) to give an overall picture of
the available evidence. Our methods were steered by the PRISMA guidelines for
reporting systematic reviews and meta-analyses.20
The review protocol was registered
on PROSPERO.
3.2. Search strategy
A systematic strategy was developed, piloted and implemented to search library
databases. The search is up to date as of the 6th
July 2012. Databases searched were
Medline (1966 to 2012), Embase (1988 to 2012), Scopus, Web of Science, Index New
Zealand and the Cochrane Library. The journal Lancet Infectious Disease (highest
rated infectious disease journal) was examined more closely for relevant articles by
applying simplified search terms.
A small number of articles were identified by expert recommendation. Additional
articles for each CCID were identified by exploring the references of the most recent
eligible articles. At least one review article was also identified from Google Scholar
for each infectious disease and searched for references. If referenced articles met the
eligibility criteria they were added to the full text screening.
The search strategy was developed to identify all articles measuring household
crowding in combination with any one of a broad set of IDs. Key word searches were
used for each of the databases with the addition of customised MeSH terms for
Medline and Embase. The majority of studies were published in journals. Studies
could be from any year of publication limited only by the limits of each database. The
search was limited to human and English language categories.
A pilot search was carried out in Medline to identify studies that referenced household
crowding and CCIDs, using the terms; “crowding” (MeSH), “overcrowding” (key
word) and “household density” (key word). Infectious origins were detected using the
following high-level mesh terms; “bacterial infections and mycoses”, “virus diseases”
and “parasitic diseases”. The pilot highlighted the assortment of measurements that
are used to assess household crowding (Table 1). This information informed the final
search strategy.
We aimed to identify household crowding studies with search terms that encompassed
the concepts of both people and space, including ratios of the number of people in a
household per the number of rooms, people per metre2, bedroom sharing and house
area. Each of these aspects was identified using adjacent search term functions (within
three words) available in all four key databases. Although it was rarely used, house
area was also adopted as a density measure because it has the potential to differentiate
between different levels of crowding density for families of a similar size.
The number of people in a household was initially considered to be an eligible
crowding measure, however, it was later excluded because it had limited specificity as

15
a density measure and furthermore it identified an unmanageably large number of
potential papers. Bed sharing was excluded because it is more of a behavioural
exposure than housing related. Therefore, we chose to concentration this review on
measures of household crowding that specifically focus on density including concepts
of both people and space (See eligibility criteria).
Table 1: Crowding measures used in different studies (most are continuous or
categorical measures rather than binary)
Measure Frequency
People per house (including adults or children per house) 12
People per room 26
People per bedroom 10
People per bed or bed sharing 1
Square metres per person 3
House size below threshold (eg 1 room, <x square meters) 3
Total 55
The pilot search on crowding and infectious disease also identified which CCIDs,
syndromes and microbes have a literature base that investigates an association with
household crowding. The IDs identified in the pilot were aligned with specific search
terms in the final search strategy (
Table 2). In this way, the sensitivity of the search was maximised for these IDs.
Furthermore, the breadth of CCIDs identified by the search was maximised by
including broad infectious disease terms such as “communicable disease”, “viral
infection”, and “bacterial infection”. An example of the search strategy is presented in
Table 3 showing the combination of MeSH terms and keywords used in Medline. The
search was adapted to search Embase, Scopus and Web of Science but used similar
terms.

16
Table 2: Close contact infectious disease search terms used in the search strategy
ID category Type of infectious disease Search terms used
Enteric Gastroenteritis, Rotavirus diarrhoea or vomiting or gastritis or gastroenteritis or rotavirus
Helicobacter pylori infection helicobacter
Hepatitis A hepatitis
Respiratory Pneumonia pneumonia
Respiratory tract infection respiratory tract infection, bronchitis or Pneumococc*
Bronchiolitis / Respiratory syncytial virus (RSV) infection
respiratory syncytial virus or bronchiolitis
Otitis media otitis
Meningococcal disease mening* or encephalitis or sepsis
Haemophilus influenzae type b haemophilus
Influenza influenza
Tuberculosis tubercul*
Acute rheumatic fever, Group A Streptococcus (GAS)
rheumatic fever or Streptococc*
Skin and eyes Skin infection / cellulitis skin infect* or cellulitis
Head lice pediculosis capitis or head lice
Staphylococcal infection / Methicillin resistance Staphylococcus aureus (MRSA)
staphylococc*
Blood-borne Hepatitis B/C hepatitis
Table 3: Medline search strategy
Exposure: crowding Outcome: infectious disease Limits
MeSH terms
Crowding/
or bed sharing/
Keywords
crowd*
or overcrowd*
or per room
or ((People or person or persons or child* or adult or adults or resident or residents or member*) adj3 (room* or bed* or area or m2 or square meter* or square metre* or ft2 or square feet*))
or ((bed* or room*) adj3 (sharing or share))
or ((hous* or home) adj3 (area or m2 or square meter* or square metre* or ft2 or square feet* or size or density))
MeSH terms
exp Communicable Diseases/ or exp bacterial infection/ or exp virus infection/ or exp parasitosis/
or exp meningococcosis / or exp tuberculosis/ or exp rheumatic fever/ or exp Haemophilus Infection/ or exp pneumonia/ or exp otitis media/ or respiratory syncytial virus infection/ or exp bronchiolitis/ or exp respiratory tract infection/ or exp gastroenteritis/ or exp acute diarrhea/ or exp infectious diarrhea/ or Vomiting/ or helicobacter infection/ or exp skin infection/ or cellulitis/ or exp conjunctivitis/ or exp acute hepatitis/ or exp chronic active hepatitis/ or exp chronic hepatitis/ or exp infectious hepatitis/ or exp virus hepatitis/ or rotavirus infection/ or exp Influenza/
Keywords
Mening* or encephalitis or sepsis or tubercul* or rheumatic fever or Haemophilus or pneumonia or otitis or respiratory syncytial virus or bronchiolitis or bronchitis or respiratory tract infection or gastroenteritis or diarrhea or Vomiting or gastritis or helicobacter or skin infect* or cellulitis or conjunctivitis or Hepatitis or Pediculosis capitis or head lice or rotavirus or Influenza or Staphylococc* or Streptococc* or Pneumococc*
Human
English

17
3.3. Selection criteria
Eligibility criteria were used to limit our selection of studies to those most relevant to
our research question. If a study did not meet any one of the following criteria it was
not eligible for narrative synthesis or meta-analysis.
Inclusion and exclusion criteria
We were interested in studies from any population. No exclusions were made based
on age or country in order to ensure the broadest range of evidence was examined.
Study populations with a high risk of disease were also eligible, such as infants born
prematurely with higher risk of infection, or patients presenting with symptoms (such
as dyspepsia) that might be a result of the infectious disease of interest (H. pylori).
The study was required to evaluate household crowding density as an exposure
variable. Eligible crowding measures included: the number of household members per
number of rooms; persons per area (such as m2); number of persons sharing the same
bedroom; and any measure of house area (e.g. number of rooms or m2). Crowding
measures excluded were the number of occupants per household, number of siblings
in the household and bed sharing (however, studies with these measures of crowding
were full text screened to determine whether additional crowding measures had also
been used). Mass gathering, prison, military, workplace, day care and institutional
care measures of crowding, were not eligible. Studies that had a CCID outcome but
did not indicate household crowding in the title or abstract were only included where
there was some indication that crowding may have been measured, such as reference
to a multivariate analysis or housing factors.
A statistical comparison was required between greater and lesser levels of household
crowding density. Any statistical measure was eligible for narrative synthesis such as
an odds ratio (OR), rate ratio (RR), beta coefficient or difference between two means.
Only ORs and RRs were combined in the meta-analysis.
Studies that reported any outcome measure of CCID were eligible. Outcome measures
of infection included incidence, prevalence, severity (e.g. hospitalisation) and
mortality. Objective identification of CCID was required such as laboratory detection
of a particular pathogen (active infection or carriage) and / or a clearly defined clinical
syndrome attributable to infectious disease. CCIDs are spread by person-to-person
contact in the community and include respiratory, enteric (faecal-oral), skin and
potentially blood borne infections such as those shown in
Table 2. Hospital acquired IDs were excluded because they are more likely to relate to
hospital factors than housing factors. Asthma, allergy and vector-borne infections,
such as malaria, were not considered CCIDs (though infectious disease is likely to
contribute to exacerbations of chronic diseases such as asthma).
Any quantitative study design with an individual level of analysis was eligible,
including cohort, case-control and cross-sectional studies. These criteria excluded
ecological study designs and neighbourhood measures of crowding. Our focus here
was on non-randomised observational studies. Systematic reviews, case studies and
case series (<20 participants) were excluded.

18
Screening
The first step was to screen the titles and abstracts identified in the search. References
from the database search were imported into a reference manager and duplicates were
removed. The title (+/- abstract) of each study was assessed as to whether it might
meet the eligibility criteria. Potentially eligible studies were then categorised by
CCID. Some articles simultaneously investigated two or more CCIDs and were
categorised by each of them. CCID categories were the same as those used in the
search strategy with the subsequent addition of intestinal parasites; cytomegalovirus,
Epstein Barr virus or herpesvirus; measles, mumps, rubella or varicella (chicken pox);
scabies; conjunctivitis; trachoma; and studies which combined multiple IDs.
Every effort was made to obtain full text articles for the set of potentially eligible
articles, irrespective of the journal in which they were published.
The second step involved screening the full texts of each study to assess whether they
met the eligibility criteria. The outcome of screening was documented. For each study,
eligibility criteria were assessed in the following order: study design; infectious
disease outcome; household crowding density measure; and an appropriate
comparison group.
Screening and the full text extraction was carried out by one reviewer (AM) who
consulted another reviewer (MB) where required.
Narrative synthesis and meta-analysis
Studies that met all of the eligibility criteria were included in the narrative synthesis.
To be eligible for meta-analysis, studies were additionally required to provide an OR
or RR (or data to calculate this) that was adjusted for confounding from age and
socioeconomic status (see Figure 1). Although tobacco smoke exposure is also an
important risk factor for respiratory infections, we considered it too restrictive to also
require adjustment for this exposure. Adjustment for low socioeconomic status
provides some adjustment for tobacco smoke exposure given the association between
low socio-economic status and tobacco use.
Adjustment for confounding could be made by stratification, standardisation and/or
regression. If a multivariate analysis was used to estimate the OR, both age and
socioeconomic status had to be considered for the model, even if these variables were
excluded from the final model because they had no predictive value or no confounding
value. Socioeconomic status was defined as any measure of income, occupation,
education, deprivation, residence or housing amenity factors (such as the presence of a
toilet).
3.4. Data collection and analysis
Extraction of data
Key information from all eligible studies was extracted into a spread sheet. Data
included: country; age of participants; exposure measure; outcome measure; study

19
design; number of subjects; crude measure of effect; direction of the effect; and
statistical significance.
A spread sheet was developed and piloted for the full text extraction of studies eligible
for meta-analysis. The following information was extracted for each study outcome:
1. Identifiers
a. Disease of interest
b. Author, year
2. Study design
a. Study design (e.g. cross-sectional, case-control, cohort)
b. Outcome measure (most crowded vs. least crowded category)
c. Exposure measure in crowded vs. not crowded
d. If case-control studies: how were the cases selected and matched?
e. Socioeconomic status variable(s) adjusted for (or considered in brackets)
f. How was age adjusted for?
g. If respiratory: What smoking or indoor smoke variables were adjusted for?
(or considered in brackets)
h. Other crowding variables adjusted for
i. Any other variables adjusted for
3. Study population:
a. Country
b. Years that study was carried out
c. Incidence or prevalence of the infectious disease of interest
d. Was the study population high risk or population representable?
e. What was the age range of the population studied?
f. How many study participants (if case control: broken down by cases and
controls)
4. Unadjusted measure of effect
a. OR: odds ratio / RR: rate ratio
b. LCI: lower 95% confidence interval
c. UCI: upper 95% confidence interval
d. P-value if CI unavailable
5. Adjusted measure of effect (from an eligible model with the most number of
variables)
a. OR: odds ratio / RR: rate ratio
b. LCI: lower 95% confidence interval
c. UCI: upper 95% confidence interval
d. P-value if CI unavailable
For each specific CCID, meta-analysis was carried out when two or more eligible
studies measured the same outcome using the same measure of effect (OR or RR). If
there was a choice between different eligible models in a study, the model that
adjusted for the greatest number of variables was selected.
Avoiding duplication
Some articles contributed data to more than one CCID, for example, if a cohort study
investigated both gastroenteritis and pneumonia as outcomes, both would be included
in our results. If a study stratified results by sub-populations and no overall measure of

20
effect was available, each strata’s results was considered as a separate study for the
purposes of analysis. For example, some studies stratified results by two separate age
groups and each group was analysed separately.
Within each CCID we aimed to limit the contribution of any one study to the overall
result. If more than one article used the same study data, the most recent article was
selected for extraction. Where a study investigated two outcomes for the same
infectious disease, one outcome was selected for inclusion in the review. The choice
of included outcome was based the most objective measure (for example a laboratory
test is more objective than reported symptoms), the measure most comparable with
other studies (for example prevalence was more common than disease severity), a
combined measure or, failing that, the more common outcome.
If there was two or more eligible crowding exposures, then one was selected based on
the following order of priority: ratio of persons to the number of rooms (prioritising
childhood exposure over adult exposures); area per person; persons per bedroom
(prioritising siblings closest in age over parents in same bedroom); house area or
other. This order is based on the validity of each measure in quantifying household
crowding density, potential relevance to CCID transmission and the frequency that
each measure is used in the literature.
3.5. Synthesis of results
Narrative synthesis of eligible study outcomes was carried out to summarise the
overall scope of the available literature. The proportion of studies that demonstrated
statistically significant associations between household crowding and ID was reported,
along with whether the effect was positive or negative.
A sub-group of studies with adjusted estimates from the narrative synthesis was then
summarised by meta-analysis. Meta-analysis combines study data to calculate
summarised effect estimates. Our methods are based on Cochrane Handbook
guidance.21
Data were entered into Revman5 software and forest plots were created using random
effects analysis to allow for heterogeneity between studies. The inverse variance
function was selected to input study data. This required that odds ratios were
converted into natural logarithms [ln(OR)] and standard errors were calculated from
the 95% confidence intervals using the following formula22
:
SE[ln(OR)] = [ ln(upper limit) – ln(lower limit) ] / 3.92
If confidence intervals were not given, but a p-value was reported, the standard error
was calculated from the p-value.22
This assumes a Wald test is used to calculate the
reported p-value and uses the following formula:
SE[ln(OR)] = ln(OR) / Z(p-value)
Heterogeneity occurs when the variability in study participants, interventions,
outcomes, design and methods results in observed effects being more different from
each other than would be expected from chance alone.21
Heterogeneity between
studies was assessed by visual inspection and the I2 statistic.
21 I
2 describes the
percentage of variability in effect estimates that is due to differences between studies
rather than sampling error (chance).

21
For example I2 =
0% to 40%: might not be important
30% to 60%: may represent moderate heterogeneity
50% to 90%: may represent substantial heterogeneity
75% to 100%: considerable heterogeneity
Where numbers were adequate, sub-group meta-analysis was considered to investigate
heterogeneity. Pre-specified sub-groups were study design, high and low income
country and high and low quality studies. Sub-groups later considered included low
vs. high risk study populations, and child vs. adult exposure to crowding.
3.6. Risk of bias in individual studies
Non-randomised study outcomes are subject to greater bias than randomised studies.
For this reason we limited the meta-analysis to studies which adjusted for two major
identified confounders: age and socioeconomic status. The meta-analysis combined
only the adjusted measures of effect. In this way we aimed to demonstrate the impact
of household crowding independent of age and socioeconomic status.
3.7. Risk of bias across studies
Funnel plots produced by RevMan5 were used to describe potential publication bias if
more than eight studies were combined in each meta-analysis. Risk of publication bias
based on the symmetry of the funnel plots was evaluated as high, moderate or low.
The narrative synthesis provides another layer of analysis to view the wider collection
of studies (irrespective of whether they adjust for confounding) and comment on the
association between crowding and ID.
3.8. Burden of infectious disease from household crowding
The burden of disease (BoD) analysis combined the results of the systematic review,
described in the previous parts of this report, with other data to estimate the burden of
IDs that can be attributed to household crowding. These other data sources were two
related reports prepared for the Ministry of Health which examined the incidence of
CCIDs8 and the distribution of household crowding in NZ,
10 as well as a published
paper on the incidence of serious IDs in NZ.1
Environmental BoD methodology can be applied to estimate the expected proportion
of a health outcome (in this case IDs) that can be attributable to a particular
environmental exposure (in this case household crowding).133
We have previously
used this method to estimate the burden of tuberculosis that can be attributed to
household crowding in Europe.134
The first step is to estimate the population attributable fraction (PAF) which is the
proportion of disease burden attributable to exposure to household crowding,
calculated using the following formula:

22
Population attributable fraction (PAF) = p (RR-1)
p (RR-1) + 1
This estimate is based on the effect measure (OR or RR) obtained from the systematic
review (Table 6) combined with the prevalence of exposure to household crowding
(p). ORs were substituted for RRs where RRs were not available. ORs are a
reasonable approximation and do not substantially (at the very most 5%) overestimate
the RR because the summary estimates are small (all ORs < 4) and incidence of
hospital admission is low (< 2% per annum).135
These methods make the assumption
that the association is causal.
The measure of disease incidence was acute and arranged overnight hospitalisations,
as previously reported.1 We consider that these events provide a reasonably consistent
measure of the burden of serious IDs in NZ. The PAF was applied to the incidence of
each ID in the age group of participants that contributed to the combined effect
measures (eg, if the meta-analysis was for gastroenteritis in children aged <5 years,
then we applied the PAF to hospitalisation rates for this condition in this age group).
The incidence rates were based on average hospital admissions over the 2007-11
period.
For most ID categories, we simply used hospitalisations for the disease outcomes that
best matched the PAF conditions. The one exception was for H. pylori infection,
where we used hospitalisations for the known sequelae of infection (non-cardia gastric
cancer, peptic ulcer, chronic gastritis and duodenitis). The justification is that H.
pylori infection is considered the predominant cause of these diseases.1
The analysis by ethnic group used four ethnicity categories: European/Other, Māori,
Pacific, and Asian. We used ‘total response’ ethnicity, meaning that those recording
multiple ethnicities were included in all of the ethnic groups that they nominated so
some individuals were effectively counted more than once. This approach was
consistent across the numerator (hospitalisations), denominator (2006 Census
population), and crowding exposure (again based on 2006 Census data10
).
It is important to recognise that this current analysis has been restricted to just nine
categories of IDs where estimates of the contribution of household crowding have
been made (trachoma was excluded because transmission does not occur in NZ). In
addition, most of these estimates apply to restricted age groups. Due to a lack of high
quality published, no pooled estimates have been possible for many important IDs,
such as skin infections and rheumatic fever. For ‘Pneumonia/lower respiratory tract
infection’ we have chosen to use the estimate for the wider age range (0-5 years)
derived from case-control and cross sectional studies, instead of the estimate from the
narrower age range (0-3 years) derived from cohort studies. We have also retained
results for ‘Upper respiratory tract infections’ even though results for the two meta-
analyses (case-control and cross-sectional studies in children 0-18 years, and cohort
studies in 0-2 year olds) were not significant. We retained this category as findings
from both meta-analyses showed a consistently positive association and the
uncertainty could be demonstrated in our hospital admissions estimates. Again, we
selected the results for the wider age group (0-18 years) rather than the findings for the
narrower age group (0-2 year olds). When calculating the total burden of IDs
attributable to crowding exposure, we removed bronchiolitis (J21) and Hib (J14) from
the pneumonia/LRTI category to avoid double counting.

23
4. Results
4.1. Study selection
Over 18,000 articles were identified from database searching including 3,178 from
Medline, 4,453 from Embase, 5,045 from Scopus, 5,466 from Web of Science, 4 from
the Cochrane library, 110 from Index New Zealand and 130 from Lancet Infectious
Diseases. A further 111 articles were identified from reference searching and 9 were
identified by expert recommendation.
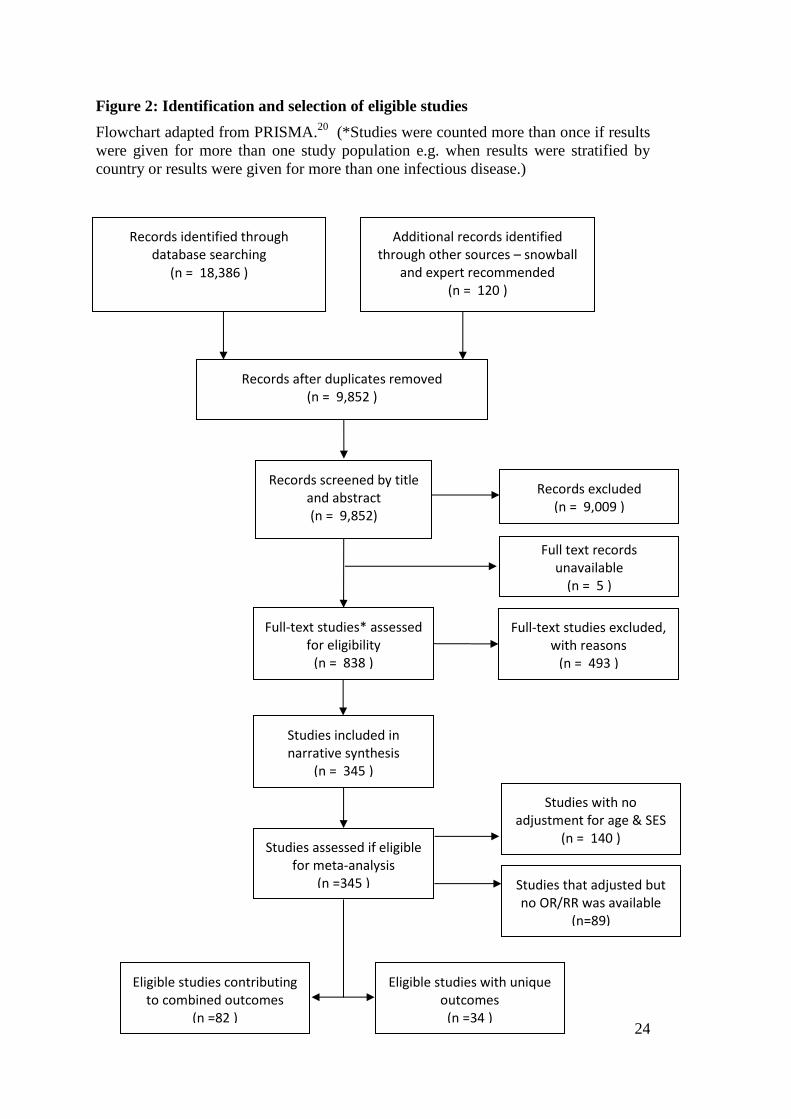
The screening and selection process is illustrated by the flowchart in Figure 2. After
removing duplicate articles 9,852 records remained and were screened by title and
abstract. Common reasons for exclusion at this stage included the absence of
infectious disease outcome, eligible household crowding measure or eligible study
design.
A total of 838 studies were assessed by full text screening. Of these, 493 were
excluded from further analysis because they did not meet the eligibility criteria (Table
4). The most common reason for exclusion at this stage was the absence of an eligible
household crowding density measure (311/838 records) and an inadequate study
design (112/838 records), which includes some exclusions for articles presenting
duplicate study results. The screening process culminated in 345 studies eligible for
narrative synthesis.
24
Figure 2: Identification and selection of eligible studies
Flowchart adapted from PRISMA.20
(*Studies were counted more than once if results
were given for more than one study population e.g. when results were stratified by
country or results were given for more than one infectious disease.)
Studies that adjusted but no OR/RR was available
(n=89)
Studies with no adjustment for age & SES
(n = 140 )
Records excluded (n = 9,009 )
Records identified through database searching
(n = 18,386 )
Additional records identified through other sources – snowball
and expert recommended (n = 120 )
Records after duplicates removed (n = 9,852 )
Records screened by title and abstract (n = 9,852)
Full-text studies* assessed for eligibility
(n = 838 )
Full-text studies excluded, with reasons
(n = 493 )
Studies included in narrative synthesis
(n = 345 )
Full text records unavailable
(n = 5 )
Studies assessed if eligible for meta-analysis
(n =345 )
Eligible studies contributing to combined outcomes
(n =82 )
Eligible studies with unique outcomes
(n =34 )

25
Table 4. Full text records assessed according to type of infectious disease showing
the reasons for exclusion from narrative synthesis. Studies included in meta-
analysis had to adjust for socioeconomic status and age.
Close-contact Infectious Disease Number full text studies screened
Studies excluded with reasons Studies Included
Study design
Infect. disease outcome
HH crowd. density expos.
Compa-rison group
Narrative synthesis
Meta-analysis
Enteric infection
Gastroenteritis* 81 9 3 37 3 29 10
Helicobacter pylori* 99 3 4 28 1 63 28
Hepatitis A* 37 4 0 17 1 15 7
Giardia and cryptosporidium 9 0 0 5 1 3 1
Intestinal parasites 31 2 1 18 0 10 3
Respiratory tract infection
Pneumonia / lower respiratory tract infection* 33 3 0 5 0 25 7
Bronchiolitis / Respiratory syncytial virus* 44 5 14 13 0 12 5
Upper respiratory tract infection* 90 13 6 25 1 45 10
Meningococcal disease* 27 2 0 8 1 16 7
Haemophilus influenzae type b* 25 4 0 3 1 17 7
Tuberculosis* 73 25 3 18 5 22 12
Otitis Media 17 1 0 6 0 10 3
Influenza 22 7 1 10 0 4 2
Measles, Mumps, Rubella, Chicken pox 25 5 1 14 0 5 2
Rheumatic fever, RHD, GAS 36 6 0 13 2 15 4
Skin & eye infection
Conjunctivitis 5 0 0 3 0 2 0
Trachoma* 7 1 0 3 0 3 2
Staphylococcus aureus (MRSA) 8 2 0 5 0 1 0
Pediculosis (lice) 20 1 1 7 0 11 1
Scabies 19 3 1 8 1 6 0
Other skin infection 29 1 1 16 0 11 1
Blood born infection
Hepatitis B 23 2 1 11 1 8 0
Hepatitis non-A, non-B 8 1 0 6 0 1 0
Other
Cytomegalovirus 9 1 0 5 0 3 0
Epstein Barr virus, Herpes virus 9 0 0 6 0 3 2
Multiple infectious disease 22 6 5 7 0 4 2
Other infectious disease 22 4 4 13 0 1 0
Other outcomes/exposures 8 1 6 1 0 0 0
Total 838 112 52 311 18 345 116
*Disease included in meta-analysis

26
4.2. Narrative synthesis
After full assessment, 345 studies were selected for narrative synthesis. The largest
group of outcomes was for respiratory infections (131), followed by enteric infections
(120), skin and eye infection (34) and blood borne infections (9). The study
populations tended to reflect the populations most affected by the diseases in question.
For example, studies of bronchiolitis involved young children (<3 years of age) and
studies of invasive bacterial infections focused on children (generally <18 years). A
handful of studies focussed on persons particularly at risk of disease such as family
contacts of a tuberculosis patient.
No randomised study designs were identified investigating the association between
household crowding and CCID. All eligible studies were non-randomised studies i.e.
observational in nature. One intervention study24
is included in the analysis. This
cohort study investigated the impact of a housing intervention on crowding and
infectious disease in an indigenous Australian community.
Cross-sectional studies were the predominant investigation method used by studies
identified here (185/345 studies) followed by cohort (84/345) and case-control studies
(76/345). Diseases where infection may be less clinically apparent have tended to be
investigated using cross-sectional studies such as is the case for Helicobacter pylori
infection and hepatitis A, where prevalence of infection can be identified by specific
serological testing. Serious acute diseases with conspicuous clinical presentations lend
themselves well to case-control studies, notably meningococcal disease, H. influenzae
type b (Hib) disease and tuberculosis.
More than half of the studies in the narrative synthesis (189/345, 55%) found a
statistically significant positive association between greater household crowding and
CCID risk. Less than half of the studies (151, 44%) found no statistical evidence of
an association and 5 (1%) found a significant negative association (Table 5). The
proportion of studies with evidence of an association was relatively similar across
respiratory (51%), enteric (59%) and skin/eye infections (59%).
More than two-thirds of studies investigating hepatitis A, intestinal parasites,
meningococcal disease, otitis media and pediculosis identified a statistically
significant positive association. Conversely, only one-third of studies investigating
gastroenteritis, upper and lower respiratory tract infections and tuberculosis identified
a statistically significant positive association. This pattern may be related to the
magnitude of the true association, chance findings, confounding bias and/or the
greater chance of measurement bias in syndrome diagnoses (based on symptoms)
compared to the greater accuracy afforded by laboratory diagnosis of a specific
infectious agent.

27
Table 5. Narrative synthesis of study outcomes which investigate the role of
household crowding as a risk factor for close contact infectious disease
Statistical significance of study outcomes at the 95% level
Total studies
+ (%) ns (%) - (%)
Enteric infection
Gastroenteritis* 11 38 18 62 0 0 29
Helicobacter pylori* 39 62 24 38 0 0 63
Hepatitis A* 11 73 4 27 0 0 15
Giardia and cryptosporidium 2 67 1 33 0 0 3
Intestinal parasites 8 80 2 20 0 0 10
Respiratory tract infection
Pneumonia / lower respiratory tract infection*
9 36 14 56 2 8 25
Bronchiolitis - Respiratory syncytial virus* 7 58 5 42 0 0 12
Upper respiratory tract infection* 17 38 26 58 2 4 45
Meningococcal disease* 12 75 4 25 0 0 16
Haemophilus influenzae type b* 9 53 8 47 0 0 17
Tuberculosis* 8 36 14 64 0 0 22
Otitis Media 7 70 2 20 1 10 10
Influenza 3 75 1 25 0 0 4
Measles, Mumps, Rubella, Chicken pox 4 80 1 20 0 0 5
Rheumatic fever, RHD, GAS 9 60 6 40 0 0 15
Skin & eye infection
Conjunctivitis 2 100 0 0 0 0 2
Trachoma* 2 67 1 33 0 0 3
Staphylococcus aureus (MRSA) 0 0 1 100 0 0 1
Pediculosis (lice) 8 73 3 27 0 0 11
Scabies 3 50 3 50 0 0 6
Other skin infection 5 45 6 55 0 0 11
Blood born infection
Hepatitis B 5 63 3 38 0 0 8
Hepatitis non-A, non-B 1 100 0 0 0 0 1
Other
Cytomegalovirus 2 67 1 33 0 0 3
Epstein Barr virus, Herpes virus 2 67 1 33 0 0 3
Multiple infectious disease 2 50 2 50 0 0 4
Other infectious disease - toxoplasma 1 100 0 0 0 0 1
Total 189 55 151 44 5 1 345
*included in the meta-analysis, + =statistically significant positive association between greater
household crowding and increased infectious disease, ns =non-significant association, - = statistically
significant negative association showing crowding as beneficial

28
4.3. Meta-analysis
Combined estimates were produced from 82 studies for ten different categories of
CCIDs. A further 36 studies were eligible for meta-analysis, but had largely unique
outcomes, so could not be combined. Some studies were not eligible for meta-analysis
because no OR or RR was available (89 studies removed) or the study had not
adjusted for age and socioeconomic position (136 studies removed).
For the combined estimates covering ten different CCIDs, nine showed statistically
significant results i.e. persons experiencing the greatest vs. least levels of household
crowding had increased risk of disease. The increased odds of infection ranged from
1.13 times the risk of gastroenteritis to 3.78 times the risk of tuberculosis (Table 6).
Although upper respiratory tract infections had a positive association with household
crowding, this association was not statistically significant (OR 1.39, CI 0.69-2.79 and
RR 1.63, CI 0.88-3.02). A summary of the meta-analyses is presented in Table 6.
The ability to conduct meta-analysis reflects the greater number of studies carried out
investigating the association of these particular CCIDs with household crowding
exposure (Table 5). There are some notable omissions of CCIDs that narrowly missed
out on meta-analysis. Pediculosis (lice) studies, for example, were limited by their
quality and were less likely to control for confounding from age and socioeconomic
status. Several studies investigating rheumatic fever, intestinal parasites and other skin
infections did control for confounding and were eligible for meta-analysis; however
study outcomes were unique and unable to be combined. These studies are also
discussed and presented in the tables below.
Included studies were more likely to investigate the impact of household crowding
density on children than adults. All meta-analyses included studies with children as
participants. Six out of ten meta-analyses focussed primarily on children, the majority
of whom were less than six years old.
The most robust meta-analysis effect estimates provided evidence that higher
crowding was associated with increased risk of pneumonia / lower respiratory tract
infection (OR 1.69, CI 1.34-2.13 and RR 1.36, CI 1.09-1.69), gastroenteritis (OR 1.13,
CI 1.01-1.26), Haemophilus influenza disease (OR 1.74, CI 1.27-2.37) and respiratory
syncytial virus (RSV) bronchiolitis - when cohort (4.44, CI 2.45-8.04) and case-
control data (OR 1.31, CI 0.85-2.01) were considered separately. Other meta-analyses
were less robust due to greater unexplained heterogeneity (variation in individual
study results), with statistically significant associations between household crowding
and hepatitis A (OR 1.53, CI 1.23-1.90), meningococcal disease (OR 2.13, CI 1.38-
3.29), H. pylori infection (OR 1.82, CI 1.55-2.14), tuberculosis (OR 3.78, CI 1.78-
8.13) and trachoma (OR 2.07, CI 1.06-4.06). The association was not statistically
significant for household crowding and upper respiratory tract infection (OR 1.39, CI
0.69-2.79 and RR 1.63, CI 0.88-3.02).
Individual study results are presented in forest plots (Figure 3, Figure 4, Figure 6,
Figure 7, Figure 8, Figure 9, Figure 10, Figure 11, Figure 12, Figure 13). Study
characteristics are summarised in corresponding tables. To investigate publication
biases between included studies, a funnel plot is presented for the H. pylori meta-
analysis (Figure 5), because this is the only outcome with sufficient studies.
For five of these outcomes (gastroenteritis, pneumonia, bronchiolitis, Hib disease, and
tuberculosis) there were additional studies that reported largely unique outcomes.
These results are summarised below:

29
A further five (6 outcomes) studies of gastroenteritis had largely unique outcomes
so could not be included in the combined meta-analysis. Two of these studies
found positive associations between disease risk and crowding (toxoplasma
gondii, typhoid fever). Two found no significant association (bacillary dysentery,
diarrhoeal deaths). And one found a weak protective effect (carriage of multiple
drug resistant E coli).
A further study of pneumonia/lower respiratory infection had a unique outcome
and so could not be included in the combined meta-analysis. This study (mortality
from respiratory infection) did not find a significant association between disease
risk and crowding
A further study of RSV had a unique outcome, reported wheeze, so could not be
included in the combined meta-analysis. It found a significant association between
disease risk and crowding.
A further study of Hib had a unique outcome, Hib nasopharyngeal carriage, so
could not be included in the combined meta-analysis. It found a significant
association between carriage risk and crowding.
A further five studies of tuberculosis had largely unique outcomes: symptoms of
tuberculosis, self-reported tuberculosis, tuberculin skin test positive (two studies),
and tuberculosis meningitis, so could not be included in the combined meta-
analysis. Three studies (the two tuberculin studies and the one on tuberculosis
meningitis) found a significant association between disease risk and crowding and
two did not (symptoms of tuberculosis, self-reported tuberculosis).
This review identified a further 21 eligible studies covering 16 specific infectious
diseases (there were three eligible studies of otitis media, two of influenza-like illness
and three of rheumatic fever and its sequelae). The outcomes were too heterogeneous
to allow for combined estimates but have been tabulated in blocks of related diseases.
Amongst the enteric diseases, there was one cross sectional study of giardia and
three other studies of specific intestinal parasites. All showed statistically
significant associations between crowding and disease.
Amongst the respiratory diseases, three eligible studies looked at different forms
of otitis media (OM) with two finding no significant relationship between disease
risk and measures of household crowding and one finding a protective effect for
chronic otitis media. Two cohort studies of influenza-like illness both found a
significant positive relationship between disease risk and measures of household
crowding. A cohort study of measles and a cross sectional study of varicella-zoster
virus antibodies each found a significant positive relationship between disease risk
and measures of household crowding. None of the three eligible studies of
rheumatic fever and its sequelae (rheumatic fever incidence, rheumatic heart
disease (RHD) prevalence, and RHD mortality) found a significant positive
relationship between household crowding and disease risk. However, one study of
invasive GAS infection did find a significant positive relationship between
household crowding and disease risk.
Amongst studies of superficial infections a study of pediculosis (head lice) found a
significant positive relationship between disease risk and measures of household
crowding whereas there was no significant association for skin infections.

30
There were a further four eligible studies that were difficult to put into a specific
transmission category. One study of Epstein–Barr virus (EBV) found a significant
positive relationship between disease risk and measures of household crowding. A
single study of Human Herpesvirus 8 (HHV8) did not find a significant
association. One case-control study of infectious illness warranting hospitalisation
and one prevalence study of communicable disease symptoms found a significant
positive relationship between disease risk and measures of household crowding.
Table 6: Summary of findings table for meta-analyses investigating association
between household crowding density and close contact infectious diseases
Infectious disease outcome
studies eligible for
meta-analysis
(combined in summary
effect)a
study design
age of participants
summary effect
(95% C.I.)
I2
Enteric
Gastroenteritis 10(4) cx 0-5yo OR 1.13 (1.01,1.26)
33%
Helicobacter pylori 27(27) cx/cohort† 0+yo OR 1.82 (1.55,2.14)
87%
Hepatitis A 7(7) cx/cohort† 0+yo OR 1.53 (1.23,1.90)
72%
Giardia and intestinal parasites
4(0) Meta-analysis not possible
Respiratory tract
Pneumonia / lower respiratory tract infection
2(4) cx/ccs 0-5yo OR 1.69 (1.34,2.13)
0%
(6) cohort 0-3yo RR 1.36 (1.09,1.69)
26%
Bronchiolitis - respiratory syncytial virus
5(4) ccs/cohort 0-3yo OR 2.24 (1.14,4.38)
84%
Upper respiratory tract infection
4(3) cx/ccs 0-18yo OR 1.39 (0.69,2.79)
84%
(3) cohort 0-2yo RR 1.63 (0.88,3.02)
65%
Meningococcal disease 7(7) ccs 0-16yo* OR 2.13 (1.38,3.29)
69%
Haemophilus influenzae type b
7(6) ccs 0-6yo OR 1.74 (1.27,2.37)
47%
Tuberculosis 12(7) ccs/cx† 15+yo^ OR 3.78 (1.75,8.13)
90%
Otitis media 3(0) Meta-analysis not possible
Influenza 2(0) Meta-analysis not possible
Measles, mumps, rubella, chicken pox
2(0) Meta-analysis not possible
Rheumatic Fever 4(0) Meta-analysis not possible

31
Skin and eye
Trachoma 2(2) cx 0+yo OR 2.07 (1.06,4.06)
94%
Pediculosis (lice) 1(0) Meta-analysis not possible
Other skin infection 1(0) Meta-analysis not possible
Other
Epstein Barr Virus, Herpesvirus
2(0) Meta-analysis not possible
Multiple infectious disease
2(0) Meta-analysis not possible
a=number of studies eligible for meta-analysis with the number of studies contributing to the combined
estimate in brackets, I2
is the proportion of heterogeneity between studies, *=one study was 16+yo, ^=one study was <15yo, †= only one study with this design, n=number of study outcomes, cx=cross-sectional, ccs=case-control study, n=study outcomes
4.3.1. Study level limitations
In all meta-analyses the quality of evidence for causality is regarded as low by
Cochrane collaboration standards because we were reliant on non-randomised
observational studies.21
The grade of evidence quality is reduced further for meta-
analyses where there are poor quality study designs (e.g. with poor control for
important confounders), unexplained heterogeneity (where study variability results in
observed effects being more different from each other than would be expected from
chance alone) and evidence of publication bias (where studies with negative effects
may be less likely to be published resulting in a bias towards positive findings in
systematic reviews).
Considerable heterogeneity was present for H. pylori, upper respiratory tract infection,
tuberculosis, trachoma and bronchiolitis. Substantial (slightly less than considerable)
heterogeneity was evident for hepatitis A and meningococcal disease. Three out of ten
meta-analyses had low to moderate heterogeneity, which is not likely to have an
important effect on the conclusions. The random effects analysis carried out allows for
this variation between included studies.
Sub-group meta-analysis was not possible for most IDs, due to the small number of
studies involved and the similarity of study designs within each ID. For H. pylori
infection 26/27 studies were cross-sectional designs, limiting the ability to stratify
based on study design. However, some sub-group analysis was possible within the H.
pylori and bronchiolitis meta-analyses. In the bronchiolitis meta-analysis, sub-group
analysis by study design helped explain the heterogeneity.
All estimates may be somewhat overstated due to publication bias. This was only able
to be assessed by funnel plot for H. pylori infection, where many studies would be
required to shift the summary estimate. Therefore the risk of this sort of bias was
considered low to moderate for this outcome.
The inclusion of only English language papers may have introduced bias, however the
evidence of this occurring in systematic reviews is conflicting.21 Some studies have
shown greater and lesser estimates from non-English vs. English published studies.

32
When Moher and colleagues examined inclusion and exclusion of trials reported in a
language other than English, the exclusion of non-English-language trials did not
significantly affect the results.25
A proportion of gastroenteritis, H. pylori, Hib disease, pneumonia / lower respiratory
tract infection, upper respiratory tract infection and meningococcal disease studies
tended to adjust for additional crowding variables in the ORs/RRs they reported. This
adjustment may have slightly diluted the overall combined effect estimate in these
meta-analyses.
There is also the possibility that residual confounding was unable to be measured and
controlled for, such as from age and socioeconomic status or other factors. This may
have overestimated the summary effect measures.
4.4. Enteric infection
Meta-analysis was carried out for three enteric infections; gastroenteritis, H. pylori
infection and Hepatitis A. In addition, eligible studies of giardia and intestinal
parasites were also described, but had unique outcomes so could not be combined.
4.4.1. Gastroenteritis meta-analysis
Data from three cross-sectional articles were considered here as four separate studies
in the analysis (Table 7). Children less than five years old living in more crowded
households experienced a small increase in the risk of gastroenteritis (diarrhoeal
illness); OR 1.13 (CI 1.01-1.26) (Figure 3). Although the increased risk borders on
statistical non-significance, there is greater reliability accredited by the preciseness of
the estimate and the low to moderate heterogeneity between studies. All studies are
representative samples and include participants of a similar age group. Confounding
was well adjusted for. Gastroenteritis is a symptomatic diagnosis here and not
classified by laboratory methods. This increases the chance of misclassification bias
that may have lowered the OR closer towards no effect.
In addition, a further five articles studying gastroenteritis were eligible for inclusion in
the meta-analysis, but had unique outcomes so could not be included in the combined
meta-analysis. Two of these studies found positive associations between disease risk
and crowding (toxoplasma gondii, typhoid fever). Two found no significant
association (bacillary dysentery, diarrhoeal deaths) and one found a weak protective
effect (carriage of multiple-drug-resistant-E. coli).

33
Table 7: Gastroenteritis meta-analysis study and population characteristics
Author, year design outcome exposure place incid.
population age n measure of effect
Combined outcomes:
Alexander, 1990
26
cx acute gastrointestinal illness resulting in doctor visits, hospitalisations, restricted activity days, or bed disability days
high household crowding, upper 25 percent
US 2% national survey 3-5yo 2094 OR 1.63 (0.89 - 1.83)
Alexander, 1990
26
cx acute gastrointestinal illness resulting in doctor visits, hospitalisations, restricted activity days, or bed disability days
high household crowding, upper 25 percent
US 2% national survey <3yo 2751 OR 1.08 (0.86 - 1.20)
Baker, 1998
27
cx mother identified if child had diarrhoea
more than one person per room vs. one or fewer
UK 26% infants, all pregnant women in three health districts
6mo 8488 OR 1.10 (0.94 - 1.29)
Von Schirnding, 1991
28
cx diarrhoeal disease more than two people per room
South Africa
9% African American people living in urban areas representative sample
0-5yo 1227 OR 1.10 (1.00 - 1.30)
Unique outcomes:
Emond29
, 1997
cohort secondary bacillary dysentery in a household
more than one person per room
UK 40% preterm infants 24-32wks gestation
0-12 mo
102 RR 1.57 (0.92 - 2.67)
Emond29
, 1997
cohort secondary bacillary dysentery in a household
more than one person per room
UK 27% term infants 0-12 mo
192 RR 0.85 (0.30 - 2.38)
Seidman30
, 2009
cx carriage of multiple drug resistant E. coli
number of people per number of rooms
India 38% children attending primary school
<10yo
119 OR 0.70 (0.52 - 0.94)
Jones31
, 2001
cx toxoplasma gondii IgG seropositivity
one or more persons per room vs. less than 0.5
US 23% adjusted to be representative of whole US population
20+yo
12566 OR 1.27 (1.02 - 1.59)
Hosoglu32
, 2006
ccs typhoid fever: S. typhi on blood culture
more than 2.25 members per room (mean of all participants)
Turkey NR patients from area surrounding hospital
15+yo
64 cases + 128 controls
OR 3.31 (1.58 - 6.92)
Victora33
, 1988
ccs diarrhoeal deaths more than 5.0 people per room vs. 2.5 or less
Brazil NR recruited from hospitals and coroners
<12mo
170 cases +340 controls
OR 1.20 (0.50 - 2.50)
*cx=cross-sectional study, incid.=incidence, NR=not reported
Figure 3: Gastroenteritis meta-analysis forest plot

34
4.4.2. Helicobacter pylori infection meta-analysis
H. pylori infection accounted for the largest group of eligible studies investigating
household crowding and CCID and 26/27 were cross-sectional designs (Table 8). The
estimate of effect is therefore relatively precise (Figure 4). Independent of age and
socioeconomic status, persons experiencing the greatest household crowding had 1.82
(1.55-2.14) times increased odds of H. pylori infection, compared to those
experiencing least crowding. This combined estimate should be considered in light of
heterogeneity and potential publication bias.
The outcome measure for H. pylori infection is laboratory defined and relatively
unlikely to be subject to substantial measurement bias. Most studies use serology (or
saliva) to measure antibodies which indicate previous infection. Other measures such
as C-urea breath test and gastric biopsy determine current infection.
There is considerable heterogeneity (87%) in this meta-analysis. We sought to explore
the reason for this by doing sub-group analysis that stratified results by outcome
measure (current infection vs. previous infection - antibodies), age of exposure (child
vs. adult), low or high income country, study population prevalence of H. pylori
infection (<40% vs. 40+%) and gastrointestinal symptoms.
The only stratification that significantly altered the summary effect was stratifying by
whether participants had gastrointestinal symptoms. If symptoms were present, there
was less risk of H. pylori infection for individuals in crowded households (OR 1.28,
CI 1.19- 1.39, I2 0%, n=4) than there was for individuals in the strata without
symptoms who were in greater vs. less crowded households (OR 1.99 CI 1.64, 2.42, I2
88%, n=24). Heterogeneity remained in the later estimate.
The funnel plot (Figure 5) indicates low to moderate risk of publication bias. It would
require several studies with quite different outcomes to substantially reduce the
magnitude of the combined effect.

35
Table 8: Helicobacter pylori infection meta-analysis study and study population characteristics
Author, year
study design
outcome exposure place incid. study population age n measure of effect
Combined outcomes:
Aguemon, 2005
34
cx* serology more than three persons sharing a room to sleep vs. not sharing room
Benin 62% healthy individuals in urban and rural households
2-74yo 446 OR 9.82 (4.30 - 23.31)
Ahmed, 2007
35
cx gastric biopsy x3 and PCR
members divided by rooms: high vs. low
Pakistan 80% upper gastrointestinal symptoms who were not treated for H pylori
30-79yo 200 OR 1.32 (0.61 - 2.83)
Breuer, 1996
36
cx serology persons per room in household at 8yo
Germany 39% all blood donors 18-61yo 260 OR(linear) 2.14 (1.07 - 4.26)
Broutet, 2001
37
cx salivary IgG more than one person per room growing up
France 46% patients consulting gastroenterologist with upper digestive tract symptoms
18+yo 1582 OR 1.40 (1.10 - 1.80)
Broutet, 2001
37
cx salivary IgG more than one person per room growing up
France 25% patients consulting gastroenterologist with non-upper digestive tract symptoms
18+yo 1450 OR 1.70 (1.20 - 2.20)
Bures, 2006
38
cx C-urea breath test
shared room with siblings vs. own room
Czech Republic
42% general practice catchments
5+yo 1350 OR 1.11 (0.77 - 1.60)
Choe, 2002
39
cx serology two or more in house divided by number of rooms vs. less than two
Korea 43% two schools - one athletics and one not
15-17yo 660 OR 2.49 (1.15 - 5.39)
Chong, 2003
40
cx serology sharing bedroom (may be sharing a bed) vs. single
US 17% children referred to hospital, GI referral and non-GI referral participants
1-18yo 992 OR 1.63 (0.79 - 3.37)
Everhart, 2000
41
cx serology number of household residents divided by the total number of rooms (excluding bathrooms): 7 levels vs. least crowded
US 33% adults in national nutrition survey
20+yo 7465 OR(linear) 1.07 (0.99 - 1.16)
Ghosh, 2012
42
cx salivary PCR
members divided by rooms: high vs. low
India 85% all asymptomatic 20+yo 1500 OR 1.28 (1.17 - 1.39)
Goodman, 2003
43
cx serology more than one household member per room vs. one or fewer household members per room
US 67% all pregnant women 17-47yo 727 OR 1.40 (0.93 - 2.11)
Malaty, 1994
44
cx serology three or more people divided number of rooms vs. less than one
US 54% Black and Hispanic volunteers who had completed high school, through local advertisements
19-49yo 151 OR 4.50 (3.30 - 5.70)
Malaty, 1996
45
cx serology more than three vs. less than one persons per room
Russia 44% children 1-19yo 307 OR 2.10 (1.20 - 2.50)
Malaty, 1996
45
cx C-urea breath test
more than three vs. less than one persons per room
Russia 88% adults 20-74yo 213 OR 1.40 (1.10 - 4.50)
Malaty, 2001
46
cx serology one bedroom home vs. three or more bedroom home
US 24% children from 13 licensed day care centres, primarily enrolling minority children from low-middle socioeconomic classes
2-16yo 356 OR 1.20 (0.60 - 2.20)

36
Table 8 continued…
Author, year
study design
outcome exposure place incid. study population age n measure of effect
McCallion, 1996
47
cx serology more than one person per room vs. less than 0.7 persons per room
UK 32% children in hospital for routine non-gastrointestinal day surgery
3-15yo 367 OR 3.38 (1.75 - 6.50)
Mendall, 1992
48
cx* serology 1.30 or more persons per room in childhood vs. 0.70 or less persons per room in childhood
UK 32% consecutive patients attending a health screening clinic in general practice
18-82yo 208 OR 6.15 (1.84 - 18.60)
Nurgalieva 2002
49
cx serology more than three members divided by rooms vs. less than two members per rooms
Kazak-stan
80% unrelated healthy individuals
10-60yo 289 OR 1.30 (0.70 - 3.00)
Özen, 2006
51
cx C-urea breath test
more than one persons per room
Turkey 57% asymptomatic children 8-17yo (at follow up)
136 OR 2.99 (1.21 - 7.35)
Patel, 1994
52
cohort saliva ELISA
more than one person per room
UK 11% random sample of 30 primary schools in Edinburgh
6-7yo 554 OR 3.10 (1.30 - 7.20)
Rodrigues, 2004
53
cx C-urea breath test
more than two persons per room vs. one person per room
Brazil 56% children random selected from urban neighbourhood
6mo-14yo 353 OR 2.58 (1.40 - 4.60)
Salomaa-Rasanen, 2010
54
cx serology for every increase of one person per room
Finland 12% all individuals invited from population register
15-40yo 3316 OR(linear) 1.13 (1.01 - 1.26)
Staat, 1996
55
cx serology two or more vs. less than 0.5 persons divided by numb rooms
US 25% national health and nutrition survey
6-19yo 2581 OR 5.60 (2.90 - 10.90)
Stone, 2000
56
cx serology persons per room in childhood
UK 15% general population sample 21-55yo 1431 OR(linear) 2.08 (1.28 - 3.38)
Torres, 1998
57
cx serology 3.6 or more persons per room vs. 1.5 or fewer persons per room
Mexico 66% national serological survey 1-39yo 11605 OR 1.40 (1.23 - 1.60)
Webb, 1994
58
cx serology greater than one person per room vs. less than one person per room
UK 37% male factory workers 18-65yo 471 OR 1.54 (0.87 - 2.75)
Wizla-Derambure, 2001
59
cx gastric biopsy
more than person per room, excluding kitchen and bathroom
France 7% high risk: children requiring a endoscopy
2-17yo 436 OR 0.60 (0.20 - 2.10)
*cx=cross-sectional

37
Figure 4: Helicobacter pylori meta-analysis forest plot
*Note: The odds ratios in the forest plot may differ slightly from the odds ratios
reported by the studies shown in Table 8, because the inverse variance function in
RevMan automatically calculates the confidence intervals from the inputted natural
log of the odds ratio and its standard error.
Figure 5: Helicobacter pylori funnel plot

38
4.4.3. Hepatitis A meta-analysis
Six studies were included in the meta-analysis investigating the association between
household crowding and hepatitis A serology (Table 9). Five out of six used a cross-
sectional study design. For persons experiencing the greatest vs. least household
crowding, there was 1.53 times increased odds of Hepatitis A infection. This estimate
may be exaggerated by publication bias. Measurement bias is relatively less unlikely.
There was substantial heterogeneity (I2
66%) amongst these six studies. This does not
appear to be due to year of publication, study design or country income. There appears
to be a slight trend to a greater magnitude of effect for studies including only children
and study populations with a lower incidence of hepatitis A.
Table 9: Hepatitis A meta-analysis study and study population characteristics adjusted
Author, year
study design
outcome exposure place Incid. study population age n measure of effect
Combined outcomes:
Almeida, 2001
60
cohort anti-HAV antibodies more than three persons per room vs. less than two
Brazil 58% population survey of households, non-immunised
0+yo 3271 OR 1.52 (1.18 - 1.97)
Barros, 1999
61
cx* anti-HAV antibodies more than two persons
per room vs. less than one person
Portugal 28% students attending public and private schools randomly selected
6-19yo 667 OR 2.60 (p=0.004)
Gomes, 2011
62
cx* anti-HAV antibodies more than one person
per bedroom vs. one only
Brazil 64% school children 7-14yo 462 OR 1.55 (1.11 - 2.18)
Green, 1992
63
cx* anti-HAV antibodies people per room at
10yo Israel 57% serving in permanent
army 21-30yo 1153 OR (linear)
1.02 (0.84 - 1.24)
Livni, 2002
64
cx* anti-HAV antibodies persons per room Israel 48% hospital workers 21-70yo 478 OR (linear)
1.28 (1.05 - 1.50)
Markus65
, 2011
cx HAV antibodies living in a household with one or more inhabitant per room
Brazil 20% outpatients from one hospital
1-14yo 901 OR 2.18 (1.51 - 3.14)
Redlinger, 1997
66
cx* anti-HAV antibodies one or more persons
per rooms vs. fewer than one
US 17% school students 3-7yo 523 OR 1.93 (1.06 - 3.50)
cx=cross-sectional
Figure 6: Hepatitis A meta-analysis forest plot

39
4.4.4. Giardia and intestinal parasites
Four studies with unique outcomes (including cross sectional studies of giardia and
three infections) were eligible for meta-analysis in the giardia and intestinal parasite
group (Table 10). All studies showed statistically significant associations between
crowding and disease.
Table 10: Studies eligible for meta-analysis with unique outcomes in the giardia
and intestinal parasite group.
Giardia and intestinal parasites
Author, year
study design
outcome exposure place occur. population age n measure of effect
Unique outcomes:
Silva67
, 2009
cx giardia lamblia
living in a two bedroom house or smaller vs. more than two bedrooms
Brazil 26% representative household survey
6-71mo 405 OR 2.30 (1.40 - 3.80)
Carneiro68
, 2002
cx ascaris lumbricoides - prevalence
“crowding” Brazil 12% census of eleven rural communities
<14yo 760 RR 6.84 (2.27 - 20.55)
Cazorla69
, 2006
cx pinworm: E. vermicularis
three or more persons per room vs less than three
Venezuela 63% six kindergartens and two primary schools in six rural communities
2-12yo 427 OR 1.88 (1.73 - 3.22)
Pullan70
, 2008
cx Coinfection: N. americanus + S. Mansoni
one or more rooms per person
Brazil 41% household survey
0+yo 1208 OR 2.35 (1.25 - 4.25)
4.5. Respiratory tract infections
Meta-analysis was carried out for six respiratory tract infections and syndromes:
Pneumonia / lower respiratory tract infection; Bronchiolitis / respiratory syncytial
virus; Upper respiratory tract infection; Meningococcal disease; Hib disease; and
Tuberculosis. In addition, eligible studies of otitis media (middle ear infection);
Influenza; Measles, mumps, rubella, varicella (chicken pox); and Rheumatic fever
(RHD, GAS) were also described but had largely unique outcomes so could not be
combined.
4.5.1. Pneumonia / lower respiratory infection meta-analysis
Two meta-analyses were carried out for studies investigating the association between
pneumonia / lower respiratory tract infection and household crowding: one for cohort
studies reporting RRs and the other for ORs reported by case-control and cross-
sectional studies (Table 11). Studies examined children of similar age groups from a

40
mix of low and high income countries. There was low heterogeneity. The small
number of studies prevents funnel plot analysis. Reliance on syndrome identification
may have led to an increased chance of misclassification bias and underestimated
these measures of effect.
Combined data from four case-control and observational studies showed that children
less than five years old exposed to greater household crowding had 1.69 times the
odds of pneumonia than children exposed to the least crowding (Figure 7). The recent
NZ study18
had similar results to the two Brazilian studies.
Combined cohort study data for children less than three years old suggests that the
increased risk of lower respiratory tract infection from the greatest level of household
crowding is 1.36 times (CI: 1.12-2.31) that of children experiencing the least crowding
(Figure 7).
A further study of pneumonia/lower respiratory infection had a unique outcome and so
could not be included in the combined meta-analysis. This study (mortality from
respiratory infection) did not find a significant association between disease risk and
crowding (Table 11).
Table 11: Pneumonia / lower respiratory infection meta-analysis study and study
population characteristics
Author, year
study design
outcome exposure place occur. population age n measure of effect
Combined outcomes:
Anderson, 1988
71
ccs acute LRTI number persons sleeping in same room as child
US NR four hospitals with all patients admitted with bronchiolitis or pneumonia, asthma considered, patients with no underlying condition
0-24mo
102 cases + 199 controls
OR 1.93 (p=0.001)
Cardoso, 2004
72
ccs LRI, acute bronchitis, acute bronchiolitis, or pneumonia (not asthma)
four or more persons sharing the child's bedroom
Brazil NR five public hospitals 2-59mo
396 cases + 336 controls
OR 2.50 (1.02 - 6.09)
Prietsch, 2008
73
cx ALRI four or more persons per bedroom vs. two or fewer
Brazil 24% sample of children residing in urban area
0-59mo
775 OR 1.54 (1.08 - 2.19)
Grant, 2012
18
ccs community-acquired pneumonia (hospitalised and non-hospitalised)
more than one person per room vs. one person or less
New Zealand
NR children presenting to a public hospital
<5yo 428 cases + 351 controls
OR 1.39 (0.78 - 2.48)
Emond, 1997
29
cohort LRTI more than one person per room vs. one per room
UK 46% preterm infants 24-32wks gestation
0-12mo
102 RR 1.53 (0.96 - 2.42)
Emond, 1997
29
cohort LRTI more than one person per room vs. one per room
UK 26% term infants 0-12mo
192 RR 0.28 (0.04 - 1.86)
Koch, 2003
74
cohort LRI two children sleeping in the same room as child vs. none
Greenland
1.59 per 100 days
0-2yo 288 RR 1.95 (1.19 - 3.19)
Kristensen, 2006
75
cohort URTI and LRTI two or more children in same bedroom vs. one
South Africa
1.56 per child year
pregnant women enrolled over 4 months from four antenatal clinics
<1yo 579 children, 118 650 days
RR 1.08 (0.73 - 1.58)
Okiro, 2008
76
cohort LRTI - all cause = cough or difficulty
3 siblings <6y sleeping in same room vs. none
Kenya NR coastal , birth cohort, lived close to hospital
<3 years
857 LRTI - all
RR 1.69 (0.81 - 3.51)

41
breathing associated with one element of respiratory distress
cause cases in 439 cohort
Parker, 1999
77
cohort severe RTI (pneumonia & bronchitis)
more than two persons in a one-roomed dwelling, three in two rooms, five in three rooms; eight persons or more in four rooms and more than two persons per room in houses of five rooms or more
UK 0.34 per child-year
Newcastle thousand families study
0-12mo
982 RR 1.29 (1.02 - 1.62)
Unique outcomes:
Victora, 1989
78
ccs mortality from respiratory infection (broncho- pneumonia, bronchiolitis, pneumonia, acute otitis media, and other)
five or more vs. 1-2.5 people per bedroom
Brazil NR all infants from two cities
0-1yo 127 cases + 254 controls
OR 1.85 (0.86 - 3.99)
*ccs=case-control, #cx=cross-sectional, ^LRTI=lower respiratory tract infection, NR=not reported
Figure 7: Pneumonia / lower respiratory infection meta-analysis showing
combined odds ratios and combined rate ratios forest

42
4.5.2. Bronchiolitis / respiratory syncytial virus meta-analysis
Five eligible studies were included in the meta-analysis investigating the association
between household crowding and respiratory syncytial virus (RSV) infection, of
which four had a similar outcome and could be combined (Table 12).
In children less than three years old with the greatest levels of household crowding,
the overall risk of symptomatic respiratory syncytial virus (RSV) infection was 2.24
times greater than those with the least household crowding. This is an imprecise
estimate based on a small number of studies with considerable heterogeneity (84%).
Studies were therefore stratified according to study design. This appeared to account
for a proportion of the heterogeneity. In the combined estimate from two case-control
studies there was now no evidence of an association between crowding and risk of
hospitalisation with respiratory syncytial virus infection (OR 1.31, CI 0.85-2.01, I2
63%). Data from a single cohort study were combined to suggest a 4.44 (CI: 2.45-
8.04, I2 0%) times increased risk of respiratory syncytial virus lower respiratory
infection for infants sharing the same bedroom with two or more others.
Another systematic review of crowding and RSV has recently been published.79
That
review had broader eligibility criteria and was limited by heterogeneity so meta-
analysis was not carried out. It reports on 20 studies of which 16 found a statistically
significant association between a crowding variable (widely defined) and RSV in
under five year olds. Using a more precise measure of household crowding density in
the narrative synthesis of this review, we identified 15 relevant studies of which 7
report a significant association with crowding. Both our results and the published
review suggest that crowding is associated with RSV.
In addition a further study of RSV was eligible for inclusion in the meta-analysis, but
had a unique, less objective outcome, reported wheeze, and so could not be included
in the combined meta-analysis (Table 12). It found a significant association between
disease risk and crowding.
Table 12: Respiratory syncytial virus meta-analysis study and study population
characteristics
Author, year
study design
outcome exposure controls place study population
age n measure of effect
Combined outcomes:
Bulkow, 2002
80
ccs* NPA +ve on Ag
detection or culture whilst hospitalised
two or more persons per room
matched on age and region of residence, with no RSV in preceding year
USA (Alaska)
remote location, 85% Eskimo, high rates of hospitalisat-ion with RSV
< 3yo 204 cases + 338 controls
OR 1.72 (p=0.024)
Nielsen, 2003
81
ccs* RSV hospitalisation,
nasopharyngeal sample positive within two days of admission
less than 22 square meters per person
community controls matched on age, sex and municipality
Denmark all children admitted with RSV infection from two counties
<2yo 1252 cases + 6260 controls
OR 1.10 (0.87 - 1.42)
Holberg, 1991
82
cohort LRI infants diagnosed by their paediatrician and then tested to be RSV positive on either culture or immunofluorescence
two or more others sharing the same bedroom vs. one or no
- USA (Arizona)
healthy infants enrolled at birth
1-<3mo 579 OR 5.30 (2.30 - 12.20)

43
(first episode only) others
Holberg, 1991
82
cohort LRI infants diagnosed by their paediatrician and then tested to be RSV positive on either culture or immunofluorescence (first episode only)
two or more others sharing the same bedroom vs. one or no others
- USA (Arizona)
healthy infants enrolled at birth
3-<5mo 600 OR 3.70 (1.60 - 8.70)
Unique outcomes:
Baker27
, 1998
cx prevalence maternal reported wheeze
more than one person per room vs. one or fewer persons per room
- UK infants, all pregnant women in three health districts
6mo 8450 OR 1.26 (1.06 - 1.49)
*ccs=case-control, cx=cross-sectional study
Figure 8: Respiratory syncytial virus bronchiolitis meta-analysis forest plot
4.5.3. Upper respiratory tract infection meta-analysis
Two meta-analyses were carried out for studies investigating the association between
upper respiratory tract infection (URTI) and household crowding: one for cohort
studies reporting RRs and the other for ORs reported by case-control and cross-
sectional studies (Table 13). URTIs are defined as those which do not meet the criteria
for lower respiratory infections and pneumonia and are typically less severe.
Combined data from two cross-sectional studies and one case-control study, showed
that children experiencing greater household crowding had an estimated 1.39 times the
odds of URTI (not significant) than children experiencing the least crowding (Figure
9). There is substantial heterogeneity in these studies. One study of older children in

44
China actually showed that living in houses with less than three rooms was protective
against infection.
Combined data from three cohort studies from high income countries suggests that the
best estimate of increased risk of URTI for children less than two years old
experiencing the greatest level of household crowding is 1.63 times (not significant)
that of children experiencing the least crowding (Figure 9). There is moderate
heterogeneity.
Reliance on syndrome identification of the outcome may lead to an increased chance
of misclassification bias and underestimate these measures of effect.
Table 13: Upper respiratory tract infection study population characteristics
Author, year
study design
outcome exposure place occur. population age n measure of effect
Combined outcomes:
Dsouza, 1997
83
cx cough and runny nose, with or without fever reported by the mother
total house area / number of people living in the house is 1.48m2 or less vs. greater than 1.48m2
Pakistan 15% children of families in a squatter settlement
unknown 698 OR 1.82 (1.01 - 3.28)
Zhang, 2002
84
cx reported ever hospitalised for respiratory symptoms
less than three rooms vs. three or more rooms
China 14% elementary school students and their families chosen from an urban district and a suburban district in each of four cities
5-16yo 7392 OR 0.81 (p=0.05)
Goren, 1999
85
cx cough without cold average persons per room
Israel NR children from participating schools in two communities
7-13yo 976 OR (linear) 2.13 (1.11 - 4.10)
Emond, 1997
29
cohort URTI recorded on parent held record
more than one person per room
UK 49% preterm infants 24-32wks gestation
0-12mo 102 RR 1.20 (0.72 - 1.98)
Emond, 1997
29
cohort URTI recorded on parent held record
more than one person per room
UK 30% term infants 0-12mo 192 RR 1.20 (0.57 - 2.51)
Koch, 2003
74
cohort URTI two adults sleeping in the same room as child vs. none
Greenland 1.59 episodes per 100 child days at risk
open cohort of Inuit children in a single town
0-2yo 288 RR 3.13 (1.60 - 6.11)
*ccs=case-control, #cx=cross-sectional, ^RTI=respiratory tract infection, NR=not reported

45
Figure 9: Upper respiratory tract infections meta-analysis showing combined
odds ratios and combined rate ratios forest plots
4.5.4. Meningococcal disease meta-analysis
Five case-control articles from high income countries contributed to seven study
outcomes investigating the association between household crowding and
meningococcal disease (Table 14). All studies, except for one, were limited to
children.
Persons experiencing the greatest vs. least household crowding had 2.13 times
increased odds of meningococcal disease. The estimate of effect was imprecise and
there was substantial heterogeneity (I2 69%). This may have been contributed to by
the range of crowding measures investigated.
The NZ study15 recorded a particularly large OR compared to studies in other high
income settings. Ascertainment of meningococcal disease included laboratory and
non-laboratory measures in the majority of studies. All studies adjusted for smoking,
4/7 adjusted for an additional crowding variables and 6/7 adjusted for other additional
variables.
Table 14: Meningococcal disease meta-analysis study and study population
characteristics
Author, year
study design
outcome exposure controls place study population
age n measure of effect
Combined outcomes
Deutch, 2004
86
ccs hospitalisation for meningococcal disease - discharge code
<20m2 per
person vs. >50m
2
Civil registry community controls matched on age and gender
Denmark nationwide population based
1-6y 1,222 cases + 24,549 controls (74%)
OR 1.50 (1.10 - 2.00)
Deutch, 2004
86
ccs hospitalisation for meningococcal disease - discharge code
<20m2 per
person vs. >50m
2
Civil registry community controls matched on age and gender
Denmark nationwide population based
≤1yo 1,222 cases + 24,549 controls (36%)
OR 1.50 (1.10 - 1.90)

46
Kriz, 2000
87
ccs lab and non-lab confirmed invasive meningococcal disease
more than one person per room
from same school matched for age, sex and place of residence
Czech Republic
school children
<15 years
68 cases +
135 controls
OR 1.13 (0.44 - 2.88)
Moodley, 1999
88
ccs lab and non-lab confirmed meningococcal disease
>2.5 equivalent people per bedroom (where a child <10y = 0.5 persons)
hospitalised controls from trauma
South Africa
metropolitan area
<14 years
70 cases +
210 controls
OR 2.30 (1.00 - 5.30)
Robinson, 2001
89
ccs lab and non-lab confirmed meningococcal disease
normally shares a bedroom
matched on age, sex and socioeconomic status
Australia state notifications
16+yo 40 cases +
80 controls
OR 1.37 (0.30 - 6.20)
Robinson, 2001
89
ccs lab and non-lab confirmed meningococcal disease
normally shares a bedroom
matched on age, sex and socioeconomic status
Australia state notifications
<16 years
47 cases +
94 controls
OR 5.40 (1.70 - 17.50)
Baker, 2000
15
ccs1
lab and non-lab confirmed meningococcal disease
number of adults (10+yo) per number of rooms
community controls matched on age and ethnicity
New Zealand
children presenting to public hospital
<8yo 202 cases +
313 controls
OR(linear) 10.70 (3.90 - 29.50)
1ccs=case-control
Figure 10: Meningococcal disease meta-analysis forest plot
4.5.5. Haemophilus influenzae disease meta-analysis
Six study results were included in the meta-analysis investigating the association
between household crowding and Hib disease (Table 15). All studies were case-
control designs in high income countries. For children <6 years old experiencing the
greatest level of household crowding there was a 1.74 times increased odds of Hib
disease, compared to children with the least household crowding (Figure 11). The
association with crowding is further strengthened by only a moderate degree of
heterogeneity (I2 47%).
In addition a further study of Hib was eligible for inclusion in the meta-analysis, but
had a unique outcome (Hib nasopharyngeal carriage) so could not be included in the
combined meta-analysis (Figure 11). It found a significant association between
carriage risk and crowding.

47
Table 15: Haemophilus influenzae type b study and study population
characteristics
Author, year study design
outcome exposure controls place study population
age n measure of effect
Combined outcomes:
Arnold, 1993
90
ccs* invasive Hib two or more vs.
less than 1.5 persons to the number of bedrooms
matched on age
US population based: children hospitalised
<6yo 295 cases + 590 controls
OR 2.00 (1.30 - 3.10)
Clements, 1995
91
ccs* invasive Hib
epiglottitis child shared a bedroom vs. did not share
day surgery hospital controls
Australia children hospitalised
<5yo 83 cases + 367 controls
OR 1.88 (0.99 - 3.55)
Clements, 1995
91
ccs* invasive Hib -
meningitis each additional child per bedroom
day surgery hospital controls
Australia children hospitalised
<5yo 76 cases + 367 controls
OR(linear) 1.26 (1.03 - 1.54)
Cochi, 1986
92
ccs* invasive Hib child shared a
bedroom vs. did not share
random sample of children matched on age
US population based surveillance of hospitals and laboratories
2-59mo 102 cases + 530 controls
OR 2.70 (1.30 - 5.70)
Jafari, 1999
93
ccs* Hib disease more than one
person per room vs. one or fewer
controls matched by age and county of birth
US population based, partially vaccinated
2-18mo 40 cases + 93 controls
OR 3.50 (1.03 - 11.70)
Zielinski, 2003
94
ccs* Hib meningitis apartment size of
47m2 or less vs. >47m2
controls matched on age and immunisation centre
Poland nested within a population based surveillance study
≤5yo 55 cases + 155 controls
OR 1.30 (0.50 - 3.00)
Unique outcomes:
Sekhar95
, 2009 cx H. influenzae nasopharyngeal carriage
more than two persons per room vs. two or fewer
NA India household sample
0-24yo 997 OR 9.20 (2.30 - 36.10)
ccs=case-control, cx=cross-sectional study
Figure 11: Haemophilus influenzae type b disease meta-analysis forest plot

48
4.5.6. Tuberculosis meta-analysis
Twelve studies of tuberculosis disease and infection were eligible for meta-analysis
(Table 16).
Six case-control studies and one cross-sectional study contributed to the meta-analysis
investigating the association in adults between household crowding and tuberculosis.
Tuberculosis was defined in 6/7 studies as pulmonary tuberculosis. The combined
effect estimate was the largest of all the CCID meta-analyses with 3.78 times
increased odds of tuberculosis in the most crowded compared to the least crowded
households.
There was considerable heterogeneity (I2 90%) and an imprecise effect estimate with a
95% confidence interval of 1.75-8.13. Studies were carried out in a range of settings,
mainly in low-moderate income countries. Two large studies account for 36% of the
combined result and both have ORs close to no effect. This is in contrast to the other
contributing studies which have higher effect estimates. There appears to be little
reason why the association would be different between the two groups of studies,
however the threshold used to define crowding exposure is less severe in the two
larger studies showing less effect.
In addition a further five studies of tuberculosis were eligible for inclusion in the
meta-analysis, but had largely unique outcomes (symptoms of tuberculosis, self-
reported tuberculosis, tuberculin skin test positive [two studies], and tuberculosis
meningitis) so could not be included in the combined meta-analysis. Three studies (the
two tuberculin studies and the one on tuberculosis meningitis) found a significant
association between disease risk and crowding and two did not (symptoms of
tuberculosis, self-reported tuberculosis) (Table 16).
Table 16: Tuberculosis meta-analysis study and study population characteristics
Author, year
study design
outcome exposure controls place study population age n measure of effect
Combined outcomes:
Coker, 2006
96
ccs1 pulmonary
tuberculosis culture confirmed
least vs. most living space per person
age and sex matched controls
Russia those recruited to WHO DOTS programme and randomly selected controls
adults 334 cases + 334 controls
OR 3.77 (2.06 - 6.88)
Corbett, 2009
97
cxc pulmonary
tuberculosis culture confirmed
more than four persons per number of rooms in the dwelling vs. less than two
NA Zimbabwe forty-six study neighbourhoods
16+yo 10092 OR 3.60 (0.80 - 16.50)
Garcia-Sancho, 2009
98
ccs1 pulmonary
tuberculosis sputum culture positive
one room household vs. more than one room
sex matched controls
Mexico females living in small communities
adults 42 cases + 84 controls
OR 15.40 (3.30 - 72.08)
Hill, 200699
ccs1 pulmonary
tuberculosis sputum culture positive
at least 4 persons and at least 2 persons per room in a household vs. less than 4 persons and less than 2 people sleeping per
age and sex matched clinic controls
Gambia presenting to a health clinic
15+yo 100 cases + 200 controls
OR 10.17 (4.08 - 25.63)

49
room on average
Shetty, 2006
100
ccs1 pulmonary
tuberculosis - new cases in pulmonary outpatients
more than two persons per room vs. less than two
age and sex matched controls from among relatives visiting non tuberculosis patients in hospital
India new cases of pulmonary tuberculosis seen at outpatients
15-83yo
189 cases + 189 controls
OR 1.03 (0.89 - 1.19)
Tekkel, 2002
101
ccs1 pulmonary
tuberculosis - verified by European definition
more than one person per room vs. one or fewer
population registry controls matched by sex, age and region
Estonia admitted to hospital
15+yo 248 cases + 248 controls
OR 1.49 (0.93 - 2.39)
Tipayam-ongkholgul, 2005
102
ccs1 tuberculosis -
hospital diagnosed - 50% pulmonary, 36% lymph nodes
five or more persons per room vs. one person or less
age and sex matched hospital controls
Thailand diagnosed and treated at one hospital
<15yo 130 cases + 130 controls
OR 11.18 (2.35 - 53.20)
Unique outcomes:
Goldhaber-Fiebert, 2011
103
cx symptoms of tuberculosis (haemoptysis and persistent cough) (sensitivities between 65 and 70% and specificities between 55 and 75%)
people per room World Health Survey
forty six mainly low and middle income countries
adults 124545 OR (linear) 1.04 (0.98 - 1.09)
Mishra, 1999
104
cx self-reported tuberculosis
number of persons per room
India national health survey
20+yo 260162 OR 0.96 (0.85 - 1.09)
Tornee, 2005
cx tuberculin skin test positive
persons per rooms Thailand household contacts of tuberculosis patients
<15yo 480 OR 5.19 (2.65 - 8.69)
Elliott, 1993
105
cohort of contacts
tuberculin skin test positive
three or more persons per room vs. less than two
Zambia tuberculosis contacts
0+yo 348 OR 3.13 (p=0.022)
Thilothammal, 1996
106
ccs tuberculosis meningitis laboratory confirmed
more vs. less living space in square feet per person
hospital controls from the seizure clinic with febrile convulsions block matched for age and sex
India hospital cases, 6mo-12yo
107 cases + 321 controls
OR 1.64 (1.02 - 2.64)
1ccs=case-control,
ccx=cross-sectional

50
Figure 12: Tuberculosis meta-analysis forest plot
4.5.7. Otitis media
Three studies looking at different forms of otitis media (OM) (previous acute OM
episodes, middle ear effusion prevalence, chronic OM) were eligible for meta-analysis
(Table 17). Two found no significant relationship between disease risk and measures
of household crowding and one found a protective effect for chronic otitis media.
Table 17: Studies eligible for meta-analysis with unique outcomes in the otitis
media group
Author, year
study design
outcome exposure place incid. population age n measure of effect
Unique outcomes:
Homøe, 1999
107
cx previous acute OM episodes
persons per room
Green-land
33% children born in Greenland
3,4,5,8yo 591 OR (linear) 1.24 (0.88 - 1.74)
Strachan, 1990
108
cx middle ear effusion prevalence
more than one person per room vs. less than one
UK 9% three schools 6-7yo 879 OR 1.05 (0.70 - 1.57)
Kim, 1993
109
ccs chronic OM
four or more living rooms vs. one living room
Korea 3% population sample of households
0+yo 201 cases + 8910 controls
RR 0.50 (0.32 - 0.80)
OM=otitis media, cx=cross-sectional, ccs=case-control,
4.5.8. Influenza
Two cohort studies of influenza-like illness were eligible for meta-analysis, however
one gives an OR and the other a RR so they were not combined (Table 18). Both
found a significant positive relationship between disease risk and measures of
household crowding.

51
Table 18: Studies eligible for meta-analysis with unique outcomes in the influenza
group
Author, year
design outcome exposure place occur. population age n measure of effect
Unique outcomes:
Forshey110
, 2010
cohort contacts
influenza like illness
2-2.9 residents per room vs. less than one
Peru 39.8 episodes per 1000 person-years
population surveillance across 45 city blocks
0+yo 1534 OR 1.56 (1.17- 2.08)
Gordon111
, 2009
cohort influenza like illness
five or more people per the number of rooms vs. less than three
Nicaragua 34.8 episodes per 100 person-years
patients of a public primary care facility
2-11yo 2615 RR 1.18 (1.04-1.34)
4.5.9. Measles, mumps, rubella, and varicella (chicken pox)
One cohort study of measles and a cross sectional study of varicella-zoster virus
antibodies were eligible for meta-analysis (Table 19). Both found a significant
positive relationship between disease risk and measures of household crowding.
Table 19: Studies eligible for meta-analysis with unique outcomes in the measles,
mumps, rubella, varicella group
Author, year
study design
outcome exposure place incid. population age n measure of effect
Unique outcomes:
Dayan, 2004
112
cx Varicella-zoster virus antibodies
more than two per bedroom vs. two or fewer
Argentina 99% women attending public health care setting in four cities and one rural area
15-49yo
2803 OR 2.70 (1.22 - 5.99)
Silfverdal, 2009
113
cohort clinical measles
quintiles of person per room at 5yo
UK 50% all children born in one week of April 1970 living in Great Britain
0-10yo 10207 OR 1.36 (1.14 - 1.62)
cx=cross-sectional,
4.5.10. Rheumatic fever, heart disease and group A streptococcus
For the rheumatic fever group, four eligible studies were identified (Table 20). Only
one showed a positive association with crowding and it investigated invasive group A
streptococcus infection.
Other syntheses of the literature on crowding and rheumatic fever are available.114,115
These reviews appear to have taken a broader approach by including more eligible
crowding measures and including a greater range of study designs (such as ecological
studies). Both these literature reviews are similar to this review, in that the studies
identified were heterogeneous and no meta-analysis was undertaken.

52
Table 20: Studies eligible for meta-analysis with unique outcomes in the
rheumatic fever, rheumatic heart disease, and invasive GAS group
Author, year
design outcome exposure place occur. population age n measure of effect
Unique outcomes:
Oli116
, 1999
cx rheumatic heart disease prevalence
number of persons per bedroom (two or more in univariate analysis)
Ethiopia 6.4 per 1000
school children in an urban area
10-15yo
9378 OR (linear) 1.00 (0.84 - 1.13)
Factor11
7, 2005
ccs invasive Group A strep: isolation of strep. pyogenes from normally sterile site
fewer rooms in the home
US NR non-institutionalised residents , population based
<18yo 38 cases + 78 controls
OR 1.49 (1.14 - 1.96)
Vlajinac118
, 1991
ccs rheumatic fever incidence
more than two persons per room
Yugoslavia (Serbia Proper)
NR all cases in region identified through reports to health administration
0-19yo (8.1% >20yo)
148 cases + 444 controls
RR 1.35 (0.61 - 3.00)
Coggon119
, 1993
cohort retros-pective
mortality from rheumatic heart disease
one or more persons per room vs. less than 0.50
UK NR Chesterfield township
0+ yo 8138 OR 1.00 (0.40 - 2.30)
RHD=rheumatic heart disease, GAS=Group A Streptococcus, NR=not reported
4.6. Skin and eye infection
Meta-analysis was carried out for trachoma. In addition, eligible studies of skin
infections and pediculosis (head lice) were also described, but had largely unique
outcomes so could not be combined.
4.6.1. Trachoma meta-analysis
Two cross-sectional studies from low income countries were included in the meta-
analysis investigating the association between household crowding and trachoma
(Table 21). For individuals in the most crowded households there was a 2.07 times
increased odds of trachoma. However, the estimate is imprecise and there is
considerable unexplained heterogeneity (I2 94%). In fact the confidence intervals of
each study do not overlap. Heterogeneity is not accounted for by age, country income,
incidence of infection, outcome measure or exposure measure.

53
Table 21: Trachoma study and study population characteristics
Author, year
study design
outcome exposure place incid. study population age n measure of effect
Combined estimates:
Katz, 1996
120
Cx* trachoma on examination
five or more people per room vs. less than five
Nepal 24% population sample house-to-house census
24-76mo
836 OR 1.46 (1.03 - 1.75)
Sahlu, 1992
121
cx trachoma on examination
four or more per room vs. three or less
Ethiopia 27% rural population representative
0+yo 1222 OR 2.90 (2.49 - 3.56)
*=cross-sectional
Figure 13: Trachoma meta-analysis forest plot
4.6.2. Other skin infection and pediculosis
One study of skin infection and one of pediculosis (head lice) were eligible for meta-
analysis (Table 22). The pediculosis study found a significant positive relationship
between disease risk and measures of household crowding whereas there was no
significant association for skin infections.
Table 22: Studies eligible for meta-analysis with unique outcomes in the skin
infection and pediculosis (lice) group
Author, year
study design
outcome exposure place incid. population age n measure of effect
Unique outcomes:
Bailie, 2012
24
cohort / intervention
positive change in skin infection reported by carer between baseline and follow-up
reduction of two or more persons per bedroom over study period vs. baseline
Australia NR children before and after in a housing intervention cohort
<=7yo 302 OR 1.81 (0.82 - 4.02)
Mahmud, 2011
122
cx head lice 3.5 or more persons per room vs. less than 3.5
Australia 6% women in national survey
12+yo 2321 OR 1.50 (1.10 - 2.10)
NR=not reported

54
4.7. Other infections
One study of Epstein–Barr virus (EBV) and one of Human Herpesvirus 8 (HHV8)
were eligible for meta-analysis (Table 22). The EBV study found a significant
positive relationship between disease risk and measures of household crowding
whereas there was no significant association for HHV8.
Two other eligible studies looked at multiple infectious diseases (Table 24). One was
a case-control study of infectious illness warranting hospitalisation and one was a
prevalence study of communicable disease symptoms. Both found a significant
positive relationship between disease risk and measures of household crowding.
Table 23: Studies eligible for meta-analysis with unique outcomes in the Epstein
Barr Virus, Herpesvirus group
Author, year
study design
outcome exposure place incid. population age n measure of effect
Unique outcomes:
Anderson, 2008
123
cx HHV8 Abs one or more person per room vs. less than one
US 1% national survey weighted to be representative
6-17yo
4166 OR 1.10 (0.40 - 2.90)
Crowcroft, 1998
124
cx EBV child shares a bedroom
UK 56% population representative sample of school children
11yo 552 OR 1.78 (1.14 - 2.79)
Table 24: Studies eligible for meta-analysis with unique outcomes in multiple
infectious diseases groups
Author, year
study design
outcome exposure controls place incid.
population age n measure of effect
Unique outcomes:
Berg, 1991
125
ccs infectious illness warranting hospitalisation (including Hib, N meningitidis)
sharing a bedroom community controls matched on age and primary health clinic
US NR excluded if had underlying condition, no phone or unable to attend day care
3-59 mo
193 cases + 193 controls
OR 2.40 (1.35 - 4.27)
Booth, 1976
126
cx prevalence of communicable disease based on symptoms
1. Kitchen set in wall of another room. 2. Number of hours respondent is awake and at home when the number of people is equal to or greater than the number of rooms. 3. Number of hours respondent is awake and at home when the number of people in the room with the respondent is two or more.
Canada 0% males - white urban intact families selected for crowded neighbour-hood and household conditions
adults 213 OR 2.69 (p<0.05)
NR=not reported

55
4.8. New Zealand studies
The following section summarises studies conducted in NZ to investigate the health
effects of household crowding. These studies are briefly summarised here because of
their particular relevance to NZ. This section of the results is therefore outside the
scope of the systematic review. However, two of the studies described here were
eligible for inclusion in the meta-analysis.15,18
Meningococcal disease – A case-control study was conducted during the early
stages of the serogroup B epidemic to identify risk factors for disease in children
<8 years.15 This was a large study that collected multiple measures of crowding
along with data on potential confounders. It found that the risk of disease was
strongly associated with crowding as measured by the number of adult and
adolescent household members per room (OR 10.7, CI 3.9-29.5). This effect
would mean that if a family living in an average sized house of six rooms
increased the number of adolescents or adults by one there would be a 50%
increase in risk of meningococcal disease for a child living in the same household.
If they increased the number by two adolescents or adults there would be a
doubling of risk, by four adolescents or adults a 5-fold increase in risk, and by six
a 10.7-fold increase.15
Rheumatic fever (RF) – An ecological study was conducted of all 1,249 new RF
hospitalisations in NZ, 1996-2005.17
This study used the percentage of crowded
households (measured using the Canadian National Occupancy Standard) in a
neighbourhood (census area unit) as the exposure measure. It used a multivariate
model (zero inflated negative binomial) that included household income (Jensen
Equivalised Annual Household Income) and proportion of children 5-14 years in
the neighbourhood. It found a significant independent risk from the crowding
exposure. The incidence rate ratio (IRR) for the risk of RF in relation to the
percentage of household crowding was: Total pop=1.065 (CI 1.052-1.079),
Children 5-14 years=1.040 (CI 1.029–1.050), Māori and Pacific children 5-14
years=1.022 (CI 1.010–1.034). The IRR of 1.065 in the full model means that for
every 1% increase in the average crowding level of a Census Area Unit (CAU)
there would be a 6.5% increase in the expected RF count in that CAU, assuming
the other variables were held constant. This means that if we used the least
crowded quintile of housing as a reference (median crowding level of 0.77%), we
would expect the RF count in the most crowded quintile (median crowding level
of 12.03%) to be approximately 88% higher if all the other variables were held
constant (based on an approximately 11% increase in crowding level).17
Rheumatic fever - An earlier study described 240 cases of RF in Auckland, NZ,
over the 1981-84 period.127
It found that RF cases tended to come from crowded
households. However, it did not have a control population so it is hard to evaluate
the findings.
Tuberculosis – An ecological study was conducted of all 1898 notified TB cases in
NZ over the 2000-04 period.16
This study used percentage of crowded households
(measured using the Canadian National Occupancy Standard) in the
neighbourhood (Census Area Unit) as the exposure measure. It used a multivariate
model (negative binomial) that included household income (Jensen Equivalised
Annual Household Income), migration, age, and existing TB burden in the
neighbourhood. It found statistically significant associations between TB
incidence and household crowding in both the total population (IRR 1.05, CI 1.02-

56
1.08) and in NZ-born people <40 years (IRR 1.08, CI 1.04-1.12). TB incidence
was also associated with migration and income. The IRR of 1.05 in the full model
means that for every 1% increase in the average crowding level of a CAU there
would be a 5% increase in the expected TB count in that CAU, assuming the other
variables were held constant. This means that if the least crowded quintile of
housing was used as a reference (median crowding level of 0.94%), the TB count
in the most crowded quintile (median crowding level of 9.49%) would be expected
to be approximately 41% higher if all the other variables were held constant (based
on an approximately 8% increase in crowding level). For NZ-born people aged
<40 years, with an IRR of 1.08, the effect would be even stronger with the
expected TB count approximately 71% higher in the most crowded quintile.16
Pneumonia – A recently published case-control study in Auckland18
demonstrating
the increased risk of pneumonia hospitalisation for children exposed to household
crowding (OR 2.87, CI 1.33-6.41) and mould in the child’s bedroom (OR 2.39, CI
1.25-4.72). The American Crowding Index was used as the measure of crowding
where the house is considered crowded if there is more than one person per room.
Crowding reduction as part of the HNZC Healthy Housing Programme (HHP) –
The three objectives of the HHP were described by the former HNZC CEO
Michael Lennon as being, ‘to reduce state housing overcrowding, reduce the risk
of meningococcal disease and other infectious disease, and conduct independent
and external evaluation of the pilot scheme prior to any rollout implementation.’ 128
The HHP had an initial pilot from January 2001 to June 2002 with the main
programme starting in 2003. Initial evaluation of the programme was based on
qualitative interviews of 30 selected households and all available HHP providers.
The authors concluded that the health goals of the initial HHP had been
strengthened by its ‘evolution’ into a more holistic approach to promoting
household well-being.129
Initial quantitative evaluation of the HHP found a
significant reduction in acute hospitalisations for younger participants in the HHP
(a 23% reduction for those aged 5-34 years).130
However, the study could not
separate the contribution of crowding reduction from the other components of the
intervention.131
A more extensive evaluation used a control population.132
This
evaluation found that for children (<20 years of age), participation in the HHP was
associated with a statistically significant fall in the total number of acute and
arranged hospitalisations of 27% (CI -43% to -6%) in the year following
completion of the HHP interventions. The effect of the HHP appeared more
marked for the most intensive intervention, crowding reduction, which was
associated with the largest reduction of 61% (CI -79% to -26%) in acute and
arranged admissions.132
Although CCID dropped by 69% (CI -91% to +1%) in the
crowding reduction sub-group, this decline was of marginal statistical significant.
57
4.9. Burden of infectious disease from household crowding
Results of the burden of disease analysis are shown in Table 25. These estimates have
been made for nine categories of infectious disease using estimates from meta-
analyses (Table 6). Trachoma was excluded as there is no transmission in New
Zealand. URTIs were retained, with the uncertainty around this estimated effect
reflected by the confidence intervals (which overlap one).
The greatest absolute numbers of hospital admissions attributable to household
crowding correspond to the most common CCID admission categories. In the age
groups studied, bronchiolitis (667, CI 89-1399), pneumonia/LRTI excluding
bronchiolitis and Hib disease (296, CI 154-455) and URTIs (177, CI -158-668)
accounted for the greatest number of hospital admissions attributable to household
crowding.
For the diseases included in the meta-analyses, the total number of hospitalisations
attributed to household crowding is estimated to be 1,343 (CI 182-2843) per year.
This total is 9.8% of the 13,680 hospital admissions a year from these diseases (which
represent about one fifth of the total 75,706 ID hospitalisations a year in NZ over the
2004-08 period1).
This analysis has also looked at the estimated contribution of exposure to household
crowding for different ethnic groups. Despite their smaller populations, Māori (Table
27) and Pacific (Table 28) ethnic groups each had more hospital admissions per year
attributable to household crowding than European/Others (Table 26). For
European/Others exposure to household crowding is estimated to cause 331 (CI 20-
799) admissions a year or 5% of the total 7,224 admissions a year for these groups of
diseases. For Asian peoples exposure to household crowding is estimated to cause 108
(CI 23-206) admissions a year, or 13% of IDs. For Māori the contribution from
exposure to household crowding is higher, with an estimated 790 (CI 106-1540)
hospitalisations a year which is 16.8% of the 4,703 hospitalisations a year from these
diseases. For Pacific peoples the estimated contribution from exposure to household
crowding is similar to Māori with 692 (CI 136-1184) admissions a year. However, for
Pacific peoples the relative contribution is the highest seen for any ethnic group, with
an estimated 24.7% of 2,802 admissions per year attributable to this exposure for the
IDs included in the analysis. The relatively larger contribution of household crowding
to Māori and Pacific disease incidence is largely because exposure to household
crowding is much higher for these populations. In addition, Māori and Pacific peoples
have rates of hospitalisation for serious infectious diseases that are two to three times
higher than those of the European/Other population. Consequently, these ethnic
groups experience a greater absolute effect from any exposure that increases their risk
of infectious disease.
The contribution of exposure to household crowding is particularly large for some
diseases affecting Māori and Pacific peoples. Meningococcal disease predominantly
occurs in children (0-16 years) and the meta-analysis shows that risk is strongly
associated with exposure to household crowding. For Pacific children (where 45% are
exposed to household crowding) an estimated 34% of disease burden and in Māori
children (where 28% are exposed to household crowding) an estimated 23% of disease
burden can be attributed to this exposure. By comparison, the estimate is only 9% in
European/Other children (where only 8% are exposed to household crowding).

58
Table 25: Estimated burden of infectious disease in New Zealand attributable to
household crowding, 2007-11, Total population
Infectious disease outcome
No.
studiesa
Age group
Meta-analysis summary
effect
(95% C.I.)
Prevalence household
crowding in this age group
(%)b
Number of hospital
admissions per year
c
Number of annual
admissions attributable
to household crowding
(95% C.I.)d
Hospital admission rate (per 100,000
persons of this age
per year)c
Hospital admission
rate attributable to crowding
(95% C.I.)d
Enteric
Gastroenteritis 4 0-5yo OR 1.13 (1.01,1.26)
17 2371 51 (4-100)
713 15 (1-30)
Hepatitis A 7 0+yo OR 1.53 (1.23,1.90)
10 11 0.6 (0.3-0.9)
0.27 0.01 (0.01-0.02)
Helicobacter pylori 28 0+yo OR 1.82 (1.55,2.14)
10 1511 119 (82-159)
38 2.9 (2.0-3.9)
Respiratory tract
Bronchiolitis from respiratory syncytial virus
4 0-3yo OR 2.24 (1.14,4.38)
17 3848 667 (89-1,399)
1749 303 (40-636)
Haemophilus influenzae
6 0-6yo OR 1.74 (1.27,2.37)
17 10 1.1 (0.4-1.8)
2.5 0.3 (0.1-0.5)
Pneumonia / lower respiratory tract infection
4 0-5yo OR 1.69 (1.34,2.13)
17 6692 699 (364-1,073)
2013 210 (109-323)
6 0-3yo RR 1.36 (1.09,1.69)
17 6315 362 (95-659)
2870 165 (43-300)
Upper respiratory tract infection
3 0-18yo OR 1.39 (0.69,2.79)
17 2919 177 (-158-668)
264 16 (-14-60)
3 0-2yo RR 1.63 (0.88,3.02)
17 1752 169 (-36-446)
1062 102 (-22-270)
Meningococcal disease
7 0-16yo OR 2.13 (1.38,3.29)
17 66 10 (4-18)
6.7 1.1 (0.4-1.8)
Tuberculosis 17 15+yo OR 3.78 (1.75,8.13)
9 109 21 (7-42)
3.5 0.7 (0.2-1.3)
a Number of studies contributing to summary estimate
b The prevalence of household crowding (one or more bedrooms in deficit) is taken from the 2006 Census
136
c Annual hospital admission numbers and rates are based on average overnight admissions from 2007-11 from the National
Minimum Data Set, with the following ICD codes: Gastroenteritis (A00-A09, K529, K528, R11), Hepatitis A (B15), Sequelae of H. pylori infection (non-cardia gastric cancer [C161-C169 ], peptic ulcer [K25-K28], gastritis and duodenitis [K293-295]), Bronchiolitis
(J21), Hib disease (J14, A413, A492), Pneumonia/LRTI (A481, A482, B59, J09-J18, J20- J22), Upper respiratory tract infection (J00-J06, J32, J340, J36, J37, J390, J392), Meningococcal disease (A39) and Tuberculosis (A15-A19, N740, N741, J65). d The following formula is used to calculate the proportion of admissions attributable to crowding:
PAF = p (RR-1)
p (RR-1) + 1

59
Table 26: Estimated burden of infectious disease in New Zealand attributable to
household crowding, 2007-11, European/Other
Infectious disease outcome
No.
studiesa
Age group
Meta-analysis summary
effect
(95% C.I.)
Prevalence household
crowding in this age group
(%)b
Number of hospital
admissions per year
c
Number of annual
admissions attributable
to household crowding
(95% C.I.)d
Hospital admission rate (per 100,000
persons of this age
per year)c
Hospital admission
rate attributable to crowding
(95% C.I.)d
Enteric
Gastroenteritis 4 0-5yo OR 1.13 (1.01,1.26)
8 1528 16 (1-32)
639 7 (1-13)
Hepatitis A 7 0+yo OR 1.53 (1.23,1.90)
5 7 0.17 (0.01-0.28)
0.22 0.01 (0.00-0.01)
Helicobacter pylori 28 0+yo OR 1.82 (1.55,2.14)
5 999 37 (25-50) 33 1.2 (0.8-1.7)
Respiratory tract
Bronchiolitis from respiratory syncytial virus
4 0-3yo OR 2.24 (1.14,4.38)
8 1442 132 (16-310)
908 83 (10-195)
Haemophilus influenzae
6 0-6yo OR 1.74 (1.27,2.37)
8 4 0.25 (0.1-0.4)
1.6 0.1 (0.0-0.2)
Pneumonia / lower respiratory tract infection
4 0-5yo OR 1.69 (1.34,2.13)
8 2772 147 (74-232)
1158 61 (31-97)
6 0-3yo RR 1.36 (1.09,1.69)
8 2567 73 (19-136)
1617 46 (12-86)
Upper respiratory tract infection
3 0-18yo OR 1.39 (0.69,2.79)
10 1865 71 (-60-286)
237 9 (-8-36)
3 0-2yo RR 1.63 (0.88,3.02)
8 1065 52 (-10-150)
895 43 (-9-126)
Meningococcal disease
7 0-16yo OR 2.13 (1.38,3.29)
8 24 2 (1-4)
3.4 0.3 (0.1-0.5)
Tuberculosis 17 15+yo OR 3.78 (1.75,8.13)
4 30 3 (1-6)
1.3 0.1 (0.0-036)
a Number of studies contributing to summary estimate
b The prevalence of household crowding (one or more bedrooms in deficit) is taken from the 2006 Census
136
c Annual hospital admission numbers and rates are based on average overnight admissions from 2007-11 from the National
Minimum Data Set, with the following ICD codes: Gastroenteritis (A00-A09, K529, K528, R11), Hepatitis A (B15), Sequelae of H. pylori infection (non-cardia gastric cancer [C161-C169 ], peptic ulcer [K25-K28], gastritis and duodenitis [K293-295]), Bronchiolitis (J21), Hib disease (J14, A413, A492), Pneumonia/LRTI (A481, A482, B59, J09-J18, J20- J22), Upper respiratory tract infection (J00-J06, J32, J340, J36, J37, J390, J392), Meningococcal disease (A39) and Tuberculosis (A15-A19, N740, N741, J65). d The following formula is used to calculate the proportion of admissions attributable to crowding:
PAF = p (RR-1)
p (RR-1) + 1

60
Table 27: Estimated burden of infectious disease in New Zealand attributable to
household crowding, 2007-11, for Māori
Infectious disease outcome
No.
studiesa
Age group
Meta-analysis summary
effect
(95% C.I.)
Prevalence household
crowding in this age group
(%)b
Number of hospital
admissions per year
c
Number of annual
admissions attributable
to household crowding
(95% C.I.)d
Hospital admission rate (per 100,000
persons of this age
per year)c
Hospital admission
rate attributable to crowding
(95% C.I.)d
Enteric
Gastroenteritis 4 0-5yo OR 1.13 (1.01,1.26)
27 595 20 (2-39)
746 25 (2-49)
Hepatitis A 7 0+yo OR 1.53 (1.23,1.90)
22 1 0.11 (0.05-0.17)
0.2 0.02 (0.01-0.03)
Helicobacter pylori 28 0+yo OR 1.82 (1.55,2.14)
22 284 44 (31-57) 50 8(5-10)
Respiratory tract
Bronchiolitis from respiratory syncytial virus
4 0-3yo OR 2.24 (1.14,4.38)
27 1871 468 (68-891)
3522 881 (128-1,677)
Haemophilus influenzae
6 0-6yo OR 1.74 (1.27,2.37)
27 3.8 0.6 (0.3-1.0)
4.1 0.7 (0.3-1.1)
Pneumonia / lower respiratory tract infection
4 0-5yo OR 1.69 (1.34,2.13)
27 2861 448 (240-667)
3586 561 (301-836)
6 0-3yo RR 1.36 (1.09,1.69)
27 2749 243 (65-430)
5173 457 (122-810)
Upper respiratory tract infection
3 0-18yo OR 1.39 (0.69,2.79)
27 905 86 (-83-296)
367 35 (-34-120)
3 0-2yo RR 1.63 (0.88,3.02)
27 587 85 (-20-207)
1473 214 (-49-519)
Meningococcal disease
7 0-16yo OR 2.13 (1.38,3.29)
27 33 8 (3-13)
14.7 3.4 (1.4-5.6)
Tuberculosis 17 15+yo OR 3.78 (1.75,8.13)
19 25 9 (3-14)
6.7 2.4 (0.9-3.9)
a Number of studies contributing to summary estimate
b The prevalence of household crowding (one or more bedrooms in deficit) is taken from the 2006 Census
136
c Annual hospital admission numbers and rates are based on average overnight admissions from 2007-11 from the National
Minimum Data Set, with the following ICD codes: Gastroenteritis (A00-A09, K529, K528, R11), Hepatitis A (B15), Sequelae of H. pylori infection (non-cardia gastric cancer [C161-C169 ], peptic ulcer [K25-K28], gastritis and duodenitis [K293-295]), Bronchiolitis (J21), Hib disease (J14, A413, A492), Pneumonia/LRTI (A481, A482, B59, J09-J18, J20- J22), Upper respiratory tract infection (J00-J06, J32, J340, J36, J37, J390, J392), Meningococcal disease (A39) and Tuberculosis (A15-A19, N740, N741, J65). d The following formula is used to calculate the proportion of admissions attributable to crowding:
PAF = p (RR-1)
p (RR-1) + 1

61
Table 28: Estimated burden of infectious disease in New Zealand attributable to
household crowding, 2007-11, Pacific peoples
Infectious disease outcome
No.
studiesa
Age group
Meta-analysis summary
effect
(95% C.I.)
Prevalence household
crowding in this age group
(%)b
Number of hospital
admissions per year
c
Number of annual
admissions attributable
to household crowding
(95% C.I.)d
Hospital admission rate (per 100,000
persons of this age
per year)c
Hospital admission
rate attributable to crowding
(95% C.I.)d
Enteric
Gastroenteritis 4 0-5yo OR 1.13 (1.01,1.26)
44 360 19 (2-37)
866 47 (4-89)
Hepatitis A 7 0+yo OR 1.53 (1.23,1.90)
41 1.4 0.25 (0.12-0.38)
0.53 0.09 (0.05-0.14)
Helicobacter pylori 28 0+yo OR 1.82 (1.55,2.14)
41 169 42 (31-53) 63 16 (12-20)
Respiratory tract
Bronchiolitis from respiratory syncytial virus
4 0-3yo OR 2.24 (1.14,4.38)
44 1072 379 (62-641)
3846 1358 (223-2,300)
Haemophilus influenzae
6 0-6yo OR 1.74 (1.27,2.37)
44 1.6 0.4 (0.20.6)
3,3 0.8 (0.4-1.2)
Pneumonia / lower respiratory tract infection
4 0-5yo OR 1.69 (1.34,2.13)
44 1840 429 (239-611)
4427 1,031 (576-1,470)
6 0-3yo RR 1.36 (1.09,1.69)
44 1770 242 (67-412)
6349 868 (242-1,479)
Upper respiratory tract infection
3 0-18yo OR 1.39 (0.69,2.79)
45 402 60 (-64-178)
328 49 (-53-146)
3 0-2yo RR 1.63 (0.88,3.02)
44 269 58 (-15-126)
1286 279 (-72-605)
Meningococcal disease
7 0-16yo OR 2.13 (1.38,3.29)
45 17 6 (2-8)
15.1 5.1 (2.2-7.6)
Tuberculosis 17 15+yo OR 3.78 (1.75,8.13)
39 14 7 (3-10)
8.3 4.3 (1.9-6.1)
a Number of studies contributing to summary estimate
b The prevalence of household crowding (one or more bedrooms in deficit) is taken from the 2006 Census
136
c Annual hospital admission numbers and rates are based on average overnight admissions from 2007-11 from the National
Minimum Data Set, with the following ICD codes: Gastroenteritis (A00-A09, K529, K528, R11), Hepatitis A (B15), Sequelae of H. pylori infection (non-cardia gastric cancer [C161-C169 ], peptic ulcer [K25-K28], gastritis and duodenitis [K293-295]), Bronchiolitis (J21), Hib disease (J14, A413, A492), Pneumonia/LRTI (A481, A482, B59, J09-J18, J20- J22), Upper respiratory tract infection (J00-J06, J32, J340, J36, J37, J390, J392), Meningococcal disease (A39) and Tuberculosis (A15-A19, N740, N741, J65). d The following formula is used to calculate the proportion of admissions attributable to crowding:
PAF = p (RR-1)
p (RR-1) + 1

62
Table 29: Estimated burden of infectious disease in New Zealand attributable to
household crowding, 2007-11, Asian peoples
Infectious disease outcome
No.
studiesa
Age group
Meta-analysis summary
effect
(95% C.I.)
Prevalence household
crowding in this age group
(%)b
Number of hospital
admissions per year
c
Number of annual
admissions attributable
to household crowding
(95% C.I.)d
Hospital admission rate (per 100,000
persons of this age
per year)c
Hospital admission
rate attributable to crowding
(95% C.I.)d
Enteric
Gastroenteritis 4 0-5yo OR 1.13 (1.01,1.26)
24 208 6 (0-12) 718 22 (2-42)
Hepatitis A 7 0+yo OR 1.53 (1.23,1.90)
41 2 0.2 (0.1-0.4) 0.7 0.1 (0.0-0.1)
Helicobacter pylori 28 0+yo OR 1.82 (1.55,2.14)
41 96 13 (9-17) 27 4 (3-5)
Respiratory tract
Bronchiolitis from respiratory syncytial virus
4 0-3yo OR 2.24 (1.14,4.38)
24 134 31 (4-60) 703 161 (23-314)
Haemophilus influenzae
6 0-6yo OR 1.74 (1.27,2.37)
24 0.4 0.1 (0.0-0.1) 1.2 0.2 (0.1-1.3)
Pneumonia / lower respiratory tract infection
4 0-5yo OR 1.69 (1.34,2.13)
24 337 48 (25 -72) 1166 165 (88- 248)
6 0-3yo RR 1.36 (1.09,1.69)
24 294 23 (6-42) 1539 122 (32-218)
Upper respiratory tract infection
3 0-18yo OR 1.39 (0.69,2.79)
22 166 13 (-12-47) 162 13 (-12-46)
3 0-2yo RR 1.63 (0.88,3.02)
24 111 14 (-3-36) 772 101 (-23-251)
Meningococcal disease
7 0-16yo OR 2.13 (1.38,3.29)
22 1.2 0.2 (0.1-0.4) 1.3 0.3 (0.1-0.4)
Tuberculosis 17 15+yo OR 3.78 (1.75,8.13)
19 45 16 (6-26) 16 6 (2-9)
a Number of studies contributing to summary estimate
b The prevalence of household crowding (one or more bedrooms in deficit) is taken from the 2006 Census
136
c Annual hospital admission numbers and rates are based on average overnight admissions from 2007-11 from the National
Minimum Data Set, with the following ICD codes: Gastroenteritis (A00-A09, K529, K528, R11), Hepatitis A (B15), Sequelae of H. pylori infection (non-cardia gastric cancer [C161-C169 ], peptic ulcer [K25-K28], gastritis and duodenitis [K293-295]), Bronchiolitis (J21), Hib disease (J14, A413, A492), Pneumonia/LRTI (A481, A482, B59, J09-J18, J20- J22), Upper respiratory tract infection (J00-J06, J32, J340, J36, J37, J390, J392), Meningococcal disease (A39) and Tuberculosis (A15-A19, N740, N741, J65). d The following formula is used to calculate the proportion of admissions attributable to crowding:
PAF = p (RR-1)
p (RR-1) + 1

63
5. Discussion
In this discussion we summarise and discuss the key findings from this review. We
also assess the strengths and weaknesses of this analysis and consider the implications
of our findings for policy and further research.
5.1. Key findings
A large body of evidence from non-randomised observational studies was identified
demonstrating an association between household crowding density and CCIDs. No
randomised trials were identified and only one study investigated the impact of a
crowding reduction intervention.
More than half of the studies in the narrative synthesis (189/345, 55%) found a
statistically significant positive association between greater household crowding and
CCID risk. Fewer than half of the studies (151, 44%) found no statistical evidence of
an association and a very small minority (5, 1%) found a significant negative
association (Table 5). The proportion of studies with evidence of an association was
relatively similar across respiratory (51%), enteric (59%) and skin/eye infections
(59%).
Of the studies included in the narrative synthesis, 116 met additional criteria for
inclusion in a meta-analysis, that is they included a quantitative measure of the effect
of crowding exposure (an OR or RR) and they included adjustment for age and SES.
Within this group of higher quality studies, meta-analysis of combined outcomes was
possible for 82 studies across ten different CCIDs (Table 6). Nine out of ten of these
combined analyses demonstrated a statistically significant association between greater
household crowding and infectious disease risk. For the one exception, upper
respiratory tract infections, there was a positive association with household crowding,
but this association was not statistically significant (OR 1.39, CI 0.69-2.79 and RR
1.63, CI 0.88-3.02). These associations were independent of age and socioeconomic
status. Increased odds of infection for persons experiencing the greatest vs. least
household crowding ranged from 1.13 times increased odds for gastroenteritis to 3.78
times for tuberculosis.
The most robust combined measures were for gastroenteritis, pneumonia/lower
respiratory tract infection, Hib disease and respiratory syncytial virus (RSV)
bronchiolitis. Associations between household crowding and risk of hepatitis A, H.
pylori infection, meningococcal disease, tuberculosis and trachoma were less robust
due to greater unexplained heterogeneity (variation in individual study results).
Over half of the meta-analyses (6/10) focussed on the impact of household crowding
on children, with the vast majority of participants less than six years old. CCIDs with
the most consistent results are some of the most frequent and increasing reasons for
hospital admission, particularly among children.1
For five of these outcomes (gastroenteritis, pneumonia, bronchiolitis, Hib disease, and
tuberculosis) there were additional studies that reported largely unique outcomes so
could not be included in the combined analyses. About half (8/15) of these additional
studies found significant positive associations between the disease in question and
household crowding. These diseases were: toxoplasma gondii, typhoid fever, wheeze

64
associated with RSV, Hib carriage, tuberculin positivity (2 studies), and tuberculosis
meningitis. Most of the remainder (5/14) found no significant positive associations
between the disease in questions and household crowding: bacillary dysentery,
diarrhoeal deaths, mortality from respiratory infection, symptoms of tuberculosis, and
self-reported tuberculosis. One study found a weak protective effect (carriage of
multiple drug resistant E. coli) associated with household crowding.
This review identified a further 21 eligible studies covering 16 additional specific
infectious diseases. The outcomes were too heterogeneous to allow for combined
estimates. A majority (13/21) found significant positive associations between the
disease in questions and household crowding. These diseases were: giardia, intestinal
parasites (3 studies), influenza-like illness (2 studies), measles, varicella-zoster
infection, invasive GAS infection, pediculosis, Epstein–Barr virus infection, infectious
illness warranting hospitalisation, and communicable disease symptoms. Most of the
remainder (7/21) found no significant positive associations between the disease in
questions and household crowding: otitis media (2 studies), rheumatic fever incidence,
rheumatic heart disease (RHD) prevalence, RHD mortality, skin infections and
Human Herpesvirus 8 infection. One study found a protective effect for chronic otitis
media associated with household crowding.
The evidence base of high-quality research studies was relatively large for some
important syndromes, such as gastroenteritis and pneumonia, and for some specific
infectious diseases, such as H. pylori infection, tuberculosis, Hib disease,
meningococcal disease and hepatitis A. For other important syndromes and diseases
the research base was very limited, notably for skin infections and rheumatic fever.
For these later diseases, there were insufficient high quality studies to produce
combined estimates of the effect of exposure to household crowding so no conclusions
can be drawn about the impact of this risk factor.
We used a burden of disease analysis to estimate the contribution of exposure to
household crowding to the incidence of serious IDs in NZ. This approach used the
effect measures obtained from the meta-analyses combined with the estimated
prevalence of exposure to household crowding in NZ to estimate the population
attributable fraction (PAF) of IDs from household crowding. This estimate was then
applied to hospitalisation incidence data for nine categories of IDs to estimate
hospitalisations attributed to household crowding. The total was estimated to be 1,343
(CI 182-2843) per year. This total is 9.8% of the 13,680 hospital admissions a year
from these diseases (which represent about one fifth of the total 75,706 annual ID
hospitalisations in NZ over the 2004-08 period1).
There are very large ethnic inequalities with this disease burden. For European/Others
exposure to household crowding is estimated to cause 331 (CI 20-799) admissions a
year, or 4.6% of IDs (in the nine groups examined). For Asian peoples exposure to
household crowding is estimated to cause 108 (CI 23-206) admissions a year, or
12.7% of IDs. For Māori the contribution from exposure to household crowding is
higher, with an estimated 790 (CI 106-1540) hospitalisations a year or 16.8% of ID
admissions, and for Pacific peoples the estimated contribution is 692 (CI 136-1184)
admissions a year, or 24.7% of ID admissions.
The contribution of exposure to household crowding is particularly large for some
diseases. For example, meningococcal disease predominantly occurs in children (0-16
years) and the meta-analysis shows that risk is strongly associated with exposure to
household crowding. For Pacific children (where 45% are exposed to household

65
crowding) an estimated 34% of disease burden and in Māori children (where 28% are
exposed to household crowding) an estimated 23% of disease burden can be attributed
to this exposure. By comparison, the estimate is only 9% for European/Other children
(where only 8% are exposed to household crowding).
5.2. Strengths and limitations
The strength of this systematic review is the ability to simultaneously explore the
impact of household crowding density across a breadth of CCID outcomes. We were
able to pivot our search strategy on household crowding density and investigate the
expanse of potential infectious disease outcomes. In this way, it was immediately
obvious which outcomes have been most investigated (such as H. pylori,
meningococcal disease) and which outcomes lack a large body of quality research
investigating the impact of household crowding (such as influenza, rheumatic fever,
and skin infections).
Inclusion of ten different infectious outcomes (diseases and syndromes) in the meta-
analysis enables us to investigate the consistency of results across different CCIDs,
study designs, settings and differences in quality. In this way we can see which
populations, or indeed age groups, have been most investigated and for which there is
the most evidence of an association with crowding. The consistency of meta-analysis
results across a variety of study designs and a wide variety of settings supports the
importance of household crowding in the aetiology of CCID.
5.2.1. Biological plausibility
The contribution of household crowding to increased rates of CCIDs has a high degree
of biological plausibility. The potential for an infectious disease to spread from person
to person in a population is summarised by the reproduction number. The reproduction
number (R0) is driven by the risk of transmission per contact (), the number of such
contacts that an average person in the population would normally have per unit time
(), and the duration of infectivity of an infected person (D). The formula for R0 then
becomes: R0= D.137
Household crowding would be expected to increase the number
of contacts that household members have over a period of time and potentially the risk
of transmission per contact and therefore increase R0 for infection within that
population.
Another reason why the household setting is so important for infectious disease
transmission is that we spend the majority of our time in the home environment. Time-
activity-microenvironment data for NZ shows we spend about 70% of our lives
indoors at home, with even higher proportions for children and the elderly who are
more vulnerable to infection.138
5.2.2. Consistency with other research
Our results are consistent with the small number of other published literature reviews
which highlight the association between crowding and various IDs. This study has
been able to go a step further and carry out meta-analysis on all the available literature
to produce combined effect estimates.

66
Systematic reviews particularly relevant to individual meta-analyses are discussed in
more detail with the presentation of individual meta-analysis results.79,114,115
5.2.3. Lack of intervention studies
Of note, there was a complete absence of randomised controlled trials identified in the
systematic review and almost a complete absence of intervention studies. For
example, a randomised controlled trial might evaluate the impact of crowding
reduction using a staggered intervention approach (as successfully used in NZ to
measure the impact of home insulation and home heating139
).
There was identified, however, one non-randomised study investigating the impact of
an intervention using a cohort study design. This recently published study in an
Australian aboriginal community evaluated an intervention that aimed to reduce
infection disease burden by reducing household crowding.24
However, the intervention
had a limited impact on reducing crowding.
Several systematic reviews of housing interventions have been reported.140,141
The
most recent of these published in 2009 identified a single study that mentioned
crowding reduction.141
This study was a programme to improve housing conditions
and reduce overcrowding. It was an uncontrolled US study that aimed at individual
owners with families on low incomes. The report was based on a conference abstract
(not reviewed).141
Our systematic review results are consistent with the findings from evaluation of the
HNZC Healthy Housing Programme which show a reduction in acute hospitalisation
for younger participants.130, 132
As has been noted, the Healthy Housing Programme
was a mixed intervention with crowding reduction just a part.
5.2.4. Review level limitations
Despite the efforts of the authors, the broad focus of this review has possibly
sacrificed a level of depth. Potential limitations of the review are incomplete retrieval
of study results, residual confounding and reporting bias.
The review focussed on published papers. This restriction may have limited the
identification of relevant articles with non-significant or negative associations. Despite
efforts to retrieve all study records, 5/838 full text articles were not obtained for full
text screening. Furthermore, articles with insignificant crowding results may not refer
to crowding in the abstract or key words, and thus remain undetected by our search.
The overall extent or direction to which incomplete retrieval has influenced our results
is unclear. However, results from the narrative synthesis are supportive of meta-
analysis findings.
Requiring effect measures in the meta-analysis to be adjusted for confounding is
important to control confounding bias and is recommended in meta-analyses of
observational studies.21
We attempted to limit confounding by excluding studies
unadjusted for age and socioeconomic status from the meta-analysis. Household
crowding has a complex link with socioeconomic status and it is possible that the
association of CCID with crowding is exaggerated by residual confounding from
socioeconomic status.

67
However, requiring adjusted estimates in this review may also have contributed to
selective reporting bias. For example, stepwise regression within studies meant that
adjusted estimates were more likely to be available when a crowding exposure
contributed significantly to a multivariate model (usually in the positive direction)
than when it did not contribute and was discarded from the model. These studies did
not report adjusted estimates that could contribute to the meta-analysis although they
did contribute to the narrative synthesis.
5.2.5. Burden of disease limitations
The BoD estimates presented here should be taken as broad approximations only.
Each of the three components of the individual disease estimations has a degree of
measurement error. The limitations of the effect estimations have been described
above. The measurement of exposure to household crowding is based on self-reported
Census data so is affected by errors in reporting of household size (bedrooms) and
occupants (numbers, ages, relationship status). Accurate hospitalisation data depends
on the extent of diagnosis and accuracy of disease coding.
The formula used to estimate the BoD makes a number of simplifying assumptions. In
particular it dichotomises the population into crowded and not crowded, and study
findings have similarly been used to produce effect estimates that compare crowded
and not crowded. This simplifying approach was necessary but fails to consider that
exposure to household crowding has many gradations. In addition, few of the studies
used to produce these pooled estimates will have used similar measures of household
crowding to those used to distinguish crowded households in NZ. For example, the
American Crowding Index, used by some of the studies included in this systematic
review, classified 6.2% of the NZ population as exposed to household crowding (more
than one person per room) in the 2006 Census. By contrast, the Canadian National
Occupancy Standard used in this BoD analysis identified 10.4% of the population as
exposed to household crowding (a bedroom deficit of one or more).10
5.3. Implications
This section considers the policy relevance of the findings of this meta-analysis and
burden of disease estimation, including potential policy interventions to reduce
exposure to household crowding and further research needs.
5.3.1. Policy response to reduce household crowding
A full review of housing policy options to reduce exposure to household crowding is
beyond the scope of this report. However, it is important to briefly consider potential
policy responses to this threat to public health.
Meta-analysis findings provide evidence for an association between exposure to
household crowding and the risk of several important IDs, particularly respiratory and
enteric infections. Findings from this report support the need to identify policy and
programmes aimed at reducing household crowding for Māori and Pacific households
in NZ, particularly those with children. Children under five years of age have the
highest rates of hospitalisation of any paediatric age group, and rates are more than

68
double for Māori (SRR 2.05, CI 2.04–2.07) and Pacific (SRR 2.11, CI 2.09–2.13)
compared with European/Other.1
A major driver of household crowding is housing affordability. The ratio of housing
costs to income is often used as a way of measuring affordability. The Ministry of
Social Development (MSD) defines housing affordability based on “the proportion of
households and the proportion of people within households spending >30% of their
income on housing”.142
From 1988 to 1997 the proportion of households spending
>30% of their household income on housing increased from 11% to 25%. This
proportion levelling off at 24% in 1998 and 2001, declined slightly to 21% in 2004,
then increasing to 26% in 2007 and 27% in 2009.19
Low housing affordability is
concentrated in poorer households, those containing children, and those containing
Māori and Pacific families.19
Changes in government policy influence housing affordability. Successive
governments have tended to develop unique responses to affordability problems and
housing need. In the early 1980s, the National Government provided income-related
rents for state tenants and income assistance for low-income beneficiaries in the
private rental sector. In the mid-1980s, Labour expanded income assistance in the
private rental sector to low-income wage earners and the Housing Corporation
targeted state housing to those facing serious housing need. In the early 1990s,
National introduced market rents for state housing and state tenants could apply for an
Accommodation Supplement to assist them with their rent. There was also the sale of
some social housing (11,000 state houses). In 1999, Labour reintroduced income-
related rents and maintained an Accommodation Supplement for the private rental
sector and homeowners.143
The size of the state housing stock may have contributed to housing affordability.
This stock has varied over time, with increasing sales in the early-1980s and early-
1990s.143
In the early 1980s, the stock declined from 59,500 to 56,100 and
subsequently increased to 63,550 by 1991. Over the first half of the 1990s, it reduced
again to 52,500 and then increased to 63,070 in the early 2000s. The patterns of sale
and constructions has shaped the spatial planning, architecture and demography of
state housing.144
Social housing policies are likely to continue to influence housing
affordability going into the future.
A detailed study of the relationship between government housing policy and
household crowding in the 1990s145
concluded that household crowding in that decade
was strongly influenced by housing affordability and state housing rents.145
House
prices almost doubled between 2001 and 2007 and it is predicted that household
crowding will rise in response to increased rents as demand for private rental housing
increases.146
Some of the drivers behind housing need are outside the housing sector. They include:
demographic changes (patterns of household formation, migration, and greater ethnic
diversity); changes in the levels and distribution of employment and unemployment;
economic growth and recession; and levels of income inequality.
One additional factor that may contribute specifically to household crowding for
Māori and Pacific peoples is racial discrimination in the private rental market.
Analysis of the NZ Health Survey has shown that Māori are thirteen times more likely
than European/Other to experience self-reported racial discrimination when buying or

69
renting housing.147
Observational studies of discrimination in the private rental market
have also confirmed racial discrimination by private landlords.148
Specific government interventions may reduce levels of household crowding. The
HNZC Healthy Housing Programme included this objective as one of its specific
goals. Evaluations of the programme show that it has been highly successful at
reducing hospitalisations in children, with suggestive evidence of a reduction in
CCIDs.132,149
Our meta-analysis results highlight the importance of considering interventions to
improve health and particularly the health of children living in poverty. A summary of
housing policy options was recently published by the Expert Advisory Group on
Solutions to Child Poverty.12
In summary, interventions to reduce household crowding in NZ might include the
following broad strategies:
Policies and programmes to increase the number of social and affordable houses
and their proportion of the total housing stock.
Policies to refocus and redesign demand side accommodation supplements and
income related rent subsidies to ensure there is additional support for low income
families and in particular larger families.
Policies to improve accessibility to affordable housing for those most in need,
including Māori and Pacific households. This approach should consider measures
to reduce racial discrimination when buying or renting housing.
Interventions to reduce household crowding, and improve the quality of existing
social housing managed by HNZC. Evaluations of the HNZC Healthy Housing
Programme, which includes a component aimed at reducing levels of household
crowding, showed that it was highly effective at reducing hospitalisation rates in
children.
5.3.2. Further research
This analysis has identified several important gaps in research:
The meta-analysis itself could be further refined and extended. For example, the
quality of individual studies that have been included could be further assessed.
Currently, some quality assessment is included in the study selection process,
notably whether they adjust for key confounders (age, socioeconomic status).
Further quality assessment would include study design, ascertainment of outcome,
selection of controls, selection of the study population and adjustment for
additional confounding. There were studies (n=89) that were eligible for inclusion
and which adjusted for key confounders, but which did not report an OR/RR
(Figure 2). Authors of these studies could be approached to see if they can provide
this analysis. These refinements would change the magnitude of the meta-analysis
findings (and the burden of disease estimates) but are very unlikely to alter the
overall conclusions of this review.
Further meta-analyses could explore other dimensions of household crowding
excluded from this current review, notably bed sharing. It would also be useful to
consider the impact on infectious diseases of crowding in other settings, notably

70
prisons. New Zealand has a very high rate of imprisonment and there have been
publicised outbreaks of infectious diseases in prison. This is an important area
that needs further research.
Intervention studies are required to determine if the findings summarised here
from observational studies truly represent causality between household crowding
and increased risk of CCID. Randomised controlled trials such as those with
staggered interventions would provide the most robust form of evidence. A
crowding reduction programme could be randomly allocated to one group and the
control group would receive the intervention at a later time. New Zealand is well
positioned to conduct such research.
Meta-analyses highlight the paucity of quality studies investigating the impact of
household crowding on some important IDs such as rheumatic fever, influenza and
skin infection. Given New Zealand’s relatively high rates of these diseases we are
well placed to carry out such studies.
There is no apparent international consensus on household crowding or how to
measure it. The value of well-designed observational studies could be improved by
standardisation in the measurement of exposure to household crowding, rigorous
adjustment for confounding, and longitudinal study designs that incorporate
changes in crowding exposures and a wide range of CCID outcomes.
Findings in this report reinforce the additional research information needs raised in
our previous report on the distribution of household crowding in NZ.10
We need to
better understand what household crowding means in practice, for example how
crowding is perceived, how rooms are used within households, and how people
adapt to higher levels of household crowding. It would be valuable to relate
findings on the distribution of household crowding and how this has changed over
time to the incidence and distribution of IDs in these same populations. It would
also be important to assess the impact of household crowding on well-being more
generally, and on the health and social functioning of individuals and families.
Previous studies indicate negative effects on education and psychological
distress.150,151 It would also be useful to fully evaluate interventions in NZ that
have sought to lower levels of household crowding.

71
6. Conclusion
The findings of this review support the conclusion that household crowding is an
important risk factor for transmission of most major categories of close-contact
infectious diseases. Restricting our analysis to the highest quality studies (n=116), and
those where there were multiple published works looking at similar outcomes, allowed
us to produce combined estimates of the effect of household crowding on 10
infectious diseases outcomes. In nine out of 10 of these outcomes there was a
statistically significant positive relationship between household crowding and the risk
of disease (and in the remaining one the effect was positive, but not statistically
significant).
Meta-analyses reliant on observational studies are considered low quality evidence for
causality and may be somewhat overstated by reporting bias and incomplete retrieval.
However, narrative review results of a much larger group of studies support the meta-
analysis results.
The evidence was most robust (with low to moderate unexplained heterogeneity) for
gastroenteritis, hepatitis A, H. pylori infection, pneumonia/LRTI, Hib disease, RSV
bronchiolitis, meningococcal disease, and tuberculosis. These IDs contribute to a
significant number of hospitalisations and some deaths in NZ, so even small increases
in risk from crowding are likely to represent a significant burden of disease. There
were very few high quality studies of several important infectious diseases, notably
skin infections and rheumatic fever, so it is not possible to make conclusions about the
impact of household crowding on these diseases. These areas would benefit from
further research.
Findings of this study are particularly relevant to child health. Several of the diseases
covered have particularly high rates in children, notably bronchiolitis, pneumonia,
gastroenteritis and meningococcal disease. New Zealand children and young people
have higher levels of exposure to household crowding than older age groups. Rates of
serious infectious diseases have increased over the last 20 years in NZ for children (as
they have across all age groups).
The burden of disease analysis showed that about 10% of hospital admissions a year
can be attributed to household crowding for the nine categories of infectious disease
included in the analysis. It also showed how the large ethnic difference in exposure to
household crowding are contributing to the markedly higher rates of serious infectious
diseases seen in Māori and Pacific populations.
Findings from this systematic review support the need to identify policies,
programmes and interventions to reduce household crowding, particularly for Māori
and Pacific households in NZ and households with children. Evaluation of
interventions which aim to reduce household crowding would provide a significant
contribution to the research base in this area.

72
7. References
1. Baker MG, Telfar Barnard L, Kvalsvig A, et al. Increasing incidence of serious
infectious diseases and inequalities in New Zealand: a national epidemiological study.
Lancet 2012;379:1112-9.
2. Das D, Baker M, Calder L. Tuberculosis epidemiology in New Zealand: 1995-
2004.[see comment]. New Zealand Medical Journal 2006;119:U2249.
3. Jaine R, Baker M, Venugopal K. Epidemiology of acute rheumatic fever in
New Zealand 1996–2005. Journal of Paediatrics and Child Health 2008;44:564-71.
4. O'Hallahan J, McNicholas A, Galloway Y, O'Leary E, Roseveare C.
Delivering a safe and effective strain-specific vaccine to control an epidemic of group
B meningococcal disease. N Z Med J 2009;122:48-59.
5. Byrnes CA, Trenholme A. Respiratory infections in Tamariki (children) and
Taitamariki (young people) Māori, New Zealand. Journal of Paediatrics and Child
Health 2010;46:521-6.
6. O’Sullivan CE, Baker MG, Venugopal K. Increasing hospitalisations for
serious skin infections in New Zealand children, 1990-2007. Epidemiol Infect
2010;Dec 15:1-11 [Epub].
7. Baker MG, Wilson N, Huang QS, et al. Pandemic influenza A(H1N1)v in New
Zealand: the experience from April to August 2009. Euro Surveillance: Bulletin
Europeen sur les Maladies Transmissibles = European Communicable Disease
Bulletin 2009;14.
8. Baker MG, Telfar Barnard L, Zhang J, et al. Close-contact infectious diseases
in New Zealand: Trends and ethnic inequalities in hospitalisations, 1989 to 2008 (2nd
edition). Wellington: He Kainga Oranga / Housing and Health Research Programme,
University of Otago, Wellington; 2010.
9. Statistics New Zealand. What is the extent of crowding in New Zealand?
Wellington: Statistics New Zealand; 2003.
10. Baker MG, Goodyear R, Telfar Barnard L, Howden-Chapman P. The
distribution of household crowding in New Zealand: An analysis based on 1991 to
2006 Census data. Wellington: He Kainga Oranga / Housing and Health Research
Programme; (Unpublished).
11. Human Rights Commission. Human Rights in New Zealand Today, Ngā Tika
Tangata O Te Motu: New Zealand Action Plan for Human Rights — Mana ki te
Tangata: Chapter 13. 2004.
12. Expert Advisory Group on Solutions to Child Poverty. Working Paper no. 18:
Housing Policy Recommendation to Address Child Poverty. 2012.
13. Gray A. Definitions of Crowding and the Effects of Crowding on Health: A
Literature Review. Wellington: Ministry of Social Policy; 2001 2001.
14. Baker M, Goodyear R, Howden-Chapman P. Household crowding and health.
What is the extent of crowding in New Zealand? An analysis of crowding in New
Zealand household 1986-2001. Wellington: Statistics New Zealand; 2003.
15. Baker M, McNicholas A, Garrett N, et al. Household crowding a major risk
factor for epidemic meningococcal disease in Auckland children. Pediatric Infectious
Disease Journal 2000;19:983-90.

73
16. Baker M, Das D, Venugopal K, Howden-Chapman P. Tuberculosis associated
with household crowding in a developed country. J Epidemiol Community Health
2008;62:715-21.
17. Jaine R, Baker M, Venugopal K. Acute rheumatic fever associated with
household crowding in a developed country. The Pediatric Infectious Disease Journal
2011;30:315.
18. Grant CC, Emery D, Milne T, et al. Risk factors for community-acquired
pneumonia in pre-school-aged children. Journal of Paediatrics & Child Health
2012;48:402-12.
19. Ministry of Social Development. The Social Report 2010. Wellington:
Ministry of Social Development; 2010.
20. Liberati A, Altman DG, Tetzlaff J, et al. The PRISMA statement for reporting
systematic reviews and meta-analyses of studies that evaluate healthcare interventions:
explanation and elaboration. BMJ 2009;339:b2700.
21. Higgins JPT, Green S. Cochrane handbook for systematic reviews of
interventions: Wiley Online Library; 2011.
22. Higgins JP, Deeks JJ. Chapter 7: Selecting studies and collecting data. In:
Higgins JP, Deeks JJ, eds. Cochrane Handbook 501: John Wiley & Sons, Ltd; 2008.
23. Moher D, Liberati A, Tetzlaff J, Altman DG. Preferred reporting items for
systematic reviews and meta-analyses: the PRISMA statement. PLoS Medicine
2009;6:e1000097.
24. Bailie RS, Stevens M, McDonald EL. The impact of housing improvement and
socio-environmental factors on common childhood illnesses: a cohort study in
Indigenous Australian communities. Journal of Epidemiology and Community Health
2012;66:821-31.
25. Moher D, Pham B, Lawson M, Klassen T. The inclusion of reports of
randomised trials published in languages other than English in systematic reviews:
Core Research; 2003.
26. Alexander CS, Zinzeleta EM, Mackenzie EJ, Vernon A, Markowitz RK. Acute
gastrointestinal illness and child care arrangements. American Journal of
Epidemiology 1990;131:124-31.
27. Baker D, Taylor H, Henderson J. Inequality in infant morbidity: Causes and
consequences in England in the 1990s. Journal of Epidemiology and Community
Health 1998;52:451-8.
28. Von Schirnding Y, Yach D, Blignault R, Mathews C. Environmental
determinants of acute respiratory symptoms and diarrhoea in young coloured children
living in urban and peri-urban areas of South Africa. South African Medical Journal
1991;79:457-61.
29. Emond AM, Howat P, Evans JA, Hunt L. The effects of housing on the health
of preterm infants. Paediatric and Perinatal Epidemiology 1997;11:228-39.
30. Seidman JC, Anitha P, Kanungo R, Bourgeois AL, Coles CL. Risk factors for
antibiotic-resistant E. coli in children in a rural area. Epidemiology and Infection
2009;137:879-88.
31. Jones JL, Kruszon-Moran D, Wilson M, McQuillan G, Navin T, McAuley JB.
Toxoplasma gondii infection in the United States: seroprevalence and risk factors.
American Journal of Epidemiology 2001;154:357-65.
32. Hosoglu S, Celen MK, Geyik MF, et al. Risk factors for typhoid fever among
adult patients in Diyarbakir, Turkey. Epidemiology & Infection 2006;134:612-6.

74
33. Victora CG, Smith PG, Vaughan JP, et al. Water supply, sanitation and
housing in relation to the risk of infant mortality from diarrhoea. International Journal
of Epidemiology 1988;17:651-4.
34. Aguemon BD, Struelens MJ, Massougbodji A, Ouendo EM. Prevalence and
risk-factors for Helicobacter pylori infection in urban and rural Beninese populations.
Clinical Microbiology & Infection 2005;11:611-7.
35. Ahmed KS, Khan AA, Ahmed I, et al. Impact of household hygiene and water
source on the prevalence and transmission of Helicobacter pylori: a South Indian
perspective. Singapore Medical Journal 2007;48:543-9.
36. Breuer T, Sudhop T, Hoch J, Sauerbruch T, Malfertheiner P. Prevalence of and
risk factors for Helicobacter pylori infection in the western part of Germany. European
Journal of Gastroenterology & Hepatology 1996;8:47-52.
37. Broutet N, Sarasqueta AM, Sakarovitch C, Cantet F, Lethuaire D, Mégraud F.
Helicobacter pylori infection in patients consulting gastroenterologists in France:
Prevalence is linked to gender and region of residence. European Journal of
Gastroenterology and Hepatology 2001;13:677-84.
38. Bures J, Kopacova M, Koupil I, et al. Epidemiology of Helicobacter pylori
infection in the Czech Republic. Helicobacter 2006;11:56-65.
39. Choe YH, Hwang TS, Hong YC. Higher seroprevalence of Helicobacter pylori
infection in Korean adolescent athletes compared to age- and sex-matched non-
athletes. Journal of Gastroenterology & Hepatology 2002;17:131-4.
40. Chong SKF, Lou Q, Zollinger TW, et al. The seroprevalence of Helicobacter
pylori in a referral population of children in the United States. American Journal of
Gastroenterology 2003;98:2162-8.
41. Everhart JE, Kruszon-Moran D, Perez-Perez GI, Tralka TS, McQuillan G.
Seroprevalence and ethnic differences in Helicobacter pylori infection among adults in
the United States. Journal of Infectious Diseases 2000;181:1359-63.
42. Ghosh P, Bodhankar SL. Determination of risk factors and transmission
pathways of Helicobacter pylori in asymptomatic subjects in Western India using
polymerase chain reaction. Asian Pacific Journal of Tropical Disease 2012;2:12-7.
43. Goodman KJ, O'Rourke K, Day RS, et al. Helicobacter pylori infection in
pregnant women from a US Mexico border population. Journal of Immigrant Health
2003;5:99-107.
44. Malaty HM, Graham DY. Importance of childhood socioeconomic status on
the current prevalence of Helicobacter pylori infection. Gut 1994;35:742-5.
45. Malaty HM, Paykov V, Bykova O, et al. Helicobacter pylori and
socioeconomic factors in Russia. Helicobacter 1996;1:82-7.
46. Malaty HM, Logan ND, Graham DY, Ramchatesingh JE. Helicobacter pylori
infection in preschool and school-aged minority children: effect of socioeconomic
indicators and breast-feeding practices. Clinical Infectious Diseases 2001;32:1387-92.
47. McCallion WA, Murray LJ, Bailie AG, Dalzell AM, O'Reilly DPJ, Bamford
KB. Helicobacter pylori infection in children: Relation with current household living
conditions. Gut 1996;39:18-21.
48. Mendall MA, Goggin PM, Molineaux N, et al. Childhood living conditions
and Helicobacter pylori seropositivity in adult life. The Lancet 1992;339:896-7.
49. Nurgalieva ZZ, Malaty HM, Graham DY, et al. Helicobacter pylori infection in
Kazakhstan: effect of water source and household hygiene. American Journal of
Tropical Medicine & Hygiene 2002;67:201-6.

75
50. O'Rourke K, Goodman KJ, Grazioplene M, Redlinger T, Day RS.
Determinants of geographic variation in Helicobacter pylori infection among children
on the US-Mexico border. American Journal of Epidemiology 2003;158:816-24.
51. Özen A, Ertem D, Pehlivanoglu E. Natural history and symptomatology of
Helicobacter pylori in childhood and factors determining the epidemiology of
infection. Journal of Pediatric Gastroenterology and Nutrition 2006;42:398-404.
52. Patel P, Mendall MA, Khulusi S, Northfield TC, Strachan DP. Helicobacter
pylori infection in childhood: risk factors and effect on growth. BMJ 1994;309:1119-
23.
53. Rodrigues MN, Queiroz DMM, Bezerra Filho JG, Pontes LK, Rodrigues RT,
Braga LLBC. Prevalence of Helicobacter pylori infection in children from an urban
community in north-east Brazil and risk factor for infection. European Journal of
Gastroenterology and Hepatology 2004;16:201-5.
54. Salomaa-Räsänen A, Kosunen TU, Aromaa ARJ, Knekt P, Sarna S, Rautelin
H. A "screen-and-treat" approach for helicobacter pylori infection: A population-based
study in Vammala, Finland. Helicobacter 2010;15:28-37.
55. Staat MA, Kruszon-Moran D, McQuillan GM, Kaslow RA. A population-
based serologic survey of Helicobacter pylori infection in children and adolescents in
the United States. Journal of Infectious Diseases 1996;174:1120-3.
56. Stone MA, Taub N, Barnett DB, Mayberry JF. Increased risk of infection with
Helicobacter pylori in spouses of infected subjects: observations in a general
population sample from the UK. Hepato-Gastroenterology 2000;47:433-6.
57. Torres J, Leal-Herrera Y, Perez-Perez G, et al. A community-based
seroepidemiologic study of Helicobacter pylori infection in Mexico. Journal of
Infectious Diseases 1998;178:1089-94.
58. Webb PM, Knight T, Greaves S, et al. Relation between infection with
Helicobacter pylori and living conditions in childhood: evidence for person to person
transmission in early life. BMJ 1994;308:750-3.
59. Wizla-Derambure N, Michaud L, Ategbo S, et al. Familial and community
environmental risk factors for Helicobacter pylori infection in children and
adolescents. Journal of Pediatric Gastroenterology & Nutrition 2001;33:58-63.
60. Almeida LM, Werneck GL, Cairncross S, Coeli CM, Costa MC, Coletty PE.
The epidemiology of hepatitis A in Rio de Janeiro: environmental and domestic risk
factors. Epidemiology & Infection 2001;127:327-33.
61. Barros H, Oliveira F, Miranda H. A survey on hepatitis A in Portuguese
children and adolescents. Journal of Viral Hepatitis 1999;6:249-53.
62. Gomes MAC, Ferreira AdSP, da Silva AAM, de Souza ER. Hepatitis A:
seroprevalence and associated factors among schoolchildren of Sao Luis (MA), Brazil.
Revista Brasileira de Epidemiologia 2011;14:548-55.
63. Green MS, Tsur S, Slepon R. Sociodemographic factors and the declining
prevalence of anti-hepatitis A antibodies in young adults in Israel: implications for the
new hepatitis A vaccines. International Journal of Epidemiology 1992;21:136-41.
64. Livni G, Plotkin S, Yuhas Y, et al. Seroepidemiology of hepatitis A antibodies
among children's hospital staff. Pediatric Infectious Disease Journal 2002;21:618-22.
65. Markus JR, Cruz CR, Maluf EMCP, Tahan TT, Hoffmann MM.
Seroprevalence of hepatitis A in children and adolescents. Jornal de Pediatria
2011;87:419-24.
66. Redlinger T, O'Rourke K, VanDerslice J. Hepatitis A among schoolchildren in
a US-Mexico border community. American Journal of Public Health 1997;87:1715-7.

76
67. Silva RR, da Silva CAM, de Jesus Pereira CA, et al. Association between
nutritional status, environmental and socio-economic factors and Giardia lamblia
infections among children aged 6-71 months in Brazil. Transactions of the Royal
Society of Tropical Medicine and Hygiene 2009;103:512-9.
68. Carneiro FF, Cifuentes E, Tellez-Rojo MM, Romieu I. The risk of Ascaris
lumbricoides infection in children as an environmental health indicator to guide
preventive activities in Caparaó and Alto Caparaó, Brazil. Bulletin of the World
Health Organization 2002;80:40-6.
69. Cazorla D, Acosta M, Garcia E, Garvett M, Ruiz A. Enterobius vermicularis
infection in preschool and schoolchildren of six rural communities from a semiarid
region of Venezuela: a clinical and epidemiological study. Helminthologia
2006;43:81-5.
70. Pullan RL, Bethony JM, Geiger SM, et al. Human helminth co-infection:
analysis of spatial patterns and risk factors in a Brazilian community. PLoS Neglected
Tropical Diseases [electronic resource] 2008;2:e352.
71. Anderson LJ, Parker RA, Strikas RA, et al. Day-care center attendance and
hospitalization for lower respiratory tract illness. Pediatrics 1988;82:300-8.
72. Cardoso MRA, Cousens SN, de Góes Siqueira LF, Alves FM, D'Angelo LAV.
Crowding: risk factor or protective factor for lower respiratory disease in young
children? BMC Public Health 2004;4:19.
73. Prietsch SOM, Fischer GB, Cesar JA, et al. Acute lower respiratory illness in
under-five children in Rio Grande, Rio Grande do Sul State, Brazil: Prevalence and
risk factors. Cadernos de Saude Publica 2008;24:1429-38.
74. Koch A, Mølbak K, Homøe P, et al. Risk factors for acute respiratory tract
infections in young Greenlandic children. American Journal of Epidemiology
2003;158:374-84.
75. Kristensen IA, Olsen J. Determinants of acute respiratory infections in Soweto-
-a population-based birth cohort. South African Medical Journal Suid-Afrikaanse
Tydskrif Vir Geneeskunde 2006;96:633-40.
76. Okiro EA, Ngama M, Bett A, Cane PA, Medley GF, Nokes DJ. Factors
associated with increased risk of progression to respiratory syncytial virus-associated
pneumonia in young Kenyan children. Tropical Medicine & International Health
2008;13:914-26.
77. Parker L, Lamont DW, Wright CM, Cohen MA, Alberti KG, Craft AW.
Mothering skills and health in infancy: the Thousand Families study revisited. The
Lancet 1999;353:1151-2.
78. Victora CG, Smith PG, Barros FC, Vaughan JP, Fuchs SC. Risk factors for
deaths due to respiratory infections among Brazilian infants. International Journal of
Epidemiology 1989;18:918-25.
79. Colosia AD, Masaquel A, Hall CB, Barrett AM, Mahadevia PJ, Yogev R.
Residential crowding and severe respiratory syncytial virus disease among infants and
young children: A systematic literature review. BMC Infect Dis 2012;12:95.
80. Bulkow LR, Singleton RJ, Karron RA, Harrison LH, Alaska RSVSG. Risk
factors for severe respiratory syncytial virus infection among Alaska native children.
Pediatrics 2002;109:210-6.
81. Nielsen HE, Siersma V, Andersen S, et al. Respiratory syncytial virus infection
- Risk factors for hospital admission: A case-control study. Acta Paediatrica,
International Journal of Paediatrics 2003;92:1314-21.

77
82. Holberg CJ, Wright AL, Martinez FD, Ray CG, Taussig LM, Lebowitz MD.
Risk factors for respiratory syncytial virus-associated lower respiratory illnesses in the
first year of life. American Journal of Epidemiology 1991;133:1135-51.
83. Dsouza RM. Housing and environmental factors and their effects on the health
of children in the slums of Karachi, Pakistan. Journal of Biosocial Science
1997;29:271-81.
84. Zhang JJ, Hu W, Wei F, Wu G, Korn LR, Chapman RS. Children's respiratory
morbidity prevalence in relation to air pollution in four Chinese cities. Environmental
Health Perspectives 2002;110:961-7.
85. Goren A, Hellmann S, Gabbay Y, Brenner S. Respiratory problems associated
with exposure to airborne particles in the community. Archives of Environmental
Health 1999;54:165-71.
86. Deutch S, Labouriau R, Schonheyeder HC, Ostergaard L, Norgard B, Sorensen
HT. Crowding as a risk factor of meningococcal disease in Danish preschool children:
a nationwide population-based case-control study. Scandinavian Journal of Infectious
Diseases 2004;36:20-3.
87. Kriz P, Bobak M, Kriz B. Parental smoking, socioeconomic factors, and risk of
invasive meningococcal disease in children: a population based case-control study.
Archives of Disease in Childhood 2000;83:117-21.
88. Moodley J, Coetzee N, Hussey G. Risk factors for meningococcal disease in
Cape Town. SAMJ South African Medical Journal 1999;89:56-9.
89. Robinson P, Taylor K, Nolan T. Risk-factors for meningococcal disease in
Victoria, Australia, in 1997. Epidemiology and Infection 2001;127:261-8.
90. Arnold C, Makintube S, Istre GR. Day care attendance and other risk factors
for invasive Haemophilus influenzae type b disease. American Journal of
Epidemiology 1993;138:333-40.
91. Clements DA, Weigle KA, Gilbert GL. A case-control study examining risk
factors for invasive Haemophilus influenzae type b disease in Victoria, Australia
1988-90. Journal of Paediatrics & Child Health 1995;31:513-8.
92. Cochi SL, Fleming DW, Hightower AW. Primary invasive Haemophilus
influenzae type b disease: A population-based assessment of risk factors. Journal of
Pediatrics 1986;108:887-96.
93. Jafari HS, Adams WG, Robinson KA, Plikaytis BD, Wenger JD. Efficacy of
Haemophilus influenzae type b conjugate vaccines and persistence of disease in
disadvantaged populations. The Haemophilus Influenzae Study Group. American
Journal of Public Health 1999;89:364-8.
94. Zielinski A, Kwon CB, Tomaszunas-Blaszczyk J, Magdzik W, Bennett JV.
Risk of Haemophilus influenzae type b meningitis in Polish children varies directly
with number of siblings: possible implications for vaccination strategies. European
Journal of Epidemiology 2003;18:917-22.
95. Sekhar S, Chakraborti A, Kumar R. Haemophilus influenzae colonization and
its risk factors in children aged <2 years in northern India. Epidemiology & Infection
2009;137:156-60.
96. Coker R, McKee M, Atun R, et al. Risk factors for pulmonary tuberculosis in
Russia: case-control study. BMJ 2006;332:85-7.
97. Corbett EL, Bandason T, Cheung YB, et al. Prevalent infectious tuberculosis in
Harare, Zimbabwe: burden, risk factors and implications for control. International
Journal of Tuberculosis & Lung Disease 2009;13:1231-7.
98. García-Sancho MC, García-García MDL, Báez-Saldaña R, et al. Indoor
pollution as an occupational risk factor for tuberculosis among women: A population-

78
based, gender oriented, case-control study in Southern Mexico. Revista de
Investigacion Clinica 2009;61:392-8.
99. Hill PC, Jackson-Sillah D, Donkor SA, Otu J, Adegbola RA, Lienhardt C. Risk
factors for pulmonary tuberculosis: a clinic-based case control study in The Gambia.
BMC Public Health 2006;6:156.
100. Shetty N, Shemko M, Vaz M, Dsouza G. An epidemiological evaluation of
risk factors for tuberculosis in South India: a matched case control study. The
International Journal of Tuberculosis and Lung Disease 2006;10:80-6.
101. Tekkel M, Rahu M, Loit HM, Baburin A. Risk factors for pulmonary
tuberculosis in Estonia. Int J Tuberc Lung Dis 2002;6:887-94.
102. Tipayamongkholgul M, Podhipak A, Chearskul S, Sunakorn P. Factors
associated with the development of tuberculosis in BCG immunized children.
Southeast Asian Journal of Tropical Medicine & Public Health 2005;36:145-50.
103. Goldhaber-Fiebert JD, Jeon CY, Cohen T, Murray MB. Diabetes mellitus and
tuberculosis in countries with high tuberculosis burdens: individual risks and social
determinants. International Journal of Epidemiology 2011;40:417-28.
104. Mishra VK, Retherford RD, Smith KR. Biomass cooking fuels and prevalence
of tuberculosis in India. International Journal of Infectious Diseases 1999;3:119-29.
105. Elliott AM, Hayes RJ, Halwiindi B, et al. The impact of HIV on infectiousness
of pulmonary tuberculosis: a community study in Zambia. AIDS 1993;7:981-7.
106. Thilothammal N, Krishnamurthy PV, Runyan DK, Banu K. Does BCG vaccine
prevent tuberculous meningitis? Archives of Disease in Childhood 1996;74:144-7.
107. Homøe P, Christensen RB, Bretlau P. Acute otitis media and sociomedical risk
factors among unselected children in Greenland. International Journal of Pediatric
Otorhinolaryngology 1999;49:37-52.
108. Strachan DP. Impedance tympanometry and the home environment in seven-
year-old children. Journal of Laryngology & Otology 1990;104:4-8.
109. Kim CS, Jung HW, Yoo KY. Prevalence and risk factors of chronic otitis
media in Korea: results of a nation-wide survey. Acta Oto-Laryngologica
1993;113:369-75.
110. Forshey BM, Laguna-Torres VA, Vilcarromero S, et al. Epidemiology of
influenza-like illness in the Amazon Basin of Peru, 2008-2009. Influenza other respi
2010;4:235-43.
111. Gordon A, Ortega O, Kuan G, et al. Prevalence and seasonality of influenza-
like illness in children, Nicaragua, 2005-2007. Emerging Infectious Diseases
2009;15:408-14.
112. Dayan GH, Panero MS, Debbag R, et al. Varicella seroprevalence and
molecular epidemiology of varicella-zoster virus in Argentina, 2002. Journal of
Clinical Microbiology 2004;42:5698-704.
113. Silfverdal SA, Ehlin A, Montgomery SM. Breast-feeding and a subsequent
diagnosis of measles. Acta Paediatrica 2009;98:715-9.
114. New Zealand Guidelines Group. RapidE: Rheumatic Fever - A systematic
review of the literature on health literacy, overcrowding and rheumatic fever2011.
115. Kerdemelidis M, Lennon DR, Arroll B, Peat B, Jarman J. The primary
prevention of rheumatic fever. Journal of Paediatrics & Child Health 2010;46:534-48.
116. Oli K, Porteous J. Prevalence of rheumatic heart disease among school
children in Addis Ababa. East African Medical Journal 1999;76:601-5.
117. Factor SH, Levine OS, Harrison LH, et al. Risk factors for pediatric invasive
group A streptococcal disease. Emerg Infect Dis 2005;11:1062-6.

79
118. Vlajinac H, Adanja B, Marinkovic J, Jarebinski M. Influence of socio-
economic and other factors on rheumatic fever occurrence. European Journal of
Epidemiology 1991;7:702-4.
119. Coggon D, Barker DJ, Inskip H, Wield G. Housing in early life and later
mortality. Journal of Epidemiology & Community Health 1993;47:345-8.
120. Katz J, West Jr KP, Khatry SK, et al. Prevalence and risk factors for trachoma
in Sarlahi district, Nepal. British Journal of Ophthalmology 1996;80:1037-41.
121. Sahlu T, Larson C. The prevalence and environmental risk factors for moderate
and severe trachoma in southern Ethiopia. Journal of Tropical Medicine & Hygiene
1992;95:36-41.
122. Mahmud S, Pappas G, Hadden WC. Prevalence of head lice and hygiene
practices among women over twelve years of age in Sindh, Balochistan, and North
West Frontier Province: National Health Survey of Pakistan, 1990-1994. Parasites &
Vectors [Electronic Resource] 2011;4:11.
123. Anderson LA, Li Y, Graubard BI, et al. Human herpesvirus 8 seroprevalence
among children and adolescents in the United States. Pediatric Infectious Disease
Journal 2008;27:661-4.
124. Crowcroft NS, Vyse A, Brown DWG, Strachan DP. Epidemiology of Epstein-
Barr virus infection in pre-adolescent children: Application of a new salivary method
in Edinburgh, Scotland. Journal of Epidemiology and Community Health
1998;52:101-4.
125. Berg AT, Shapiro ED, Capobianco LA. Group day care and the risk of serious
infectious illnesses. American Journal of Epidemiology 1991;133:154-63.
126. Booth A, Cowell J. Crowding and health. Journal of Health & Social Behavior
1976;17:204-20.
127. Lennon D, Martin D, Wong E, Taylor LR. Longitudinal study of
poststreptococcal disease in Auckland; rheumatic fever, glomerulonephritis,
epidemiology and M typing 1981-86. N Z Med J 1988;101:396-8.
128. Lennon M. Housing provision in New Zealand In: Howden-Chapman P,
Carroll P, eds. Housing and health: research, policy and innovation. Wellington Steele
Roberts 2001:70-3.
129. Bullen C, Kearns RA, Clinton J, Laing P, Mahoney F, McDuff I. Bringing
health home: householder and provider perspectives on the healthy housing
programme in Auckland, New Zealand. Social Science & Medicine 2008;66:1185-96.
130. Jackson G, Thornley S, Woolston J, Papa D, Bernacchi A, Moore T. Reduced
acute hospitalisation with the healthy housing programme. J Epidemiol Community
Health 2011.
131. Blakely T, Baker MG, Howden-Chapman P. Does housing policy influence
health? Journal of Epidemiology & Community Health 2011.
132. Baker M, Zhang J, Keall M, Howden-Chapman P. Health Impacts of the
Healthy Housing Programme on Housing New Zealand Tenants: 2004-2007.
Wellington: He Kainga Oranga/ Housing and Health Research Programme, University
of Otago 2011.
133. Pruss-Ustun A, Mathers C, Corvalan C, Woodward A. Introducation and
methods: assessing the environmental burden of disease at national and local levels.
Geneva: World Health Organization; 2003.
134. Baker MG, Venugopal K, Howden-Chapman P. Household crowding and
tuberculosis. In: Braubach M, Jacobs DE, Ormandy D, eds. Environmental burden of
disease of inadequate housing: A method guide to the quantification of health effects

80
of selected housing risks in the WHO European Region Bonn World Health
Organization. 2011.
135. Davies HTO, Crombie IK, Tavakoli M. When can odds ratios mislead? BMJ
1998;316:989-91.
136. Baker MG, Goodyear R, Barnard LT, Howden-Chapman P. The distribution of
household crowding in New Zealand: An analysis based on 1991 to 2006 Census data.
Wellington: University of Otago; 2012.
137. Giesecke J. Modern infectious disease epidemiology. London: Arnold; 2002.
138. Baker M, Keall M, Howden-Chapman P. Home is where the heart is - most of
the time N Z Med J 2007;120:U2769.
139. Howden-Chapman P, Matheson A, Crane J, et al. Effect of insulating existing
houses on health inequality: cluster randomised study in the community. BMJ
2007;334:460.
140. Thomson H, Petticrew M, Morrison D. Health effects of housing improvement:
systematic review of intervention studies. BMJ 2001;323:187-90.
141. Thomson H, Thomas S, Sellstrom E, Petticrew M. The health impacts of
housing improvement: a systematic review of intervention studies from 1887 to 2007.
American Journal of Public Health 2009;99 Suppl 3:S681-92.
142. Ministry of Social Development. The social report 2005: Indicators of social
wellbeing in New Zealand. Wellington: Ministry of Social Development; 2005.
143. DTZ New Zealand. Changes in the Structure of the New Zealand Housing
Market. Wellington: Centre for Housing Research Aotearoa New Zealand; 2004.
144. Schrader B. We call it home: A history of state housing in New Zealand.
Auckland: Reed Publishing; 2005.
145. Widmer S. Household crowding in New Zealand in the 1990s: Was it driven
by housing policy? Wellington: Otago; 2006.
146. Productivity Commission. Housing affordability inquiry. 2012.
147. Harris R, Tobias M, Jeffreys M, et al. Racism and health: the relationship
between experience of racial discrimination and health in New Zealand. Social
Science & Medicine 2006;63:1428-41.
148. MacDonald J. Racism and rental accommodation. Auckland Social
Development and Research Trust; 1986.
149. Jackson G, Thornley S, Woolston J, Papa D, Bernacchi A, Moore T. Reduced
acute hospitalisation with the healthy housing programme. J Epidemiol Community
Health 2011;65:588-93.
150. Goux D, Maurin E. The effect of overcrowded housing on children's
performance at school. Journal of Public Economics 2005;89:797-819.
151. Evans GW. The built environment and mental health. Journal of Urban Health
2003;80:536-55.