inferring physical processes from seafloor bedforms around
TRANSCRIPT

Inferring physical processes from seafloor bedforms around Brothers and Rumble III volcanoes in the Kermadec Arc
Toby Mcleod
University of Washington
School of Oceanography Box 357840
Seattle, WA 98195-7940
Email: [email protected]
Toby Mcleod Current Inference from Sediment Ripples Ocean 444
2
Acknowledgements
I would like to thank my professors and peers for their collaborative efforts to help
accomplish my studies as well as the crew and researchers on the Thompson Research
Vessel who were essential for the collection of data and also Andrea Ogston for
additional help and analysis of the data.

Toby Mcleod Current Inference from Sediment Ripples Ocean 444
3
Abstract
The objective for this project is to determine the contribution of physical
processes, such as turbidity currents and bottom currents, to the transport and distribution
of sediments around the underwater volcanoes known as Brothers and Rumble III of the
Kermadec Arc off the coast of New Zealand. This project, conducted during March of
2009, tests the hypothesis that currents from the East Cape Eddy (ECE) produce the most
significant contribution to sediment transport in this area, based on previous studies
which indicated a consistency between substrate winnowing and relatively shallow water
movement of the ECE (Wright, 2001). Research includes analyzing seafloor bedforms
using a towed camera system and determining the magnitude, direction, and type of
bottom stresses based on the shape of sediment waves and the size of the sediment
particles. This data was compared to direct local current measurements to evaluate trends
in water movement along different timescales. Utilizing data from a satellite altimeter
will examine broad-scale current information from maps of sea surface height.
Sedimentology inference of ocean currents allows for an interpretation about the history
of volcanic rock. So far, it has been determined that unidirectional flows occur in about
55% of the sediment ripple photographs at Brothers and 70% at Rumble III. The other
flow patterns observed at both volcanoes indicate the presence of internal waves.
Correlations between multiple methods of current analysis further indicate that
unidirectional currents are more significant to sediment transport than oscillatory
currents, but longer-term trends in currents are likely occurring.

Toby Mcleod Current Inference from Sediment Ripples Ocean 444
4
Non-Technical Summary
This project was designed to understand the way ocean currents move along the
seafloor by studying their effect on the sediment of underwater volcanoes which includes
mud, silt, sand, and ash. If the dominant physical process controlling the distribution of
sediment grains can be determined, this may reveal useful information in interpreting
volcanic rock deposits in addition to increasing the general knowledge of deep ocean
currents and how other small particles within the water column, such as some larval
species, can be affected by the physical environment. During March of 2009 aboard the
R/V Thompson, sediment ripples around Rumble III and Brothers volcanoes of the
Kermadec Arc were studied. Data was collected at each volcano for 2 and 4 days
respectively. If the water is flowing in one direction, the sediment will create a pattern of
asymmetrical ripples along the seafloor. However, if the water moves back and forth
along its path, the sediment will settle in a symmetrical pattern. The intensity of wave
motion has been calculated based on features such as the distance between ripples and the
size of particles. Photographs show that both patterns exist at each of the volcanoes of
interest. Since there were more images of asymmetrical ripples at both sites it is likely
that unidirectional currents are a greater source of particle movement than oscillatory
flows. Currents were also mapped by satellites at the surface and by an ADCP to a depth
of about 700m for comparison to the information yielded from the sediments.
Correlations between these methods of current analysis further indicate that
unidirectional water movement is more significant than wave-like patterns for sediment
transport, but longer-term trends in currents are likely occurring.

Toby Mcleod Current Inference from Sediment Ripples Ocean 444
5
The Kermadec Arc is the largest submarine arc in the world where oceanic crust
of the Pacific plate is subducting under continental crust of the Australian plate resulting
in relatively unique chemical and geological features (de Ronde et al., 2007). It consists
of many underwater volcanoes and hydrothermal vents between about 200m and 1700m.
Off of the East Cape region and South Westland, the sediment supply to the New Zealand
coast is among the highest rates in the world (Bradford-Grieve et al., 2006).
Studying the movement of water masses provides information valuable to
anyone interested in the relationships between those features and where they are located.
Sediment ripples may contain a record of water movements that provide a different
perspective from traditional current measurements like ADCP, the geostrophic method,
and satellite altimetry. Such information has applications in relating surface current
patterns to deep current movements, as well as evaluating the relative accuracy of various
deep current measurement techniques; knowing how currents affect sediment distribution
helps geologists interpret the volcanic rock record. This research project focuses on these
aspects. In addition, ecological impacts may result from correlating larval dispersal to the
same sediment carrying currents as well as distribution of any of the various species
sensitive to sediment grain size; this study does not investigate the biological aspects
applicable from this project, but others could use the work for future studies in this area
of research.
Possible controls of sediment transport include tides, surface currents that
induce deep currents, localized deep currents, and internal waves. Tides have been shown
to contribute significantly to the movement of water around New Zealand. They are

Toby Mcleod Current Inference from Sediment Ripples Ocean 444
6
largely dominated by moon cycles and tend to form a trapped Kelvin wave with a 360
degree rotation around the islands in response to the forcing of amphidromes (Walters et
al., 2001). It is also possible that localized currents around the volcanoes, which are
generated by tidal fluxes, dominate sediment transport (Lavelle 2006). There exist
currents that depend on the seafloor topography around New Zealand, rather than with
tides or surface waves, with definite periods (Heath 1985). Other studies exploring
circulation patterns suggest that eddies affect current flow around Brothers volcano and
that internal tides cause tidal current differences contributing to general flow patterns
through the water column (Lavelle et al., 2008).
Sedimentology has been used to infer current movements from seafloor
bedforms in the Kermadec Arc assuming unidirectional current flow (Wright 2001).
Wright took sediment samples along tow-cam track lines, sorted the grain sizes and
calculated the magnitude and vertical profile of currents around Kermadec volcanoes,
particularly around Rumble IV where the samples could be correlated with the
photography. The threshold of sediment movement can be calculated if the sediment size
and density, as well as the fluid density, shear stress, and viscosity are known (Miller et
al., 1977). Results in Wright’s experiment indicated a high correlation between East Cape
Eddy current flow and seafloor bedform data.
Following up on areas where similar research has been conducted and a basic
idea of the sediments and their related currents has been established, research for this
study has been done at the Brothers volcano and Rumble III volcanoes of the Kermadec
Arc in New Zealand. Comparing bedforms to a broader array of data on currents such as
ADCP information and satellite altimetry of surface currents show different timescales

Toby Mcleod Current Inference from Sediment Ripples Ocean 444
7
and depths for recording currents. This research is important for its applications in
developing geological, physical, biological knowledge around subduction zones and
underwater volcanoes. Inferring currents from sediment data reveals information about
the history of post-eruptive volcanic processes on a timescale much longer than direct
current measurements. Comparing various methods of evaluating currents provides
insight to various timescales of current movement and their affects on sediment transport.
Understanding how physical processes influence transport of sediment may be applied to
the transport and distribution of larval species in later research.
Methods
This project was conducted along the Kermadec Arc off the coast of New Zealand
aboard the R.V. Thompson during March of 2009. It began with approximately four days
of research at Brothers volcano and proceeded to Rumble III for an additional two days
of study. Data collection consisted of taking photographs of the seafloor substrate from a
towed camera system, dredging for sediment, and continuous measurement of currents
using a 75 kHz hull-mounted ADCP. The TowCam was oriented such that it would face
the same direction that the ship was moving and the direction of currents could be
estimated from the photographs based on the angle of deviation between sediment wave
orientation and TowCam heading. Current velocities were calculated from the sediment
sample data and components obtained from photographs.
Details of analysis are based largely on Wright (2001), who used similar methods
in the same areas for analyzing bedforms. Direction and magnitude can be calculated
Toby Mcleod Current Inference from Sediment Ripples Ocean 444
8
using threshold flow formulas for an assumed unidirectional flow which rely on sediment
and fluid data (Miller et al., 1977).
θ = τ / ( ( ρ s – ρ ) gD) = ρu* 2 / (( ρ s – ρ ) gD) = f (u * D / v) = f ( D / δ ) (1)
Where θ is the entrainment function or dimensionless shear stress, τ is the critical shear
stress, ρ s is the density of the sediment, ρ is the density of seawater which is equal to
1.027g cm-3 at 1500m depth (Wright, 2001), g is the acceleration of gravity which is
979.8cms-2 at 36ºS, D is the sediment grain diameter, u* is the friction velocity, δ is the
thickness of the viscous sublayer given by δ = 10v/u, and v is the fluid viscosity. The
function f is given by a Shields diagram that has been determined experimentally (Miller
et al., 1977). This experimental relationship determines u* which is used to calculate the
bottom stress. Bottom stress can be related to velocity from:
U100= (1/k)u* ln(z/zo) (2)
Where U100 is the velocity measured 100cm above the bed, k is the von Karmon’s
constant, z is the height above the bed, and zo is the roughness length of the bed given by
zo = H2/(2λ). H represents bedform height and λ is the wavelength of the sediment
ripples.
Oscillatory waves can exert a stress on sediment grains in back and forth
directions which yield more symmetrical substrate patterns and smaller ripple heights

Toby Mcleod Current Inference from Sediment Ripples Ocean 444
9
than a unidirectional flow (Komar and Miller, 1975). The threshold of particle movement
for oscillatory flow can be determined by:
ρum2/( ρ s- ρ) gD = 0.30 (do/D)^(1/2) for D < 0.05cm (3a)
ρum2/( ρ s- ρ) gT = f 2 (do/D) for D > 0.05cm (3b)
Where um is the near-bottom velocity, do is the orbital diameter of wave motion, T is the
wave period and the function f 2 has been determined experimentally (Komar and Miller
1973). Data on orbital wave motion was not collected directly, so do is estimated from its
relationship to λ (Komar, 1976).
One sediment sample was collected from a dredge at Brothers volcano after failed
attempts to use a van-Veen grab sampler mounted to and deployed from the camera sled.
Because of field constraints, sediment data for the entirety of this experiment is confined
to this sample. To analyze this sediment, the sample was first dried in an oven for
approximately 24 hours at 60 C. Next, the total sample was weighed and sieved for about
10 minutes with sieve sizes ranging from 0.063 to 1 mm. The sediment found in each
sieve was then weighed and plotted as a histogram (Fig. 1). For velocity calculations, the
mean of the histogram was used to determine the value of D. Sediment density was
determined by measuring the volume and mass of de-ionized water, adding the sediment
sample and measuring the volume and mass again, then dividing the differences in weight
by the differences of volume.
During interpretations of seafloor substrate, careful discrimination was made
between features that are relevant to physical processes and those that are not. Sediment

Toby Mcleod Current Inference from Sediment Ripples Ocean 444
10
ripples can be confused with sediment deformation features unrelated to water currents,
but there are criteria to distinguish these characteristics in the seafloor such as creep folds
and extension faults in sediment waves, among several others (Wynn and Stow, 2002).
To determine which physical process contributes the most to the transport of particles
correlations between sediment ripples to other water movement data were examined in
addition to calculating current flow from the substrate. All of the photographs along a
single TowCam track line where sediment ripples were believed to have been observed
were examined. Photographs were either critically analyzed or discarded if it was
determined that they did not appear to exhibit distinguishable ripple features. Relative
abundance of oscillatory and unidirectional flows was determined by separating
symmetrical ripple images from asymmetrical ripples and finding a ratio between the
number of images that represent areas of those ripple patterns along a track line. Analysis
of the images investigated ripple symmetry, direction of propagation, and wavelength.
Height of asymmetrical sediment ripples could not be determined from photographs
because the TowCam lacked an adequate altimeter and it cannot be calculated without
already knowing the speed of the current that generated it. Symmetrical ripples did not
require H for calculating current speed because do can be calculated from its relationship
to either H or λ (Komar, 1976).
Current analysis from sediment distributions was compared to other forms of
examining water movement which include mapping shallow currents with the shipboard
ADCP and satellite altimeter data (Lavelle et al., 2008). This comparative data was
analyzed with MATLAB for both volcanoes. The comparison itself exists to gauge the
effectiveness of my use of sediment ripples as a means of calculating currents as well as

Toby Mcleod Current Inference from Sediment Ripples Ocean 444
11
providing additional data about how physical processes may be influencing the system.
For example, internal waves may be contributing oscillatory water movement around the
summits of the volcanoes and their possible effects will be considered if I encounter
inconsistencies in the assumption of unidirectional flow (Lavelle et al., 2008).
Results
Satellite altimetry showed a consistent pattern of surface currents during the
days of study. Surface currents were oriented towards the southwest near Brothers and
northwest near Rumble III (Fig. 2). The currents surrounding the volcanoes follow a
general clockwise circulation indicating that the ECE may have been centered on the
volcanoes during the time of study. Towards the southwest of this site is an anti-cyclonic
eddy pattern which could be the actual ECE since that eddy is within close proximity to,
and propagates in the same direction as, previous observations of the ECE (Wright, 2001;
Lavelle et al., 2008). Directions of surface currents from satellite altimetry were
consistent with currents measured with the ADCP between 500 and 600m depth (Figs. 3-
4).
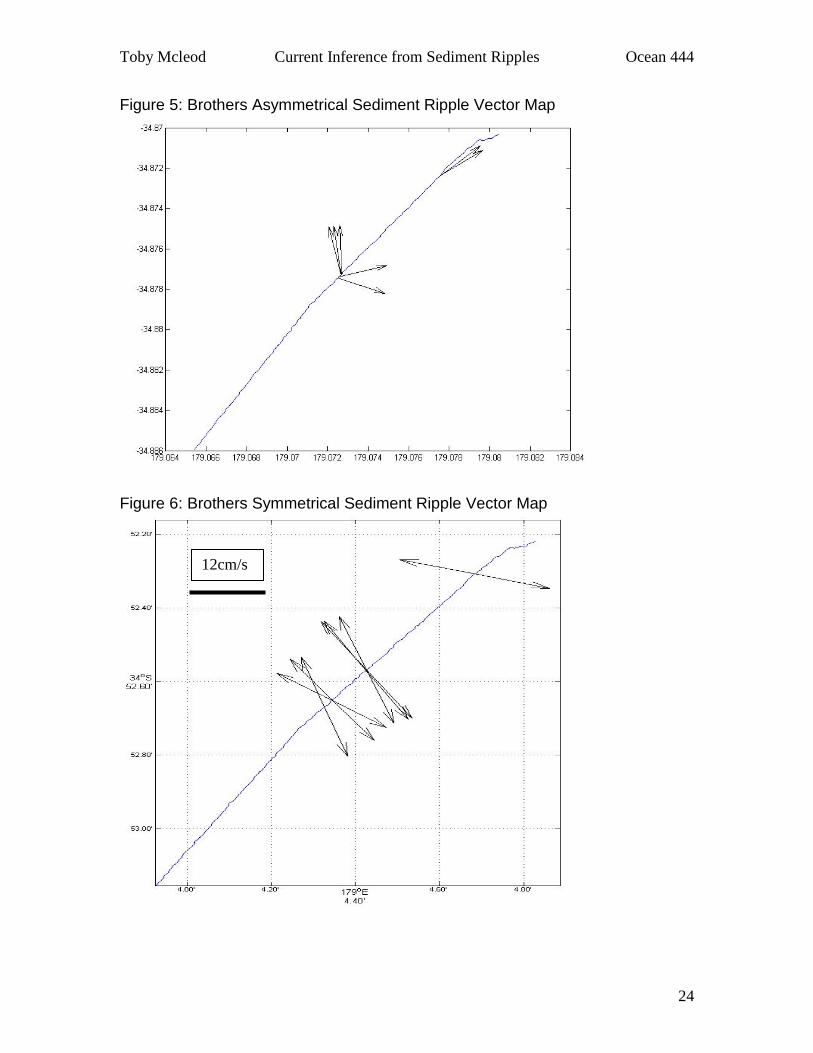
For Brothers volcano, neither the oscillatory or unidirectional current patterns
correlated to the direction of the current directions measured by the ADCP (Figs. 3, 5-6).
Unidirectional currents flow towards the northwest and the northeast according to the
sediment ripple data (Fig. 5). Oscillatory currents flowed along a northwest and southeast
trajectory (Fig. 6). The average magnitudes of velocity calculated from oscillatory
currents in the sediment data and from the ADCP vector map were about 12 and 16 cm/s
respectively which is a difference of 25% (Figs. 3, 6).

Toby Mcleod Current Inference from Sediment Ripples Ocean 444
12
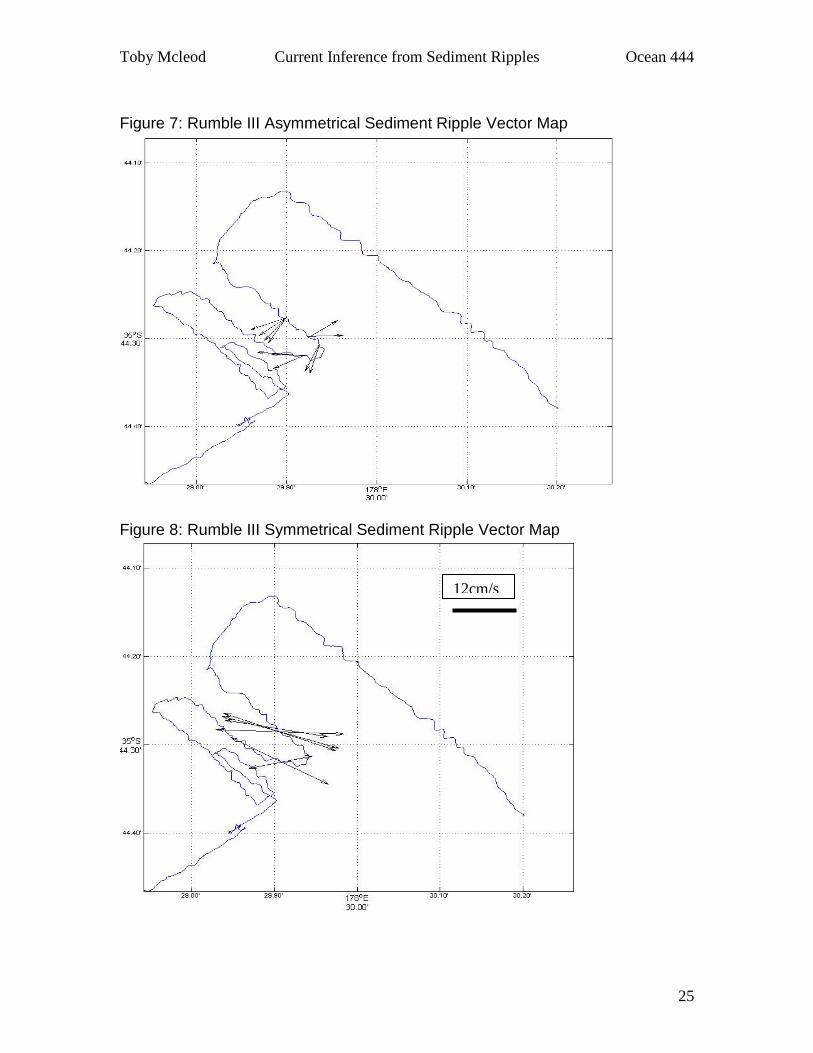
There was an array of current directions at Rumble III among the sediment data.
Unidirectional currents generally flowed in both southwest and northeast directions
which did not correspond to the general northwest orientation of currents indicated by
ADCP and satellite data (Fig. 7). Oscillatory currents indicated by sediment ripples were
observed to flow in northwest and southeast directions just as the ADCP and satellite
altimetry indicated, but the angle at which they propagate is not precisely correlated with
those other forms of measurement (Figs. 2, 4, 8). The average velocity calculated from
sediment data and from the ADCP vector map were about 10 and 15 cm/s such that
magnitude of oscillatory currents were about 66% than the overall current magnitude
(Figs. 4, 8). Overall, there was little correlation between the sediment ripple data to the
ADCP and satellite altimetry. In addition, though oscillatory ripple directions were
oriented as northwest and southeast at both Brothers and Rumble III, neither their angles
nor magnitudes of velocity were correlated.
The average eastward and northward velocities were extracted from the ADCP
data for both of the volcanoes. Westward velocity of Rumble III decreased with depth
from about 17.5 cm/s at the surface to 5 cm/s at depths near 600m. Rumble III’s velocity
also changes from about 17.5 cm/s northward near the surface to 4cm/s southward at
around 650m depth (Fig. 9). At Brothers, the westward magnitude of velocity generally
increases and the southward velocity decreases slightly with depth. Westward velocity at
Brothers has a maximum of approximately 11.5 cm/s at 600m depth and a minimum of
about 2cm/s near the surface. The southward velocity of currents at Brothers decreases
from 10 to about 7.5 cm/s between the surface and maximum depth capacity of the

Toby Mcleod Current Inference from Sediment Ripples Ocean 444
13
ADCP and fluctuates through the water column with a minimum of about 6cm/s at
approximately 330m depth (Fig. 10).
Patterns indicating the presence of oscillatory flow could be observed at Rumble
III and at Brothers through the remaining ADCP data. Given a single moment in time, an
alternation between high and low magnitudes of velocity can be observed with varying
depths at both volcanoes (Figs. 11-12). That alternating pattern is also seen at a single
depth as time changes. At Brothers, both the northward and eastward velocity maximums
appear to form diagonal lines across the time and depth varying graph (Fig. 12).
Photographs of the seafloor yielded a comparison between the occurrence of
oscillatory and unidirectional flows based on the symmetrical or asymmetrical patterns
observed. Approximately 55% of the photographs at Brothers and 70% at Rumble III
were asymmetrical. These frequencies are estimated from photographs that showed clear
evidence of sediment winnowing from which wavelength and deviation from heading
could be calculated. Examples of both symmetrical and asymmetrical sediment ripples
for Brothers and Rumble III are shown in Figure 15.
Discussion
Based on Wright’s study in 2001, sufficient bedforms for this experiment can be
found between depths of about 300-1600 meters around Rumble III and over the full
relief of Brothers to a depth of about 1900 meters including the caldera floor. These
sediment ripples become smaller and less distinct with increasing distance from the
source of sediments, so there exist distances where it is ineffective to observe the
substrate for these features. While there was evidence of winnowing across the Brothers

Toby Mcleod Current Inference from Sediment Ripples Ocean 444
14
volcano caldera and on the northwest caldera wall, the site where the presence of
sediment ripples could actually be interpreted was the Extinct Site of the southeast
caldera wall because other bedform deformations were either indistinct or had the
potential of being derived from non-current sources as determined from the photographs.
The exact locations of sediment ripple occurrence have not yet been mapped. When the
directions and magnitudes of water velocity are graphed from ADCP and sediment image
data, the sources of current generation can be determined by examining the correlations
between the observations and the source information. Such sources include tides, the
ECE, and internal waves.
The two types of flow patterns that can be propagated through and observed
from the water column are unidirectional and oscillatory. Unidirectional currents
immediately north of New Zealand can be derived from surface currents such as the ECE
or the East Auckland Current; the ECE is the most likely source of these flow patterns
around Rumble III and Brothers volcanoes because it is typically centered within their
proximity (Wright, 2001). Oscillatory currents can be generated by internal waves that
were created by water flowing over parts of the Kermadec Ridge or by tides which rotate
in an anti-cyclonic pattern around New Zealand (Walters et al., 2001).
Previous studies in New Zealand have observed significant correlation between
the ECE and deep current movements (Wright, 2001; Lavelle et al., 2008). The
unidirectional current directions observed in sediment ripple analysis were not consistent
with the ADCP and satellite altimetry data corresponding to the locations of each volcano
which suggests that the observed real-time data does not represent longer term trends in
deep water circulation. If the ECE was located further south than the surface current

Toby Mcleod Current Inference from Sediment Ripples Ocean 444
15
circulation above the volcanoes during the time of study, the inconsistency between data
sets does not exclude the possibility of the eddy’s influence on the system. With few
other sources of unidirectional currents, the ECE could be contributing to sediment
transport over longer time-frames than the brief presence of currents observed during the
cruise not produced by that eddy. There is also a chance that the TowCam was not
oriented in the same direction as the ship during times when the ship was turning which
created error in evaluating the true direction of currents. As long as the ship was moving
in a straight line, however, the direction of the TowCam and the sediment ripple
directions derived from its images should be accurate.
It is important to recognize the flaws in the sediment data before completing
analysis for current velocities shown by seafloor bedforms. Unfortunately, logistical
constraints prevented the addition of both a precise altimeter to measure ripple height
directly and a compass which could accurately record the direction of the TowCam and
sediment ripples within each image. For the latter problem, current flow was estimated
with the assumption that the camera sled is in fact oriented to face in the direction of the
ship movement. Error was reduced by not including images in the analysis where the ship
was not moving and thus not making the further assumption that the camera maintained
the same heading as the ship. For the former problem, the height for sediment ripples in a
unidirectional flow cannot be estimated from velocity calculations without already
knowing the velocity. Therefore, only sediment ripples indicating oscillatory flow were
evaluated for magnitude of the currents. Also, it is a large assumption that the one
sediment sample is representative of all areas on both volcanoes so the D and ρ s of all
those calculations may not be entirely accurate (Fig. 1).

Toby Mcleod Current Inference from Sediment Ripples Ocean 444
16
A comparison can be made between the directions of sediment ripples and of
currents changing with depth as seen by the ADCP (Figs. 5-10). At Rumble III, the deep
currents seen in the ADCP are correlated to the direction of many of the asymmetrical
sediment ripples, but not the symmetrical ripples which indicates that the source of
oscillatory currents does not produce a strong signature in the general movement of deep
currents relative to unidirectional currents at that volcano. The magnitude of currents
calculated from symmetrical sediment ripples at both volcanoes were greater than 50% of
the velocity magnitudes measured by the ADCP which may be counterevidence to the
proposed weaker contribution of oscillatory currents, but the implications are difficult to
ascertain without also having the magnitudes given by asymmetrical ripples (Figs. 3-4, 6,
8). Deep currents measured by the ADCP at Brothers did not correlate to the direction of
either ripple type even though the ADCP current directions were averaged over four days.
This implies that the range of the ADCP was inadequate to measure the deeper currents
of this volcano as opposed to being an issue of not recognizing the affects of longer-term
affects of currents.
Another interesting thing to note with respect to sediment ripple direction is the
lack of consistency between the locations of Brothers and Rumble III. Symmetrical ripple
directions were oriented to the northwest and southeast at both Brothers and Rumble III,
neither their angles nor magnitudes of velocity were correlated similarly oriented which
suggests a different source of oscillatory currents (Figs. 6, 8). Asymmetrical ripples were
oriented in almost opposite directions, with the exception of a few, which could be
explained by assuming either a different source or the same source. If unidirectional
currents have different sources among these volcanoes, it’s not particularly surprising that

Toby Mcleod Current Inference from Sediment Ripples Ocean 444
17
they would be oriented differently. However, if their common source is the ECE, then the
different course of sediment ripples could be a result of the eddy producing current which
flows towards one direction at Brothers and another direction at Rumble III.
Signatures of oscillatory currents were identified in both ADCP and sediment
ripple data (Figs. 11-13). Symmetrical ripples seen at both volcanoes were arranged such
that oscillatory current flow was consistent with the expected anti-cyclonic tidal current
direction. Alternating patterns of maximum and minimum velocities did not always occur
at the same times along a range of depths which suggests the presence internal waves as
oppose to just a tidal oscillatory effect (Figs. 11-12). Relative contributions of tides and
internal waves are not yet known because the research was constrained by not being able
to measure internal waves directly. From the image analysis, it is observed that
unidirectional flow patterns occur with greater frequency than oscillatory flows at both
volcanoes. This means that the sources of unidirectional flows contribute more to the
transport of sediment transport than those of oscillatory flow. However, oscillatory
patterns occur with a great enough frequency that their contribution to water and
sediment transport is non-trivial composing about 45% of the observed ripples at
Brothers and 30% at Rumble III. Since unidirectional currents were more abundant than
oscillatory currents, the source of those unidirectional currents likely makes the most
significant contribution to water movement and sediment transport.

Toby Mcleod Current Inference from Sediment Ripples Ocean 444
18
Conclusions
This paper has established that internal waves and tides influence the transport
of sediment around the underwater volcanoes to a significant, but lesser extent than
unidirectional currents based on their relative abundances and the correlation between
one of the ADCP deep current measurements to asymmetrical sediment ripples. Relative
tidal and internal wave contributions to sediment transport have not been evaluated. It is
difficult to determine much from the velocity determined from sediment ripples because
the magnitudes of unidirectional flow could not be calculated. The magnitude of
oscillatory waves, however, was easily over 50% of the velocity measured by the ADCP
implying a strong influence on general current movement. The contribution of the ECE to
the propagation of unidirectional current flow has neither been confirmed nor denied
through this research, but there is evidence that it is the source of these currents because
of the inconsistency of sediment data to surface currents that are probably not derived
from this eddy and the lack of other sources in the area. Since the directions of deep
currents measured by the ADCP did not typically correlate to sediment inferences of
currents, longer-term trends in the contribution of sediment transport are likely taking
place and were not observed in the few days during which the project took place.

Toby Mcleod Current Inference from Sediment Ripples Ocean 444
19
References:
Bradford-Grieve, J., K. Probert, K. Lewis, P. Sutton, J. Zeldis, and A. Orpin. 2006. New Zealand
shelf region, p. 1451-1492. In A.R. Robinson and K.H. Brink [eds.], The Global Coastal Ocean:
Interdisciplinary regional studies and synthesis. Academic.
De Ronde, C.E.J., ET Baker, GJ Massoth, JE Luptin, IC Wright, RJ Sparks, SC Bannister, ME
Reyners, SL Walker, RR Greene, J Ishibashi, K Faure, JA Resing, and GT Lebon. 2007.
Submarine hydrothermal activity along the Kermadec Arc, New Zealand: Large-scale effects on
venting. American Geophysical Union 8: 1525-2027
Heath, R.A. 1985. A review of the physical oceanography of the seas. New Zealand Journal of
Marine and Freshwater Research 19: 79-124
Komar, P.D., and M.C. Miller. 1973. The threshold of sediment movement under oscillatory
water waves. Journal of Sedimentary Research 43: 1101-1110
Komar, P.D., and M.C. Miller. 1975. The initiation of oscillatory ripple marksand the
development of plane-bed at high shear stresses. Journal of Sedimentary Research 45: 1101-1110
Komar, P.D. 1976. The transport of cohesionless sediments on continental shelves, p. 107-124. In
D.J. Stanley and D.J.P Swift [eds.], Marine sediment transport and environmental management.
Lavelle, J.W. 2006. Flow, hydrography, turbulent mixing, and dissipation at Fieberling Guyot
examined with a primitive equation model. Journal of Geophysical Research 111: C07014 1-21

Toby Mcleod Current Inference from Sediment Ripples Ocean 444
20
Lavelle, J.W., G.J. Massoth, E.T. Baker, and C.E.J. de Ronde. 2008. Ocean current and
temperature time series at Brothers volcano. Journal of Geophysical Research 113: C09018 1-10
Miller, M.C., I.N. McCave, and P.D. Komar. 1977. Threshold of sediment motion under
unidirectional currents. Sedimentology 24: 507-527
Walters, R.A., D.G. Goring, and R.G. Bell. 2001. Ocean tides around New Zealand. New Zealand
Journal of Marine and Freshwater Research 35: 567-579
Wright, IC. 2001. InSitu modification of modification of modern submarine
hyaloclastic/pyroclasic deposits by oceanic currents: an example from the Southern Kermadec arc
(SW Pacific). Marine Geology 172: 287-307
Wynn, R.B., and D.A.V. Stow. 2002. Classification and characterization of deep water sediment
waves. Marine Geology 192: 7-22

Toby Mcleod Current Inference from Sediment Ripples Ocean 444
21
Figure Legends
Figure 1: Sediment grain size ranging between 0 Ф and 4 Ф where (Ф) = -log2(D/1mm)
Figure 2: Satellite Alimetry- The blue square shows an anti-cyclonic pattern which may
represent the ECE. The red square shows a cyclonic pattern centered on the area of study
Figure 3: ADCP velocities at Brothers shown as vectors along the ship’s course
Figure 4: ADCP velocities at Rumble III shown as vectors along the ship’s course
Figure 5: Brothers asymmetrical sediment ripple vector map showing direction of ripples
along the ship’s path. Vector’s do not represent magnitude of velocity.
Figure 6: Brothers symmetrical sediment ripple vector map showing direction of ripples
along the ship’s path.
Figure 7: Rumble III asymmetrical sediment ripple vector map showing direction of
ripples along the ship’s path. Vector’s do not represent magnitude of velocity.
Figure 8: Rumble III symmetrical sediment ripple vector map showing direction of
ripples along the ship’s path.
Figure 9: Rumble III velocity through water depth at an average time
Figure 10: Brothers velocity through water depth at an average time
Figure 11: Rumble III velocity at varying times and depths
Figure 12: Brothers velocity at varying times and depths
Figure 13: Examples of symmetrical sediment ripples at both volcanoes. The green line
represents the 10cm scale for evaluating wavelengths. Red arrows indicate the direction
of propagation. A) Brothers, symmetrical ripples; B) Brothers, asymmetrical ripples; C)
Rumble III, symmetrical ripples; D) Rumble III, asymmetrical ripples

Toby Mcleod Current Inference from Sediment Ripples Ocean 444
22
Figures:
Figure 1 Sediment Grain Distribution
0
1
2
3
4
5
6
7
8
9
10
11
12
0 0.25 0.5 0.75 1 1.25 1.5 1.75 2 2.25 2.5 2.75 3 3.5 3.75 4
Seive Size (Ф)
Wei
ght P
erce
nt
Figure 2: Satellite Altimetry
Brothers
Rumble III

Toby Mcleod Current Inference from Sediment Ripples Ocean 444
23
Figure 3
Figure 4
Brothers ADCP Vector Map
Rumble III ADCP Vector Map
Toby Mcleod Current Inference from Sediment Ripples Ocean 444
24
Figure 5: Brothers Asymmetrical Sediment Ripple Vector Map
Figure 6: Brothers Symmetrical Sediment Ripple Vector Map
12cm/s
Toby Mcleod Current Inference from Sediment Ripples Ocean 444
25
Figure 7: Rumble III Asymmetrical Sediment Ripple Vector Map
Figure 8: Rumble III Symmetrical Sediment Ripple Vector Map
12cm/s

Toby Mcleod Current Inference from Sediment Ripples Ocean 444
26
Figure 9: Rumble III Time Average
Figure 10: Brothers Time Average

Toby Mcleod Current Inference from Sediment Ripples Ocean 444
27
Figure 11: Rumble III
Figure 12: Brothers

Toby Mcleod Current Inference from Sediment Ripples Ocean 444
28
Figure 13: A
B
C
D