flow over bedforms in a large sand-bed river: a field ... · flow over bedforms in a ... the...
TRANSCRIPT

Journal of Hydraulic Research Vol. 46, No. 3 (2008), pp. 322–333
doi:10.3826/jhr.2008.3040
© 2008 International Association of Hydraulic Engineering and Research
Flow over bedforms in a large sand-bed river: A field investigation
Ecoulements sur des configurations de lits sableux de grands fleuves:investigation en natureROBERT R. HOLMES, JR., Hydrologist, U.S. Geological Survey Office of Surface Water, 1201 W. University Avenue,Urbana, Illinois 61801, USA. E-mail: [email protected]
MARCELO H. GARCIA, (IAHR Member), Siess Professor and Director, Ven Te Chow Hydrosystems Laboratory, University ofIllinois at Urbana-Champaign, 205 N. Matthews, Urbana, Illinois, 61801, USA. E-mail: [email protected]
ABSTRACTAn experimental field study of flows over bedforms was conducted on the Missouri River near St. Charles, Missouri. Detailed velocity data werecollected under two different flow conditions along bedforms in this sand-bed river. The large river-scale data reflect flow characteristics similarto those of laboratory-scale flows, with flow separation occurring downstream of the bedform crest and flow reattachment on the stoss side of thenext downstream bedform. Wave-like responses of the flow to the bedforms were detected, with the velocity decreasing throughout the flow depthover bedform troughs, and the velocity increasing over bedform crests. Local and spatially averaged velocity distributions were logarithmic for bothdatasets. The reach-wise spatially averaged vertical-velocity profile from the standard velocity-defect model was evaluated. The vertically averagedmean flow velocities for the velocity-defect model were within 5% of the measured values and estimated spatially averaged point velocities werewithin 10% for the upper 90% of the flow depth. The velocity-defect model, neglecting the wake function, was evaluated and found to estimate thevertically averaged mean velocity within 1% of the measured values.
RÉSUMÉUne étude expérimentale en nature des écoulements sur des formes de lit a été conduite sur le fleuve Missouri près de St. Charles, Missouri. Desdonnées détaillées de vitesse ont été rassemblées dans deux conditions différentes d’écoulement le long des formes du lit dans ce fleuve sableux.Les données à l’échelle des grands fleuves reflètent des caractéristiques d’écoulement semblables à celles des écoulements en laboratoire, avec laséparation d’écoulement se produisant en aval de la crête de dune et le recollement de l’écoulement sur la face de la dune suivante Des réponses desillage de l’écoulement aux dunes ont été détectées, avec la vitesse diminuant dans tout le tirant d’eau au-dessus des creux, et la vitesse augmentant audessus des crêtes. Les distributions des vitesses moyennes locales et spatiales étaient logarithmiques pour les deux ensembles de données. L’écart duprofil des vitesses moyennes dans l’espace ramené au modèle standard de défaut de vitesse a été évalué. Les vitesses moyennes verticales ramenées àune moyenne d’écoulement pour le modèle de défaut de vitesse étaient à moins de 5% des valeurs mesurées et les vitesses moyennes dans l’espaceétaient à moins de 10% pour les 90% du tirant d’eau supérieur. Le modèle de défaut de vitesse, négligeant la fonction de sillage, a été évalué pourestimer la vitesse moyenne sur la verticale à moins de 1% des valeurs mesurées.
Keywords: Acoustics, ADCP, ADV, bedform, field investigation, sand-bed river, velocity profiles
1 Introduction
Bedforms occur on the bottom of sand-bed rivers and result inflow that is complex and dynamic. The bedforms are an obstacleto the flow and cause both wake effects in their lee and topo-graphically induced spatial flow acceleration, which is termedwave-like effects. In a general longitudinal sense, bedforms causea momentum defect that diffuses outward in the downstreamdirection. Flow separation occurs near the bedform crest, fol-lowed by a reattachment of the flow on the next downstreambedform (Fig. 1). At the reattachment point (where a definablevelocity profile begins to re-develop near the bed), a new internalboundary layer begins to grow within the wake region.
Much research has been conducted pertaining to the flowhydrodynamics over bedforms found in sand-bed rivers. Most
Accepted on March 4, 2008/Open for discussion until December 31, 2008.
322
of this work, however, has been conducted in laboratory flumes(Bennett and Best, 1995; Lyn, 1993; Nelson et al., 1993), primar-ily because of the difficult logistics and expense of collecting andanalyzing field data, particularly on large rivers of depths fromapproximately 3 to 15 m and mean annual discharges ≥ 500 m3/s.Obviously, there are questions of scale effects when theories oralgorithms derived from laboratory research are applied to largesand-bed rivers. There is a need for data on large sand-bed riversto establish means for either enhancing present theories (based onthe laboratory data) or developing entirely new theories. Considerthe following expressed by ASCE (2002):
“Field studies with detailed measurements of not only dunecharacteristics but also flow and transport are valuable and dauntingfor the same reason: they indicate the complexity of the real problem,which, together with practical constraints on field measurements, makemore difficult the analysis and interpretation of the data.”

Journal of Hydraulic Research Vol. 46, No. 3 (2008) Flow over bedforms in a large sand-bed river: A field investigation 323
Figure 1 Flow over a bedform where δ is the developing internal boundary layer and b is the developing wake zone resulting in a momentum defect
Correct understanding and prediction of the velocity profileand associated flow resistance is necessary for flow measurement,sediment transport prediction, and model simulation of sand-bedriver systems. The combination and interaction of the turbulencefield and flow accelerations because of the non-uniformity ofthe bed are reported to affect the form drag of the bedforms(Nelson et al., 1993). Consideration of the flow resistance isimportant for hydraulic engineers in determining the relationbetween discharge and stage.
Determination of the flow physics of the near-bed region iscrucial for understanding the relation between bedform geome-try and flow properties. The near-bed region is an area of intenseturbulence generation and concurrent mean flow energy loss.Because of the difficulties of data collection at depth in large sand-bed rivers, the data are scant in the near-bed region. More detailedvelocity data in the vicinity of bedforms are needed to increase theunderstanding of the flow field in these areas. This work presentsan overview of the measurement devices, and describes the exper-imental setup and results of the analysis of data collected at theMissouri River at St. Charles, Missouri. Results from this studyshould enhance the understanding of flow over bedforms in largesand-bed rivers, particularly in the near-bed region.
2 Hydraulics of flow over bedforms
The velocity in a shear flow is non-uniform because of the pres-ence of the boundary and the resulting resistance to flow not onlyalong the boundary but between the fluid particles. Although itwas realized as early as in the 4th Century B.C. by Aristotle thatflow resistance was important to the bulk flow (Rouse and Ince,1963), it was not until Prandtl (1904) presented his paper on theboundary-layer theory that fluid mechanics was incorporated intoflow-resistance theory and enabled a characterization of the pro-file of the velocity distribution in the vertical (Yen, 1992).Alluvialchannels add a layer of complexity to any investigation into theflow field because of the capacity of the boundary geometry tochange with flow condition.
In laboratory experimental observations, it has been noted thatin flow over a train of bedforms, a definitive momentum defectregion is present (Nelson et al., 1993; Bennett and Best, 1995).This region is associated with flow separation and wake formation
downstream of the bedform lee face, and as the wake is advecteddownstream, the effect of the momentum defect is diffused out-ward, causing the region to grow in depth. A conceptual drawingof the flow character in the presence of bedforms is given in Fig. 1.The flow separates at the crest of the bedform and reattaches atsome point downstream on the next bedform, creating an adversepressure gradient
1
µ
dp
dx> 0 (1)
where p is pressure, µ dynamic viscosity, and x the stream-wise coordinate. The pressure gradient induces a smaller velocitygradient and, thus, a smaller velocity near the bed given as
∂2u
∂z2
∣∣∣∣z=0
= 1
µ
dp
dx> 0 (2)
where u is the streamwise velocity and z is the vertical coordinate.From laboratory experiments of Nelson et al. (1993), the reduc-tion of bed velocity in the presence of adverse pressure gradientsis well demonstrated on the stoss side of the bedform.
For a shear flow over a flat-rough bed, the velocity profilehas been found empirically to be acceptably approximated byPrandtl’s logarithmic law of the wall equation for the entire depthof the flow (Garcia, 1999) expressed as
u
u∗= 1
κln z + C (3)
where u∗ is the shear velocity, κ is von Karman’s constant,and C is a constant. For shear flows over a flat-rough bed, theReynolds stresses typically decrease monotonically away fromthe boundary, reaching zero near the water surface in equilibriumconditions. With bedforms present, the velocity and Reynoldsstress profiles have been shown experimentally to be differentfrom those for a flat-rough bed (Bennett and Best, 1995; Nezuand Nakagawa, 1993). The velocity profiles for these experimentswere logarithmic in nature; however, the slopes vary in multipleand separate distinct layers. The major separation point betweenthe layers often corresponds to a maximum in the Reynolds stress,increasing from the boundary to the location of the maximumshear stress and then decreasing toward the water surface.

324 R.R. Holmes, Jr and M.H. Garcia Journal of Hydraulic Research Vol. 46, No. 3 (2008)
3 Review of past field experiments
As expressed earlier, there is a lack of field-scale experimentsof detailed velocity measurements longitudinally over bedforms,especially for large river systems. Two notable exceptions are thefield experiments of Smith and McLean (1977) and Kostaschukand Villard (1996).
Smith and McLean (1977) conducted experiments on theColumbia River (USA) in which they collected data on veloc-ity and sediment-concentration profiles over bedforms as wellas channel bathymetry and bed-material samples for a sediment-size analysis. In these experiments, velocity was measured at fourlocations in the boundary layer using 0.04 m diameter mechan-ical current meters attached to a frame that was lowered to thenear bed. Other velocity observations were made with a sus-pended device. The frame was moved 3 m downstream everyhour. The discharge during the experiments ranged from 8000to 17 000 m3/s, with velocities 1 m from the bed ranging from0.50 to 0.82 m/s. In the early experiments (1968 and 1969), thesediment was transported only as bedload, whereas during the1971 and 1972 experiments sediment was transported as bothsuspended-sediment load and bedload. In the experiments withbedload only, the bedforms were shorter and steeper than for theother experiments. The elongated, more symmetrical bedformswere not sufficient to induce separated flow in the lee of thebedform. Velocity data were collected at time scales such that inexamining velocity profiles, the velocity data were averaged over30 minutes at multiple locations in the vertical and then averagedin the longitudinal direction (along the bedform). The velocitydata also were normalized with the velocity measured 1 meterabove the bed, as opposed to normalizing with the shear velocity,which is more typical. Depths ranged from 13.4 to 16.6 m, withbedforms ranging from 67 to 96 m in length and from 1.34 to3.21 m in height.
Kostaschuk and Villard (1996) collected flow and sedimentdata over asymmetric and symmetric bedforms in the Fraser Riverestuary near Steveston, Canada. Data were collected betweenMay and July 1989 at 4 to 5 verticals along the bedforms. Theyfound no lee-side flow separation for flows over the bedforms.A Marsh McBirney™ 527 current meter and pump samplerwere secured above a 70 kg lead sounding weight to collect thenecessary velocity and sediment data for this study.
4 Experimental procedure
A reach of the Missouri River at St. Charles, Missouri was chosenfor study because it provided (1) good logistics with a boat launchadjacent to the data-collection reach; (2) approximate equilib-rium dimensions for dunes with dune height to water-depth ratiosfrom 1/6 to 1/7; and (3) “pseudo-steady” flow conditions for dura-tion of data collection of 10 to 15 hours. Two sets of data were col-lected. The first set, designated MO-1, was collected on June 19,2002 and the second set, designated MO-2, on August 27, 2002.
In the study reach, the river is fairly straight and flows tothe northeast. The study reach is 44.6 km upstream from the
confluence with the Mississippi River. USGS streamflow-gagingstation 06935965 is immediately adjacent to the study reach, agaging station is maintained by the Corps of Engineers 44.6 kmdownstream on the Mississippi River atAlton, Ill. near the conflu-ence of the Missouri River, and a wire-weight gage is maintainedby the National Weather Service 53 km upstream at Washing-ton, Mo. The water surface slopes for these experiments weredetermined by utilizing the water surface elevations at these loca-tions. The slope in the reach upstream of St. Charles is typicallyhigher than the reach downstream. As the reach of gages extends97.6 km, the true slope at St. Charles will differ from the reach-averaged slope. The reach-averaged slope is reasoned to be anacceptable estimate of the water surface slope because the reach-averaged (bulk) shear stress computed from the product of thewater-surface slope, flow depth, and acceleration of gravity com-pares well with the reach-averaged shear stress computed fromthe spatially averaged velocity profile.
The channel bed is composed of fairly uniform sand withD50 = 0.31 mm. The channel-top width at the study reachfor bank-full flows is between 350 and 400 m at the dischargespresent during data-collection efforts in this study. The approx-imate bank-full flow depth would be around 9 m. The flows attimes of data collection for this research were well within thechannel banks, with average water depths for MO-1 and MO-2of 6.4 and 5.0 m, respectively. Both banks are lined with treesand riprap.
For each dataset, the bathymetry data were collected usinga boat-mounted 200 kHz Odum Hydrographic Systems Hydro-trac Digital Fathometer, with 1 cm accuracy, in concert with aTrimble AgGPS™ 124/132 differentially corrected global posi-tioning system (DGPS), with sub-meter horizontal accuracy. Thedata from these instruments were synchronized and logged usingOceangraphic Systems, Inc. HYPACK™ software.
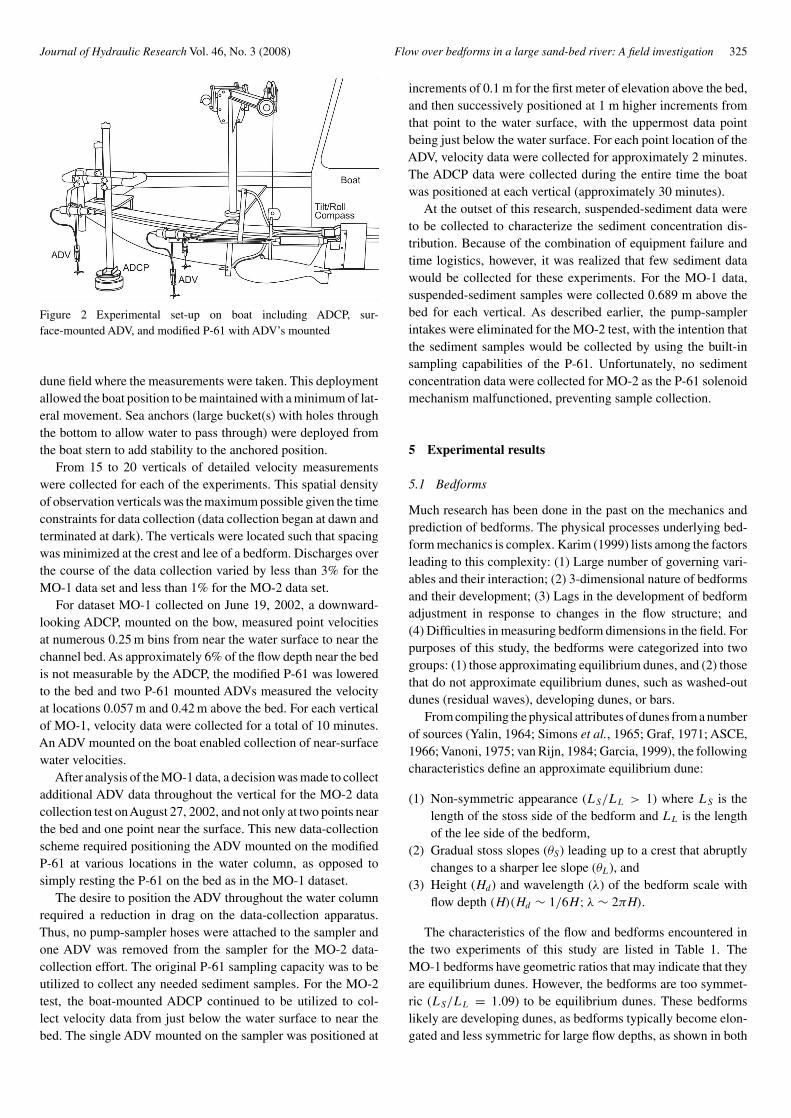
Detailed velocity data were collected from a stationary boatusing a down-looking 600 kHz acoustic Doppler current profiler(ADCP) and multiple 10 MHz acoustic Doppler velocimeters(ADV). Single ping per ensemble velocity data were collectedat 3 Hz using the ADCP with typical median absolute deviations(MAD) (Helsel and Hirsch, 1992) between 0.17 and 0.19 m/s.Single ping per ensemble data were collected at 25 Hz usingthe ADV with typical MAD values between 0.05 and 0.15 m/sdepending on location in the water column, with higher MADvalues for those locations near the bed. The horizontal position ofeach vertical was determined by DGPS. The ADCP was mountedto the side of the boat; one of the ADVs was mounted on a mod-ified P-61 sediment sampler suspended from the boat by a cable(Fig. 2) and the other on the boat to obtain a surface velocity.The surface-velocity data from the ADV mounted to the boatwas not used to determine the velocity profiles as the presenceof the boat caused a decrease in the stream velocities near thesurface. Attempts (with limited success) were made to collectsuspended-sediment data by both a pump sampler connected tointakes on the modified P-61 sediment sampler and through theregular sampling capacity of the P-61.
To begin the collection of the detailed velocity data, twoanchors were deployed from the boat upstream on each side of the
Journal of Hydraulic Research Vol. 46, No. 3 (2008) Flow over bedforms in a large sand-bed river: A field investigation 325
Figure 2 Experimental set-up on boat including ADCP, sur-face-mounted ADV, and modified P-61 with ADV’s mounted
dune field where the measurements were taken. This deploymentallowed the boat position to be maintained with a minimum of lat-eral movement. Sea anchors (large bucket(s) with holes throughthe bottom to allow water to pass through) were deployed fromthe boat stern to add stability to the anchored position.
From 15 to 20 verticals of detailed velocity measurementswere collected for each of the experiments. This spatial densityof observation verticals was the maximum possible given the timeconstraints for data collection (data collection began at dawn andterminated at dark). The verticals were located such that spacingwas minimized at the crest and lee of a bedform. Discharges overthe course of the data collection varied by less than 3% for theMO-1 data set and less than 1% for the MO-2 data set.
For dataset MO-1 collected on June 19, 2002, a downward-looking ADCP, mounted on the bow, measured point velocitiesat numerous 0.25 m bins from near the water surface to near thechannel bed. As approximately 6% of the flow depth near the bedis not measurable by the ADCP, the modified P-61 was loweredto the bed and two P-61 mounted ADVs measured the velocityat locations 0.057 m and 0.42 m above the bed. For each verticalof MO-1, velocity data were collected for a total of 10 minutes.An ADV mounted on the boat enabled collection of near-surfacewater velocities.
After analysis of the MO-1 data, a decision was made to collectadditional ADV data throughout the vertical for the MO-2 datacollection test onAugust 27, 2002, and not only at two points nearthe bed and one point near the surface. This new data-collectionscheme required positioning the ADV mounted on the modifiedP-61 at various locations in the water column, as opposed tosimply resting the P-61 on the bed as in the MO-1 dataset.
The desire to position the ADV throughout the water columnrequired a reduction in drag on the data-collection apparatus.Thus, no pump-sampler hoses were attached to the sampler andone ADV was removed from the sampler for the MO-2 data-collection effort. The original P-61 sampling capacity was to beutilized to collect any needed sediment samples. For the MO-2test, the boat-mounted ADCP continued to be utilized to col-lect velocity data from just below the water surface to near thebed. The single ADV mounted on the sampler was positioned at
increments of 0.1 m for the first meter of elevation above the bed,and then successively positioned at 1 m higher increments fromthat point to the water surface, with the uppermost data pointbeing just below the water surface. For each point location of theADV, velocity data were collected for approximately 2 minutes.The ADCP data were collected during the entire time the boatwas positioned at each vertical (approximately 30 minutes).
At the outset of this research, suspended-sediment data wereto be collected to characterize the sediment concentration dis-tribution. Because of the combination of equipment failure andtime logistics, however, it was realized that few sediment datawould be collected for these experiments. For the MO-1 data,suspended-sediment samples were collected 0.689 m above thebed for each vertical. As described earlier, the pump-samplerintakes were eliminated for the MO-2 test, with the intention thatthe sediment samples would be collected by using the built-insampling capabilities of the P-61. Unfortunately, no sedimentconcentration data were collected for MO-2 as the P-61 solenoidmechanism malfunctioned, preventing sample collection.
5 Experimental results
5.1 Bedforms
Much research has been done in the past on the mechanics andprediction of bedforms. The physical processes underlying bed-form mechanics is complex. Karim (1999) lists among the factorsleading to this complexity: (1) Large number of governing vari-ables and their interaction; (2) 3-dimensional nature of bedformsand their development; (3) Lags in the development of bedformadjustment in response to changes in the flow structure; and(4) Difficulties in measuring bedform dimensions in the field. Forpurposes of this study, the bedforms were categorized into twogroups: (1) those approximating equilibrium dunes, and (2) thosethat do not approximate equilibrium dunes, such as washed-outdunes (residual waves), developing dunes, or bars.
From compiling the physical attributes of dunes from a numberof sources (Yalin, 1964; Simons et al., 1965; Graf, 1971; ASCE,1966; Vanoni, 1975; van Rijn, 1984; Garcia, 1999), the followingcharacteristics define an approximate equilibrium dune:
(1) Non-symmetric appearance (LS/LL > 1) where LS is thelength of the stoss side of the bedform and LL is the lengthof the lee side of the bedform,
(2) Gradual stoss slopes (θS) leading up to a crest that abruptlychanges to a sharper lee slope (θL), and
(3) Height (Hd) and wavelength (λ) of the bedform scale withflow depth (H)(Hd ∼ 1/6H; λ ∼ 2πH).
The characteristics of the flow and bedforms encountered inthe two experiments of this study are listed in Table 1. TheMO-1 bedforms have geometric ratios that may indicate that theyare equilibrium dunes. However, the bedforms are too symmet-ric (LS/LL = 1.09) to be equilibrium dunes. These bedformslikely are developing dunes, as bedforms typically become elon-gated and less symmetric for large flow depths, as shown in both

326 R.R. Holmes, Jr and M.H. Garcia Journal of Hydraulic Research Vol. 46, No. 3 (2008)
Table 1 General data for experiments MO-1 and MO-2
Date MO-1 MO-2
June 19, 2002 August 27, 2002
Discharge (Q) 3,160 m3/s 1,407 m3/sSlope (S) 0.00016 0.00017Mean depth (〈H〉) 6.46 m 4.87 mMean velocity (U) 1.52 m/s 1.03 m/sFroude number (F) 0.2 0.149Median bed
material size (D50) 0.31 mm 0.31 mm
Large bedform Small bedform
Dune height (Hd) 1.25 m 1.1 m 0.32 mDune length (λ) 23.0 m 140 m 5.7 mStoss angle (θS) 5.7◦ 0.72◦ 3.4◦
Lee angle (θL) 7.8◦ 1.3◦ 14◦–30◦
Ratio of stoss toLee length (LS/LL) 1.09 1.90 1.5Near-bed total suspended
sediment concentration (mg/l) 482 320Near-bed sand suspended
Sediment concentration (mg/l) 265 265
numerical perturbation analysis (Kennedy, 1963; Fredsoe, 1982)and through field observations (Shen et al., 1978; Jordan, 1965).
The MO-2 bedforms are a combination of large non-symmetric bedforms with smaller superimposed, non-symmetricbedforms. The larger bedform geometries approximate those ofequilibrium dune characteristics reasonably well. The geome-tries from all the Smith and McLean (1977) bedforms are withinexpected ratios that would characterize them as equilibriumdunes. The June 21, 1989 dataset from Kostaschuk and Villard(1996) had bedforms with geometries suggesting that they arenon-equilibrium dunes, with the remaining 2 Kostaschuk andVillard (1996) datasets characterized as equilibrium dunes.
5.2 Mean flow
The velocity and bed profiles are shown for the datasets MO-1and MO-2 in Figs 3 and 4. The channel bathymetries for these
Figure 3 Streamwise velocity observations for the MO-1 data set. Vertical lines along the bottom of the plot indicate the location of the velocityprofile origin. Because of data density, lighter solid lines are included to assist the reader in determining which origin corresponds with a profile
experiments were collected at the same resolution, but have greatdifferences in their geometries. In both these experiments, flowseparation in the lee of the bedform was detectable. MO-1 hadzero near-bed velocities measured at x = 36.3 m and 37.6 m(3.8 m and 5.1 m downstream of the bedform crest at x = 32.5 m).MO-2 had negative near-bed velocities at x = 138.9 m (5.4 mdownstream of the crest at x = 133.5 m). According to Nelsonet al. (1993), the distance between the crest and the downstreamreattachment point averaged about 4Hd , which corroborates thefindings of Engel (1981). Lyn (1993) discussed the re-circulationregion downstream of the bedform crest and noted that in hislaboratory results, the re-circulation region extended past theone-quarter length of the next downstream bedform. The spatialresolution of the MO-1 and MO-2 experiments was insufficientto definitively ascertain the reattachment point, but flow attach-ment was evident by location x = 38.3 m in MO-1, in thatthe near-bottom velocity had increased considerably from the

Journal of Hydraulic Research Vol. 46, No. 3 (2008) Flow over bedforms in a large sand-bed river: A field investigation 327
Figure 4 Streamwise velocity observations for MO-2 data set. Vertical lines along the bottom of the plot indicate the location of the velocity profileorigin. Zero or negative velocities are represented as solid circles
Figure 5 MO-1 velocity profiles in the vicinity of the crest and in thelee of the crest
zero velocity at x = 37.6 m. The attached velocity profile atx = 38.3 m is 4.6 Hd downstream of the crest. Because ofthe presence of the superimposed dunes in MO-2, the detailedvelocity data (Fig. 4) appear to indicate the flow detaching andreattaching at numerous points along the larger parent bedform.
The attachment of the flow becomes more evident when exam-ining the velocity profiles. Figure 5 shows a marked decrease invelocity throughout the water column downstream of the bed-form crest for MO-1, which also is slightly apparent for theMO-2 experiment (Fig. 6). The question is whether the veloc-ity decrease in MO-1 and MO-2 is a wake-induced momentumdefect controlled by turbulence diffusion, or a topographicallyinduced deceleration controlled by the pressure gradient and iner-tial forces. Nelson and Smith (1989) delineate the various regionsof flow over well-developed bedforms as characterized by dif-ferent turbulence structures and length scales. The first regionis that wherein velocity and velocity fluctuations are wake-like(in the lee of the bedform near the bed and diffusing outward).A second region is present where the scaling parameters andvelocity structure coincide with that of a boundary layer flow.A third region is wave-like, where the scaling parameters are
Figure 6 MO-2 velocity profiles in the vicinity of the crest and in thelee of the crest
closer to those of the bulk flow parameters of shear velocityand flow depth. In MO-1 (Fig. 5), it is noted that the veloc-ity decrease is almost immediately throughout the water column3.8 m downstream of the crest at x = 36.3 m. Flow separationwas noted in the MO-1 data, which would require the presenceof wake-like flow features. However, the decrease of the velocityextending to the surface immediately (3.8 m) downstream of thecrest likely indicates that this is attributable to the topographi-cally induced pressure gradient, as intuitively, a wake-inducedvelocity decrease would require a longer distance downstreamfrom the crest to be seen at the surface. Nelson et al. (1993)noted this same wave-like response of the flow to the bedformsin their laboratory experiments.
Typically, velocity scales with shear velocity, whereas thelength scaling variable for the inner region is either a roughnesslength or a combination of the shear velocity and viscosity, wherethe inner region is that region where the flow is influenced by theboundary. For the outer region, that region where the influenceof the boundary on the flow is decreased, the length scaling istypically the total depth. These scales typically are referred to asinner and outer scales, respectively. For the shear velocity, both

328 R.R. Holmes, Jr and M.H. Garcia Journal of Hydraulic Research Vol. 46, No. 3 (2008)
local and bulk (reach-averaged) shear velocity possibly couldbe used in scaling. Two common methods used to compute thebulk shear velocity u∗T are: (1) Square root of the product ofthe mean flow depth, water-surface slope, and the gravitationalconstant; and (2) Slope of the best-fit line through the reachwisespatially averaged velocity profile. Herein, method (1) was usedto determine the bulk shear velocity, unless otherwise noted. Thelocal shear velocity u∗L is computed at each vertical from theslope of the velocity distribution. In computing the local shearvelocity, the velocity data in the range 0.2 < z/H < 0.5 weretypically used as this range was found to provide the most rea-sonable values (reasonableness was judged as smooth transitionin local shear velocity along the longitudinal direction). MO-1and MO-2 indicate a collapse of the data away from the bed toa universal functional form when scaled with shear velocity asshown in Figs 7 and 8, with the better collapse resulting with theuse of the local shear velocity.
With the apparent flow separation in both the MO-1 and MO-2data, the lack of flow similarity near the bed is to be expected.The lack of the near-bed (z/H < 0.15) universal flow structure
Figure 7 All local velocity data collected in MO-1 and MO-2, plottedin velocity-defect form and scaled by the local shear velocity
Figure 8 All local velocity data collected in MO-1 and MO-2, plottedin velocity-defect form and scaled by the bulk shear velocity
also was discussed by Lyn (1993), who noted that this regionwould “exhibit only weakly (if at all) universal structure.” Onthe basis of laboratory data, Fedele and Garcia (2001) postulatethat within the internal layer (near-bed region), the lack of scal-ing occurs as “two major dynamic mechanisms are competingin producing and transporting turbulent properties with differentrelative importance at different locations along flow development(shear layer and wake diffusion, and wall turbulence)”. This lackof scaling seems reasonable when examining the turbulent fluctu-ations from the MO-2 dataset (Fig. 9). The streamwise turbulentfluctuations are similar to the wall-bounded shear flow relationsgiven by Nezu and Nakagawa (1993) only for elevations wherez/H > 0.4.
The velocity-defect law with a wake function can be written as
Um − u
u∗= −1
κln
( z
H
)+ 2W0
κcos2
( πz
2H
)(4)
where (2W0/κ) · cos2(πz/2H) is the wake function, W0 is Coles’wake parameter, and Um is the maximum streamwise velocity inthe water column. In this work, W0 was computed by the methodlisted in Julien (1995). The rationale for this method is based onthe assumption that the wake term vanishes as z approaches 0. Ifa semi-log plot is fitted to the lower part of the velocity profileand a line is projected to z/H = 1, W0 can be calculated as
W0 = κ
2
[Um − u
u∗
]zH =1
(5)
W0 depends on free stream pressure gradients in equilibriumboundary layer flow (Lyn, 1993), with negative W0 occurring forfavorable pressure gradients and positive W0 for adverse pressuregradients. For flat-bed flows, W0 has a range from 0 to 0.25 witha mean of approximately 0.2 (Nezu and Rodi, 1986).
For MO-1, W0 varied from 0.200 near the crest to −0.127downstream of the crest (Fig. 10), with an average value for alllocations of 0.020. For MO-2, W0 varied from 0.252 at a crestof a superimposed dune to −0.251 in the lee of a superimposedbedform (Fig. 10) (Holmes, 2003). An average W0 of 0.070 wascalculated for all MO-2 locations. The impact of the range of W0
on the theoretical velocity defect profile is shown in Figs 7 and 8.
Figure 9 Streamwise turbulent fluctuations for MO-2

Journal of Hydraulic Research Vol. 46, No. 3 (2008) Flow over bedforms in a large sand-bed river: A field investigation 329
Figure 10 Variation of Coles’ wake coefficient with distance along thedune for all experiments
In general, the wake coefficient is positive in the flow leading upto the bedform crest and negative in the lee of the bedform crest(Fig. 10). The single data value that has a negative W0 on thestoss side of the bedform, (X − X0)/λ = 0.84, occurs in the leeof a superimposed bedform.
5.3 Spatially-averaged velocity
As shown in the above Mean Flow section, the velocity profilevaries over the length of a bedform. For some applications, it isuseful to determine a spatially-averaged velocity profile. Thesespatial averages are an integration of all the flow effects over thebedform. Various investigators performed spatial averaging ofboth velocity and Reynolds stresses (Smith and McLean, 1977;Nelson et al., 1993; Fedele and Garcia, 2001), using two differentmethods: (1) Averaging along lines of constant elevation above aspecified datum, and (2) Averaging along lines equidistant fromthe boundary, the latter being used herein. The equidistant methodwas judged to better capture the boundary effects in the flow struc-ture because averaging along lines of constant elevation above thedatum causes elimination of data in the bedform trough, as thereare not enough other data at that elevation to average against.
For flow over bedforms, the inner length scale is the compositeroughness height, kc, which is an amalgam of both grain and formresistance. The value of kc can be computed from the spatiallyaveraged velocity profile. The value of C from Eq. (3) is definedas (Schlichting, 1979)
C = −u∗κ
ln kc + B
[u∗kc
ν
]u∗ (6)
where B[u∗kc/ν] is the roughness function from Nikuradse’sdata (Schlichting, 1979) and u∗kc/ν is the roughness Reynoldsnumber. Rearranging terms yields an implicit equation for kc as
kc = exp
{(B
[u∗kc
ν
]− C
u∗
)κ
}(7)
C is computed from a regression of the velocity and the naturallogarithm of the elevation (z) of the velocity data point, wherethe intercept (for z = 1) of the regression fit to the line is equal
to C. The implicit nature of Eq. (7) requires an iteration pro-cess by assuming an initial value of roughness kc, solving for theroughness Reynolds number, determining B[u∗kc/ν] from Niku-radse’s data plot (Schlichting, 1979), computing kc by Eq. (7),and finally comparing the computed value of kc with the initialassumption.
In examining the values for kc, a value 0.322 m was computedfor the MO-2 data set which scales with the superimposed bed-form heights, whereas a computed kc = 0.13 m for MO-1 is muchsmaller than the bedform height (Table 1). This result seems toimply that the flow for MO-1 was experiencing a smaller amountof form resistance, with the bedforms appearing to the flow aslarge roughness elements. The lack of form resistance is likely dueto the relatively symmetric and closely spaced bedforms of MO-1.
Examining the data to determine similarity characteristics,the data can be plotted in logarithmic form with the compositeroughness height as the length scaling parameter and the bulk-shear velocity as the velocity-scaling parameter. This log-linearform is presented in Fig. 11 and shows some collapse of thedata toward a universal functional form. The MO-2 data seemto have two linear segments, whereas the MO-1 data could bewell characterized by one single linear segment. MO-1 data werefor bedforms that were not characterized as equilibrium dunes,as was the June 21 dataset collected by Kostaschuk and Villard(1996). This dataset also was represented well by a single lin-ear segment (Holmes, 2003). MO-2, which required 2 segmentsto properly characterize the velocity profile in log-linear space,had equilibrium dunes present. This result is similar to datasetsfrom the field experiments of Smith and McLean (1977) andKostaschuk and Villard (1996). These data also required multi-ple linear segments to properly characterize the spatial velocityprofile (Holmes, 2003).
The velocity data also can be presented in dimensionlessvelocity defect form using outer scales of average flow depth andbulk-shear velocity (Fig. 12), which provide a better data col-lapse. It should be noted that the velocity defect form requires noknowledge of equivalent composite roughness. The data collapsein proximity of the bed is noticeably improved as compared tothe local velocity data (Figs 7 and 8).
Figure 11 Log-linear dimensionless velocity plot

330 R.R. Holmes, Jr and M.H. Garcia Journal of Hydraulic Research Vol. 46, No. 3 (2008)
Figure 12 Spatially-averaged velocity data plotted in velocity-defectform
6 Spatially-averaged velocity-defect model
To provide a simple model for field application, the defect form ofthe log-linear velocity model Eq. (4) can be used without knowl-edge of the roughness parameters ks or kc. The parameters to beestimated for application of the velocity-defect model are Um, u∗,(either u∗T or u∗L) and W0. The inclusion of the wake adds non-linearity (in log-linear space) to the velocity profile. The wakefunction accounts for some of the pressure and inertial effects thatare not accounted for in the log-law velocity models. A numberof measures of bedform geometry were investigated to determineif they were uniquely related to W0; however, nothing satisfac-tory was found. Coleman (1986) determined that W0 varies withsediment concentration, which is in-line with other work sug-gesting the influence of sediment on the velocity profile (Vanoni,1946; Einstein and Chien, 1955; Coleman, 1981; Gelfenbaumand Smith, 1986). Given those findings, an effort was made todetermine a relation between W0 and the sediment concentration.As the sediment concentration can be expressed in terms of thegross flow Richardson number, Rig, a relation between Rig andW0 was developed (Fig. 13) based on (Coleman, 1986)
Rig = gH(ρs − ρf )
〈ρf 〉U2m
(8)
where 〈ρf 〉 is the vertically-averaged sediment-water mixturedensity, Um is the maximum water velocity, H is the aver-age flow depth, and ρs is sediment density. For this work, ρf
is defined as the sediment-water mixture density near the bed(approximately 0.005 m above the bed). This simpler version forcomputation of Rig in Eq. (8) was used because of the limitedsediment concentration data.
Three field datasets [69-W1 of Smith and McLean (1977),June 29 of Kostaschuk and Villard (1996), and MO-2] were notused in Fig. 13, so that these data could be used to test the velocity-defect profiles predicted with the W0 estimated from Fig. 13.
The sediment concentration distribution used to compute thevertical average of the sediment-water mixture density 〈ρf 〉 wasdetermined by applying the sediment distribution of Rouse to
Figure 13 Coles’ wake parameter as a function of the gross flowRichardson number
the near-bed suspended-sediment sample. The MO-2 suspended-sediment concentration near the bed was estimated from acombination of the MO-1 data and the detailed suspended-sediment data collected 112 km upstream at the Missouri Riverat Hermann, Mo. The flow conditions and bed-sediment sizes arethere similar to those at St. Charles. Sand and total suspended-sediment concentrations near the bed are listed in Table 1. Thedensity at each location in the vertical was then computed as
ρf = ρsc + ρ(1 − c) (9)
where c is the volumetric sediment concentration.The relation between the Richardson number and Coles’wake
parameter from the original laboratory flume work of Coleman(1986), using flat beds, is also shown in Fig. 13. As Coles’ wakeparameter is used to help account for pressure and inertial forces,a difference in the relation between flows over bedforms and theflat-bed flows is to be expected. For field applications, a log-linearrelation fit through the data can be used to estimate Coles’ wakeparameter, the bulk shear velocity can be computed from
u∗T = u∗ = √g〈H〉S (10)
and the maximum velocity and total depth are fairly easy todetermine. From these parameters, the velocity profile can becomputed from Eq. (4). Plots of the model performance incomparison to the field observed data of MO-2 are shown inFig. 14. A summary plot of velocity-defect model performancefor the validation datasets of MO-2, Smith and McLean 69-W1(1977), and Kostaschuk and Villard June 29 (1996) is shown inFig. 15. The velocity-defect model is accurate away from the bed(z/H > 0.1), where the error is ±10% in all cases, whereas theaccuracy is eroded considerably near the bed (z/H < 0.1). Thisaccuracy decrease is especially true for those situations in whichthe bed becomes more dune-like with increasing lee vortices andthe flow separation is strong resulting in a definitive two-segment,log-linear velocity profile, such as for the Smith and McLean(1977) 69-W1 dataset. The vertically-averaged mean velocitiesfor modeled velocity profiles for the three verification datasets inFig. 15 had an averaged absolute error of 2.7% for the three data

Journal of Hydraulic Research Vol. 46, No. 3 (2008) Flow over bedforms in a large sand-bed river: A field investigation 331
Figure 14 Observed and velocity-defect modeled velocity profiles forMO-2 data
Figure 15 Error of the velocity-defect model as a function of dimen-sionless elevation above the bed
sets with all modeled velocity profiles within 5% of the observedmean velocity.
The weakness of the spatially-averaged W0 is recognized, par-ticularly when one evaluates it in light of the variation of W0 over abedform (Fig. 10). As such, the performance of the velocity defectmodel without considering W0 was also evaluated. Figure 16shows a summary plot of velocity-defect model performance forthe same validation datasets used in Fig. 15. In comparison tothe velocity-defect model with W0, the velocity-defect modelwithout W0 has little, if any, decrease in performance away fromthe bed (z/H > 0.3), where the error is ±10% in all cases andhas model accuracy decreases in the range z/H < 0.1. In thisnear-bed range, the errors greatly increase. However, the mod-eled vertically-averaged mean velocities for the velocity-defectmodel without W0 has a much lower average absolute error valueof 0.4%, with all modeled vertically-averaged mean velocitieswithin 0.8% of the observed vertically averaged mean velocities.In addition, the model has the added advantage of easier fieldapplication, as there is no need for knowledge of the sedimentconcentration.
Figure 16 Error of the velocity-defect model, neglecting W0, as afunction of dimensionless elevation above the bed
7 Conclusions
A field study of flows over bedforms, utilizing ADCP andADV instrumentation, was conducted on the Missouri River atSt. Charles, Mo. The MO-2 dataset was determined to havebedforms that approximated equilibrium dunes with superim-posed dunes, whereas equilibrium dunes were not present in theMO-1 dataset. The spatially-averaged and at-a-vertical velocitydistributions were logarithmic in nature for all datasets. Flowseparation in the lee of the bedforms was noted in both datasets,with the smaller superimposed bedforms appearing to be thecontrolling feature on the MO-2 data. There is good collapseto a universal functional form of the spatially-averaged field-scale velocity data in both inner and outer scales (log-linear andvelocity-defect form). Coles’ wake coefficient, computed for allvelocity profiles at each section, varied from 0.200 near the crestto −0.127 downstream of the crest for the MO-1 dataset, andfrom 0.252 at a crest of a superimposed dune to −0.251 in thelee of a superimposed bedform for the MO-2 dataset. The flowover the bedforms experiences a wave-like response in the outerregion, with velocity decreasing throughout the flow depth overbedform troughs, and the velocity increasing over bedform crests.
The spatially averaged velocity profiles for those experimentswith bedforms that do not approximate equilibrium bedforms canbe well characterized with a single logarithmic function, whereasflows over equilibrium dunes require multiple linear segments inlogarithmic space to characterize the profile. All the field datacollected in this research collapse sufficiently well when plottedin inner scales (bulk-shear velocity and the composite roughnesslength); the collapse is better, however, when the data are plot-ted in velocity-defect form. There appears to be universal flowstructure close to the bed in the spatially averaged data.
The standard velocity-defect-wake model was tested for thespatially averaged velocity profiles of field data, with bedformspresent. Coles’ wake parameter was presented as a functionof the gross flow Richardson number, which requires someknowledge of the vertical-density distribution where sedimentconcentration influences the density. The model estimates the

332 R.R. Holmes, Jr and M.H. Garcia Journal of Hydraulic Research Vol. 46, No. 3 (2008)
vertically-averaged mean velocity to within 2% and estimates thepoint velocities to within ±10% for z/H > 0.1. The velocity-defect model without the Coles’ wake parameter was evaluatedand found to estimate the vertically-averaged mean velocity bet-ter than the velocity-defect model that included Coles’ wakeparameter.
Acknowledgments
Thanks to the U.S. Geological Survey who provided funding andlogistical support for this research. The use of firm, trade, andbrand names in this paper is for identifier purposes only and doesnot constitute endorsement by the U.S. Geological Survey.
Notation
B[u∗kc/ν] = Roughness functionc = Volumetric sediment concentrationC = Constant
D50 = Median diameter of bed materialF = u/(gH)1/2 Froude numberg = Acceleration of gravity
H = Flow depth〈H〉 = Spatially-averaged flow depthHd = Bedform heightkc = Composite roughness heightks = Nikuradse equivalent roughness parameterLs = Length of stoss side of bedformLL = Length of lee side of bedformp = PressureQ = Streamflow discharge
Rig = Gross Richardson numberS = Water surface slopeu = Mean velocity at a pointU = Vertically-averaged mean velocity
Um = Maximum streamwise velocity in water columnu∗ = Shear velocity
u∗L = Local shear velocityu∗T = Bulk (reach-averaged) shear velocity
u∗kc/ν = Roughness Reynolds numberW0 = Coles’ wake coefficient
x = Distance along bedform; streamwise coordinatex0 = Location of the bedform crest
Greek symbols
z = Elevation above channel bed, vertical coordinateκ = Von Karman’s constantλ = Bedform lengthµ = Dynamic viscosityθs = Stoss side angle of bed formθL = Leeside angle of bed formρf = Fluid density
〈ρf 〉 = Spatially-averaged fluid densityρs = Sediment density
References
ASCE Task Force on Bed Forms inAlluvial Channels of the Com-mittee on Sedimentation. (1966). Nomenclature for bed formsinalluvial channels.J.Hydr.Div.,ASCE 92(3),51–64.
ASCE Task Force on Flow and Transport Over Dunes. (2002).Flow and transport over dunes. J. Hydr. Engng. 128(8), 726–728.
Bennett, S.J., Best, J.L. (1995). Mean flow and turbulencestructure over fixed, two-dimensional dunes: Implications forsediment transport and bedform stability. Sedimentology 42,491–513.
Coleman, N.L. (1981). Velocity profiles with suspended sedi-ment. J. Hydr. Res. 19(3), 211–229.
Coleman, N.L. (1986). Effects of suspended sediment on theopen-channel velocity distribution. Water Resources Research22(10), 1377–1384.
Einstein, H.A., Chien, N. (1955). Effects of heavy sedimentconcentration near the bed on velocity and sediment distri-bution. Report 8. U.S. Army Corps of Engineers, MissouriRiver Division, University of California, Berkley, California.
Engel, P. (1981). Length of flow separation over dunes. J. Hydr.Div., ASCE 107(10), 1133–1143.
Fedele, J.J., Garcia, M.H. (2001). Alluvial roughness in streamswith dunes: A boundary-layer approach. In River, Coastal,and Estuarine Morphodynamics, G. Seminara, P. Blondeaux(eds.), Springer, Berlin, pp. 37–60.
Fredsoe, J. (1982). Shape and dimensions of stationary dunes inrivers. J. Hydr. Div., ASCE 108(HY8), 932–947.
Garcia, M.H. (1999). Sedimentation and erosion hydraulics. InHydraulic Design Handbook, L.W. Mays (ed.), McGraw-Hill,New York, pp. 6.1–6.113.
Gelfenbaum, G., Smith, J.D. (1986). Experimental evalua-tion of a generalized suspended-sediment transport theory.In Shelf Sands and Sandstones, R.J. Knight, J.R. McLean(eds.), Canadian Society of Petroleum Geologists, Calgary,pp. 133–144.
Graf, W.H. (1971). Hydraulics of Sediment Transport. McGraw-Hill, New York.
Helsel, D.R., Hirsch, R.M. (1992). Statistical Methods in WaterResources. Elsevier, Amsterdam NL.
Holmes, R.R., Jr. (2003). Vertical velocity distributions in sand-bed alluvial rivers. PhD Dissertation, University of Illinois,Urbana-Champaign.
Jordan, P.R. (1965). Fluvial sediment of the mississippi riverat St. Louis, Missouri. U.S. Geological Survey Water-SupplyPaper 1802.
Julien, P.Y. (1995). Erosion and Sedimentation. CambridgeUniversity Press, Cambridge UK.
Karim, F. (1999). Bed-form geometry in sand-bed flows. J. Hydr.Engng. 125(12), 1253–1261.
Kennedy, J.F. (1963). The mechanics of dunes and antidunes inerodible-bed channels. J. Fluid Mech. 16, 521–544.
Kostaschuk, R., Villard, P. (1996). Flow and sediment trans-port over large subaqueous dunes: Fraser river, Canada.Sedimentology 43, 849–863.

Journal of Hydraulic Research Vol. 46, No. 3 (2008) Flow over bedforms in a large sand-bed river: A field investigation 333
Lyn, D.A. (1993). Turbulence measurements in open-channelflows over artificial bed forms. J. Hydr. Engng. 119(3), 306–326.
Nelson, J.M., Smith, J.D. (1989). Mechanics of flow over ripplesand dunes. J. Geophysical Res. 94(C6), 8146–8162.
Nelson, J.M., McLean, S.R., Wolfe, S.R. (1993). Mean flowand turbulence fields over two-dimensional bed forms. WaterResources Res. 29, 3935–3953.
Nezu, I., Rodi, W. (1986). Open-channel flow measurements witha laser doppler anemometer. J. Hydr. Engng. 112(5), 335–355.
Nezu, I., Nakagawa, H. (1993). Turbulence in Open-ChannelFlows. IAHR Monograph Series. Balkema Rotterdam NL.
Prandtl, L. (1904). Über Flüssigkeitsbewegung bei sehr kleinerReibung. Proc. 3rd Intl. Congress of Mathematics, Heidelberg,pp. 484–491.
Rouse, H., Ince, S. (1963). History of Hydraulics. Dover,New York.
Schlichting, H. (1979). Boundary-Layer Theory, 7th ed.McGraw-Hill, New York.
Shen, H.W., Mellema, W.J., Harrison, A.S. (1978). Temperatureand Missouri river stages near Omaha. J. Hydr. Div., ASCE104(1), 1–20.
Simons, D.B., Richardson, E.V., Nordin, C.F. (1965). Sed-imentary structures generated by flow in alluvial channels.American Assoc. Petroleum Geologists, Special Publication12. AAPG, Tulsa, OK.
Smith, J.D., McLean, S.R. (1977). Spatially averaged flow overa wavy surface. J. Geophysical Res. 82(12), 1735–1746.
van Rijn, L.C. (1984). Sediment transport III: Bed forms andalluvial roughness. J. Hydr. Engng. 110(12), 1733–1754.
Vanoni, V.A. (1946). Transportation of suspended sediment bywater. Trans. ASCE 111, 67–133.
Vanoni, V.A. (1975). Sedimentation Engineering. Manual 54.ASCE, New York.
Yalin, M.S. (1964). Geometrical properties of sand waves.J. Hydr. Div., ASCE 90(5), 105–120.
Yen, B.C. (1992). Hydraulic resistance in open channels. InChannel Flow Resistance: Centennial of Manning’s Formula,B.C. Yen, (ed.), Water Resources Publications, Littleton Co.,pp. 1–135.