influence of group on individual subject maps in spm … · michael am, evans e and moore gj (2016)...
TRANSCRIPT
TECHNOLOGY REPORTpublished: 02 December 2016doi: 10.3389/fnins.2016.00522
Frontiers in Neuroscience | www.frontiersin.org 1 December 2016 | Volume 10 | Article 522
Edited by:
Xi-Nian Zuo,
Chinese Academy of Sciences, China
Reviewed by:
Pedro Antonio Valdés Hernández,
Cuban Neuroscience Center, Cuba
Baxter P. Rogers,
Vanderbilt University, USA
*Correspondence:
Andrew M. Michael
Specialty section:
This article was submitted to
Brain Imaging Methods,
a section of the journal
Frontiers in Neuroscience
Received: 24 February 2016
Accepted: 28 October 2016
Published: 02 December 2016
Citation:
Michael AM, Evans E and Moore GJ
(2016) Influence of Group on Individual
Subject Maps in SPM Voxel Based
Morphometry.
Front. Neurosci. 10:522.
doi: 10.3389/fnins.2016.00522
Influence of Group on IndividualSubject Maps in SPM Voxel BasedMorphometryAndrew M. Michael 1, 2*, Eli Evans 1 and Gregory J. Moore 1, 3
1 Autism & Developmental Medicine Institute, Geisinger Health System, Lewisburg, PA, USA, 2 Institute for Advanced
Applications, Geisinger Health System, Danville, PA, USA, 3Department of Radiology, Geisinger Health System, Danville, PA,
USA
Voxel based morphometry (VBM) is a widely utilized neuroimaging technique for spatially
normalizing brain structural MRI (sMRI) onto a common template. The DARTEL technique
of VBM takes into account the spatial intensity distribution of sMRIs to construct a
study specific group template. The group template is then used to create final individual
normalized tissuemaps (FINTM) for each subject in the group. In this study, we investigate
the effect of group on FINTM, i.e., we evaluate the variability of a constant subject’s FINTM
when other subjects in the group are iteratively changed.We examine this variability under
the following scenarios: (1) when the demographics of the iterative groups are similar, (2)
when the average age of the iterative groups is increased, and (3) when the number
of subjects with a brain disorder (here we use subjects with autism) is increased. Our
results show that when subject demographics of the group remains similar the mean
standard deviation (SD) of FINTM gray matter (GM) of the constant subject was around
0.01. As the average age of the group is increased, mean SD of GM increased to around
0.03 and at certain brain locations variability was as high as 0.23. A similar increase in
variability was observed when the number of autism subjects in the group was increased
where mean SD was around 0.02. Further, we find that autism vs. control GM differences
are in the range of −0.05 to +0.05 for more than 97% of the voxels and note that the
magnitude of the differences are comparable to GM variability. Finally, we report that
opting not to modulate during normalization or increasing the size of the smoothing kernel
can decrease FINTM variability but at the loss of subject-specific features. Based on the
findings of this study, we outline precautions that should be considered by investigators
to reduce the impact of group on FINTM and thereby derive more meaningful group
differences when comparing two cohorts of subjects.
Keywords: structural MRI preprocessing, SPM DARTEL, SPM VBM, spatial normalization, influence of group
INTRODUCTION
Voxel Based Morphometry (VBM) in SPM is an industry leading tool applied to preprocessstructural MRI (sMRI) of the brain (Ashburner and Friston, 2000). VBM registers sMRIs ofdifferent subjects to a common template through spatial normalization. Spatial normalizationenables users to make inter-subject comparisons between brains that have different geometricshapes and topography in their native space. Group level analyses are made by examining brain
Michael et al. Variability of VBM Group Registration
tissue map concentrations that are derived from VBM. VBM hasthe option of computing a study specific group template throughDiffeomorphic Anatomical Registration using ExponentiatedLie algebra (DARTEL; Ashburner, 2007). Each subject’s sMRIis then normalized to the study specific template beforeperforming group analyses. Here, we investigate the effect ofgroup composition on final individual normalized tissue maps(FINTM) that are constructed from the group template.
VBM has been widely applied in neuroimaging studies and indiverse subject populations. For example, VBM has been usedto track cerebellar degeneration in Alzheimer’s disease (Collobyand Taylor, 2014) and to map gray matter atrophy in Lewybody dementia (Watson et al., 2012). VBM has been utilized todetect group differences in brain structure in autism spectrumdisorder (Abell et al., 1999; Calderoni et al., 2012; Riva et al.,2013), pervasive developmental disorder (Kosaka et al., 2010),epilepsy (Keller and Roberts, 2008), and schizophrenia (Honeaet al., 2005; Asami et al., 2012). Imaging genetics studies havealso made use of VBM DARTEL to study 22q11.2 deletion inchildren (Campbell et al., 2006). Because VBM provides effectivenormalization techniques, it has become a popular method formaking group level volumetric comparisons of brain tissues evenin heterogeneous populations.
Our motivation to examine the accuracy of VBM DARTEL’sstudy specific template is the outcome of a serendipitousfinding while preprocessing a set of sMRIs that accidentallyincluded a “phantom” (a calibration device) image. The imageof the phantom, when preprocessed using VBM with otherbrain sMRIs, went through normalization successfully. Afterpreprocessing, we observed that the normalized image of thenon-brain phantom had taken on “brain-like” topography. Thismade us question how the inclusion of this phantom may haveinfluenced the FINTMs of other brain sMRIs. We removedthe phantom and re-ran all of the sMRIs and found that theFINTMs this time were different from their counterparts in theprevious run. This inspired us to remove more brain sMRIsand examine the effect on the remaining subjects. Again we sawchanges in FINTM voxel values. From this finding we were led toexamine the phenomenon of FINTMs being altered as a functionof the other subjects present in the group. In this project, weexamine the effect of group on FINTM using a set of structuredexperiments.
Previous studies have examined the effect of variations indemographics and image acquisition methods on VBM results.VBM differences based on scanner (Focke et al., 2011), andhow these scanner-based differences were affected by the groupgender composition (Takao et al., 2014) have been reportedpreviously. Takao et al. reported that gender composition (ratioof males to females) between different scanner sites can result invarying FINTMs, but it is unclear if the variability in FINTMwas caused by scanner differences or gender composition.Results of the above studies were based on multisite data withheterogeneous subject demographics and their focus was not onevaluating the effects of group composition on FINTM.
Other VBM studies have looked at the importance of selectingappropriate VBM parameters. VBM parameters that have beeninvestigated include size of smoothing kernel, type of atlas used,
modulation, and the number of subjects in the group. García-Vázquez et al. (2008) examined the effects of different smoothingkernel sizes and group size on the ability to detect atrophy. Alater study recommended a smoothing kernel of 6 mm for groupswith 50 participants and 8–10mm for groups with 25 participants(Shen and Sterr, 2013). They concluded that parameter selectionchanged the significance of the voxels while using the same groupof subjects (Shen and Sterr, 2013). In addition, the effects ofmodulation were demonstrated inWilliams Syndrome where theshape of the hypothalamus and orbitofrontal gray matter regionswere dependent on whether the data was modulated or not(Eckert et al., 2006). The above studies indicate the importance ofpaying close attention to the parameters used while preprocessingsMRIs using VBM.
However, previous studies do not address how overall subjectcomposition of the group affects FINTMs when FINTMs areconstructed using a study specific template. Previous studies donot answer the question of “can the FINTMof a particular subjectchange if that subject is preprocessed with different groups ofsubjects?” In this study, we address this question by investigatinghow FINTMs of subjects that are held constant (henceforthconstant subject) change when they are preprocessed with varyinggroups of subject compositions. The answer to the above questionis important as alterations of FINTM as a function of the groupcan affect post processing analyses that use FINTM, especiallyanalyses of group differences between two cohorts of subjects.
Using real sMRI data and a set of systematic experiments wetest the influence of group on the FINTM of constant subjects.In Experiment 1, we investigate the effects of changing groupswhen the demographics of the groups are not substantiallydifferent. Experiment 1 serves as a baseline or “gold standard”to quantify the variability of FINTM when group compositionsbetween runs are not considerably different demographically.We then compare the variability of Experiment 1 with FINTMchanges when group compositions are more heterogeneous. InExperiment 2, we investigate the effects of changing the group bywidening the age range of the subject pool at each preprocessingrun. In Experiment 3, we examine the effects of altering theratio of the number of autism spectrum disorder (ASD) patientsand typically developing controls (TDC). This experiment issimilar to Experiment 2, however, group composition is variedwith respect to diagnosis rather than age. In Experiment 4, wecompare ASD vs. TDC FINTM differences of all ASD and TDCsubjects in our sample and through Experiment 4 we aim tocompare the variability of a constant subject’s FINTM with ASDvs. TDC differences. Experiments 5 and 6 examine the effectof modulation and spatial smoothing on FINTMs of constantsubjects.
METHODS
VBM-DARTELThe final outputs of VBM are spatially normalized subject specifictissue maps. We refer to these maps as FINTMs. VBM segmentssMRI into three primary tissue concentration maps: gray matter(GM), white matter (WM), and cerebrospinal fluid (CSF).VBM performs this segmentation by first affine transforming
Frontiers in Neuroscience | www.frontiersin.org 2 December 2016 | Volume 10 | Article 522
Michael et al. Variability of VBM Group Registration
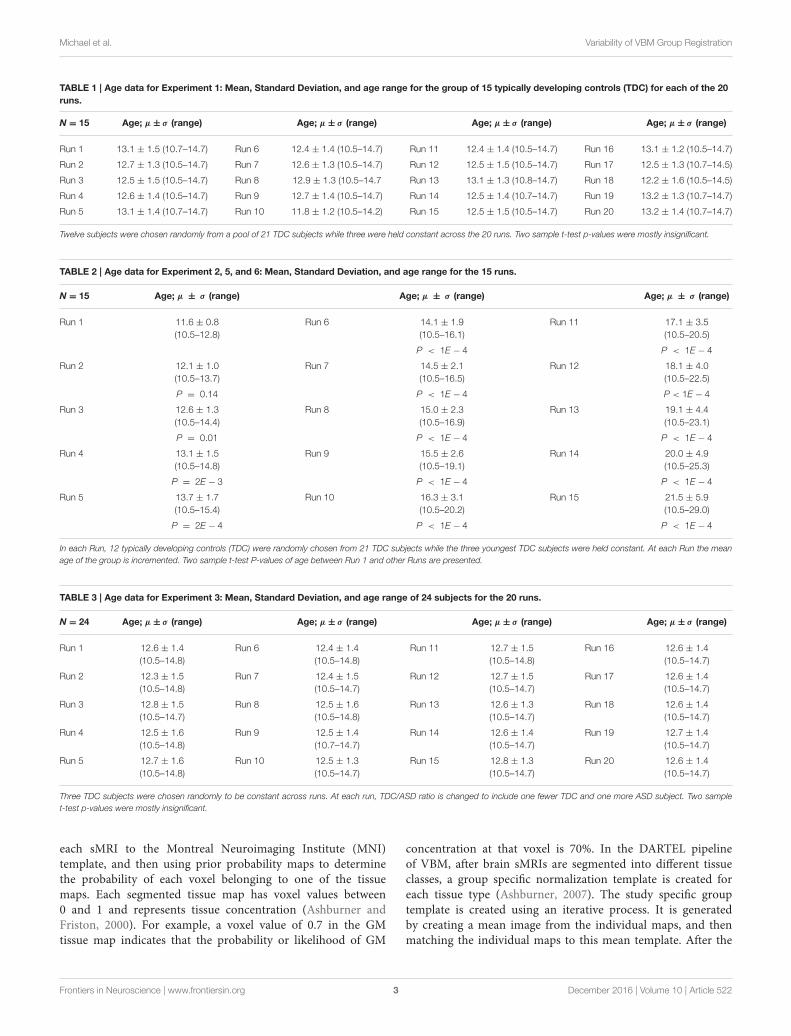
TABLE 1 | Age data for Experiment 1: Mean, Standard Deviation, and age range for the group of 15 typically developing controls (TDC) for each of the 20
runs.
N = 15 Age; µ ± σ (range) Age; µ ± σ (range) Age; µ ± σ (range) Age; µ ± σ (range)
Run 1 13.1 ± 1.5 (10.7–14.7) Run 6 12.4 ± 1.4 (10.5–14.7) Run 11 12.4 ± 1.4 (10.5–14.7) Run 16 13.1 ± 1.2 (10.5–14.7)
Run 2 12.7 ± 1.3 (10.5–14.7) Run 7 12.6 ± 1.3 (10.5–14.7) Run 12 12.5 ± 1.5 (10.5–14.7) Run 17 12.5 ± 1.3 (10.7–14.5)
Run 3 12.5 ± 1.5 (10.5–14.7) Run 8 12.9 ± 1.3 (10.5–14.7 Run 13 13.1 ± 1.3 (10.8–14.7) Run 18 12.2 ± 1.6 (10.5–14.5)
Run 4 12.6 ± 1.4 (10.5–14.7) Run 9 12.7 ± 1.4 (10.5–14.7) Run 14 12.5 ± 1.4 (10.7–14.7) Run 19 13.2 ± 1.3 (10.7–14.7)
Run 5 13.1 ± 1.4 (10.7–14.7) Run 10 11.8 ± 1.2 (10.5–14.2) Run 15 12.5 ± 1.5 (10.5–14.7) Run 20 13.2 ± 1.4 (10.7–14.7)
Twelve subjects were chosen randomly from a pool of 21 TDC subjects while three were held constant across the 20 runs. Two sample t-test p-values were mostly insignificant.
TABLE 2 | Age data for Experiment 2, 5, and 6: Mean, Standard Deviation, and age range for the 15 runs.
N = 15 Age; µ ± σ (range) Age; µ ± σ (range) Age; µ ± σ (range)
Run 1 11.6 ± 0.8
(10.5–12.8)
Run 6 14.1 ± 1.9
(10.5–16.1)
Run 11 17.1 ± 3.5
(10.5–20.5)
P < 1E − 4 P < 1E − 4
Run 2 12.1 ± 1.0
(10.5–13.7)
Run 7 14.5 ± 2.1
(10.5–16.5)
Run 12 18.1 ± 4.0
(10.5–22.5)
P = 0.14 P < 1E − 4 P < 1E − 4
Run 3 12.6 ± 1.3
(10.5–14.4)
Run 8 15.0 ± 2.3
(10.5–16.9)
Run 13 19.1 ± 4.4
(10.5–23.1)
P = 0.01 P < 1E − 4 P < 1E − 4
Run 4 13.1 ± 1.5
(10.5–14.8)
Run 9 15.5 ± 2.6
(10.5–19.1)
Run 14 20.0 ± 4.9
(10.5–25.3)
P = 2E − 3 P < 1E − 4 P < 1E − 4
Run 5 13.7 ± 1.7
(10.5–15.4)
Run 10 16.3 ± 3.1
(10.5–20.2)
Run 15 21.5 ± 5.9
(10.5–29.0)
P = 2E − 4 P < 1E − 4 P < 1E − 4
In each Run, 12 typically developing controls (TDC) were randomly chosen from 21 TDC subjects while the three youngest TDC subjects were held constant. At each Run the mean
age of the group is incremented. Two sample t-test P-values of age between Run 1 and other Runs are presented.
TABLE 3 | Age data for Experiment 3: Mean, Standard Deviation, and age range of 24 subjects for the 20 runs.
N = 24 Age; µ ± σ (range) Age; µ ± σ (range) Age; µ ± σ (range) Age; µ ± σ (range)
Run 1 12.6 ± 1.4
(10.5–14.8)
Run 6 12.4 ± 1.4
(10.5–14.8)
Run 11 12.7 ± 1.5
(10.5–14.8)
Run 16 12.6 ± 1.4
(10.5–14.7)
Run 2 12.3 ± 1.5
(10.5–14.8)
Run 7 12.4 ± 1.5
(10.5–14.7)
Run 12 12.7 ± 1.5
(10.5–14.7)
Run 17 12.6 ± 1.4
(10.5–14.7)
Run 3 12.8 ± 1.5
(10.5–14.7)
Run 8 12.5 ± 1.6
(10.5–14.8)
Run 13 12.6 ± 1.3
(10.5–14.7)
Run 18 12.6 ± 1.4
(10.5–14.7)
Run 4 12.5 ± 1.6
(10.5–14.8)
Run 9 12.5 ± 1.4
(10.7–14.7)
Run 14 12.6 ± 1.4
(10.5–14.7)
Run 19 12.7 ± 1.4
(10.5–14.7)
Run 5 12.7 ± 1.6
(10.5–14.8)
Run 10 12.5 ± 1.3
(10.5–14.7)
Run 15 12.8 ± 1.3
(10.5–14.7)
Run 20 12.6 ± 1.4
(10.5–14.7)
Three TDC subjects were chosen randomly to be constant across runs. At each run, TDC/ASD ratio is changed to include one fewer TDC and one more ASD subject. Two sample
t-test p-values were mostly insignificant.
each sMRI to the Montreal Neuroimaging Institute (MNI)template, and then using prior probability maps to determinethe probability of each voxel belonging to one of the tissuemaps. Each segmented tissue map has voxel values between0 and 1 and represents tissue concentration (Ashburner andFriston, 2000). For example, a voxel value of 0.7 in the GMtissue map indicates that the probability or likelihood of GM
concentration at that voxel is 70%. In the DARTEL pipelineof VBM, after brain sMRIs are segmented into different tissueclasses, a group specific normalization template is created foreach tissue type (Ashburner, 2007). The study specific grouptemplate is created using an iterative process. It is generatedby creating a mean image from the individual maps, and thenmatching the individual maps to this mean template. After the
Frontiers in Neuroscience | www.frontiersin.org 3 December 2016 | Volume 10 | Article 522

Michael et al. Variability of VBM Group Registration
individual images are morphed to match the group template,a new template is generated as a mean of the new images.This process is repeated for a set number of runs creatinga progressively crisper template. The GM and WM imagesare then normalized to the final template. As such, the finaltemplate that is created using the above averaging mechanismis a function of the tissue maps that were used to createit. A voxel concentration modulation is performed (except inExperiment 5) to preserve the amount of tissue content. Duringmodulation each voxel concentration is scaled by the amountof expansion or contraction of that voxel that occurred duringspatial normalization. The normalized images are then smoothedusing a Gaussian kernel to increase the signal to noise ratio bydecreasing the effects of small errors in registration (Ashburner,2007). Gaussian kernel smoothing also approximates tissue voxelconcentrations to a normal distribution (Ashburner, 2007).
SubjectsMRI images used in this study were downloaded from theAutism Brain Imaging Data Exchange (ABIDE), a multisiteonline database of brain images from subjects with autism and
typically developing controls (http://fcon_1000.projects.nitrc.org/indi/abide/; Di Martino et al., 2014). For all experimentswe used T1-weighted sMRIs of male subjects scanned on aSiemensMagnetomVerio 3T scanner at the NewYorkUniversity(NYU) Langone Medical Center. SMRIs used in this study hadthe following pulse sequence parameters: TR = 2530ms, TE =
3.25ms, bandwidth = 200Hz/Px, flip angle = 70, echo spacing= 7.4ms, slice thickness = 1.33mm, voxel size = 1.3 × 1.0 ×
1.3mm, field of view= 256mm, and base resolution= 256mm.Subjects were selected from a single site (NYU) to reduce the
effects of scanner and acquisition variability present across sitesof the ABIDE dataset. This removes the possibility of FINTMvariability that can be attributed to scanner and imaging protocoldifferences affecting the group template and focuses on FINTMvariability due to just subject variability in group composition.In addition, to remove variability added by gender, only malesubjects were picked for the experiments presented in this study.Among the ABIDE sites, NYU was chosen since it had thelargest number of subjects. Evaluation of image quality wasperformed through visual inspection of each image. Images withmotion (ghosting and smearing), susceptibility and homogeneity
FIGURE 1 | FINTM variability when preprocessed in groups with similar demographics (Experiment 1). (A) GM concentration variability of a constant subject
across multiple runs; mean value is depicted in black and standard deviation in red. Mean GM concentrations are in ascending order and voxel indices are at intervals
of 100. (B) The overall distribution of GM concentration variability. (C) Brain map of GM concentration variability (standard deviation).
Frontiers in Neuroscience | www.frontiersin.org 4 December 2016 | Volume 10 | Article 522
Michael et al. Variability of VBM Group Registration
artifacts were removed from further analysis. ASD and TDCsubjects were pairwise chosen to match age as close as possible.Our pool of subjects consisted of 24 TDC and 24 ASD subjects(age range TDC: 10.5–14.8 years, ASD: 10.5–14.7 years; meanage ± SD TDC: 12.52 ± 1.45 years, for ASD: 12.54 ± 1.45years; t-val = 0.06; p-val = 0.95). Subjects for Experiment 1, 3,and 4 were drawn from the above pool of subjects. In Experiment2, because the effects of increasing age are investigated, inaddition to the above pool, TDCs between 11 and 29 yearswere also included. Experiments 5 and 6 are extensions ofExperiment 2. Further details on subject ages are provided in theExperiments Section.
PreprocessingImages were preprocessed according to the guidelines,parameters and templates recommended in the VBM tutorial(Ashburner, 2010) except for the smoothing kernel, whichwas kept at 6mm to improve the accuracy of DARTEL forregistration and normalization. A 6mm kernel is recommendedto more accurately detect changes (Shen and Sterr, 2013). The8 mm smoothing kernel recommended by the VBM tutorialwas used in Experiment 6 to compare the effects of increasing
age group on FINTM with varying smoothing kernels. Imageswere segmented into GM, WM, and CSF tissue maps using priorprobability maps included with SPM8 for tissue classification.The maps were then spatially normalized, modulated (except inExperiment 5), and then smoothed.
ExperimentsThemain aim of this paper is to investigate how constant subjects’FINTMs vary when the groups in which they are preprocessedare iteratively changed. Our analyses are focused on changesof GM FINTM. We focused only on FINTM voxel locationswith GM concentrations above a threshold of 0.1. As voxelslocations with <0.1 GM concentrations have <10% GM contentthose voxels were not included for further analysis. In eachexperiment we iteratively and randomly subsampled a group ofsubjects. In each group run, three subjects were held constantand an evaluation of the variability across runs was done viathe standard deviation (SD) of GM concentration. We report themean and SD of GM concentration across all runs for each of thethree constant subjects. We also report the overall distributionof GM SD and display the SD of GM concentration ona brain map.
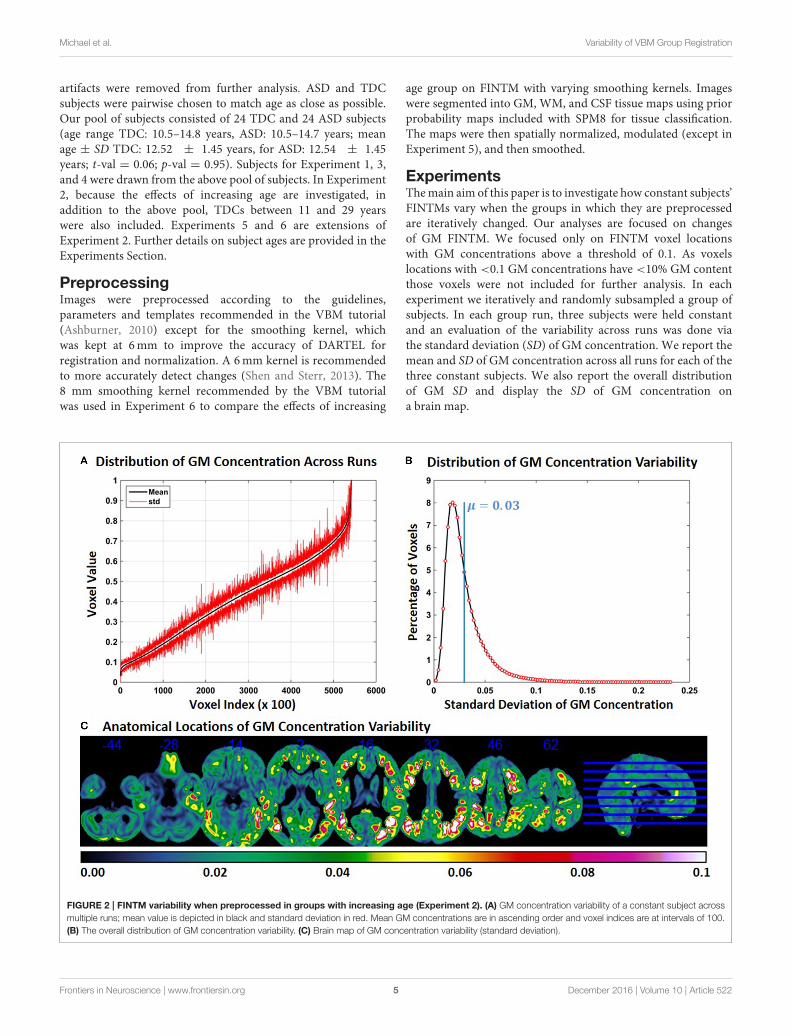
FIGURE 2 | FINTM variability when preprocessed in groups with increasing age (Experiment 2). (A) GM concentration variability of a constant subject across
multiple runs; mean value is depicted in black and standard deviation in red. Mean GM concentrations are in ascending order and voxel indices are at intervals of 100.
(B) The overall distribution of GM concentration variability. (C) Brain map of GM concentration variability (standard deviation).
Frontiers in Neuroscience | www.frontiersin.org 5 December 2016 | Volume 10 | Article 522

Michael et al. Variability of VBM Group Registration
Experiment 1: FINTM Variability When Preprocessed
in Groups with Similar DemographicsThe purpose of Experiment 1 is to investigate how FINTMsof constant subjects change when the group demographics aresimilar between runs. We randomly picked three TDCs from ourpool of 24 TDCs and these three TDCs were kept as constantsubjects between runs. In each run we randomly picked anadditional 12 TDCs from the remaining 21 TDCs, added these12 TDCs to the three constant TDCs and preprocessed a totalnumber of 15 TDCs. The 12 subjects that changed with eachrun had an age range of 10.46–14.79 years with a mean ageof 12.52 years. Age information for each of the 20 runs isprovided in Table 1. Two sample t-tests between subject agesacross all combinations of runs were mostly (>96%) statisticallyinsignificant.
Experiment 2: FINTM Variability When Preprocessed
in Groups with Increasing AgeThe purpose of Experiment 2 is to check for changes in constantsubjects’ FINTM while the mean age of the group is increased.Here our null hypothesis H0 is that “compared to the variability
of Experiment 1 there is no significant increase in variability.”We repeatedly processed sMRI, holding the youngest three TDCsconstant and changing the 12 TDCs for 15 different runs. Only 15runs were used in this experiment due to the limited number ofTDCs available at higher ages. The 12 TDCs that were changed ineach runwere selected using a sliding window across age, with theyounger three TDCs from the group of 12 being removed and thenext three oldest being added. The age range of Run 1 was 10.46–12.81 years and of Run 15 was 10.46–29.02 years. Two samplet-tests between the subject age of Run 1 and the subject age ofall other runs (except Run 2) were statistically significant. Notethat for this Experiment we deliberately increased the mean ageof each group. Age information for the 15 runs and P-values oftwo sample t-test difference from Run 1 are provided in Table 2.
Experiment 3: FINTM Variability When Preprocessed
in Groups with Increasing ASD/TDC RatioIn this Experiment, we examine how ASD/TDC ratio affects theFINTMs. Here again our null hypothesis H0 is that “comparedto the variability of Experiment 1 there is no significant increasein variability.” We repeated a process similar to Experiments 1
FIGURE 3 | FINTM variability when preprocessed in groups with increasing ASD/TDC ratio (Experiment 3). (A) GM concentration variability of a constant
subject across multiple runs; mean value is depicted in black and standard deviation in red. Mean GM concentrations are in ascending order and voxel indices are at
intervals of 100. (B) The overall distribution of GM concentration variability. (C) Brain map of GM concentration variability (standard deviation).
Frontiers in Neuroscience | www.frontiersin.org 6 December 2016 | Volume 10 | Article 522
Michael et al. Variability of VBM Group Registration
and 2 by holding three randomly chosen TDCs constant andchanging 21 other subjects at each run. For the first run, of the21 subjects not held constant, 20 were TDC and 1 ASD. Foreach subsequent run, one TDC was randomly removed and oneage matched ASD was added from the original ASD pool of 24subjects. Age information for the 20 runs are provided in Table 3.Age differences for all of the runs were statistically insignificant.
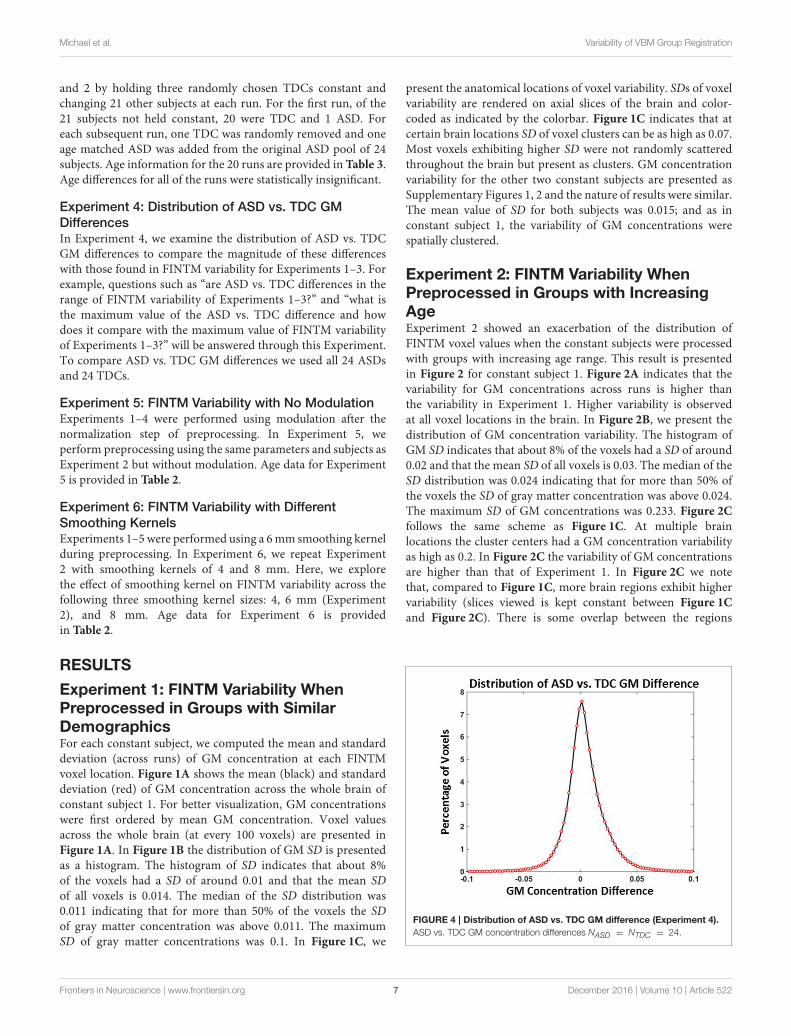
Experiment 4: Distribution of ASD vs. TDC GM
DifferencesIn Experiment 4, we examine the distribution of ASD vs. TDCGM differences to compare the magnitude of these differenceswith those found in FINTM variability for Experiments 1–3. Forexample, questions such as “are ASD vs. TDC differences in therange of FINTM variability of Experiments 1–3?” and “what isthe maximum value of the ASD vs. TDC difference and howdoes it compare with the maximum value of FINTM variabilityof Experiments 1–3?” will be answered through this Experiment.To compare ASD vs. TDC GM differences we used all 24 ASDsand 24 TDCs.
Experiment 5: FINTM Variability with No ModulationExperiments 1–4 were performed using modulation after thenormalization step of preprocessing. In Experiment 5, weperform preprocessing using the same parameters and subjects asExperiment 2 but without modulation. Age data for Experiment5 is provided in Table 2.
Experiment 6: FINTM Variability with Different
Smoothing KernelsExperiments 1–5 were performed using a 6mm smoothing kernelduring preprocessing. In Experiment 6, we repeat Experiment2 with smoothing kernels of 4 and 8 mm. Here, we explorethe effect of smoothing kernel on FINTM variability across thefollowing three smoothing kernel sizes: 4, 6 mm (Experiment2), and 8 mm. Age data for Experiment 6 is providedin Table 2.
RESULTS
Experiment 1: FINTM Variability WhenPreprocessed in Groups with SimilarDemographicsFor each constant subject, we computed the mean and standarddeviation (across runs) of GM concentration at each FINTMvoxel location. Figure 1A shows the mean (black) and standarddeviation (red) of GM concentration across the whole brain ofconstant subject 1. For better visualization, GM concentrationswere first ordered by mean GM concentration. Voxel valuesacross the whole brain (at every 100 voxels) are presented inFigure 1A. In Figure 1B the distribution of GM SD is presentedas a histogram. The histogram of SD indicates that about 8%of the voxels had a SD of around 0.01 and that the mean SDof all voxels is 0.014. The median of the SD distribution was0.011 indicating that for more than 50% of the voxels the SDof gray matter concentration was above 0.011. The maximumSD of gray matter concentrations was 0.1. In Figure 1C, we
present the anatomical locations of voxel variability. SDs of voxelvariability are rendered on axial slices of the brain and color-coded as indicated by the colorbar. Figure 1C indicates that atcertain brain locations SD of voxel clusters can be as high as 0.07.Most voxels exhibiting higher SD were not randomly scatteredthroughout the brain but present as clusters. GM concentrationvariability for the other two constant subjects are presented asSupplementary Figures 1, 2 and the nature of results were similar.The mean value of SD for both subjects was 0.015; and as inconstant subject 1, the variability of GM concentrations werespatially clustered.
Experiment 2: FINTM Variability WhenPreprocessed in Groups with IncreasingAgeExperiment 2 showed an exacerbation of the distribution ofFINTM voxel values when the constant subjects were processedwith groups with increasing age range. This result is presentedin Figure 2 for constant subject 1. Figure 2A indicates that thevariability for GM concentrations across runs is higher thanthe variability in Experiment 1. Higher variability is observedat all voxel locations in the brain. In Figure 2B, we present thedistribution of GM concentration variability. The histogram ofGM SD indicates that about 8% of the voxels had a SD of around0.02 and that the mean SD of all voxels is 0.03. The median of theSD distribution was 0.024 indicating that for more than 50% ofthe voxels the SD of gray matter concentration was above 0.024.The maximum SD of GM concentrations was 0.233. Figure 2Cfollows the same scheme as Figure 1C. At multiple brainlocations the cluster centers had a GM concentration variabilityas high as 0.2. In Figure 2C the variability of GM concentrationsare higher than that of Experiment 1. In Figure 2C we notethat, compared to Figure 1C, more brain regions exhibit highervariability (slices viewed is kept constant between Figure 1C
and Figure 2C). There is some overlap between the regions
FIGURE 4 | Distribution of ASD vs. TDC GM difference (Experiment 4).
ASD vs. TDC GM concentration differences NASD = NTDC = 24.
Frontiers in Neuroscience | www.frontiersin.org 7 December 2016 | Volume 10 | Article 522

Michael et al. Variability of VBM Group Registration
of Figure 1C and Figure 2C; but most of the high variabilityregions in Figure 2C were not present in Figure 1C. We checkedfor the consistency of this result by examining the other twoconstant subjects and noted similar findings. The mean valueof SD for constant subjects 2 and 3 were 0.026 and 0.029,respectively. GM concentration variability maps of constantsubjects 2 and 3 are provided as Supplementary Figures 3, 4respectively.
Experiment 3: FINTM Variability WhenPreprocessed in Groups with IncreasingASD/TDC RatioCompared to Experiment 1, GM concentration variability inExperiment 3 was higher, but variability was less compared toExperiment 2. Figure 3A shows the SD of GM concentrationfor constant subject 1 for brain voxels across the whole brain.In Figure 3B the distribution of GM concentration variabilityis presented as a histogram. The histogram of the SD indicatesthat about 11% of the voxels had a SD of around 0.012and that the mean SD of all voxels is 0.021. The median ofthe SD distribution was 0.017 indicating that for more than
50% of the voxels the SD of gray matter concentration wasabove 0.017. The maximum SD of gray matter concentrationswas 0.21. At multiple brain locations, the cluster centers hada GM concentration variability as high as 0.15. Figure 3C
shows brain locations with corresponding GM concentrationvariability. Compared to Figure 2C, regions with variability areless widespread, but more widespread than those in Figure 1C.There is some overlap between Figures 1C, 2C, 3C, but most ofthe regions do not overlap. GM concentration variability maps ofconstant subject 2 and 3 are provided as Supplementary Figures5 and 6.
Experiment 4: Distribution of TDC vs. ASDGM Concentration DifferencesDistribution of TDC vs. ASD GM concentration differenceswhen all 24 TDCs and 24 ASDs are used is provided inFigure 4 and the mean GM difference is around 0. Thenumber of voxels with a GM concentration difference >0.1or <−0.1 were <0.04%. The number of voxels with a GMconcentration difference >0.05 or <−0.05 were <2.3%. Theabove results indicate that TDC vs. ASD GM differences
FIGURE 5 | FINTM variability with no modulation (Experiment 5). (A) GM concentration variability of a constant subject across multiple runs; mean value is
depicted in black and standard deviation in red. Mean GM concentrations are in ascending order and voxel indices are at intervals of 100. (B) The overall distribution
of GM concentration variability. (C) Brain map of GM concentration variability (standard deviation).
Frontiers in Neuroscience | www.frontiersin.org 8 December 2016 | Volume 10 | Article 522

Michael et al. Variability of VBM Group Registration
are small and predominantly present in the −0.1 to 0.1range.
Experiment 5: FINTM Variability with NoModulationIn Experiment 5, we repeat Experiment 2 without modulating theGM concentrations. Compared to Experiment 2, the variabilityof GM concentration of constant subject 1 was slightly lower inExperiment 5. Mean and SD of GM concentration, distributionof GM concentration and brain locations of GM SD arepresented in Figure 5. The mean value of GM concentrationSD was 0.0262. When Figure 2C and Figure 5C are compared,we note that GM variability occurs at similar brain locations,but the magnitude of SD is generally higher in Figure 2C
indicating that modulation can increase GM concentrationvariability.
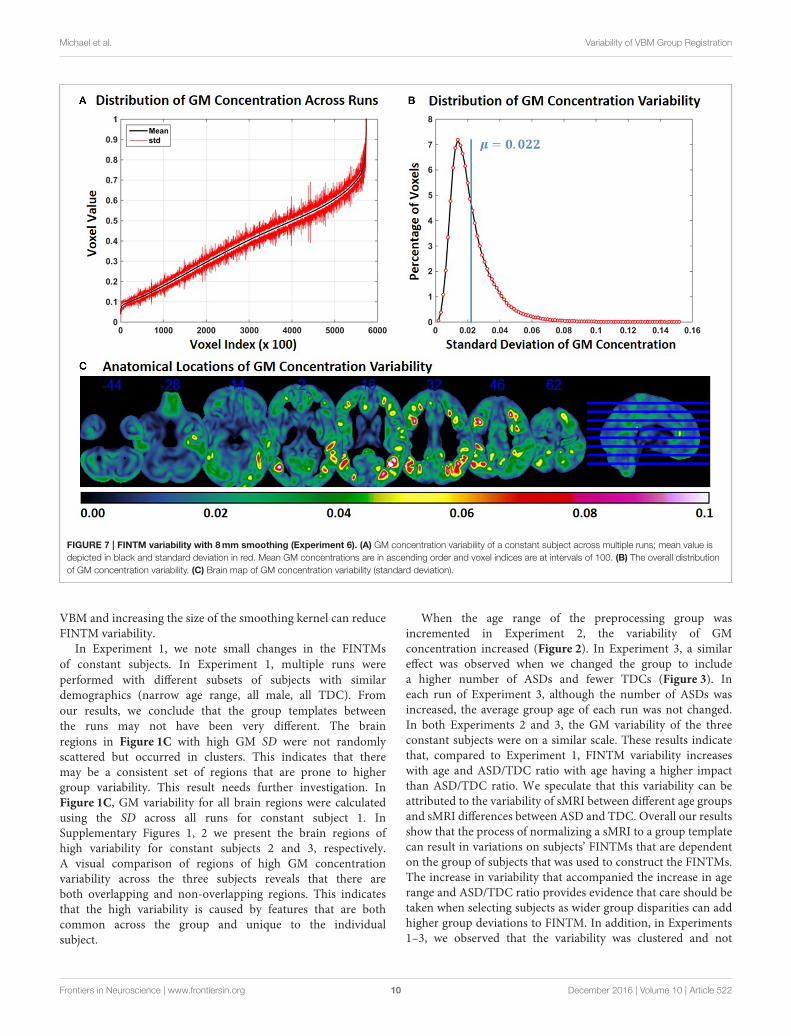
Experiment 6: FINTM Variability withDifferent Smoothing KernelsIn Experiment 6, we repeat Experiment 2 with 4 and 8mmsmoothing kernels (Experiment 2 was performed with asmoothing kernel of 6mm). Compared to Experiment
2, variability of GM concentration of constant subject 1was higher with 4mm smoothing and lower with 8mmsmoothing. Mean and SD of GM concentration, distributionof GM concentration and brain locations of GM SD for4 and 8mm smoothing are presented in Figures 6, 7
respectively. The mean value of GM concentration SDfor 4 and 8mm smoothing kernels was 0.042 and 0.022,respectively. Here, again, the GM variability occurred at similarbrain locations, for 4mm (Figure 6C), 6mm (Figure 2C),and 8mm (Figure 7C) smoothing, but the SD of GMconcentration variability decreased with higher smoothingkernel size.
DISCUSSION
Interpretation of ResultsIn Table 4, we present a summary of results for FINTM GMvariability across all experiments. Of the first three experiments,Experiment 2 (increasing age) showed the highest variability,followed by Experiment 3 (increasing ASD). The least variabilitywas observed in Experiment 1 where subject demographics weresimilar across runs. We also note that not modulating during
FIGURE 6 | FINTM variability with 4 mm smoothing (Experiment 6). (A) GM concentration variability of a constant subject across multiple runs; mean value is
depicted in black and standard deviation in red. Mean GM concentrations are in ascending order and voxel indices are at intervals of 100. (B) The overall distribution
of GM concentration variability. (C) Brain map of GM concentration variability (standard deviation).
Frontiers in Neuroscience | www.frontiersin.org 9 December 2016 | Volume 10 | Article 522
Michael et al. Variability of VBM Group Registration
FIGURE 7 | FINTM variability with 8mm smoothing (Experiment 6). (A) GM concentration variability of a constant subject across multiple runs; mean value is
depicted in black and standard deviation in red. Mean GM concentrations are in ascending order and voxel indices are at intervals of 100. (B) The overall distribution
of GM concentration variability. (C) Brain map of GM concentration variability (standard deviation).
VBM and increasing the size of the smoothing kernel can reduceFINTM variability.
In Experiment 1, we note small changes in the FINTMsof constant subjects. In Experiment 1, multiple runs wereperformed with different subsets of subjects with similardemographics (narrow age range, all male, all TDC). Fromour results, we conclude that the group templates betweenthe runs may not have been very different. The brainregions in Figure 1C with high GM SD were not randomlyscattered but occurred in clusters. This indicates that theremay be a consistent set of regions that are prone to highergroup variability. This result needs further investigation. InFigure 1C, GM variability for all brain regions were calculatedusing the SD across all runs for constant subject 1. InSupplementary Figures 1, 2 we present the brain regions ofhigh variability for constant subjects 2 and 3, respectively.A visual comparison of regions of high GM concentrationvariability across the three subjects reveals that there areboth overlapping and non-overlapping regions. This indicatesthat the high variability is caused by features that are bothcommon across the group and unique to the individualsubject.
When the age range of the preprocessing group wasincremented in Experiment 2, the variability of GMconcentration increased (Figure 2). In Experiment 3, a similareffect was observed when we changed the group to includea higher number of ASDs and fewer TDCs (Figure 3). Ineach run of Experiment 3, although the number of ASDs wasincreased, the average group age of each run was not changed.In both Experiments 2 and 3, the GM variability of the threeconstant subjects were on a similar scale. These results indicatethat, compared to Experiment 1, FINTM variability increaseswith age and ASD/TDC ratio with age having a higher impactthan ASD/TDC ratio. We speculate that this variability can beattributed to the variability of sMRI between different age groupsand sMRI differences between ASD and TDC. Overall our resultsshow that the process of normalizing a sMRI to a group templatecan result in variations on subjects’ FINTMs that are dependenton the group of subjects that was used to construct the FINTMs.The increase in variability that accompanied the increase in agerange and ASD/TDC ratio provides evidence that care should betaken when selecting subjects as wider group disparities can addhigher group deviations to FINTM. In addition, in Experiments1–3, we observed that the variability was clustered and not
Frontiers in Neuroscience | www.frontiersin.org 10 December 2016 | Volume 10 | Article 522

Michael et al. Variability of VBM Group Registration
TABLE 4 | Summary of FINTM GM variability results across the different experiments.
Experiment # Constant subject #1 Constant subject #2 Constant subject #3
Mean Median Max Mean Mean
1: Similar demographics 0.014 0.011 0.1 0.015 0.015
2: Increasing age 0.030 0.024 0.23 0.026 0.029
3: Increasing ASD 0.021 0.017 0.21 0.019 0.019
5: No modulation 0.026 0.021 0.21
6: 4 mm smoothing 0.042 0.033 0.34
8 mm smoothing 0.022 0.019 0.15
Experiments 1, 2, and 3 were performed with modulation and with a 6 mm smoothing kernel. Experiments 5 and 6 use the same experimental setup as Experiment 3 but uses no
modulation and different smoothing kernels, respectively.
randomly scattered as individual voxels. This result indicatesthat variability is present in large brain regions (on the order ofdozens of 1mm3 voxels) that are not consistent across subjects.Most of the FINTM variability was evident in the gyri and sulciof the cortex. Each cortical folding pattern represented by gyriand sulci is likely unique to each individual (Van Essen andDierker, 2007) and these subject specific patterns can be lostwhen FINTMs are derived from group templates.
In Experiment 4, the distribution of TDC vs. ASD GMconcentration differences were explored using all 24 ASD and24 TDC subjects. A histogram of GM group differences forExperiment 4 provides evidence that more than 99% of TDC vs.ASD differences GM concentrations are present between −0.1and +0.1 and more than 97% of differences are present between−0.05 and+0.05. In Experiment 2, we observed that themean SDof GM variability is 0.03 and can be as high as 0.233. The abovevalues indicate that the SD of GM variability of a constant subjectis comparable to the GM differences between two groups for>97% of the voxels. This result shows that voxels that are foundto have significant ASD vs. TDC differences may be impacted bygroup variability.
In Experiment 5, we compared unmodulated FINTMs tomodulated while age was increased across runs as in Experiment3. We found that the variability after modulation is highercompared to no modulation. Modulation uses warping measuresto correct for changes in volume based on the group template,and it is an additional processing step that will cause FINTM to beinfluenced by the group. Most VBM studies compare volumetricdifferences between groups and in such cases modulation is anecessary step to preserve volumetric changes that occur duringthe normalization step. But if comparing local GM volumes isnot the main research question, our results show that usingunmodulated GM concentrations is better as they will be lessaffected by the group.
Increasing the smoothing kernel decreased variability betweenruns for constant subject 1 in Experiment 6, but at the expense oflosing subject specific features. Finding the optimal size of thesmoothing kernel will always be important and dependent onthe set of data being used. Ashburner recommends choosing asmoothing kernel that reflects the size of the regions of interestbeing explored (Ashburner, 2007), which is well-suited for ahypothesis based approach.
Suggestions for VBM UsersSeveral trends in variability patterns were evident in our resultsand can be used to guide a user for better VBM practices.Increasing the group age range as well as increasing the ratio ofcases to controls can significantly alter the amount of variabilityobserved in the FINTMs. When designing a study, it is necessaryto take both of these factors into account. Care must be takenwhen preprocessing a group of controls with a larger group ofcases. It will be important to assess if the variability of controlFINTMs increases with a higher number of cases. If this is truewe suggest that cases vs. controls comparisons be made on anequal number of samples in separate runs with subgroups of casesin each run. The consistency of the results across the differentruns can then be compared. This also applies when the numberof controls are larger than cases. Wider age ranges are alsoan important consideration as this can affect the FINTMs in asimilar manner. These differences are not trivial and can produceinconsistent results. GM regions that appear in a subject whenpreprocessed with one group of individuals may be differentin shape or even completely absent for this same subject whenpreprocessed with a different group of individuals. Our resultsindicate that demographic factors like age range and the ratio ofpatients to controls in a preprocessing group should be carefullyconsidered. For these reasons careful attention to the selection ofgroups in studies is paramount. We suggest that users carefullymatch subjects based on demographics. Our results indicate thatcaution should be taken when drawing conclusions based onsMRIs that have been normalized to a group template using VBMDARTEL, especially when the age range of the subjects is large. Insuch cases, the final normalized images can differ depending onthe group that the subject was processed with. To ascertain resultrobustness we suggest users perform permutation testing usingsub groups of subjects.
Limitations of Our ExperimentsWe performed all of our experiments using SPM8 usingthe recommendations of Ashburner (Ashburner et al., 2012)with data that was publically available. We did not verifyour results with SPM12. SPM12 offers various improvementsto normalization and segmentation, but according to SPM12release notes (http://www.fil.ion.ucl.ac.uk/spm/software/spm12)the DARTEL process of normalizing to an averaged group
Frontiers in Neuroscience | www.frontiersin.org 11 December 2016 | Volume 10 | Article 522

Michael et al. Variability of VBM Group Registration
template was not updated in SPM12. As such we speculate thatour results will hold true with SPM12, but to confirm this resultwe plan to use SPM12 in future studies. Another limitation ofthis study is the small sample size which precludes measuring thevariability of interest as a function of sample size.
CONCLUSIONS
We demonstrate that the GM maps of individual subjectsconstructed by SPM’s VBM DARTEL process can change withrespect to the group in which they are preprocessed. Theseeffects can be exacerbated when subject age is varied acrosspreprocessing groups. We demonstrate that differences in agerange, ratio of cases to controls, smoothing kernel size, andwhether data is modulated or unmodulated can all affect thevariability of the final GM maps. When using VBM DARTELto preprocess brain sMRI data sets, all the above factors shouldbe taken into consideration to reduce the confounding influence
of group characteristics. These finding suggest that investigatorsshould perform iterative permutation tests in imaging studies toimprove the robustness of the results. This will ensure that theobserved findings are not a byproduct of preprocessing artifacts.
AUTHOR CONTRIBUTIONS
AM designed the experiments, developed metrics of evaluations,supervised EE and wrote and edited the manuscript with EE.EE implemented the experiments and wrote the manuscriptunder the guidance of AM. GM supervised the project, providedsuggestions to AM and edited the manuscript.
SUPPLEMENTARY MATERIAL
The Supplementary Material for this article can be foundonline at: http://journal.frontiersin.org/article/10.3389/fnins.2016.00522/full#supplementary-material
REFERENCES
Abell, F., Krams, M., Ashburner, J., Passingham, R., Friston, K., Frackowiak,R., et al. (1999). The neuroanatomy of autism: a voxel-based whole brainanalysis of structural scans.Neuroreport 10, 1647–1651. doi: 10.1097/00001756-199906030-00005
Asami, T., Bouix, S.,Whitford, T. J., Shenton,M. E., Salisbury, D. F., andMcCarley,R. W. (2012). Longitudinal loss of gray matter volume in patients withfirst-episode schizophrenia: DARTEL automated analysis and ROI validation.Neuroimage 59, 986–996. doi: 10.1016/j.neuroimage.2011.08.066
Ashburner, J. (2007). A fast diffeomorphic image registration algorithm.Neuroimage 38, 95–113. doi: 10.1016/j.neuroimage.2007.07.007
Ashburner, J. (2010).VBMTutorial. London: Univ. Coll. Available online at: http://www.fil.ion.ucl.ac.uk/~john/misc/VBMclass10.pdf
Ashburner, J., Barnes, G., Chen, C., Daunizeau, J., Flandin, G., Friston, K., et al.(2012). SPM8 Manual. London: Funct. Imaging Lab. Inst. Neurol.
Ashburner, J., and Friston, K. J. (2000). Voxel-based morphometry–the methods.Neuroimage 11, 805–821. doi: 10.1006/nimg.2000.0582
Calderoni, S., Retico, A., Biagi, L., Tancredi, R., Muratori, F., and Tosetti, M.(2012). Female children with autism spectrum disorder: an insight frommass-univariate and pattern classification analyses.Neuroimage 59, 1013–1022.doi: 10.1016/j.neuroimage.2011.08.070
Campbell, L. E., Daly, E., Toal, F., Stevens, A., Azuma, R., Catani, M., et al. (2006).Brain and behaviour in children with 22q11.2 deletion syndrome: a volumetricand voxel-based morphometry MRI study. Brain 129, 1218–1228. doi: 10.1093/brain/awl066
Colloby, S. J., and Taylor, J.-P. (2014). Patterns of cerebellar volume loss indementia with Lewy bodies and Alzheimer’s disease: a VBM-DARTEL study.Psychiatry Res. Neuroimaging 223, 187–191. doi: 10.1016/j.pscychresns.2014.06.006
Di Martino, A., Yan, C.-G., Li, Q., Denio, E., Castellanos, F. X., Alaerts, K.,et al. (2014). The autism brain imaging data exchange: towards a large-scaleevaluation of the intrinsic brain architecture in autism. Mol. Psychiatry 19,659–667. doi: 10.1038/mp.2013.78
Eckert, M. A., Tenforde, A., Galaburda, A. M., Bellugi, U., Korenberg, J. R., Mills,D., et al. (2006). To modulate or not to modulate: differing results in uniquelyshaped Williams syndrome brains. Neuroimage 32, 1001–1007. doi: 10.1016/j.neuroimage.2006.05.014
Focke, N. K., Helms, G., Kaspar, S., Diederich, C., Tóth, V., Dechent, P., et al.(2011). Multi-site voxel-based morphometry—not quite there yet. Neuroimage
56, 1164–1170. doi: 10.1016/j.neuroimage.2011.02.029García-Vázquez, V., Reig, S., Janssen, J., Pascau, J., Rodríguez-Ruano, A., Udías, Á.,
et al. (2008). “Use of IBASPM atlas-based automatic segmentation toolbox in
pathological brains: effect of template selection,” in Nuclear Science Symposium
Conference Record, 2008, NSS’08 (Dresden: IEEE), 4270–4272. doi: 10.1109/nssmic.2008.4774225
Honea, R., Crow, T. J., Passingham, D., and Mackay, C. E. (2005). Regional deficitsin brain volume in schizophrenia: a meta-analysis of voxel-based morphometrystudies. Am. J. Psychiatry 162, 2233–2245. doi: 10.1176/appi.ajp.162.12.2233
Keller, S. S., and Roberts, N. (2008). Voxel-based morphometry of temporal lobeepilepsy: an introduction and review of the literature. Epilepsia 49, 741–757.doi: 10.1111/j.1528-1167.2007.01485.x
Kosaka, H., Omori, M., Munesue, T., Ishitobi, M., Matsumura, Y., Takahashi, T.,et al. (2010). Smaller insula and inferior frontal volumes in young adults withpervasive developmental disorders. Neuroimage 50, 1357–1363. doi: 10.1016/j.neuroimage.2010.01.085
Riva, D., Annunziata, S., Contarino, V., Erbetta, A., Aquino, D., and Bulgheroni,S. (2013). Gray matter reduction in the vermis and CRUS-II Is associatedwith social and interaction deficits in low-functioning children with autisticspectrum disorders: a VBM-DARTEL study. Cerebellum 12, 676–685. doi: 10.1007/s12311-013-0469-8
Shen, S., and Sterr, A. (2013). Is DARTEL-based voxel-basedmorphometry affectedby width of smoothing kernel and group size? A study using simulated atrophy.J. Magn. Reson. Imaging 37, 1468–1475. doi: 10.1002/jmri.23927
Takao, H., Hayashi, N., and Ohtomo, K. (2014). Effects of study design in multi-scanner voxel-based morphometry studies. Neuroimage 84, 133–140. doi: 10.1016/j.neuroimage.2013.08.046
Van Essen, D. C., and Dierker, D. L. (2007). Surface-based and probabilistic atlasesof primate cerebral cortex. Neuron 56, 209–225. doi: 10.1016/j.neuron.2007.10.015
Watson, R., O’Brien, J. T., Barber, R., and Blamire, A. M. (2012). Patterns of graymatter atrophy in dementia with Lewy bodies: a voxel-based morphometrystudy. Int. Psychogeriatr. 24, 532–540. doi: 10.1017/S1041610211002171
Conflict of Interest Statement: The authors declare that the research wasconducted in the absence of any commercial or financial relationships that couldbe construed as a potential conflict of interest.
Copyright © 2016 Michael, Evans and Moore. This is an open-access article
distributed under the terms of the Creative Commons Attribution License (CC BY).
The use, distribution or reproduction in other forums is permitted, provided the
original author(s) or licensor are credited and that the original publication in this
journal is cited, in accordance with accepted academic practice. No use, distribution
or reproduction is permitted which does not comply with these terms.
Frontiers in Neuroscience | www.frontiersin.org 12 December 2016 | Volume 10 | Article 522