links for maps of individual natural hazards map your hazards! combining natural hazards with...
TRANSCRIPT

Links for Maps of Individual Natural Hazards
Map Your Hazards! Combining Natural Hazards with Societal Issues

Links to Maps of Individual Natural Hazards
• Links to maps are primarily from government websites.
• Maps represent a historical complication of the occurrence of the natural hazard.
• Additional sources for non-governmental websites are given for some natural hazards.
Note: All sites last accessed 7/18/2014

Questions for Maps of Individual Natural Hazards
• Are some of the maps more credible than others? Which ones and why?
• Based on the maps and sources, which natural hazards pose the greatest local risk?

Volcanoes• http://volcanoes.usgs.gov/
– Interactive map focusing on United States volcanoes.
• http://pubs.usgs.gov/fs/2005/3024/– USGS fact sheet focusing on
Yellowstone caldera.– Map of large ash plumes is
found in last third of webpage.
• Additional Source: http://www.tetonwyo.org/em/topics/volcano/201723/– Information about volcanic
risk, preparedness and impacts.
Eruption at Mount Pinatubo, Philippines in 1991.

Earthquakes• http://geohazards.usgs.gov/qfaults/map.php
– Interactive map focusing on United States earthquakes.
• http://earthquake.usgs.gov/hazards/– Seismic hazard maps and data.
Northridge Earthquake, CA, January 17, 1994.
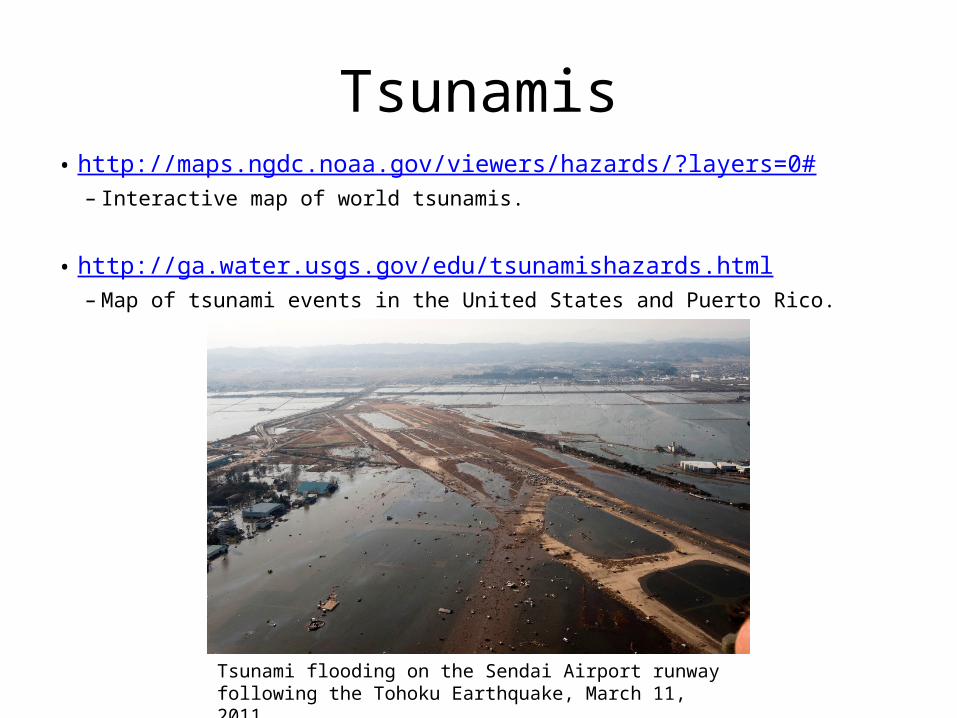
Tsunamis• http://maps.ngdc.noaa.gov/viewers/hazards/?layers=0#
– Interactive map of world tsunamis.
• http://ga.water.usgs.gov/edu/tsunamishazards.html– Map of tsunami events in the United States and Puerto Rico.
Tsunami flooding on the Sendai Airport runway following the Tohoku Earthquake, March 11, 2011.

Wildfires• http://www.firelab.org/fmi/data-products/229-wildland-fire-potential-
wfp– Map of wildland fire potential for the contiguous United States (under “WFP
Downloads,” “Continuous WFP”).
Wildfire in Yellowstone, August 20, 1988.

Floods
• http://scienceprogress.org/2011/03/climate-change-could-create-new-risks-to-u-s-nuclear-reactor-safety/– Map of FEMA-declared
flood emergencies by county for the contiguous United States.
• http://maps.redcross.org/website/Maps/Images/NationalLevel/flood_hires.jpg– Map of presidential
disaster declarations from 1965 to 2003 for the United States.
Flooding north of St. Louis, Missouri at the confluence of the Mississippi, Missouri, and Illinois rivers during the 1993 Mississippi Flood as compared to the same location in 2002.

Landslides
• http://pubs.usgs.gov/pp/p1183/figures/map.jpg – Map of landslide
incidence and susceptibility for the contiguous United States.
• http://landslides.usgs.gov/docs/coe/GodtCoeBaumHighlandHazardMap.pdf– Map of landslide
susceptibility for the contiguous United States (Figure 3).
Landslide damming the Spanish Fork River and destroying Thistle, Utah, 1983.

Coastal Hazards• http://pubs.usgs.gov/circ/c1075/us.html
– Map of coastal erosion for the United States.
Coastal erosion, California, 1997.

Severe Weather: Hurricanes• http://www.csc.noaa.gov/h
urricanes/# – Interactive map of historical
hurricane tracks for the contiguous United States.
Hurricane Katrina, August 29, 2005.

Severe Weather: Tornadoes, Thunderstorms, and Lightning
• Tornadoes: http://www.spc.noaa.gov/wcm/ – Map of tornado tracks from 1950 to 2011 for the contiguous United States (bottom of web page). – Map of average annual tornado watches per year for the contiguous United States (near bottom of web page).
• Thunderstorms: http://www.spc.noaa.gov/wcm/ – Map of average annual severe thunderstorm watches per year for the contiguous United States (near bottom of web page).
• Lightning: http://www.wunderground.com/blog/weatherhistorian/comment.html?entrynum=78– Map of cloud-to-ground lightning from 1997 to 2010 for the contiguous United States.
Tornado damage, Joplin, Missouri, May 22, 2011.

Severe Weather: Winds, Drought, and Fog• Winds: http://www.nrel.gov/gis/wind.html
– Maps of average annual wind speeds for the United States.
• Drought: http://serc.carleton.edu/eslabs/drought/5c.html – Map of drought occurrence from 1895 to 1995 for the contiguous United States.
• Fog: http://www.geography.hunter.cuny.edu/tbw/wc.notes/5.cond.precip/clouds/fog_map.htm – Map of average annual occurrence of fog for the contiguous United States.
*Additional severe weather topics may be appropriate for local communities such as: severe winter weather, mountain winds, hail, heat waves, dust and sand storms, etc.
Fog on Lake Michigan, July 2014.
Questions for Maps of Individual Natural Hazards
• Are some of the maps more credible than others? Which ones and why?
• Based on the maps and sources, which natural hazards pose the greatest local risk?
• What problems might occur from interpreting local risk from regional maps?
• Are there credible sources that identify specific local natural hazard risks for your area?