natural hazards assessment
TRANSCRIPT

Natural Hazards
Assessment
La Crosse County, WI
Prepared by: NOAA / National Weather Service La Crosse, WI
2
Natural Hazards Assessment for
La Crosse County, WI
Prepared by NOAA / National Weather Service – La Crosse Last Update: November 2015
Table of Contents:
Overview…………………………………………………. 3 Tornadoes………………………………………………… 4 Severe Thunderstorms / Lightning……….…… 5 Flooding and Hydrologic Concerns……………. 6 Winter Storms and Extreme Cold…….…….…. 7 Heat, Drought, and Wildfires………………….... 8 Local Climatology……………………………………… 9 National Weather Service & Weather Monitoring……………………….. 10 Resources………………………………………………… 11

3
Natural Hazards Assessment La Crosse County, WI
Prepared by National Weather Service – La Crosse
Overview La Crosse County is in the Upper Mississippi River Valley of the Midwest with relatively hilly terrain and bluffs. It is bordered by the Mississippi River to the west. The area experiences a temperate climate with both warm and cold season extremes. Winter months can bring occasional heavy snows, intermittent freezing precipitation or ice, and prolonged periods of cloudiness. While true blizzards are rare, winter storms impact the area on average about 3 to 4 times per season. Occasional arctic outbreaks bring extreme cold and dangerous wind chills. Temperatures between river valleys and surrounding ridges can vary greatly. Typically high
temperatures on ridges are 3 to 5F colder than valleys. This can lead to slightly more average snowfall on ridge tops and occasionally a difference in winter precipitation types from ridge to valley. Thunderstorms occur on average 30 to 50 times a year, mainly in the spring and summer months. The strongest storms can produce associated severe weather like tornadoes, large hail, or damaging wind. Both river flooding and flash flooding can occur, along with urban-related flood problems. The terrain can lead to mud slides and generally increases the flash flood threat. Heat and high humidity is occasionally observed in June, July, or August. The autumn season usually has the quietest weather. Valley fog is most common in the late summer and early fall months. On calm nights, colder air settles into valleys leading to colder low temperatures compared to ridge top locations. High wind events can also occur occasionally, usually in the spring or fall. The variability in weather can be seen in the following graphic, created by a private company (weatherpages.com) that rated each city on variations in temperature, precipitation, and other factors. La Crosse, WI ranked 27th highest in variability out of 277 cities.
Since 1998, La Crosse County has been included in a FEMA Federal Disaster Declaration 5 times: 1998 – Severe storms 2001 – Flooding 2004 – Severe storms / flooding 2007 – Severe storms / flooding 2008 – Severe storms / flooding

4
3
8
4
1
0 0 0
1
2
3
4
5
6
7
8
9
F0/EF0 F1/EF1 F2/EF2 F3/EF3 F4/EF4 F5/EF5
Tornadoes by F/EF Scale for La Crosse County 1950-2015
Tornadoes Even though Wisconsin averages about 23 tornadoes per year, La Crosse County has only had 16 tornadoes since 1950, averaging about one tornado every 4 years. Most tornadoes are short-lived and small. May and June are the peak months and most occur between 3 and 9 p.m., but they can occur nearly any time of year and at all times of the day.
Most recent tornadoes:
May 22, 2011 (EF1)
May 22, 2011 (EF2)
June 7, 2008 (EF1)
Sept.13, 2005 (F0)
May 15, 1998 (F0)
June 28, 1995 (F0)
June 23, 1981 (F1)
June 5, 1980 (F2)
July 16, 1972 (F1)
June 15, 1967 (F0)
July 10, 1966 (F1)
One of the strongest tornadoes to hit La Crosse County was on June 6, 1906 when a tornado moved out of southeast Minnesota and across southeast parts of the county killing 4 and injuring 26. Ranked an F4, the tornado did tremendous damage on ridge tops and in the steep valleys in the Township of Washington. In more recent years, an F3 tornado moved across the county on May 5, 1965 tracking through the Midway area between Onalaska and Holmen. And in May 2011, a tornado (EF2) crossed the south end of La Crosse damaging buildings, homes, and many trees but there were no injuries. The terrain may limit some tornadoes from forming but brief touchdowns and tracks are still possible even through the bluffs and valleys. Strongest tornadoes: (1850-2015) La Crosse County Tornado Facts:
June 6, 1906 (F4) – 26 inj, 4 dead No F5 or EF5* tornadoes
May 1, 1930 (F3) – 15 inj, 0 dead Only one F4 tornado and three F3s
Aug.20, 1928 (F3) – 3 inj, 0 dead 4 deaths and 61 injuries since 1850
May 5, 1965 (F3) – 1 inj, 0 dead Tornadoes have occurred April – Sept.
May 23, 1933 (F2) – 3 inj, 0 dead Most have occurred in May (7)
* Started February 1, 2007
Tornado Watches Tornado Warnings
Year Year 2015 0 2015 0 2014 1 2014 0 2013 3 2013 0 2012 2 2012 0 2011 4 2011 2 2010 3 2010 0 2009 2 2009 0 2008 8 2008 1 2007 5 2007 1 2006 3 2006 0
Enhanced Fujita (EF*) Scale
EF0 65-85 mph EF1 86-110 mph EF2 111-135 mph EF3 136-165 mph EF4 166-200 mph EF5 >200 mph

5
Severe Thunderstorms / Lightning La Crosse County averages 39 thunderstorm days per year. The National Weather Service (NWS) considers a thunderstorm severe when it produces wind gusts of 58 mph (50 knots) or higher, 1 inch diameter hail or larger, or a tornado. Downdraft winds from a severe thunderstorm can produce local or widespread damage, even tornado-like damage if strong enough. Most severe thunderstorm winds occur in June or July and between the hours of 4 and 8 p.m., but can occur at other times. Most damage involves blown down trees, power lines, and damage to weaker structures (i.e. barns, outbuildings, garages) with occasional related injuries. In 1998, a large squall line moved through the region with wind gusts in excess of 100 mph knocking down hundreds of trees and damaging buildings. Power was also out in many communities. There have been over 137 damaging wind reports since 1982 in the county. Large hail can also occur in a severe thunderstorm. June is the peak month with the most common time between 1 and 9 p.m., but it can occur in other warm season months and at any time of day. Hail is typically a crop damaging hazard but can damage roofs, windows, and vehicles if large enough (> 1”). Expenses can be high. Injuries or fatalities are rare for hail. In June 2001, a series of storms dropped large hail in parts of Holmen, Onalaska, and areas just east of La Crosse. In April 2011, hail up to 3” in diameter damaged hundreds of roofs and vehicles across mainly the south side of La Crosse causing millions in damages. There have been 110 large hail (≥ 3/4”) reports in the county since 1982. Non-severe thunderstorms still pose a lightning risk. According to the Vaisala Group, an average of just over 300,000 cloud-to-ground strikes hit Wisconsin each year based on data from 1997 to 2010. Nationally, Wisconsin ranks 24th in lightning related fatalities with 6 deaths reported between 2001 and 2010. There have been lightning fatalities in Wisconsin in 2007, 2008, and 2011 with two known injuries in La Crosse County from lightning since 1982.
Severe Thunderstorm
Watches
Severe Thunderstorm
Warnings
Year Year 2015 5 2015 4 2014 5 2014 10 2013 8 2013 10 2012 7 2012 7 2011 14 2011 9 2010 13 2010 15 2009 4 2009 0 2008 10 2008 11 2007 12 2007 7 2006 19 2006 1
6
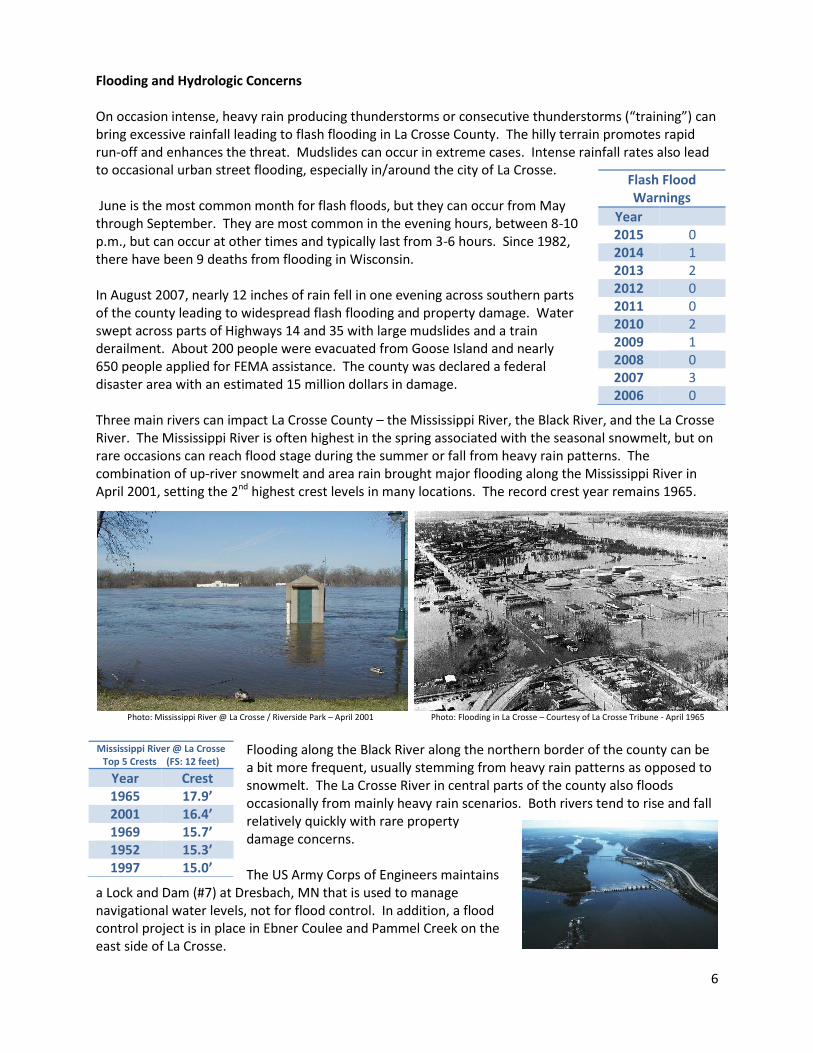
Flooding and Hydrologic Concerns On occasion intense, heavy rain producing thunderstorms or consecutive thunderstorms (“training”) can bring excessive rainfall leading to flash flooding in La Crosse County. The hilly terrain promotes rapid run-off and enhances the threat. Mudslides can occur in extreme cases. Intense rainfall rates also lead to occasional urban street flooding, especially in/around the city of La Crosse. June is the most common month for flash floods, but they can occur from May through September. They are most common in the evening hours, between 8-10 p.m., but can occur at other times and typically last from 3-6 hours. Since 1982, there have been 9 deaths from flooding in Wisconsin. In August 2007, nearly 12 inches of rain fell in one evening across southern parts of the county leading to widespread flash flooding and property damage. Water swept across parts of Highways 14 and 35 with large mudslides and a train derailment. About 200 people were evacuated from Goose Island and nearly 650 people applied for FEMA assistance. The county was declared a federal disaster area with an estimated 15 million dollars in damage. Three main rivers can impact La Crosse County – the Mississippi River, the Black River, and the La Crosse River. The Mississippi River is often highest in the spring associated with the seasonal snowmelt, but on rare occasions can reach flood stage during the summer or fall from heavy rain patterns. The combination of up-river snowmelt and area rain brought major flooding along the Mississippi River in April 2001, setting the 2nd highest crest levels in many locations. The record crest year remains 1965.
Photo: Mississippi River @ La Crosse / Riverside Park – April 2001 Photo: Flooding in La Crosse – Courtesy of La Crosse Tribune - April 1965
Flooding along the Black River along the northern border of the county can be a bit more frequent, usually stemming from heavy rain patterns as opposed to snowmelt. The La Crosse River in central parts of the county also floods occasionally from mainly heavy rain scenarios. Both rivers tend to rise and fall relatively quickly with rare property damage concerns. The US Army Corps of Engineers maintains
a Lock and Dam (#7) at Dresbach, MN that is used to manage navigational water levels, not for flood control. In addition, a flood control project is in place in Ebner Coulee and Pammel Creek on the east side of La Crosse.
Flash Flood Warnings
Year 2015 0 2014 1 2013 2 2012 0 2011 0 2010 2 2009 1 2008 0 2007 3 2006 0
Mississippi River @ La Crosse Top 5 Crests (FS: 12 feet)
Year Crest 1965 17.9’ 2001 16.4’ 1969 15.7’ 1952 15.3’ 1997 15.0’
7
Winter Storms and Extreme Cold Hazardous winter weather can bring a variety of conditions to La Crosse County. Since 1982, there has been 89 storms with an average of 3-4 winter storms area each season. The terrain in the county does limit the number of true blizzards (only 3 since 1982) but heavy snow, blowing snow, ice, and sleet all occur. There have been a total of 6 documented deaths and 51 injuries as a direct result from winter storms in Wisconsin since 1982. The 30-year average seasonal snowfall at La Crosse is 44.5 inches, but nearby ridge tops are typically 3-
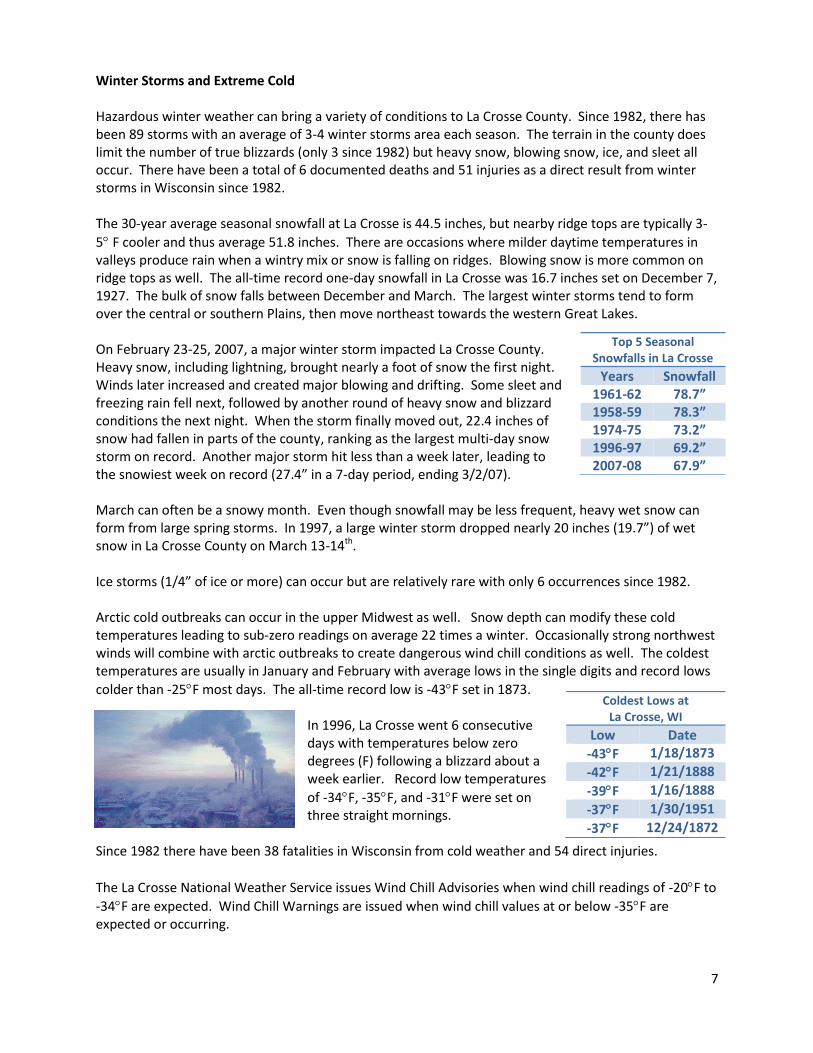
5 F cooler and thus average 51.8 inches. There are occasions where milder daytime temperatures in valleys produce rain when a wintry mix or snow is falling on ridges. Blowing snow is more common on ridge tops as well. The all-time record one-day snowfall in La Crosse was 16.7 inches set on December 7, 1927. The bulk of snow falls between December and March. The largest winter storms tend to form over the central or southern Plains, then move northeast towards the western Great Lakes. On February 23-25, 2007, a major winter storm impacted La Crosse County. Heavy snow, including lightning, brought nearly a foot of snow the first night. Winds later increased and created major blowing and drifting. Some sleet and freezing rain fell next, followed by another round of heavy snow and blizzard conditions the next night. When the storm finally moved out, 22.4 inches of snow had fallen in parts of the county, ranking as the largest multi-day snow storm on record. Another major storm hit less than a week later, leading to the snowiest week on record (27.4” in a 7-day period, ending 3/2/07). March can often be a snowy month. Even though snowfall may be less frequent, heavy wet snow can form from large spring storms. In 1997, a large winter storm dropped nearly 20 inches (19.7”) of wet snow in La Crosse County on March 13-14th. Ice storms (1/4” of ice or more) can occur but are relatively rare with only 6 occurrences since 1982. Arctic cold outbreaks can occur in the upper Midwest as well. Snow depth can modify these cold temperatures leading to sub-zero readings on average 22 times a winter. Occasionally strong northwest winds will combine with arctic outbreaks to create dangerous wind chill conditions as well. The coldest temperatures are usually in January and February with average lows in the single digits and record lows
colder than -25F most days. The all-time record low is -43F set in 1873. In 1996, La Crosse went 6 consecutive days with temperatures below zero degrees (F) following a blizzard about a week earlier. Record low temperatures
of -34F, -35F, and -31F were set on three straight mornings.
Since 1982 there have been 38 fatalities in Wisconsin from cold weather and 54 direct injuries.
The La Crosse National Weather Service issues Wind Chill Advisories when wind chill readings of -20F to
-34F are expected. Wind Chill Warnings are issued when wind chill values at or below -35F are expected or occurring.
Top 5 Seasonal Snowfalls in La Crosse
Years Snowfall 1961-62 78.7” 1958-59 78.3” 1974-75 73.2” 1996-97 69.2” 2007-08 67.9”
Coldest Lows at La Crosse, WI
Low Date
-43F 1/18/1873
-42F 1/21/1888
-39F 1/16/1888
-37F 1/30/1951
-37F 12/24/1872

8
Heat, Drought, and Wildfires On occasion the weather pattern across the upper Midwest favors prolonged heat and humidity, leading to heat waves. June through August are the warmest months with average high temperatures in the 80s
and record highs above 100F most days. The warmest temperature on record at La Crosse has
occurred twice … 108F set on July 13, 1995 and July 14, 1936. Since 1982, there have been 121 fatalities directly related to heat waves and another 95 indirectly, in Wisconsin. In La Crosse County, there have been 17 heat waves since 1982 and four related fatalities – the most recent in July 2012. One of the longest heat waves on record occurred in July 1936 when La
Crosse hit 90F or higher for 14 consecutive days, including 9 days at or above
100F and an all-time record of high of 108F as noted above. In more recent years, the high
temperature hit 90F or warmer 11 consecutive days from July 30th through August 9th in 2001 (topping
100F two days), and 10 consecutive days from June 16th through 25th in 1995. The combination of warm temperatures and high dew points values led to heat index values of 113 on July 17 and July 18, 2011 (followed by 109 and 107 the following two-days).
Prolonged dry spells can also lead to drought causing extreme damage to crops. Droughts vary in length and intensity but abnormally dry to moderate drought conditions can occur quite frequently. Severe to extreme droughts occur far less frequently. Dry weather can also lead to a wildfire threat, especially in the spring before foliage has
emerged (i.e. before green up) or in the fall after vegetation has started to die off. Warm, dry (i.e. lower relative humidities), and windy conditions all favor higher fire danger and can lead to sporadic grass fires in La Crosse County. Thick, wooded areas also pose a threat for wildfires under extremely dry conditions but occur far less frequently.
Warmest Highs at La Crosse, WI
High Date
108F 7/13/1995
108F 7/14/1936
107F 5/31/1934
106F 7/13/1936
105F 8/1/1988

9
Local Climatology Here are some basic climatology figures for the La Crosse County area. Data is valid for La Crosse, WI based on normals from a 30-year period (1981-2010).
Month Normal
Maximum Temperature
Normal Minimum
Temperature
Average Temperature
Precipitation Snowfall
JAN 26.1 8.9 17.5 1.13” 11.7” FEB 31.6 13.7 22.6 1.05” 8.0”
MAR 44.1 25.1 34.6 2.04” 7.2” APR 59.6 37.9 48.8 3.33” 1.9” MAY 71.0 48.8 59.9 3.51” 0.0” JUN 80.3 58.5 69.4 4.34” 0.0” JUL 84.5 63.2 73.8 4.26” 0.0”
AUG 81.8 61.2 71.5 4.29” 0.0” SEP 73.4 52.4 62.9 3.56” 0.0” OCT 60.2 40.3 50.3 2.20” 0.2” NOV 44.3 28.4 36.3 2.01” 4.1” DEC 29.9 14.7 22.3 1.36” 11.3” Year 57.3 37.8 47.6 33.26” 44.5”
Miscellaneous facts:
Warmest year on record – 1998 (51.9F)
Warmest month on record – July 2012 (79.6F)
Warmest day on record – July 13, 1995 and July 14, 1936 (108F)
Greatest number of days with 90F or warmer – 1988 (46 times)
Coldest year on record – 1917 (42.1F)
Coldest month on record – January 1912 (-1.1F)
Coldest day on record – January 18, 1873 (-43F)
Greatest number of days at 0F or colder – 1875 (55 times)
Wettest year on record – 1881 (44.74”)
Wettest month on record – August 2007 (13.75”)
Wettest day on record – September 6, 1884 (5.55”)
Driest year on record – 1910 (16.77”)
Driest month on record – November 1976 (Trace)
Highest seasonal snowfall on record – 1961/62 (78.7”)
Highest monthly snowfall on record – January 1929 (39.6”)
Highest one-day snowfall on record – December 7, 1927 (16.7”)
Least seasonal snowfall on record – 1967/68 (7.7”)

10
NOAA/National Weather Service Support and Weather Monitoring
NOAA’s National Weather Service (NWS) forecast office at La Crosse, WI serves La Crosse County with weather information and support on a continuous basis. Operating 24 hours a day, a staff of 23 issues routine and non-routine informational products for the area, including all watches, warnings, and advisories related to natural hazards. Doppler radar (WSR-88D) is co-located with the La Crosse NWS office and covers the region.
NWS La Crosse has a web site at: www.weather.gov/lacrosse Normal communication during hazardous weather scenarios is via telephone, National Warning System (NAWAS), and amateur radio. NOAA Weather Radio coverage in La Crosse County includes two stations: WXJ86 (La Crosse) on 162.550 MHz and KGG95 (Winona) on 162. 425 MHz.
Storm spotter groups consist of mainly amateur radio operators and the general public, with some involvement from law enforcement and fire departments, among others. Spotter training is held annually with an average attendance in the past 5 years of 88. There are a variety of weather monitoring sources in La Crosse County, including:
Automated weather station(s):
La Crosse Airport (KLSE)
River Gauge(s):
Mississippi River Lock & Dam #7 @ La Crescent / Dresbach
Mississippi River @ La Crosse (Wastewater Treatment Plant)
La Crosse River @ West Salem (inactive)
La Crosse River @ La Crosse
Cooperative Observers
NWS La Crosse
French Island (La Crosse 4NNW) In addition, numerous volunteer reports from around the county are received at the La Crosse NWS office including rainfall, snowfall, and temperatures, on a routine basis.
11
Resources National Weather Service – La Crosse www.weather.gov/arx NWS La Crosse Tornado Database www.weather.gov/arx/tornadomain NWS La Crosse River Monitoring http://water.weather.gov/ahps2/index.php?wfo=ARX NWS La Crosse Climate http://w2.weather.gov/climate/index.php?wfo=arx La Crosse Drought information www.weather.gov/arx/drought NWS La Crosse Storm Summaries www.weather.gov/arx/events NWS La Crosse NOAA Weather Radio page www.weather.gov/arx/nwr NWS Storm Prediction Center http://www.spc.noaa.gov/ SPC Online Severe Weather Climatology http://www.spc.nssl.noaa.gov/climo/online/grids/ http://www.spc.noaa.gov/climo/online/rda/ARX.html
Contact information: Todd Shea Warning Coordination Meteorologist NWS La Crosse [email protected] Last Updated: November 2015