influence of headteachers management practices on …
TRANSCRIPT

INFLUENCE OF HEADTEACHERS’ MANAGEMENT PRACTICES ON STUDENTS’
ACADEMIC PERFORMANCE IN PUBLIC SECONDARY SCHOOLS WITHIN KITUI
CENTRAL DISTRICT, KITUI COUNTY, KENYA
Ndinza Kasyoka Lena
A Research Project Report Submitted to the School of Education for the Award of the Degree of
Masters of Education in South Eastern Kenya University
FEBRUARY 2015

ii
DECLARATION
This research project report is my original work and has not been submitted for a degree or any
other award in any other university.
_____________________________________ ____________________
Ndinza Kasyoka Lena Date
E55/KIT/20115/2012
RECOMMENDATION
This project report has been submitted for examination with our approval as University
supervisors
_______________________________ _________________
Prof. James Muola Date
Machakos University College
_______________________________ _________________
Dr. Joash Migosi Date
University of Nairobi

iii
DEDICATION
This work is dedicated to my late son Charles Kausya.

iv
ACKNOWLEDGEMENT
I am grateful to God for giving me good spiritual, mental and physical health in the course of
my study. I would wish to extent my gratitude to my supervisors Prof .James Muola and Dr.
Joash Migosi for the guidance they offered me to enable me come up with this project. I would
also like to thank my teachers, the secretary, the clerk and Mr. Patrick who encouraged and
assisted me in typing and analysing the data for my research, may God bless you all. I also
thank my family members and especially my dear husband for understanding that I had to spend
some time away from our family during the study period.
v
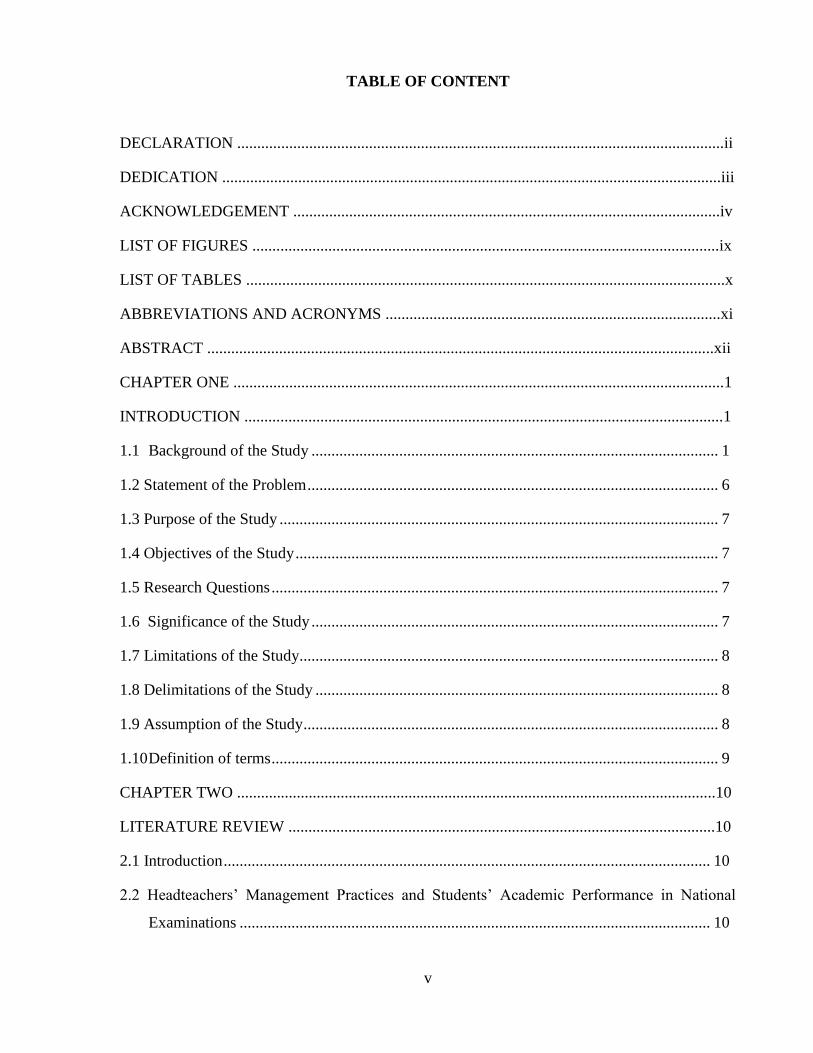
TABLE OF CONTENT
DECLARATION ..........................................................................................................................ii
DEDICATION .............................................................................................................................iii
ACKNOWLEDGEMENT ...........................................................................................................iv
LIST OF FIGURES .....................................................................................................................ix
LIST OF TABLES ........................................................................................................................x
ABBREVIATIONS AND ACRONYMS ....................................................................................xi
ABSTRACT ...............................................................................................................................xii
CHAPTER ONE ...........................................................................................................................1
INTRODUCTION ........................................................................................................................1
1.1 Background of the Study ...................................................................................................... 1
1.2 Statement of the Problem ....................................................................................................... 6
1.3 Purpose of the Study .............................................................................................................. 7
1.4 Objectives of the Study .......................................................................................................... 7
1.5 Research Questions ................................................................................................................ 7
1.6 Significance of the Study ...................................................................................................... 7
1.7 Limitations of the Study......................................................................................................... 8
1.8 Delimitations of the Study ..................................................................................................... 8
1.9 Assumption of the Study ........................................................................................................ 8
1.10 Definition of terms ................................................................................................................ 9
CHAPTER TWO ........................................................................................................................10
LITERATURE REVIEW ...........................................................................................................10
2.1 Introduction .......................................................................................................................... 10
2.2 Headteachers‘ Management Practices and Students‘ Academic Performance in National
Examinations ...................................................................................................................... 10

vi
2.3 Influence of Headteachers‘ Management Practices of Supervision on Students‘ Academic
Performance ........................................................................................................................ 14
2.4 Influence of Headteachers‘ Management Practices of Communication on Students‘
Academic Performance ....................................................................................................... 16
2.5 Influence of Headteachers‘ Management Practices of Motivation on Students‘ Academic
Performance ........................................................................................................................ 18
2.6 Performance ......................................................................................................................... 20
2.7 Theoretical Frame Work: McGregor‘s Theory X and Y ..................................................... 21
2.8 Abraham Maslow‘s Hierarchy of Needs.............................................................................. 23
2.9 Conceptual Framework ........................................................................................................ 27
CHAPTER THREE ....................................................................................................................28
RESEARCH METHODOLOGY ...............................................................................................28
3.1 Introduction .......................................................................................................................... 28
3.2 Research Design................................................................................................................... 28
3.3 Target Population ................................................................................................................. 28
3.4 Sampling Procedures and Sample Size ................................................................................ 29
3.5 Instrumentation .................................................................................................................... 31
3.5.1 Validity of Research Instruments...................................................................................... 31
3.5.2 Reliability of Research Instruments .................................................................................. 32
3.6 Data Collection Procedures.................................................................................................. 32
3.7 Data analysis Procedures .................................................................................................... 33
CHAPTER FOUR ......................................................................................................................34
RESULTS ANALYSIS, INTERPRETATION AND DISCUSSION .......................................34
4.1 Introduction .......................................................................................................................... 34
4.2 Questionnaire Return Rate ................................................................................................... 34
4.3 Demographic Characteristics of Respondents ..................................................................... 34
vii
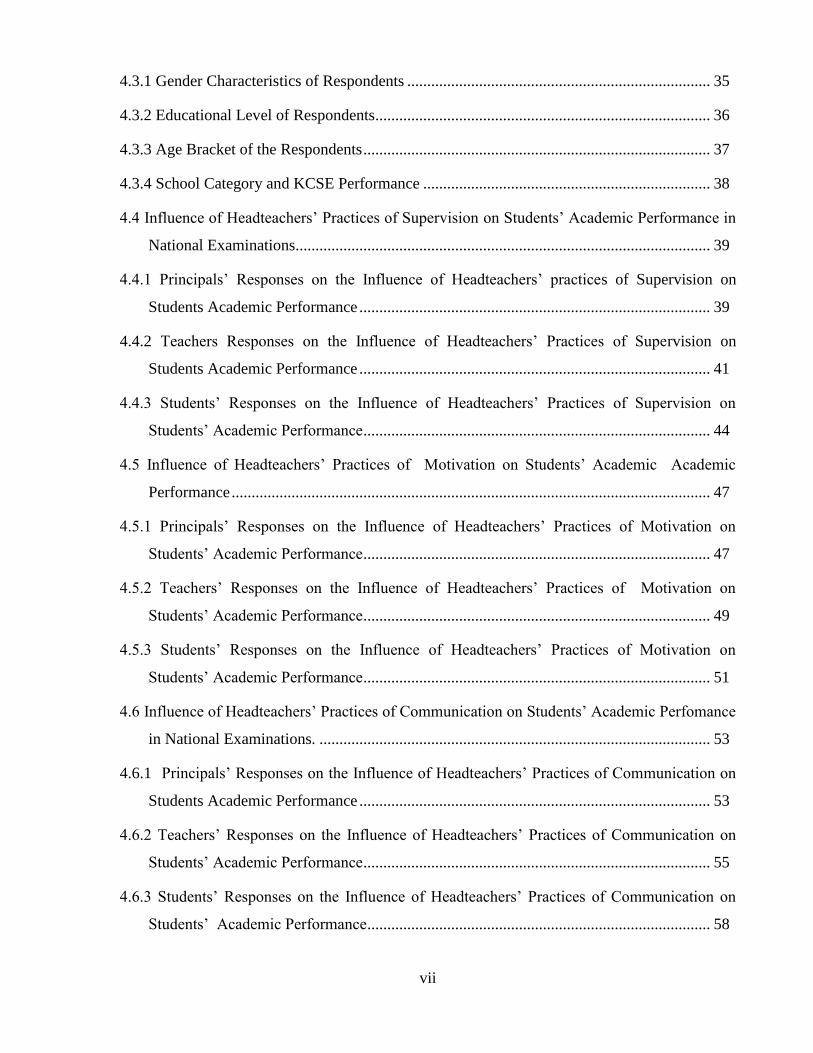
4.3.1 Gender Characteristics of Respondents ............................................................................ 35
4.3.2 Educational Level of Respondents .................................................................................... 36
4.3.3 Age Bracket of the Respondents ....................................................................................... 37
4.3.4 School Category and KCSE Performance ........................................................................ 38
4.4 Influence of Headteachers‘ Practices of Supervision on Students‘ Academic Performance in
National Examinations ........................................................................................................ 39
4.4.1 Principals‘ Responses on the Influence of Headteachers‘ practices of Supervision on
Students Academic Performance ........................................................................................ 39
4.4.2 Teachers Responses on the Influence of Headteachers‘ Practices of Supervision on
Students Academic Performance ........................................................................................ 41
4.4.3 Students‘ Responses on the Influence of Headteachers‘ Practices of Supervision on
Students‘ Academic Performance ....................................................................................... 44
4.5 Influence of Headteachers‘ Practices of Motivation on Students‘ Academic Academic
Performance ........................................................................................................................ 47
4.5.1 Principals‘ Responses on the Influence of Headteachers‘ Practices of Motivation on
Students‘ Academic Performance ....................................................................................... 47
4.5.2 Teachers‘ Responses on the Influence of Headteachers‘ Practices of Motivation on
Students‘ Academic Performance ....................................................................................... 49
4.5.3 Students‘ Responses on the Influence of Headteachers‘ Practices of Motivation on
Students‘ Academic Performance ....................................................................................... 51
4.6 Influence of Headteachers‘ Practices of Communication on Students‘ Academic Perfomance
in National Examinations. .................................................................................................. 53
4.6.1 Principals‘ Responses on the Influence of Headteachers‘ Practices of Communication on
Students Academic Performance ........................................................................................ 53
4.6.2 Teachers‘ Responses on the Influence of Headteachers‘ Practices of Communication on
Students‘ Academic Performance ....................................................................................... 55
4.6.3 Students‘ Responses on the Influence of Headteachers‘ Practices of Communication on
Students‘ Academic Performance ...................................................................................... 58

viii
CHAPTER FIVE ........................................................................................................................61
SUMMARY, CONCLUSIONS AND RECOMMENDATIONS ……………………………..61
5.1 Introduction .......................................................................................................................... 61
5.2 Summary of Research Findings ........................................................................................... 61
5.2.1 Influence of Headteachers‘ practices of Supervision on Students Academic Performance
……………………………………………………………………………………………61
5.2.2 Influence of Headteachers‘ Practices of Motivation on Students‘Academic Performance.
……………………………………………………………………………………..……..62
5.2.3 Influence of Headteachers‘ Practices of Communication on Students‘ Academic
Performance .................................................................................................................. …..62
5.3 Conclusions .......................................................................................................................... 63
5.4 Recommendations ................................................................................................................ 64
5.5 Recommendations for Further Research .............................................................................. 65
REFERENCES ...........................................................................................................................66
APPENDICES ............................................................................................................................71
Appendix I: Kitui Central District Secondary Schools .............................................................. 71
Appendix II: Introduction Letter ................................................................................................ 73
Appendix III: Student`s Questionnaires..................................................................................... 74
Appendix IV: Teachers Questionnaires .................................................................................... 78
Appendix V: Principal‘s Questionnaire ..................................................................................... 83

ix
LIST OF FIGURES
Figure 1: Maslow‘s Hierarchy of Needs….............................................................................24
Figure 2: Revised pyramid of Needs …..................................................................................26
Figure3: Conceptual Frame Work….......................................................................................27
x
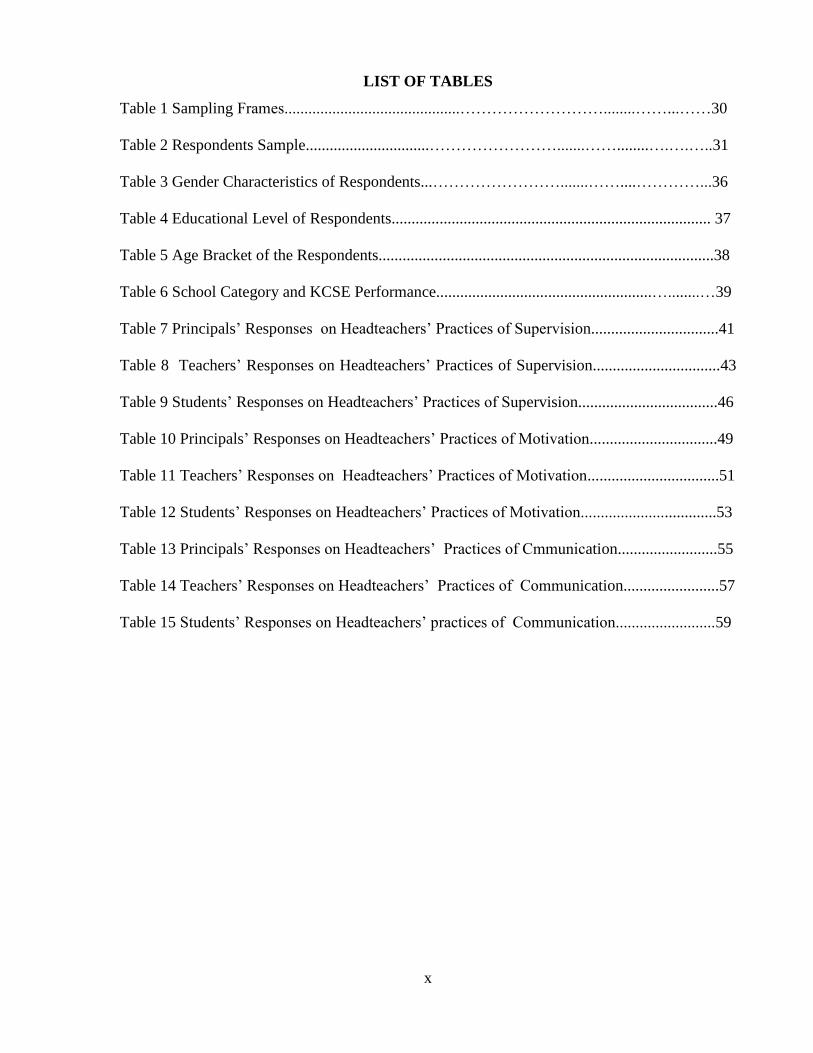
LIST OF TABLES
Table 1 Sampling Frames............................................………………………........……...……30
Table 2 Respondents Sample...............................…………………….......……........….….…..31
Table 3 Gender Characteristics of Respondents...…………………….......……....…………...36
Table 4 Educational Level of Respondents................................................................................ 37
Table 5 Age Bracket of the Respondents....................................................................................38
Table 6 School Category and KCSE Performance......................................................…........…39
Table 7 Principals‘ Responses on Headteachers‘ Practices of Supervision................................41
Table 8 Teachers‘ Responses on Headteachers‘ Practices of Supervision................................43
Table 9 Students‘ Responses on Headteachers‘ Practices of Supervision...................................46
Table 10 Principals‘ Responses on Headteachers‘ Practices of Motivation................................49
Table 11 Teachers‘ Responses on Headteachers‘ Practices of Motivation.................................51
Table 12 Students‘ Responses on Headteachers‘ Practices of Motivation..................................53
Table 13 Principals‘ Responses on Headteachers‘ Practices of Cmmunication.........................55
Table 14 Teachers‘ Responses on Headteachers‘ Practices of Communication........................57
Table 15 Students‘ Responses on Headteachers‘ practices of Communication.........................59

xi
ABBREVIATIONS AND ACRONYMS
KCSE - Kenya Certificate of Secondary Education
KNEC - Kenya National Examination Council
MOE - Ministry of Education
TSC - Teachers Service Commission
DEO - District Education Officer
xii
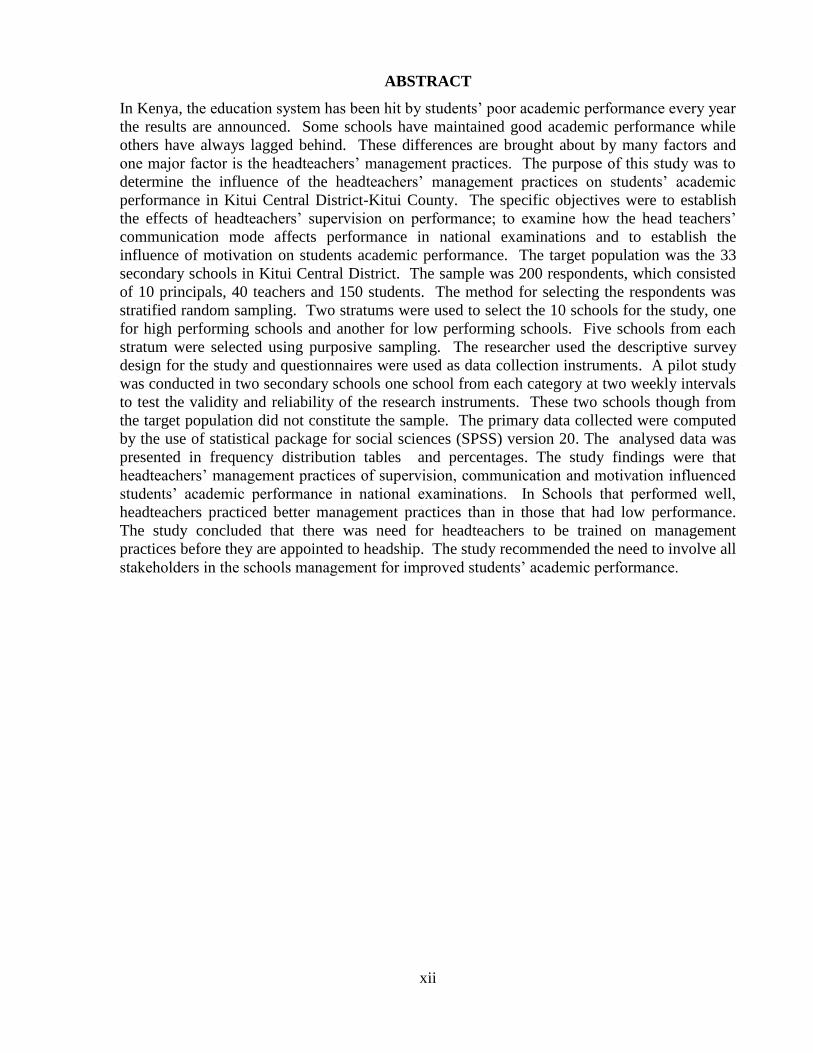
ABSTRACT
In Kenya, the education system has been hit by students‘ poor academic performance every year
the results are announced. Some schools have maintained good academic performance while
others have always lagged behind. These differences are brought about by many factors and
one major factor is the headteachers‘ management practices. The purpose of this study was to
determine the influence of the headteachers‘ management practices on students‘ academic
performance in Kitui Central District-Kitui County. The specific objectives were to establish
the effects of headteachers‘ supervision on performance; to examine how the head teachers‘
communication mode affects performance in national examinations and to establish the
influence of motivation on students academic performance. The target population was the 33
secondary schools in Kitui Central District. The sample was 200 respondents, which consisted
of 10 principals, 40 teachers and 150 students. The method for selecting the respondents was
stratified random sampling. Two stratums were used to select the 10 schools for the study, one
for high performing schools and another for low performing schools. Five schools from each
stratum were selected using purposive sampling. The researcher used the descriptive survey
design for the study and questionnaires were used as data collection instruments. A pilot study
was conducted in two secondary schools one school from each category at two weekly intervals
to test the validity and reliability of the research instruments. These two schools though from
the target population did not constitute the sample. The primary data collected were computed
by the use of statistical package for social sciences (SPSS) version 20. The analysed data was
presented in frequency distribution tables and percentages. The study findings were that
headteachers‘ management practices of supervision, communication and motivation influenced
students‘ academic performance in national examinations. In Schools that performed well,
headteachers practiced better management practices than in those that had low performance.
The study concluded that there was need for headteachers to be trained on management
practices before they are appointed to headship. The study recommended the need to involve all
stakeholders in the schools management for improved students‘ academic performance.
1
CHAPTER ONE
INTRODUCTION
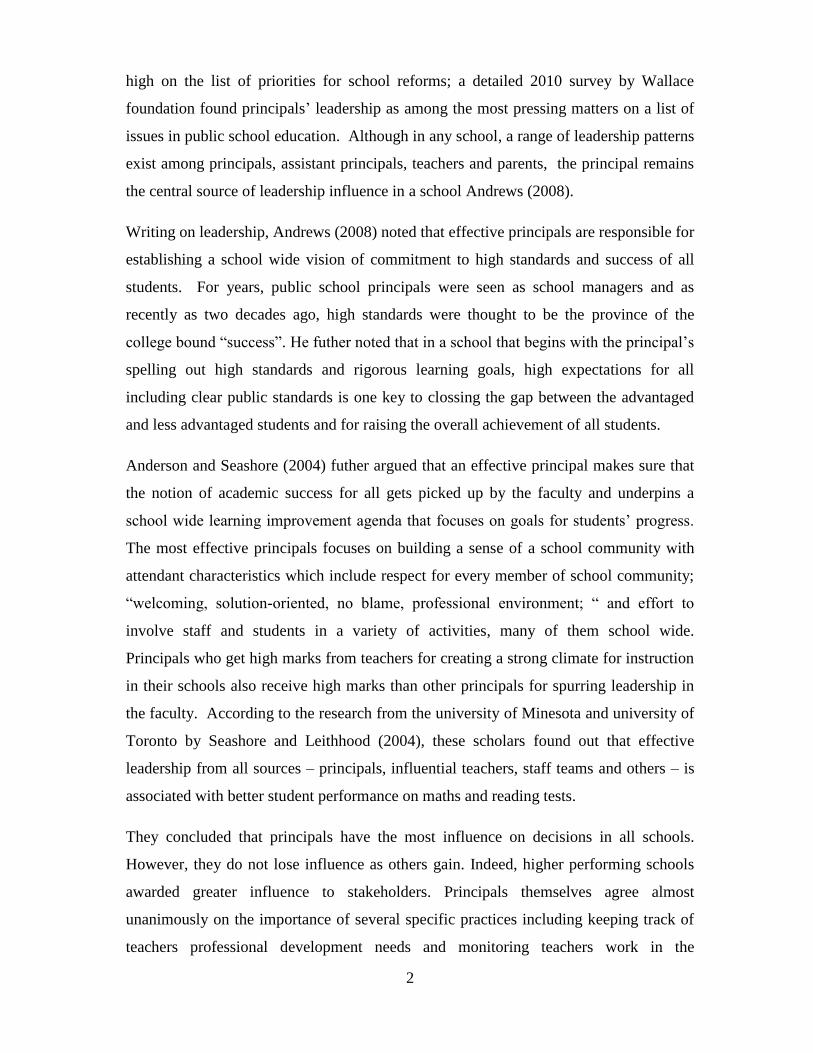
1.1 Background of the Study
According to Holmes (2000), in a school set up, managment practices refer to the way a
school principal uses the human resources and other resources and promotes ―best
value‖ and the way the school works with its governing body. They also refer to
methods or techniques found to be the best effective and practical means in achieving an
objective while making the optimum use of its firms resources,
http://www.businessdictionary.com (2014). The central question addressed is ―to what
extent does the principals‘ management practices play in student‘s academic
achievement?‖ The traditions and beliefs about leadership in schools are no different
from those regarding leadership in other institutions. The principal is considered to be
vital to the successful functioning of many aspects of a school.
Studies conducted in U.S by Marvel and Morton (2006) identified the principal as the
single most influential person in a school. He/she is the person responsible for all
activities that occur in and around the school building. It is the principals‘ management
practices that set the tone of the school, the climate for teaching, the level of
professionalism, the morale of teachers and the degree of concern for what students may
or may not become.
The principal is the main link between the community and the school and the way he/she
performs in this capacity largely determines the attitudes of parents and students about
the school. Seashore and Leithhood (2010) observed that if a school is vibrant,
innovative and child centred, if it has a reputation for excellence in teaching, if the
students are performing well, one can almost always point to the principals‘
management practices as key to success.
Karen and Kenneth (2004) believe that principals perform among other key functions
shaping a vision of academic success for all students, creating a climate hospitable to
education, cultivating leadership in others, improving instruction, managing people, and
data processes to foster school improvement. Today, improving school leadership ranks
2
high on the list of priorities for school reforms; a detailed 2010 survey by Wallace
foundation found principals‘ leadership as among the most pressing matters on a list of
issues in public school education. Although in any school, a range of leadership patterns
exist among principals, assistant principals, teachers and parents, the principal remains
the central source of leadership influence in a school Andrews (2008).
Writing on leadership, Andrews (2008) noted that effective principals are responsible for
establishing a school wide vision of commitment to high standards and success of all
students. For years, public school principals were seen as school managers and as
recently as two decades ago, high standards were thought to be the province of the
college bound ―success‖. He futher noted that in a school that begins with the principal‘s
spelling out high standards and rigorous learning goals, high expectations for all
including clear public standards is one key to clossing the gap between the advantaged
and less advantaged students and for raising the overall achievement of all students.
Anderson and Seashore (2004) futher argued that an effective principal makes sure that
the notion of academic success for all gets picked up by the faculty and underpins a
school wide learning improvement agenda that focuses on goals for students‘ progress.
The most effective principals focuses on building a sense of a school community with
attendant characteristics which include respect for every member of school community;
―welcoming, solution-oriented, no blame, professional environment; ― and effort to
involve staff and students in a variety of activities, many of them school wide.
Principals who get high marks from teachers for creating a strong climate for instruction
in their schools also receive high marks than other principals for spurring leadership in
the faculty. According to the research from the university of Minesota and university of
Toronto by Seashore and Leithhood (2004), these scholars found out that effective
leadership from all sources – principals, influential teachers, staff teams and others – is
associated with better student performance on maths and reading tests.
They concluded that principals have the most influence on decisions in all schools.
However, they do not lose influence as others gain. Indeed, higher performing schools
awarded greater influence to stakeholders. Principals themselves agree almost
unanimously on the importance of several specific practices including keeping track of
teachers professional development needs and monitoring teachers work in the

3
classroom; observing and communicating on what‘s working well and what is not.
Moreover, they shift the pattern of the annual evaluation cycle to one of on going and
informal interactions with teachers Michael and Brandley (2003).
Brandley and Michael (2003) described five key responsibilities of the principal
(i) Shaping a vision of academic success for all students, one based on high
Academic Standards.
(ii) Creating climate hospitable to education in order that safety, a cooperative
spirit and other foundations of fruitful interaction prevail.
(iii) Cultivating leadership in others so that teachers and other adults assume their
part in realising the school vision.
(iv) Improving instruction to enable teachers to teach at their best and students to
learn their utmost.
(v) Managing people, data and processes to foster school improvement.
Kenya like any other country values education because of its intrinsic and extrinsic
gains. Education is an important phenomenon in the society because it helps the
individual learners to overcome their limits and transcends in order to have their
aspirations achieved. The government of Kenya has a duty to ensure that its citizens are
educated to enable them to participate fully in the development of their country.
Education is important in Kenya because the kind of job one acquires generally depends
on his/her level of education. Normally, the higher the level of education, the more
prestigious the job and the greater the earnings.
The Kenya Education Commission Report (1964) observed that secondary education not
only serves as a base for higher education but also opens the door for wage employment.
Ones level of education determines the kind of occupation he/she gets into because
education is seen as a powerful weapon which can be used for economic, social and
intellectual advancement. Education equips the child with appropriate skills, knowledge
and understanding of the world in which he lives and helps the child to attain his/her full
formation or completeness as a person. Examination and certification are central to
education and training process in Kenya because they are a means of evaluating the level
of achievement for purposes of further education, training and/or employment. The

4
Kenyan education system is examination oriented, because the success of any school is
measured by the quality of results in national examinations. The Daily Nation as
reported by Muya (1987) observed that public examinations had become a matter of life
and death in the country because we are living in an examination-oriented society.
Without a good certificate one cannot get a better future.
There is high competition among Kenyan schools each trying to produce good results
every year. There is much emphasis on good performance in examinations and
acquisition of good academic certificates that would enable school leavers to gain
further education or employment. There has been increasing pressure from parents,
taxpayers and stakeholders in schools‘ performance in national examinations. They
evaluate schools in terms of students‘ performance in national examinations. It is
evident that some secondary schools perform better every year in national examinations
than others. One factor which is responsible for this is the differences in school
organization and the headteachers‘ managerial practices.
Fuller (1987) noted that management practices can vary enormously at times
independent of school official goals and that headteachers employ a variety of means in
supervising the staff and motivating teachers to improve their practices.The
headteacher‘s leadership behaviour is given serious attention by educators and policy
makers. The headteacher is the central figure when the school is considered as a formal
organization. His position in the school provides him with an opportunity to motivate his
staff and to improve the standards of academic performance in the school. Headteachers
are greatly accountable for academic achievements of their students. Jode and Jacoby
(1986) concur that instructional processes are affected directly or indirectly by various
management practices exercised by headteachers. This leads to high or low academic
achievement in schools. Headteachers are charged with the task of managing human
resources in their schools. Their managerial behaviour has great impact either negatively
or positively. Effective headteachers usually concentrate on planning, coordinating and
facilitating the work without neglecting interpersonal relationships with the staff,
support staff and the student body.
5
Studies conducted by Andrews, Jode and Jacoby (1986) all concur that ―the strong
leadership of the headteachers was the greatest prediction of student achievement in
national examinations‖.
In their studies Andrews, Jode and Jacoby (1986) observed that efficient use of
instructional time within the classroom is more strongly determined by the management
practices of the headteacher. More effective headteachers are likely to set high
performance goals for their schools and improved performance in national examinations.
Studies conducted by Brookover (1979) observed that good performing schools are run
by headteachers who exercise assertive leadership while unsuccessful schools are run by
headteachers who are bogged down with administrative details which renders them
unable to engage in leadership activities. These studies stress that the managerial
practices of headteachers are important in determining the schools‘ performance in
national examinations. Evidence from recent studies conducted by Leithhood (2010)
show that schools‘ organizational management greatly influences students academic
outcomes in schools. Thus what the headteachers, the teachers and the students do in
schools and in classrooms, that is, how they spent their time in schools, how the pursue
their objectives and how they interact greatly determines the students‘ performance in
national examinations. In high performing schools, team spirit is encouraged by the
headteachers. There is order and safe climate, which encourages teaching and learning.
The minister of education (1993) noted that the admission of best students and facilities
parse does not matter, what matters is what goes on inside the schools. Positive climates,
hard work by teachers and students, discipline and effective teaching were the most vital
factors behind good results in national examinations. The school‘s effort is measured by
the quality of results in national examinations. The headteachers are charged with
implementation of the curriculum and general school organization, which contributes to
good performance in examinations. Good examination results are the ultimate blessing
of schools. The Kenyan parents access the schools effectiveness on how students
perform well in national examinations.
Bigala (1978) put it that, examinations are end in themselves and a source of fear and
anxiety to pupils who are very concerned about memorization of abstract information
which enables them to pass examinations. The headteacher therefore occupies a strategic

6
position in the school organizations structure for developing a school climate which is
conducive for learning. Since the success of teaching and learning takes place in the
school, the quality of education is greatly determined by the headteachers‘ managerial
practices, which play a major role in determining the schools performance in national
examinations.
1.2 Statement of the Problem
In Kenya, the problem of performance in secondary schools in national examinations
has been a concern of all stakeholders. In Kitui County, the situation has been worse due
to the continuous students‘ poor academic performance every year. Very few students
qualify to join public universities and Kitui Central District has lagged behind in
students‘ academic performance in national examinations. Educators and members of
public acknowledge that different schools achieve different degrees of success even with
similar learning facilities. There is great competition today among schools all trying to
produce better results in national examinations. Some have maintained better results
while others have dropped due to different management practices of headteachers in the
schools. Success in producing good results in national examinations is largely
determined by the headteacher and the type of management practices in the school. The
headteachers‘ management practices are important in shaping the school‘s
organizational climate and the students‘ academic performance.
In Kenya studies focusing on headteachers‘ management practices have not been well
conceptualized. Studies available tend to focus on students‘ discipline, teachers‘
motivation and academic performance in public schools in Koibatek District, Kenya as
reported by Ocham (2012). In his studies, though students‘ discipline, and teacher
motivation were found to boost morale in enhancing students performance, there is lack
of sufficient knowledge on the influence of headteacher‘s management practices on
students academic performance. In public schools in Kitui County performance has been
poor as indicated by poor performance index of students in their KCSE examinations.
There is therefore need to look at the influence of headteachers‘ management practices
on students‘ academic performance and suggest possible interventions. Thus, this study
sought to investigate the influence of headteachers‘ management practices on students‘
academic performance and suggest possible interventions and strategies for improved

7
students‘ academic performance in the District and in Kitui County hence the need for
this study.
1.3 Purpose of the Study
The purpose of this study was to investigate the influence of the management practices
of headteachers on students‘ academic performance in public secondary schools. The
study attempted to: examine whether headteachers‘ management practices of
supervision, motivation and effective communication affects students‘ academic
performance in national examinations.
1.4 Objectives of the Study
The objectives of the study were:
i. To determine the influence of headteachers‘ practices of supervision on
students‘ accademic performance in public secondary schools in Kitui Central
District.
ii. To establish the influence of motivation by headteachers on students‘ accademic
performance in secondary schools.
iii. To establish whether effective communication by headteachers affect students‘
academic performance in secondary schools.
1.5 Research Questions
The study was guided by the following research questions:
i. How does the headteachers‘ level of supervision affect students‘ academic
performance?
ii. In which way does the headteacher‘s motivation in school affect students‘
accademic performance?
iii. How does the headteacher‘s management practice of communication affect
students‘ academic performance in national examinations?
1.6 Significance of the Study
The study addresses the management practices of headteachers‘ in secondary schools in
Kitui Central District. It highlights the management practices of headteachers which can
result to improved performance in national examinations in the district. The findings of

8
the study could shed light to the rest of the schools outside the District on management
practices which can bring about better students‘ academic achievement. The study will
be useful to the educators when formulating ways of improving performance in the
county and elsewhere. The academia may also benefit in that the study will add to the
existing knowledge in headteachers management practices and also propose areas for
further studies.
1.7 Limitations of the Study
The data which was used in the study was collected in a span of six months. This
implies that even though findings of the study depicted the situation as it was at that
particular time, a study of a longer period of time would produce more representative
results. Due to the vast geographical dispersion of schools, the researcher was not in a
position to have a larger sample size for better representation. However, the sampled
schools were used to represent the sampled population for the study. There are other
factors that affect students‘ academic performance; however the researcher was limited
to headteachers‘ management practices due to the limited study period.
1.8 Delimitations of the Study
There are many factors that affect students‘ academic performance in secondary schools;
however, this study only focused on the headteachers management practices and only in
Kitui Central Public Secondary schools. A study of a wider area would produce more
representative results.
1.9 Assumption of the Study
The study assumed that:
i. Headteachers‘ management practices influence the students‘ academic
performance in national examinations.
ii. Headteachers‘ management practices of supervision, communication and
motivation greatly affected students‘ academic performance in national
examinations.

9
1.10 Definition of terms
Motivation - In this study refers to ways of making employees have
interest in their work.
Supervision - Refers to a system of overseeing that employees perform
their duties well.
Communication - In this study refers to the processes used by the
headteachers to pass information in the school.
High Performing Schools - These refers to schools whose performance in KCSE
is or above a mean score of 5.00 out of 12.00.
Low performing Schools - They refers to schools whose performance in KCSE
is below a meanscore of 5.00 out of 12.00.
Performance: - In this study refers to the grades both per subject and
overall grades that a student obtained in national
examinations.
Management Practices - These refers to the management skills/behaviour
exercised by a headteacher in a school.
Headteacher/Principal - These two are used to mean the executive head of
a Secondary School institution or the highest authority in
the school.
Students Performance - The students‘ mean achievement score in KCSE
Standardised examinations
National Examination - Standardised tests designed to measure the students‘
academic and Practical knowledge on various subjects
taught during form one to form four in secondary
curriculum in the Kenya system of education. The
National Examination referred to was the Kenya
certificate of Secondary examinations (KCSE).
10
CHAPTER TWO
LITERATURE REVIEW
2.1 Introduction
In this chapter, the researcher presents a review of related literature on management
practices of headteachers in secondary schools and their impacts on students‘ academic
Performance. The first part presents literature in general form on headteachers
management practices in schools and Studrnts academic performance in national
examinations. The second part is devoted to related literature on each specific
headteachers – Management practices of Supervision; Motivation and Communication
on Students‘ Academic performance. The third part deals with the Theoretical
framework and the last part presents the Conceptual framework for this study.
2.2 Headteachers’ Management Practices and Students’ Academic Performance in
National Examinations
Management is a process that involves planning, organizing and staffing, controlling and
problem solving. Effective headteachers usually concentrate on planning, coordinating
and facilitating the work without neglecting interpersonal relations with the staff,
students and the subordinates. More effective headteachers are likely to set high
performance goals for their schools and act as linking pins with other group and with
higher management. Edmonds (1979) in his study of exceptional urban elementary
schools pointed out that the headteachers‘ management practices were crucial to school
success because they influence the behaviour of subordinates and leaders and initiate
programs, set policies, obtain materials and fiscal resources and provide motivation.
Headteachers are responsible for introducing useful changes aimed at improving the
quality of schools instructional programmes. Studies on exemplary schools have
described effective headteachers as task oriented, action oriented, well organized, skilled
in work, and delegation in getting things done Edmonds (1979). Andrews study as
reported by Brandt (1987) found that high performing schools were characterized by
high expectations, frequent monitoring of student progress, a positive learning and goal
clarity. Effective headteachers exert pressure on teachers and students for high academic
achievement. Brookover (1979) in Michigan found that successful elementary head
teachers frequently visited classroom, presented innovative programs and techniques to

11
the staff to discuss books relating to school effectiveness. They met with small groups of
teachers to discuss their students‘ achievement and organized teachers‘ effectiveness
training programmes.
Brookover (1979) in his studies further noted that the highest level of school
management specializes on students‘ achievement and their well being. Headteachers in
high achieving schools use various means such as interpersonal relations, administrative
and other managerial behaviour that provide the central focus of other styles of
leadership in order to achieve the schools‘ objectives. The headteachers‘ management
practises are therefore a key player in establishing the school‘s wide instructional goals,
practices and in developing the schools‘ curriculum. One of the roles of the headteacher
is to carry out internal supervision of curriculum implementation in his/her school. This
involves physical observation of teachers lessons in progress. Regular class supervision
promotes curriculum goals and failure to do so may lead to poor performance in national
examinations Edmods (1980).
By the early 1980‘s there emerged an agreement about the characteristics common to the
schools which people admired in U.S.A. Edmonds (1980), lists seven characteristics of
high performing schools in examinations in U.S.A, as follows:
i. High performing schools have a clear articulated instructional focus; that is, a
clearly articulated school mission through which the staff shares an
understanding of a commitment to the instructional goals, priorities, assessment
procedures, and accountability. The staff accepts responsibility for the students‘
learning of the school‘s essential curricular goals.
ii. There is use of systematic evaluation and assessment. Edmonds (1980) argues
that no school can be effective or successful in examination performance unless
it has academic goals to be accomplished, because, effectiveness means goal
accomplishment. It is not surprising, then, that good schools have a curriculum,
which is constantly evaluated and that students‘ progress is regularly assessed.
The results of assessment are used to improve individual students‘ performance
and also to improve instructional programmes.
iii. There is expectation in effective schools that all students will learn well.
Edmonds (1980) argues that; Most consistent findings in the school
12
effectiveness is the crucial connection between expectations and achievement in
the standard tests.
iv. There is an orderly, purposeful, businesslike atmosphere which is free from
threat of physical harm. The school climate is not oppressive and is conducive to
teaching and learning.
v. In the high performing schools, teachers allocate a significant amount of
classroom time to instruction in the essential skills. For a high percentage of this
time, students are engaged in whole class or large group learning activities that
are planned and teacher directed.
vi. The principal acts as an instructional leader and effectively and persistently
communicates that mission to the staff, parents and students. The principal
understands and applies characteristics of instructional effectiveness in
management of instructional programmes.
vii. The parents understand and support the basic mission of school and are made to
feel that they have an important role in achieving this mission.
Brookover (1982) discovered that:
i. Teachers in higher achieving schools spend a larger proportion of class time on
instruction.
ii. Lower achieving schools tend to write off a larger proportion of their students.
iii. Higher achieving schools tend to create activities in which groups of students
compete as teams rather than individuals.
iv. Teachers in high achieving schools make immediate correction and provide re-
instruction, when students failed to give correct responses and positive
reinforcement was given to students who gave correct answers.
v. The higher achieving schools had an orderly and safe climate which encouraged
learning and teaching.
vi. These schools concentrated on their professional task of teaching and learning
and they gained their eminence because they do not allow trivialities or
distractions to deviate them from that task.
In Britain, the findings of Rutter (1979) in their study of twelve-inner London schools,
found out that:

13
i. Inner London Schools‘ lessons were-oriented with time focused on subject
matter rather than on behavior or administration.
ii. Teachers worked and planned together, and there was strong supervision and co-
ordination of instruction by senior teachers.
iii. Formal reward systems, public commendation, and immediate feedback to
students and good performance existed in the good schools.
iv. Students were expected to take responsibility for day-to-day matters in their
school like looking after their own books and facilities.
v. Home work was set and followed up. The good schools often emphasized good
academic performance and students were expected to work hard to succeed in
their examinations.
vi. The good schools had a good atmosphere and ethos of students achievement.
According to Rutter (1979), the above differences were accounted for by school
alterable factors of; degree of academic emphasis, teacher actions in lessons, the
availability of incentives and rewards, good condition for pupil‘s learning, and the extent
to which children were able to carry out responsibility. The principals‘ management
practices greatly contributed to the differences in performance. Boyan (1985)
consistently reported that successful schools in examination performance, have the
following characteristics: School climate conducive to learning, one free of disciplinary
problems and vandalism; a school wide emphasis on basic skills on instructions;
teachers who hold high expectations for all students to achieve; a system of clear
instructional objectives for monitoring and assessing students‘ performance; and a
school principal who is a strong programmatic leader and who sets high standards,
observes classrooms frequently, maintains students‘ discipline, and creates incentives
for learning.
Orora (1998) observed that research on school leadership and school management is
gaining momentum with the increasing awareness that within the school environment,
the headteachers are the actors in charge of translating policies into everyday practices.
Evidence from school improvement literature according to studies in the United States
by Brooker (1979), Edmonds (1982), Mortimore (2000), all concur that effective leaders
exercise a direct or indirect but powerful influence on the school‘s capacity to

14
implement reforms and improve students‘ levels of achievement. They futher pointed
that headteachers in high achieving schools engage more in behaviour associated with
cultural linkage than headteachers in other schools. In their study students‘ achievement
appears to be influenced by environmental and organization characteristics. Studies
conducted by Evans (1999), Sorgionanni (2001) and Chege (2002) found that the quality
of leadership in a school matters in determining the motivation of teachers and the
quality of the teaching. Moreover, Sergiovanni(2001) noted that the more distributed
the leadership is throughout the school community, in particular to the teachers, the
better the performance of that school in terms of students‘ outcomes.
The roles and responsibilities of school principals are vital to the function of individual
schools. There is therefore need to have policies that actually result in school
environment in terms of performance. Kilanga (2013) noted that the school principals
need to be well prepared in leading organizational changes which address the
performance gaps of students. The development of the education sector has been a long
standing objective of the government of Kenya since independence in 1963 to date.
Education is considered by various stakeholders and players as a basic need and a right.
Performance ranks high on the national agenda with educators and policy makers
focusing on testing, accountability, curriculum reform, teacher quality and headteachers‘
management practices. Few studies have been done in Kenya on principals‘
management practices and their contribution to performance in public secondary
schools. Majority of them confined their studies to the administrative functions of the
school principals. For example, Wamukuru and Odebero (2006), Abaya (2011) carried
out a study on how secondary principals build trust in Kenya secondary schools. The
study based in western Kenya found out that principals had to among others sustain high
levels of competence, professionalism as well as morals. The study however did not
relate the trust thus created within and without the schools with the way students
performed academically. This is a gap that this study wishes to address.
2.3 Influence of Headteachers’ Management Practices of Supervision on Students’
Academic Performance
According studies conducted by Kent (1989) headteachers should supervise teaching
and learning in the school by: ensuring that early lesson planning is always done,
15
ensuring that lessons are structured with an interesting beginning, revision of previous
lesson, teacher voice variations and summary of major points are done, that there is use
of backups (teaching aids by teachers) properly and that there is good relationship
between teachers, students and that teachers follow up curriculum strictly. Edmonds
(1979) further noted that students‘ progress should be frequently monitored and that in
high performing schools headteachers establish a system of evaluating the students
frequently through tests and examinations. Those who perform unsatisfactory are forced
to repeat the work by teachers. It is communicated to classteachers by the headteachers
that their students‘ progress is a concern for the whole school.
Orlosky (1984) noted that supervision is a major function that the school head must
carry. It includes supervision of activities supportive of improving instruction that is
curriculum and material development, evaluation of programmes and instructional
planning. Usdan (2001) argues that, for there to be student learning, the principals must
serve as leaders. Among the things they list as requirements to achieving this include:
working with teachers to strengthen skills, knowledge of academic content and
pedagogy, collect, analyse and use data, posses the leadership skills to fulfill the role and
ability to rally all stakeholders to increase students performance. Teachers ought to be
closely supervised for effective teaching in order for students to consistently do well in
national examinations. For a school to perform well in national examinations there must
be a teaching scheme for each subject on the curriculum. This is because the teaching
schemes provide the school with organizational systems of content coverage for the full
period of the course in each subject Mbiti (1974).
Mbiti (1974) says that supervision concerns the tactics of efficient and proper
management of personnel. The headteachers should frequently monitor the teaching and
learning process in the school. The failure of any organization depends mainly on its
personnel. There must be a proper system of supervision to ensure that the organizations
goals are met. In schools which perform well, the headteachers give proper directions
about what to do and as well spots the problem areas and rectifies them before things get
worse.
The Kenya‘s education system is dominated by examination orientated teaching where
passing examination is the benchmark for performance because there is no internal
16
system of monitoring learning education cycle. Maiyo (2009) noted that examinations
are generally accepted as valid measures of achievement. The responsibility of checking
professional documents like teachers‘ schemes of work and lesson plans lies in the
hands of the headteacher. This may be done in person or he may delegate to the deputy
headteacher or the senior the teacher. Preparation and use of schemes of work by the
teachers, enhances sequential teaching and results to improved academic achievement.
This should be done frequently to allow the headteachers to monitor curriculum
implementation. Lack of this close monitoring is a factor which could contribute to poor
performance in national examinations. Writing on the American set up Usdan (2001)
noted that the role of the principal is that of manager where it is the duty of the principal
to manage the budget, manage personnel and carry out other operational issues. In the
same scenario in Kenya it is the principal who is the TSC agent in the school who
oversees the implementation of the curriculum as stipulated by MOE. The management
practices of the principal ensure the effectiveness of the school.
2.4 Influence of Headteachers’ Management Practices of Communication on
Students’ Academic Performance
Communication is a very important tool in management. It can be used to boost the
morale of teachers and pupils in the schools. Effective communication in the school
foster friendship among the staff, students, non-teaching staff and the whole school
community. Goodland (1984) also noted that learning appeared to be enhanced when
students understand what is expected of them, get recognitions of their work, learn
quickly about their errors and receive guidance on improving their performance.
Effective communication is necessary if a school has to achieve its educational
objectives. Studies conducted by Sweeney (2012) pointed that headteachers should be
interested in what goes on in classroom because that is where the customers are served
to determine the quality factor of service provided. This is ensured through effective
communication in the school, which eventually impacts on the school academic
achievement in natioonal examinations. Effective headteachers are instrumental in
schools‘ success in national examinations.
For example, Andrews study as reported by Brandt (1987) reported that successful head
teachers communicate the school vision effectively, provide resources for instruction,

17
act as instructional resources and maintain a high visible presence in all aspects of the
school. The study found out that the schools that performed well in mathematics: the
principals who are the managers of their schools practiced democracy in that they took
everybody on board with no reservations. This study was however limited only to
students performance in mathematics.
Mbiti (1974) noted that a manager who knows his job well must brief members of the
teaching staff of their responsibilities. He must inform his staff about events and
activities and avoid last minute communication. Headteachers as managers of schools
among other things must explain and clarify the objectives of ongoing innovations to the
teachers and students in the school if these innovations are to be carried out successfully.
Mbiti (1974) further notes on the importance of communication through staff meetings,
which should aim at: Programming for the future events and examinations in the school,
making official announcements to teachers on the content of circulars from the ministry,
discussing subject allocations and fostering friendship among staff. Education managers
must create opportunities for understanding the needs aspirations and frustrations of
each staff members through effective communication, mutual trust and openness
amongst stakeholders.
Ngware and Wamukuru (2006) noted that, in addition to general communication skills,
training teachers in the principles of teamwork and team building would be of great
benefit to both the teachers and students. A team that meets regularly provides the
members with the opportunity to express concerns, offer opinions and ask for
clarification of roles, duties and goals. Teams with clearly defined roles and regularly
scheduled meetings can experience many advantages not the least of which include
increased job satisfaction, reduced tension, improved job performance and self
confidence. Effective headteachers should identify the expectations for their schools
and describe them correctly for the entire schools.
The studies by Nzuve (1999) found that most people would like a clear understanding of
what is expected of them in the workplace. To provide the best education or care for
students, principals need to communicate clearly and regulary communicate to share the
frustrations and disappointment of the teachers and other workers. Teachers must also
18
know the principles of effective communication and how to use these communication
skills to provide students with the daily direction they need in the school.
Gray (2004) noted that it is through intense social communicative processes that
organizational cababilities are developed and enacted. Communication is therefore of
great importance in the schools‘ socialization, decision making, change management and
problem solving processes. In a school set up, there has to be communication for it to be
effective and efficient in achieving the school set goals. Communication builds up
relationships in schools among the principals and the school community.
2.5 Influence of Headteachers’ Management Practices of Motivation on Students’
Academic Performance
Motivation is the complex forces, incentives, needs, desires, tensions and other
mechanisms which start and maintain voluntary activity by members of an organization
such as a school, for purpose of attaining personal aims, organisational goals, targets,
professional roles and status Hoy and Miskel (1987). Good students achievement will
occur when we have a situation whereby teachers look at principals as facilitators,
supporters and reinforces in accomplishing, the school‘s mission rather than as guiders,
and leaders of their own private plan Mc Ewan (2003). He further argued that school
community should ensure maximum flexibility with an open door where teachers, non
teaching staff and students are encouraged to consider school problems which must be
talked by the person most capable of resolving them. Schools should provide fringe
benefits and exclusive privileges. For instance, school based Health Services for
students, teachers and non teaching staff and the surrounding local community.
Hoy and Miskel (1987) observed that a school should have an outreach package for all
community members. These could include clubs, retirement packages, competition
prizes and rewards, certificates of services and recognition awards. Schools should
develop an overall school based incentive systems. Hence, everything done; each
member of the school community should try to improve to make a better product and
give a better service with minimum of resource outlay. Robbins (1988) noted that
motivation of human resources in any work place is associated with high productivity.
Rewards may be used for motivation either financial on non-financial rewards. Many
studies and reports have associated the productivity of human resources with how such

19
resources are managed. Educational administrators have recommended rewards, which
are individualized to reflect the differences, in what employees consider important.
Robbins (1988) pointed out that rewards should be given on the basis of effort and
performance of personnel.
The way staff members and pupils are compensated determines their motivational levels.
The staffs that are better enumerated are likely to be more motivated than poorly
remunerated staff Mbiti (1974). He further noted that headteachers must realize that their
major tasks include among other things seeing to it that necessary monitory resources
are available for the school use and to motivate their staff to produce a lively school
spirit as well as excellence in work performance. Motivation is necessary if schools
objectives and overall school efficiency is to be achieved. It makes the teachers put
utmost effort in their work and leads to school efficiency and better academic
perfomance.
Armor (1976) observed that motivation in the school should not only be through
monetary rewards but it should also involve the proper use of verbal praise and other
non-monetary rewards such as letters of appreciation and presentation of gifts.
Headteachers should also recommend promotion of teachers who have shown excellent
performance to boost their morale and productivity. Studies conducted by Ocham (2010)
pointed out that the greater involvement of teachers in school decision making improve
teacher motivation and commitment hence improves school performance. He argued that
as managers, headteachers should work to maintain an environment that supports
teachers‘ efforts in the classroom and minimize outside factors that can disrupt the
learning process.
Storey (2002) argued that in high achieving schools headteachers encourage a spirit of
cooperation between the staff, the administration and the entire student body in the
school. Studies by Otieno (2008) on factors influencing performance of Gusii schools
found out among others, inadequate teaching resources, poor syllabus coverage, poor
administration leading to lack of motivation in teachers and poor infrastructure as
common factors at poorly performing schools in national examinations. The survey
concluded that in good performing schools, they maximized support from parents, high
standards of discipline among teachers and students. Hayness (2011) is of the opinion
20
that maintaining healthy employees‘ relations is an essential pre-requisite for
organizational success, hence principals should relate well with the teachers for
improved academic performance.
A school in which good morale prevails is likely to have less disciplinary problems
amongst teachers and students. Headteachers have recognized the fact that high
motivation contributes to academic success of students in national examinations rather
than school facilities. For example in the Daily Nation (1993) the headteacher of Nyeri
High School reported that motivation and hard work on the part of students and teachers
had contributed to the success of the school in national examinations. It is clear that high
academic achievement is observed in schools where both teachers and students are
motivated by headteachers.
Bhella (1982) in a study that correlated the teachers‘ production and principals‘
leadership found out that where important relationship exists between teacher/principal
relationship and his/her concern with people, production was high. The study showed
that a principal who demonstrates a high level concern for people and for the product,
has a better rapport with school community. Renson (2009) carried out a study on the
role of the school leadership on students‘ achievement in Kenya. The research focused
on how the principals leadership style affects the performance on mathematics in
Kenyan secondary schools. The study did not relate the influence of headteachers
management practices on academic performance thus the need for this study.
2.6 Performance
Generally, the concept of organizational performance is founded upon the thought that,
an organization is a voluntary alliance of productive assets that include human, physical,
and capital resources with the aim of realizing a shared purpose Barney (2001).
Armstrong (2001) quotes Brumbach (1988), as having indicated that performance refers
to results as well as behaviors, and fine-tuning organizational behaviors and work
activities with the aim of achieving results or outcomes. These behaviors are as a result
of physical and mental effort applied to tasks. The behavioral aspect of performance has
to do with what an individual does at work place. In a school set up this will include for
instance, teaching basic reading skills to elementary school children. For any behavior to
be subsumed under the performance concept, it has to be relevant to the organizational

21
goals Campell (1999). On the other hand, the results aspect refers to the consequence of
the individuals‘ behavior; these results are however dependant on other factors apart
from the individuals behavior. In a school setup, the results aspect of performance can
be defined but is not limited to students test scores, examination results, students‘
capability to generally apply what is learnt, and the graduation rate to institutions of
higher learning.
2.7 Theoretical Frame Work: McGregor’s Theory X and Y
Theory X postulates that workers or employees are lazy and will always avoid
responsibility to achieve high performance; there is need to control and even threaten
them Okumbe (1998). Theory Y postulates that employees are human being and
therefore a manager should provide the enabling environment that enables employees
to realise the potential they are endowed with. McGregor‘s theory was adopted for
this study because there are cases where teachers and students just do not want to
follow a certain code of set behaviour and the leader or managers have to apply
various management practices to ensure that they do the right things.
Theory X assumes that people dislike work; they want to avoid it and do not want to
take responsibility. Theory Y assumes that people are self-motivated, and thrive on
responsibility. In a Theory X organization, management is authoritarian, and
centralized control is retained, whilst in Theory Y, the management style is
participative: Management involves employees in decision making, but retains power
to implement decisions. Theory X employees tend to have specialized and often
repetitive work. In Theory Y, the work tends to be organized around wider areas of
skill or knowledge; Employees are also encouraged to develop expertise and make
suggestions and improvements. Theory X organizations work on a ‗carrot and stick‘
basis and performance appraisal is part of the overall mechanisms of control and
remuneration. In Theory Y organizations, appraisal is also regular and important, but
is usually a separate mechanism from organizational controls. Theory Y
organizations also give employees frequent opportunities for promotion.
Although Theory X management style is widely accepted as inferior to others, it has
its place in large scale production operation and unskilled production-line work.

22
Many of the principles of Theory Y are widely adopted by types of organizations that
value and encourage participation. Theory Y- style management is suited to
knowledge work and professional services. Professional service organizations
naturally evolve Theory Y- type practices by the nature of their work; Even highly
structure knowledge work, such as call center operations, can benefits from Theory Y
principles to encourage knowledge sharing and continuous improvement.
Weakness of Theory X and Y
Theory X style of management fosters a very hostile and distrustful atmosphere - An
authoritarian organization requires many managers just because they need to constantly
control every single employee, and the method of control usually involves a fair amount
of threat and coercion. At times, an employer that is overly threatening will lead to
dissatisfaction among employees, or they might even attempt to blame each other in
order to save themselves from the threats. Conversely, Coercion might work better with
the prospects of bigger rewards for more, but employees might purposely try to cheat or
attempt to hide the truth itself. Also, employees might try to sabotage the efforts of each
other in order to make it easier for them to achieve the rewards. Theory Y style of
management is tough to uphold in reality - The core belief of Theory Y, is that with the
right support and the right environment, self-directed employees will be able to perform
their jobs well. However, because every individual is different from one
another, creating an environment which fits all does not sound very practical in the
current era of organizations.
Theory X and Theory Y is very hard to be used with each other - Just because we think
that utilizing different theories in order to accommodate different types of
employees does not mean that it would be beneficial to the companies. In the end, the
human labor of the company might be improved, but at the cost of creating monetary
loses as well as inefficient allocation of resources.

23
Strengths of Theory X and Y
McGregor‘s work on Theory X and Theory Y has had a significant impact on
management thought and practice in the years since he first articulated the concepts. In
terms of the study of management, McGregor‘s concepts are included in the
overwhelming majority of basic management textbooks, and they are still routinely
presented to students of management. Most textbooks discuss Theory X and Theory Y
within the context of motivation theory; others place Theory X and Theory Y within the
history of the organizational humanism movement. Theory X and Theory Y are often
studied as a prelude to developing greater understanding of more recent management
concepts, such as job enrichment, the job-characteristics model, and self-managed work
teams. Although the terminology may have changed since the 1950s, McGregor‘s ideas
have had tremendous influence on the study of management. In terms of the practice of
management, the work place of the early twenty-first century, with its emphasis on self-
managed work teams and other forms of worker involvement programs, is generally
consistent with the precepts of Theory Y. There is every indication that such programs
will continue to increase, at least to the extent that evidence of their success begins to
accumulate.
2.8 Abraham Maslow’s Hierarchy of Needs
Many theorists have tried to explain the importance of the human resources approach.
One of these individuals was Abraham Maslow (1943).
24
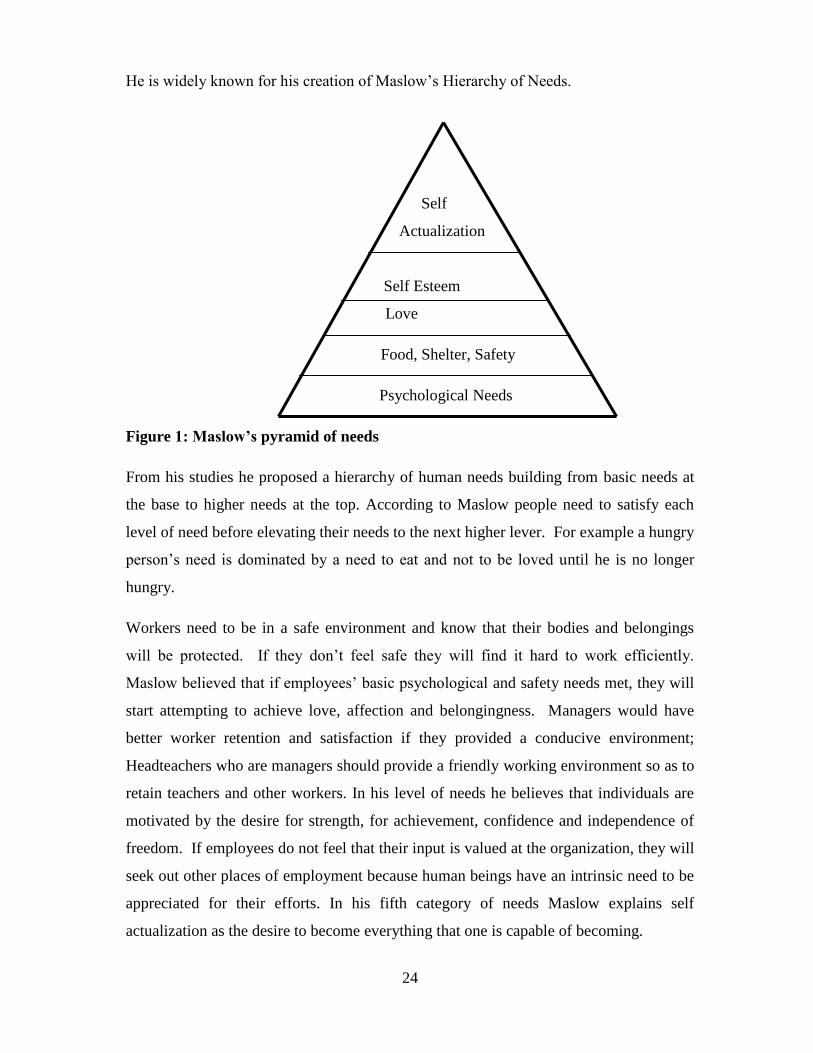
He is widely known for his creation of Maslow‘s Hierarchy of Needs.
Self
Actualization
Self Esteem
Love
Food, Shelter, Safety
Psychological Needs
Figure 1: Maslow’s pyramid of needs
From his studies he proposed a hierarchy of human needs building from basic needs at
the base to higher needs at the top. According to Maslow people need to satisfy each
level of need before elevating their needs to the next higher lever. For example a hungry
person‘s need is dominated by a need to eat and not to be loved until he is no longer
hungry.
Workers need to be in a safe environment and know that their bodies and belongings
will be protected. If they don‘t feel safe they will find it hard to work efficiently.
Maslow believed that if employees‘ basic psychological and safety needs met, they will
start attempting to achieve love, affection and belongingness. Managers would have
better worker retention and satisfaction if they provided a conducive environment;
Headteachers who are managers should provide a friendly working environment so as to
retain teachers and other workers. In his level of needs he believes that individuals are
motivated by the desire for strength, for achievement, confidence and independence of
freedom. If employees do not feel that their input is valued at the organization, they will
seek out other places of employment because human beings have an intrinsic need to be
appreciated for their efforts. In his fifth category of needs Maslow explains self
actualization as the desire to become everything that one is capable of becoming.

25
Strengths
Maslow's believes that if individuals can have their needs met in order of layers then
they can be both motivated and seek opportunities to excel. Maslow Hierarchy of needs
helps managers to understand how to motivate workers and strive for more in the
organization. Hence, communication is very important because we need to understand
what employees need in order to motivate them to work more proficiently and
productively. Managers should consider the needs and aspirations of individual
subordinates.
Weaknesses
Maslow‘s broad assumptions of human needs have been disapproved by exceptions as
he seems to be too theoretical in his models and approach to human needs. Regarding
monitory rewards, sometimes beyond certain level of pays (e.g. Consultation) other
things become more important like working conditions, and working environment.
Hence the need for this study to find out how management practices of headteachers
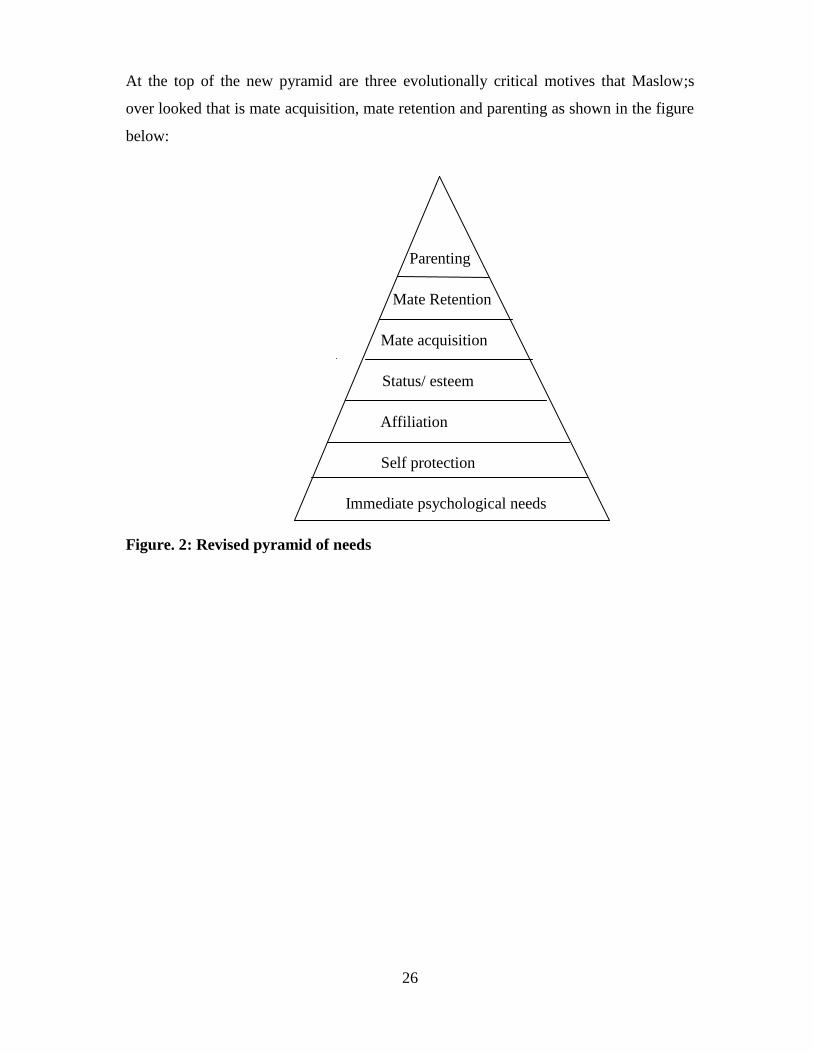
affects academic performance. Recent Studies by Kenrick as reviewed by John (2010)
have come up with a new pyramid of needs. Instead of many of the activities that
Maslow labeled as self actualizing, they reflect more on biologically basic drives to gain
status. Thus they came up with a new restructured pyramid after observing how
psychological process radically change in response to evolutionarily fundamental
motives such as self protection, mating or status concerns. The bottom four levels of the
new pyramid are highly compatible with Maslow‘s, but the big changes are at the top.
The most controversial modification is that self actualization no longer appears on the
new pyramid at all.
26
At the top of the new pyramid are three evolutionally critical motives that Maslow;s
over looked that is mate acquisition, mate retention and parenting as shown in the figure
below:
Parenting
Mate Retention
Mate acquisition
Status/ esteem
Affiliation
Self protection
Immediate psychological needs
Figure. 2: Revised pyramid of needs

27
2.9 Conceptual Framework
The researcher conceptualized the independent, dependent and intervening variables as
shown in figure 3.
Independent Variables Dependent Variables
Independent Variable
Figure 3: Relationship Between Headteachers’ Management Practices and
Students’ Academic Performance
(Source: Researcher, 2014)
The figure above shows the concepts of independent variables as supervision,
communication and motivation. The dependent variable is academic performance. The
study investigated the relationship between independent variable on the dependent one.
The researcher aimed at determining whether the independent variable: Headteachers‘
management practice does in any way affect the dependent variable: performance,
intervening variables are students‘ discipline, teaching methods and proper time
management.
Head teachers management practices
Supervision
Communication
Motivation
Academic performance
in K.C.S.E.
Intervening Variables
Student Discipline
Teaching Methods
Proper Time Management

28
CHAPTER THREE
RESEARCH METHODOLOGY
3.1 Introduction
In this chapter the researcher presents methods and procedures employed to obtain data.
It also explains the data analysis techniques, which were used by the researcher to
analyse and interpret data related to the management practices of headteachers in
secondary schools and their effects on students academic performance. The chapter is
subdivided into the following sections: The research design, target population, sampling
procedures and sample size, instrumentation, the validity of research instruments,
reliability of research instruments, data collection procedures and data analysis.
3.2 Research Design
The researcher used descriptive survey design to investigate the influence of
headteachers‘ management practices on students‘ academic performance in Kitui Central
District. According to Koul (1993) descriptive survey is the only means through which
opinions, attitude and suggestions for improvements on educational practices and
instructions can be collected. Since the study covered a large number of respondents,
then the descriptive survey design was the most suitable. The dependent variable was
performance whereas the independent variable was the headteachers‘ management
practices.
3.3 Target Population
The target population was Kitui Central District secondary schools. The district by the
time of study had a total of thirty three secondary schools according to the DEOs‘ office
record in the year 2013. The respondents included the form three students from the
selected secondary schools in the District, teachers and headteachers. Ten secondary
schools were selected; five from the high performing schools and the other five from
low performing schools. The researcher used a total of two hundred respondents in the
study. Due to the vastness of Kitui County the researcher conducted the research in
Kitui Central District because at the time of study she was a resident in the district.
Gayness (1987) suggests that for a population as the one in the study, a percentage of
10% representation is acceptable.

29
3.4 Sampling Procedures and Sample Size
According to Bryman and Bell (2003), a sample can be said to be a section of a
population that is selected for investigation. The need to sample is key in any
quantitative research. The researcher used both stratified and purposive sampling to
arrive at 10 schools which translated to 30.30% sample representation. The samples
were stratified into two categories of performing and non-performing schools.
Performing schools were taken to be those that had achieved a KCSE mean score of 5.00
and above in the year 2010, 2011 and 2012 KCSE results as per the Kitui Central
District DEOs records of 2013. All the ten principals from the selected schools took part
in the study. The sample also constituted 4 teachers and 15 form three students from
each school. The total number of respondents was two hundred. In selecting teachers
the researcher considered teachers who had stayed in the school for more than three
years. Form threes were selected because they had stayed in the school longer and had
adequate exposure to school trainings. Form fours were excluded because they were
busy preparing for their KCSE examinations at the end of the year.

30
Table 1
Sampling Frames
Nature of School
Category (i)
Performing Schools Sampled School Sampled Method Percentage
Boys school 3 2 Purposive 90%
Girls school 3 2 Purposive 90%
Mixed school 2 1 Purposive 90%
Totals 8 5
Nature of Schools
Category (ii)
Non Performing
Schools
Sampled Schools Sampling Method Percentage
Zone 1 8 1 Stratified 32.0%
Zone 2 4 1 Stratified 16.0%
Zone 3 6 1 Stratified 24.0%
Zone 4 4 1 Stratified 16.0%
Zone 5 3 1 Stratified 12.0%
Total 25 5
Total number of schools = 33
Stratum I: performing schools = 8
Stratum II: non performing schools = 25
To arrive at the 5 performing schools the researcher used purposive sampling to have a
representation of two boy schools, 2 girl schools and 1 mixed school in the district. Then
stratified sampling was used to pick the non-performing schools which were the
majority. The researcher grouped the schools into the five divisions and randomly
picked one school from each division to be represented in the study.
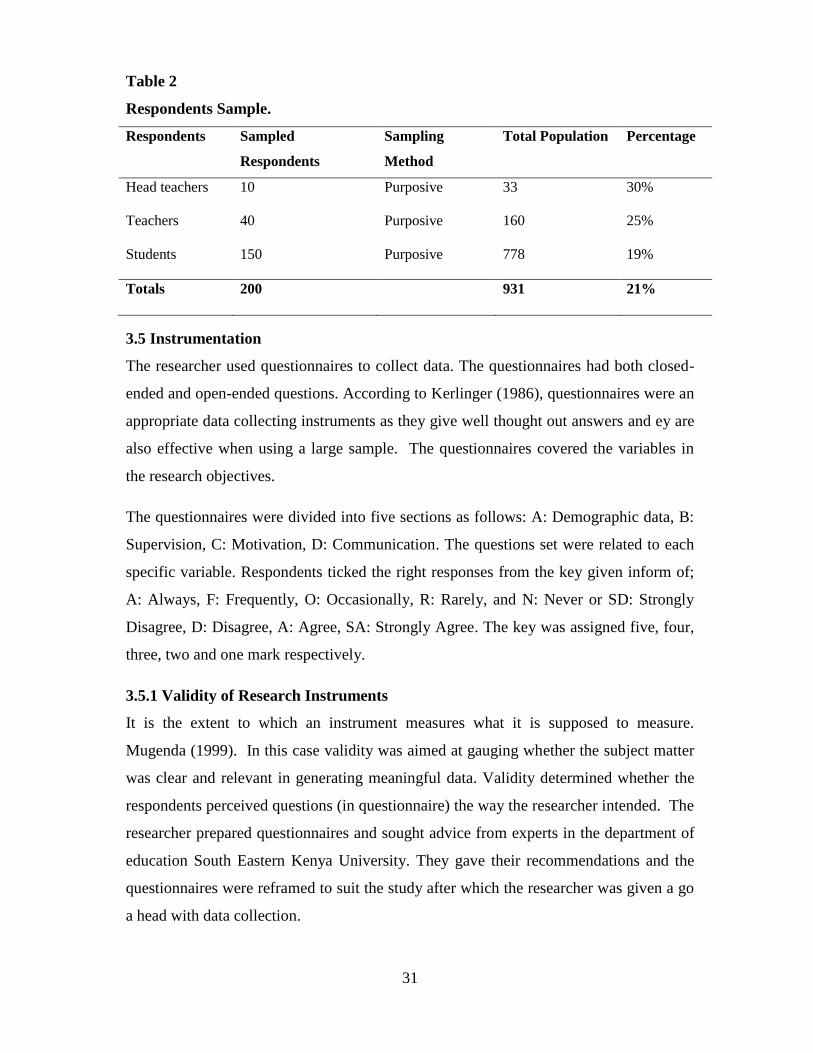
31
Table 2
Respondents Sample.
Respondents Sampled
Respondents
Sampling
Method
Total Population Percentage
Head teachers 10 Purposive 33 30%
Teachers 40 Purposive 160 25%
Students 150 Purposive 778 19%
Totals 200 931 21%
3.5 Instrumentation
The researcher used questionnaires to collect data. The questionnaires had both closed-
ended and open-ended questions. According to Kerlinger (1986), questionnaires were an
appropriate data collecting instruments as they give well thought out answers and ey are
also effective when using a large sample. The questionnaires covered the variables in
the research objectives.
The questionnaires were divided into five sections as follows: A: Demographic data, B:
Supervision, C: Motivation, D: Communication. The questions set were related to each
specific variable. Respondents ticked the right responses from the key given inform of;
A: Always, F: Frequently, O: Occasionally, R: Rarely, and N: Never or SD: Strongly
Disagree, D: Disagree, A: Agree, SA: Strongly Agree. The key was assigned five, four,
three, two and one mark respectively.
3.5.1 Validity of Research Instruments
It is the extent to which an instrument measures what it is supposed to measure.
Mugenda (1999). In this case validity was aimed at gauging whether the subject matter
was clear and relevant in generating meaningful data. Validity determined whether the
respondents perceived questions (in questionnaire) the way the researcher intended. The
researcher prepared questionnaires and sought advice from experts in the department of
education South Eastern Kenya University. They gave their recommendations and the
questionnaires were reframed to suit the study after which the researcher was given a go
a head with data collection.
32
3.5.2 Reliability of Research Instruments
Orodho (2004) states reliability as the degree to which a measuring procedure gives
similar results over a number of repeated trials. This was to test whether the instruments
were reliable enough to go on with data collection. This was done through the test–
retest reliability method. Two schools not included in the study were subjected to test-
retest technique where by questionnaires were administered to the respondents and
collected after three days. After two weeks the same questionnaires were administered
to the same respondents. This was aimed at testing the reliability of the research
instruments. For purpose of reliability, the split half‘s method was also used. The
instruments were split into two sets of questions, even numbered and odd numbered
items. The two sets of items were then scored separately and then correlated to obtain
the estimate of reliability; this saw to it that the researcher had a broader perspective of
participants. Through the pilot testing the researcher was able to note the ambiguously
presented questions and modified them to increase their reliability.
The number of respondents for the test retest reliability test was 30. This included 20
students 10 from each school, 8 teachers 4 from each school and 2 principals one from
each selected school.
After 2 weeks the same questionnaires were administered to the same respondents. The
researcher evaluated the scores through the use of spearman Brown formula, to test how
the two sets of scores correlated to access the reliability of the research instruments and
correct them accordingly. The observed correlation coefficint reliability was 0.78 while
the accepted reliability coefficient is 0.7 so the tested instruments were reliable.
3.6 Data Collection Procedures
The researcher obtained a permit from the ministry of education through the school of
graduate studies; South Eastern Kenya University and an introductory letter from the
District Education Officer in Kitui Central. The exercise involved administering
questionnaires to students, teachers and headteachers. The researcher personally visited
the sampled schools, introduced herself to the headteachers and explained the purpose of
the study. She advised on how the questionnaires should be completed independently by
the headteachers, teachers and the students. The researcher primarily relied on primary
sources of data. The questionnaires were administered to the respondents using the drop
33
and pick technique of visiting the sampled schools to distribute the questionnaires then
come to pick them from the principal later after a few days through arrangements when
the students were not too busy.
3.7 Data analysis Procedures
To analyse data, the researcher used descriptive statistics. The data collected from the
respondents was tabulated inform of frequencies, , tables, and percentages. The research
instruments were used to generate both qualitative and quantitative data. The responses
were coded and categorized into specific objectives of the study. Then the researcher
used the statistical package for social sciences (SPSS) version 20 in the data analysis.
The results of data analysis were presented by use of frequency distribution tables
percentages and tables . After the data analysis was done, results, conclusions and
recommendations were made based on the findings.

34
CHAPTER FOUR
RESULTS ANALYSIS, INTERPRETATION AND DISCUSSION
4.1 Introduction
This study was about the influence of headteachers‘ management practices on students‘
academic performance in public secondary schools within Kitui Central District, Kitui
County, Kenya. It is sub-divided into: questionnaire return rate; Demographic
Characteristics of Respodents; Schools category and KCSE Performance; Influence of
Headteachers‘ Supervision on Academic Performance; Influence of Headteachers‘
Motivation on Academic Perfomance and Influence of Headteachers‘ Communication
on Academic Performance.
4.2 Questionnaire Return Rate
Questionnaires were used as the sole tools to collect data for the purposes of this study.
The study had three types of questionnaires. There was the principals, the teachers and
the students questionnaires. The reseacher gave out 10 principals‘ questionnaires to the
principals of the 10 schools under the study. All the 10 questionnaires were returned. On
the other hand 40 teachers questionnaires were issued to the respondents and were all
returned. Likewise, all the 150 students questionnaires issued were returned. This
translates to 100% return rate.
4.3 Demographic Characteristics of Respondents
This shows the number and characteristics of respondents used in data collection; that is
the principals, the teachers and the students. The researcher classified the respondents
characteristics which included; gender, education level and age bracket. They were
classified and coded into the three categories and distributed into tables. The results of
each characteristic were anlysed and discussed seperately as shown in the tables 3,4 and
5.

35
4.3.1 Gender Characteristics of Respondents
The gender characteristics of principals, teachers and students were analysed and
categorized as in table 3.
Table 3
Gender Characteristics of Respondents
Respondents Gender Frequency Percent (%)
Principals Male 6 60.0
Female 4 40.0
Total 10 100.0
Teachers Male 26 65.0
Female 14 35.0
Total 40 100.0
Students Male 98 65.3
Female 52 34.7
Total 150 100.00
Results in table 3 shows that the principals were fairly represented because 6 out of 10
of the principals were male that is 60% represantation while the female principals were
4 out of 10 which constituted 40% of the female represantation in the study. Thus there
was fairness in the selection of principals‘ respondents. From the teachers data, results
shows that majority of the teachers that is 26 out of 40 were male respondents which
translated to 65% while the female teachers were 14 out of 40 which was a percentage
representation of 35%. This indicates fairness in gender represantation of the teachers
who participated in the study. From the gender characteristics of students 98 out of 175
of the respondents were of the male gender with a percentage represantation of 65.3%
while in terms of female respondents they consisted 52 out of 175 which comprised a
percentage of 34.7% of the female students. Therefore, the respondents were both male
and female in the three categories. This implies that there was fairness in gender
representation in the study.

36
4.3.2 Educational Level of Respondents
The education level of principals, teachers and students were analysed and categorized
as shown in table 4.
Table 4
Educational Level of Respondents
Respondents Education Level Frequency Percent (%)
Principals Trained Diploma Teacher 0 0.0
Untrained Graduated 0 0.0
Graduate Teacher 2 20.0
Post Graduate Teacher 8 80.0
Total 10 100.0
Teachers Trained Diploma Teacher 3 7.5
Untrained Graduated 3 7.5
Trained Graduate 28 70.0
Total 40 100.0
Students Form one 0 0.0
Form two 0 0.0
Form three 150 100.0
Form four 0 0.0
Total 150 100.0
Results in table 4 shows that in terms of academic qualification majority of the
principals that is 8 out of 10 had attained a post graduate degree. This comprised a
percentage represantation of 80%. The rest of the principals 2 out of 10 which
constituted 20% had at least a bachelors degree. This pointed out that in terms of
training, the principals were qualified to head schools. The trained graduate teachers
constituted 28 which translated to 70% of graduate teacher respondents. Results in table
4 indicates that at least 6 teachers who participated in the study translating to 15% had
achieved post graduate degrees. This shows the importance attached to education in the
society since majority of the respondents were either persuing masters degree or some
had already graduated with masters. The researcher utilised form three students to fill

37
the questionnaires since they had stayed in schools for a longer period of time and form
fours were not utilised since they were busy preparing for KCSE at the end of the year.
4.3.3 Age Bracket of the Respondents
The age brackets of principals, teachers and students were analysed and categorized as
shown in table 5.
Table 5
Age Bracket of Respondents
Respondents Age Bracket Frequency Percent (%)
Principals 30 – 40 0 0.0
41 – 50 6 60.0
51 – 60 4 40.0
Totals 10 100.0
Teachers 25 – 30 2 5.0
31 – 40 6 15.0
41 – 50 24 60.0
Above 50 yrs 8 20.0
Totals 40 100.0
Students 14 – 17 103 68.7
18 – 20 47 31.3
Total 150 100.0
Results in table 5 shows that majority of the principals who participated in the study that
is, 6 out of 10 were within the age range of 41 – 50 years. This constituted 60%
represantation. Principals who were above 50 years were only 4 which comprised 40%.
This implies that all the principals who took part in the study had enough experience and
were mature enough as indicated by their age bracket. From the results in table 5,
majority of the teachers that is, 24 out of 40 were aged between 41 – 50 years thus a
percentage representation of 60%. There were 10 teachers out of 40 who were aged
more than 50 years old which comprised 25% represantation. Few teachers ranged
between 31—40 years that is a total of 6 out of 40 teachers only and a percentage
representation of 15% . This indicates that in terms of teachers represantation the
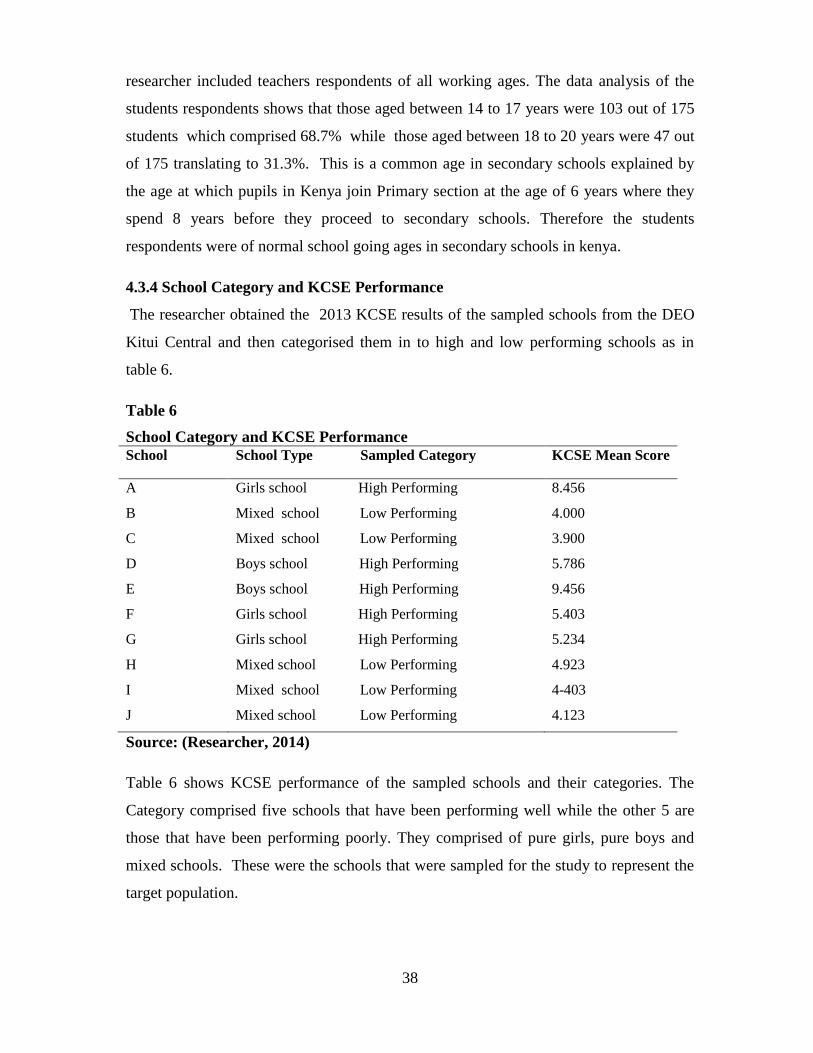
38
researcher included teachers respondents of all working ages. The data analysis of the
students respondents shows that those aged between 14 to 17 years were 103 out of 175
students which comprised 68.7% while those aged between 18 to 20 years were 47 out
of 175 translating to 31.3%. This is a common age in secondary schools explained by
the age at which pupils in Kenya join Primary section at the age of 6 years where they
spend 8 years before they proceed to secondary schools. Therefore the students
respondents were of normal school going ages in secondary schools in kenya.
4.3.4 School Category and KCSE Performance
The researcher obtained the 2013 KCSE results of the sampled schools from the DEO
Kitui Central and then categorised them in to high and low performing schools as in
table 6.
Table 6
School Category and KCSE Performance
School School Type Sampled Category KCSE Mean Score
A Girls school High Performing 8.456
B Mixed school Low Performing 4.000
C Mixed school Low Performing 3.900
D Boys school High Performing 5.786
E Boys school High Performing 9.456
F Girls school High Performing 5.403
G Girls school High Performing 5.234
H Mixed school Low Performing 4.923
I Mixed school Low Performing 4-403
J Mixed school Low Performing 4.123
Source: (Researcher, 2014)
Table 6 shows KCSE performance of the sampled schools and their categories. The
Category comprised five schools that have been performing well while the other 5 are
those that have been performing poorly. They comprised of pure girls, pure boys and
mixed schools. These were the schools that were sampled for the study to represent the
target population.

39
4.4 Influence of Headteachers’ Practices of Supervision on Students’ Academic
Performance in National Examinations
In this objective, the researcher intended to find out the influence of Headteachers‘
practices of supervision on students‘ academic performance. The researcher
administered questionnaires to the respondents. The data on the influences of the
headteachers‘ supervision practices on students‘ academic performance were collected
from principals, teachers and students. This was to help find out how often the
headteachers supervised teaching and learning within their work environments. The
researcher categorized the supervision scores into three categories of principals; teachers
and students and then analysed them into tables each category seperately.
4.4.1 Principals’ Responses on the Influence of Headteachers’ practices of
Supervision on Students Academic Performance
The researcher adminstered questionnaires to the principals to get their responses on the
influence of headteachers‘ practices of supervision on students academic performance
The data collected was analysed and coded into the categories of high and low scoring
schools as in table 7.
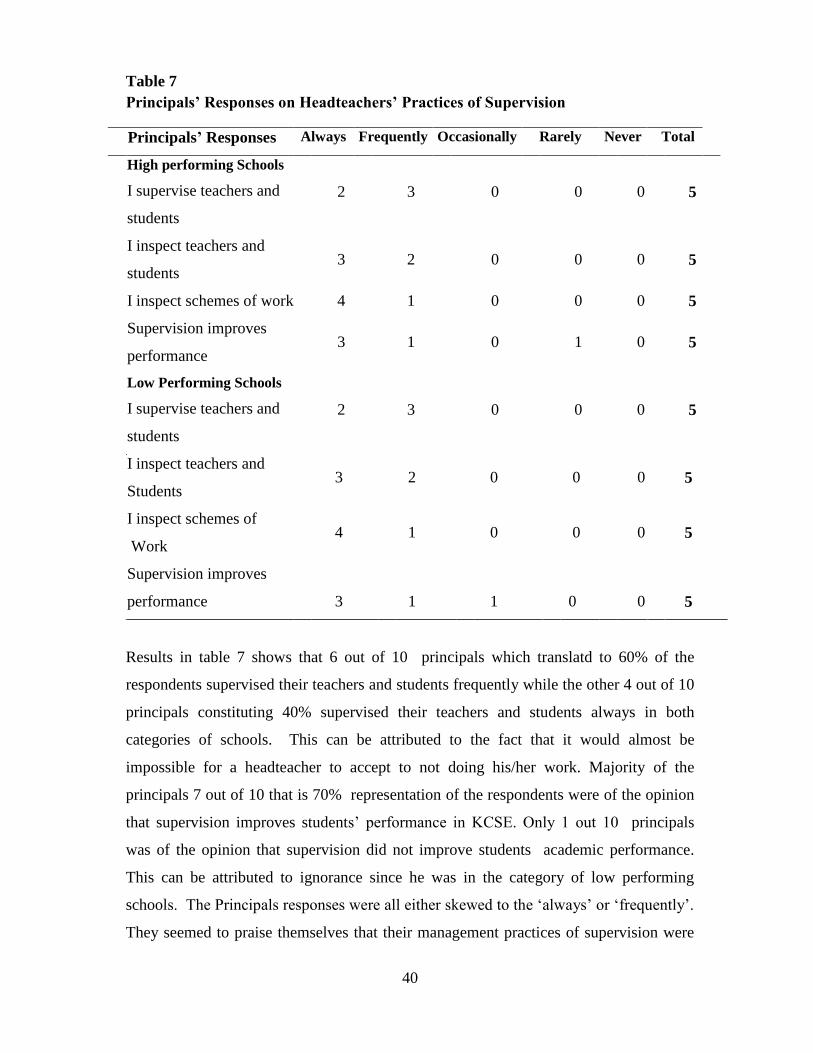
40
Table 7
Principals’ Responses on Headteachers’ Practices of Supervision
Principals’ Responses Always Frequently Occasionally Rarely Never Total
A
High performing Schools
I supervise teachers and
students
2 3 0 0 0 5
I inspect teachers and
students 3 2 0 0 0 5
I inspect schemes of work 4 1 0 0 0 5
Supervision improves
performance 3 1 0 1 0 5
Low Performing Schools
I supervise teachers and
students
2 3 0 0 0 5
I inspect teachers and
Students 3 2 0 0 0 5
I inspect schemes of
Work 4 1 0 0 0 5
Supervision improves
performance
3
1
1
0
0
5
Results in table 7 shows that 6 out of 10 principals which translatd to 60% of the
respondents supervised their teachers and students frequently while the other 4 out of 10
principals constituting 40% supervised their teachers and students always in both
categories of schools. This can be attributed to the fact that it would almost be
impossible for a headteacher to accept to not doing his/her work. Majority of the
principals 7 out of 10 that is 70% representation of the respondents were of the opinion
that supervision improves students‘ performance in KCSE. Only 1 out 10 principals
was of the opinion that supervision did not improve students academic performance.
This can be attributed to ignorance since he was in the category of low performing
schools. The Principals responses were all either skewed to the ‗always‘ or ‗frequently‘.
They seemed to praise themselves that their management practices of supervision were
41
well practiced. However this may have not been the case since the teachers‘ responses
especially those in the low performing schools did not support their principals‘
responses. Majority of them may have been ignorant or did not want to point out their
own weaknesses. The findings are in line with Edmonds (1979) who noted that students‘
progress should be frequently monitored and that in high performing schools,
headteachers established a system of evaluating students frequently through tests and
examinations. From the responses, majority of the headteachers responded that they
practiced good supervision skills in their schools. However, this may have not been the
case especially those in low performing schools. Supervision practices were therefore
found to be important in improving the students academic performance.
4.4.2 Teachers Responses on the Influence of Headteachers’ Practices of
Supervision on Students Academic Performance
The researcher administered questionnaires to the teachers to get their responses on their
headteachers‘ supervision influences in the schools and how it affected the students‘
academic performance. The responses from both high scoring and low scoring schools
were given as in table 8 which was used to categorise the respondents scores from
teachers in both high and low performing schools.

42
Table 8
Teachers’ Responses on Headteachers’ Practices of Supervision
Teachers Responses Always Frequently Occasionally Rarely Never Total
A
High Performing Schools
My H/T inspects notes
12
7
1
0
0
20
My H/T supervises my teaching 8 7 5 0 0 20
My H/T inspects teaching aids 9 11 0 0 0 20
My H/T requires me to teach 10 5 5 0 0 20
My H/T reminds me of class 19 1 0 0 0 20
My H/T inspects notes 15 5 0 0 0 20
My H/T inspects schemes 19 0 1 0 0 20
My H/T inspects private study 18 2 0 0 0 20
My H/T encourages extra effort 13 6 0 1 0 20
I perceive my headteacher‘s
supervision style as being
effective
1 4 6 6 3 20
Low Performing Schools
A
My H/T inspects notes 0 0 4 10 6 20
My H/T supervises my teaching 0 1 6 8 5 20
My H/T inspects teaching aids 1 0 5 10 4 20
My H/T requires me to teach 2 2 5 10 1 20
My H/T reminds me of class 0 0 0 7 13 20
My H/T inspects notes 0 0 6 5 9 20
My H/T inspects schemes 0 0 1 8 11 20
My H/T inspects private study 3 1 2 6 8 20
My H/T encourages extra effort 0 0 0 8 12 20
I perceive my head teacher‘s
supervision style as being
effective
0 0 1 9 10 20
Source: (Researcher, 2014)

43
From table 8, majority of the teachers that is 12 out of 20 respondents which translated
to 60% of the teachers from the high performing schools said that their headteachers
inspected their lesson notes, while 5 out of 20 teachers translating to 25% said that their
headteachers supervised their teaching occasionally. In terms of teaching aids 14 out of
20 teachers which constituted 70% of the respondents said that their headteachers
inspected their teaching aids while 7 out of 20 teachers that is 47.5% were of the
opinion that their headteachers required them to meet their deadlines. Almost all the
teachers that is 19 out of 20 with a 95% represantation of respondents who took part in
the study agreed to the fact that they had to be reminded about their class duties. This
can be attributed to the fact that naturally man tries to avoid work (McGregor‘s-Theory
Y and X). In terms of lesson notes 14 out of 20 of the respondents that is 70% of the
teachers said that their headteachers inspected notes and the headteachers were seen to
have been inspecting schemes of work. Out of the 20 respondents from high
performing schools, 18 teachers that is 90% said that their headteachers inspected
private studies and encouraged extra effort in their respective subjects. It can therefore
be said that in schools where the principals‘ practices of supervision were well
practised students academic performance had also improved.
Out of the 20 respondents from the teachers in the category of high performing
schools, 7 teachers translating to 32.5% did not perceive their headteachers‘
supervision practices as being effective. In any institution, there is always a dissatisfied
lot hence not all respondents supported the headteachers‘ management practices. These
responses are in line with McGregor‘s Theory Y which views the school as an
organization with a principal who is able to apply leadership practices/skills so as to gain
willing cooperation from teachers, students and non teaching staff Okumbe (1998). On
the other hand, 10 out the 20 teachers respondents translating to 50% from the poorly
performing schools were of the opinion that their headteachers rarely inspected their
notes, teaching aids and didn not require them to teach all the time.
This reflects the differences in the performance between the high performing and the
low performing schools. Most the teachers‘ responses from low performing schools
showed that they were dissatisfied with their headteachers‘ management practices of
supervision. This is supported by the teachers responses of ‗rarely‘, ‗never,‘ and a few
44
‗occasionally‘. Majority of the teachers felt that their principals did not supervise their
teaching aids. In the category of low performing schools 10 out of 20 teachers
translating to 50% responded that their principals‘ supervision practices were
ineffective. In the low performing schools, principals ‗rarely‘ reminded teachers to teach
or inspect their lesson notes. The teachers were left alone and did not know what was
expected of them.
The responses pointed out that the principals need to improve their supervision practices
in schools without which they could not achieve the schools‘ academic goals. In line
with this, Usdan (2001) argued that for there to be students learning, principals must
serve as a leaders by working with teachers to strengthen their skills and knowledge.
Orlosky (1984) further noted that supervision is a major function that the school head
must carry. He includes supervision of curriculum and material development as well as
evaluation of school programmes and instructional planning. This points out that
supervision of curriculum implentation is key if the school has to achieve it‘s eductional
goals.
4.4.3 Students’ Responses on the Influence of Headteachers’ Practices of
Supervision on Students’ Academic Performance
The researcher administered questionnaires to students to get their responses on the
headteachers‘ influence of supervision in the school and how it effected on students‘
academic performance. The supervision responses from the students were categorised
into two categories of low and high performing schools as indicated in table 9.

45
Table 9
Students’ Responses on Headteachers’ Practices of Supervision
Students’ Responses Always Frequently Occasionally Rarely Never Total
A
High Performing Schools
My H/T requires
punctuality
57
8
5
5
0
75
My H/T works hard 52 13 10 0 0 75
My H/T reprimands me
when I fail 42 11
16 6 0 75
My H/T requires all lesson
are done 52 18
5 0 0 75
My H/T ensures sch.
Routine 54 16
5 0 0 75
My H/T ensures assistance 44 16 8 7 0 75
My H/T is always present 44 16 5 10 0 75
Poorly Performing Schools
A
My H/T requires
punctuality 0 20 25 30 0 75
My H/T works hard 0 10 40 12 14 75
My H/T reprimands me
when I fail
4 15 38 8 10 75
My H/T requires all lesson
are done
0 18 12 36 9 75
My H/T ensures sch.
Routine
0 16 52 7 0 75
My H/T ensures assistance 10 12 42 7 4 75
My H/T is always present 5 8 52 10 0 75
Source: (Researcher, 2014)
From table 9 almost all the responses from students in the high performing schools
were skewed towards the ‗always‘ responses meaning that according to the students, the
46
headteachers were doing their supervision work well. This can be attributed to the fact
that majority of the students see the headteacher as being the only person in the school
who does everything in the right way though this might not be true. Majority of students
from high performing schools were of the ‗always‘ or ‗frequently‘ opinions that their
principals‘ supervision practices were above average and that they supervised the
curriculum properly.
They further indicated the physical presence of most of their principals in the schools.
Thus 44 out of 75 students which translated to 60% responded that their principals
were ‗always‘ present in their institutions. This can give a reason why performance in
these schools was better compared to the other category of schools. However the table
from low performing schools indicates that some headteachers were rarely present in
schools and had no time to supervise the curriculum implementation in their schools.
This absence and lack of concern can be seen to have contributed to poor academic
performance in the schools. The responses from the poor performing schools pointed
out an opposite trend where students responded either that supervision practices were
either being practiced occasionally ‗rarely‘ and even some ‗never‘. Most of the
respondents, 52 out of 75 which translated to 75% responded that their principals were
‗occasionally‘ in the schools and that they ‗rarely‘ required punctuality where by 30 out
of 75 students responded ‗rarely‘ translating to 45% represantation. This implies that
poor supervision practices were common in the low scoring schools. Leithwood and
Seashore (2004) in their studies on principals‘ managment practices in the University of
Minnesota and University of Toronto found out that principals in both high and low
performing school said they frequently visited class rooms and are very visible.
However, the difference in the two groups came in to sharp focus as they described their
reasons for making class rooms visits.
High scoring principals frequently visited to observe classroom instructions for short
periods of time to make formative obervations for learning and professional growth
coupled with direct and immediate feed back. In constrast, low scoring principals made
informal visits not for instructional purposes and their informal observations were even
planned so that teachers were aware when the principals would be stopping by. The
teachers reported that they received little or no feed back after the informal observations

47
in the low scoring schools. This indictes that in most low performing schools,
supervision practices were poorly practiced which pointed a reason for poor academic
performance in these schools. There was need for improvement of supervision practices
in the low performing schools. This could lead to better students academic achievement
in national examinations.
4.5 Influence of Headteachers’ Practices of Motivation on Students’ Academic
Academic Performance
Objective number two was to establish the influence of headteachers‘ practices of
motivation on students‘ academic performance in secondary schools. The researcher in
this objective wanted to establish whether the Headteachers‘ management practices of
motivation enhanced students‘ academic performance. To collect data on the influence
of headteachers‘ practices of motivation on students academic performance ; principals,
teachers and students from both performing and non-performing schools filled
questionnaires. Then data was categorized into two categories of high performing and
low performing schools for each category of respondents. Each category of respondents
gave their responses on Principals‘ influences of motivation which were categorized
and coded into tables.
4.5.1 Principals’ Responses on the Influence of Headteachers’ Practices of
Motivation on Students’ Academic Performance
The principals responses on their influences of motivation practices on Students
Academic performance were analysed and coded in to two categories of low and high
performing schools as in table 10.
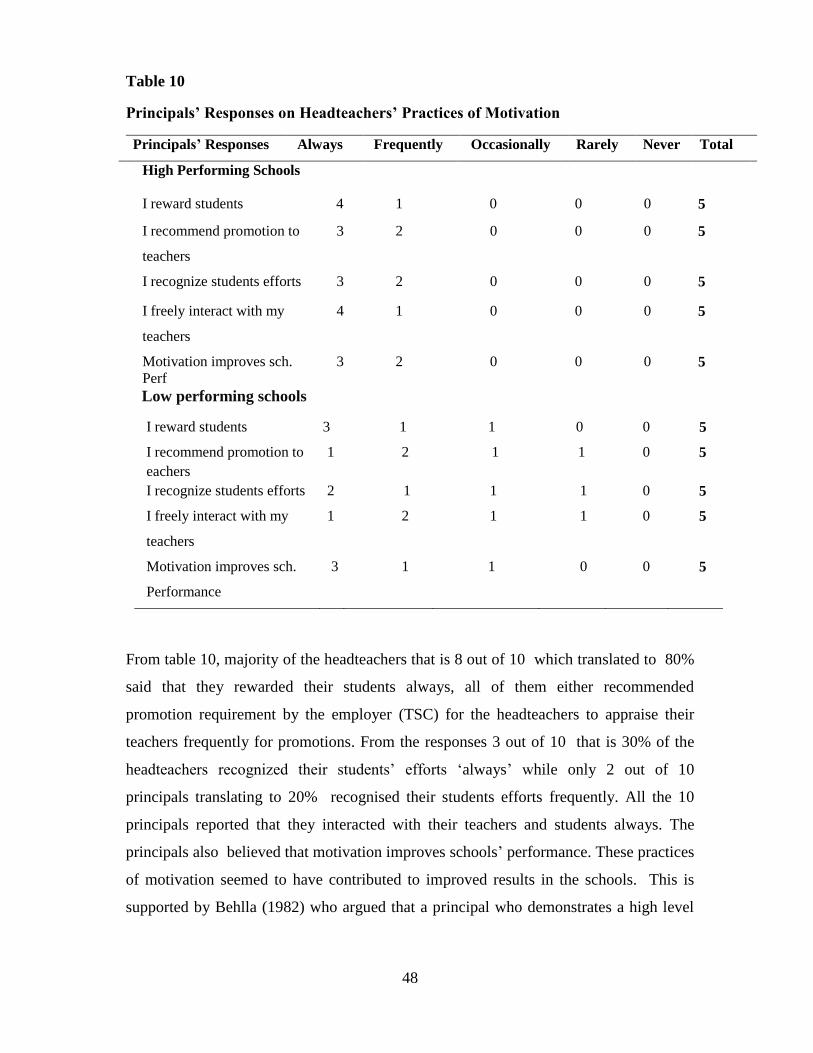
48
Table 10
Principals’ Responses on Headteachers’ Practices of Motivation
Principals’ Responses Always Frequently Occasionally Rarely Never Total
High Performing Schools
I reward students
4
1
0
0
0
5
I recommend promotion to
teachers
3 2 0 0 0 5
I recognize students efforts 3 2 0 0 0 5
I freely interact with my
teachers
4 1 0 0 0 5
Motivation improves sch.
Perf
3 2 0 0 0 5
Low performing schools
I reward students 3 1 1 0 0 5
I recommend promotion to
eachers
1 2 1 1 0 5
I recognize students efforts 2 1 1 1 0 5
I freely interact with my
teachers
1 2 1 1 0 5
Motivation improves sch.
Performance
3 1 1 0 0 5
From table 10, majority of the headteachers that is 8 out of 10 which translated to 80%
said that they rewarded their students always, all of them either recommended
promotion requirement by the employer (TSC) for the headteachers to appraise their
teachers frequently for promotions. From the responses 3 out of 10 that is 30% of the
headteachers recognized their students‘ efforts ‗always‘ while only 2 out of 10
principals translating to 20% recognised their students efforts frequently. All the 10
principals reported that they interacted with their teachers and students always. The
principals also believed that motivation improves schools‘ performance. These practices
of motivation seemed to have contributed to improved results in the schools. This is
supported by Behlla (1982) who argued that a principal who demonstrates a high level

49
of concern for people and for the product has a better report with teachers and students
which leads to improved academic performance in the school.
Principals‘ from low performing schools did not ‗always‘ reward students. Only 3 out of
10 principals that is 30% who responded ‗always‘. The rest responded that they
rewarded the students ‗frequently‘ and ‗occasionally‘. Most of the principals did not
‗always‘ recommend teachers for promotion and their interaction with teachers was
‗occasionally‘ or ‗rarely‘. However majority of the principals 6 out of 10 that is 60%
believed that motivation improves school performance in national examinations. This is
further supported by Robbins (1988) who argued that rewards should be given on the
basis of effort and performance of personnel and that staffs that are better enumerated
are likely to be more motivated than poorly remunerated staff. It was noted that
motivation was an important management tool in schools and if practiced frequently, the
students academic performance is likely to improve. There was need for school
principals to strengthen the reward systems in their institutions to encourage the teachers
and students to work hard so as to achieve the schools‘ set academic goals.
4.5.2 Teachers’ Responses on the Influence of Headteachers’ Practices of
Motivation on Students’ Academic Performance
The headteachers‘ influences of motivation responses from the teachers were
categorized and classified into two categories of high performing and low performing
schools as shown in table 11. The researcher intended to get the teachers responses on
the headteachers management practices of motivation and how it influenced students‘
academic performance. The responces were categorised as indicated in table 11.

50
Table 11
Teachers’ Responses on Headteachers’ Practices of Motivation
Teachers’ Responses Always Frequently Occasionally Rarely Never Total
A
High Performing Schools
My H/T rewards students
12
8
0
0
0
20
My H/T recommends
promotion to teachers 1 8 8 3 0 20
My H/T inspires me 9 5 6 0 0 20
My H/T congratulates me
every time I improve 14 6 0 0 0 20
My H/T organizes trips
for us 14 2 1 2 1 20
How often are you
motivated as a staff?
1 4 9 4 2 20
Low Performing Schools
My H/T rewards students 0 0 5 12 3 20
My H/T recommends
promotion to teachers 1 0 4 8 7 20
My H/T inspires me 5 0 3 10 2 20
My H/T congratulates me
every time I improve 0 3 6 10 1 20
My H/T organizes trips for
us 2 2 4 10 2 20
How often are you
motivated as a staff?
1 4 9 4 2 20
Source: (Researcher, 2014)
From table 11, 12 out of 20 respondents, that is 60% of the teachers from high
performing schools said that their headteachers ‗always‘ rewarded them whenever they
performed well. Thus the principals in the high performing schools practices of
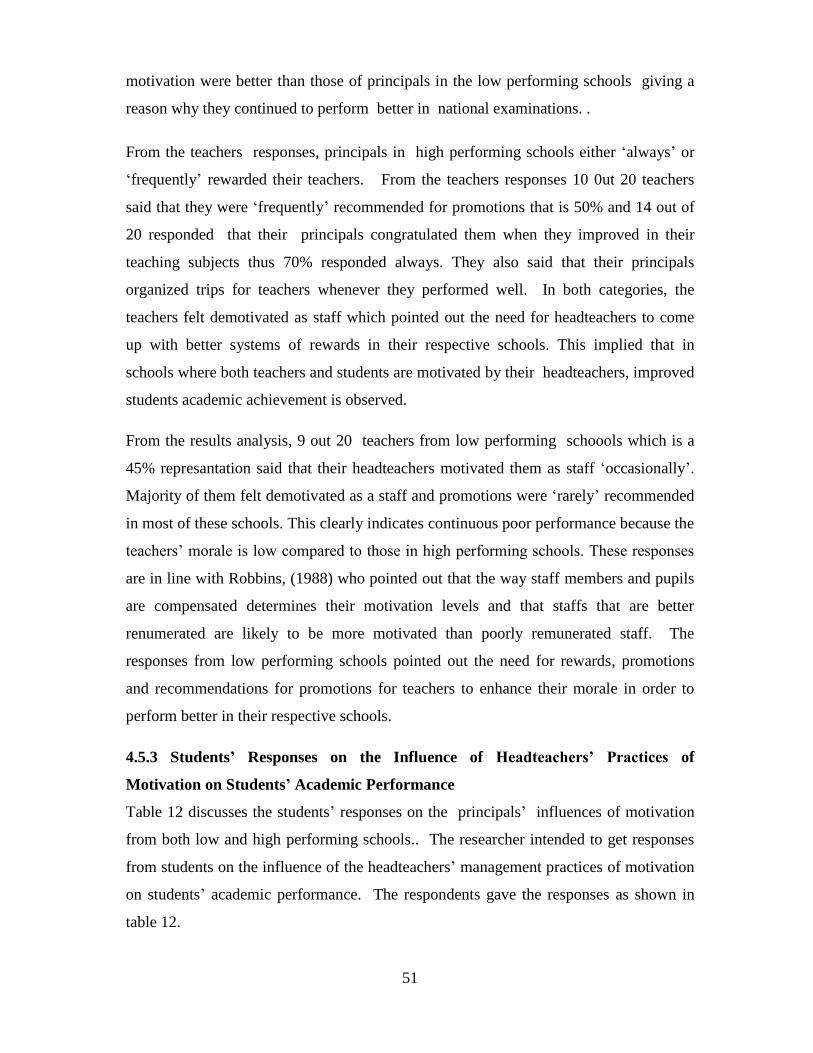
51
motivation were better than those of principals in the low performing schools giving a
reason why they continued to perform better in national examinations. .
From the teachers responses, principals in high performing schools either ‗always‘ or
‗frequently‘ rewarded their teachers. From the teachers responses 10 0ut 20 teachers
said that they were ‗frequently‘ recommended for promotions that is 50% and 14 out of
20 responded that their principals congratulated them when they improved in their
teaching subjects thus 70% responded always. They also said that their principals
organized trips for teachers whenever they performed well. In both categories, the
teachers felt demotivated as staff which pointed out the need for headteachers to come
up with better systems of rewards in their respective schools. This implied that in
schools where both teachers and students are motivated by their headteachers, improved
students academic achievement is observed.
From the results analysis, 9 out 20 teachers from low performing schoools which is a
45% represantation said that their headteachers motivated them as staff ‗occasionally‘.
Majority of them felt demotivated as a staff and promotions were ‗rarely‘ recommended
in most of these schools. This clearly indicates continuous poor performance because the
teachers‘ morale is low compared to those in high performing schools. These responses
are in line with Robbins, (1988) who pointed out that the way staff members and pupils
are compensated determines their motivation levels and that staffs that are better
renumerated are likely to be more motivated than poorly remunerated staff. The
responses from low performing schools pointed out the need for rewards, promotions
and recommendations for promotions for teachers to enhance their morale in order to
perform better in their respective schools.
4.5.3 Students’ Responses on the Influence of Headteachers’ Practices of
Motivation on Students’ Academic Performance
Table 12 discusses the students‘ responses on the principals‘ influences of motivation
from both low and high performing schools.. The researcher intended to get responses
from students on the influence of the headteachers‘ management practices of motivation
on students‘ academic performance. The respondents gave the responses as shown in
table 12.
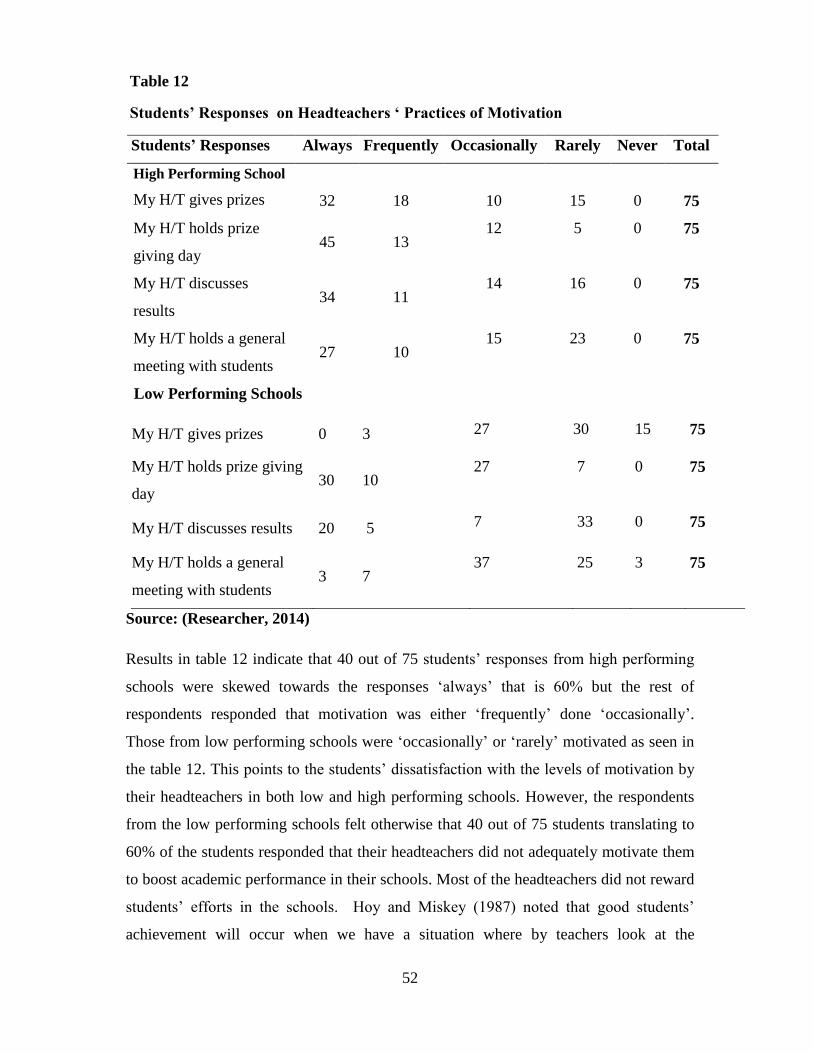
52
Table 12
Students’ Responses on Headteachers ‘ Practices of Motivation
Students’ Responses Always Frequently Occasionally Rarely Never Total
A
High Performing School
My H/T gives prizes
32
18
10
15
0
75
My H/T holds prize
giving day 45 13
12 5 0 75
My H/T discusses
results 34 11
14 16 0 75
My H/T holds a general
meeting with students 27 10
15 23 0 75
Low Performing Schools
My H/T gives prizes 0 3 27 30 15 75
My H/T holds prize giving
day 30 10
27 7 0 75
My H/T discusses results 20 5 7 33 0 75
My H/T holds a general
meeting with students 3 7
37 25 3 75
Source: (Researcher, 2014)
Results in table 12 indicate that 40 out of 75 students‘ responses from high performing
schools were skewed towards the responses ‗always‘ that is 60% but the rest of
respondents responded that motivation was either ‗frequently‘ done ‗occasionally‘.
Those from low performing schools were ‗occasionally‘ or ‗rarely‘ motivated as seen in
the table 12. This points to the students‘ dissatisfaction with the levels of motivation by
their headteachers in both low and high performing schools. However, the respondents
from the low performing schools felt otherwise that 40 out of 75 students translating to
60% of the students responded that their headteachers did not adequately motivate them
to boost academic performance in their schools. Most of the headteachers did not reward
students‘ efforts in the schools. Hoy and Miskey (1987) noted that good students‘
achievement will occur when we have a situation where by teachers look at the

53
principals as facilitators and supporters in accomplishing the schools‘ mission rather
than as guiders and leaders of their own private plan. Most students from low
performing schools seemed to be dissatisfied with their principals‘ levels of motivation.
This could explain why the performance was poor over the years in these schools. In
both categories principals exercised some degree of motivation. However in high
performing schools the principals‘ levels of motivation were better practiced compared
to those in low performing schools. In some schools motivation was ‗rarely‘ practiced
thus students were demoralised as well the teachers morale was low. The study found
motivation as an important management practice which boosted the morale of both
teachers, students and the support staff so as to work together towards achieving the
schools‘ academic objectives.
4.6 Influence of Headteachers’ Practices of Communication on Students’ Academic
Perfomance in National Examinations.
Objective number three was to establish whether effective communication practices by
headteachers affected students‘ academic performance in Secondary schools. In this
objective the researcher intended to investigate the influence of the headteachers‘
management practices of communication on the students‘ academic performance. To
achieve this objective, principals, teachers and students from both high performing and
low performing schools filled questionnaires which were classified into two categories
of high and low scoring schools .Then each category was analysed separately.
4.6.1 Principals’ Responses on the Influence of Headteachers’ Practices of
Communication on Students Academic Performance
Principals‘ responses on the headteachers‘ practices of communication were coded and
categorized in table 13. They were classified into the high and low performing schools.

54
Table 13
Principals’ Responses on Headteachers’ Practices of Communication
Principals’ Responses Always Frequently Occationally Rarely Never Total
High Peforming Schools
I hold staff meetings 2 3 0 0 0 5
I don‘t send memos 3 2 0 0 0 5
I apply both forms 3 1 1 0 0 5
of comm.
Low Performing Schools
I hold staff meetings 2 1 2 0 0 5
I do send memos 1 2 2 0 0 5
I apply both forms 2 2 1 0 0 5
of comm.
Source: (Researcher, 2014)
From table 13, 6 out of 20 principals translating to 60% of the respondents reported
that they ‗frequently‘ wrote internal memos to communicate in the schools. Interms of
how often they held staff meetings 6 out of 10 principals which translated to 60% said
that they frequently held staff meeetings in schools. Resonding on the modes of
communication in their respective schools 5 out of 10 principals which translated to
50% reported that they used verbal and written forms of communication to pass
information in the schools.
All the headteachers responded that they practiced good communication skills which
might not be the case. The reason may have been that nobody can state their negative
side of management. Thus the principals may have responded positively to support their
management practices which actually were not the case in all the sampled schools.
From both categories, principals responded that they practiced effective communication
in their schools. This may not be the case since the teachers on the contrary responded
that communication was poor. The principals may have been influenced by the fact that
it is impossible to state ones weaknesses. Supporting effective communication in

55
schools, Goodland (1984) noted that learning appeared to be enhanced when teachers
and students understand what is expected of them and that effective communication is
necessary if the schools have to achieve their educational objectives. Few principals,
only 2 out of 10 that is 20% from low performing schools responded that they
‗occasionally‘ held staff meetings and send memos ‗occasionally‘. This pointed out the
need to improve communication in schools for better students academic achievement.
Though almost all the principals responded that their communication practices were
above average, this may not be true. This is because the teachers and students responses
on the contrally pointed otherwise that their headteachers‘ practices of communication
were poor. Hence the principals may have only responded what supported their
management practices which may have not been the actual situation in their schools.
Brandt (1987) further noted that effective communication in the schools fostered
friendship among the staff, students and non teaching staff and the whole school
community. Most of the principals responded that they held staff meetings and wrote
memos to pass information. If this was the case the principals in high performing
schools seemed to practice effective communication better than those in the category of
low performing schools. That could be the reason why the principals in the high
scoring schools had recorded better performance than those in low performing schools.
From the results of the study there was need for the principals to practice effective
communication all the time since it strengthens relationships among the teachers,
students and the support staff. This would therefore result to improved students
academic performace.
4.6.2 Teachers’ Responses on the Influence of Headteachers’ Practices of
Communication on Students’ Academic Performance
The researcher intended to get responses from teachers on the principals‘ management
practices of communication and its influence on students‘ academic performance. The
responses were classified and categorised as in table 14. The table shows the teachers
responces on their principals‘ influences of communication on students academic
performance.

56
Table 14
Teachers’ Responses on Headteachers’ Practies of Communication
Teachers’ Responses Always Frequently Occasionally Rarely Never Total
A
High Performing Schools
My H|t holds staff
meetings
3
10
7
0
0
20
My H/T doesn‘t send
memos 1 2 15 2 0 20
My H/T uses both forms
of communication 10 4 5 1 0 20
I perceive communication
in the school as being
effective
3 3 8 6 0 20
Low performing schools
A
My H|T holds staff
meetings 0 2
5 13 0 20
My H/T doesn‘t send
memos 0 0 0 15 5 20
My H/T uses both forms
of communication 0 1 4 12 3 20
My H/Ts‘
communication in the
school is effective
1 0 6 13 0 20
Source: (Researcher, 2014)
From table 14, 20 out of 40 teachers that is 50% of the respondents from both high and
low performing schools said that they ‗frequently‘ held staff meetings. This can be
attributed to the norms in many schools where by staff meetings are held at the
beginning and end of every term. This is supported by the 60% report from the
principals who said that they frequently held staff meetings. The responces also indicate
that 50 % of the teachers said that their headteachers ‗always‘ used both verbal and non-

57
verbal means of communication to pass information in schools. This is an agreement
with the 70% principals‘ responses in table 13 who also stated that they used similar
methods of communication to pass information in schools.
The responses by teachers from low performing schools however showed some
dissatisfaction with their principals‘ methods of communication. This is indicated by
their responses of ‗rarely‘, ‗occasionally‘ and ‗never‘. From the responses 13 out of 20
teachers translating to 60% felt that their headteachers‘ communication was ineffective.
Interms of cmmunication by use of memos, 15 out of 20 teachers which translated to
75% responded that their principals ‗rarely‘ wrote memos in the schools. This indicates
that where communication was poor, the performance was low because the teachers and
students lacked proper guidance on what should happen in the schools.
Communication in low performing schools was not very effective as compared to high
performing schools. About 75% that is 15 out of 20 teachers from low performing
schools felt that due to the poor communication by the headteachers, performance had
been greatly compromised. This can be attributed to the 60% that is 13 out 20
responses from teachers who said that that their headteachers ‗rarely‘ held staff
meetings and send memos to pass information to the teachers. Most teachers in low
performing schools did not know what they were supposed to do in the schools due to
poor methods of communication by their principals. There was great need for improved
communication in most schools as indicated by the responses of ‗rarely‘, ‗occasionally‘
and ‗never‘ to point out that they lacked proper communication in the schools.
Brandt (1987) reported that successful headteachers communicate the school vision
effectively, provide resources for instruction, act as instructional resources and maintain
visible presence in all aspects of the school. Communication in low performing schools
was ineffective, which explained the reasons for poor students‘ academic performance
and the need for improved methods of communicatioin in schools. Headteachers need
to improve their methods of communication for proper flow of information in the
schools The study singled out poor practices of communication by school principals as
factors that contributed to poor students academic performance in national examinations.
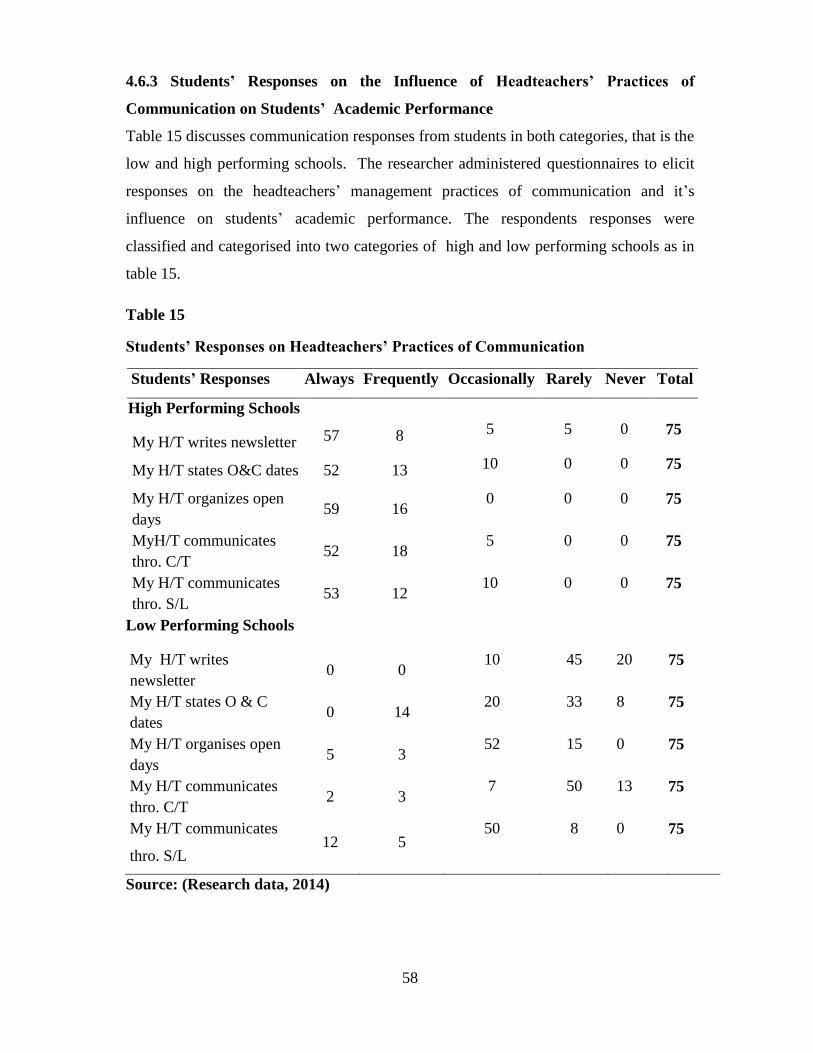
58
4.6.3 Students’ Responses on the Influence of Headteachers’ Practices of
Communication on Students’ Academic Performance
Table 15 discusses communication responses from students in both categories, that is the
low and high performing schools. The researcher administered questionnaires to elicit
responses on the headteachers‘ management practices of communication and it‘s
influence on students‘ academic performance. The respondents responses were
classified and categorised into two categories of high and low performing schools as in
table 15.
Table 15
Students’ Responses on Headteachers’ Practices of Communication
Students’ Responses Always Frequently Occasionally Rarely Never Total
A
High Performing Schools
My H/T writes newsletter
57
8
5
5
0
75
My H/T states O&C dates 52 13 10 0 0 75
My H/T organizes open
days 59 16
0 0 0 75
MyH/T communicates
thro. C/T 52 18
5 0 0 75
My H/T communicates
thro. S/L 53 12
10 0 0 75
Low Performing Schools
My H/T writes
newsletter 0 0
10 45 20 75
My H/T states O & C
dates 0 14
20 33 8 75
My H/T organises open
days 5 3
52 15 0 75
My H/T communicates
thro. C/T 2 3
7 50 13 75
My H/T communicates
thro. S/L 12 5
50 8 0 75
Source: (Research data, 2014)

59
From table 15, the students responses indicated that principals in high performing
schools employed better methods of communication than the principals in the low
scoring schools.. This is indicated by their responses that their prinipals ‗always‘ wrote
newsletters for them which comprised 57 out of 75 students and translated to 81%. In
their responses on whether principals organised open days to discuss students‘ welfare,
59 out of 75 that is 82% respnded ‗always‘, and they also responded that their
headteachers used class teachers and students leaders ‗always‘ to pass information.
This clearly points a difference in the two categories of schools. In low performing
schools headteachers either ‗occasionally‘ or ‗rarely‘ wrote news letters or organised
school open days. Majority of the respondents that is 50 out of 75 students translating
to 75% responded that their headteachers did not use classteachers to pass information.
Thus the flow of information in the schools was poor. This could give a reason why the
students‘ performance lagged behind since both teachers and students did not get proper
information on what was supposed to happen in the schools.
The responses of students from high performing schools showed that the headteachers in
these schools practised better communication practices since majority of them
responded, ‗always‘ or ‗frequently‘. This indicates that the students were confident that
there was good communication from the headteachers in the schools. Some students
responded ‗occasionally‘ meaning that in some schools communication was not very
effective. Students responses from low performing schools responded that the flow of
information was done ‗occasionally‘ or ‗rarely‘. This may give reasons why
performance was poor since students were not aware of what they should do.
According to Goodland (1984) learning appeared to be enhanced when students
understand what is expected of them, get recognition of their work, learn quickly about
their roles and receive guidance on improving their performance. This was better
practiced in high performing schools than in poor performing schools where principals‘
practices of communication were poor. The responses from students pointed out the
need for improved methods of communication in schools so as to enhance the flow of
information. Communication was therefore noted to be a major tool in schools without
which the schools academic goals cannot be achieved. There was need for the
headteachers to revise their communication methods in schools. This would enable both
60
teachers and students to know what is expected of them in schools because when there is
proper flow of information in schools the students academic performance is likely to
improve.
61
CHAPTER FIVE
SUMMARY, CONCLUSIONS AND RECOMMENDATIONS
5.1 Introduction
The study was about the influence of headteachers‘ management practices on students‘
academic performance in Public Secondary Schools in Kitui Central, Kitui County,
Kenya. In this chapter the researcher discusses the summary, conclusions and
recommendations based on the findings from the study.
5.2 Summary of Research Findings
The summary of the research findings was subdivided in to the three variables that is;
supervision, motivation and communication. Each of the three variables was discussed
seperately.
5.2.1 Influence of Headteachers’ practices of Supervision on Students Academic
Performance
i. From the data analysis on the influence of headteachers‘ practices of
supervision on the students‘ academic performance, the teachers responses
indicated that 13 out of 40 respondents were not satisfied with their
headteachers‘ supervision practices
ii. From the responses, 11 teachers that is 84.62% of the respondents were from low
performing schools. There were only 2 teachers which translated to 15.38% who
were from high performing schools. This implies that students‘ poor academic
performance can be attributed to poor headteachers‘ supervision practices.
iii. The principals‘ management practices of supervision were therefore very
important in improving students‘ academic performance. From the data analyses
on the headteachers‘ supervision practices, it was noted that in the high
performing schools, the principals practiced supervision better than those in
poorly performing schools thus the reason for differences in performance in the
two categories of schools.

62
5.2.2 Influence of Headteachers’ Practices of Motivation on Students’Academic
Performance.
i. From the frequency distribution tables on the influence of headteachers‘
practices of motivation on the students academic performance, the teachers
responses indicated that 18 out of the 40 respondents responded that they
were motivated occasionally. The results further indicated that 15 of these
respondents were in the category of high performing schools. This
constituted 83.33% while only 3 teachers that is 16.67% were from low
performing schools. It can thus be argued that when teachers are motivated
occasionally academic performance improves.
ii. This study pointed that lack of teachers motivation contributed to poor
students academic performance in national examinations.
iii. The study findings were that most headteachers rarely motivated the students
and the staff which contributed to poor students academic performance in
national examinations. The headteachers in the high performing schools‘
practices of motivation were better than those of headteachers from the low
performing schools.
iv. It was therefore noted that the principals‘ practices of motivation greatly
contributed to students academic achievement because motivation boosted
the morale of both teachers and students hence, it was a major tool for better
students‘ academic achievement in national examinations.
5.2.3 Influence of Headteachers’ Practices of Communication on Students’
Academic Performance
i. From the data analysis on the influence of headteachers‘ practices of
communication on students‘ academic performance, the teachers‘ respondents
who were satisfied with their principals‘ methods of communication in the
institutions were 12 out of 40 which translated to 30%. Out of these, 10
respondents translating to 83.33% were from high performing schools. This
implied that where we have effective communication from the heateachers,
students‘ academic performance improves.
ii. The study found that learning a ppeared to be enhanced when teachers and
students understand what is expected of them through the headteachers proper

63
methods of communication. From the findings of the study, most of the teachers
and students underscored communication gaps in the schools.
iii. The study therefore noted the need to improve communication methods in
schools inorder to strengthen relationships and achieve better students academic
perfornance in national examinations.
iv. .Thus it is can be concluded that effective communication practices by principals
influences students‘ academic performance because it enables teachers and
students to clearly understand what is expected of them in the schools.
5.3 Conclusions
The study concluded that:
i. The headteachers‘ practices of supervision, motivation and communication
have direct influence on students‘ academic performance in national
examinations.
ii. In the high performing schools, the principals supervised teachers and students
better than the principals in the low performing schools. The principals in the
high performing schools further motivated both teachers and students and they
practised effective communication better than their counterparts in the low
scoring schools.
iii. In the schools that performed poorly, the principals‘ practices of supervision,
motivation and communication were poor. Students and teachers lacked
guidance and proper direction. The study concluded that there existed a gap
between the principals and the teachers in the low performing schools which
was clearly indicated by the schools‘ poor academic performance over the
years.
iv. The study pointed the need for headteachers to be physically present in
schools to supervise and monitor what is happening in the institutions.
v. School principals should come up with methods of motivating students and the
staff to encourage them to work hard towards improving the students academic
perfomance. This is because motivation boosts the teachers and students morale
to work towards achieving the schools‘ set goals.
64
vi. Lastly, effective communication in schools is very important as it enables
everyone to know what they are expected to do and this improves relationships
which leads to improved academic performance. In schools where the three
variables were rarely practiced poor academic perforamnce was noted implying
that management practices of headteachers were key in determining the schools
academic outcomes in national examinations.
5.4 Recommendations
From the discussion of the results, the following recommendations were made:
i. That principals ought to supervise teachers and students closely for effective
teaching and learning and for students to consistently do well in national
examinations. They should ensure that there are teaching schemes for each
subject in the curriculum to ensure coverage for the full period of the course in
each subject.
ii. School principals must create opportunities for understanding the needs,
aspirations and frustrations of each staff members through effective
communication, mutual trust and openness among all the stakeholders. Thus
there should be proper and free flow of information in the institutions regardless
of the communication model adopted by the school principal.
iii. The principals through the BOM should support the teachers, students and the
non-teaching staff motivation in schools. This is because motivation has been
seen to play a major role in improving students academic performance since it
boasts the morale of both teachers and students.
iv. Headteachers should start being team players instead of being managers by
improving their communication skills. This will ensure that there is free flow of
information in the schools hence better students academic performance.
v. BOMs should support the headteachers in students and teachers motivation
financing as motivation has been seen to play a major role in better students
academic performance.
vi. The ministry of education should organize in service courses for principals on
management practices that can lead to improved academic perfromance in their
institutions.
65
vii. There should be proper and free flow of information in the institutions regardless
of the communication model adopted by the school.
5.5 Recommendations for Further Research
This study was specifically carried out in Kitui Central, Kitui County. However, there
are many other counties in Kenya where the same research can be carried out focusing
on the influence of Headteachers‘ management styles and students‘ academic
performance in the counties for comparative analysis.

66
REFERENCES
Abaya, J. (2011). How Secondary School Principals Build Trust in Kenya Secondary
Schools. St. Louis: The University of Missouri.
Armstrong, M. (2001). A Hardbook on Human Resource Management Practice, (8 –
9) Kogan page publisher
Anderson, S. E. and Seashore, K. L. (2004). Review of Research; How Leadership
Influences Student Learning, University of Minesota and university of
Toronto
Andrew, C. P. (2008). Venderbilt Assessment of Leadership in Education; Technical
Manual, Vanderbilt University.
Armor, D. (1976). Analysis of the School Preferred Reading Program in Selected Los
Angeles Minority Schools, preferred for the Los Angelas United States School
District. Santa Monica: Carlifonia road Corporation .
Bhella, S. K. (1982). Principals Leadership Style, Does it Affect Teacher Morale;
Education, 102. 369 – 376, Retrieved September 24, 2006 from Psy CINFO
Data base
Bigala, C. B. (1978).A framework of Political Socialization. Nairobi: Kenya
Literature Bureau Nairobi.
Boyan, N. J. (1988). Hand book of Research on Educational Administration ;
London: Longman.
Brandley, S. P. Michael, S. K., (2009).Leadership for Learning Improvement in
Urban Schools, University of Washington.
Brandley, S. and Lauren, L. (2003). Making Sense of Leading Schools: The
Principals of Leadership, University of Washington.
Brandt, C. (1987). Leadership and Student Achievement: and a Conversation with
Richard Andrews, Education Leadership P. 45
Brooker, W. B. Beady, C. and Wisenbaker (1979). School Social Systems and
Students Achievement: Schools make a Difference, New York Praeger.
Brookover, W. (1979). Changes in Schools Characteristics: A Coincidence with
Changes in Student Achievement. Occassional Paper no.17 East Lansing
Michigan Institute of research on teaching, Michigan University way
ed.181:005.
Brumbach, G. B. (1988). Some Ideas, Issues and Predictions about Performance
Management, Public Personnel Management, Winter: 387 – 402
Bryman, and Bell, E. (2003). Business Research Methods; Oxford University Press:
United Kingdom
67
Campbell, J. P. (1999). The Definition and Measurement of Performance in the New
Age, in DR.
Davies, B. and Ellison, L. (2003). The New Strategic Direction and Development of
the School, London: Routhedge/Falmer Press
Decenzo, D. A. and Robbins, S. P. (1988). Personnel and Human Resource
Management: Third Edition Practices Hall, New Dehl India p. 3 – 4.
Edmonds, R. (1979). Effective Schools for the Urban Poor,Educational Leadership: Vol
(37) , 15-24.
Edmonds, R. R. (1982). Programs of School Improvement: an Overview, Educational
Leadership 40, 3, 4 – 11..
Fullan, M. (2001). Leading in a Culture of Change, San Fransisco; Jossey – Bass.
Fuller, B. (1987). What School Factors Raise Achievement in the Third World,A Review
Educational Research , 255-292.
Gay, L. R. (1987). Educatinal Research: Competencies for analyses and Application,
3rd
ed, Columbus Ohio: Merrill Publishing Company, 101
Goodland, J. (1984). A Place called School, the Prospects for the Future, New York:
Publisher
Gray, J. and Laidlow, H. (2004). Improving the measurement of communication
satisfaction, Mnagement communication Quarterly, A(3), 425 – 448.
Hargreaves, A. and Fullan, M. (1998). What’s Worth Fighting for Out There, New
York; Teachers‘ College Press.
Harris, A. (2002). School Improvement – what’s in it for schools, London: Routledge
Falmer, London.
Hayness, M. (2011) Meeting the Challege; The Role of School Leaders in Turning
Around the Lowest Performing Hish Schools; Alliance for Excellent Education.
New York.
Holmes, R. (2000) Is Learning a “ContaminatedConcept‖. A handbook for Schools:
London.
Howkins, S. and Janet, J. (1996). The Organization in its Environment, New York:
Oxford University Press.
Hoy, W. K. And Miskel, C.C. (1982). Educational Administration, Theory Research
and Practice; 2nd
Ed, Newyork: Random House, Inc.
Http://www.thinkadvisor.com/2011/08/31/practice-managment-primer-pt-
t.definition-and-pro (accessed on 18/11/2014)
Ingersoil, R. (2003). Is there Really a Teacher Shortage?, Philadelphia: University of
Pennsylvania, Consortium for Policy Research in Education.
68
John, M. G. (2010). A Revised Theory of Human Motivation, Arizona State
University
Kal-zenmeyer, M. and Moller, G. (2001). Awakening the Sleeping Giant:
Leadership Development for Teachers, Thou sand Oaks, CA: Corwin Press.
Karen, S. L. And Kenneth, L. (2004).Learning from Leadership: Student Learning,
University of Minesota and University of Toronto. USA
Kenneth, L., Karen S. L. and Stephen, E. A. (2004).Review of Research: How
Leadership Influences Student Learning,University of Toronto.
Kent, G. (1989). The Modern Primary School Head Teacher, Kogan Page Publisher,
London:
Kerlinger, F. N., (1986). ―Survey Research” in Foundation of Behavioral Research in
Education, New York.
Kilanga, S. M. (2013). Employee Relations Contributions to Students Performance
in Public Secondary Schools, (Unpublished Master Thesis 2013) Kenyatta
University.
Koul, I. (1993). Methodology of Educational Research, New Delhi, Willey Eastern
Ltd.
Marvel, J. L. and Morton, B. A. (2006). Teacher Attrition and Mobility, 2004 – 2005
Teacher Follow up Survey (NCES 2002 – 307) Washington DC, U.S.
Government Printing Office.
Maslow, A. H. (1943). A Theory of Human Motivation (Psychological Review),Pg
370 – 396)
Mbiti, D. (1974). Foundations of School Administration, Nairobi Oxford University
Press.
Mc Ewan, E. (2003). 7 Steps to Effective Instructional Leadership, Thousand Oaks,
CA: Corwin Press, Inc.
Michael, S. K. , Michael, A. C., and Bradley, S. P. (2010). Learning – Focused
Leadership and Leadership Support; Meaning and Practice in Urban
Systems, University of Washington.
Ministry of Education, (1993). Report of a Conference on Educational
Administration, Nairobi; Jomo Kenyatta Foundation.
Mortimore, P. (2000). The Road to School Improvement; Lisse, The Netherland:
Swets and Zethnger.
Mugenda, O. M. and Mugenda, A. G. (1999). Research Methods; Qualitative and
Quantitative Approaches, Act Press Nairobi.

69
Muya, M. (1993). Proper Management of Teachers, Daily Nation Nairobi January
21st
Muya, M. (1987). ―Kenya Examination System‖, Daily Nation Septermber 2nd
, Pg 6
Muya, M. (1991). Where Living is the Girls, Precious Blood and Starehe; Strathmore
break Public Schools Monopoly: Daily Nation Feb Pg 23.
Ngware, M. W., Wamukuru, D. K. and Odebero S. O. (2006). Total Quality
Management in Secondary Schools in Kenya Extent of Practice Quality
Assurance in Education, 14. (U) 339 – 362.
Nzuve, S. (1999). Management of Human Resources, Tech and Pro Publishers:
Nairobi, Kenya.
Ocham, L. A. (2010). Effects of Head Teachers Motivational Practices on Teacher
Performance in Public Secondary Schools in Koibateck District, Kenya,
http://erepository.uonbi.ac.ke:8080/handle/123456789/4763. Accessed on
25th February 2013.
Orlosky, L. K. (1984). Educational Administration Today, Columbus Charles E Merric
Publishing Co.
Orodho, J. A. (2004). Techniques of Writing Research Proposals and Report in
Education and Social Sciences, Bureau of Education Research Kenyatta
University; Nairobi Kenya.
Orora, J. O. (1988). School Culture and the Role of the Principal, Unpublished PHD
Dissertation, Dal housie University Nova Scotia.
Otieno, D. T. (2008). Factors Influencing Performance in Gusii,Unpublished PHD
Thesis; Kenyatta Univesirty.
Renson, M. M. (2009). “The Role of School Leadership in Student Achievement in
Kenya” Executive Doctor of Management Program Paper, Weather Head of
School Management.
Robbins, D. (1988). Personal and Human Resource Management, 3rd Edition Prentice
Hall. New Delhi India , 3-4.
Robbins, S. S. P. (1991). Organizational Behaviour; Concepts Controversies, and
Applications, 6th
Edition, New Delhi; Prentice Hall Inc. ―(1993)‖ Ranking of
Schools‖ Daily Nation June P. 13
Rutter, C. M. (1979). Fifteen Thousand Hours Secondary Schools and their Effects on
Children, London, Open University.
Seashore, L. K. and Leithwood, K. (2010). Leadership; Investigating the links to
improved student learning; University of Minnesota and University of
Toronto.

70
Storey, J. O. (2002). Human Resource Management, Marching on or Marching out?
In the Realities of Human Resource Management; Managing the Employment
Relationship. J. Story, and K. Buckingham: Open University Press; 3 – 32
Sweeney, B. (2012). School Administrators Perspectives on Labour Relations;
Survey Results and Analysis, IRC. Research Briefs, July 2012
Okumbe, J. A. (1998). Educational Management Theory and Practice, Nairobi
University Press
Usdan, M. C. (2001). Leadership of Student Learning; Redefining the Teacher as a
Leader, Institute of Educational Leadership. Washington DC.
Walker, G. B. (2007). Publication Participatory Communication in Environmental
Policy Decision Making, from Concepts to Structured
Conversations,Environmental Communications, I, 99 – 110
Wekesa, G. W. (1993). The Impact of Head Teacher Leadership on Student Academic
Achievement, Unpublished PHD Dissertation; Teacher College; Columbia
University.
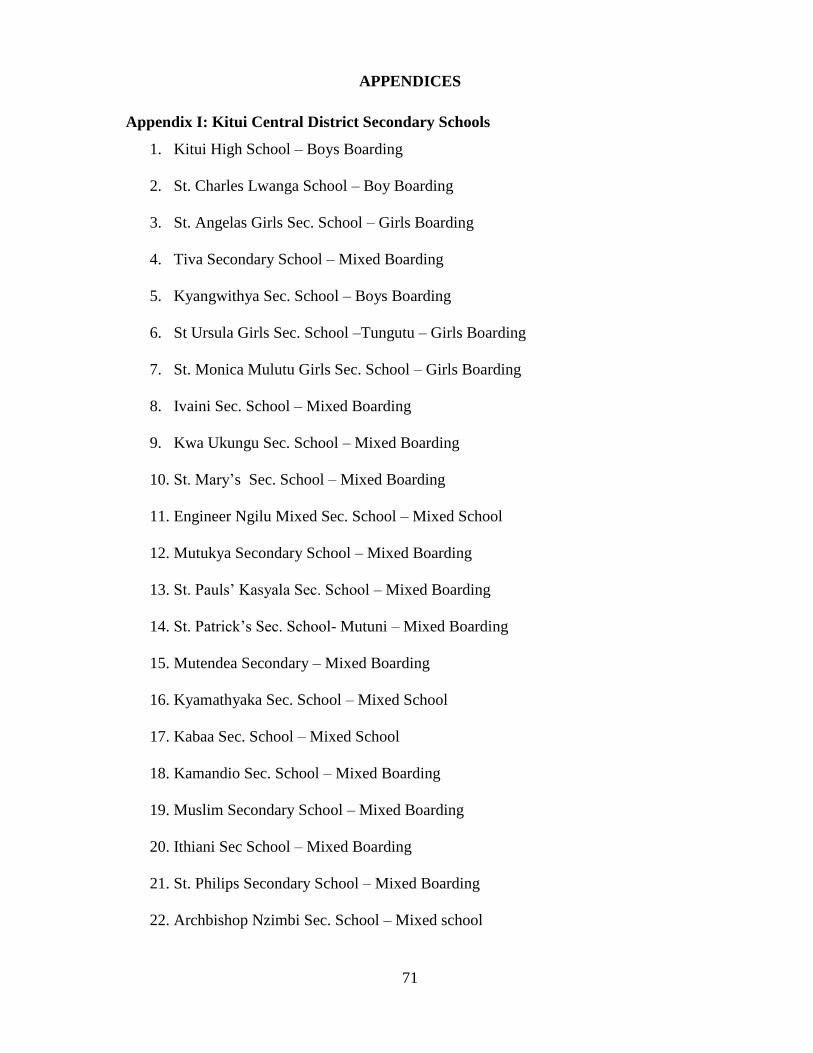
71
APPENDICES
Appendix I: Kitui Central District Secondary Schools
1. Kitui High School – Boys Boarding
2. St. Charles Lwanga School – Boy Boarding
3. St. Angelas Girls Sec. School – Girls Boarding
4. Tiva Secondary School – Mixed Boarding
5. Kyangwithya Sec. School – Boys Boarding
6. St Ursula Girls Sec. School –Tungutu – Girls Boarding
7. St. Monica Mulutu Girls Sec. School – Girls Boarding
8. Ivaini Sec. School – Mixed Boarding
9. Kwa Ukungu Sec. School – Mixed Boarding
10. St. Mary‘s Sec. School – Mixed Boarding
11. Engineer Ngilu Mixed Sec. School – Mixed School
12. Mutukya Secondary School – Mixed Boarding
13. St. Pauls‘ Kasyala Sec. School – Mixed Boarding
14. St. Patrick‘s Sec. School- Mutuni – Mixed Boarding
15. Mutendea Secondary – Mixed Boarding
16. Kyamathyaka Sec. School – Mixed School
17. Kabaa Sec. School – Mixed School
18. Kamandio Sec. School – Mixed Boarding
19. Muslim Secondary School – Mixed Boarding
20. Ithiani Sec School – Mixed Boarding
21. St. Philips Secondary School – Mixed Boarding
22. Archbishop Nzimbi Sec. School – Mixed school

72
23. Kwa Ngindu Sec. School – Mixed Boarding
24. Mutulukuni Sec. School – Mixed Boarding
25. Museve Sec. School – Mixed Boarding
26. Kwa Muema Sec. School – Mixed Boarding
27. AIC Miambani Sec. School – Mixed Boarding
28. St. Pauls Mutula Sec. School – Mixed Boarding
29. Katyethoka Sec. School – Mixed School
30. Mbusyani Sec. School – Mixed Boarding
31. Kaliakakya sec. School – Mixed Boarding
32. Kiviu Sec. School – Mixed Boarding
33. Ithimani Sec. School – Mixed Boarding

73
Appendix II: Introduction Letter
Influence of Headteachers‘ Management Practices on Students‘ Academic Performance
in Public Secondary Schools within Kitui Central District, Kitui County, Kenya.
South Eastern Kenya University
P.O. Box 170 - 90200
KITUI
Re: Letter to the Respondents
Dear respondents,
This research is by a student of South Eastern Kenya University. It is for academic
purpose only. The research is an investigation on the influence of managerial practices
of head teachers in secondary schools and their effects on students‘ academic
performance. A case of Kitui Central District.
The information collected will be treated with confidence. Please give appropriate and
accurate answers.
Thank you
Yours faithfully,
Mrs. Lena Kasyoka

74
Appendix III: Student`s Questionnaires
Instructions to Students
Do not write your name on the questionnaire
The questionnaire is divided into sections ‗A‘ ‗B‘ ‗C‘ ‗D‘ and ‗E‘
Please do respond to the questions by either ticking ( ) the correct response or by
filling in details as required where appropriate.
Section ‘A’
Name of your school ___________________________________________
Class ____________________________________________________
Age
Below 14 ( )
14-17 ( )
18-20 ( )
Above 20 years ( )
Gender
Male ( ) Female ( ) please tick one
Section B: Supervision
Please tick the appropriate response as follows:
A = Always, F = Frequently, O = Occasionally, R = Rarely, N = Never
Students Response A F O R N
1 My head teacher requires that I be punctual to class
2 My head teacher requires that I should work hard to pass my
examinations
3 My head teacher reprimands me when I fail in my terminal exams
4 My head teacher ensures that all lessons are taught every day
5 My head teacher ensures that the school daily routine is followed
6 My head teacher requires that I seek assistance from teachers to
improve my weak areas
7 Availability of head teacher in school

75
Section C: Motivation
Please tick the appropriate response as follows:
A = Always, F = Frequently, O = Occasionally, R = Rarely, N = Never
Students Response A F O R N
1 My headteacher gives me presents when I pass well in my
exams
2 My head teacher organizes prize giving days every year
when our school has performed well in national
examinations
3 My head teacher calls me to the office to discuss my
academic progress and advices me accordingly
4 My head teacher holds general meetings with all students in
the school to discuss our school progress
5. What form of rewards are you given (a)______________________________
(b) ______________________________
(c) ______________________________

76
Section D:Effective Communication
Please tick the appropriate response as follows:
(A = Always, F = Frequently, O = Occasionally, R = Rarely, N = Never)
Students Response A F O R N
1 My head teacher writes newsletter to my parents every end
of term to inform them about schools progress
2 My head teacher communicates the school opening and
closing days to students, teachers and parents
3 My head teacher organizes open days in school to share our
challenges in the school
4 My head teacher communicates to us every day through our
class teachers
5 My head teachers uses the students leaders in the school to
pass information to other students
12. How many times do you have assemblies per
week?___________________________

77
Section E: Academic Performance
Please tick the appropriate response as follows:
SD = Strongly Disagree, D = Disagree, A = Agree, SA= Strongly Agree
Students Response SD D A SA
1 My headteacher requires I work hard inorder to improve my
academic performance
2 Myheadteacher demands that I perform well in all subjects
taught
3 My headteacher inspects my lesson notes
4 My headteacher requires each students to set academic targets
for each term
5 My headteacher reprimands me when I fail in my internal
exams
6 My schools KCSE academic performance is above a mean
score of 5.00
7. Give your KCSE mean score for 2010_______________________________
2011 _______________________________
2012 _______________________________
8.Give your class mean grade in last terms end term exams _________________
9. What was your individual performance in-terms of grades last term _________
10. What is your academic target this term _______________________________
Thank you
Mrs. Lena Kausya

78
Appendix IV: Teachers Questionnaires
Instructions to Teachers
Do not write your name on the questionnaire
The questionnaire is divided into ‗A‘ ‗B‘ ‗C‘ ‗D‘ and ‗E‘
Please do respond to the questions by either ticking the correct response ( ) or by
filling in the details as required where appropriate.
Section ‘A’
Demographic Data
Name of your school __________________________________________________
Teaching subjects _____________________________________________________
How long have you taught in the school ___________________________________
Your professional qualification please
Trained diploma teacher ( )
Trained graduate teacher ( )
Untrained graduate teacher ( )
Post graduate teacher ( )
Gender
Male ( ) Female ( ) please tick one
Age in years
25 – 30 ( )
31 – 40 ( )
41 – 50 ( )
50 and above ( ) ( Please tick one)

79
School Characteristics
Tick the appropriate response/ fill in the blank space
School category
Girls School ( )
Boys School ( )
Mixed School ( )
How many teachers do have in your school? ________________________________
How many are TSC employees __________________________________________
How many are BOG employees _________________________________________
Section B: Supervision
Please tick the appropriate response as follows:
A = Always, F = Frequently, O = Occasionally, R = Rarely, N = Never
Teachers Response A F O R N
1 My head teacher inspects my lesson plan notes
2 My head teacher supervises me while teaching my
lessons in class
3 My head teacher inspects my teaching aids
4 My head teacher requires me to teach all my lessons in
the school timetables
5 My head teacher inspects my schemes of work and
records work
6 My head teacher requires that I supervise students
when they are doing private studies
7 My head teacher encourages me to put extra effort in
my work for the success of the school
8 I perceive my head teacher‘s management style as
being effective
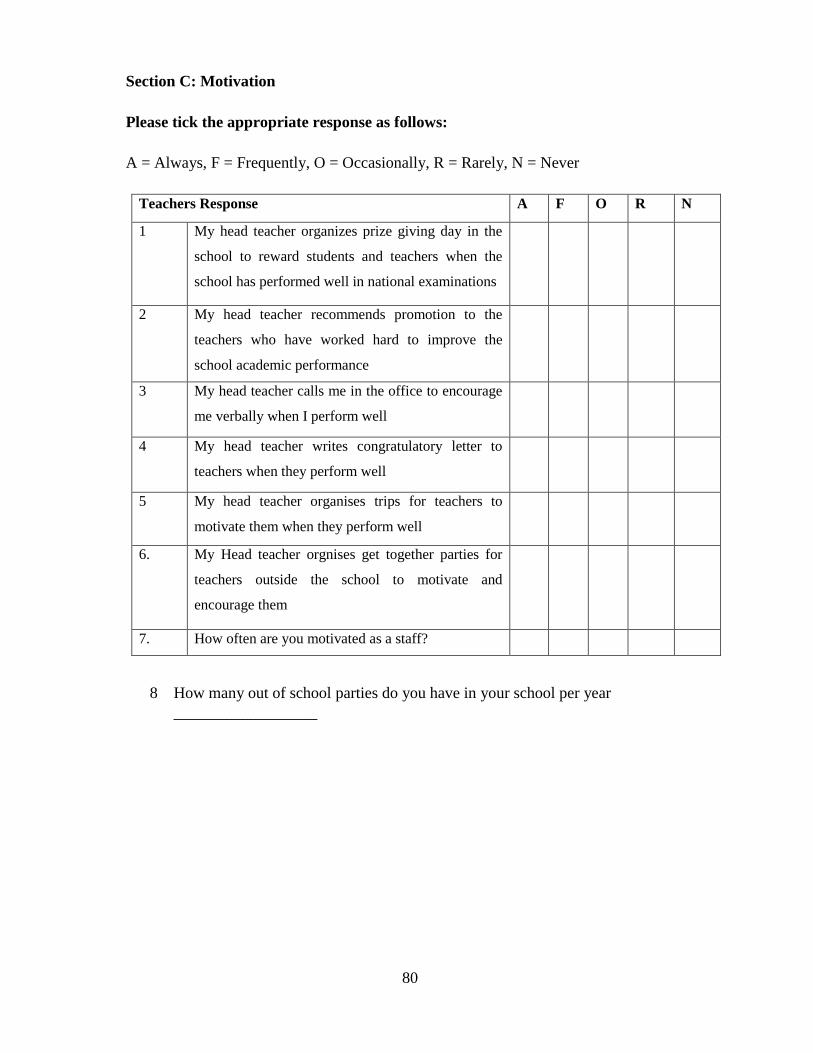
80
Section C: Motivation
Please tick the appropriate response as follows:
A = Always, F = Frequently, O = Occasionally, R = Rarely, N = Never
Teachers Response A F O R N
1 My head teacher organizes prize giving day in the
school to reward students and teachers when the
school has performed well in national examinations
2 My head teacher recommends promotion to the
teachers who have worked hard to improve the
school academic performance
3 My head teacher calls me in the office to encourage
me verbally when I perform well
4 My head teacher writes congratulatory letter to
teachers when they perform well
5 My head teacher organises trips for teachers to
motivate them when they perform well
6. My Head teacher orgnises get together parties for
teachers outside the school to motivate and
encourage them
7. How often are you motivated as a staff?
8 How many out of school parties do you have in your school per year
__________________
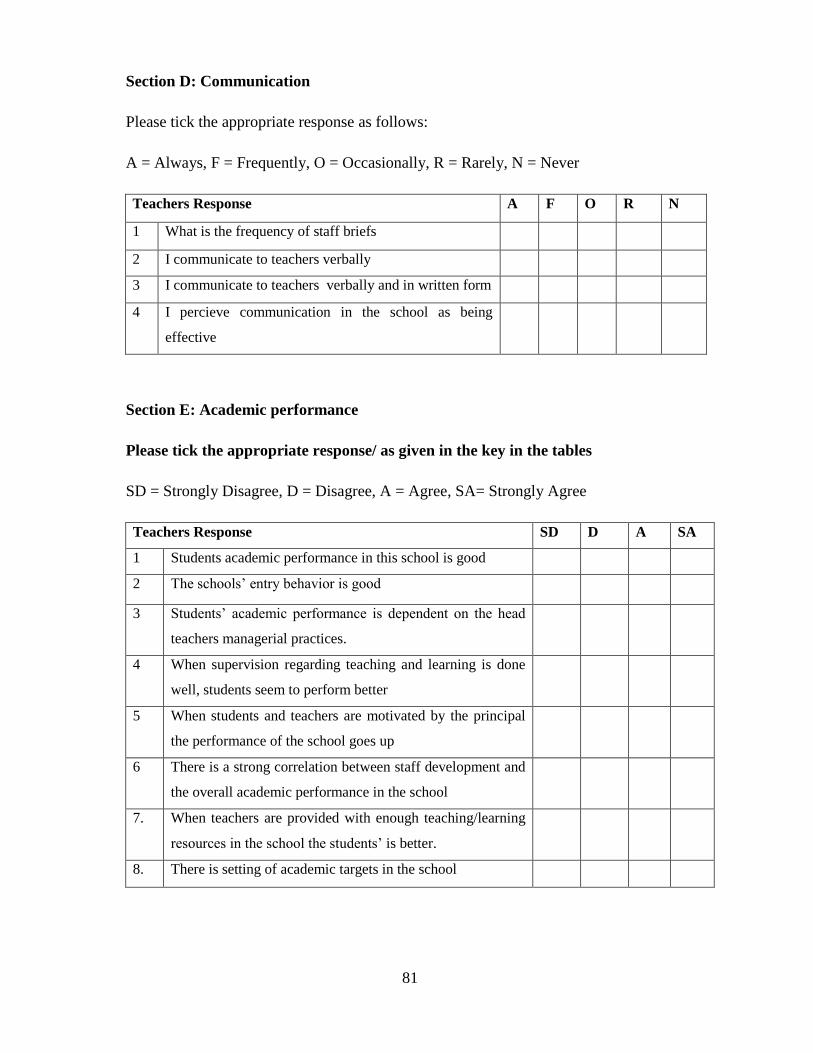
81
Section D: Communication
Please tick the appropriate response as follows:
A = Always, F = Frequently, O = Occasionally, R = Rarely, N = Never
Teachers Response A F O R N
1 What is the frequency of staff briefs
2 I communicate to teachers verbally
3 I communicate to teachers verbally and in written form
4 I percieve communication in the school as being
effective
Section E: Academic performance
Please tick the appropriate response/ as given in the key in the tables
SD = Strongly Disagree, D = Disagree, A = Agree, SA= Strongly Agree
Teachers Response SD D A SA
1 Students academic performance in this school is good
2 The schools‘ entry behavior is good
3 Students‘ academic performance is dependent on the head
teachers managerial practices.
4 When supervision regarding teaching and learning is done
well, students seem to perform better
5 When students and teachers are motivated by the principal
the performance of the school goes up
6 There is a strong correlation between staff development and
the overall academic performance in the school
7. When teachers are provided with enough teaching/learning
resources in the school the students‘ is better.
8. There is setting of academic targets in the school

82
9. If there is academic target setting in your school, what is your subject target this term
_______________________________________________________________________
10. State any other three ways in which your head teacher can do to improve academic
performance in your school.
_______________________________________________________________________
_______________________________________________________________________
Thank you
Mrs. Lena Kausya

83
Appendix V: Principal’s Questionnaire
Instructions to the Principal
Do not write your name on the questionnaire
The questionnaire is divided into two sections; Section A‘ ‗B‘ ‗C‘ ‗D‘ and ‗E‘
Please respond to the questions by either ticking ( ) the correct response or by filling
in details as required where appropriate.
Section ‘A’ Demographic Data
Principals’ Background
Please tick the appropriate response/fill in the blank space
Gender:
Male ( )
Female ( )
Write the name of your school ________________________________________
State your professional qualifications
Graduate teacher ( )
Untrained graduate ( )
Trained Diploma teacher ( )
Post graduate ( )
Any other___________________________________________________
How long have you been a principal in the school _________________________
Is your school fully staffed or understaffed?
Yes ( )
No ( ) (Tick one)
Indicate your age in years
30 – 40 ( )
41 – 50 ( )
51 – 60 ( ) (Please tick one)
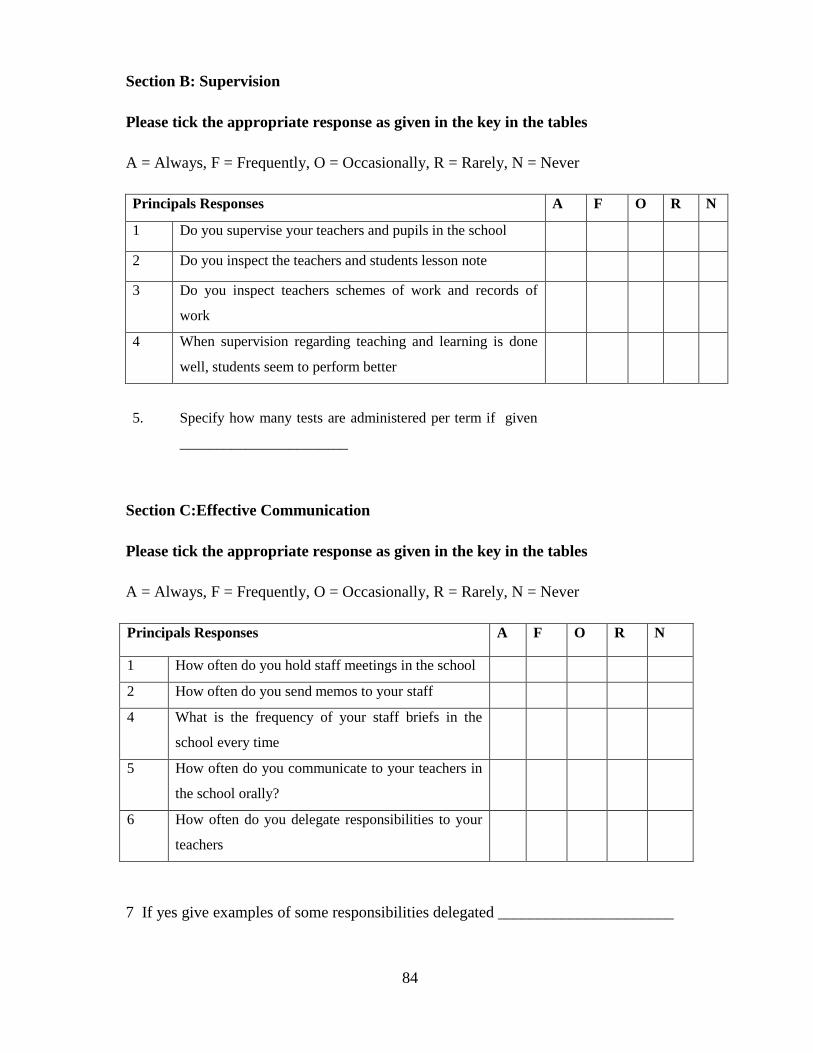
84
Section B: Supervision
Please tick the appropriate response as given in the key in the tables
A = Always, F = Frequently, O = Occasionally, R = Rarely, N = Never
Principals Responses A F O R N
1 Do you supervise your teachers and pupils in the school
2 Do you inspect the teachers and students lesson note
3 Do you inspect teachers schemes of work and records of
work
4 When supervision regarding teaching and learning is done
well, students seem to perform better
5.
Specify how many tests are administered per term if given
_______________________
Section C:Effective Communication
Please tick the appropriate response as given in the key in the tables
A = Always, F = Frequently, O = Occasionally, R = Rarely, N = Never
Principals Responses A F O R N
1 How often do you hold staff meetings in the school
2 How often do you send memos to your staff
4 What is the frequency of your staff briefs in the
school every time
5 How often do you communicate to your teachers in
the school orally?
6 How often do you delegate responsibilities to your
teachers
7 If yes give examples of some responsibilities delegated ______________________

85
Section D:Motivation
Please tick the appropriate response as given in the key in the tables
A = Always, F = Frequently, O = Occasionally, R = Rarely, N = Never
Principals Responses A F O R N
1 How often do you reward students?
2 How often do you recomment teachers for
promotion?
3 How often do you recognise students efforts?
4 How often do you stay in the staffroom and talk
freely with your teachers to encourage them
5 When students and teachers are motivated by the
principal the performance of the school goes up
Section E: Academic Performance
Please tick the appropriate response/ as given in the key in the tables
Vg = Very good, G = Good, F = Fair, P = Poor
Principals Responses Vg G F P
1 How do you rate students academic performance in this school
2 How is your schools entry behavior?
3 When we have good head teachers‘ managerial practices, the
students performance is
4. What is your school‘s KCSE mean target this year? ___________________________
5. What was your schools‘ KCSE mean in the year
2010 ___________________
2011 ___________________
2012 ___________________

86
6. What are some of the methods that you use in your school to ensure improved
academic
Performance
____________________________________________________________
____________________________________________________________
Thank you
Mrs. Lena Kausya