influence of substrate thickness on the...
TRANSCRIPT

Mladen Stančić, Branka Ružičić, Nemanja Kašiković, Dragoljub Novaković, Rastko Milošević
141
Journal of Chemical Technology and Metallurgy, 50, 2, 2015, 141-148
INFLUENCE OF SUBSTRATE THICKNESS ON THE QUALITY ATTRIBUTES OF POLYMER MATERIALS REVERSE PRINTED BY SCREEN PRINTING TECHNIQUE
Mladen Stančić1, Branka Ružičić1, Nemanja Kašiković2,
Dragoljub Novaković2, Rastko Milošević2
1 University of Banja Luka, Faculty of Technology, Graphic Engineering Vojvode Stepe Stepanovića 73, 78 000 Banja Luka Bosnia and Herzegovina E-mail: [email protected] University of Novi Sad Faculty of Technical Sciences, Graphic Engineering and Design Trg Dositeja Obradovića 6, 21 000 Novi Sad, Serbia
ABSTRACT
The printing substrate and its characteristics have a significant impact on print quality. Print quality includes de-sired colour reproduction and satisfactory reproduction of image elements. This study analyzes the transparent polymer material substrates, printed by a screen printing technique. The paper primary focus is on the analysis of colour differ-ences between obverse and reverse side of the printing substrate, and in addition, on line quality and the dot roundness analysis. Considering the results, it can be concluded that substrate thickness has influence on the colour reproduction in reverse printing when observing through a transparent substrate. Also, the differences between line area and perimeter in obverse and line area and perimeter – in the reverse printed side increases with the printing substrate thickness increase and dot roundness observed from the reverse side has a more irregular shape.
Keywords: polyethylene films, obverse and reverse printing, colour reproduction, line quality, dot roundness.
Received 18 September 2014Accepted 30 January 2015
INTRODUCTION
Polymer materials in the printing industry are mostly used in flexible packaging. As the market requires not only good quality but aesthetic appearance as well, manufacturers resort to attractive design and printing for guiding customers to faster recognition of their prod-ucts. Polymer substrates can be printed by flexographic, screen printing and, with technology advances, by ink jet printing technique. Nowadays, polymer substrates are mostly printed by flexographic technology, with low viscosity inks, but the disadvantage of this technique is the high implementation cost [1]. Screen printing has a great advantage in terms of cost when low-circulations are produced. Requirements for its use are very modest, and it can in essence be carried out anywhere in the world
with little prerequisites. Also, it is simple, fast, reproduc-ible, flexible and adaptable [2, 3]. On the other hand, polyethylene as a printing substrate is the most widely used plastic on earth with an annual production of ap-proximately 80 million tons [4]. Polyethylene is created by ethylene polymerization. The types are: PE-HD high density (> 0.941 g cm-3), PE-MD medium density (0.926 - 0.940 g cm-3), PE-LD low density (0.910 - 0.925 g cm-3) polyethylene. PE-LD is highly branched and contains relatively high amorphous content, which results in an outstanding clarity in the film for food packaging, which is a major application [5]. Polyethylene as a material has some characteristics that greatly affect the final result of the product. Beside transparency that shows the distor-tion of an object observed through the examined film, the haze has also a huge impact. It represents scattering

Journal of Chemical Technology and Metallurgy, 50, 2, 2015
142
of light by a film that results in a cloudy appearance or poorer clarity of objects when viewed through the film. Light may be scattered by particles suspended in the substance, such as pigment particles or contaminants, or by an imperfect surface caused by dirt, oil, or a fine texture. Haze is an important appearance attribute which can be quantified and then used to assess the objects such as liquids, glass, plastics, painted panels, and even metals [6]. More technically, haze is the percentage of light transmitted through a film that is deflected more than 2.5° from the direction of the incoming beam. This property is used to describe transparent and translucent films, not opaque films. Haze is greatly influenced by material selection and product design. Additives and coatings usually contribute to increased haze. Also, thicker films will be hazier than thinner films. Additional variables, like process temperatures in the different stages of film-making, can further affect haze, so they are tightly controlled [7]. Reverse printing, i.e. printing on the underside of a transparent film, is mostly used in the production of packaging for food as snacks, juices, biscuits, ketchup, etc. In this technique the ink is printed on the inner layer of substrate and it does not become in direct contact with human skin, weather conditions and other substrates because in most of cases the ink is sandwiched between substrates by a lamination process. Reverse printed and laminated materials such as BOPP (biaxial oriented polypropylene), CPP (Cast Polypro-pylene), LDPE (Low density polyethylene) makes the perfect double, triple or quadruple layer films used for food packaging. Beside laminated products reverse printing is also used with an LDPE film for bottle label, overwrap film for books, bundling and pallets, towels and tissues, film for bakery goods, meat, coffee, frozen foods, liquid packaging (milk cartons and bag-in-box applications), bags and shoppers, packaged beverages industries and others. In case of a reverse printing sub-strate, characteristics can affect the image quality in many ways [8]. The colour reproduction can be charac-terized using the CIE L*a*b* colour coordinates. CIE L*a*b* coordinates enable colour differences estimation between samples, or between samples and standards, or in this research between reverse and obverse image of the same sample. Colour differences determination is based on calculations of the differences of colour space coordinates (ΔL, Δa, Δb) [9]. There are many systems that use different formulas (models) for colour distance
calculation, wherein the gain values can be classified into several groups: ΔEab < 0.2 (the difference is not visible), ΔEab between 0.2 and 1 (the difference is noticeable), ΔEab between 1 and 3 (the difference can be seen), ΔEab between 3 and 6 (the difference is easy to see) and ΔEab over 6 (obvious colour difference) [10]. Colour distance (ΔEab) is defined by the equation [11]:
(1)
In equation (1) ΔEab is the colour difference value, L* is the brightness value, a* is red/green colour value, b* is yellow/blue colour value.
Quantitative assessment of the colour reproduction is not enough for defining overall print quality. It is proven that print quality does not represent monotonous function of hue, saturation and value [12, 13]. Quality at-tributes as contrast, sharpness, macro non-uniformity are not connected to a colour reproduction but certainly have an affect on print quality. They are directly connected with line and dot quality that represent the component of any image [14]. Important print quality attributes are: contrast, sharpness, noise/graininess, edge ragged-ness, effective resolution, text quality, micro uniform-ity, macro non-uniformity, gloss uniformity, etc. [13]. Many researchers have questioned and acknowledged the importance of quality attributes. However, they did not reach an agreement which of them were the most important. Engeldrum in his work states that observers most likely will not be able to perceive more than five quality attributes simultaneously [15].
Line quality reproduction depends on numerous factors, including the printing plate (screen and the process of illumination), ink and substrate [16]. Some of the quality components are line width and its variations, raggedness and sharpness. Line raggedness indicates deviation of printed lines from ideal geometric shape and is the undesired line property that leads to print quality reduction. Line raggedness can be characterized by measuring area and perimeter of lines and comparing these values with ideal ones. Excessive line raggedness causes low sharpness of the prints and can cause text to become unclear or bold [11].
Printed dot fidelity is determined by evaluating dot area and its roundness [17]. Dot roundness represents the shape of the dot relative to a perfect circle. The ideal circular dot should be the one whose area is π/2 that of

Mladen Stančić, Branka Ružičić, Nemanja Kašiković, Dragoljub Novaković, Rastko Milošević
143
the corresponding square pixel. If the dot is not perfectly round, its deviation can cause uneven ink coverage. Dot roundness is defined as [18]:Roundness = 4π (A/p2) (2)where A is the area of the dot and p is its perimeter. The roundness is equal to 1 for circle, and is less than one for any other closed figure. The closer the roundness is to 1, the better is the quality of the dot. Fleming et al. stated that their analyses and interpretation are general and applicable to any printing processes where image quality is governed by the smallest printable dot [19]. In screen printing, due to the technique itself, it is not expected that roundness reaches values as high as 1.
It should be pointed out that the aim of this study is to investigate the influence of transparent polyethylene film thickness on print quality. The analysis primaryly included the colour reproduction, but important quality attributes such as line quality and dot roundness, were also examined. Colour reproduction was analysed by spectrophotometric measurements, and secondary im-age quality parameters evaluation was performed by the method of digitally analysed scanned imprint images in specified programming languages.
EXPERIMENTAL
This research included four different thicknesses of polymer material of the same composition. The mate-rial used was PE-LD low density polyethylene (0.910 - 0.925 g cm-3). Used thicknesses were 30, 35, 38 and 110 mm. The samples were printed with the screen print-ing technique. Test image, used in research, was created using Adobe Illustrator CS5.5 software. The test image dimension was 210 x 297 mm and contained different elements used for print quality control. Elements used for obtaining the results were 2.54 x 2.54 mm solid tone patches, lines 2 pt width and dots with 0.6 mm diameter. Screen with thread count of 120 threads per cm was used for printing plates, which were made convention-ally using linearized positive films. As a photo sensitive coating Sericol Dirasol 22 emulsion was used. Exposure was performed 90 seconds with a RUVA lamp (40W), where the distance from the lamp to screen measured 20 cm. Printing speed amounted to 15 cm per second, squeegee hardness - 85 Shore Type A, while snap-off distance measured 4 mm. Ink used for printing was Seri-col Polyscreen yellow colour PS-043/1 (Mid Chrome).
Fixation of printed samples was carried out on room temperature in duration of 4 hours. After fixation, the printed sheets were digitalized by Mustek 1200 ub plus flat scanner for further analysis. The scanning resolution was set as 600 spi and all auto functions were turned off.
CIE L*a*b* colour coordinates on the obverse and reverse side of a printed sample were obtained using diffuse spectrophotometer Konica Minolta cm-2600d (Illuminant D65, Standard Observer 8º, geometric con-dition d/8, measurement area 11 mm).
Line reproduction was assessed by measuring area and perimeter of 2 points thick lines and comparing these values with area and perimeter values of an ideal image created using a computer in resolution of 600 ppi.
Dot roundness was obtained by measuring printed dots with 0.6 mm diameter. All values of importance were calculated using ImageJ software, implemented in Java for the creation, visualization, editing, processing, and image analysis [20].
RESULTS AND DISCUSSION
Colour reproductionThe influence of substrate thickness on the change
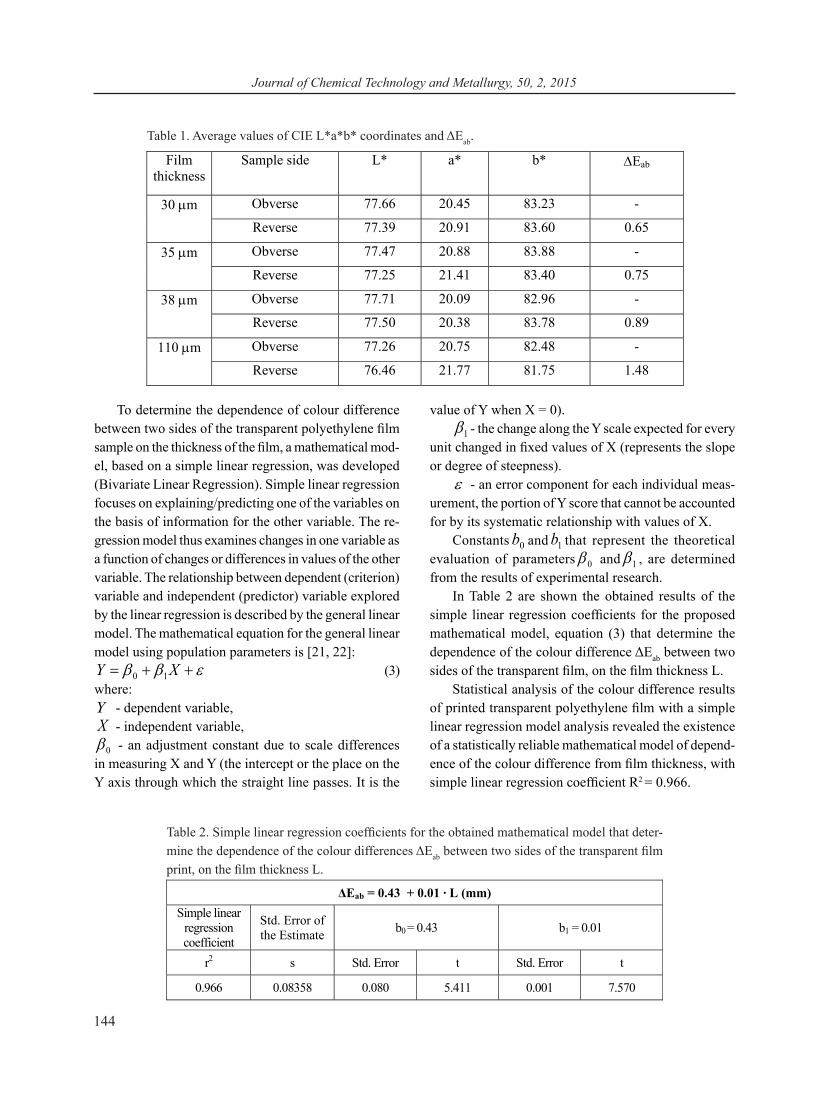
of the sample features by screen printing technique was experimentally determined. First the CIE L*a*b* coordi-nates of the samples on the obverse printed side were de-termined with a spectrophotometer. Five measurements were performed for each sample, and was used the mean value as the result. The same process was performed for the reverse side of printing, and the obtained results are shown in Table 1, where the film thickness used in the printing process for every sample is specified.
On the basis of the obtained results the colour dif-ference values of the obverse side of the printed sample and the reverse side measured through the transparent film, are determined. The obtained results show that there is a change in colour. These changes are small and can be listed in two groups of values - a group of values for colour difference where the difference is noticeable (ΔEab between 0.2 and 1), and a group where the colour difference between obverse and reverse side results is visible (ΔEab between 1 and 3). An increase of colour dif-ference with an increasing of film thickness is noticeable which shows that film thickness affects colour, i.e. with the increase of film thickness the film has a greater haze and it brings changes to colour coordinates readings.
Journal of Chemical Technology and Metallurgy, 50, 2, 2015
144
To determine the dependence of colour difference between two sides of the transparent polyethylene film sample on the thickness of the film, a mathematical mod-el, based on a simple linear regression, was developed (Bivariate Linear Regression). Simple linear regression focuses on explaining/predicting one of the variables on the basis of information for the other variable. The re-gression model thus examines changes in one variable as a function of changes or differences in values of the other variable. The relationship between dependent (criterion) variable and independent (predictor) variable explored by the linear regression is described by the general linear model. The mathematical equation for the general linear model using population parameters is [21, 22]:
εββ ++= XY 10 (3)where:Y - dependent variable,X - independent variable,
0β - an adjustment constant due to scale differences in measuring X and Y (the intercept or the place on the Y axis through which the straight line passes. It is the
value of Y when X = 0).1β - the change along the Y scale expected for every
unit changed in fixed values of X (represents the slope or degree of steepness).
ε - an error component for each individual meas-urement, the portion of Y score that cannot be accounted for by its systematic relationship with values of X.
Constants 0b and 1b that represent the theoretical evaluation of parameters 0β and 1β , are determined from the results of experimental research.
In Table 2 are shown the obtained results of the simple linear regression coefficients for the proposed mathematical model, equation (3) that determine the dependence of the colour difference ΔEab between two sides of the transparent film, on the film thickness L.
Statistical analysis of the colour difference results of printed transparent polyethylene film with a simple linear regression model analysis revealed the existence of a statistically reliable mathematical model of depend-ence of the colour difference from film thickness, with simple linear regression coefficient R2 = 0.966.
Table 1. Average values of CIE L*a*b* coordinates and ΔEab.
Table 2. Simple linear regression coefficients for the obtained mathematical model that deter-mine the dependence of the colour differences ΔEab between two sides of the transparent film print, on the film thickness L.
ΔEab = 0.43 + 0.01 ∙ L (mm) Simple linear
regression coefficient
Std. Error of the Estimate b0 = 0.43 b1 = 0.01
r2 s Std. Error t Std. Error t
0.966 0.08358 0.080 5.411 0.001 7.570
Film thickness
Sample side L* a* b* ∆Eab
30 mm Obverse 77.66 20.45 83.23 -
Reverse 77.39 20.91 83.60 0.65
35 mm Obverse 77.47 20.88 83.88 -
Reverse 77.25 21.41 83.40 0.75
38 mm Obverse 77.71 20.09 82.96 -
Reverse 77.50 20.38 83.78 0.89
110 mm Obverse 77.26 20.75 82.48 -
Reverse 76.46 21.77 81.75 1.48

Mladen Stančić, Branka Ružičić, Nemanja Kašiković, Dragoljub Novaković, Rastko Milošević
145
Line reproductionLine analysis, as an essential attribute of print qual-
ity, was performed by measuring the surface area and perimeter lines. The results obtained by measuring the 2 pt thick lines from both sides of the printed sample are shown on Fig. 1. The smallest difference is with the thinnest film of 30 mm, and the difference increases with the increasing of film thickness, so the biggest difference is with the thickest film of 110 mm.
In this graph, the differences between the line areas from both sides of the film can be seen. It is necessary to examine the relations between differences of the line areas on the obverse and line areas on the reverse side of print, then between the line areas on the obverse side of the print and the ideal line as well as the difference between line areas on the reverse side and the ideal line. The results are shown in Fig. 2.
Results in Fig. 3 show 2 pt (0.7 mm) line perimeter values. The smallest difference between the line perim-
eters is on the 30 mm thick film sample and it gradually increases with increasing film thickness, so that the big-gest difference between the obverse and reverse side of a film is on the 110 mm thick film.
In this graph, differences between the line perimeters from both sides of the film can be seen. It is necessary to examine the relations between differences of line perimeters on the obverse and line perimeters on the reverse side of print, then between the line perimeter on the obverse side of the print and the ideal line, as well as the difference between line perimeters on the reverse side and the ideal line. The results are shown in Fig. 4.
Dot reproductionIn addition to analysis of line area and perimeter,
the quality of dot reproduction, which is determined on the basis of its roundness, is a more important factor for determining the print quality. Roundness of a dot was analyzed with ImageJ software. Dots with 0.6 mm in
Fig. 1. Graphical representation of line area values.
Fig. 2. Graphic representation of line area trend with increasing of film thickness.

Journal of Chemical Technology and Metallurgy, 50, 2, 2015
146
Fig. 3. Graphic representation of line perimeter values.
Fig. 4. Graphic representation of line perimeter movements with increasing of film thickness.
Fig. 5. Graphic representation of dot roundness values.
Mladen Stančić, Branka Ružičić, Nemanja Kašiković, Dragoljub Novaković, Rastko Milošević
147
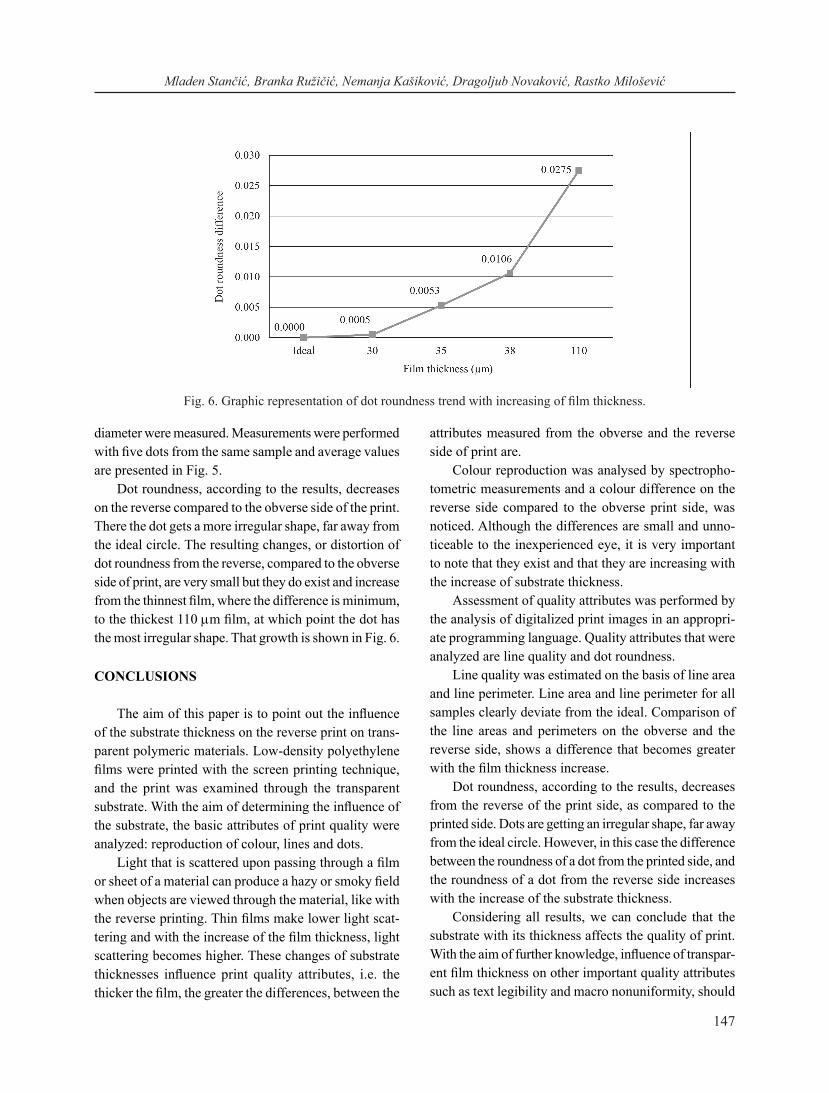
diameter were measured. Measurements were performed with five dots from the same sample and average values are presented in Fig. 5.
Dot roundness, according to the results, decreases on the reverse compared to the obverse side of the print. There the dot gets a more irregular shape, far away from the ideal circle. The resulting changes, or distortion of dot roundness from the reverse, compared to the obverse side of print, are very small but they do exist and increase from the thinnest film, where the difference is minimum, to the thickest 110 mm film, at which point the dot has the most irregular shape. That growth is shown in Fig. 6.
CONCLUSIONS
The aim of this paper is to point out the influence of the substrate thickness on the reverse print on trans-parent polymeric materials. Low-density polyethylene films were printed with the screen printing technique, and the print was examined through the transparent substrate. With the aim of determining the influence of the substrate, the basic attributes of print quality were analyzed: reproduction of colour, lines and dots.
Light that is scattered upon passing through a film or sheet of a material can produce a hazy or smoky field when objects are viewed through the material, like with the reverse printing. Thin films make lower light scat-tering and with the increase of the film thickness, light scattering becomes higher. These changes of substrate thicknesses influence print quality attributes, i.e. the thicker the film, the greater the differences, between the
attributes measured from the obverse and the reverse side of print are.
Colour reproduction was analysed by spectropho-tometric measurements and a colour difference on the reverse side compared to the obverse print side, was noticed. Although the differences are small and unno-ticeable to the inexperienced eye, it is very important to note that they exist and that they are increasing with the increase of substrate thickness.
Assessment of quality attributes was performed by the analysis of digitalized print images in an appropri-ate programming language. Quality attributes that were analyzed are line quality and dot roundness.
Line quality was estimated on the basis of line area and line perimeter. Line area and line perimeter for all samples clearly deviate from the ideal. Comparison of the line areas and perimeters on the obverse and the reverse side, shows a difference that becomes greater with the film thickness increase.
Dot roundness, according to the results, decreases from the reverse of the print side, as compared to the printed side. Dots are getting an irregular shape, far away from the ideal circle. However, in this case the difference between the roundness of a dot from the printed side, and the roundness of a dot from the reverse side increases with the increase of the substrate thickness.
Considering all results, we can conclude that the substrate with its thickness affects the quality of print. With the aim of further knowledge, influence of transpar-ent film thickness on other important quality attributes such as text legibility and macro nonuniformity, should
Fig. 6. Graphic representation of dot roundness trend with increasing of film thickness.

Journal of Chemical Technology and Metallurgy, 50, 2, 2015
148
be examined. It would also provided an opportunity to examine the influence of other material properties such as surface tension, surface roughness, dampening and contact angle on the print quality.
AcknowledgementsThe research is supported by the Ministry of educa-
tion, science and technology development of Republic of Serbia, project number: 35027 „Development of software model for scientific and production improve-ment in graphic industry“ and project CEEPUS III RS - 0704 - 03 - 1415, „Research and Education in the Field of Graphic Engineering and Design“.
REFERENCES
1. H. Kipphan, Handbook of print media: Technologies and Production Methods, Springer, Berlin, 2001
2. T.M. Lee, Y.J. Choi, S.Y. Nam, C.W. You, D.Y. Na, H.C. Choi, D.Y. Shin, K.Y. Kim, K.I. Jung, Color filter patterned by screen printing, Thin Solid Films, 516, 2008, 7875-7880.
3. F. Krebs, M. Jørgensen, K. Norrman, O. Hagemann, J. Alstrup, T. Nielsen, J. Fyenbo, K. Larsen, J. Kristensen, A complete process for production of flexible large area polymer solar cells entirely using screen printing - First public demonstration, Solar Energy Materials and Solar Cells, 93, 2009, 422-441.
4. R. Szentgyörgyvölgyi, E. Novotny, Investigation of flexographic printing on PE and BOPP foils, Proceedings of GRID ‘10, Novakovic, D. (Ed.), Novi Sad, Serbia, 2010, FTN, GRID, NOVI SAD (2010), pp. 337-342.
5. D.B. Malpass, Introduction to Industrial Polyethylene: Properties, Catalysts, and Processes, John Wiley & Sons, Inc., New Jersey, 2010
6. Technical Services Department Hunter Associates Laboratory, Inc., Insight on Color, Haze. HunterLab Application Note, 9, 6, 2008, 1-4
7. I. Vujković, K. Galić, M. Vereš, Ambalaža za paki-ranje namirnica, Tectus, Zagreb, 2007.
8. Y. Kipman, Image Quality Metrics for Printers and Media, IS&T’s Conference - Image Processing, Image Quality, Image Capture, Systems Conference, Portland, 1998, 183-187.
9. N.T. Kočevar, Kolorimetrijska analiza i vizuelna
ocjena boja na dvobojnoj tkanini. Tekstil, 55, 2006, 127-134.
10. K. Schläpfer, Farbmetrik in der grafischen Industrie. UGRA, St. Gallen, 2002.
11. M. Stančić, D. Novaković, N. Kašiković, V. Vukmirović, B. Ružičić, Influence of material composition on print quality digitally printed textile substrates, Tekstilna industrija, 1, 2013, 37-43.
12. E. A. Fedorovskaya, H. De Ridder, F. Blommaert, Chroma variations and perceived quality of colour images of natural scenes, Color research and ap-plication, 22, 2, 1997, 96-110.
13. M. Pedersen, N. Bonnie, J. Hardeberg, F. Albregtsen, Attributes of a new image quality model for color prints, Proceedings of Color Imaging Conference, Albuquerque, New Mexico, USA, 2009, 204-209.
14. A. Dhopade, Image quality assessemnet according to ISO 13660 and ISO 19751, Test Targets 9.0, Published by RIT School of Print Media, Rochester, NY, 2009, 43 - 50
15. P. G. Engeldrum, A Theory of Image Quality: The Image Quality Circle, Journal of Imaging Science and Technology, 2004, 446-456.
16. S. Ingram, Screen Printing Primer, Sec. Ed. Sewickley, GATFPress, 1999.
17. J. Sarafano, A. Pekarovicova, Factors Affecting Dot Fidelity in Solvent Based Publication Gravure, American Ink. Maker, 1999, 32-36.
18. M. Stančić, D. Novaković, I. Tomić, I. Karlović, Influence of Substrate and Screen Thread Count on Reproduction of Image Elements in Screenprinting, acta graphica, 23, 2012, 1-12.
19. P.D. Fleming, J.E. Cawthorne, F. Mehta, S. Halwawala, M.K. Joyce, Interpretation of Dot Fidelity of Ink Jet Dots Based on Image Analysis. The Journal of Imaging Science and Technology, 5, 2003, 394-399.
20. W.S. Rasband, ImageJ, U.S. National Institutes of Health, Maryland, USA, http://rsb.info.nih.gov/ij/, 1997-2006.
21. J. Komić, Metodi statističke analize kroz prim-jere - zbirka zadataka. Univerzitet u Banjoj Luci, Ekonomski fakultet, Banja Luka, 2000.
22. J. Pallant, SPSS - A Step by Step Guide to Data Analysis Using SPSS for Windows, Allan & Unwin, Australia, 2007.