infographics - university of queensland · reproduced or adapted from original content provided...
TRANSCRIPT

Reproduced or adapted from original content provided under Creative Commons license by The University of Queensland Library
Infographics: Display Data for Easy Interpretation
Course objectives:
• Create new infographics • Customise layouts • Edit content using text, images, media, charts and maps • Publish, Present and Print
Student Training and Support Phone: (07) 334 64312 Email: [email protected] Web: https://web.library.uq.edu.au/library-services/training/
Service Points St Lucia: Main desk of the SSAH, ARMUS and DHESL libraries Hospitals: Main desk of the PACE, Herston and Mater libraries Gatton: Level 2, UQ Gatton Library
Staff Training (Bookings) Phone (07) 3365 2666 Email [email protected] Web http://www.uq.edu.au/staffdevelopment Staff may contact their trainer with enquiries and feedback related to training content. Please contact Staff Development for booking enquiries or your local I.T. support for general technical enquiries.

InfographicsManual_VenngageV002.docx 2 of 20 Data Visualisation: Infographics
Table of Contents Venngage ....................................................................................................................................... 3
Create a Venngage account ................................................................................... 3
Creating a Data Visualisation .......................................................................................................... 3
The Venngage interface .................................................................................................................. 4
Getting Started ................................................................................................................................ 5 View featured Venngage creations ......................................................................... 5 Choose a template ................................................................................................. 5 Set Dimensions ...................................................................................................... 6 Rename your Visualisation ..................................................................................... 6
Adding Content ............................................................................................................................... 7 Change Background............................................................................................... 7 Add Text ................................................................................................................. 7 Working with Graphics ........................................................................................... 8
Edit graphics ................................................................................................................................. 10 Upload Images ..................................................................................................... 10
Insert Images .................................................................................................... 10
Grouping ....................................................................................................................................... 11 Grouping related elements ................................................................................ 11 Ungrouping ....................................................................................................... 11 Lock Objects ..................................................................................................... 11 Unlock Objects ................................................................................................. 11
Interactive elements ...................................................................................................................... 12 Insert pictograms .............................................................................................. 12 Insert charts ...................................................................................................... 13 Add Hyperlinks ................................................................................................. 15 Add a map ........................................................................................................ 16 Add Video ......................................................................................................... 17 Acknowledgments ............................................................................................. 17
Publish, Present and Print your Venngage .................................................................................... 18 Publish your infographic .................................................................................... 18 Preview a Venngage ......................................................................................... 19 Download your Venngage ................................................................................. 19 Print your Venngage ......................................................................................... 20
General house keeping ................................................................................................................. 20 Delete a Venngage ........................................................................................... 20

3 of 20 Data Visualisation: Infographics
Venngage Venngage is a web application, for creating a range of data visualisations including infographics, posters, reports, and promotions. The basic version of the Venngage application is web based and does not require an installation. You do, however, need a free account to start creating your own visualisations. As a UQ student you are able to use your academic mailbox to create an educational licence. There are also additional paid membership options which can be investigated at https://Venngage.com/pricing/
Create a Venngage account Preferred browser for using Venngage is Google Chrome
1. Go to http://venngage.com 2. Click on SIGN UP FOR FREE
3. Complete the registration form DO NOT use the same password as your UQ account. Email address has to be your UQ domain email address in order to get Premium. Example- [email protected]
4. Click on Register
Creating a Data Visualisation The process in five easy steps
1. Discover your infographic Story What do you want your creation to say?
2. Choose a Template • Infographic • Poster • Presentation • Report
3. Get the Relevant Data This can be your own data, original research or from other data sources such as journals, databases or websites
4. Design your infographic • Visualisations • Layouts/shapes • Colours/Fonts
5. Promote your Infographic Publish by sharing online or downloading to print

4 of 20 Data Visualisation: Infographics
The Venngage interface Venngage is being actively developed and the interface and features may change from time to time.
Venngage has six main sections:
1. Templates Access templates to assist with new creations of any format.
2. Infographics Your personal library of creations.
3. Community A gallery of published inforgraphics from Venngage users
4. Blog Blog posts to assist users with their creations
5. Account This allows you to change your account settings or sign out
6. Support A help centre which is only available from certain screens
Formats
Gallery

5 of 20 Data Visualisation: Infographics
Getting Started
View featured Venngage creations
1. Click Community
2. Click on any displayed creation
Choose a template Templates are pre-made visualisations with frames that you can edit with your content. Use templates to get a feel for how Venngage works best or to get started quickly.
Venngage Editor
Use a new template
1. Click TEMPLATES in the banner
2. Select Informational under INFOGRAPHICS
Side Menu
Tools
Banner
Zoom Control
Workspace
6 of 20 Data Visualisation: Infographics
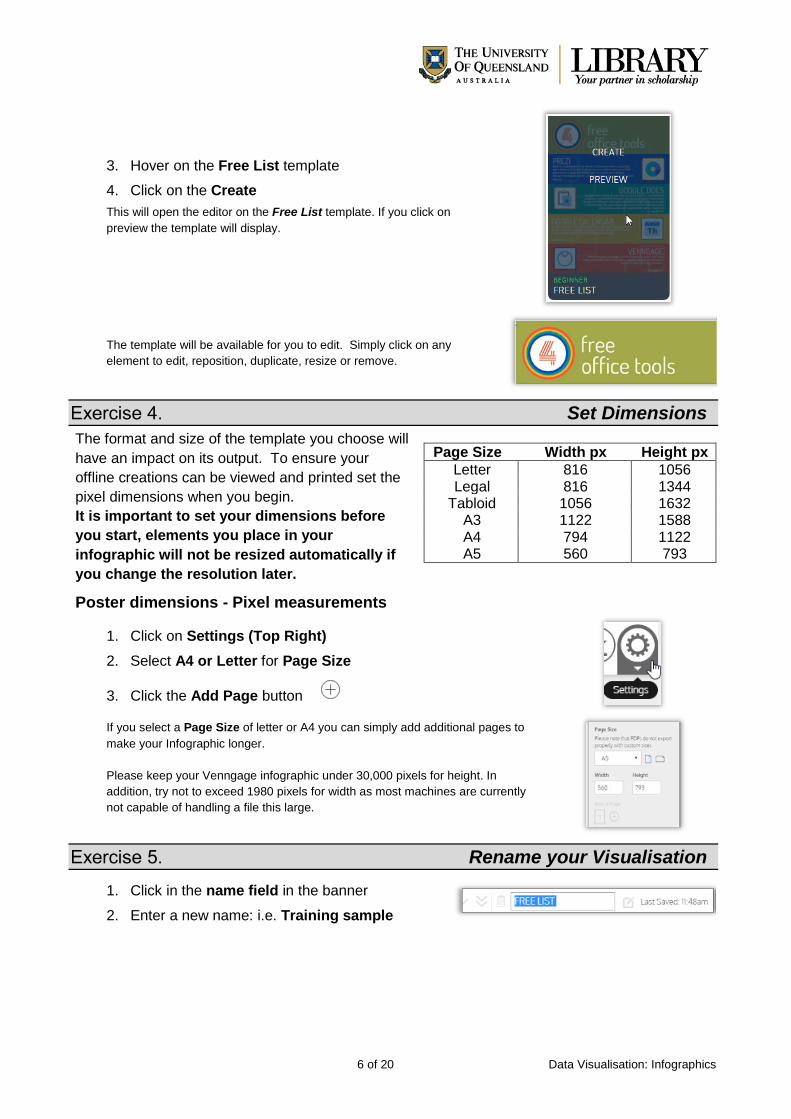
3. Hover on the Free List template 4. Click on the Create This will open the editor on the Free List template. If you click on preview the template will display.
The template will be available for you to edit. Simply click on any element to edit, reposition, duplicate, resize or remove.
Set Dimensions The format and size of the template you choose will have an impact on its output. To ensure your offline creations can be viewed and printed set the pixel dimensions when you begin. It is important to set your dimensions before you start, elements you place in your infographic will not be resized automatically if you change the resolution later.
Poster dimensions - Pixel measurements
1. Click on Settings (Top Right) 2. Select A4 or Letter for Page Size
3. Click the Add Page button
If you select a Page Size of letter or A4 you can simply add additional pages to make your Infographic longer. Please keep your Venngage infographic under 30,000 pixels for height. In addition, try not to exceed 1980 pixels for width as most machines are currently not capable of handling a file this large.
Rename your Visualisation 1. Click in the name field in the banner 2. Enter a new name: i.e. Training sample
Page Size Width px Height px Letter 816 1056 Legal 816 1344
Tabloid 1056 1632 A3 1122 1588 A4 794 1122 A5 560 793

7 of 20 Data Visualisation: Infographics
Adding Content
Change Background
1. Click on Background 2. Click on the colour sample
3. Click anywhere in the colour wheel 4. Drag the saturation target to alter the depth
of colour (optional) 5. Drag the opacitiy to change the
transparency (optional) You can also add a colour using the hexadecimal code or using the Red, Green, Blue and Alpha RGBA references.(Alpha is the transparency)
6. Click Add Color icon to add colour to palette
Add Text
1. Double-click free 2. Add University of Queensland 3. Click the Size drop down
4. Select 72

8 of 20 Data Visualisation: Infographics
1. Double-click office tools 2. Add LIBRARY 3. Click the Alignment drop down 4. Select centred alignment If your headings are grouped, you may need to ungroup your headings
1. Click the Heading placeholder A dark outline with handles will appear.
2. Drag this object up to re-position 3. Green alignment guides will display
onscreen.
1. Click Text in the side menu 2. Add a Text Frame by dragging it into
position below the heading
3. Resize to fit 4. Double-click text frame content to edit 5. Add new text: 2017
Working with Graphics
1. Click on Icons in the side menu 2. Click on Lines & Borders 3. Drag a Line button to page
4. Click and drag line to resize
9 of 20 Data Visualisation: Infographics
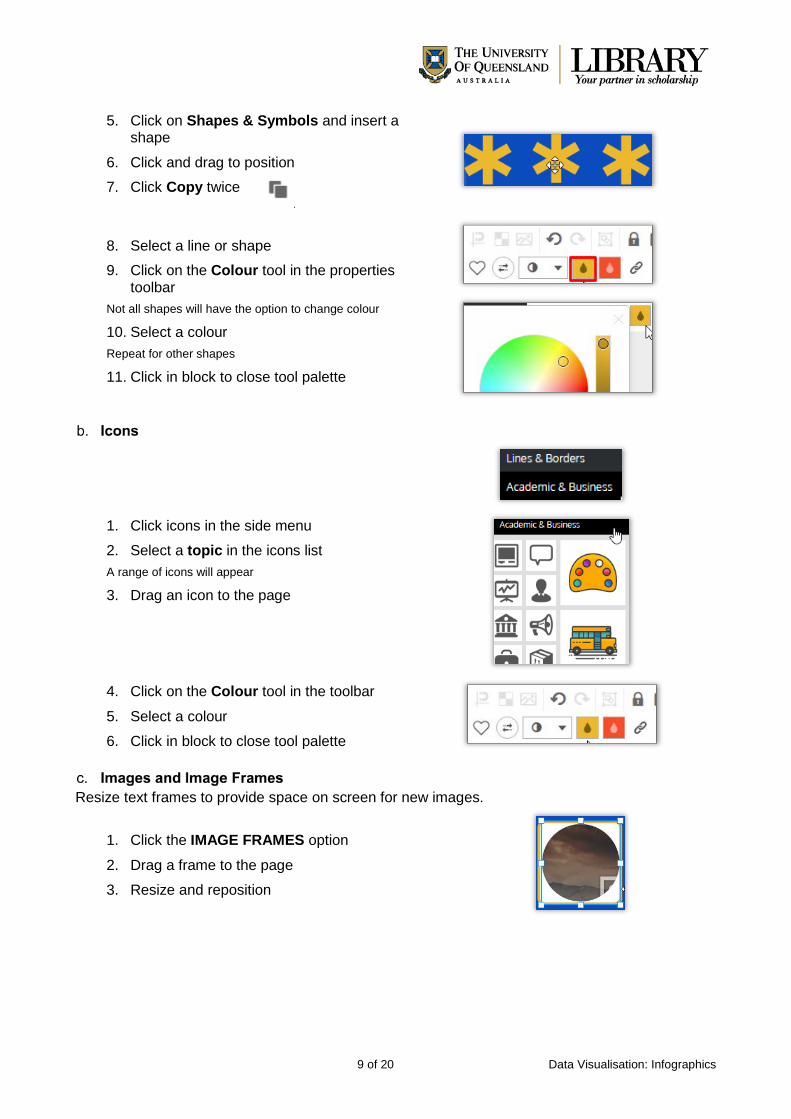
5. Click on Shapes & Symbols and insert a shape
6. Click and drag to position 7. Click Copy twice
8. Select a line or shape 9. Click on the Colour tool in the properties
toolbar Not all shapes will have the option to change colour
10. Select a colour Repeat for other shapes
11. Click in block to close tool palette
1. Click icons in the side menu 2. Select a topic in the icons list A range of icons will appear
3. Drag an icon to the page
4. Click on the Colour tool in the toolbar
5. Select a colour 6. Click in block to close tool palette
Resize text frames to provide space on screen for new images.
1. Click the IMAGE FRAMES option
2. Drag a frame to the page 3. Resize and reposition

10 of 20 Data Visualisation: Infographics
4. Click IMAGE in the side menu 5. Enter a search term 6. Drag and Drop the photo 7. Click and drag the photo into the Image Frame
8. The image will be bound by the frame already in place.
Note: If you drag beyond the frame the image will appear independently.
Edit graphics
Upload Images
1. Click on Uploads in the side menu 2. Click DRAG & DROP images here to upload
or Upload Image button
3. Click on Browse 4. Navigate to the required image file 5. Click on Upload Make sure to use an image that is free to use or share, even commercially
Insert Images
1. Go to UPLOADS in the side menu
2. Drag and drop an image on the page 3. Resize and Reposition

11 of 20 Data Visualisation: Infographics
Grouping Objects can be selected together to edit or can be grouped to manage in a frame are automatically grouped. This means they rescale or will be deleted if you change or delete the frame. Grouping also links objects.
Grouping related elements
1. Click and drag across the objects to group or Hold Shift and click objects
2. Click and Drag to reposition
1. Click and drag across the objects to group or Hold Shift and click objects
2. Select Group on the tools bar 3. Click and drag to reposition Note: Grouped items will always proportionally resize.
Ungrouping
Optional 1. Select Ungroup
Lock Objects 1. Click on any object 2. Click on the padlock button Note Groupings cannot be locked. The padlock will change to red when an object is locked.
Unlock Objects
1. Click on a locked object on the page 2. Click on the red padlock button

12 of 20 Data Visualisation: Infographics
Interactive elements If you intend to use a digital version of your infographic you can add charts, hyperlinks, interactive maps and media clips.
Insert pictograms
1. Go to Pictograms in the side menu 2. Click on a topic heading 3. Click and drag any icon on to the page A 5 by 5 pictogram will automatically be added to the page. It will also highlight a 13% difference in results
1. Click the icon/row button 2. Select a number for rows 3. Click the icon/column button 4. Select a number for columns 5. Resize and reposition Pictogram if necessary
1. Click the color one sample in the toolbar
2. Select a new colour 3. Click into page to confirm change 4. Repeat for color two
1. Click the fill % button
2. Select a fill number to represent a percentage
Note: color one will change to represent the fill value. To add information explaining pictogram add text frames.

13 of 20 Data Visualisation: Infographics
Insert charts
1. Go to Charts in the side menu 2. Click and drag the desired chart into the
project 3. Resize and reposition as necessary A popup window will appear if you double click the chart, displaying:
• A list of available chart types. • A preview of the chart • A spreadsheet for inserting or importing your data
4. Change the data as shown: representing 90% of population change data
5. Go to the Settings tab 6. Switch on Show Title 7. Click Show Title arrow
a. Enter Title Smart Phone Usage 8. Switch off Legend 9. Click Background Colour sample
a. Select a colour b. Adjust the opacity
10. Resize and reposition as necessary

14 of 20 Data Visualisation: Infographics
1. Go to Charts in the side menu 2. Select the Pie Chart and drag to desired
location 3. Double click on the Pie Chart
4. Click the Chart Style arrow 5. Select the donut chart
6. Change the data as shown–– 7. Click the colour samples on the side of the data
to change individual colours
8. Click Settings tab 9. Switch off the Legend 10. Change the Donut Size to 60
Layering is necessary to locate a chart behind an image or icon for effect.
11. Select the Pie Chart 12. Click Move to back button 13. Resize and reposition as necessary
The chart will be positioned behind the relevant object.

15 of 20 Data Visualisation: Infographics
Add Hyperlinks You can include hyperlinks to sites on the internet by entering the URL. Note that these hyperlinks will only become active if you choose Publish and either view the infographic online, embed the infographic to a website or download it as an Interactive PDF. Links will not work if you export to JPEG or PNG.
1. Select the object or text you would like to hyperlink on your Venngage.
References, icons and images are great for hyperlinking. Not every object will show the hyperlink symbol.
2. Click the link icon in the top menu 3. Enter the URL. 4. Hit Enter Note: Links won’t be active until published.
5. Click on Publish button 6. Click on Preview to check link There will be no indication of the link other than the Hyperlink Hand

16 of 20 Data Visualisation: Infographics
Add a map
1. Click Maps in the side menu
2. Drag the Country desired onto your Infographic
3. Double click to edit the MAP
4. Enter details for each state
5. Click Settings tab
6. Click colour samples to adjust the colours for the minimum and maximum data values.
Note: Other values will display in gradients of colour
7. Click Save button
Note: The Map will only be interactive when published. The data that you include has captions available (on Hover) with the online (url /published) shared version. However, no static data will appear for the downloaded version.

17 of 20 Data Visualisation: Infographics
Add Video You can add a YouTube video to an infographic. Note, however, that videos will only work when opened with the provided URL or when the infographic is embedded in a website. Videos will not work if you choose to export your Venngage as JPEG, PNG, or PDF.
1. Click on Interactive in the side menu 2. Drag the YouTube icon to desired location 3. Paste the video URL 4. Click Send 5. Resize and reposition as necessary To resize or move, make sure you click on the boundary of the video
Acknowledgments It is important to include attribution for the sources used in creating your infographic. These can be added to the last section in your creation.
1. Insert Text 2. Click to edit text

18 of 20 Data Visualisation: Infographics
Publish, Present and Print your Venngage
Publish your infographic
Share online via Edit Mode
1. Click on Publish in menu bar This will make your Infographic public and visible on the Community page. You will be given a link to your infographic.
2. Click Publish in the submenu 3. Edit the Infographics Name as needed 4. Click Publish
Note: The URL of your creation will display. This can be copied to add to web pages, blogs and presentations. To remove you creation from the Community gallery click on Unpublish
Share privately via Edit Mode
1. Click on Share in menu bar
2. Enter in the recipients email address Or 3. Click Enabled 4. Copy and share the address shown
5. The URL of your creation will display. This can be copied to add to web pages, blogs and presentations.

19 of 20 Data Visualisation: Infographics
Preview a Venngage
1. Click Infographics 2. Hover mouse over a Venngage 3. Click on Preview
1. Click on Publish 2. Click Preview This will open the Infographic in a new tab
Download your Venngage Go to Infographics
1. Click Edit button on chosen creation 2. Click Download
3. Select the download file type
4. Enter a filename for the download 5. Click on Save

20 of 20 Data Visualisation: Infographics
Print your Venngage Venngage does not include a built-in printing function. To print, you have to first download your infographic to your computer.
1. Open the file using your computer's photo software, and print with that application.
You may experience unexpected results if your printer cannot work with the infographic dimensions.
General house keeping
Delete a Venngage
1. Click Infographics in the toolbar
2. Click on the Cog icon on the Venngage thumbnail 3. Then click Delete Infographic
4. Click on the Delete button