inform innovate accelerate optimize how telcos can … · inform innovate accelerate optimize how...
TRANSCRIPT
© 2013 TM Forum | 1
V2013.4
inform innovate accelerate optimize
How telcos can
benefit from
streaming big data
analytics
Sponored by:
#streamingbigdataanalytics

© 2013 TM Forum | 2
V2013.4
Today’s Speakers
Adrian PasciutaDirector of Industry Solutions
Rebecca SendelSenior Director, Business Assurance Program
© 2014 TM Forum | 3
V2013.5
inform innovate accelerate optimize
Data Analytics
Best Practices
TM Forum WebinarSeptember 2014
© 2014 TM Forum | 4
V2013.5
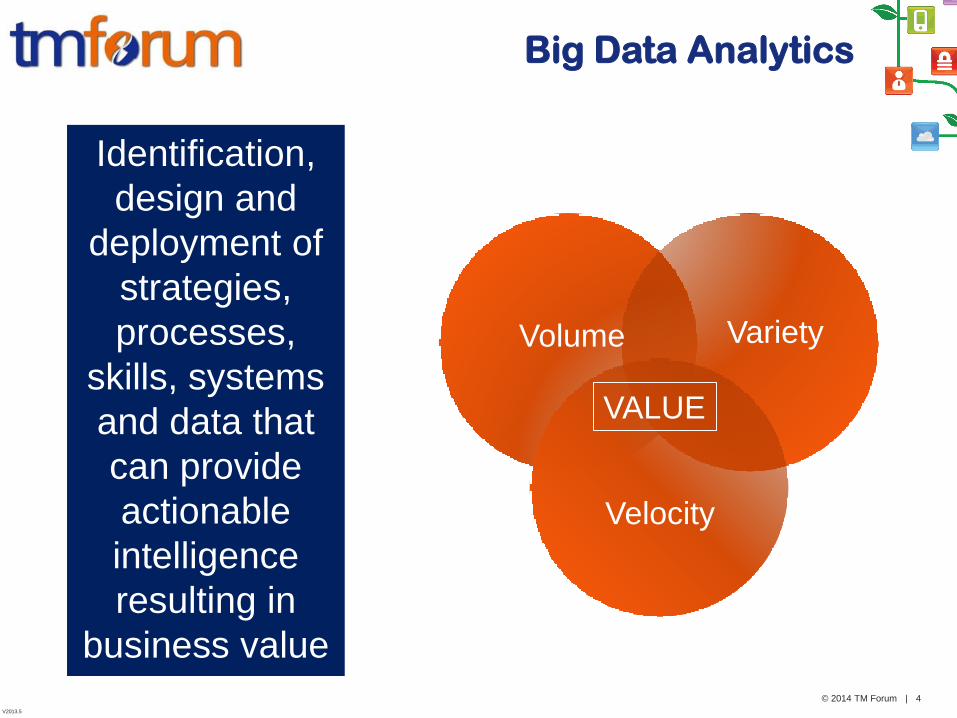
Big Data Analytics
Identification,
design and
deployment of
strategies,
processes,
skills, systems
and data that
can provide
actionable
intelligence
resulting in
business value
VarietyVolume
Velocity
VALUE
© 2014 TM Forum | 5
V2013.5
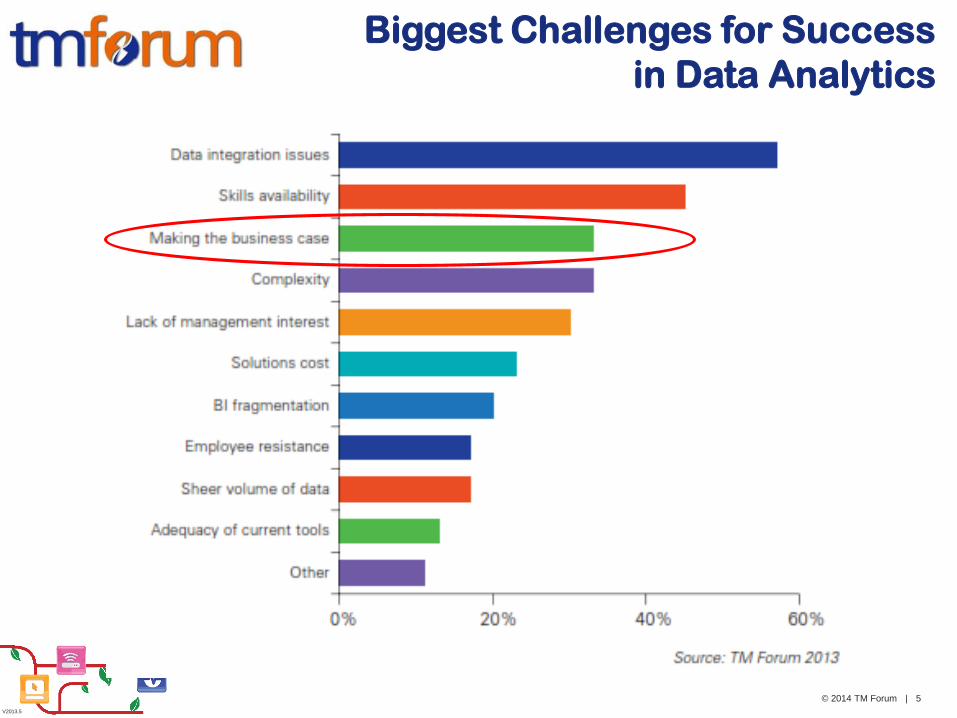
Biggest Challenges for Success
in Data Analytics
© 2014 TM Forum | 6
V2013.5
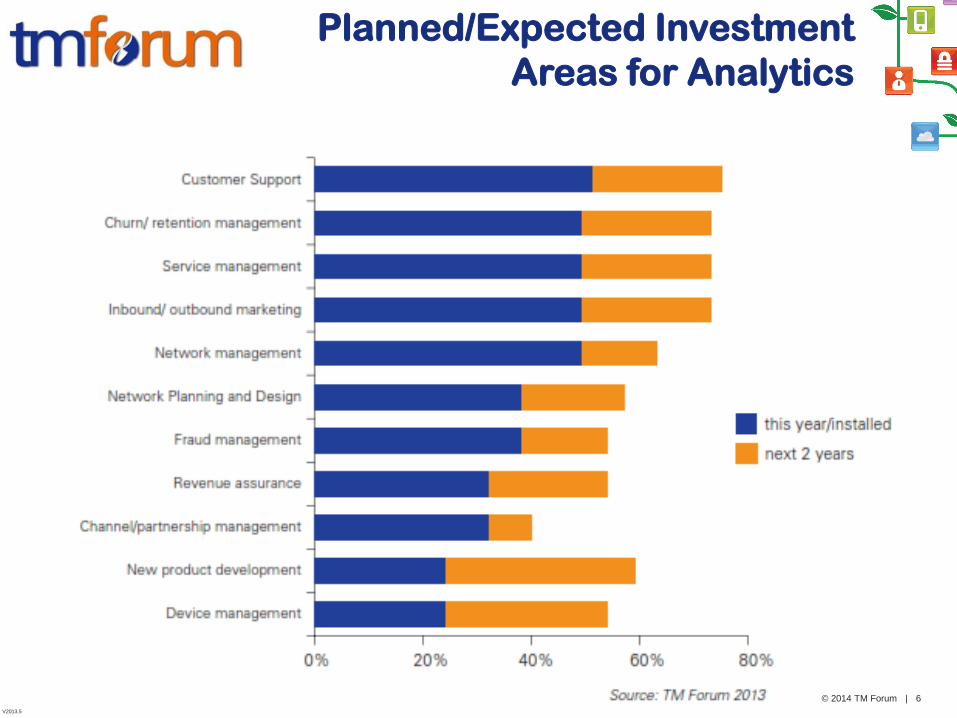
Planned/Expected Investment
Areas for Analytics
© 2014 TM Forum | 7
V2013.5
Data Analytics in TM Forum
Common Language
© 2014 TM Forum | 8
V2013.5
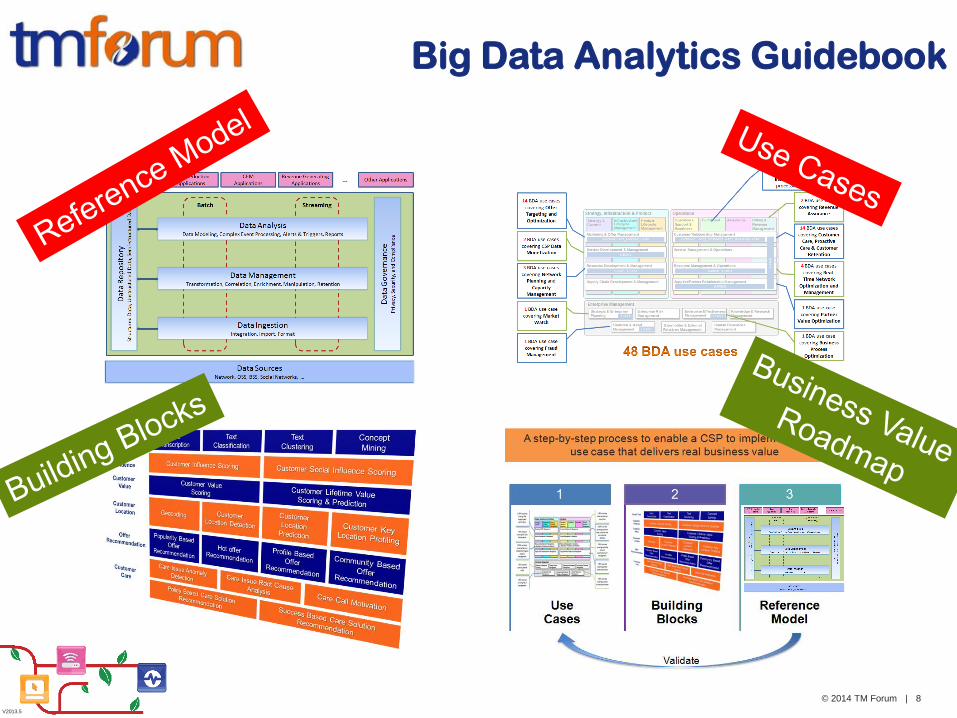
Big Data Analytics Guidebook
© 2014 TM Forum | 9
V2013.5
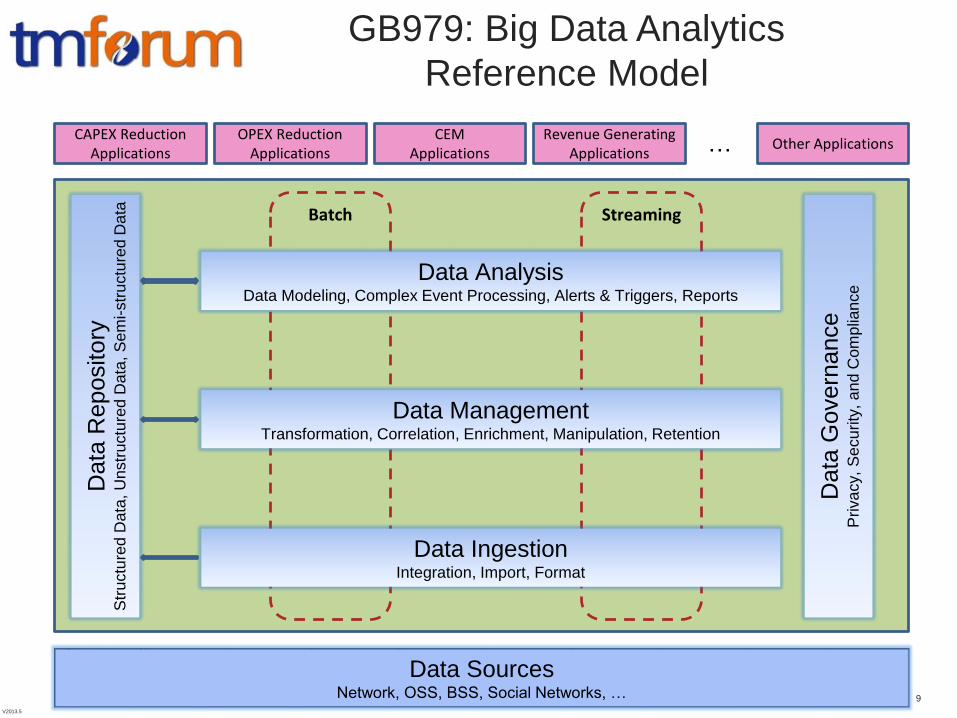
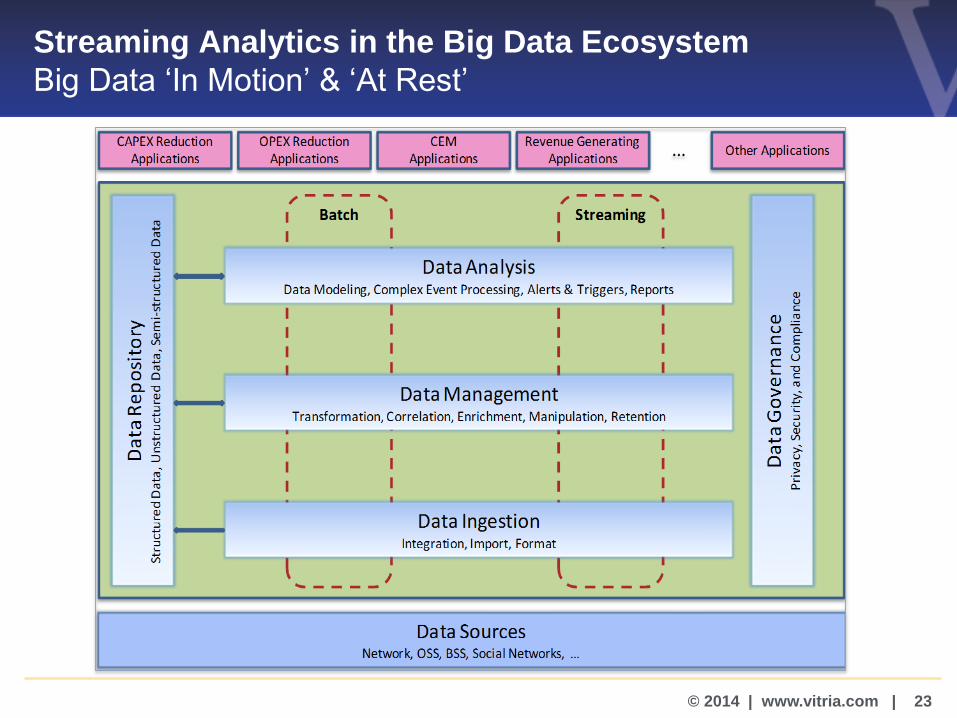
Data SourcesNetwork, OSS, BSS, Social Networks, …
Data
Repository
Str
uctu
red
Data
, U
nstr
uctu
red
Da
ta, S
em
i-str
uctu
red D
ata
CAPEX Reduction Applications
OPEX Reduction Applications
CEMApplications
Revenue Generating Applications
Other Applications …
Data
Govern
ance
Priva
cy,
Se
cu
rity
, a
nd
Com
plia
nce
Data AnalysisData Modeling, Metrics, Reports
Batch Streaming
Data IngestionIntegration, Import, Format
Data AnalysisData Modeling, Complex Event Processing, Alerts & Triggers, Reports
Data ManagementTransformation, Correlation, Enrichment, Manipulation, Retention
GB979: Big Data Analytics
Reference Model
© 2014 TM Forum | 10
V2013.5
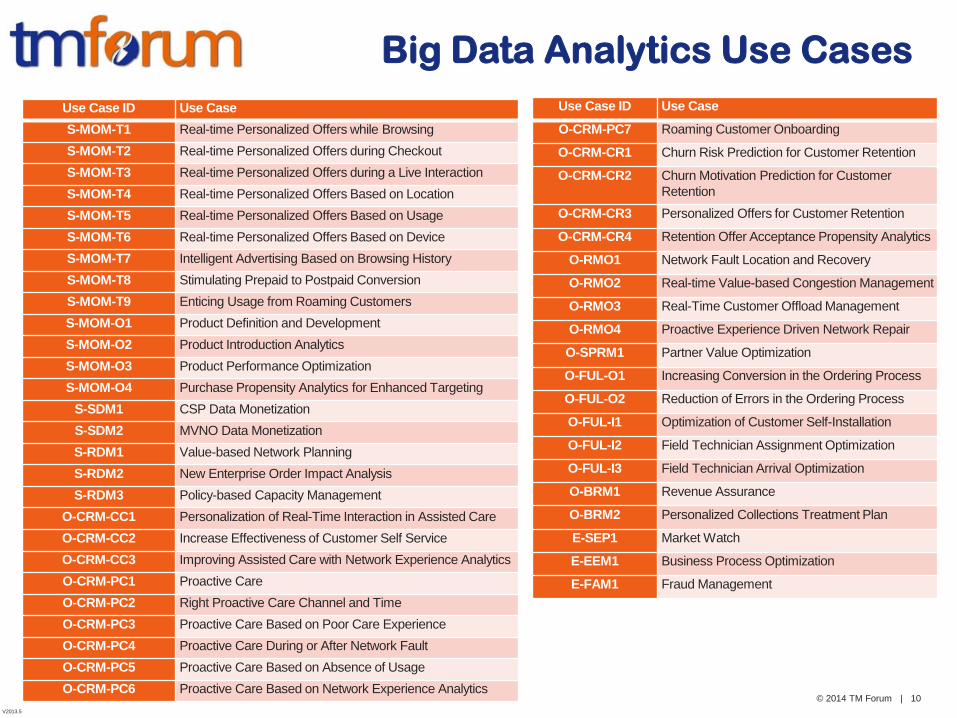
Big Data Analytics Use Cases
Use Case ID Use Case
S-MOM-T1 Real-time Personalized Offers while Browsing
S-MOM-T2 Real-time Personalized Offers during Checkout
S-MOM-T3 Real-time Personalized Offers during a Live Interaction
S-MOM-T4 Real-time Personalized Offers Based on Location
S-MOM-T5 Real-time Personalized Offers Based on Usage
S-MOM-T6 Real-time Personalized Offers Based on Device
S-MOM-T7 Intelligent Advertising Based on Browsing History
S-MOM-T8 Stimulating Prepaid to Postpaid Conversion
S-MOM-T9 Enticing Usage from Roaming Customers
S-MOM-O1 Product Definition and Development
S-MOM-O2 Product Introduction Analytics
S-MOM-O3 Product Performance Optimization
S-MOM-O4 Purchase Propensity Analytics for Enhanced Targeting
S-SDM1 CSP Data Monetization
S-SDM2 MVNO Data Monetization
S-RDM1 Value-based Network Planning
S-RDM2 New Enterprise Order Impact Analysis
S-RDM3 Policy-based Capacity Management
O-CRM-CC1 Personalization of Real-Time Interaction in Assisted Care
O-CRM-CC2 Increase Effectiveness of Customer Self Service
O-CRM-CC3 Improving Assisted Care with Network Experience Analytics
O-CRM-PC1 Proactive Care
O-CRM-PC2 Right Proactive Care Channel and Time
O-CRM-PC3 Proactive Care Based on Poor Care Experience
O-CRM-PC4 Proactive Care During or After Network Fault
O-CRM-PC5 Proactive Care Based on Absence of Usage
O-CRM-PC6 Proactive Care Based on Network Experience Analytics
Use Case ID Use Case
O-CRM-PC7 Roaming Customer Onboarding
O-CRM-CR1 Churn Risk Prediction for Customer Retention
O-CRM-CR2 Churn Motivation Prediction for Customer
Retention
O-CRM-CR3 Personalized Offers for Customer Retention
O-CRM-CR4 Retention Offer Acceptance Propensity Analytics
O-RMO1 Network Fault Location and Recovery
O-RMO2 Real-time Value-based Congestion Management
O-RMO3 Real-Time Customer Offload Management
O-RMO4 Proactive Experience Driven Network Repair
O-SPRM1 Partner Value Optimization
O-FUL-O1 Increasing Conversion in the Ordering Process
O-FUL-O2 Reduction of Errors in the Ordering Process
O-FUL-I1 Optimization of Customer Self-Installation
O-FUL-I2 Field Technician Assignment Optimization
O-FUL-I3 Field Technician Arrival Optimization
O-BRM1 Revenue Assurance
O-BRM2 Personalized Collections Treatment Plan
E-SEP1 Market Watch
E-EEM1 Business Process Optimization
E-FAM1 Fraud Management

© 2014 TM Forum | 11
V2013.5
500+ Pre-defined Metrics
www.tmforum.org
Standards Menu
Tools
Frameworx
Metrics
Repository
© 2014 TM Forum | 12
V2013.5
inform innovate accelerate optimize
Thank You!
© 2014. VITRIA TECHNOLOGY, INC. All rights reserved.
Streaming Analytics for Big Data:
What’s In It for CSPs?
Adrian PasciutaDirector, Industry Solutions
17th September 2014

© 2014 | www.vitria.com | 14
Topics
The TMF Big Data Reference Model
What is Streaming Analytics?
From Streaming Analytics to Operational Intelligence
Streaming Analytics in the Big Data Ecosystem
What Problems Does It Solve?
Customer Use Cases
Summary and Q&A

© 2014 | www.vitria.com | 15
GB979: TMF Big Data Analytics Reference
Model
Data SourcesNetwork, OSS, BSS, Social Networks, …
Da
ta R
ep
osi
tory
Stru
ctu
red
Da
ta,
Un
stru
ctu
red
Da
ta, S
em
i-st
ruct
ure
d D
ata
CAPEX Reduction Applications
OPEX Reduction Applications
CEMApplications
Revenue Generating Applications
Other Applications …
Da
ta G
ove
rna
nce
Pri
vacy
, Se
curi
ty, a
nd
Co
mp
lia
nce
Data AnalysisData Modeling, Metrics, Reports
Batch Streaming
Data IngestionIntegration, Import, Format
Data AnalysisData Modeling, Complex Event Processing, Alerts & Triggers, Reports
Data ManagementTransformation, Correlation, Enrichment, Manipulation, Retention
© 2014 | www.vitria.com | 16
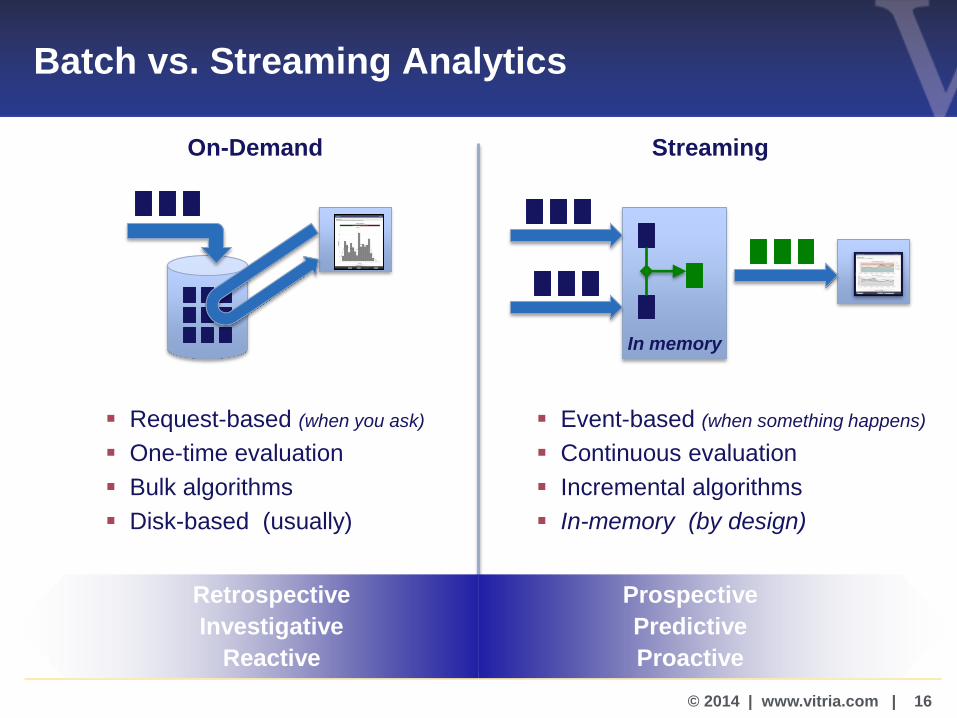
Request-based (when you ask)
One-time evaluation
Bulk algorithms
Disk-based (usually)
Batch vs. Streaming Analytics
Event-based (when something happens)
Continuous evaluation
Incremental algorithms
In-memory (by design)
On-Demand Streaming
In memory
Prospective
Predictive
Proactive
Investigative
Retrospective
Reactive
Retrospective
Investigative
Reactive
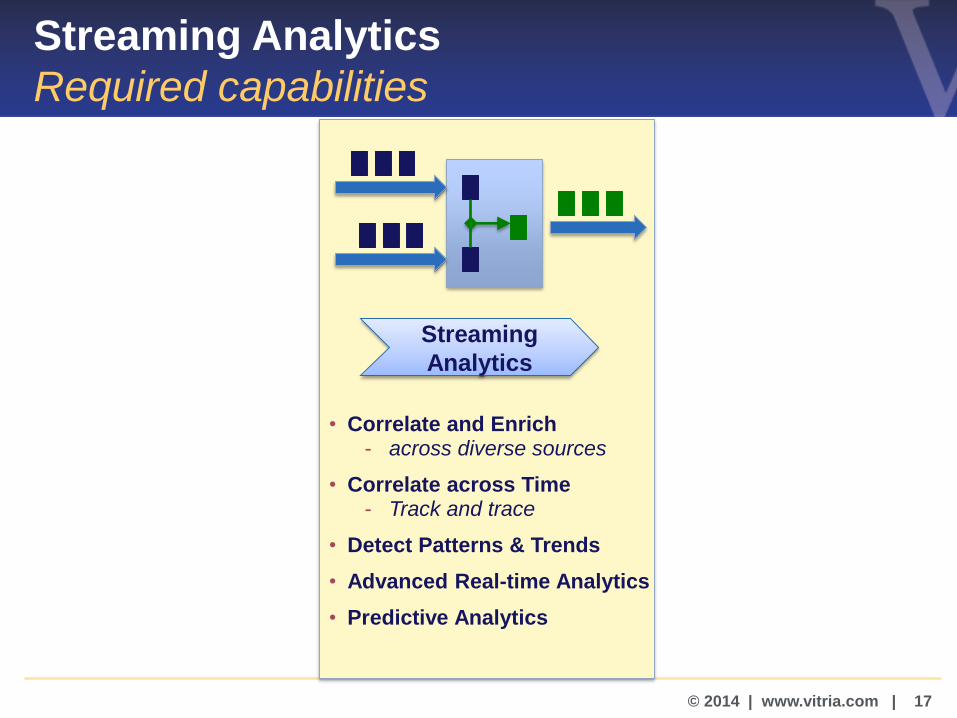
© 2014 | www.vitria.com | 17
Streaming
Analytics
Streaming Analytics
Required capabilities
• Correlate and Enrich- across diverse sources
• Correlate across Time- Track and trace
• Detect Patterns & Trends
• Advanced Real-time Analytics
• Predictive Analytics
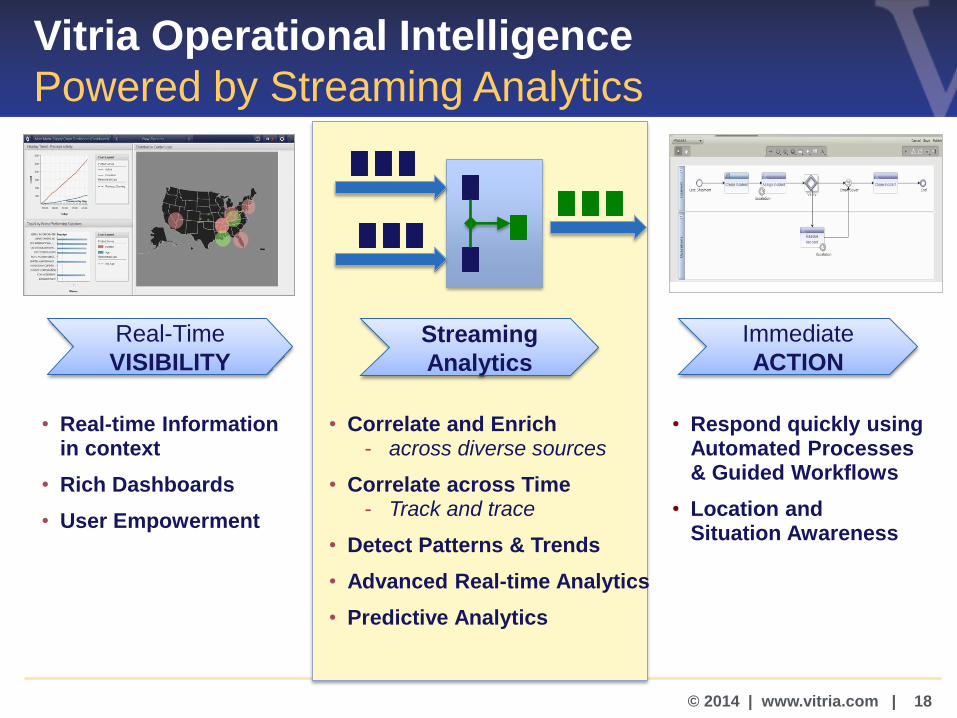
© 2014 | www.vitria.com | 18
Real-Time
VISIBILITY
Immediate
ACTION
Vitria Operational Intelligence
Powered by Streaming Analytics
• Respond quickly using Automated Processes& Guided Workflows
• Location and Situation Awareness
• Real-time Information in context
• Rich Dashboards
• User Empowerment
Streaming
Analytics
• Correlate and Enrich- across diverse sources
• Correlate across Time- Track and trace
• Detect Patterns & Trends
• Advanced Real-time Analytics
• Predictive Analytics
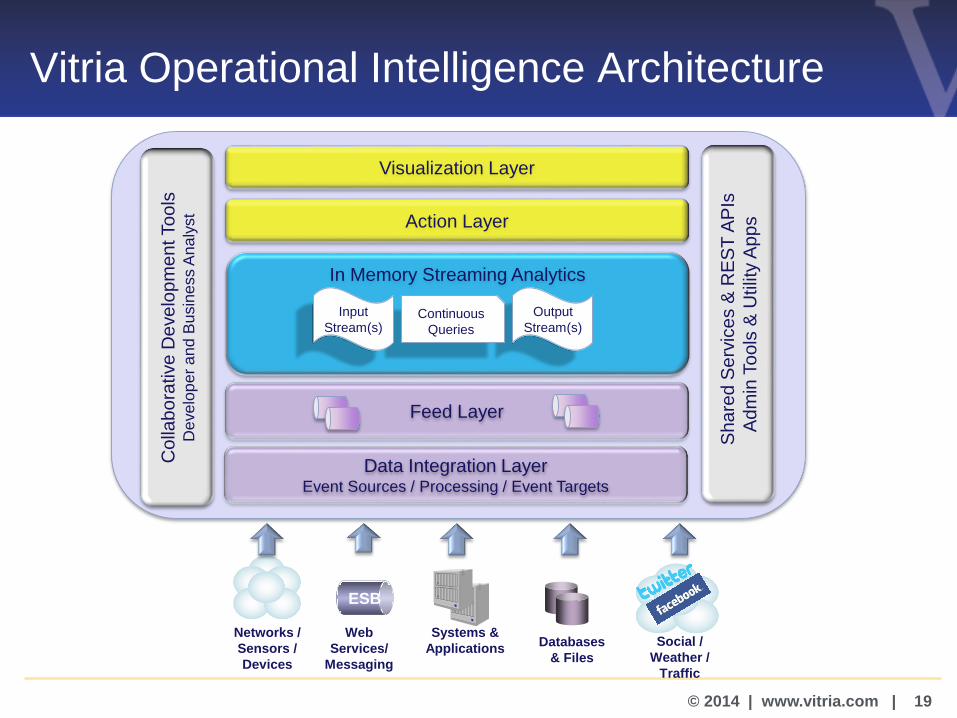
© 2014 | www.vitria.com | 19
Vitria Operational Intelligence Architecture
Databases
& Files
Networks /
Sensors /
Devices
Social /
Weather /
Traffic
Systems &
Applications
In Memory Streaming Analytics
Share
d S
erv
ice
s &
RE
ST
AP
Is
Ad
min
To
ols
& U
tilit
y A
pp
s
Feed Layer
Visualization Layer
Action Layer
Output
Stream(s)Continuous
Queries
Input
Stream(s)
Data Integration LayerEvent Sources / Processing / Event Targets
ESB
Web
Services/
Messaging
Co
llab
ora
tive
De
ve
lop
me
nt To
ols
De
ve
lop
er
an
d B
usin
ess A
na
lyst
© 2014 | www.vitria.com | 20
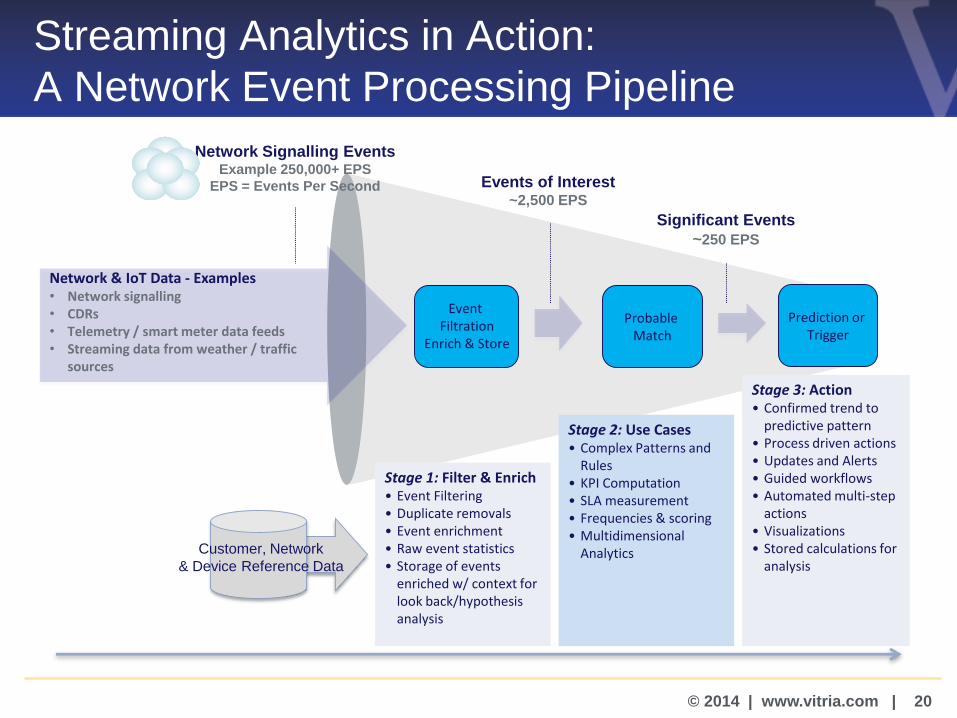
Streaming Analytics in Action:
A Network Event Processing Pipeline
Network Signalling EventsExample 250,000+ EPS
EPS = Events Per Second Events of Interest~2,500 EPS
Significant Events
~250 EPS
Stage 1: Filter & Enrich• Event Filtering• Duplicate removals • Event enrichment• Raw event statistics• Storage of events
enriched w/ context for look back/hypothesis analysis
Event Filtration
Enrich & Store
Stage 2: Use Cases• Complex Patterns and
Rules • KPI Computation• SLA measurement• Frequencies & scoring• Multidimensional
Analytics
Probable Match
Stage 3: Action• Confirmed trend to
predictive pattern• Process driven actions• Updates and Alerts• Guided workflows• Automated multi-step
actions• Visualizations• Stored calculations for
analysis
Prediction or Trigger
Network & IoT Data - Examples• Network signalling• CDRs• Telemetry / smart meter data feeds• Streaming data from weather / traffic
sources
Customer, Network
& Device Reference Data

© 2014 | www.vitria.com | 21
Elastic Scalability
Scale out on commodity
hardware an elastic grid of
compute servers
Each use case defined as a
multi-step “Event
Processing Network” (EPN)
Each EPN contains multiple
“Projects” pipelined together
A Project uses Map-Reduce
to scale
Contextual (business) data
is preloaded into memory
Intelligent BPM enables
immediate action
AnalyticServer
AnalyticServer
AnalyticServer
iBPM
iBPM
AnalyticServer
AnalyticServer
AnalyticServer
AnalyticServer
AnalyticServer
AnalyticServer
Detect anomalous events
Correlate Customer data
Multidimensional analysis
Automated Actions,
Alerts, Workflows &
visualizations
Asset & Customer
Context
iBPM
Network events
© 2014 | www.vitria.com | 22
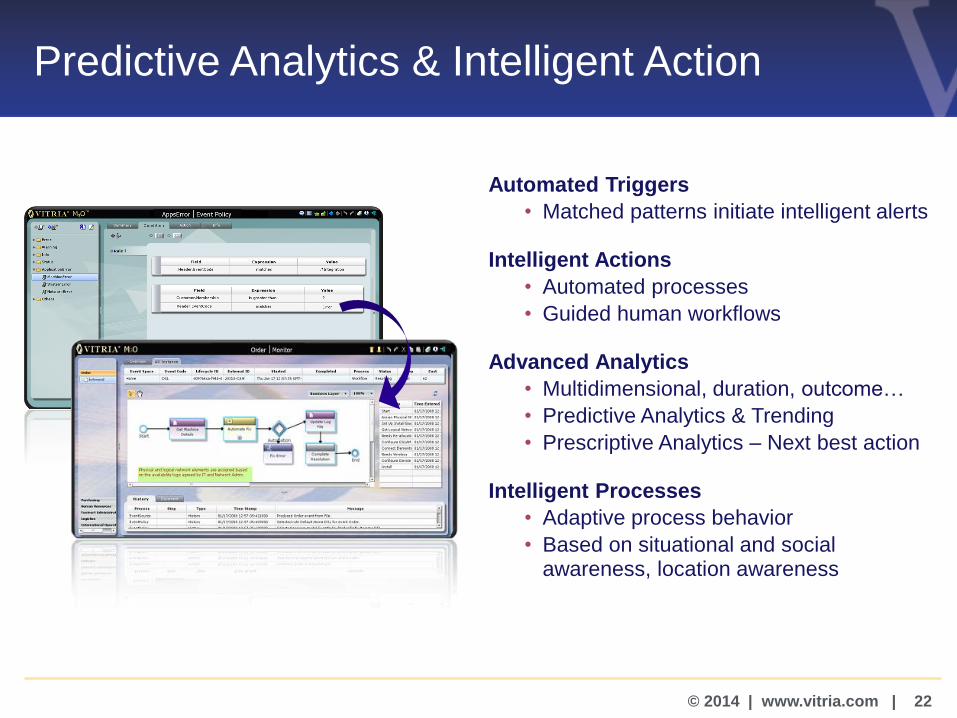
Automated Triggers
• Matched patterns initiate intelligent alerts
Intelligent Actions
• Automated processes
• Guided human workflows
Advanced Analytics
• Multidimensional, duration, outcome…
• Predictive Analytics & Trending
• Prescriptive Analytics – Next best action
Intelligent Processes
• Adaptive process behavior
• Based on situational and social awareness, location awareness
Predictive Analytics & Intelligent Action
© 2014 | www.vitria.com | 23
Streaming Analytics in the Big Data Ecosystem
Big Data ‘In Motion’ & ‘At Rest’
© 2014 | www.vitria.com | 24
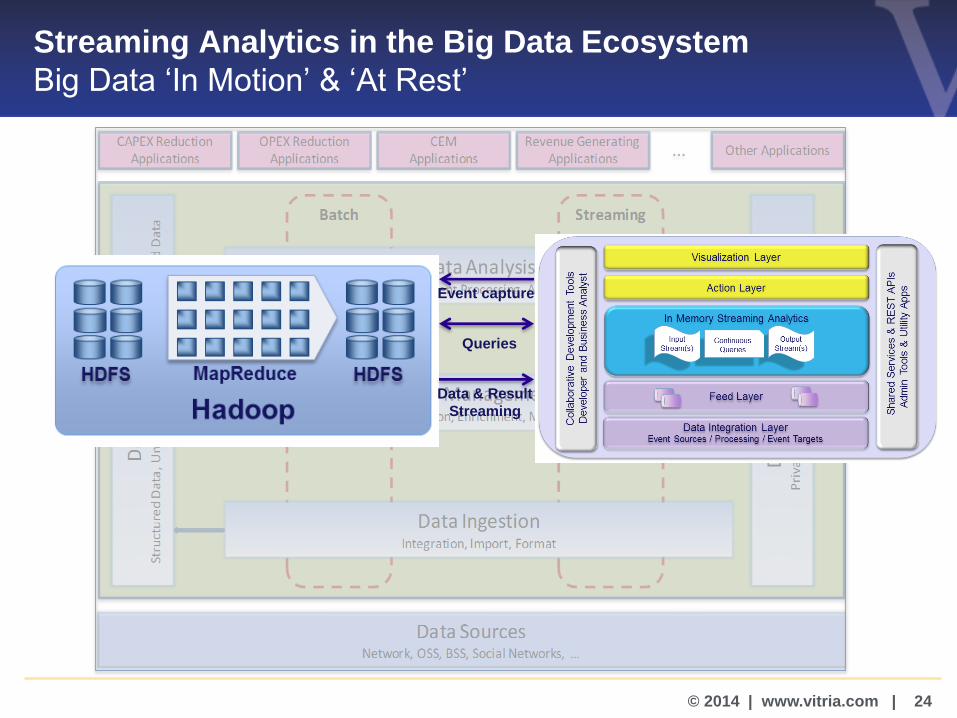
Streaming Analytics in the Big Data Ecosystem
Big Data ‘In Motion’ & ‘At Rest’
Event capture
Queries
Data & Result
Streaming
© 2014 | www.vitria.com | 25
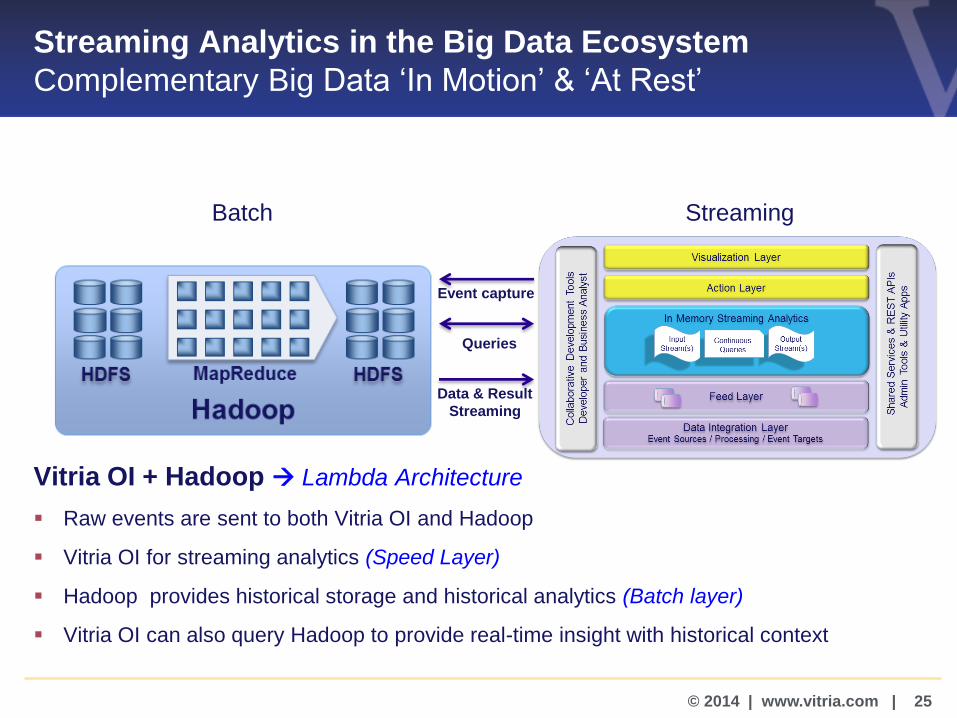
Streaming Analytics in the Big Data Ecosystem
Complementary Big Data ‘In Motion’ & ‘At Rest’
Vitria OI + Hadoop Lambda Architecture
Raw events are sent to both Vitria OI and Hadoop
Vitria OI for streaming analytics (Speed Layer)
Hadoop provides historical storage and historical analytics (Batch layer)
Vitria OI can also query Hadoop to provide real-time insight with historical context
Event capture
Queries
Data & Result
Streaming
Batch Streaming
© 2014 | www.vitria.com | 26
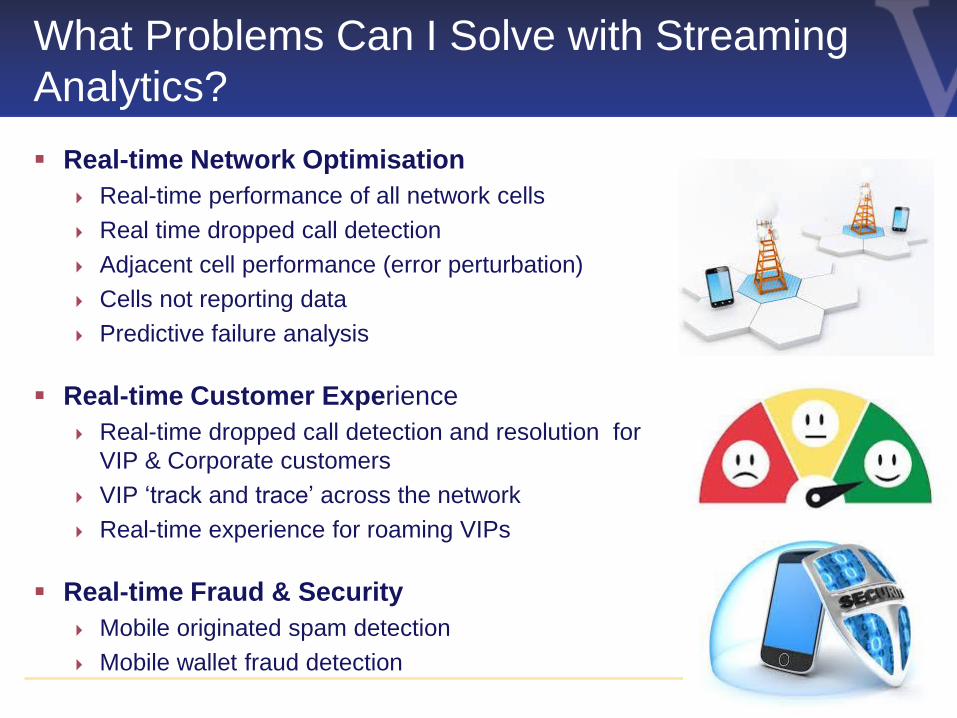
What Problems Can I Solve with Streaming
Analytics?
Real-time Network Optimisation
Real-time performance of all network cells
Real time dropped call detection
Adjacent cell performance (error perturbation)
Cells not reporting data
Predictive failure analysis
Real-time Customer Experience
Real-time dropped call detection and resolution for
VIP & Corporate customers
VIP ‘track and trace’ across the network
Real-time experience for roaming VIPs
Real-time Fraud & Security
Mobile originated spam detection
Mobile wallet fraud detection
© 2014 | www.vitria.com | 27
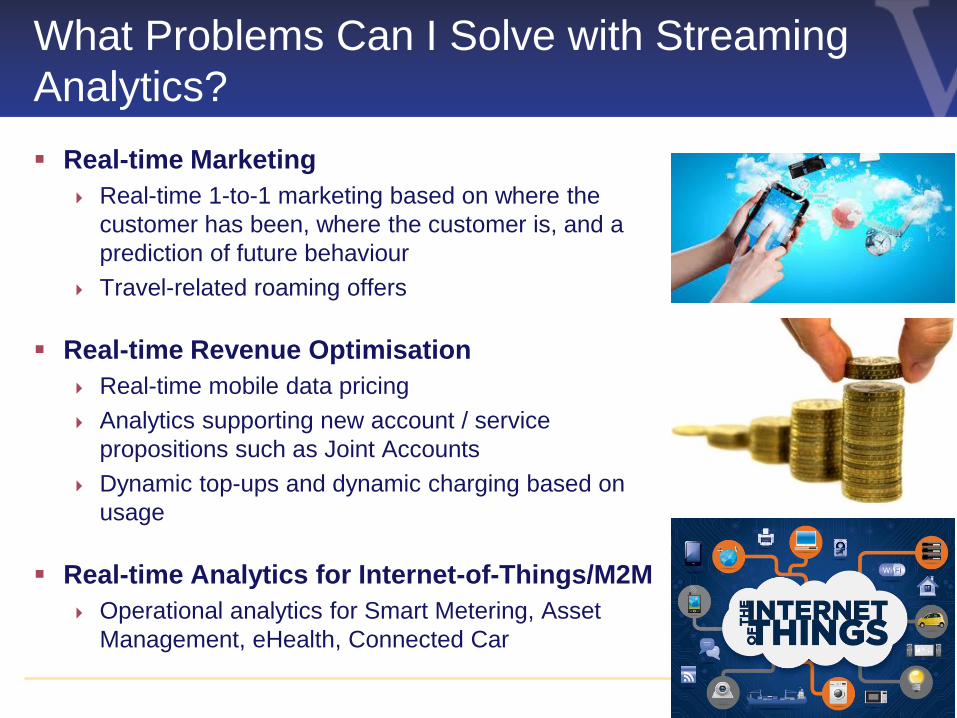
What Problems Can I Solve with Streaming
Analytics?
Real-time Marketing
Real-time 1-to-1 marketing based on where the
customer has been, where the customer is, and a
prediction of future behaviour
Travel-related roaming offers
Real-time Revenue Optimisation
Real-time mobile data pricing
Analytics supporting new account / service
propositions such as Joint Accounts
Dynamic top-ups and dynamic charging based on
usage
Real-time Analytics for Internet-of-Things/M2M
Operational analytics for Smart Metering, Asset
Management, eHealth, Connected Car
© 2014 | www.vitria.com | 28
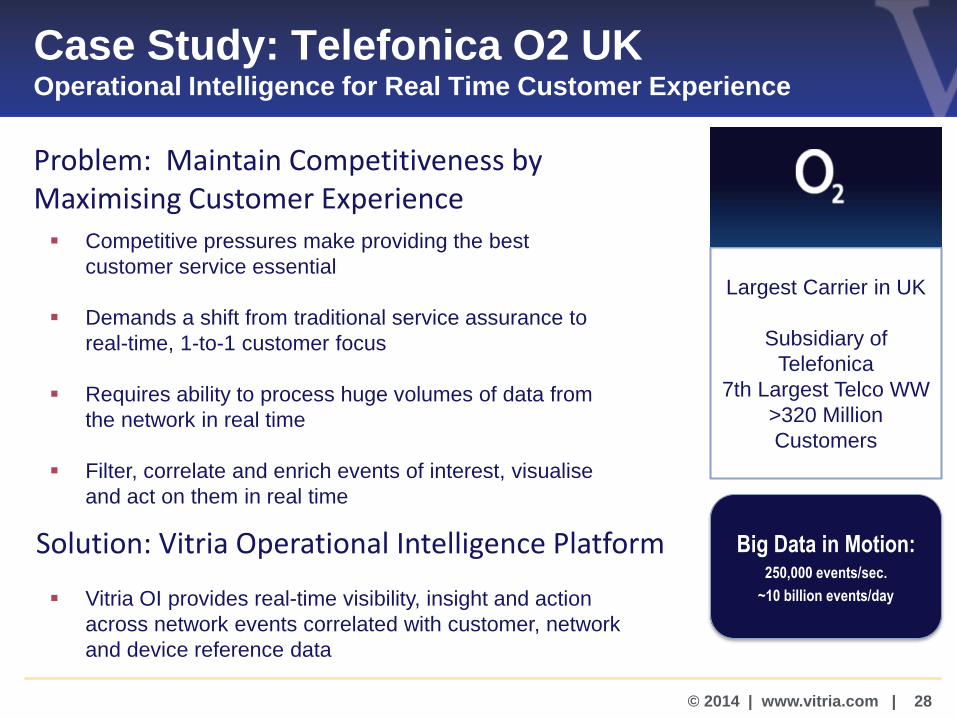
Case Study: Telefonica O2 UKOperational Intelligence for Real Time Customer Experience
Competitive pressures make providing the best
customer service essential
Demands a shift from traditional service assurance to
real-time, 1-to-1 customer focus
Requires ability to process huge volumes of data from
the network in real time
Filter, correlate and enrich events of interest, visualise
and act on them in real time
Vitria OI provides real-time visibility, insight and action
across network events correlated with customer, network
and device reference data
Problem: Maintain Competitiveness by Maximising Customer Experience
Solution: Vitria Operational Intelligence Platform Big Data in Motion:250,000 events/sec.
~10 billion events/day
Largest Carrier in UK
Subsidiary of
Telefonica
7th Largest Telco WW
>320 Million
Customers
© 2014 | www.vitria.com | 29
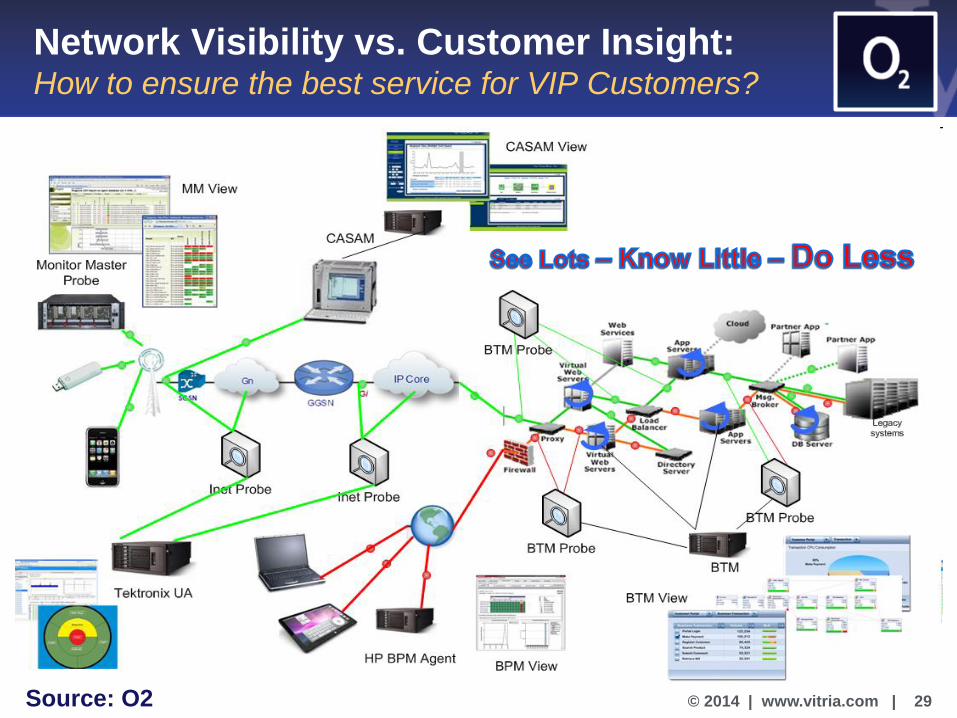
Network Visibility vs. Customer Insight: How to ensure the best service for VIP Customers?
Source: O2
© 2014 | www.vitria.com | 30
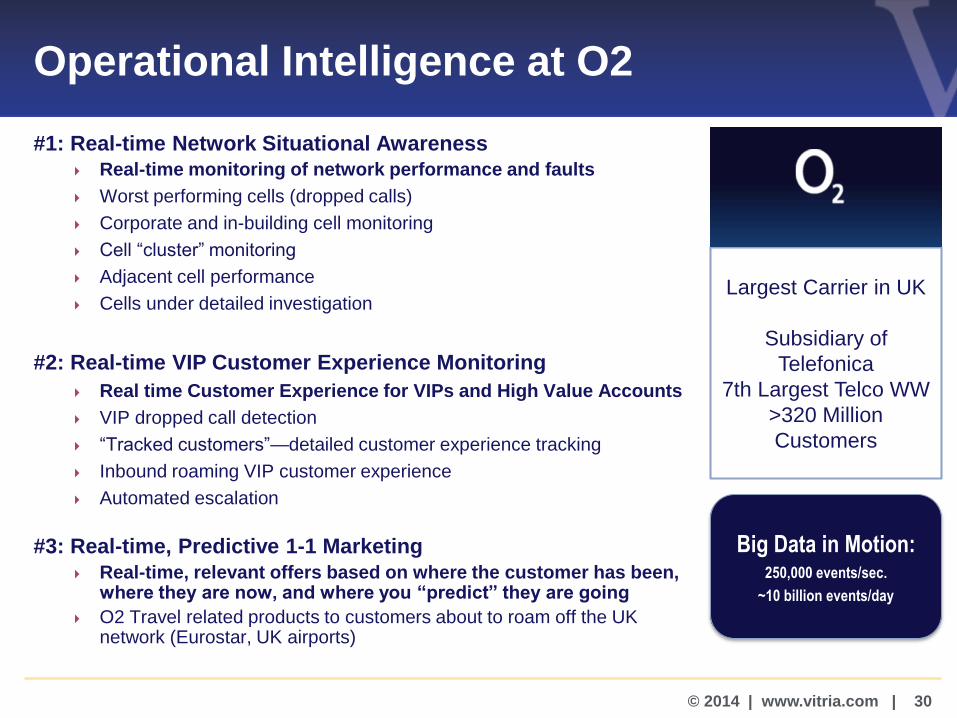
Operational Intelligence at O2
#1: Real-time Network Situational Awareness
Real-time monitoring of network performance and faults
Worst performing cells (dropped calls)
Corporate and in-building cell monitoring
Cell “cluster” monitoring
Adjacent cell performance
Cells under detailed investigation
#2: Real-time VIP Customer Experience Monitoring
Real time Customer Experience for VIPs and High Value Accounts
VIP dropped call detection
“Tracked customers”—detailed customer experience tracking
Inbound roaming VIP customer experience
Automated escalation
#3: Real-time, Predictive 1-1 Marketing
Real-time, relevant offers based on where the customer has been, where they are now, and where you “predict” they are going
O2 Travel related products to customers about to roam off the UK network (Eurostar, UK airports)
Big Data in Motion:250,000 events/sec.
~10 billion events/day
Largest Carrier in UK
Subsidiary of
Telefonica
7th Largest Telco WW
>320 Million
Customers
© 2014 | www.vitria.com | 31
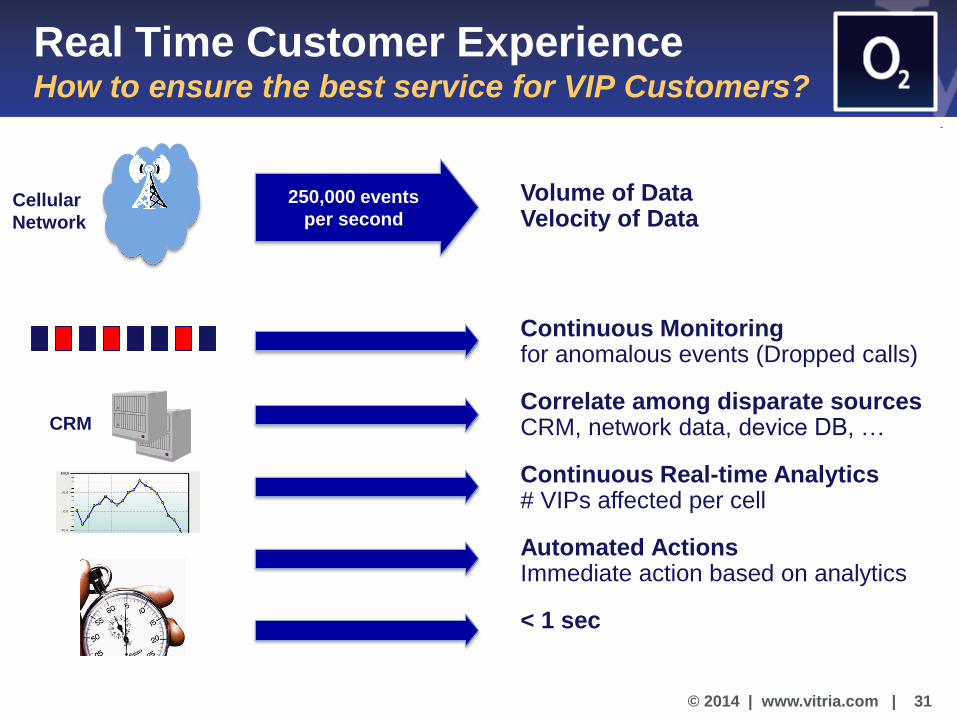
Real Time Customer ExperienceHow to ensure the best service for VIP Customers?
Volume of DataVelocity of Data
250,000 events
per secondCellular
Network
CRM
Continuous Monitoring for anomalous events (Dropped calls)
Correlate among disparate sourcesCRM, network data, device DB, …
Continuous Real-time Analytics# VIPs affected per cell
Automated Actions Immediate action based on analytics
< 1 sec

© 2014 | www.vitria.com | 32
Geo-map of call
failures by VIP group
Categorisation and
cause code of call
failure(s)
Call performance for
VIP group
List of call failures for
VIP group
VIP / HVA Call Failure Monitoring
© 2014 | www.vitria.com | 33
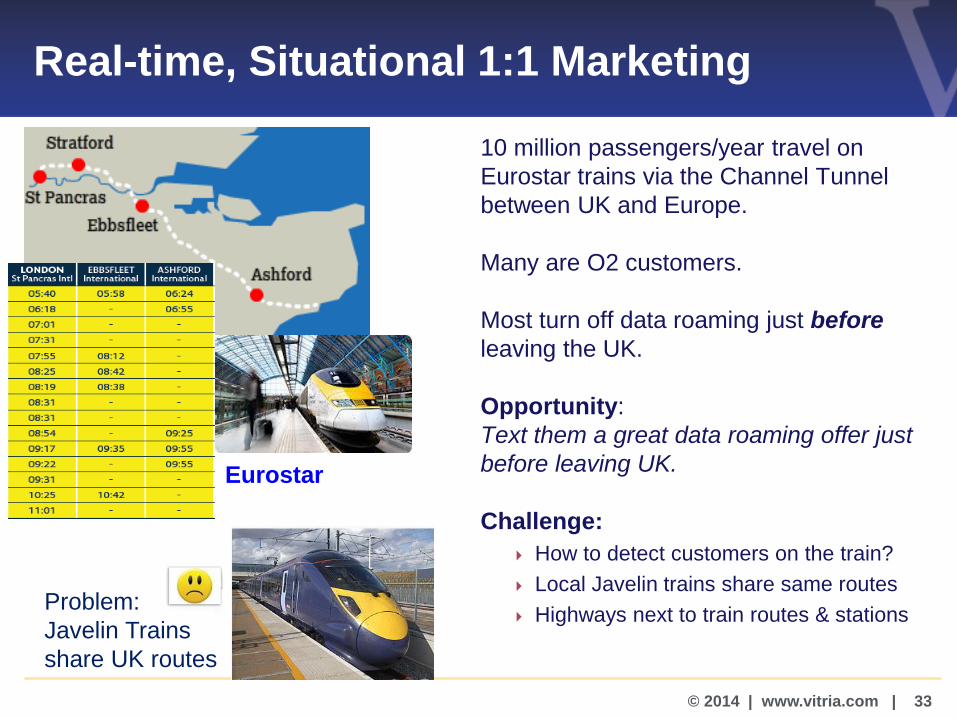
Real-time, Situational 1:1 Marketing
10 million passengers/year travel on
Eurostar trains via the Channel Tunnel
between UK and Europe.
Many are O2 customers.
Most turn off data roaming just before
leaving the UK.
Opportunity:
Text them a great data roaming offer just
before leaving UK.
Challenge:
How to detect customers on the train?
Local Javelin trains share same routes
Highways next to train routes & stationsProblem:
Javelin Trains
share UK routes
Eurostar
© 2014 | www.vitria.com | 34
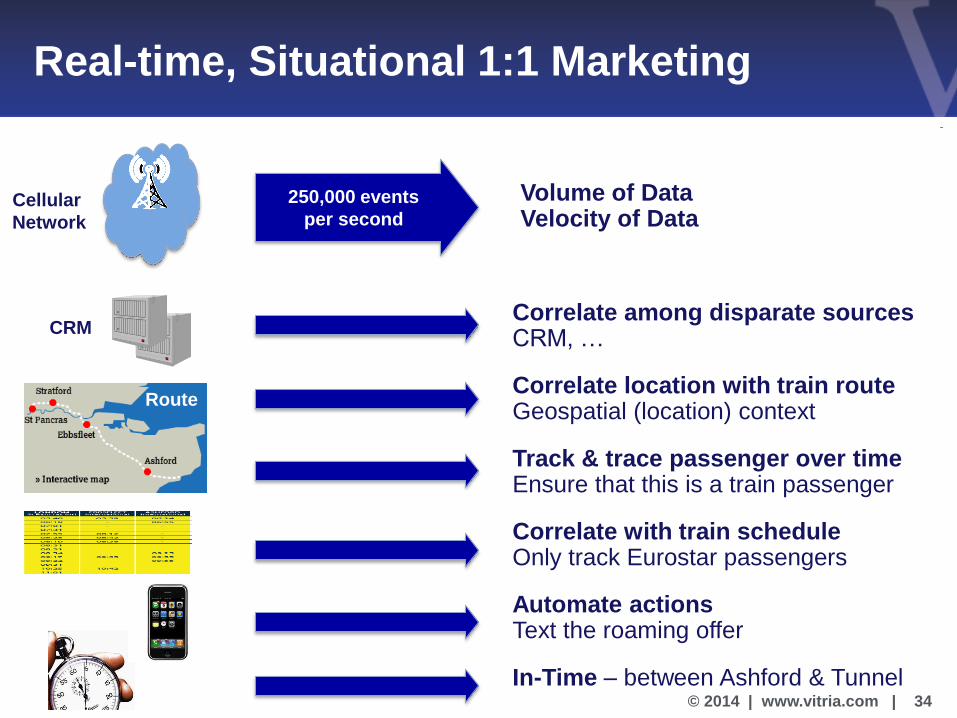
Real-time, Situational 1:1 Marketing
Volume of DataVelocity of Data
250,000 events
per secondCellular
Network
CRMCorrelate among disparate sourcesCRM, …
Correlate location with train routeGeospatial (location) context
Track & trace passenger over timeEnsure that this is a train passenger
Correlate with train scheduleOnly track Eurostar passengers
Automate actions Text the roaming offer
In-Time – between Ashford & Tunnel
Route
© 2014 | www.vitria.com | 35
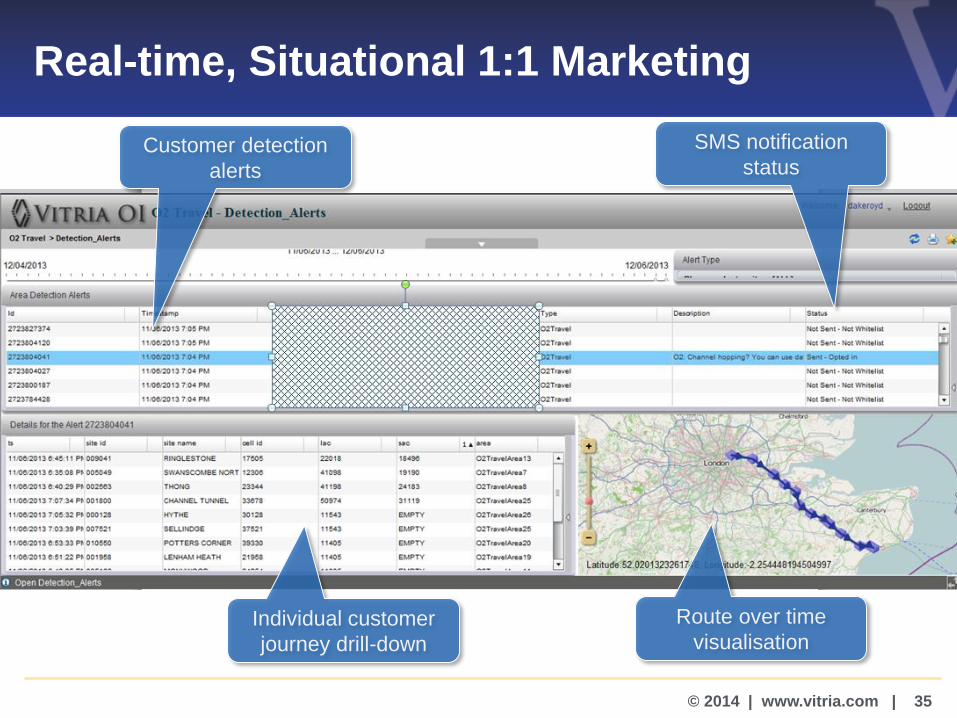
Real-time, Situational 1:1 Marketing
Individual customer
journey drill-down
Route over time
visualisation
Customer detection
alerts
SMS notification
status
© 2014 | www.vitria.com | 36
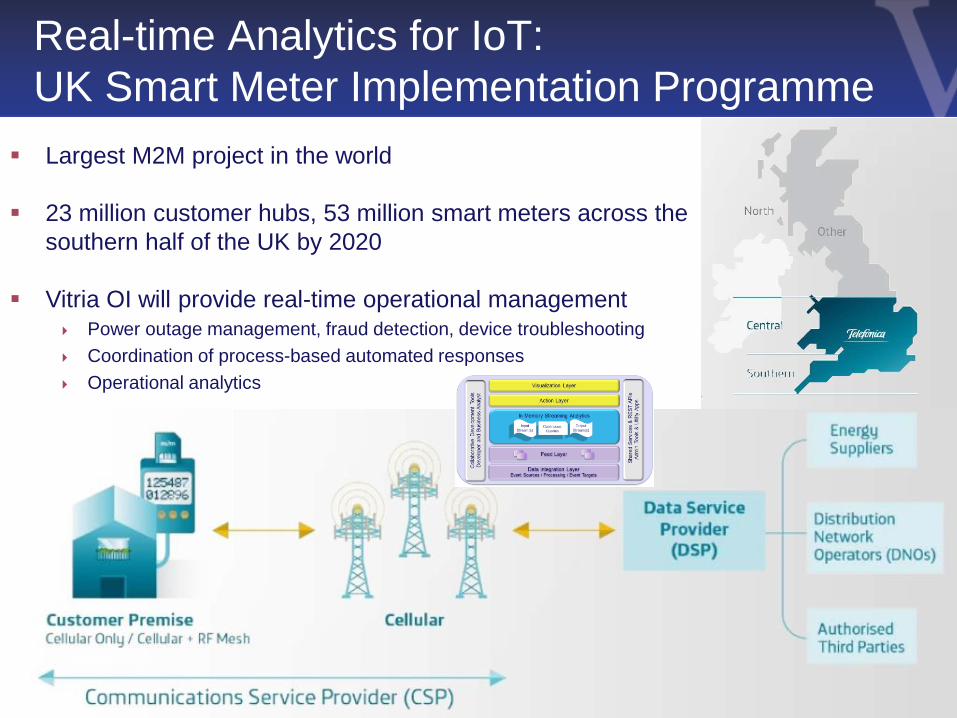
Real-time Analytics for IoT:
UK Smart Meter Implementation Programme
Largest M2M project in the world
23 million customer hubs, 53 million smart meters across the
southern half of the UK by 2020
Vitria OI will provide real-time operational management Power outage management, fraud detection, device troubleshooting
Coordination of process-based automated responses
Operational analytics
© 2014 | www.vitria.com | 37
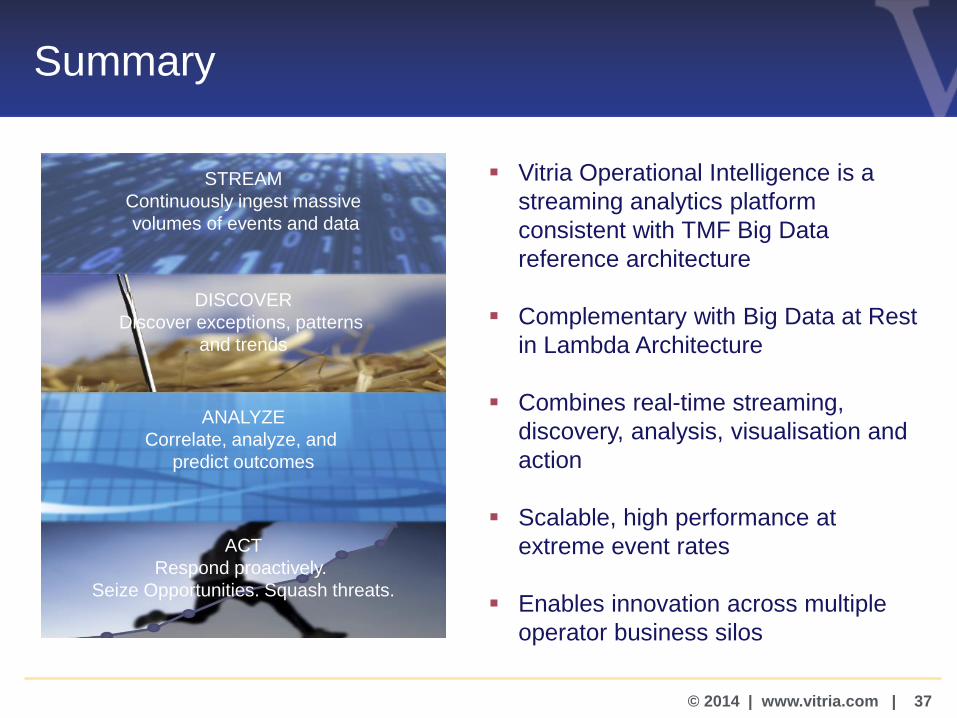
Summary
Vitria Operational Intelligence is a
streaming analytics platform
consistent with TMF Big Data
reference architecture
Complementary with Big Data at Rest
in Lambda Architecture
Combines real-time streaming,
discovery, analysis, visualisation and
action
Scalable, high performance at
extreme event rates
Enables innovation across multiple
operator business silos
STREAM
Continuously ingest massive
volumes of events and data
DISCOVER
Discover exceptions, patterns
and trends
ANALYZE
Correlate, analyze, and
predict outcomes
ACT
Respond proactively.
Seize Opportunities. Squash threats.
© 2014 | www.vitria.com | 38
Operational IntelligencePowered by Streaming Analytics
Try our Interactive Streaming Big Data Demosvitria.com/big-data-demo
www.vitria.com
© 2013 TM Forum | 39
V2013.4
inform innovate accelerate optimize
Q & A
Webinar sponsored by:
#streamingbigdataanalytics