information and communications technology · lebanon, panama, tanzania, and uganda. ... aiming for...
TRANSCRIPT
2017 Funded by the Michigan Economic Development Corporation Conducted by the International Business Center
in the Eli Broad College of Business at Michigan State University
Information and Communications
Technology Market Potential
Index

P a g e | 1
International Business Center
Michigan State University
Preface The Market Potential Index (MPI) for specific industries intends to compare countries identified
as having the highest Gross Domestic Product (GDP) globally based on several dimensions.
In 2016, the number of countries used for these rankings was 89, but has increased to 97 for 2017. Countries removed from the MPI rankings include Iraq, Luxembourg, Malta, Myanmar, and Papua New Guinea, while those added are Angola, Bolivia, Cameroon, the Democratic Republic of the Congo, Côte d’Ivoire, Ethiopia, Ghana, Jordan, Kenya, Lebanon, Panama, Tanzania, and Uganda.
The Index compares these 97 countries on six market dimensions: size, growth rate, capacity, openness, current logistics infrastructure, and country risk. In order to measure each of these dimensions, a different set of indicators has been identified for each industry. Secondary data that has been gathered from reputable sources is used for these indicators, as noted. The rankings of the countries are calculated by adding up the dimensions and weighing them based on relative importance.
While the MPI is a very useful tool for companies in the process of researching new markets for export, it should not be used as the single source of information in the decision. MPIs are designed to support further market research and is intended to be used for verification purposes. The information in this report can be utilized as a foundation to help identify potential countries for which more detailed research should be conducted.
The Market Potential Index is calculated with the most recent data that is available, so it is important to note that the results represent the current state of the identified 97 countries, not a forecast.
Industry specific MPIs are updated annually, and can be accessed at: https://globaledge.msu.edu/mpi
International Business Center Michigan State University
Eli Broad College of Business East Lansing, MI [email protected]
+1 (517) 353.4336
P a g e | 2
International Business Center
Michigan State University
Market Overview
Asia
Japan
Japan is one of the largest and most lucrative markets for the Information and Communications Technology (ICT) industry in Asia. They increased one ranking from 2016-2017 to reach #3 out of the 97 countries. In 2013, the Japanese government released a statement that was a ‘Declaration to be the World’s Most Advanced Information Technology Nation”, and the country desires to accomplish this goal by 2020, when the Olympic and Paralympic Games will be held in Tokyo. Through this ‘Declaration’, Japan appointed a Chief Information Officer (CIO), who controls the government’s ICT strategy and coordinates the activities of each department at a high level. This will allow Japan to reduce inefficiencies in the government’s ICT investment.1
Other important parts of the ICT Declaration include updating data regulations under the Personal Information Protection Act, regional start-up funds to promote entrepreneurship, aiming for the operation of fully autonomous driving systems by 2020, and strengthening human resources. Additionally, the Japanese government wishes to improve cybersecurity infrastructure, considering the Asia Pacific region is 80% more likely to be targeted by hackers than other regions.2
China
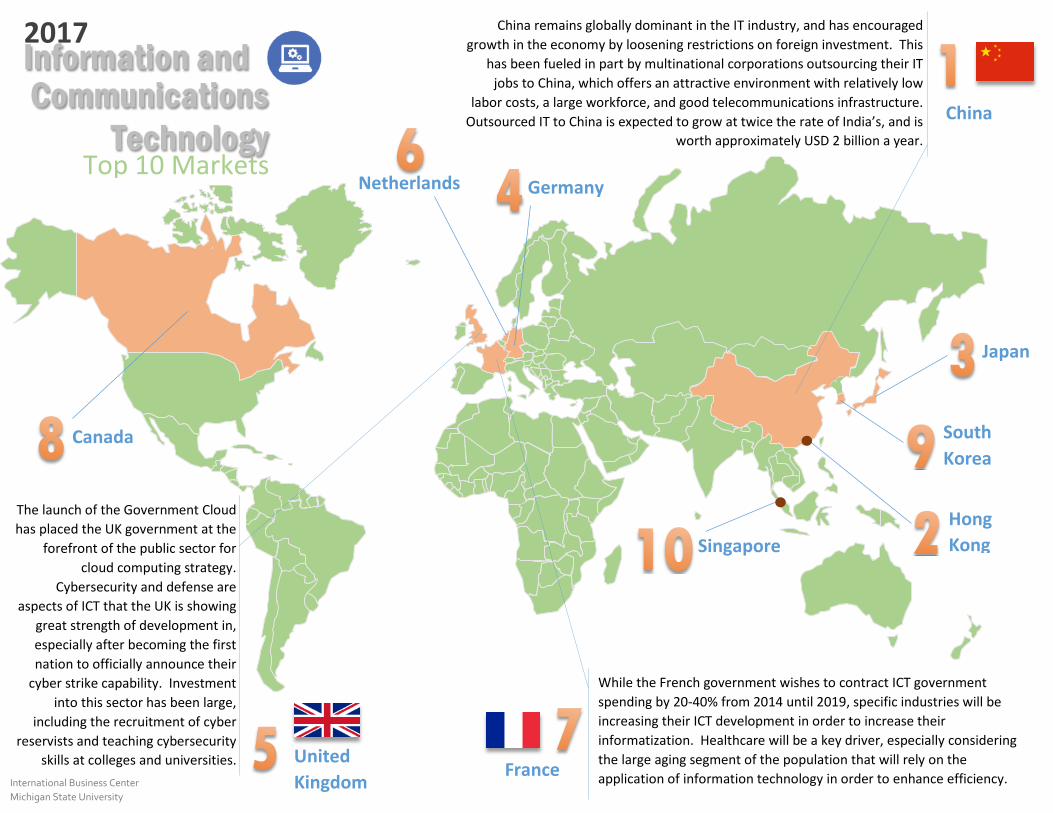
China remains globally dominant in the Information Communications Technology industry, ranked at #1 out of 97 countries. In order to boost innovation to help encourage growth in the economy, China loosened restrictions on foreign investment in the ICT sector. Following this, Apple opened its first directly-invested research and development facility in Beijing, with an initial investment of USD 14.8 million. This location will be utilized for the development of advanced technologies in software, hardware, communication and information technology.3
Growth is fueled in the ICT sector by many multinational corporations outsourcing their IT jobs in China in order to take advantage of relatively low labor costs, the large workforce, and good telecommunications infrastructure. Outsourced IT in China has been estimated to be growing at twice the rate of India’s, and is worth around USD 2 billion a
1The International Telecommunication Union Association of Japan: https://www.ituaj.jp/wp-content/uploads/2016/04/nb28-2_web-06-PolicyITnation.pdf 2BMI Research-Japan Information Technology Report: https://bmo-bmiresearch-com.proxy2.cl.msu.edu/reports/view?productid=900&issue=20171001&archive=1&service=13&active_pillar=Reports%20Subtab 3Mergent Archives-Asia Pacific IT & Technology Sectors: file:///C:/Users/gagnerau/Downloads/AP_10020_112016.pdf
P a g e | 3
International Business Center
Michigan State University
year. This work is largely being conducted for other countries in Asia, like Japan, but China is hoping to extend this further.
According to the Chinese government, roughly 53% of the demand for outsourcing is for information, computer services, and software, and is heavily concentrated in only five provinces: Guangdong, Beijing, Fujian, Jiangsu, and Shanghai. Collectively, these five provinces account for nearly two-thirds of services provided, with only 14 outsourcing service bases being responsible for around 80.1% of these services.4
China is also expected to be a regional leader in the further development of the Internet of Things (IoT), which will advance ‘smart services’ in the country. The International Data Corporation estimates that the number of devices for the Asia Pacific region’s IoT sector will increase from about 3.1 billion in 2015 to 8.6 billion by 2020, with the market size increasing from USD 250 billion to USD 580 billion and fueled largely by Chinese consumers.5
North America
Canada
Canada remained ranked at #8 from 2016 to 2017 for the Information Communications Technology industry MPI. Spending on the Internet of Things (IoT) is expected to be one of the largest drivers of growth for the ICT industry in Canada, with a 375% increase to USD 19.56 billion in 2018; up from USD 5.22 billion in 2013. Another area of growth and opportunity will be with the e-health sector, especially considering that nearly USD 393 million has been allocated to invest in health informatization. Informatization refers to the increased role of knowledge processes, systems, and networks in society that are increasingly being integrated with information and communication technology; with growth in the speed and quantity of information production and distribution.6
Canada’s status as a developed country with higher disposable incomes has positive effects on the ICT industry. As one of the most advanced markets for personal computers (PC), their household penetration rates are much higher than those of Latin and South America, and even the United States. Since a large segment of the population has moved from lower income groups to making excess of USD 50,000 per year, consumers are increasingly paying for premium products. This shift from marketing to first-time
4BMI Research-China Information Technology Report: https://bmo-bmiresearch-com.proxy2.cl.msu.edu/reports/view?issue=20170701&productid=744&name=China%20Information%20Technology%20Report&widget=Related%20Reports&url=https://bmo-bmiresearch-com.proxy2.cl.msu.edu/article/view&page=&clickId=11317 5 BMI Research-China Information Technology Report: https://bmo-bmiresearch-com.proxy1.cl.msu.edu/reports/view?productid=744&issue=20170701&archive=1&service=13&active_pillar=Reports%20Subtab 6IGI Global-Informitization: https://www.igi-global.com/dictionary/informatization/35426
P a g e | 4
International Business Center
Michigan State University
buyers that desired cheaper products to demand fueled by the replacement of those cheap devices has stabilized the market as well as increased the average selling price of devices.
The software and services sector of the ICT industry is much larger than hardware in terms of output, employment, and number of enterprises. Software and services accounted for 87% of the 37,400 ICT companies operating in Canada, 62% of total employment, 46% of research and development expenditures, and over 33% of total expenditure in 2015. Policy uncertainty in the United States may push companies towards Canada, considering their stable market and political climate that also boasts high skilled labor.
The last sector that has received considerable attention within Canada’s ICT industry is cybersecurity. In 2015, the Canadian government announced that USD 182.56 million will be invested into the industry until 2020, which will go toward extending protection to essential cyber systems outside of the federal government. The investment will also fund the development of policing expertise to detect and disrupt cybercrime activities through resources and training, and the creation of an investigative team to combat high-priority cybercrimes.7
Mexico
Although Mexico decreased one place in the ICT industry MPI ranking from 2016 to 2017, the country is still highly ranked at #13 out of the 97 countries. As a middle-income country, Mexico has a large market for ICT purchasing. For households that have lower incomes, cheap versions of devices like tablets, smartphones, and personal computers (PC) all satisfy demand for many first time buyers. The premium end of the income spectrum has been steadily increasing, which allows for households to spend on more expensive devices in order to replace previous models, which in turn acts as a price driver for the sector.8
Regulations of the Mexican economy are handled by the Secretariat of the Economy, within the Ministry of Economy. In July of 2014, the Ministry presented Prosoft 3.0, which provided updated policy goals for the Mexican ICT sector, as well as set an annual budget of more than USD 112 million. Prosoft 3.0 included 14 objectives to be hopefully achieved at the end of the 10 year ICT industry development program, including increasing the ICT market value from USD 14.4 billion in 2013 to USD 58 billion in 2024. Other goals of Prosoft 3.0 are doubling the number ICT companies,
7BMI Research-Canada Information Technology Report: https://bmo-bmiresearch-com.proxy1.cl.msu.edu/reports/view?productid=886&issue=20170701&archive=1&service=13&active_pillar=Reports%20Subtab 8BMI Research-Mexico Information Technology Report: https://bmo-bmiresearch-com.proxy1.cl.msu.edu/reports/view?productid=804&issue=20170701&archive=1&service=13&active_pillar=Reports%20Subtab

P a g e | 5
International Business Center
Michigan State University
increasing the industry’s workforce, promoting domestic companies, and increasing access to loans to 50% from 2014 to 2024.
Further regulation of the telecommunications sector has been approved, in 2013, which targets phone, internet, and television providers that have account for more than 50% market share, with the desire to create greater competition. This choice is intentioned to reduce the power of overly dominant companies in the industry in order to help Mexico meet its target for universal internet access. The new law also authorized the creation of the Federal Telecommunications Institute (IFETEL), which acts as an autonomous regulatory authority that can impose punitive sanctions on any company that resists competition.9
Europe
United Kingdom
Remaining at the #5 ranking from 2016 to 2017, the United Kingdom is home to one of the most robust Information Communications Technology sectors in Europe. In 2014, the government launched the Government Cloud (G-Cloud), which includes pooled data centers, a digital market place, and other additional applications. When full adoption of the G-Cloud is achieved, the UK government will be at the forefront of the public sector for their cloud computing strategy.
For the IoT sector, the UK is expected to generate more than USD 148 billion in the next 10 years. This is expected to come from domestic start-up companies that will largely contribute to the informatization of the country within many important sectors including healthcare, retail, energy, and transportation. Healthcare is expected to have the greatest opportunity for IoT, with up to USD 71.14 billion of potential market access.
While the 2016 referendum for the United Kingdom to leave the European Union (Brexit) has proven harmful to industries like agriculture and manufacturing, the ICT industry has the potential to be enhanced by this decision. Leaving the EU may prove to highlight the UK’s business friendly environment, offering reduced regulatory burden, lower wages, and a roll back of protections for workers. However, if a ‘hard’ Brexit is pursued, other countries such as France and Germany may prove to be a more desirable environment for the industry.
Cybersecurity and defense are important global issues that the government of the UK has worked to be more prepared to handle. Plans to create the Cyber Security Information Sharing Partnership were announced in 2013, which acts as an anti-cybercrime center
9BMI Research-Mexico Information Technology Report: https://bmo-bmiresearch-com.proxy1.cl.msu.edu/reports/view?productid=804&issue=20170701&archive=1&service=13&active_pillar=Reports%20Subtab
P a g e | 6
International Business Center
Michigan State University
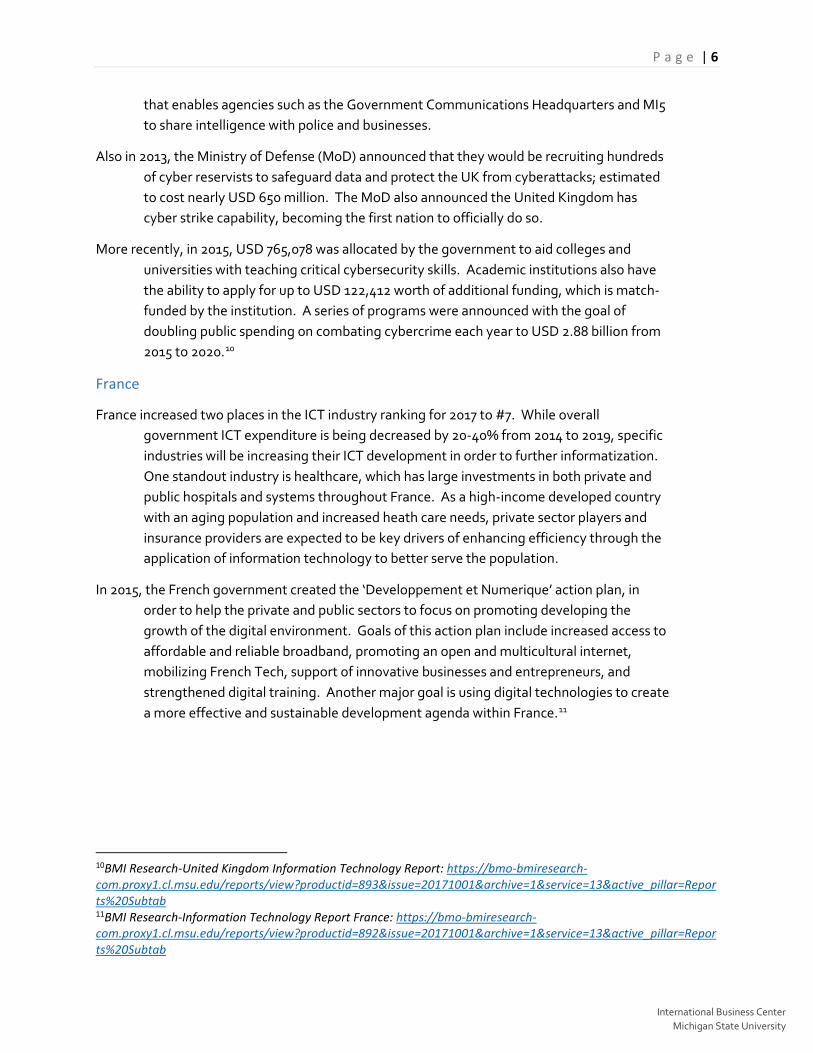
that enables agencies such as the Government Communications Headquarters and MI5 to share intelligence with police and businesses.
Also in 2013, the Ministry of Defense (MoD) announced that they would be recruiting hundreds of cyber reservists to safeguard data and protect the UK from cyberattacks; estimated to cost nearly USD 650 million. The MoD also announced the United Kingdom has cyber strike capability, becoming the first nation to officially do so.
More recently, in 2015, USD 765,078 was allocated by the government to aid colleges and universities with teaching critical cybersecurity skills. Academic institutions also have the ability to apply for up to USD 122,412 worth of additional funding, which is match-funded by the institution. A series of programs were announced with the goal of doubling public spending on combating cybercrime each year to USD 2.88 billion from 2015 to 2020.10
France
France increased two places in the ICT industry ranking for 2017 to #7. While overall government ICT expenditure is being decreased by 20-40% from 2014 to 2019, specific industries will be increasing their ICT development in order to further informatization. One standout industry is healthcare, which has large investments in both private and public hospitals and systems throughout France. As a high-income developed country with an aging population and increased heath care needs, private sector players and insurance providers are expected to be key drivers of enhancing efficiency through the application of information technology to better serve the population.
In 2015, the French government created the ‘Developpement et Numerique’ action plan, in order to help the private and public sectors to focus on promoting developing the growth of the digital environment. Goals of this action plan include increased access to affordable and reliable broadband, promoting an open and multicultural internet, mobilizing French Tech, support of innovative businesses and entrepreneurs, and strengthened digital training. Another major goal is using digital technologies to create a more effective and sustainable development agenda within France.11
10BMI Research-United Kingdom Information Technology Report: https://bmo-bmiresearch-com.proxy1.cl.msu.edu/reports/view?productid=893&issue=20171001&archive=1&service=13&active_pillar=Reports%20Subtab 11BMI Research-Information Technology Report France: https://bmo-bmiresearch-com.proxy1.cl.msu.edu/reports/view?productid=892&issue=20171001&archive=1&service=13&active_pillar=Reports%20Subtab
Information and Communications
Technology China
France
Japan
Canada
Singapore
United Kingdom
Germany Netherlands
2017
Top 10 Markets
International Business Center Michigan State University
South Korea
While the French government wishes to contract ICT government spending by 20-40% from 2014 until 2019, specific industries will be increasing their ICT development in order to increase their informatization. Healthcare will be a key driver, especially considering the large aging segment of the population that will rely on the application of information technology in order to enhance efficiency.
The launch of the Government Cloud has placed the UK government at the
forefront of the public sector for cloud computing strategy.
Cybersecurity and defense are aspects of ICT that the UK is showing
great strength of development in, especially after becoming the first nation to officially announce their
cyber strike capability. Investment into this sector has been large,
including the recruitment of cyber reservists and teaching cybersecurity
skills at colleges and universities.
China remains globally dominant in the IT industry, and has encouraged growth in the economy by loosening restrictions on foreign investment. This
has been fueled in part by multinational corporations outsourcing their IT jobs to China, which offers an attractive environment with relatively low
labor costs, a large workforce, and good telecommunications infrastructure. Outsourced IT to China is expected to grow at twice the rate of India’s, and is
worth approximately USD 2 billion a year.
Hong Kong

P a g e | 7
International Business Center
Michigan State University
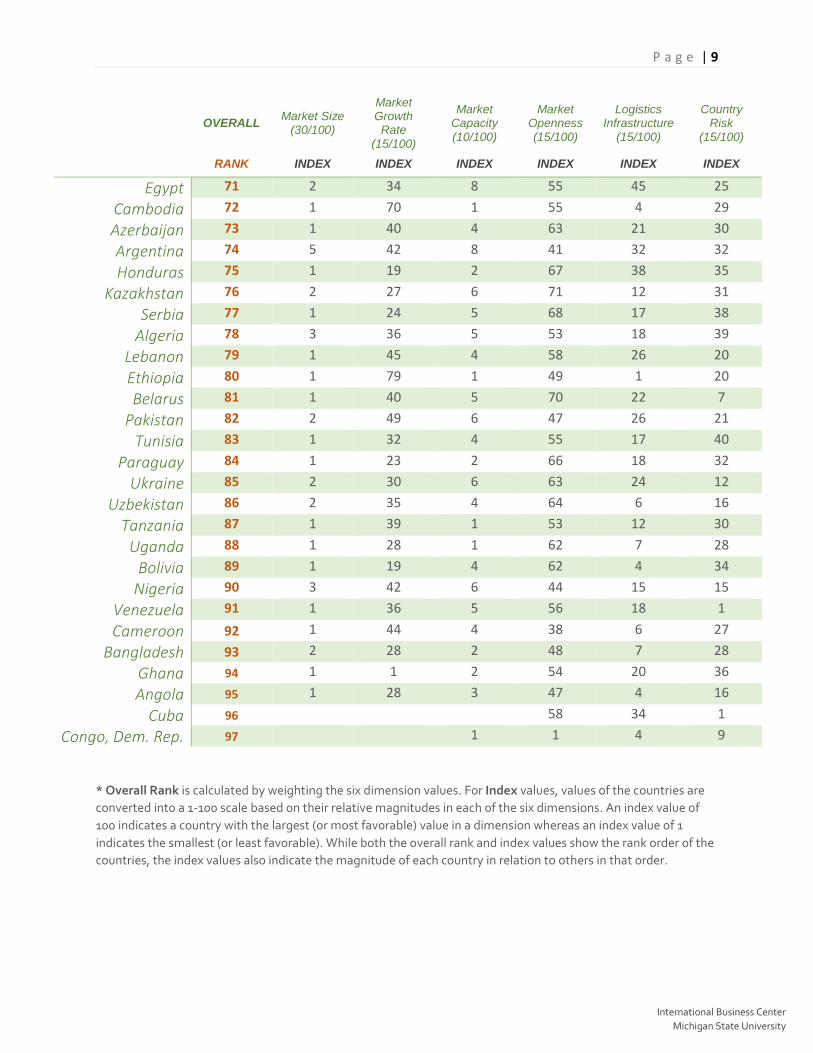
Results of the 2017 Information and Communications Technology MPI
OVERALL Market Size
(30/100)
Market Growth
Rate (15/100)
Market Capacity (10/100)
Market Openness (15/100)
Logistics Infrastructure
(15/100)
Country Risk
(15/100)
RANK INDEX INDEX INDEX INDEX INDEX INDEX
China 1 100 36 100 63 78 60
Hong Kong 2 51 49 18 75 77 84
Japan 3 50 33 23 71 67 92
Germany 4 40 39 24 73 89 94
United Kingdom 5 30 35 19 76 89 87
Netherlands 6 23 32 16 78 100 92
France 7 24 29 18 73 79 88
Canada 8 20 35 15 76 84 88
Korea, Rep. 9 21 42 12 70 71 79
Singapore 10 10 34 13 78 81 88
Australia 11 19 40 14 72 35 91
Switzerland 12 8 33 19 73 68 100
Mexico 13 22 50 11 70 57 51
United Arab E. 14 9 64 9 69 72 69
Sweden 15 8 29 11 74 78 96
Spain 16 11 33 13 72 80 77
Belgium 17 6 32 9 73 92 89
Italy 18 15 30 15 70 61 77
Ireland 19 4 39 19 79 59 86
India 20 19 40 22 66 36 57
Denmark 21 4 31 10 74 73 91
Norway 22 4 36 12 75 56 97
Austria 23 4 30 10 74 62 94
Finland 24 3 27 10 77 66 90
Oman 25 1 100 5 70 40 55
Czech Republic 26 8 37 6 72 49 85
Poland 27 8 44 9 71 49 76
Malaysia 28 8 39 7 73 56 69
Panama 29 1 30 6 89 77 58
Slovakia 30 4 52 6 71 36 78
Chile 31 5 39 7 72 47 76
New Zealand 32 3 34 8 74 34 93
Estonia 33 1 34 5 74 48 86
Israel 34 4 32 9 75 43 78

P a g e | 8
International Business Center
Michigan State University
OVERALL Market Size
(30/100)
Market Growth
Rate (15/100)
Market Capacity (10/100)
Market Openness (15/100)
Logistics Infrastructure
(15/100)
Country Risk
(15/100)
RANK INDEX INDEX INDEX INDEX INDEX INDEX
Portugal 35 2 25 7 73 62 77
Latvia 36 1 46 5 72 44 75
Saudi Arabia 37 9 40 8 63 44 60
Qatar 38 2 57 10 63 42 67
Vietnam 39 10 67 7 63 28 43
Thailand 40 9 50 8 67 30 54
Slovenia 41 1 36 6 73 48 76
Hungary 42 4 41 6 73 40 67
Lithuania 43 1 37 5 71 47 73
Turkey 44 8 42 11 63 48 44
El Salvador 45 1 36 2 100 36 43
Costa Rica 46 1 39 5 86 28 59
Guatemala 47 1 36 4 98 35 41
Philippines 48 4 67 7 64 6 58
Peru 49 3 48 6 65 37 57
Kuwait 50 5 51 7 60 24 61
Indonesia 51 8 49 10 62 9 54
Romania 52 2 41 6 70 29 59
Greece 53 3 37 6 70 47 50
Dominican Rep. 54 1 43 5 76 45 42
South Africa 55 6 37 6 63 43 49
Uruguay 56 1 36 5 70 40 59
Morocco 57 2 34 5 66 49 57
Colombia 58 5 33 7 65 41 51
Cyprus 59 1 30 8 69 31 65
Bahrain 60 1 38 5 69 42 48
Bulgaria 61 1 43 5 69 23 58
Russia 62 12 16 17 58 30 39
Croatia 63 1 28 5 71 43 46
Brazil 64 11 9 20 53 30 39
Ecuador 65 1 21 5 73 47 27
Sri Lanka 66 1 43 2 65 24 38
Jordan 67 1 25 4 70 29 39
Cote d'lvoire 68 1 50 1 57 35 28
Kenya 69 1 33 5 63 26 38
Nicaragua 70 1 55 1 62 23 24
P a g e | 9
International Business Center
Michigan State University
OVERALL Market Size
(30/100)
Market Growth
Rate (15/100)
Market Capacity (10/100)
Market Openness (15/100)
Logistics Infrastructure
(15/100)
Country Risk
(15/100)
RANK INDEX INDEX INDEX INDEX INDEX INDEX
Egypt 71 2 34 8 55 45 25
Cambodia 72 1 70 1 55 4 29
Azerbaijan 73 1 40 4 63 21 30
Argentina 74 5 42 8 41 32 32
Honduras 75 1 19 2 67 38 35
Kazakhstan 76 2 27 6 71 12 31
Serbia 77 1 24 5 68 17 38
Algeria 78 3 36 5 53 18 39
Lebanon 79 1 45 4 58 26 20
Ethiopia 80 1 79 1 49 1 20
Belarus 81 1 40 5 70 22 7
Pakistan 82 2 49 6 47 26 21
Tunisia 83 1 32 4 55 17 40
Paraguay 84 1 23 2 66 18 32
Ukraine 85 2 30 6 63 24 12
Uzbekistan 86 2 35 4 64 6 16
Tanzania 87 1 39 1 53 12 30
Uganda 88 1 28 1 62 7 28
Bolivia 89 1 19 4 62 4 34
Nigeria 90 3 42 6 44 15 15
Venezuela 91 1 36 5 56 18 1
Cameroon 92 1 44 4 38 6 27
Bangladesh 93 2 28 2 48 7 28
Ghana 94 1 1 2 54 20 36
Angola 95 1 28 3 47 4 16
Cuba 96 58 34 1
Congo, Dem. Rep. 97 1 1 4 9 * Overall Rank is calculated by weighting the six dimension values. For Index values, values of the countries are converted into a 1-100 scale based on their relative magnitudes in each of the six dimensions. An index value of 100 indicates a country with the largest (or most favorable) value in a dimension whereas an index value of 1 indicates the smallest (or least favorable). While both the overall rank and index values show the rank order of the countries, the index values also indicate the magnitude of each country in relation to others in that order.
P a g e | 10
International Business Center
Michigan State University
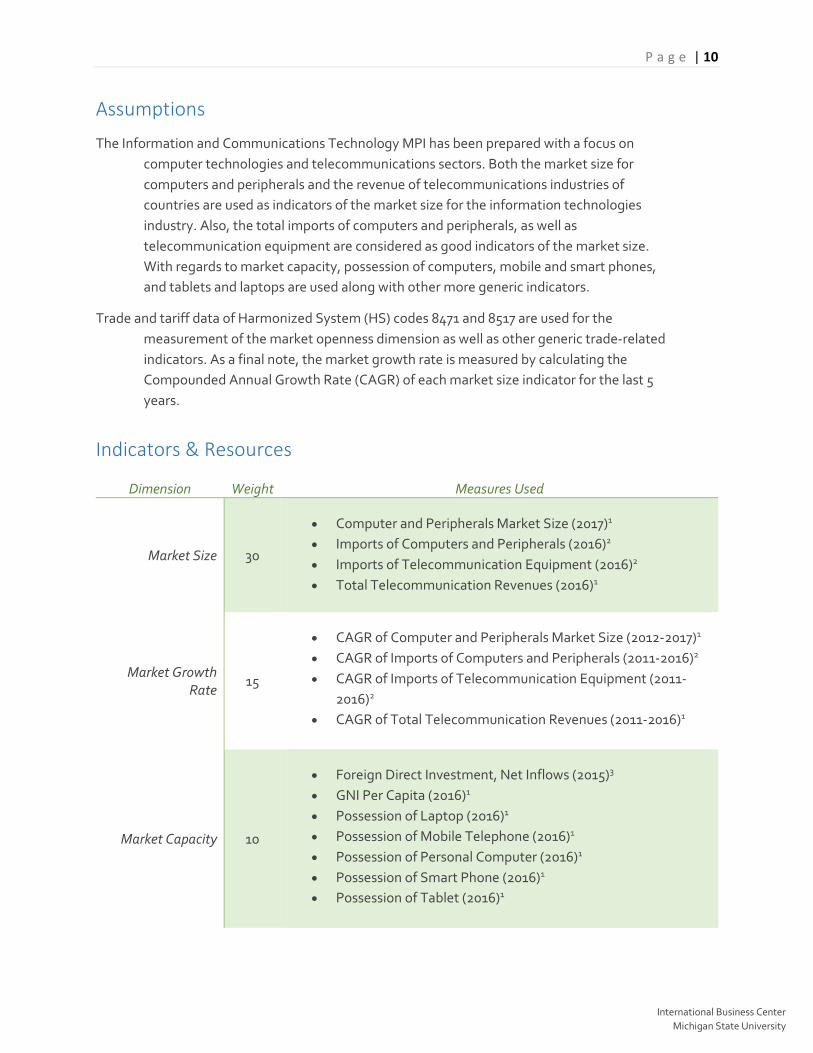
Assumptions
The Information and Communications Technology MPI has been prepared with a focus on computer technologies and telecommunications sectors. Both the market size for computers and peripherals and the revenue of telecommunications industries of countries are used as indicators of the market size for the information technologies industry. Also, the total imports of computers and peripherals, as well as telecommunication equipment are considered as good indicators of the market size. With regards to market capacity, possession of computers, mobile and smart phones, and tablets and laptops are used along with other more generic indicators.
Trade and tariff data of Harmonized System (HS) codes 8471 and 8517 are used for the measurement of the market openness dimension as well as other generic trade-related indicators. As a final note, the market growth rate is measured by calculating the Compounded Annual Growth Rate (CAGR) of each market size indicator for the last 5 years.
Indicators & Resources
Dimension Weight Measures Used
Market Size 30
• Computer and Peripherals Market Size (2017)1 • Imports of Computers and Peripherals (2016)2 • Imports of Telecommunication Equipment (2016)2 • Total Telecommunication Revenues (2016)1
Market Growth Rate
15
• CAGR of Computer and Peripherals Market Size (2012-2017)1 • CAGR of Imports of Computers and Peripherals (2011-2016)2 • CAGR of Imports of Telecommunication Equipment (2011-
2016)2 • CAGR of Total Telecommunication Revenues (2011-2016)1
Market Capacity 10
• Foreign Direct Investment, Net Inflows (2015)3 • GNI Per Capita (2016)1 • Possession of Laptop (2016)1 • Possession of Mobile Telephone (2016)1 • Possession of Personal Computer (2016)1 • Possession of Smart Phone (2016)1 • Possession of Tablet (2016)1

P a g e | 11
International Business Center
Michigan State University
Market Openness 15
• Applied Tariff Rate of HS 8471 & HS 8517 (2017)4 • Burden of Customs Procedure (2016)3 • Cost to Import, Border Compliance (2016)3 • Cost to Import, Documentary Compliance (2016)3 • Imports of Computers and Peripherals from US as a Share of
Global Imports (2016)2 • Imports of Telecommunication Equipment from US as a Share
of Global Imports (2016)2
Logistics Infrastructure
15
• Distance of Country from US (2016) 5 • Logistics Performance Index (2016) 3 • Liner Shipping Connectivity Index (2016) 3 • Quality of Port Infrastructure Index (2015) 3
Country Risk 15
• Business Risk Rating (2016) 6 • Economic Risk Rating (2016) 7 • Intellectual Property Rights Protection (2017) 8 • Political Risk Rating (2016) 9
Data used are those available for most recent year. All sources were accessed in May-July 2017.
1 Passport GMID:,Global Market Information Database 2 UN Comtrade:,Commodity Trade Statistics Database 3 World Bank:,World Development Indicators 4 World Trade Organization (WTO):,Tariff Database 5 Happyzebra:,Distances 6 Swiss Export Risk Insurance:,Cover Practice for Countries and Banks 7 Coface:,Economic Studies 8 International Property Rights Index:,2016 IPRI Report 9 Credendo:,Country Risks

P a g e | 12
International Business Center
Michigan State University
RANK
Country 2017 2016 Kuwait 50 57
Indonesia 51 34 Romania 52 55
Greece 53 68 Dominican Republic 54 58
South Africa 55 53 Uruguay 56 56 Morocco 57 64
Colombia 58 46 Cyprus 59 60
Bahrain 60 52 Bulgaria 61 63
Russian Federation 62 59 Croatia 63 66
Brazil 64 61 Ecuador 65 70
Sri Lanka 66 67 Jordan 67
Cote d'lvoire 68
Kenya 69
Nicaragua 70 74 Egypt, Arab Rep. 71 62
Cambodia 72 69 Azerbaijan 73 71 Argentina 74 75 Honduras 75 73
Kazakhstan 76 81 Serbia 77 77
Algeria 78 65 Lebanon 79
Ethiopia 80
Belarus 81 85 Pakistan 82 72
Tunisia 83 78 Paraguay 84 76
Ukraine 85 79 Uzbekistan 86 88
Tanzania 87
Uganda 88
Bolivia 89
Nigeria 90 80 Venezuela 91 87 Cameroon 92
Bangladesh 93 86 Ghana 94
Angola 95
Cuba 96 89 Congo, Dem. Rep. 97
Year To Year Comparison
RANK
Country 2017 2016 China 1 1
Hong Kong SAR, China 2 2 Japan 3 4
Germany 4 3 United Kingdom 5 5
Netherlands 6 7 France 7 9
Canada 8 8 Korea, Rep. 9 11
Singapore 10 10 Australia 11 14
Switzerland 12 16 Mexico 13 12
United Arab Emirates 14 6 Sweden 15 13
Spain 16 24 Belgium 17 20
Italy 18 28 Ireland 19 22
India 20 17 Denmark 21 25
Norway 22 21 Austria 23 30 Finland 24 27
Oman 25 19 Czech Republic 26 37
Poland 27 32 Malaysia 28 23 Panama 29
Slovakia 30 40 Chile 31 33
New Zealand 32 31 Estonia 33 42
Israel 34 43 Portugal 35 45
Latvia 36 54 Saudi Arabia 37 26
Qatar 38 15 Vietnam 39 51 Thailand 40 36 Slovenia 41 50 Hungary 42 44
Lithuania 43 48 Turkey 44 39
El Salvador 45 38 Costa Rica 46 29
Guatemala 47 35 Philippines 48 49
Peru 49 47

P a g e | 13
International Business Center
Michigan State University
For More Information
For the indexing methodology, please refer to:
"Measuring the Potential of Emerging Markets: An Indexing Approach" - S. Tamer Cavusgil, Business Horizons, January-February 1997, Vol. 40 Number 1, 87-91
"Complementary Approaches to Preliminary Foreign Market Opportunity Assessment: Country Clustering and Country Ranking" - S. Tamer Cavusgil, Tunga Kiyak and Sengun Yeniyurt, Industrial Marketing Management, October 2004, Volume 33, Issue 7, 607-617