information brief - spccfpstore1.blob.core.windows.net
TRANSCRIPT

Information brief
Photo: Michele Westmorland
Pacific kava production, trade and consumption: Gaps in data hinder full analysis Nilima Lal, Economic Statistics Adviser, Statistics for Development Division, Pacific Community
A. Introduction Kava is made by grinding parts (usually the roots either dried or fresh depending on the country) of the plant Piper methysticum, soaking it in water and then straining it using a cloth or vau1. It is reported to lessen anxiety and is said to contain some medicinal properties. It is also reported to have some side effects due to which a number of countries have placed restrictions on its import. These have included limits on the quantity that can be carried into, for example, Australia by arriving passengers, a restiction that still stands.
Kava is a popular social and cultural/ceremonial drink in a number of Pacific Island countries and territories (PICTs). It is also popular among the Pacific Island diaspora now settled in countries like the United States of America, Australia and New Zealand. It is a drink that soldiers from the Fiji military forces take with them when they go for peace keeping duties. A talanoa2 around the tanoa3 is common among all ages and groups of people in many countries across the Pacific region. If taken in moderation this can be an enjoyable experience and a socio-cultural approach to brainstorm ideas or resolve conflicts.
Cultivating and selling kava is an important source of income for many rural farmers and their families. It is also an important value-adding commodity since other than the usual powder form, it comes in other forms including capsules.
The economic importance of kava to many PICTs is significant. It contributes to the gross domestic product (GDP) and to the balance of payments and foreign exchange earnings. These contributions need to be more accurately and
1Dried inner bark of the hibiscus plant. 2Talk or discussion. 3Traditional bowl in which kava is mixed.

Challenges in compiling statistics on kava Page 2 of 15
comprehensively measured. This can only happen if statistics on kava production, consumption, imports and exports are compiled by all PICTs.
For this to happen two things are necessary:
1. Statistical classifications are needed to capture data on kava – these are among the basic tools for accurate and reliable data collection, analysis and dissemination. Appendix 1 illustrates the different classifications which have been regionalised to better identify goods, including kava, that are important to the economies of PICTs.
2. Reliable and comprehensive data on kava production, consumption and trade: this is the crux of the problem; the lack of data on kava is a major issue facing the compilation of statistics on kava, which in turn poses difficulties in developing kava-related policies that could benefit PICTs.
Section B highlights issues due to which the compilation of statistics on kava in PICTs is not up to scratch and proposes ways in which the kava-data lacuna can be significantly improved. Section C analyses the avaiable data by country and makes the issues discussed in Section B clearly visible. Section D of the paper provides a short summary and conclusion.
B. Issues in the compilation of statistics on kava and ways they can be resolved
Data on kava production, exports, imports and household (HH) final consumption expenditure were obtained from 11 countries4. Guam and Tokelau reported they had no production, export or import data. Papua New Guinea reported no data on kava since activities are carried on outside of the formal sector. There were data gaps, inconsistencies and other quality issues with the data provided by almost all the other countries indicating that, although kava is an important cash crop and items of trade for many, there is very little available reliable data on the industry as a whole.
Some of the major issues in the compilation of statistics and thoughts on how these can be addressed are highlighted below:
1. Issues in capturing data on the number of growers and the production of kava
For most countries the growing of Piper methysticum and the production of kava falls in the informal sector, that is, they are household-based activities carried out by self-employed persons with or without hired casual workers and/or unpaid family workers. However, most of the kava produced in this way is sold. For some HHs this is a major source of income, and therefore needs to be reflected in the country’s GDP.
It is therefore recommended that the agriculture departments in PICTs collect data more regularly from HHs through its extension offices and through the periodic agricultural census, on the number of kava growers, quantity of kava produced and the farmgate/market price received.
2. Underreporting of kava exported
This is common in almost all the PICTs and will be better explained with the following example from Tonga. Table 1 shows two sets of numbers for the quantity of kava exported from Tonga from 2012 to 2020. Statistics on the quantity of kava officially exported, as released by the Tonga Statistics Department, differs from the quantity of kava exports as reported by Tonga’s Quarantine and Quality Management Division as having been authorised to be taken abroad. Kava approved by the Quarantine Division to be taken abroad are hand carried, taken as checked-in luggage or taken as unaccompanied baggage for personal use or with the intention to resell it.5 Either way, if what Table 1 indicates is correct, then there is a significant undercoverage of the quantity and, as a result, of the official value of kava exported. Table 1 gives two scenarios, the first assumes that data from the Quarantine Division were not included in the official
4American Samoa, Federated States of Micronesia, Fiji, Guam, Kiribati, Papua New Guinea, Samoa, Solomon Islands, Tokelau, Tonga and Vanuatu. 5In international trade this is referred to as shuttle trade. Shuttle trade to a significant scale as defined by national law are to be included in the IMTS. One of characteristics of shuttle trade is the intention to resell goods as compared to own use. The shuttle trade is normally not recorded due to a low value (below customs threshold), but in some cases they are undeclared to avoid duties. In PICTS, shuttle trade conducted on an informal basis is common among all categories of travellers including non-resident workers where: (a) the value of the imports of goods are not declared in order to avoid import duties. A common way is for persons and individual traders to hand carry goods in excess of customs thresholds or carry goods as part of personal items in checked-in luggage. If caught at the arrival hall/customs check point, duty is paid but often this does not get recorded by customs; (b) the value of exports e.g., travellers carry with them goods as personal items or unaccompanied baggage like a container full of fish or taro which passes through the quarantine department but the information from the quarantine department, most of the time, does not get passed onto the customs administrations. Since data on the shuttle trade are not recorded in the customs trade database passed on to the NSOs, the IMTS falls short of this information. Source: Draft Pacific International Merchandise Trade Statistics Compilation Guide by Nilima Lal, Statistics for Development Division, SPC.

Challenges in compiling statistics on kava Page 3 of 15
national statistics office (NSO) data released. Scenario 2 assumes that all the export data released by the NSO are covered by the Quarantine Division and that only a portion of the quantity reported by the Quarantine Division was not covered.
Table 1: Tonga – Quantity of kava exports authorised to be taken abroad by the Quarantine Division, 2012–2020
Year
Official exports data released by the NSO
Export data from
quarantine
Scenario 1 – Quarantine tonnage not included in the
official export data released by NSO
Scenario 2 – Only net quantine tonnage not included in the official export data released by
the NSO
Value (TOP)
Quantity (tonnes)
Price (TOP per tonne)
Quantity (tonnes)
Value of quarantine data
(column 5 multiplied by
column 4) (TOP)
Total export value
(column 2 plus column
6) (TOP)
Net quarantine
tonnage (column 5 less
column 3)
Value of net quarantine
tonnage (column 8
multiplied by column 4) (TOP)
Total export value (column 2 plus column
8) (TOP)
1 2 3 4 5 6 7 8 9 10 2012 2,021,143 118 17,164 210 3,595,912 5,617,055 92 1,574,769 3,595,912 2013 2,078,618 69 30,027 218 6,536,874 8,615,491 148 4,458,256 6,536,874 2014 2,388,235 123 19,394 196 3,795,498 6,183,732 73 1,407,263 3,795,498 2015 6,628,562 116 56,904 218 12,393,665 19,022,227 101 5,765,103 12,393,665 2016 4,215,267 92 45,770 104 4,760,066 8,975,333 12 544,799 4,760,066 2017 1,640,747 33 50,000 79 3,949,999 5,590,745 46 2,309,252 3,949,999 2018 3,831,014 77 50,000 123 6,170,000 10,001,014 47 2,338,986 6,170,000 2019 5,651,701 113 50,000 129 6,440,000 12,091,701 16 788,299 6,440,000 2020 9,965,306 211 47,183 243 11,456,001 21,421,307 32 1,490,696 11,456,001
Source: Tonga Quarantine Division and SPC Land Resources and Statistics for Development Divisions Note: Price in column 4 is calculated using information on exports from the IMTS provided by the Tonga Statistics Department (refer to Table 6 in Appendix 2); this is assumed to be the official export price to estimate the value of the total quantity of kava approved by Tonga’s Quarantine Division to be taken abroad.
Price is a critical value for all trade, and especially in the case of a commodity such as kava that appears to have almost as much in unofficial as in official export quantity. There is anecdotal evidence (from SPC’s Land Resources Division) that most of the kava taken by passengers is purchased in Tonga at the local price and from 2016 to end of 2018 the price was sitting at over TOP 100 per kilo due to the impact of El Niño and other natural disasters.
It is therefore recommended that appropriate institutional arrangements be put in place between the NSOs, customs administrations and quarantine departments to be able to estimate the correct value of official and unofficial exports in the IMTS. Partner country trade data can also be checked but experience shows that because kava carried by travellers is usually within the permitted limit, it does not get recorded at the destination.
Until such arrangements are put in place, the challenge is for the NSOs to obtain data from the quarantine departments, work out different scenarios, find out which scenario is correct and include the estimates in the IMTS. NSOs should take note that though customs administrations are the preferred source for international trade data, supplementary sources can be used to verify or correct data.
3. Issues in obtaining data for estimating final consumption expenditure of households6
Kava is consumed by many HHs in countries across the region but, except for Fiji, no other PICT is able to provide the data on this important economic crop. It is recommended that more emphasis be given to this item in the consumption expenditure data from the HH Income and Expenditure Surveys (HIES).
4. The lack of quality checks on the data being compiled on kava
As mentioned earlier in this paper, some of the data obtained from the countries could not be used for the analysis in Section C because they did not meet the quality standards required.
It is recommended that NSOs do a simple supply-use analysis for kava using the template at Figure 1. Doing this will allow confrontation of data from different sources, for example, the quantity of kava produced obtained from the agriculture census and kava growers associations/councils, and household and market surveys; exports of kava from
6Households’ final consumption expenditure is an important component of the GDP expenditure approach.
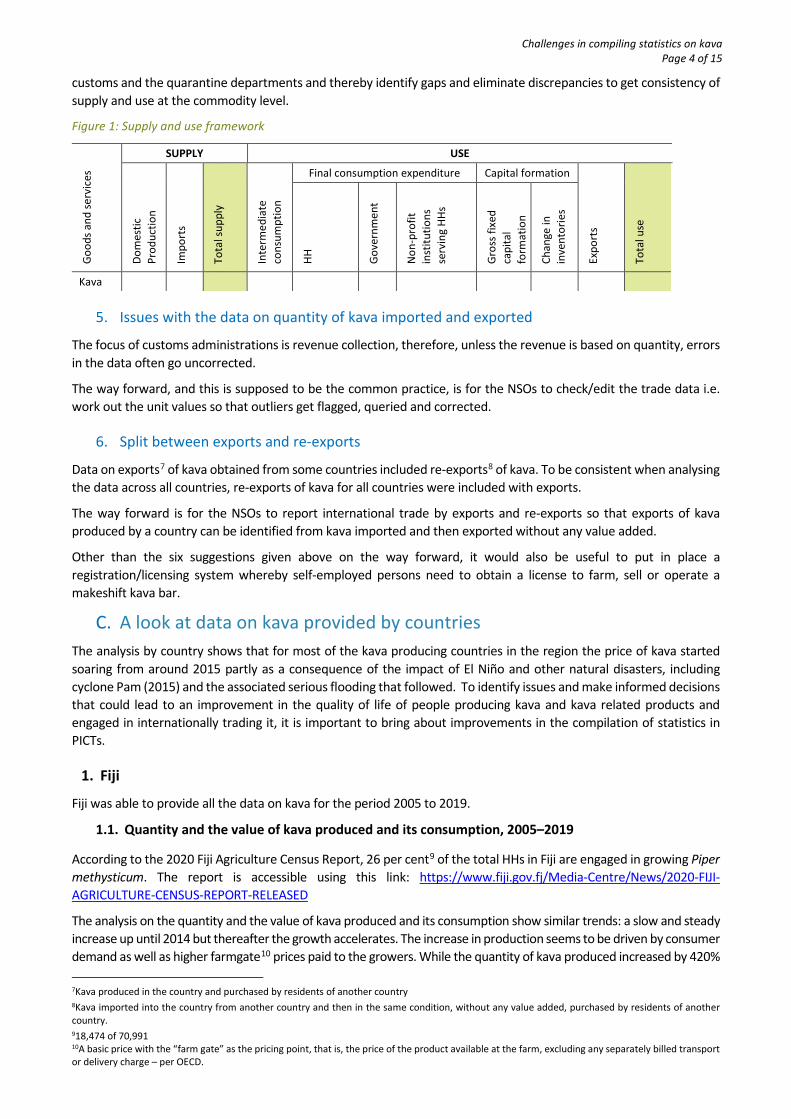
Challenges in compiling statistics on kava Page 4 of 15
customs and the quarantine departments and thereby identify gaps and eliminate discrepancies to get consistency of supply and use at the commodity level.
Figure 1: Supply and use framework
Good
s and
serv
ices
SUPPLY USE Do
mes
tic
Prod
uctio
n
Impo
rts
Tota
l sup
ply
Inte
rmed
iate
co
nsum
ptio
n
Final consumption expenditure Capital formation
Expo
rts
Tota
l use
HH
Gove
rnm
ent
Non
-pro
fit
inst
itutio
ns
serv
ing
HHs
Gros
s fix
ed
capi
tal
form
atio
n
Chan
ge in
in
vent
orie
s
Kava
5. Issues with the data on quantity of kava imported and exported
The focus of customs administrations is revenue collection, therefore, unless the revenue is based on quantity, errors in the data often go uncorrected.
The way forward, and this is supposed to be the common practice, is for the NSOs to check/edit the trade data i.e. work out the unit values so that outliers get flagged, queried and corrected.
6. Split between exports and re-exports
Data on exports7 of kava obtained from some countries included re-exports8 of kava. To be consistent when analysing the data across all countries, re-exports of kava for all countries were included with exports.
The way forward is for the NSOs to report international trade by exports and re-exports so that exports of kava produced by a country can be identified from kava imported and then exported without any value added.
Other than the six suggestions given above on the way forward, it would also be useful to put in place a registration/licensing system whereby self-employed persons need to obtain a license to farm, sell or operate a makeshift kava bar.
C. A look at data on kava provided by countries The analysis by country shows that for most of the kava producing countries in the region the price of kava started soaring from around 2015 partly as a consequence of the impact of El Niño and other natural disasters, including cyclone Pam (2015) and the associated serious flooding that followed. To identify issues and make informed decisions that could lead to an improvement in the quality of life of people producing kava and kava related products and engaged in internationally trading it, it is important to bring about improvements in the compilation of statistics in PICTs.
1. Fiji
Fiji was able to provide all the data on kava for the period 2005 to 2019.
1.1. Quantity and the value of kava produced and its consumption, 2005–2019
According to the 2020 Fiji Agriculture Census Report, 26 per cent9 of the total HHs in Fiji are engaged in growing Piper methysticum. The report is accessible using this link: https://www.fiji.gov.fj/Media-Centre/News/2020-FIJI-AGRICULTURE-CENSUS-REPORT-RELEASED
The analysis on the quantity and the value of kava produced and its consumption show similar trends: a slow and steady increase up until 2014 but thereafter the growth accelerates. The increase in production seems to be driven by consumer demand as well as higher farmgate10 prices paid to the growers. While the quantity of kava produced increased by 420%
7Kava produced in the country and purchased by residents of another country 8Kava imported into the country from another country and then in the same condition, without any value added, purchased by residents of another country. 918,474 of 70,991 10A basic price with the “farm gate” as the pricing point, that is, the price of the product available at the farm, excluding any separately billed transport or delivery charge – per OECD.

Challenges in compiling statistics on kava Page 5 of 15
from 2005 to 2019, the price per kilogram of kava for the same period increased by 533% which is 114 percentage points more. The retail price of kava in Fiji, depending on which part of the plant it is made from e.g. whether it is lewena11 or waka,12 currently ranges from FJD 60 to FJD 90. Refer to Graphs 1 to 3 and Appendix 2, Table 1.
1.2. Imports and exports of kava, 2005–2019
The analysis on the imports of kava shows a decline of 31% in the quantity of kava imported from 2005 to 2019 but the dollar per tonne paid for imports for the same period showed an increase of 530%, which is 560 percentage points higher. The increase of 336% in the value of imports from 2005 to 2019 was therefore driven by escalating import price of kava. Fiji’s major source market for kava is Vanuatu. In 2019 kava contributed 0.4% to Fiji’s total imports, 0.17 percentage points more than 2005 and 0.08 percentage points more than 2018.
The analysis on the exports of kava shows an increase of 168% in the quantity of kava exported from 2005 to 2019 but the dollar per tonne paid for exports for the same period showed an increase of 375%, which is 207 percentage points more. The increase of 1,171% in the value of exports from 2005 to 2019 was driven more by the increase in the export prices than by the quantity of kava exported. Fiji’s major destinations are PICTs. In 2019 kava contributed 1.5% to the value of Fiji’s total exports, 1.3 percentage points more than 2005. Refer to Graphs 4 and 5 and Appendix 2, Tables 3 and 4.
1.3. Contribution of kava to GDP, 2005–2019
Imports of kava, together with what is produced in Fiji, forms the total supply of kava in Fiji; the use mostly being for domestic final consumption and with the quantity remaining being re-exported. As per the requirements of the System of National Accounts, Fiji constructs a supply and use table13 (SUT) to fill-in the data gaps and do valuation adjustments etc to get a reconciled GDP using the production, income and expenditure approaches. Refer to Appendix 2, Table 5. (Read 9.2.1 of the 4th day presentations using this link https://sdd.spc.int/events/2013/07/4th-regional-conference-heads-planning-and-statistics-hops-4 to get an overview of the SUT methodology.)
11Made from the stump of the kava plant. 12Made from the root of the kava plant. 13The principle SUTs are based on: (a) products available for use in a country, either domestically produced or imported = total supply; (b) the total supply is used for intermediate consumption, final consumption expenditure, capital formation and exports.
0
2,000
4,000
6,000
8,000
10,000
12,000
14,000
2005
2006
2007
2008
2009
2010
2011
2012
2013
2014
2015
2016
2017
2018
2019
Tonn
es
Years
Graph 1: Fiji – Quantity of kava produced, 2005–2019
0
50
100
0
500,000,000
1,000,000,000
1,500,000,000
2005
2007
2009
2011
2013
2015
2017
2019
FJD
per K
g
FJD
Years
Graph 2: Fiji – Value of kava produced and Farmgate price, 2005–2019
Value of production Farmgate price
0
200,000,000
400,000,000
600,000,000
800,000,000
1,000,000,000
1,200,000,000
2005
2007
2009
2011
2013
2015
2017
2019
FJD
Years
Graph 3: Fiji – Value of kava consumption, 2005–2019
0
200
400
600
0
5,000,000
10,000,000
15,000,000
20,000,000
25,000,000
2005
2006
2007
2008
2009
2010
2011
2012
2013
2014
2015
2016
2017
2018
2019
Tonn
esFJD
Years
Graph 4: Fiji – Value and quantity of kava imports, 2005–2019
Value of imports Quantity imported
0
100
200
300
400
0
10,000,000
20,000,000
30,000,000
40,000,000
2005
2006
2007
2008
2009
2010
2011
2012
2013
2014
2015
2016
2017
2018
2019
Tonn
es
FJD
Years
Graph 5: Fiji – Value and quantity of kava exports, 2005–2019
Value of exports Quantity exported

Challenges in compiling statistics on kava Page 6 of 15
The difference in the contribution between nominal and real GDP starts widening from 2016 due to inflation and the analysis in paragraph 1.1 (Quantity and the value of kava produced and its consumption, 2005–2019) mentions the increase in the farmgate price.
In 2016, kava’s contribution to nominal GDP was more than 2.6 percentage points higher than its contribution to real GDP, in 2017 and 2018 it was higher by 2.7 percentage points and in 2019 by 3.6 percentage points.
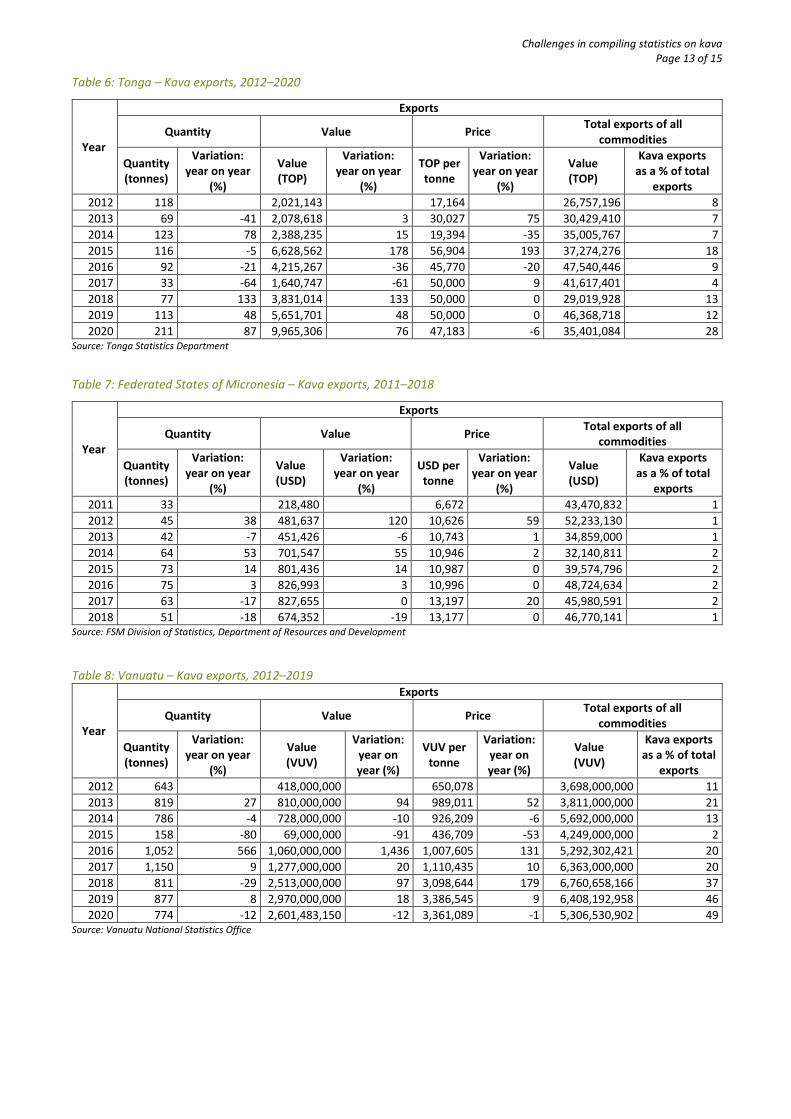
2. Tonga
Tonga provided data on the quantity and value of kava exports for the period 2012 to 2020. Analysis shows that from 2016 the quantity and the value of exports follow a similar trend. This is also the period where the export price per tonne remained relatively steady between TOP 45,000 and TOP 50,000. Analysis shows an increase of 79% in the quantity of kava exported from 2012 to 2020 and an increase of 175% in price per tonne for the same period, this is 96 percentage points more than the increase in the quantity. The increase of 393% in the value of exports from 2012 to 2020 was driven more by the increase in the export price per tonne than by the quantity of kava exported.
In 2019, kava contributed 28% to Tonga’s total exports, 20 percentage points more than 2012 and 16 percentage points more than 2019. Refer to Graph 7 and Appendix 2, Table 6. Note that the data used here are from the NSO – refer to point 2 under Section B.
3. Federated States of Micronesia (FSM)
FSM provided data on the quantity and value of kava exports for the period 2011 to 2018. Analysis indicates that both the quantity and value of exports generally showed an increasing trend from 2011 until 2016 when a decline set in. Exports for 2018 compared to 2017 showed an 18% decline in the quantity, a 19% decline in the value and no change in the price per tonne. In 2018, kava contributed 1% to FSMs total exports, which was the same as in 2011 but 1 percentage point less than in 2017. Refer to Graph 8 and Appendix 2, Table 7.
4. Vanuatu
Kava contributes significantly to Vanuatu’s economy, however for this study the NSO was only able to provide data on the quantity and value of kava exports for the period 2012 to 2020. Nonetheless, the NSO reported that Vanuatu was making every effort to improve the data collection on kava, the custodianship of which now lies with the country’s biosecurity agency. The NSO also reported that the Vanuatu Primary Producers Authority, established in 2018, is bestowed with the role to register all primary producers in the country and thus far they have registered some 7,500 kava producers.
The sharp decline of 80% in 2015 compared to 2014 in the quantity exported, a decline of 91% in the value of exports and a 53% decline in the price was due to Cyclone Pam, a category 5 storm that hit Vanuatu in March 2015. Recovery efforts saw Vanuatu bounce back and in 2016 compared to 2015, registered an increase of 566% in the quantity exported, an increase of 1,436% in the value of exports and a 131% increase in the price per tonne. In 2018 compared to 2017, despite a 29% decline in the quantity exported, the value of exports increased by 97% due to a 179% increase in the price per tonne. In 2020, kava contributed 49% to Vanuatu’s total exports, which was 38 percentage points more than in 2012 and 3 percentage points more than 2019. Refer to Graph 9 and Appendix 2, Table 8.
0
50
100
150
200
250
0
2,500,000
5,000,000
7,500,000
10,000,000
12,500,000
2012
2013
2014
2015
2016
2017
2018
2019
2020
Tonn
es
TOP
Years
Graph 7: Tonga – Value and quantity of kava exports, 2012–2020
Value of export Quantity exported
0
20
40
60
80
0
250,000
500,000
750,000
1,000,000
2011
2012
2013
2014
2015
2016
2017
2018
Tonn
es
USD
Year
Graph 8: FSM – Value and quantity of kava exports, 2011–2018
Value of exports Quantity exported
-3.0
2.0
7.020
0520
0620
0720
0820
0920
1020
1120
1220
1320
1420
1520
1620
1720
1820
19
Perc
ent
Years
Graph 6: Fiji – Contribution of kava to GDP, 2005–2019
Contribution of kava to Real GDP (%)
Contribution of kava to Nominal GDP (%)
0
500
1000
1500
0
1,000
2,000
3,000
2012
2013
2014
2015
2016
2017
2018
2019
2020
Tonn
es
Vatu
Mill
ions
Years
Graph 9: Vanuatu – Value and quantity of kava exports, 2012–2020
Value of exports Quantity exported

Challenges in compiling statistics on kava Page 7 of 15
5. Solomon Islands
Solomon Islands provided data on the value of kava exports for the period 2005 to 2019. Analysis indicates that the value of exports fluctuated considerably over time. Over the whole period from 2005 to 2019, there was a general upward trend. However, sharp increases in exports between 2005 and 2010 were followed by equally sharp declines between 2010 and 2015; follwed once again by another upturn between 2017 through 2019. Exports for 2018 compared to 2017 showed an increase of 304% and for 2019 compared to 2018 an increase of 103%. Contribution of kava exports to Solomon Islands’ total exports is negligible. Refer to Graph 10 and Appendix 2, Table 9.
6. Samoa
Samoa provided data on the value of kava exports and imports for the period 2010 to 2020. The analysis shows that the data on imports and exports in Samoa are moving in opposite directions i.e. when imports increase, exports decline or vice versa. The reasons for this inverse relationship are not clear but may be the consequence of weather or biosecurity regulations. Contribution of kava imports to total imports and kava exports to total exports are negligible. Refer to Graph 11 and Appendix 2, Table 10.
7. Kiribati
Kiribati provided data on the quantity and value of kava imports for the period 2012 to 2020. The quantity and value of kava imports have similar trends. The sharp decline in the quantity imported by 69% and value of imports by 65% in 2016 compared to 2015 can be linked to lower production in the kava producing countries of Fiji and Vanuatu in 2015 due to Cyclone Pam. Kava imports in 2020 compared to 2012 saw the quantity increase by 11% but the value of imports increased by 374% due to a 328% increase in the price per tonne of kava imported. In 2020 compared to 2019, a 23% decline in the quantity imported, a 22% decline in the value imported but a 1% increase in the price per tonne was noted. In 2020, kava contributed 5% to Kiribati’s total
import, which was 4 percentage points more than in 2012 and 1 percentage point less than 2019. Refer to Graph 12 and Appendix 2, Table 11.
8. American Samoa
American Samoa provided data on the value of kava imports for the period 2010 to 2019. 2013 saw a 732% increase in the value of imports. Kava imports in 2019 compared to 2010 saw an 8% increase in the value of imports. In 2019 compared to 2018, a 19% decline in the value imported was noted. Contribution of kava imports to American Samoa’s total imports for all the years is less than 1%. Refer to Graph 13 and Appendix 2, Table 12.
0
1,000
2,000
3,000
4,00020
0520
0620
0720
0820
0920
1020
1120
1220
1320
1420
1520
1620
1720
1820
19
SBD
Years
Graph 10: Solomon Islands –Value of kava exports, 2005–2019
0
100,000
200,000
300,000
400,000
2010
2011
2012
2013
2014
2015
2016
2017
2018
2019
2020
SAT
Years
Graph 11: Samoa – Value of kava exports and imports, 2010–2020
Value of exports Value of imports
0
50
100
150
200
0
5,000,000
10,000,000
15,000,000
2012
2013
2014
2015
2016
2017
2018
2019
2020
Tonn
es
AUD
Year
Graph 12: Kiribati – Value and quantity of kava imports, 2012–2020
Value of imports Quantity imported
0
100,000
200,000
300,000
400,000
500,000
2010
2011
2012
2013
2014
2015
2016
2017
2018
2019
USD
Years
Graph 13: Value of kava imports from American Samoa, 2010–2019

Challenges in compiling statistics on kava Page 8 of 15
D. Conclusion Kava is an important source of cash income for kava producers in many countries in the region. Kava is reported to be a crop that provides a high rate of return to labour for growers, both those who serve domestic markets and those who maintain the high quality standards required to meet export demand and associated biosecurity conditions.
There are believed to be many opportunities for expanding kava production in the region, but as has been demonstrated in this paper, there is a lack of reliable and comprehensive data on production, domestic consumption and exports. Without such data it is difficult to build a strong investment case for either private sector or government intervention.
Many of the data gaps and issues around the lack of data needed to compile statistics on the kava industry have been highlighted in this paper, and are clearly visible in the data submitted by the countries that contributed to this study. Only Fiji was able to provide reasonable quality and coverage of data on kava from multiple sources, most other countries were only able to provide data from their IMTS trade statistics:
Tonga, FSM and Vanuatu submitted data on the quantity and value of kava exports; Solomon Islands submitted data on the value of kava exports; Samoa submitted data on the value of kava exports and imports; Kiribati submitted data on the quantity and value of kava imports, and; American Samoa submitted data on the value of kava imports.
Kava is consumed in most PICTs, either from domestic production, or in the case of most of the atoll nations from imports, but because the production is HH-based and the nature of trade informal, data on kava do not get fully captured. The contribution of kava to the economies of the region is not therefore truly reflected despite the fact that it is an important source of income and employment for many HHs and a foreign exchange earner for some countries. Several suggestions on the way forward to improve kava statistics have been made in this paper for NSOs to consider.
The paper also throws some light on the increase in the price of kava traded internationally and going by the retail price data provided by Fiji, the rising export prices influnce higher prices consumers also have to pay domestically. Although the volume of production has increased, the continued demand for kava from the growing number of Pacific migrants overseas will probably see prices escalating further.
In August 2021 it was reported that Australia was considering allowing kava to be grown domestically, a possibility that was causing concern to many, notably the Government of Vanuatu14, which saw this as a threat to growers across the Pacific region. Such concerns were somewhat allayed by Griffith Asia Institute in an October 2021 paper stating “Like some Australians, the sub-committee was not fully aware of the deep cultural and economic significance of drinking the ceremonial beverage of kava to the people of many Pacific island countries and their diaspora living in Australia. Members welcomed any moves to expand a regulated market in Australia for the safe consumption of kava and opening up to trade opportunities.15
Another interesting development was the signing of a memorandum of agreement between Fiji Kava and iTaukei Trust Fund Board to develop Fiji Kava’s supply chain and the relationship between commercial partners in Fiji.16
It is important that all countries involved in the kava trade act collectively to protect the industry in the face of any external challenges and for that all PICTs need to pay more attention to the compilation of data on kava and build a comprehensive picture of the industry and its importance to the economies of the region.
14https://www.rnz.co.nz/international/pacific-news/449662/commercial-production-of-kava-in-australia-will-badly-affect-vanuatu 15One region, one family, one report: Activating trade and investment between Australia and the Pacific islands region. 16https://www.fijivillage.com/news/-Kava-farmers-expected-to-benefit-from-MOU-signed-between-Fiji-Kava-and-iTaukei-Trust-Fund-Board-x5f48r/?fbclid=IwAR2oW45sZfYCLYyB9U5h2vrTP7Nkbre-4VdQ0SR1aGR5PUDMqtDouuK-0D8#.YWZ15Fa3qKY.facebook

Challenges in compiling statistics on kava Page 9 of 15
Appendix 1 – Classifications used for the compilation of data on kava Pacific Standard Industrial Classification of All Economic Activities (PACSIC) 2014
This is a regional classification of all productive activities undertaken in PICTs. Derived from the United Nations International Standard Industrial Classification of All Economic Activities Revision 4, PACSIC caters for capturing data of industries e.g. production of kava that are of significant economic importance to PICTs. Access the classification using the link https://www.spc.int/DigitalLibrary/Get/s4aid
Figure 1: Kava in PACSIC, 2014
Section A: Agriculture, forestry and fishing
DIVISION GROUP CLASS SUB-CLASS DESCRIPTION
01 CROP AND ANIMAL PRODUCTION, HUNTING AND RELATED SERVICE ACTIVITIES
0128 Growing of perennial and non-perennial spices, aromatic, drug and pharmaceutical crops
0128_01 Growing of ginger 0128_02 Growing of kava 0128_03 Growing of vanilla 0128_04 Growing of noni 0128_05 Growing of pyrethrum 0128_06 Growing of chilies 0128_07 Growing of betel nuts
0128_99 Growing of perennial and non-perennial spices, aromatic, drug and pharmaceutical crops n.e.c.
Classification of Individual Consumption According to Purpose (PACCOICOP) 2020
PACCOICOP 2020 is a regional classification of goods and services purchased by individuals and HHs in PICTs. It has been derived from the United Nations Classification of Individual Consumption According to Purpose 2018 to capture data on goods commonly consumed in PICTs. Access the classification using the link https://sdd.spc.int/news/2020/07/07/PACCOICOP-2020
Figure 2: Kava in PACCOICOP 2020
DIVISION GROUP CLASS SUB-CLASS DESCRIPTION TYPE 02 Alcoholic beverages, tobacco and narcotics 02.3 02.3.1 Narcotics (ND17) 02.3.1_087 Kava (also known as yaqona or sakau) 02.3.1_088 Marijuana, opium, cocaine and their derivatives 02.3.1_089 Cola nuts, betel nuts and betel leaves 02.3.1_090 Chemicals and man-made drugs
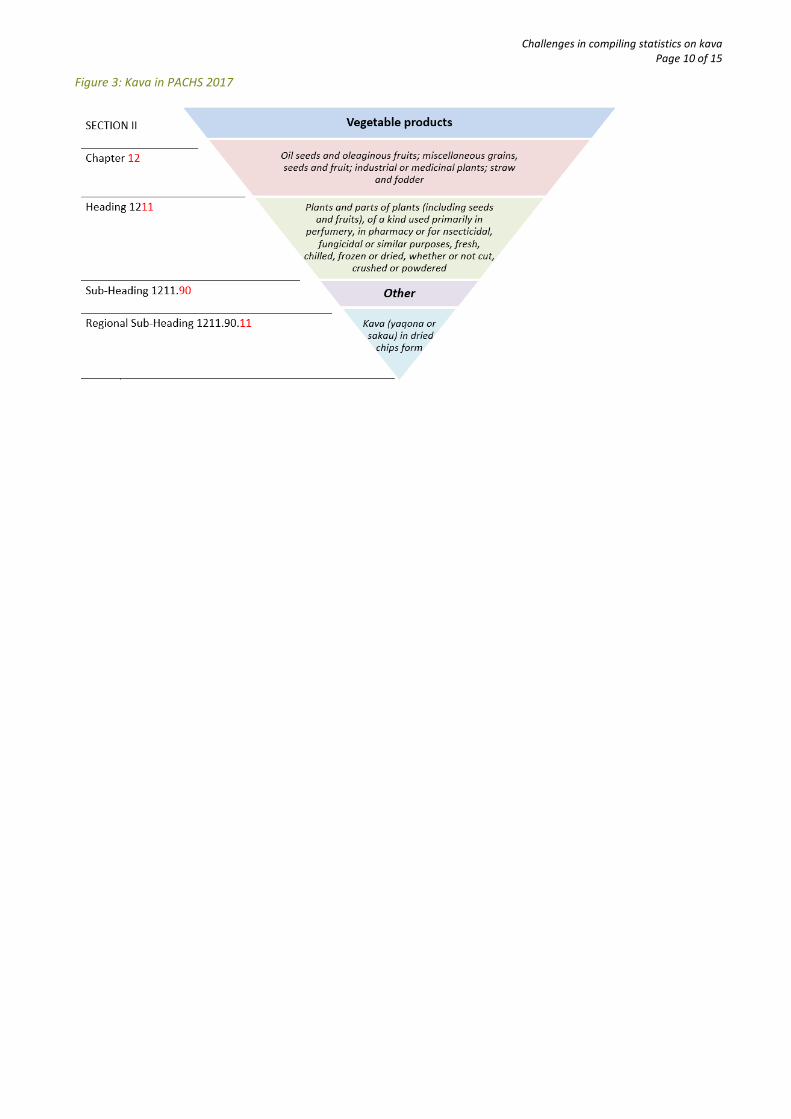
Pacific Harmonized Commodity Description and Coding System (PACHS) 2017
This is a regional classification of exports and imports of goods. It has been derived from the World Customs Organisation’s Harmonized Commodity Description and Coding System 2017. PACHS17 allows data on the exports and imports of goods specific to the Pacific e.g. kava be captured. Access the classification using the link https://sdd.spc.int/digital_library/pacific-harmonized-commodity-description-and-coding-system-2017-pachs17
17Non-durable
Challenges in compiling statistics on kava Page 10 of 15
Figure 3: Kava in PACHS 2017

Challenges in compiling statistics on kava Page 11 of 15
Appendix 2 – Data on kava Table 2: Fiji – Kava production and consumption, 2005–2019
Year
Quantity of production Farmgate price Value of production HH
consumption
Quantity (tonnes)
Variation: year on year (%)
FJD per kg Variation:
year on year (%)
Value (FJD)
Variation: year on year (%)
Value (FJD)
Variation: year on year
(%) 2005 2,259 15 33,885,000 40,000,006 2006 1,700 -25 25 66 42,330,000 25 36,200,000 -10 2007 3,350 97 28 11 92,460,000 118 75,600,000 109 2008 3,286 -2 28 0 90,365,000 -2 70,500,000 -7 2009 2,603 -21 27 -4 68,979,500 -24 55,800,000 -21 2010 2,792 7 25 -6 69,800,000 1 60,300,000 8 2011 2,227 -20 28 10 61,242,500 -12 131,900,000 119 2012 3,328 49 26 -6 85,696,000 40 128,600,000 -3 2013 3,733 12 26 0 96,124,750 12 135,200,000 5 2014 3,871 4 35 34 133,549,500 39 122,100,000 -10 2015 6,442 66 36 4 231,912,000 74 203,100,000 66 2016 7,595 18 80 122 607,600,000 162 596,500,000 194 2017 9,113 20 71 -11 649,301,250 7 770,300,000 29 2018 10,481 15 80 12 838,480,000 29 823,200,000 7 2019 11,742 12 95 19 1,115,490,000 33 1,060,400,000 29
Source: Fiji Bureau of Statistics and SPC
Table 3: Fiji – Kava imports, 2005–2019
Years
Imports
Quantity Value Price Total imports of all commodities
Quantity (tonnes)
Variation: year on year (%)
Value (FJD)
Variation in value: year on
year (%)
FJD per tonne
Variation: year on year (%)
Value (FJD)
Kava imports as a % of
total imports 2005 474 4,751,933 10,027 2,722,794,000 0.17 2006 521 10 8,970,226 89 17,202 72 3,124,342,000 0.29 2007 283 -46 5,819,920 -35 20,570 20 2,890,071,000 0.20 2008 220 -22 4,563,557 -22 20,712 1 3,601,404,000 0.13 2009 175 -21 3,165,834 -31 18,138 -12 3,022,159,000 0.10 2010 149 -14 2,672,960 -16 17,881 -1 3,464,614,000 0.08 2011 269 80 4,529,371 69 16,845 -6 3,913,571,000 0.12 2012 253 -6 4,603,213 2 18,170 8 4,030,678,000 0.11 2013 328 29 6,661,271 45 20,307 12 5,198,924,000 0.13 2014 140 -57 3,411,244 -49 24,427 20 5,012,583,000 0.07 2015 73 -48 2,284,381 -33 31,446 29 4,756,824,000 0.05 2016 94 30 3,698,935 62 39,240 25 4,820,066,303 0.08 2017 124 32 8,651,799 134 69,766 78 4,972,360,580 0.17 2018 170 37 15,239,178 76 89,694 29 5,696,683,662 0.27 2019 328 93 20,734,633 36 63,134 -30 6,008,529,782 0.35
Source: Fiji Bureau of Statistics and SPC

Challenges in compiling statistics on kava Page 12 of 15
Table 4: Fiji – Kava exports, 2005–2019
Years
Export
Quantity Value Price Total exports of all commodities
Quantity (tonnes)
Variation: year on year
(%)
Value (FJD)
Variation: year on year
(%)
FJD per tonne
Variation: year on year (%)
Value (FJD)
Kava exports as a % of total
exports 2005 123 2,553,666 20,826 1,192,579,000 0.21 2006 183 50 3,674,216 44 20,031 -4 1,201,573,000 0.31 2007 174 -5 4,153,246 13 23,847 19 1,209,811,000 0.34 2008 184 6 4,750,661 14 25,780 8 1,471,028,000 0.32 2009 224 22 4,180,686 -12 18,669 -28 1,310,259,000 0.32 2010 244 9 3,900,666 -7 16,015 -14 1,605,383,000 0.24 2011 296 21 5,700,409 46 19,288 20 1,924,848,000 0.30 2012 300 1 6,636,133 16 22,138 15 2,181,741,000 0.30 2013 137 -54 6,601,761 -1 48,025 117 2,119,726,000 0.31 2014 214 56 7,574,259 15 35,400 -26 2,302,158,000 0.33 2015 160 -25 8,864,530 17 55,346 56 2,059,222,000 0.43 2016 259 61 14,138,312 59 54,659 -1 1,930,859,146 0.73 2017 311 20 19,658,137 39 63,154 16 2,039,324,779 0.96 2018 284 -9 30,807,017 57 108,382 72 2,101,986,862 1.47 2019 328 16 32,454,630 5 98,835 -9 2,218,698,815 1.46
Source: Fiji Bureau of Statistics and SPC
Table 5: Fiji – Supply and use of kava, 2005–2019
Year Supply Use
Difference Production Imports Total Exports Consumption
FJD 2005 33,885,000 4,751,933 38,636,933 2,553,666 40,000,006 -3,916,739 2006 42,330,000 8,970,226 51,300,226 3,674,216 36,200,000 11,426,010 2007 92,460,000 5,819,920 98,279,920 4,153,246 75,600,000 18,526,674 2008 90,365,000 4,563,557 94,928,557 4,750,661 70,500,000 19,677,896 2009 68,979,500 3,165,834 72,145,334 4,180,686 55,800,000 12,164,648 2010 69,800,000 2,672,960 72,472,960 3,900,666 60,300,000 8,272,294 2011 61,242,500 4,529,371 65,771,871 5,700,409 131,900,000 -71,828,538 2012 85,696,000 4,603,213 90,299,213 6,636,133 128,600,000 -44,936,920 2013 96,124,750 6,661,271 102,786,021 6,601,761 135,200,000 -39,015,740 2014 133,549,500 3,411,244 136,960,744 7,574,259 122,100,000 7,286,485 2015 231,912,000 2,284,381 234,196,381 8,864,530 203,100,000 22,231,851 2016 607,600,000 3,698,935 611,298,935 14,138,312 596,500,000 660,623 2017 649,301,250 8,651,799 657,953,049 19,658,137 770,300,000 -132,005,088 2018 838,480,000 15,239,178 853,719,178 30,807,017 823,200,000 -287,839 2019 1,115,490,000 20,734,633 1,136,224,633 32,454,630 1,060,400,000 43,370,003
Source: Fiji Bureau of Statistics and SPC Note: Due to confidentiality reasons, Fiji generally does not publish its SUT. What appears as the difference in this table comprises change in inventories, intermediate consumption etc in Fiji’s fully balanced SUT.
Challenges in compiling statistics on kava Page 13 of 15
Table 6: Tonga – Kava exports, 2012–2020
Year
Exports
Quantity Value Price Total exports of all commodities
Quantity (tonnes)
Variation: year on year
(%)
Value (TOP)
Variation: year on year
(%)
TOP per tonne
Variation: year on year
(%)
Value (TOP)
Kava exports as a % of total
exports 2012 118 2,021,143 17,164 26,757,196 8 2013 69 -41 2,078,618 3 30,027 75 30,429,410 7 2014 123 78 2,388,235 15 19,394 -35 35,005,767 7 2015 116 -5 6,628,562 178 56,904 193 37,274,276 18 2016 92 -21 4,215,267 -36 45,770 -20 47,540,446 9 2017 33 -64 1,640,747 -61 50,000 9 41,617,401 4 2018 77 133 3,831,014 133 50,000 0 29,019,928 13 2019 113 48 5,651,701 48 50,000 0 46,368,718 12 2020 211 87 9,965,306 76 47,183 -6 35,401,084 28
Source: Tonga Statistics Department
Table 7: Federated States of Micronesia – Kava exports, 2011–2018
Year
Exports
Quantity Value Price Total exports of all commodities
Quantity (tonnes)
Variation: year on year
(%)
Value (USD)
Variation: year on year
(%)
USD per tonne
Variation: year on year
(%)
Value (USD)
Kava exports as a % of total
exports 2011 33 218,480 6,672 43,470,832 1 2012 45 38 481,637 120 10,626 59 52,233,130 1 2013 42 -7 451,426 -6 10,743 1 34,859,000 1 2014 64 53 701,547 55 10,946 2 32,140,811 2 2015 73 14 801,436 14 10,987 0 39,574,796 2 2016 75 3 826,993 3 10,996 0 48,724,634 2 2017 63 -17 827,655 0 13,197 20 45,980,591 2 2018 51 -18 674,352 -19 13,177 0 46,770,141 1
Source: FSM Division of Statistics, Department of Resources and Development Table 8: Vanuatu – Kava exports, 2012–2019
Year
Exports
Quantity Value Price Total exports of all commodities
Quantity (tonnes)
Variation: year on year
(%)
Value (VUV)
Variation: year on year (%)
VUV per tonne
Variation: year on year (%)
Value (VUV)
Kava exports as a % of total
exports 2012 643 418,000,000 650,078 3,698,000,000 11 2013 819 27 810,000,000 94 989,011 52 3,811,000,000 21 2014 786 -4 728,000,000 -10 926,209 -6 5,692,000,000 13 2015 158 -80 69,000,000 -91 436,709 -53 4,249,000,000 2 2016 1,052 566 1,060,000,000 1,436 1,007,605 131 5,292,302,421 20 2017 1,150 9 1,277,000,000 20 1,110,435 10 6,363,000,000 20 2018 811 -29 2,513,000,000 97 3,098,644 179 6,760,658,166 37 2019 877 8 2,970,000,000 18 3,386,545 9 6,408,192,958 46 2020 774 -12 2,601,483,150 -12 3,361,089 -1 5,306,530,902 49
Source: Vanuatu National Statistics Office

Challenges in compiling statistics on kava Page 14 of 15
Table 9: Solomon Islands – Kava exports, 2005–2019
Year
Exports Value Total exports of all commodities
Value (SBD)
Variation in value: year on year (%)
Value (SBD)
Kava exports as a % of total exports
2005 3 753,128,682 0.0000 2006 49 1,329 901,792,486 0.0000 2007 989 1,918 1,211,799,738 0.0001 2008 2,156 118 1,640,568,754 0.0001 2009 1,053 -51 1,286,715,241 0.0001 2010 3,810 262 1,761,494,784 0.0002 2011 3,322 -13 3,115,703,109 0.0001 2012 1,674 -50 3,429,967,897 0.0000 2013 706 -58 3,571,799,812 0.0000 2014 751 6 3,377,790,668 0.0000 2015 305 -59 3,176,069,000 0.0000 2016 1,541 405 3,470,468,770 0.0000 2017 473 -69 3,934,778,638 0.0000 2018 1,913 304 4,531,495,085 0.0000 2019 3,880 103 1,106,326,242 0.0004
Source: Solomon Islands National Statistics Office
Table 10: Samoa – Kava exports and imports, 2010–2020
Year
Exports Imports
Value Total exports of all commodities Value Total imports of all commodities
Value (SAT)
Variation: year on year
(%)
Value (SAT)
Kava exports as a % of
total exports
Value (SAT)
Variation: year on year (%)
Value (SAT)
Kava imports as a % of total
imports 2010 2,970 179,093,984 0.00 20,034 786,362,000 0.00 2011 28,810 870 153,111,162 0.02 7,567 -62 805,751,718 0.00 2012 7,900 -73 176,427,618 0.00 26,865 255 791,973,802 0.00 2013 580 -93 144,103,200 0.00 147,420 449 851,292,154 0.02 2014 519 -11 117,400,172 0.00 198,462 35 895,325,981 0.02 2015 420 -19 136,017,840 0.00 126,895 -36 855,389,663 0.01 2016 876 109 143,755,166 0.00 180,016 42 899,005,000 0.02 2017 62,967 7,088 112,215,339 0.06 17,305 -90 900,997,000 0.00 2018 226,423 260 119,204,456 0.19 6,103 -65 939,443,298 0.00 2019 336,002 48 130,097,446 0.26 17,855 193 1,031,312,647 0.00 2020 179,580 -47 99,340,000 0.18 77,187 332 828,649,702 0.01
Source: Samoa Bureau of Statistics
Table 11: Kiribati – Kava imports, 2012–2020
Year
Imports Quantity Value Price Total imports of all commodities
Quantity (tonnes)
Variation: year on year
(%)
Value (AUD)
Variation in value: year on year (%)
AUD per tonne
Variation: year on year (%)
Value (AUD)
Kava imports as a % of total
imports 2012 117 1,984,257 16,921 135,133,000 1 2013 110 -6 2,484,826 25 22,661 34 141,857,785 2 2014 110 0 2,797,375 13 25,437 12 147,922,499 2 2015 119 8 3,056,097 9 25,683 1 155,448,160 2 2016 37 -69 1,079,653 -65 28,895 13 184,166,367 1 2017 90 142 4,799,449 345 53,073 84 171,027,798 3 2018 103 14 6,895,259 44 67,049 26 162,638,855 4 2019 169 65 12,102,265 76 71,427 7 189,348,691 6 2020 130 -23 9,411,207 -22 72,344 1 192,937,151 5
Source: National Statistics Office

Challenges in compiling statistics on kava Page 15 of 15
Table 12: American Samoa – Kava imports, 2010–2019
Year
Imports Value Total imports of all commodities
Value (USD)
Variation: year on year (%)
Value (USD)
Kava imports as a % of total
imports 2010 50,295 433,870,868 0.01 2011 33,949 -33 463,240,279 0.01 2012 54,058 59 514,310,359 0.01 2013 449,814 732 478,543,309 0.09 2014 102,215 -77 611,070,028 0.02 2015 95,625 -6 675,394,554 0.01 2016 72,479 -24 654,763,945 0.01 2017 32,366 -55 578,661,000 0.01 2018 67,034 107 653,344,000 0.01 2019 54,179 -19 711,567,000 0.01
Source: American Samoa Department of Commerce