information document to support main motions … · f. sp. pini hepting; fusarium subglutinans...
TRANSCRIPT

International Seed Testing Association Secretariat, Zürichstrasse 50, CH-8303 Bassersdorf, Switzerland Phone: +41 44 838 60 00 Fax: +41 44 838 60 01 Email: [email protected] - http://www.seedtest.org
Document OGM14-06
INFORMATION DOCUMENT TO SUPPORT MAIN MOTIONS PRESENTED IN DOCUMENT ‘OM14-05 RULES PROPOSALS FOR THE INTERNATIONAL RULES FOR SEED TESTING 2015 EDITION’
OGM14-06 Method Validation Reports for ISTA Rules 2015.docx 2014-04-15 12:30 Approved by ECOM and RUL Decision No. 853 2014-02-10 Page 1/50
Method Validation Reports on Rules Proposals for the International Rules for Seed Testing 2015 Edition Contents Diagnostic protocol 7/91 for Gibberella circinata on Pinus spp. (pine) and Pseudotsuga
menziesii (Douglas-fir) seed 2
Proposal for replacement of mCS20ABN and FS media recipes in ISTA Rule 7-019a (Xanthomonas campestris pv. campestris detection in Brassica spp. seed lots) by adapted versions 15
Validation of a new method for the detection of Acidovorax valerianellae on Corn salad (Valerianella locusta) 21
Proposal for the addition of Cicer arietinum (Kabuli type) as a species to which the conductivity test for seed vigour can be applied 33
Early counts of radicle emergence as a vigour test for oil seed rape 42

ISTA Method Validation Reports Diagnostic protocol for Gibberella circinata
OGM14-06 Method Validation Reports for ISTA Rules 2015.docx 2014-04-15 12:30 Approved by ECOM and RUL Decision No. 853 2014-02-10 Page 2/50
Diagnostic protocol 7/91 for Gibberella circinata on Pinus spp. (pine) and Pseudotsuga menziesii (Douglas-fir) seed From the Bulletin of the European and Mediterranean Plant Protection Organization (2009): Bulletin OEPP/EPPO Bulletin 39, 298–309 © 2009 OEPP/EPPO
European and Mediterranean Plant Protection Organization PM 7/91 (1)
Organisation Europeenne et Mediterraneenne pour la Protection des Plantes
Diagnostics
Diagnostic
Gibberella circinata
Specific scope
This standard describes a diagnostic protocol for Gibberella
circinata1.
1Use of brand names of chemicals or equipment in these EPPO Standards
implies no approval of them to the exclusion of others that may also be
suitable.
298
Specific approval and amendment
Approved in 2009–09.
Introduction
Gibberella circinata is the causal agent of pitch canker disease.
The disease almost exclusively affects Pinus sp., but was also
described on Douglas-fir (Pseudotsuga menziesii). This disease is
a serious threat to the pine forests wherever it occurs (especially
on plantations of Pinus radiata), due to extensive tree mortality,
reduced growth and timber quality. Multiple branch infection may
cause severe crown dieback and eventually lead to the death of the
tree. This aggressive fungus may also cryptically infect the Pinus
seeds and may cause damping-off in seedlings. Conifer seeds can
be colonized by G. circinata internally (where it can remain dor-
mant until seed germination) and externally (Storer et al., 1998).
Fusarium circinatum, anamorph of G. circinata, is predomi-
nantely a wound pathogen and enters the host tree through
mechanical wounds or feeding holes caused by woodboring
insects. The fungus may move from tree to tree by aerial disper-
sion of the conidiospores or through vectoring by feeding insects
(Gordon et al., 2001; Schweigkofler et al., 2004). However,
long-range dispersal of the pathogen from affected areas to dis-
ease-free areas may be driven by infected seed movement and
movement of infected plant material (Storer et al., 1998).
The fungus is officially reported in the USA, Mexico, Haiti,
South Africa, Japan, Chile (OEPP ⁄ EPPO, 2005) and has been
officially reported in the EPPO region only recently: Spain (Lan-
deras et al., 2005; under eradication), Italy (Carlucci et al., 2007
eradicated), France (OEPP ⁄ EPPO, 2008 under eradication). In
most instances of introduction into new areas the pest was first
found in nurseries.
The fungus has gone through a number of anamorph name
changes, with the same teleomorph Gibberella fujikuroi. Origi-
nally described as Fusarium lateritium f. sp. pini (Snyder et al.,
1949), it was successively renamed Fusarium moniliforme
f. sp. subglutinans (Kuhlman et al., 1978), F. subglutinans f. sp.
pini, ‘H’ mating population (Correll et al., 1991, 1992) and was
finally ranked at the species level as F. circinatum, with a new
teleomorph recognition: G. circinata (Nirenberg & O’Donnell,
1998). The G. fujikuroi sp. complex encompasses at least 36 ana-
morphic Fusarium sp. (O’Donnell et al., 1998), from which the
new species G. circinata is now excluded. Numerous Fusarium
sp. residing in this complex, already fully described or still poorly
documented, are morphologically similar and identification may
require several techniques to be undertaken. In particular, Steenk-
amp et al. (1999) report that some of the distinguishing morpho-
logical characters may be inadequate or insufficient to make a
definite identification of F. circinatum (Nirenberg & O’Donnell,
1998).
Although an official ISTA method was published in 2002 to
detect F. moniliforme f. sp. subglutinans in seeds of Pinus taeda
and Pinus elliotii (ISTA, 2002), the latter is not recommended as
the morphological features indicated as typical for F. monili-
forme f. sp. subglutinans in this method are based on a substrate
not showing the characteristic sterile hyphae of this pathogen and
are not sufficient to ensure a reliable identification of F. circina-
tum Nirenberg & O’Donnell (anamorphic stage of G. circinata).
Identity
Name: Gibberella circinata Nirenberg & O’Donnell
Anamorph: Fusarium circinatum Nirenberg & O’Donnell
Synonyms: Fusarium subglutinans f. sp. pini Hepting; F. mon-
iliforme Sheldon var. subglutinans Wollenweber F. lateritium
ª 2009 OEPP/EPPO, Bulletin OEPP/EPPO Bulletin 39, 298–309
Gibberella circinata 299
f. sp. pini Hepting; Fusarium subglutinans (Wollenweber &
Reinking) Nelson et al. f. sp. pini Correll et al.
Taxonomic position: Fungi: Ascomycota: Hypocreales: Nectri-
aceae
Notes on taxonomy and nomenclature: For many years, the
pitch canker pathogen was known only as an anamorph (form or
pathotype of F. subglutinans; Correll et al., 1991). Since its tele-
omorph was discovered following in vitro crosses, it is known as
G. circinata (Nirenberg & O’Donnell, 1998). However, since
only the anamorphic form of G. circinata will be observed in
pure culture after isolation, F. circinatum will consistently be
used in the morphological descriptions throughout this protocol.
EPPO code: GIBBCI
Phytosanitary categorization: EPPO A1 list no. 306.
Detection
Symptoms
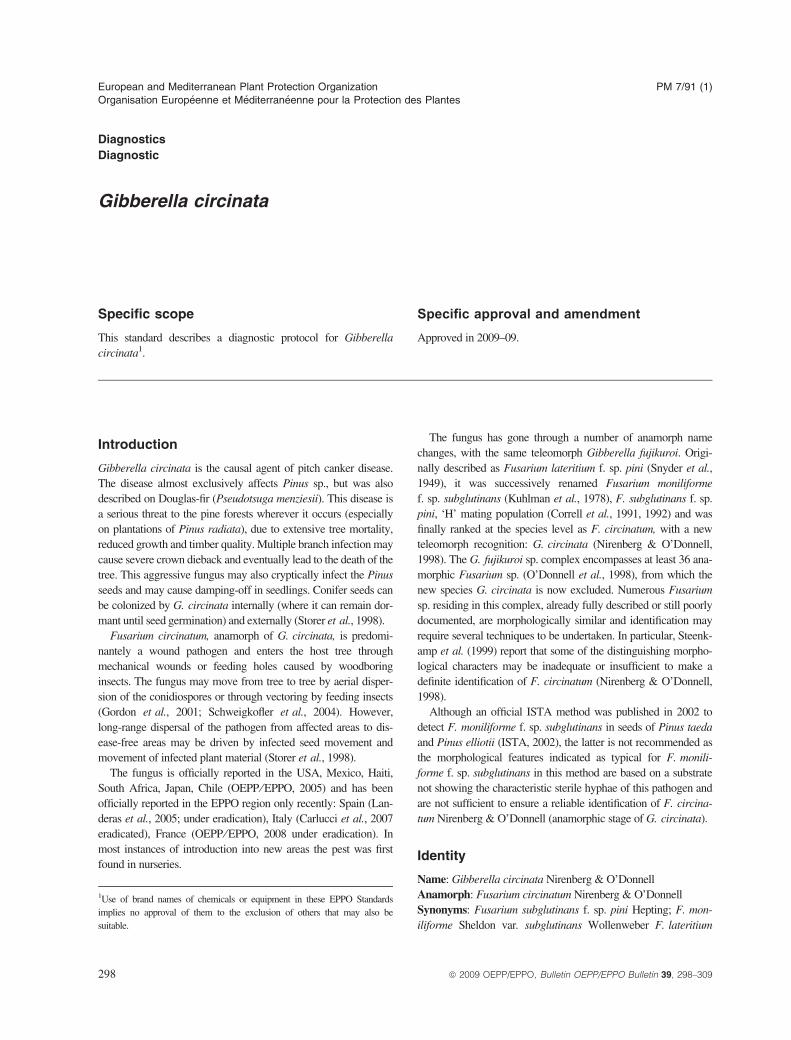
The fungus causes cankers that girdle branches, aerial roots and
even trunks of Pinus sp., often associated with conspicuous and
sometimes spectacular resin exudates (‘pitch’) in response to the
fungal infection (Fig. 1A,B). Gibberella circinata may also be
soil-borne, and can infect seeds cryptically (Storer et al., 1998).
The fungus can also cause root rot (Coutinho et al., 1997). Symp-
toms may be observed at any time of the year.
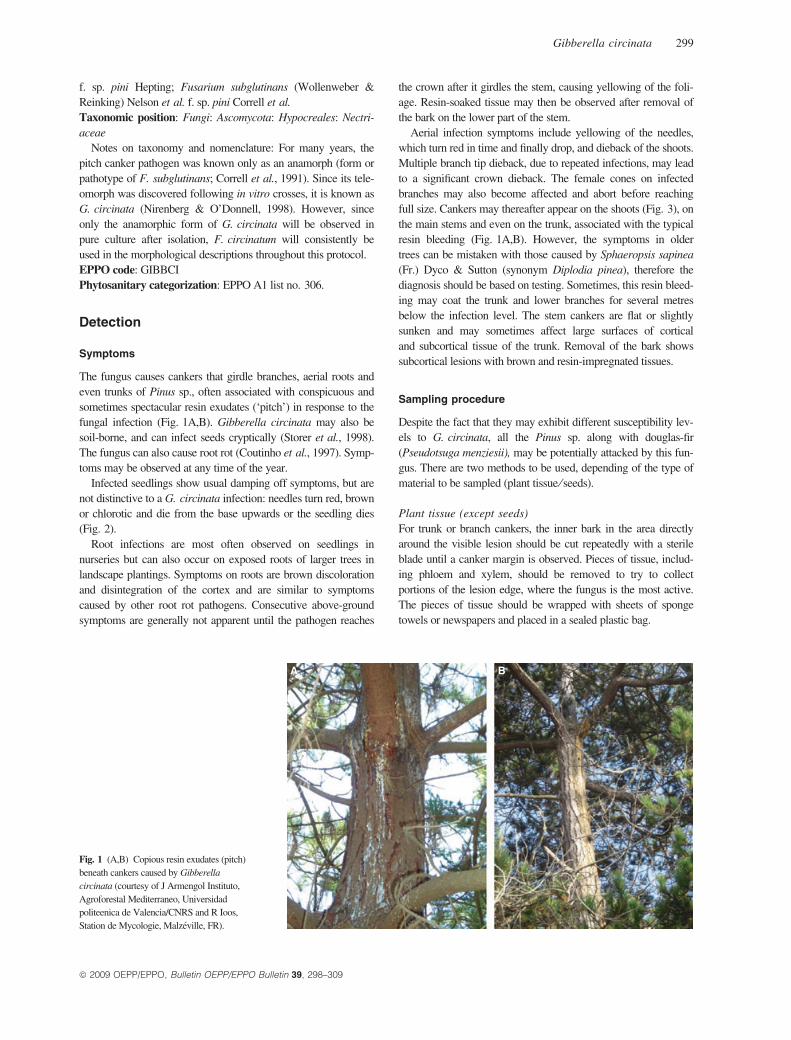
Infected seedlings show usual damping off symptoms, but are
not distinctive to a G. circinata infection: needles turn red, brown
or chlorotic and die from the base upwards or the seedling dies
(Fig. 2).
Root infections are most often observed on seedlings in
nurseries but can also occur on exposed roots of larger trees in
landscape plantings. Symptoms on roots are brown discoloration
and disintegration of the cortex and are similar to symptoms
caused by other root rot pathogens. Consecutive above-ground
symptoms are generally not apparent until the pathogen reaches
A
Fig. 1 (A,B) Copious resin exudates (pitch)
beneath cankers caused by Gibberella
circinata (courtesy of J Armengol Instituto,
Agroforestal Mediterraneo, Universidad
politeenica de Valencia/CNRS and R Ioos,
Station de Mycologie, Malzeville, FR).
ª 2009 OEPP/EPPO, Bulletin OEPP/EPPO Bulletin 39, 298–309
the crown after it girdles the stem, causing yellowing of the foli-
age. Resin-soaked tissue may then be observed after removal of
the bark on the lower part of the stem.
Aerial infection symptoms include yellowing of the needles,
which turn red in time and finally drop, and dieback of the shoots.
Multiple branch tip dieback, due to repeated infections, may lead
to a significant crown dieback. The female cones on infected
branches may also become affected and abort before reaching
full size. Cankers may thereafter appear on the shoots (Fig. 3), on
the main stems and even on the trunk, associated with the typical
resin bleeding (Fig. 1A,B). However, the symptoms in older
trees can be mistaken with those caused by Sphaeropsis sapinea
(Fr.) Dyco & Sutton (synonym Diplodia pinea), therefore the
diagnosis should be based on testing. Sometimes, this resin bleed-
ing may coat the trunk and lower branches for several metres
below the infection level. The stem cankers are flat or slightly
sunken and may sometimes affect large surfaces of cortical
and subcortical tissue of the trunk. Removal of the bark shows
subcortical lesions with brown and resin-impregnated tissues.
Sampling procedure
Despite the fact that they may exhibit different susceptibility lev-
els to G. circinata, all the Pinus sp. along with douglas-fir
(Pseudotsuga menziesii), may be potentially attacked by this fun-
gus. There are two methods to be used, depending of the type of
material to be sampled (plant tissue ⁄ seeds).
Plant tissue (except seeds)
For trunk or branch cankers, the inner bark in the area directly
around the visible lesion should be cut repeatedly with a sterile
blade until a canker margin is observed. Pieces of tissue, includ-
ing phloem and xylem, should be removed to try to collect
portions of the lesion edge, where the fungus is the most active.
The pieces of tissue should be wrapped with sheets of sponge
towels or newspapers and placed in a sealed plastic bag.
B
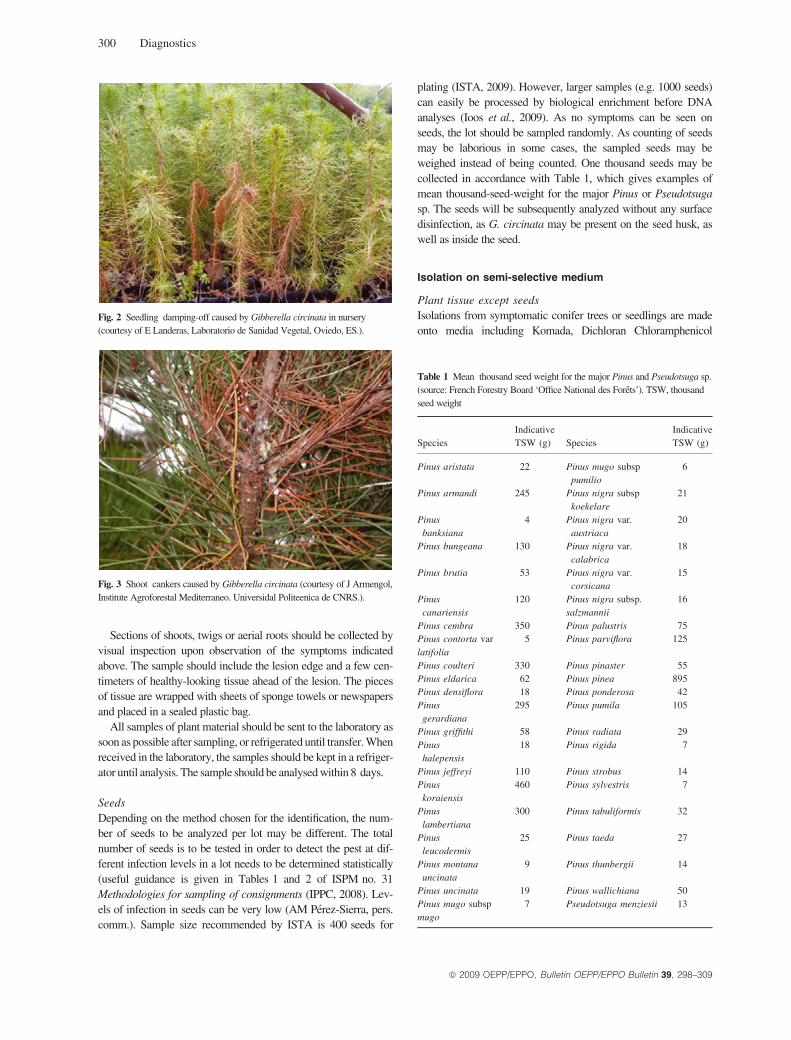
Table 1 Mean thousand seed weight for the major Pinus and Pseudotsuga sp.
(source: French Forestry Board ‘Office National des Forets’). TSW, thousand
seed weight
Species
Indicative
TSW (g) Species
Indicative
TSW (g)
Pinus aristata 22 Pinus mugo subsp
pumilio
6
Pinus armandi 245 Pinus nigra subsp
koekelare
21
Pinus
banksiana
4 Pinus nigra var.
austriaca
20
Pinus bungeana 130 Pinus nigra var.
calabrica
18
Pinus brutia 53 Pinus nigra var.
corsicana
15
Pinus
canariensis
120 Pinus nigra subsp.
salzmannii
16
Pinus cembra 350 Pinus palustris 75
Pinus contorta var
latifolia
5 Pinus parviflora 125
Pinus coulteri 330 Pinus pinaster 55
Pinus eldarica 62 Pinus pinea 895
Pinus densiflora 18 Pinus ponderosa 42
Pinus
gerardiana
295 Pinus pumila 105
Pinus griffithi 58 Pinus radiata 29
Pinus
halepensis
18 Pinus rigida 7
Pinus jeffreyi 110 Pinus strobus 14
Pinus
koraiensis
460 Pinus sylvestris 7
Pinus
lambertiana
300 Pinus tabuliformis 32
Pinus
leucodermis
25 Pinus taeda 27
Pinus montana
uncinata
9 Pinus thunbergii 14
Pinus uncinata 19 Pinus wallichiana 50
Pinus mugo subsp
mugo
7 Pseudotsuga menziesii 13
Fig. 2 Seedling damping-off caused by Gibberella circinata in nursery
(courtesy of E Landeras, Laboratorio de Sanidad Vegetal, Oviedo, ES.).
Fig. 3 Shoot cankers caused by Gibberella circinata (courtesy of J Armengol,
Institute Agroforestal Mediterraneo. Universidal Politeenica de CNRS.).
300 Diagnostics
Sections of shoots, twigs or aerial roots should be collected by
visual inspection upon observation of the symptoms indicated
above. The sample should include the lesion edge and a few cen-
timeters of healthy-looking tissue ahead of the lesion. The pieces
of tissue are wrapped with sheets of sponge towels or newspapers
and placed in a sealed plastic bag.
All samples of plant material should be sent to the laboratory as
soon as possible after sampling, or refrigerated until transfer. When
received in the laboratory, the samples should be kept in a refriger-
ator until analysis. The sample should be analysed within 8 days.
Seeds
Depending on the method chosen for the identification, the num-
ber of seeds to be analyzed per lot may be different. The total
number of seeds is to be tested in order to detect the pest at dif-
ferent infection levels in a lot needs to be determined statistically
(useful guidance is given in Tables 1 and 2 of ISPM no. 31
Methodologies for sampling of consignments (IPPC, 2008). Lev-
els of infection in seeds can be very low (AM Perez-Sierra, pers.
comm.). Sample size recommended by ISTA is 400 seeds for
plating (ISTA, 2009). However, larger samples (e.g. 1000 seeds)
can easily be processed by biological enrichment before DNA
analyses (Ioos et al., 2009). As no symptoms can be seen on
seeds, the lot should be sampled randomly. As counting of seeds
may be laborious in some cases, the sampled seeds may be
weighed instead of being counted. One thousand seeds may be
collected in accordance with Table 1, which gives examples of
mean thousand-seed-weight for the major Pinus or Pseudotsuga
sp. The seeds will be subsequently analyzed without any surface
disinfection, as G. circinata may be present on the seed husk, as
well as inside the seed.
Isolation on semi-selective medium
Plant tissue except seeds
Isolations from symptomatic conifer trees or seedlings are made
onto media including Komada, Dichloran Chloramphenicol
ª 2009 OEPP/EPPO, Bulletin OEPP/EPPO Bulletin 39, 298–309

Table 2 Sequence and target of the PCR primers and probes combinations
Primer
Sequence
(5¢-3¢)Size
(bp) Target Reference
H3-1a ACT AAG CAG ACC GCC CGC AGG ca 520 Histone H3 gene Steenkamp et al. (1999)
H3-1b* GCG GGC GAG CTG GAT GTC CTT
CIRC1A CTT GGC TCG AGA AGG G 360 IGS rDNA region Schweigkofler et al. (2004)
CIRC4A* ACC TAC CCT ACA CCT CTC ACT
FCIR-F TCG ATG TGT CGT CTC TGG AC 146 IGS rDNA region Ioos et al. (2009)
FCIR-R* CGA TCC TCA AAT CGA CCA AGA
FCIR-P FAM-CGA GTC TGG CGG GAC TTT GTG C-BHQ1
ITS1 TCC GTA GGT GAA CCT GCG G ca 580 ITS rDNA region White et al. (1990)
ITS4* TCC TCC GCT TAT TGA TAT GC
18S uni-F GCA AGG CTG AAA CTT AAA GGA A 150 18S rDNA Ioos et al. (2009)
18S
uni-R*
CCA CCA CCC ATA GAA TCA AGA
18S uni-P JOE-ACG GAA GGG CAC CAC CAG GAG T-BHQ1
*reverse primers.
Fig. 4 Sub cortical necrosis caused by Gibberella circinata beneath a canker
observed on a stem (courtesy of E Landeras, Laboratorio de Sanidad Vegetal,
Oviedo, ES).
Gibberella circinata 301
Peptone Agar (DCPA) or onto Potato dextrose agar supple-
mented with streptomycin sulphate (PDAS) (see Appendix 1).
Plant material should be surface-sterilized for up to 1 min in a
1.5% solution of sodium hypochlorite, and rinsed in sterile dis-
tilled water to eliminate saprophytic organisms from the plant
material which would otherwise overgrow any Fusarium. On
seedlings the pathogen is isolated from the lower part of the stem
and from the roots. On mature trees, isolations are made from
cankers. The cankers are washed thoroughly with water, and iso-
lations are made from wood-chips taken from the edge of the
lesion found beneath the affected bark (Fig. 4). During incuba-
tion, the plates are observed periodically and all the Fusarium
spp. colonies are transferred to Potato dextrose agar (PDA) and
to Spezieller-Nahrstoffarmer Agar (SNA) (Appendix 1) for mor-
phological identification. This method is very efficient and reli-
able to isolate any Fusarium spp. from infected tissue and does
not require expensive equipment. However, the correct morpho-
logical identification of F. circinatum in pure culture requires
experience and a molecular confirmation should be carried out in
case of uncertainty.
Seeds
Seeds are directly plated onto Fusarium semi-selective media
(e.g. Komada’s medium. DCPA medium see Appendix 1) with-
out previous surface disinfection. Plates are incubated at room
temperature (22 ± 6�C). During incubation, the plates are
observed periodically and all the Fusarium spp. colonies are
transferred to Potato dextrose agar (PDA) and to Spezieller-
Nahrstoffarmer Agar (SNA) (Appendix 1) for morphological
identification. This method is efficient and reliable to isolate any
Fusarium spp. from the seeds and does not require expensive
equipment, though time- and space-consuming when serial analy-
ses are conducted. However, the correct morphological identifica-
tion of F. circinatum in pure culture requires experience and in
case of uncertainty a molecular confirmation should be carried
out. In addition, Storer et al. (1998) have demonstrated that agar
ª 2009 OEPP/EPPO, Bulletin OEPP/EPPO Bulletin 39, 298–309
plating of pine seeds may not be able to detect dormant (quies-
cent) propagules of F. circinatum, thus leading to an unknown
risk of false negative results.
Direct detection in planta using molecular techniques
(plant tissue, including seeds)
See Identification section for description. These methods are fast,
efficient and reliable in detecting G. circinata specifically, with-
out previous agar plating, thus saving a lot of space and time, but
require molecular biology facilities and instruments. In addition,
as these techniques target the DNA of the fungus, active and qui-
escent forms of the pathogen should be equally detected. How-
ever, positive conventional PCR requires confirmation as cross-
reaction with phylogenetically closely related species might occur
and lead to false positive results.

Plant sample/Seed sample
Isolation followedby morphological
identification
DNA extraction fromsymptomatic tissues orfrom seeds followingbiological enrichment
(Appendix 3)
PCR/SyBr green real-time PCR(Appendix 4)
Negative:no G. circinata
present *
Real-time PCR(Appendix 6)
Positive:G. circinata
present
Positive Negative:no G. circinata
present
Confirmation by one of the following methods:•Isolation followed by morphological identification•Melting curve analysis
Negative:no G. circinata
present
Positive:G. circinata
present
In case of uncertainty, confirmation is recommended by one of the following molecular methods on the pure culture:
(Appendix 4)•IGS amplicon sequencing (Appendix 5)•Real-time PCR (Appendix 6)
•PCR-RFLP of H3 gene (Appendix 2)•PCR/SyBr green real-time PCR (Appendix 4)•IGS amplicon sequencing (Appendix 5)•Real-time PCR (Appendix 6)
Positive:G. circinata
present
Negative:no G. circinata
present *
Positive:G. circinata
present
Negative:no G. circinata
present
* It is reported in the literature that G. circinatamay sometimes be present in a quiescentform which can not be detected by isolation.Therefore, the absence of G. circinata can notbe ascertained by isolation.be
Fig. 5 Flow diagram for diagnosis of Gibberella circinata on plant tissue and on seeds.
302 Diagnostics
Identification
The procedures for the identification of G. circinata on Pinus
spp. and Pseudotsuga menziesii will consist of (i) isolating the
fungus from the plant tissue on semi-selective culture media fol-
lowed by morphological and, in the case of uncertainty, molecu-
lar identification, or (ii) directly detecting the fungus in planta by
conventional PCR, SyBr green real-time PCR or dual-labelled
probe real-time PCR. A flow diagram indicating the different
combinations of methods is shown in Fig. 5.
Fig. 6 Cultural aspect of the anamorphic stage of Gibberella. circinata
(F. circinatum) on potato dextrose agar (left: Fusarium circinatum MAT-1;
right: Fusarium circinatum MAT-2). MAT-1 mating type produces typical
coiled sterile hyphae on Spezieller-Nahrstoffarmer Agar (SNA), whereas
MAT-2 mating type produces not distinctively coiled or even uncoiled sterile
hyphae (courtesy of A. Perez-Sierra, Instituto Agroforestal Mediterraneo,
Universidad Politecnica de Valencia (ES)) (see also Fig. 9A,B).
Morphological characteristics in pure culture
For morphological identification, the isolates are grown on PDA
to study colony morphology and pigmentation, and on SNA
(Appendix 1) to study formation and type of microconidia and
conidiogenous cells. SNA and PDA plates are incubated at room
temperature. All isolates are examined after 10 days and con-
firmed as F. circinatum based on the morphological features
described by Nirenberg & O’Donnell (1998) and Britz et al.
(2002). On PDA, F. circinatum grows relatively rapidly (average
growth of 4.7 mm ⁄day at 20�C; Nirenberg & O’Donnell, 1998).
After 10 days, the colony should have an entire margin, white
ª 2009 OEPP/EPPO, Bulletin OEPP/EPPO Bulletin 39, 298–309
A
B
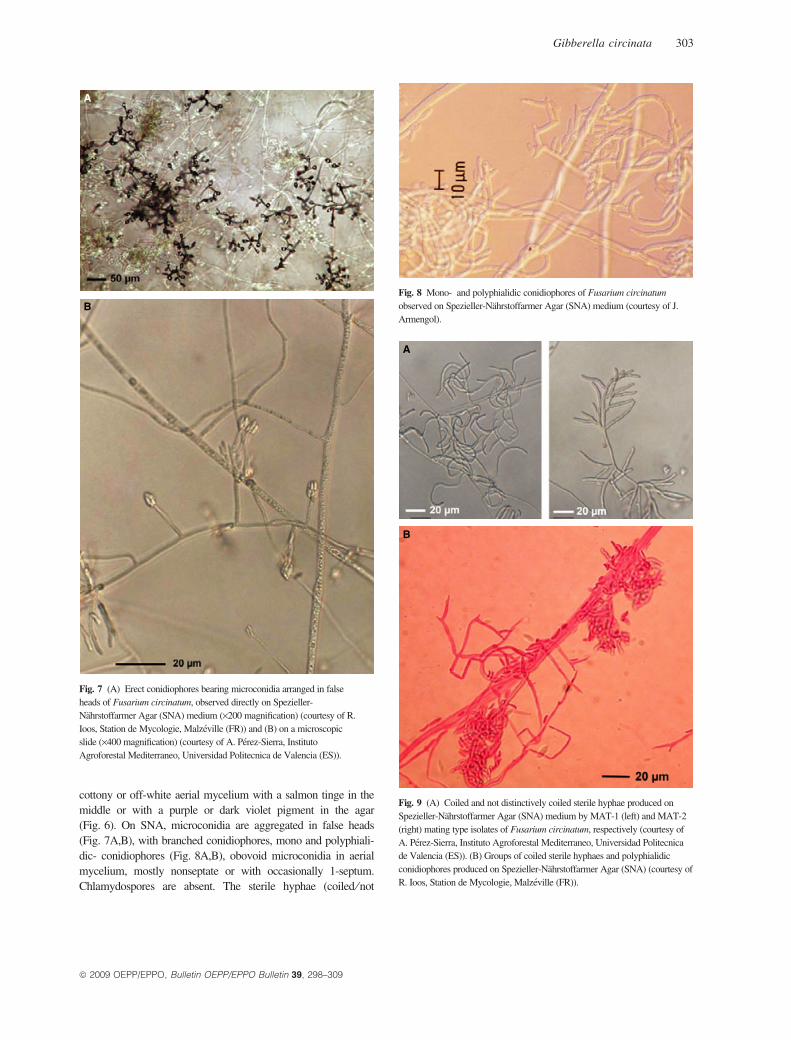
Fig. 7 (A) Erect conidiophores bearing microconidia arranged in false
heads of Fusarium circinatum, observed directly on Spezieller-
Nahrstoffarmer Agar (SNA) medium (·200 magnification) (courtesy of R.
Ioos, Station de Mycologie, Malzeville (FR)) and (B) on a microscopic
slide (·400 magnification) (courtesy of A. Perez-Sierra, Instituto
Agroforestal Mediterraneo, Universidad Politecnica de Valencia (ES)).
A
B
Fig. 9 (A) Coiled and not distinctively coiled sterile hyphae produced on
Spezieller-Nahrstoffarmer Agar (SNA) medium by MAT-1 (left) and MAT-2
(right) mating type isolates of Fusarium circinatum, respectively (courtesy of
A. Perez-Sierra, Instituto Agroforestal Mediterraneo, Universidad Politecnica
de Valencia (ES)). (B) Groups of coiled sterile hyphaes and polyphialidic
conidiophores produced on Spezieller-Nahrstoffarmer Agar (SNA) (courtesy of
R. Ioos, Station de Mycologie, Malzeville (FR)).
Fig. 8 Mono- and polyphialidic conidiophores of Fusarium circinatum
observed on Spezieller-Nahrstoffarmer Agar (SNA) medium (courtesy of J.
Armengol).
Gibberella circinata 303
cottony or off-white aerial mycelium with a salmon tinge in the
middle or with a purple or dark violet pigment in the agar
(Fig. 6). On SNA, microconidia are aggregated in false heads
(Fig. 7A,B), with branched conidiophores, mono and polyphiali-
dic- conidiophores (Fig. 8A,B), obovoid microconidia in aerial
mycelium, mostly nonseptate or with occasionally 1-septum.
Chlamydospores are absent. The sterile hyphae (coiled ⁄not
ª 2009 OEPP/EPPO, Bulletin OEPP/EPPO Bulletin 39, 298–309

304 Diagnostics
distinctively coiled) are characteristic of F. circinatum and are
observed clearly on this medium (Fig. 9A,B). The epithet ‘circin-
atum’ refers to these typical coiled hyphae, also called ‘circinate’
hyphae.
Molecular methods
There are several molecular methods currently available to con-
firm the identity of the anamorphic stage of G. circinata isolated
in pure culture or to detect and identify directly G. circinata
in planta.d A PCR-RFLP (Restriction Fragment Length Polymorphism)
test, with primers and RFLP pattern developed by Steenkamp
et al. (1999) is presented in Appendix 2 and is appropriate for
identification of the anamorphic stage of G. circinata in pure
culture only as contaminants or host material may affect the
quality and numbers of PCR amplicons.d SyBr green real-time PCR or conventional PCR tests with
primers designed by Schweigkofler et al. (2004) can be useful
for identification of the fungus in pure culture, as well as for
direct detection of the pathogen in seeds, and is presented in
Appendix 4. However, when carried out on plant samples
DNA, verification of the nature of the PCR amplicon should be
carried out by sequencing for conventional PCR, or by melting
analysis for SyBr green real-time PCR (Appendix 5). Indeed,
infection by other Fusarium spp. is frequent and cryptic specia-
tion was reported in the Gibberella fujikuroi sp. complex
(Steenkamp et al., 2002). PCR cross-reaction might occur with
phylogenetically close Fusarium sp., especially with high
amounts of Fusarium template DNAd Method for real-time PCR with primers and a dual-labelled
probe designed by Ioos et al. (2009) can be useful for
identification of the fungus in pure culture, as well as for
direct detection of the pathogen in plant tissue, including
seeds, and is presented in Appendix 6. This method proved
to be more sensitive than the conventional PCR (diagnostic
sensitivities of 79.1% and 58.6%, respectively; Ioos et al.,
2009) described in Appendix 4 and its specificity is
strengthened thanks to the combination of specific primers
and probe.
Another conventional PCR test has been developed by
Ramsfield et al. (2008) but there is no experience with this
test in the EPPO region, therefore it is not described in the
protocol.
DNA extraction from pure culture
Fungal DNA should be extracted using an appropriate standard
method for DNA extraction from fungi e.g. regular commercial
plant DNA extraction kits (or other methods reviewed in Irlinger
et al., 2008) and analyzed following any of the tests presented in
Appendices 2, 4 or 6.
DNA extraction from plant tissue (except seeds)
Total DNA from potentially infected plant tissue should be
extracted as described in Appendix 3 and analyzed following any
of the tests presented in Appendices 4 or 6.
DNA extraction from seeds
Total DNA from potentially infected seeds should be extracted
as described in Appendix 3 and analysed following any of the
tests presented in Appendices 4 or 6.
Reference cultures
The type strain of G. circinata (CBS 405.97) and other strains
(CBS 117843, Spain; CBS 119864, South Africa; CBS 100197,
USA) are available from CBS, Utrecht (NL).
Reporting and documentation
Guidelines on reporting and documentation are given in EPPO
standard PM 7 ⁄ 77 Documentation and reporting of a diagnosis.
Further information
Further information on this organism can be obtained from:
Ioos R, Laboratoire National de la Protection des Vegetaux
(LNPV), Station de Mycologie, Domaine de Pixerecourt, BP
90059, F54220 Malzeville (FR), Tel: +33 (0) 383338662, fax:
+33 (0) 383338652; e-mail: [email protected]
Perez-Sierra AM, Grupo de Investigacion en Hongos
Fitopatogenos, Instituto Agroforestal Mediterraneo, Universidad
Politecnica de Valencia, Camino de Vera s ⁄ n, 46022
Valencia (ES), Tel: (+34) 963879254, fax: (+34) 963879269;
e-mail: [email protected]
Acknowledgements
This protocol was originally drafted by:
Ioos R, Laboratoire National de la Protection des Vegetaux,
Station de Mycologie, Malzeville (FR) and A. M. Perez-Sierra,
Grupo de Investigacion en Hongos Fitopatogenos, Instituto Agro-
forestal Mediterraneo, Universidad Politecnica de Valencia,
Valencia (ES).
References
Andrews S & Pitt J (1986) Selection medium for Fusarium species and
dematiaceous hyphomycetes from cereals. Applied and Environmental
Microbiology 5, 1235–1238.
Britz H, Coutinho TA, Wingfield MJ & Marasas WFO (2002) Validation of
the description of Gibberella circinata and morphological differentiation of
the anamorph Fusarium circinatum. Sydowia 54, 9–22.
Carlucci A, Colatruglio L & Frisullo S (2007) First report of pitch canker
caused by Fusarium circinatum on Pinus halepensis and P. pinea in Apulia
(Southern Italy). Plant Disease 91, 1683.
Correll JC, Gordon TR & McCain AH (1992) Genetic diversity in California
and Florida populations of the pitch canker fungus Fusarium subglutinans
f. sp. pini. Phytopathology 82, 415–420.
Correll JC, Gordon TR, McCain AH, Fox JW, Koehler CS, Wood DL &
Schultz ME (1991) Pitch canker disease in California: pathogenicity,
distribution and canker development on Monterey pine (Pinus radiata).
Plant Disease 75, 676–682.
Coutinho TA, Wingfield MJ, Viljoen A, Britz H & Marasas WFO (1997) Pitch
canker of pines: a Southern African perspective. In: Proceedings of the ISTA
ª 2009 OEPP/EPPO, Bulletin OEPP/EPPO Bulletin 39, 298–309

Gibberella circinata 305
Tree Seed Pathology Meeting (Ed. Prochazkova Z & Sutherland JR), pp.
29–35. Opocno, Czech Republic, 9–11 October 1996. International Seed
Testing Association, Zurich (CH).
EPPO (2005) Gibberella circinata. Data sheets on Quarantine pests. EPPO
Bulletin 35, 383–386.
EPPO (2008) Gibberella circinata eradicated in France. EPPO Reporting
Service 2008–05 no. 106 http://www.eppo.org/PUBLICATIONS/reporting/
reporting_service.htm. [Accessed on 25 April 2009.].
Gerlach W & Nirenberg H (1982) The genus Fusarium – a pictorial atlas.
Mitteilungen aus der Biologischen Bundesanstalt fur Land- und
Forstwirtschaft 209, 406.
Gordon TR, Storer AJ & Wood DL (2001) The pitch canker epidemic in
California. Plant Disease 85, 1128–1139.
Ioos R, Belhadj A & Menez M (2004) Occurrence and distribution of
Microdochium nivale and Fusarium species isolated from barley, durum,
and soft wheat grains in France from 2000 to 2002. Mycopathologia 158,
351–362.
Ioos R, Fourrier C, Iancu G & Gordon TR (2009) Sensitive detection of
Fusarium circinatum in pine seed by combining an enrichment procedure
with a real-time PCR using dual-labeled probe chemistry. Phytopathology
99, 582–590.
IPPC (2008) ISPM no. 31 Methodologies for sampling of consignments. https://
www.ippc.int/servlet/CDSServlet?status=ND0xMzM5OSY2PWVuJjMzPS
omMzc9a29z [Accessed on 25 April 2009].
Irlinger F, Berthet N, Vallaeys T, Vasseur V, Ioos R, Buee M et al. (2008) Ch
XI, nucleic acids preparation of fungal samples isolated from clinical, food
and environmental specimens for direct molecular applications. In:
Handbook of Nucleic Acid Purification (Ed. Dongyou L). CRC Press,
Florence, South Carolina (US). ISBN 978-1-4200-7096-568 pp.
ISTA (2002) International rules for testing. 7–009: Detection of Fusarium
moniliforme var. subglutinans Wollenw & Reinke on Pinus taeda and
P. elliotii (Pine). International Seed Testing Association (ISTA), Basseldorf,
Switzerland. http://www.seedtest.org [Accessed on 01/09/2009].
Komada H (1975) Development of a selective medium for quantitative
isolation of Fusarium oxysporum from natural soil. Review of Plant
Protection Research 8, 114–125.
Kuhlman EG, Dwinnell LD, Nelson PE & Booth C (1978) Characterization of
the Fusarium causing pitch canker of southern pines. Mycologia 70, 1131–
1143.
Landeras E, Garcia P, Fernandez Y, Brana M, Fernando-Alonso O, Mendez-
Lodos S et al. (2005) Outbreak of pitch canker caused by Fusarium
circinatum on Pinus spp. in northern Spain. Plant Disease 89, 1015.
Nirenberg HI & O’Donnell K (1998) New Fusarium species and combinations
with the Gibberella fujikuroi species complex. Mycologia 90, 434–458.
O’Donnell K, Cigelnik E & Nirenberg HI (1998) Molecular systematic and
phylogeography of the Gibberella fujikuroi species complex. Mycologia 90,
465–493.
Perez-Sierra A, Landeras E, Leon M, Berbegal M, Garcia-Jimenez J &
Armengol J (2007) Characterization of Fusarium circinatum from Pinus
spp. in Northern Spain. Mycological Research 111, 832–839.
Ramsfield TD, Dobbie K, Dick MA & Ball RD (2008) Polymerase chain
reaction-based detection of Fusarium circinatum, the causal agent of pitch
canker disease. Molecular Ecology Resources 8, 1270–1273.
Schweigkofler W, O’Donnell K & Garbelotto M (2004) Detection and
quantification of airborne conidia of Fusarium circinatum, the causal agent
of pine pitch canker, from two California sites by using a real-time PCR
approach combined with a simple spore trapping method. Applied and
Environmental Microbiology 70, 3512–3520.
Snyder WC, Toole ER & Hepting GH (1949) Fusaria associated with mimosa
wilt, and pine pitch canker. Journal of Agricultural Research 78, 365–382.
Steenkamp ET, Wingfield BD, Coutinho TA, Wingfield MJ & Marasas WFO
(1999) Differentiation of Fusarium subglutinans f. sp. pini by histone gene
sequence data. Applied and Environmental Microbiology 65, 3401–
3406.
ª 2009 OEPP/EPPO, Bulletin OEPP/EPPO Bulletin 39, 298–309
Steenkamp ET, Wingfield BD, Desjardin AE, Marasas WFO & Wingfield MJ
(2002) Cryptic speciation in Fusarium subglutinans. Mycologia 94, 1032–
1043.
Storer AJ, Gordon TR & Clarck SL (1998) Association of the pitch canker
fungus, Fusarium subglutinans f. sp. pini with Monterey pine seeds, and
seedlings in California. Plant Pathology 47, 649–656.
White TJ, Bruns T, Lee S & Taylor J (1990) Amplification and direct
sequencing of fungal ribosomal RNA genes for phylogenetics. In: PCR
Protocols: A Guide to Method and Applications (Ed. Innis MA, Gelfand DH,
Sninsky JJ & White TJ), pp. 315–322, Academic Press, NewYork (US).
Appendix 1 – Composition of the differentculture media
Komada medium (Komada, 1975):
This medium is suitable for isolation of Fusarium circinatum
from plant tissue, including seeds, but not for identification. The
basal medium contains:d K2HPO4: 1.0 gd KCl: 0.5 gd MgSO4 7H2O: 0.5 gd Fe-Na-EDTA: 10 mgd L-Asparagine: 2.0 gd D-Galactose: 20.0 gd Technical agar: 15.0 gd Distilled water to 1.0 L
The pH is adjusted to 3.8 ± 0.2 with 10% phosphoric acid.
The basal medium is autoclaved and slightly cooled before add-
ing the following filter-sterilized supplemental solutions:d Pentachloronitrobenzene (PNCB, 75% w ⁄ w): 1.0 gd Oxgall: 0.5 gd Na2B4O7 10H2O: 1.0 gd Streptomycin: 6 mL ⁄ L of stock solution (5 g of strepto-
mycin in 100 mL distilled water).
PDAS
Potato dextrose agar supplemented with 0.5 mg ⁄ mL of strep-
tomycin sulphate salt (775 units ⁄ mg solid).
Dichloran Chloramphenicol Peptone Agar (DCPA)
(slightly modified by Ioos et al., 2004; after Andrews & Pitt,
1986)
This medium is suitable for isolation of Fusarium circinatum
from plant tissue, including seeds, but not for identification. The
medium contains:d Bacteriological peptone, 15.0 gd KH2PO4, 1.0 gd MgSO4(7H2O): 0.5 gd Chloramphenicol: 0.2 gd 2.6-dichloro-4-nitroanilin (dichloran) (0.2% W ⁄ V in etha-
nol, 1.0 mL): 2 mgd Violet crystal (0.05% W ⁄ V in water, 1.0 mL): 0.0005 gd Technical agar: 20.0 gd Distilled water: to 1.0 L
Spezieller-Nahrstoffarmer Agar (SNA) (Gerlach &
Nirenberg, 1982)
This medium should be mandatory used for identification of
F. circinatum, based on morphological features. The medium
contains:
306 Diagnostics
d KH2PO4: 1.0 gd KNO3: 1.0 gd MgSO4 7H2O: 0.5 gd KCl: 0.5 gd Glucose: 0.2 gd Sucrose: 0.2 gd Technical agar: 20.0 gd Distilled water to 1.0 L
Optionally, two 1-cm2 square pieces of sterile filter paper may
be laid on the surface of the agar since Fusarium sporodochia are
sometimes more likely to be produced at the edge of the paper.
Appendix 2 – Identification at species levelby PCR-RFLP (Steenkamp et al., 1999)
(1) General information
Steenkamp et al. (1999) described a technique based on a PCR-
RFLP carried out on the histone H3 gene to identify the anamor-
phic stage for G. circinata from pure culture. Total DNA
extracted from a pure Fusarium circinatum (anamorphic stage of
G. circinata) culture is the nucleic acid source.
The PCR test targets the histone H3 gene and produces a
515 bp amplicon for G. circinata (sequences of partial G. circi-
nata H3 gene may be retrieved from Genbank, accessions
AF150847 to AF150853). The histone H3 gene is first amplified
in Gibberella spp. using the primer pair H3-1a (forward) and H3-
1b (reverse) (Table 2).
(2) Methods
Nucleic acid extraction and purification
Fungal DNA should be extracted using an appropriated standard
method for DNA extraction from fungi (Irlinger et al., 2008).
Purified DNA should be frozen until analysis.
PCR reaction
The PCR reaction mixture includes:d 1· PCR buffer (supplied with the DNA polymerase),d 0.25 mM each dNTP,d 2.5 mM MgCl2,d 0.2 lM of each H3-1a and H3-1b primers,d 0.05 U ⁄lL DNA polymerased 25–50 ng of template DNA,d Molecular grade water (MGW) is added to reach the final
reaction volume (20 lL).
The PCR reaction conditions are carried out on a thermocycler
equipped with a heated lid and include an initial denaturation at
92�C for 1 min, followed by 30 cycles of denaturation at 92�Cfor 1 min, annealing at 63�C for 1 min and elongation at 72�Cfor 1 min. A final elongation step is done at 72�C for 5 min. The
PCR product is kept at 5�C or less, until restriction analysis.
Enzymatic digestion
Histone H3 PCR products obtained are thereafter consecutively
digested with restriction enzymes CfoI and DdeI, respectively.
Consecutive enzymatic digestion is performed by addition of 5 U
CfoI to 15 lL of unpurified PCR product followed by incubation
at 37�C for 3 h. Subsequently, the sodium chloride concentration
is adjusted to 100 mM and 5 U of DdeI is added to the reaction
mixture. This is followed by further 5-h incubation at 37�C.
However, Perez-Sierra et al. (2007)showed that it was possible
to add both enzymes simultaneously without adjustment of the
sodium chloride concentration, and to simply incubate the mix-
ture for 5 h at 37�C.
The digested amplicons are separated by electrophoresis in
2–3% agarose gels followed by ethidium bromide staining.
The PCR-RFLP pattern of G. circinata (refered to as the ana-
morph F. subglutinans f. sp. pini, mating population ‘H’, by
Steenkamp et al. (1999) consists of bands of 250, 232, and 33
(not observed on the gel) bp.
(3) Essential procedural information
Total DNA obtained from a reference culture of G. circinata
should be processed in parallel with the DNA samples to be ana-
lyzed in order (i) to have a reference control pattern on the final
electrophoresis gel and (ii) to ensure that the PCR ⁄enzymatic
process was correctly achieved.
Appendix 3 – DNA extraction for in plantadetection of Gibberella circinata
(1) Plant tissue (except seeds)
Grinding
Potentially infected plant tissues are collected from the sample
and first roughly cut using a sterile scalpel blade, without prior
surface disinfection step. Small pieces of approximately 0.5–
1 cm2 should be first collected then subsequently cut into smal-
ler pieces (<2–3 mm, each side) into a sterile plastic Petri dish.
The sample is then transferred into a 2 mL microcentrifuge
tube corresponding to approximately 200 lL and ground for
2 min with two 3-mm steel or tungsten carbide beads and
400 lL of the lysis buffer provided by the DNA extraction kit, at
a frequency of 30 Hz with a bead beater (Tissuelyser�, Qiagen,
or equivalent). The samples may also be ground in a mortar by a
pestle with liquid nitrogen, or using other efficient grinding tech-
niques.
DNA extraction and purification
Total DNA should be extracted preferably following the extrac-
tion protocol described by Ioos et al. (2009) using the commer-
cial DNA extraction kit Nucleospin Plant II� miniprep
(Macherey-Nagel, Hoerdt, France), which proved to be efficient.
However, other DNA extraction protocols may be used providing
that they proved to yield total DNA at least equivalent with at
least similar quality and quantity.
Total DNA is extracted following the manufacturer’s
instructions with slight modifications. First, the chemical lysis
incubation step is extended to 20 min, using the PL1 lysis
buffer. After this incubation step, the sample is centrifuged
ª 2009 OEPP/EPPO, Bulletin OEPP/EPPO Bulletin 39, 298–309
Gibberella circinata 307
for 5 min at approximately 11 000 g to compact the debris
and only the supernatant is recovered to be further processed
following the manufacturer’s instructions. Total DNA is
finally eluted with 100 lL of the elution buffer provided by
the manufacturer and stored frozen until analysis. Total DNA
is directly used as a template for conventional or real-time
PCR (Appendices 4 and 6).
(2) Seeds
Biological enrichment
This procedure was initially described by Ioos et al. (2009) and
should be followed when the presence of G. circinata is checked
by a conventional or real-time PCR test carried out directly on a
seed DNA extract (Appendix 4 and 6). The purpose of this
preliminary biological enrichment step is to increase the biomass
of viable G. circinata propagules, prior to DNA extraction and
molecular testing.
As recommended by ISTA for agar plating technique (ISTA,
2002), at least 400 seeds per seed lot are incubated at 22 ± 3�Cfor 72 hrs in a cell culture flask with potato dextrose broth (PDB,
Difco, Beckton, Dickinson and Co, Sparks, MD, USA). How-
ever, larger sample sizes (e.g. 1000 seeds in Ioos et al., 2009)
can easily be processed by this test and may increase the chance
to detect the fungus when present at low infection levels. The
flask’s size should be chosen so that the entire seed sample can
be spread more or less as a ‘single seed’-thick layer. Depending
on the species of Pinus, the average size of the seed may vary
greatly and the quantity of PDB per flask should be manually
adjusted in a way that the seed layer is almost completely over-
laid by the liquid medium.
Grinding
After incubation, the whole content of the flask (seeds and
PDB) is transferred aseptically into a decontaminated mixer
bowl of appropriate volume, and is subsequently ground with
a mixer mill till a homogenous solution is obtained. Sterile
water or sterile PDB may be added at this step in case the
ground sample remains too thick. Two sub-samples of
approximately 500 lL are then collected and transferred
aseptically into individual 2-mL microcentrifuge tubes for
DNA extraction.
DNA extraction and purification
Total DNA should be extracted preferably following the
extraction protocol described by Ioos et al. (2009) using the
commercial DNA extraction kit Nucleospin Plant II� mini-
prep (Macherey-Nagel, Hoerdt, France), which proved to be
efficient, but other DNA extraction protocols may be used
providing that they proved equivalent in yield and quality of
DNA.
Total DNA is extracted individually from the two 500 lL
sub-samples following the manufacturer’s instructions with
slight modifications. Proceed as described above for plant
tissue.
ª 2009 OEPP/EPPO, Bulletin OEPP/EPPO Bulletin 39, 298–309
Appendix 4 – Identification at species levelby conventional or SyBr green real-time PCR(Schweigkofler et al., 2004)
(1) General information
Schweigkofler et al. (2004) described a technique based on a
conventional or a SyBrgreen real-time PCR designed from the
rDNA IGS (Inter Genic Spacer) region to identify the anamor-
phic stage of G. circinata in pure culture or in trapped airborne
spores, but may be adapted to the analysis of seeds following the
biological enrichment step (See Identification section, Ioos R.,
pers. comm.).
The PCR test targets a region of the IGS and produces a
360 bp amplicon for G. circinata (sequences of the IGS region
for G. circinata may be retrieved from Genbank, accessions
AFAY249397 to AY249403). A specific region of the IGS is
amplified with G. circinata DNA using the primer pair CIRC1A
(forward) and CIRC4A (reverse) (Table 2).
(2) Methods
Nucleic acid extraction and purification
See Appendix 3.
Conventional PCR reaction
A G. circinata-specific IGS portion is amplified by PCR as
follows.
The PCR reaction mixture includes:d 1· PCR buffer supplied with the DNA polymerase,d 0.25 mM each dNTP,d 2 mM MgCl2,d 0.5 lM of each CIRC1A and CIRC4A primers,d 0.05 U ⁄lL DNA polymerased 6.25 lL of template DNA,d Molecular grade water is (MGW) added to reach the final
reaction volume (25 lL).
Each DNA extract should be tested by at least two replicate
reactions.
The PCR reaction conditions should be carried out in a ther-
mocycler equipped with a heated lid and include an initial dena-
turation at 94�C for 3 min, followed by 45 cycles for
denaturation at 94�C for 35 s, annealing at 66�C for 55 s and
elongation at 72�C for 50 s. A final elongation step is done at
72�C for 12 min.
The PCR products are separated by electrophoresis in a 1%
agarose gel followed by ethidium bromide staining. A DNA tem-
plate containing amplifiable G. circinata DNA will yield a 360-
bp fragment after a CIRC1A ⁄ CIRC4A PCR.
SyBr green real-time PCR reaction
A G. circinata-specific IGS portion is amplified by PCR as
follows.
The PCR reaction mixture includes:d 1· PCR buffer supplied with the DNA polymerase,
308 Diagnostics
d 0.25 mM each dNTP,d 5 mM MgCl2,d 0.5 lM of each CIRC1A and CIRC4A primers,d SyBrgreen dye (concentration to be adjusted following the
manufacturer’s recommendation)d 0.05 U ⁄lL DNA polymerased 6.25 lL of template DNA,d Molecular grade water is (MGW) added to reach the final
reaction volume (25 lL).
Each DNA extract should be tested by at least two replicate
reactions.
The real-time PCR reactions are carried out in a suitable PCR
instrument equipped with a system capable of fluorescence moni-
toring.
The PCR reaction conditions include an initial denaturation at
95�C for 3–10 min (according to the type of DNA polymerase),
followed by 45 cycles for denaturation at 94�C for 35 s, anneal-
ing at 66�C for 55 s, and extension at 72�C for 50 s. The fluores-
cence of the reporter dye is monitored at the end of each
extension step.
The accumulation of G. circinata PCR amplicons is moni-
tored in real-time by the measurement of the specific fluores-
cence of the SyBr green dye incorporated into the PCR
product. A DNA template containing amplifiable G. circinata
DNA will yield a Cycle threshold (Ct) value. The Ct value
represents the estimated cycle number from which the level of
fluorescence becomes significantly superior to the background
fluorescence level.
The nature of the amplicons should be checked by yielding
melting curves at the end of the amplification process and by
comparison to the melting curves yielded with the PCR positive
control.
(3) Essential procedural information
A DNA extraction negative control (blank tube) should be
included for each DNA extraction series in order to ensure the
absence of contamination during this step.
A PCR negative control containing no target DNA should be
included in every test in order to ensure the absence of contami-
nation during PCR.
A PCR positive control should be used (genomic DNA from
a reference strain of G. circinata, or subcloned G. circinata CIR-
C1A ⁄ CIRC4A PCR product). When testing plant and seed sam-
ples, the positive control should correspond to the limit of
detection of the test (LOD). This LOD positive control2 should
2LOD positive control is made of diluted genomic DNA from a reference strain
of G. circinata, or diluted subcloned G. circinata CIRC1A ⁄ CIRC4A PCR
product. It can be defined as the lowest target amount giving positive result in
at least 95% of the times, thus ensuring a £5% false negative rate.
be included in order to assess the performance of the PCR run
and to ensure that the negative results are caused by an absence
or a too low level of the PCR target in the DNA sample, rather
than by an insufficient PCR efficiency.
The quality of the DNA extract should be assessed by a
relevant means e.g. by spectrophotometry, by using an ad hoc
internal amplification control or by testing the extract in
PCR with the fungal ribosomal genes primers ITS1 and ITS4
(White et al., 1990). In the latter case, the PCR conditions
are those described above, simply replacing the FCIRC1A ⁄ -CIRC4A primers with ITS1 and ITS4 primers (Table 2), and
decreasing the annealing temperature to 50�C. A positive sig-
nal (approximately 600 bp) following this test would mean
that the DNA extract was amplifiable: DNA was successfully
extracted and the level of co-extracted inhibiting compounds
was sufficiently low.
Interpretation of results:d A sample will be considered positive if it produces ampli-
cons of 360 bp and provided that the contamination con-
trols are negative.d A sample will be considered negative if (i) it produces no
band of 360 bp; (ii) provided that the sample DNA extract
proved to be amplifiable and that no significant inhibition
occurred; and (iii) if used, that the LOD positive control
tested in the PCR run yielded a 360 bp amplicon.d Plant samples whose DNA extract yields a Ct inferior or
equal to CtLOD should be considered as infected by G. cir-
cinata, provided that the negative controls (PCR and DNA
extraction) do not yield Ct.d Plant samples whose DNA extract does not yield a Ct infe-
rior or equal to CtLOD should be considered as non-infected
by G. circinata, or infected below the detection threshold of
the technique, provided that the sample DNA extract proved
to be amplifiable and that no significant inhibition occurred.d Tests should be repeated if any contradictory or unclear
results are obtained.
Appendix 5 – Confirmation of Gibberellacircinata by sequencing
As the CIRC1A ⁄CIRC4A conventional PCR test might cross
react with phylogenetically close species (including non- or ill-
described species of the G. fujikuroi complex), especially when
testing high amount of Fusarium template DNA, the nature of
the CIRC1A ⁄CIRC4A amplicon can be verified by sequencing.
Send an appropriate CIRC1A ⁄ CIRC4A PCR product for two-
way sequencing with primer CIRC1A and CIRC4A as forward
and reverse primer, respectively. The consensus sequence, from
which the primers’ sequences are trimmed prior to this, is
compared by BLAST with those deposited in Genbank for
numerous phylogenetically close Fusarium sp. (http://
www.ncbi.nlm.nih.gov). The sequence lying between CIRC1A
and CIRC4A on the IGS region is sufficiently discriminant to
identify G. circinata.
ª 2009 OEPP/EPPO, Bulletin OEPP/EPPO Bulletin 39, 298–309
Gibberella circinata 309
Appendix 6 – Identification at species levelby dual-labelled probe real-time PCR (Iooset al., 2009)
(1) General information
Ioos et al. (2009) described a technique based on a real-time
PCR designed from the rDNA IGS (Intergenic spacer region) to
identify the anamorphic stage of G. circinata (F. circinatum) in
pure culture or directly in plant samples.
The PCR test targets a region of the IGS and produces a
149 bp amplicon for G. circinata (sequences of the IGS region
for G. circinata may be retrieved from Genbank, accessions
AFAY249397 to AY249403). A specific region of the IGS is first
amplified with G. circinata DNA using the primer pair FCIR-F
(forward) and FCIR-R (reverse) and detected by a fluorescent
probe FCIR-P (Table 2).
(2) Methods
3LOD positive control is made of diluted genomic DNA from a reference strain
Nucleic acid extraction and purification
See Appendix 3.
Real-time PCR reaction
A G. circinata-specific IGS portion is amplified by real-time
PCR as follows.
The real-time PCR reaction mixture includes:d 1 · PCR buffer supplied with the DNA polymerase,d 0.20 mM each dNTP,d 5 mM MgCl2,d 0.2 lM of each FCIR-F and FCIR-R primers,d 0.1 lM of FCIR-P probe,d 0.025 U ⁄lL Hotstart DNA polymerase,d 25–50 ng of template DNA,d Molecular grade water (MGW) is added to reach the final
reaction volume (20 lL).
Each DNA extract should be tested by at least two replicate
reactions.
The real-time PCR reactions are carried out in a suitable PCR
instrument equipped with a system capable of fluorescence moni-
toring.
The PCR reaction conditions include an initial denaturation at
95�C for 10 min, followed by 40 cycles for denaturation at 95�Cfor 15 s, annealing ⁄ extension at 70�C for 55 s. The fluorescence
of the reporter dye is monitored at the end of each anneal-
ing ⁄ extension step.
The accumulation of G. circinata PCR amplicons is monitored
in real-time by the measurement of the specific fluorescence of
the reporter dye cleaved from the FCIR-P probe. A DNA tem-
plate containing amplifiable G. circinata DNA will yield a Cycle
threshold (Ct) value. The Ct value represents the estimated cycle
number from which the level of fluorescence becomes signifi-
cantly superior to the background fluorescence level.
ª 2009 OEPP/EPPO, Bulletin OEPP/EPPO Bulletin 39, 298–309
(3) Essential procedural information
A DNA extraction negative control should be included for each
DNA extraction series in order to ensure the absence of contami-
nation during this step (blank tube containing sterile MGW, or
500 lL of PD Broth for seed samples).
A PCR negative control (no template control, containing for
instance MGW) should be included in every experiment to check
the absence of contamination during PCR.
A PCR limit of detection (LOD) positive control3 should be
used in order to assess the performance of the PCR run and to
ensure that the negative results are caused by an absence or a too
low level of the PCR target in the DNA sample, rather than by
an insufficient PCR efficiency.
The quality of the DNA extract should be assessed by a rele-
vant means, e.g. by spectrophotometry, by testing the extract in
conventional PCR, with the universal fungal ribosomal genes
primers ITS1 and ITS4 (See Appendix 4) or in real-time PCR,
with other universal plant and fungal primers and probe such as
18S uni-F ⁄ -R ⁄ -P (Ioos et al., 2009) or other universal tests
described in the scientific literature. A positive signal (approxi-
mately 600 bp) following ITS1 ⁄ ITS4 PCR or a Ct yielded with
18S uni-F ⁄ -R ⁄ -P real-time PCR test would mean that the DNA
extract was amplifiable: DNA was successfully extracted and the
level of co-extracted inhibiting compounds was sufficiently low.
Interpretation of results:d Plant samples whose DNA extract yields a Ct inferior or
equal to CtLOD should be considered as infected by G. cir-
cinata, provided that the negative controls (PCR and DNA
extraction) do not yield Ct.d Plant samples whose DNA extract does not yield a Ct infe-
rior or equal to CtLOD should be considered as non-infected
by G. circinata, or infected below the detection threshold
of the technique, provided that the sample DNA extract
proved to be amplifiable and that no significant inhibition
occurred.d Tests should be repeated if any contradictory or unclear
results are obtained. Doubtful or borderline results should
be re-analyzed using the same or another technique (e.g.
sequencing).
of G. circinata, or diluted subcloned G. circinata FCIR-F ⁄ FCIR-R PCR prod-
uct. It can be defined as the lowest target amount giving positive result in at
least 95% of the times, thus ensuring a £5% false negative rate.

ISTA Method Validation Reports Sato et al.: Replacement of media recipes in 7-019a
OGM14-06 Method Validation Reports for ISTA Rules 2015.docx 2014-04-15 12:30 Approved by ECOM and RUL Decision No. 853 2014-02-10 Page 15/50
Proposal for replacement of mCS20ABN and FS media recipes in ISTA Rule 7-019a (Xanthomonas campestris pv. campestris detection in Brassica spp. seed lots) by adapted versions Sato, M., Seed Health Testing Laboratory, National Center for Seeds and Seedlings (NCSS), Fujimoto 2-2, Tsukuba, Ibaraki, 305-0852, Japan ([email protected]) Asma, M., Bejo Zaden B.V, Seed Technology Laboratory, P.O. Box 50, 1749 ZH Warmenhuizen, The Netherlands, ([email protected]) Politikou, L., ISF, 7 Chemin du Reposoir, 1260 Nyon, Switzerland, ([email protected]) The recipes of the FS and mCS20ABN semi-selective media described in the ISTA Rule 7-019a were adapted to increase their performance regarding the recovery and recognition of Xanthomonas campestris pv. campestris (Xcc) on the plates as well as the safety and practicality in their preparation. The adapted and ISTA Rule7-019a media recipes were compared between 5 seed health testing laboratories in an ISHI-Veg peer validation study that was organised in parallel to the ISTA proficiency test. Extracts of three 10,000-seed subsamples of a low, medium, high and Xcc-free cabbage lot were plated on media plates prepared with the adapted and the ISTA Rule 7-019a recipes. Results comparison showed no difference between the two recipes. The benefits of the adapted FS and mCS20ABN media recipes suggest the replacement of the ISTA Rule 7-019a recipes by the former. Introduction Xanthomonas campestris pv. campestris (Xcc) is an important seed-borne bacterial pathogen and the causal organism of black rot in Brassicas. The use of healthy seed is critical to control this bacterial disease. The ISTA Rule 7-019a published in 2005 for the detection of Xcc is a seed-washing and liquid-plating assay (1). In this assay, bacteria are first extracted from seeds by shaking and then the seed extract is diluted and plated on semi-selective media. The suspect Xcc colonies are confirmed in a pathogenicity test. A PCR test was adopted in this method in 2013 as an alternative to the pathogenicity test for the confirmation of Xcc suspects.
The ISTA Rule 7-019a is based on the results from a comparative test in 13 laboratories organized by the International Seed Health Initiative for Vegetables, ISF (ISHI-Veg) in 2005 (2). However, the composition of the semi-selective media mCS20ABN and FS in ISTA Rule 7-019a does not correspond to the composition of mCS20ABN and FS used in the underlying comparative test.
In the mCS20ABN medium the amount of KH2PO4 was increased in the ISTA Rule 7-019a from 1.0 g/L to 1.59 g/L and the amount of (NH4)2HPO4 was lowered from 0.8 g/L to 0.33 g/L. Moreover, evidence was obtained that the sensitivity of Xcc with respect to neomycin activity is pH dependent (3). After the ISHI-Veg comparative test in 2005, the mCS20ABN medium recipe was further optimized by increasing the amount of KH2PO4 from 1.0 g/L to 2.8 g/L that ensured stable pH in the medium. This increase in conjunction with the reinstatement of the amount of (NH4)2HPO4 to 0.8 g/L resulted in a better buffered medium. Finally, the amount of agar was increased from 15.0 g/L to 18.0 g/L as it showed better absorption of the seed extract (pers. com. Dr. H. Koenraadt, NAKTuinbouw, The Netherlands).
The FS medium recipe included in the ISTA Rule 7-019a also differed from the recipe used in the ISHI-Veg comparative test in 2005. The concentration of starch was reduced from 25.0 g/L to 10.0 g/L and this hampered the recognition of Xcc colonies by the typical halo (pers. com. Dr. H. Koenraadt, NAKTuinbouw, The Netherlands). Also, the KNO3 was omitted and gentamycin was added at 0.4 mg/L. It was suggested that these changes could result in a low or no recovery of Xcc colonies and therefore were not accepted in the adapted recipe. Finally, the expensive and very toxic cycloheximide was replaced in both adapted media recipes by nystatin for safety reasons and improvement of fungal control.
For these reasons, many seed health testing laboratories use the adapted version of mCS20ABN and FS media recipes and not the recipes described in the ISTA Rule 7-019a.

ISTA Method Validation Reports Sato et al.: Replacement of media recipes in 7-019a
OGM14-06 Method Validation Reports for ISTA Rules 2015.docx 2014-04-15 12:30 Approved by ECOM and RUL Decision No. 853 2014-02-10 Page 16/50
Aim of the peer validation study The aim of this ISHI-Veg peer validation study was to compare the performance of the
mCS20ABN and FS media adapted recipes to the media recipes described in ISTA Rule 7-019a. Provided that the performance of the media from the adapted recipe is better or equivalent to the latter, the data generated by this study will provide scientific evidence to back up a proposal to replace the mCS20ABN and FS media recipes in ISTA Rule 7-019a with the adapted recipes.
This study was organised and performed in parallel to the ISTA proficiency test on ISTA Rule 7-019a. Participants were five seed-health-testing laboratories from Japan, France, The Netherlands, USA and Israel. Materials and Methods Seed lots and seed subsamples Four, untreated, cabbage (Brassica oleracea) seed lots with different levels of Xcc natural contamination and saprophytes were selected by the Seed Health Testing Laboratory, National Center for Seeds and Seedlings (NCSS) in Japan. Prior to the peer validation study, fifteen 10,000-seed subsamples from each seed lot were tested in a heterogeneity test following the detection method and media recipes described in ISTA Rule 7-019a. However, no heterogeneity test was performed on the seed lots with the adapted media recipes.
A subsample was considered positive if at least 1 YDC positive colony isolated either from FS or mCS20ABN medium was confirmed in the pathogenicity test. Eleven, 15, 15 and 0 seed subsamples of the 15 tested in total were found Xcc positive from the No. 1, No. 2, No. 3 and No. 4 seed lots respectively. The confirmed Xcc cfu/seed values were analysed using a Generalized Linear Model assuming a Poisson distribution. The mean cfu/seed of the No. 1, No. 2, No. 3 and No. 4 seed lots were 4, 358, 34.7 and 0 respectively. Based on these results the No. 1, No. 2 and No. 3 seed lots were characterised having a low, high and medium Xcc contamination level respectively whereas the seed lot No. 4 was characterised being healthy.
Each participating laboratory received three 10,000 seed-subsamples per seed lot that were prepared based on the thousand seed weight (TSW) of their corresponding lot. All 12 in total seed subsamples were coded randomly and their correspondence to the seed lots was not revealed to ensure a blind test.
Media preparation Based on the 12 received seed subsamples, participating laboratories prepared an adequate number of mCS20ABN and FS media plates following the recipes described in ISTA Rule 7-019a. Additionally, they prepared an equal number of mCS20ABN and FS media plates following the below described adapted recipes (2):
mCS20ABN adapted recipe: The final concentration of the compounds per litter of distilled water was: 2.8 g KH2PO4, 0.8 g (NH4)2HPO4, 0.4 g MgSO4.7H2O, 2.0 g bacto tryptone, 2.0 g soya peptone, 6.0 g L-glutamine, 1.0 g L-histidine, 1.0 g dextrose, 25.0 g soluble starch (Merck 1252) and 18.0 g agar. The pH was adjusted to 6.5 and the medium was autoclaved at 121°C for 15 min. When the mixture cooled to 50°C the following sterile antibiotics were added: 35 mg nystatin, 40 mg neomycin sulphate and 100 mg bacitracine.
FS adapted recipe: The final concentration of the compounds per litter of distilled water was: 0.8 g K2HPO4, 0.8 g KH2PO4, 0.5 g KNO3, 0.1 g MgSO4
.7H2O, 0.1 g yeast extract, 25.0 g soluble starch (Merck 1252), 15.0 g agar along with 1.5 ml methyl green (1% aq.) which the laboratories added. The pH was adjusted to 6.5 and the medium was autoclaved at 121°C for 15 min. When the mixture cooled to 50°C the following sterile antibiotics were added: 35 mg nystatin, 3 mg D-methionine, 1 mg pyridoxine-HCl, 50 mg cephalexine, 30 mg trimethoprim.

ISTA Method Validation Reports Sato et al.: Replacement of media recipes in 7-019a
OGM14-06 Method Validation Reports for ISTA Rules 2015.docx 2014-04-15 12:30 Approved by ECOM and RUL Decision No. 853 2014-02-10 Page 17/50
All medium plates were stored at 4°C for at least 4 days prior to use to become opaque due to the retrogradation of the starch. This practice facilitated the recognition of starch hydrolysis by Xcc colonies. The extracts of the 12 seed subsamples were plated in parallel on plates of 7-019a and adapted recipes of mCS20ABN and FS media and results were compared. Reference culture Participating laboratories used a known Xcc strain grown on YDC medium and suspended in sterile saline (0.85% NaCl) as a positive control.
Xcc detection method description The Xcc detection method described in ISTA Rule 7-019a was followed to extract bacteria from the subsamples, prepare sterility check plates, dilutions of seed extracts and positive control, incubate and examine plates for Xcc suspect colonies, check Xcc suspects morphology on YDC medium plates and perform the pathogenicity test for their confirmation.
Data analysis Following the seed lots’ characterisation in the heterogeneity test, the SeedCalc Version 8 (4)
spreadsheet application was used to calculate the Xcc contamination rate in the low contamination level lot. The number of expected positive subsamples from this lot - plated on the 7-019a media recipes - in the peer validation study at a probability higher than 5% was then calculated with the spreadsheet application developed by J. L. Laffont (ISTA Statistics Committee Chair). The 11 positive 10,000-seed subsamples of the 15 tested revealed a contamination rate of 0.01% and 0-3 expected positive subsamples of the 3 distributed to laboratories. In the medium and high contamination level lots, as all 15 subsamples were positive in the heterogeneity test, it was expected that all 3 distributed subsamples per lot would be found positive in the peer validation study when plated on 7-019a media plates. Regarding the healthy level lot, as all 15 subsamples were Xcc negative in the heterogeneity test, it was expected that that all 3 distributed subsamples per lot would be found negative on the 7-019a media plates.
In the peer validation study, the Xcc suspects were recorded in cfu/ml for each (laboratory x contamination level x subsample x semi-selective medium x recipe x dilution x plate) combination. The positive colonies in the pathogenicity test determined the subsamples that were Xcc positive on the (medium x recipe) combination. A subsample was considered negative in this combination if there were no Xcc suspects recorded or if the Xcc suspects were negative on YDC medium and no pathogenicity test was performed. The case of Xcc suspects being positive on YDC medium but not tested in the pathogenicity test was considered to be a missing value (laboratory 4, high contamination level, subsample 2, mCS20ABN medium, 7-019a recipe).
Results of laboratory 5 were not included in the analysis as there was a positive result in the healthy level lot and a lower number of positive subsamples in the medium level lot than in the rest laboratories (Tables 1, 2 and 3). Laboratory 5 recorded Xcc suspects in one subsample from the healthy level lot in both 7-019a and adapted recipes of FS medium which were confirmed being Xcc in the pathogenicity test (raw data not shown). The Xcc suspects were recorded only in the plates of (100) undiluted extract and not in the 10-1 or 10-2 dilutions. As the results of the heterogeneity test and of the rest laboratories in the peer validation study showed no Xcc presence in the tested subsamples, this result of laboratory 5 could be attributed either to a cross contamination or to a very low Xcc presence in the lot that became apparent due to a sampling effect. Results
A variable number of Xcc suspects was recorded by all 1-4 laboratories in the subsamples of the healthy level lot in plates of both media recipes (raw data not shown). However, all suspects were
ISTA Method Validation Reports Sato et al.: Replacement of media recipes in 7-019a
OGM14-06 Method Validation Reports for ISTA Rules 2015.docx 2014-04-15 12:30 Approved by ECOM and RUL Decision No. 853 2014-02-10 Page 18/50
confirmed negative in the pathogenicity test. Regarding the sterility control plates no Xcc suspects were recorded in any laboratory (raw data not shown).
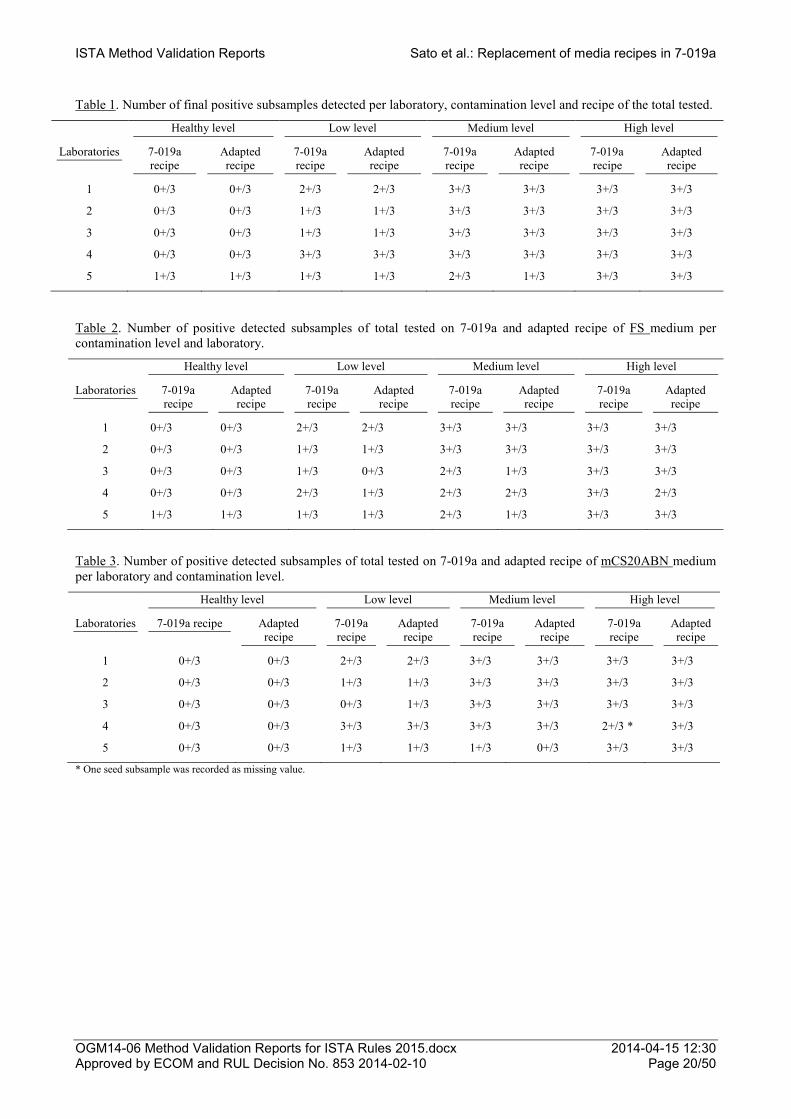
In Table 1, the number of final positive detected subsamples - positive in either one or both FS and mCS20ABN media of the same recipe - is presented per laboratory, contamination level and recipe. The expected number of positive subsamples plated on the 7-019a media recipes was detected by all 1-4 laboratories in the healthy, low, medium and high level lots (Table 1).
Results of the peer validation study showed that the final number of positive detected subsamples in the healthy, low, medium and high level lots was the same in 7-019a and adapted media recipes and that was in each laboratory (Table 1).
The number of positive subsamples detected in each FS medium recipe was the same in all contamination levels in laboratories 1 and 2 (Table 2). A slightly smaller number of positives was detected in the adapted than in the 7-019a FS medium recipe in laboratories 3 and 4 which varied on the contamination level lots (Table 2).
The number of positive subsamples detected in each mCS20ABN medium recipe was the same in all contamination levels in laboratories 1 and 2 (Table 3). Regarding the rest of laboratories the detected number of positives in the adapted compared to the 7-019a recipe was equal or higher varying on the contamination level lot (Table 3).
Discussion and Conclusions
The adapted recipes of mCS20ABN and FS semi-selective media showed to perform equally to the recipes described in the ISTA Rule 7-019a for the Xcc contaminated and pathogen free cabbage seed lots.
The benefits of the adapted mCS20ABN recipe are summarised as follows: better buffered medium that ensures pH stability due to the increase of KH2PO4 and (NH4)2HPO4 amounts and better absorption of the seed extract as a result of the agar amount increase in the medium. Regarding the FS medium, the clear formation of typical halos around the Xcc suspect colonies that is a result of the starch amount increase improves their recognition while the KNO3 amount increase and omission of gentamycin improves the Xcc recovery. Finally, the nystatin replaces the toxic cycloheximide and improves the fungal control in both semi-selective media. The benefits of the adapted recipes of FS and mCS20ABN semi-selective media over the 7-019a recipes support the suggestion for replacement of the 7-019a recipes with the former.
Moreover, the adapted recipes of mCS20ABN and FS media are available in a ready-to-use package that allows for a standardised and easy preparation. Already, many seed health testing laboratories on an international level use the adapted recipes for the routine detection of Xcc on untreated and on disinfested/disinfected Brassica spp. seed.
In addition, the adapted recipe of both media have been described in the ISTA Rule 7-019b for the detection of Xcc on disinfested/disinfected Brassica spp. seed with grinding. Acknowledgements M. Sato (ISTA SHC member, NCSS) is greatly acknowledged for organising this ISHI-Veg peer validation study in parallel to the ISTA proficiency test, sourcing the seed testing material and running the heterogeneity test. The NCSS, GEVES-SNES, Bejo B.V., STA Labs U.S.A. and Microlab laboratories are acknowledged for their participation in this study. Bibliography 1. Roberts, S.J. and Koenraadt, H. (2005). Detection of Xanthomonas campestris pv. campestris
on Brassica spp. Method description 7-019 (2005). ISTA International Rules for Seed Testing, Annex to Chapter 7 seed Health testing Methods 2003.
2. Koenraadt, H., van Bilsen, J.G.P.M. and Roberts, S.J. (2005). Comparative test of four semi-selective media for the detection of Xanthomonas campestris pv. campestris in brassica seed. Seed Science and Technology, 33, 115-125
ISTA Method Validation Reports Sato et al.: Replacement of media recipes in 7-019a
OGM14-06 Method Validation Reports for ISTA Rules 2015.docx 2014-04-15 12:30 Approved by ECOM and RUL Decision No. 853 2014-02-10 Page 19/50
3. Olivier, V., Guillaumes, J., Manceau, C. and Grimault, V. (2006). Risks of problems of Xanthomonas campestris pv. campestris growth on isolation medium mCS20ABN. GEVES report, 3 pp.
4. Seedcalc version 8 (http://www.seedtest.org/en/statistical-tools-for-seed-testing-_content---1--1143--279.html)
ISTA Method Validation Reports Sato et al.: Replacement of media recipes in 7-019a
OGM14-06 Method Validation Reports for ISTA Rules 2015.docx 2014-04-15 12:30 Approved by ECOM and RUL Decision No. 853 2014-02-10 Page 20/50
Table 1. Number of final positive subsamples detected per laboratory, contamination level and recipe of the total tested.
Healthy level Low level Medium level High level
Laboratories 7-019a recipe
Adapted recipe
7-019a recipe
Adapted recipe
7-019a recipe
Adapted recipe
7-019a recipe
Adapted recipe
1 0+/3 0+/3 2+/3 2+/3 3+/3 3+/3 3+/3 3+/3
2 0+/3 0+/3 1+/3 1+/3 3+/3 3+/3 3+/3 3+/3
3 0+/3 0+/3 1+/3 1+/3 3+/3 3+/3 3+/3 3+/3
4 0+/3 0+/3 3+/3 3+/3 3+/3 3+/3 3+/3 3+/3
5 1+/3 1+/3 1+/3 1+/3 2+/3 1+/3 3+/3 3+/3
Table 2. Number of positive detected subsamples of total tested on 7-019a and adapted recipe of FS medium per contamination level and laboratory.
Healthy level Low level Medium level High level
Laboratories 7-019a recipe
Adapted recipe
7-019a recipe
Adapted recipe
7-019a recipe
Adapted recipe
7-019a recipe
Adapted recipe
1 0+/3 0+/3 2+/3 2+/3 3+/3 3+/3 3+/3 3+/3
2 0+/3 0+/3 1+/3 1+/3 3+/3 3+/3 3+/3 3+/3
3 0+/3 0+/3 1+/3 0+/3 2+/3 1+/3 3+/3 3+/3
4 0+/3 0+/3 2+/3 1+/3 2+/3 2+/3 3+/3 2+/3
5 1+/3 1+/3 1+/3 1+/3 2+/3 1+/3 3+/3 3+/3
Table 3. Number of positive detected subsamples of total tested on 7-019a and adapted recipe of mCS20ABN medium per laboratory and contamination level.
Healthy level Low level Medium level High level
Laboratories 7-019a recipe Adapted recipe
7-019a recipe
Adapted recipe
7-019a recipe
Adapted recipe
7-019a recipe
Adapted recipe
1 0+/3 0+/3 2+/3 2+/3 3+/3 3+/3 3+/3 3+/3
2 0+/3 0+/3 1+/3 1+/3 3+/3 3+/3 3+/3 3+/3
3 0+/3 0+/3 0+/3 1+/3 3+/3 3+/3 3+/3 3+/3
4 0+/3 0+/3 3+/3 3+/3 3+/3 3+/3 2+/3 * 3+/3
5 0+/3 0+/3 1+/3 1+/3 1+/3 0+/3 3+/3 3+/3
* One seed subsample was recorded as missing value.

ISTA Method Validation Reports Grimault & Politikou: New method Acidovorax on Valerianella
OGM14-06 Method Validation Reports for ISTA Rules 2015.docx 2014-04-15 12:30 Approved by ECOM and RUL Decision No. 853 2014-02-10 Page 21/50
Validation of a new method for the detection of Acidovorax valerianellae on Corn salad (Valerianella locusta) Grimault, V., GEVES-SNES, 25 Rue Georges Morel, CS 90024, 49071 Beaucouze, Cedex, France ([email protected]) Politikou, L., ISF, 7 Chemin du Reposoir, 1260 Nyon, Switzerland ([email protected]) The performance of an ISHI-Veg developed method for the detection of the seed-transmitted pathogen Acidovorax valerianellae (Av) on corn salad (Valerianellae locusta) seed was evaluated in an international comparative test between eight laboratories organized by ISHI-Veg. The method includes a grow-out test performed in a sweatbox followed by PCR confirmation of Av on symptomatic/doubtful corn salad cotyledons at 14 or 21 days after sowing. One pathogen-free untreated, and two (low and medium infected) naturally contaminated seed lots with variable saprophytic loads were compared. Each seed lot was tested in six blind replicates of 5,000-seed. One 1,000-seed sample from the pathogen-free and one 1,000 seed sample of the medium contaminated seed lot served as negative and positive control, respectively. In the same comparison a potting soil-vermiculite mixture showed comparable results to vermiculite alone as substrate and is therefore considered an alternative. No significant effect of Thiram treatment was shown on the saprophytic load of seed lots. Yet, its application in the recommended ratio can ensure discernible Av symptoms on corn salad cotyledons. The detection method showed high values of accordance (repeatability), concordance (reproducibility), sensitivity, specificity and accuracy for all three contamination levels. Therefore, it is considered to be a reliable method for the detection of Av on corn salad seed and is highly recommended in routine seed health testing.
Introduction Acidovorax valerianellae (Av) is a gram-negative bacterium causing circular water-soaked spots that turn black on cotyledons and leaves of corn salad (Valerianella locusta) plants (Gardan et al., 2003). It is one of the major pathogens of corn salad and is soil transmitted (Grondeau et al., 2003).
Seed transmission of Av was demonstrated through grow-out tests originally carried out for the detection of Peronospora valerianellae (Grimault et al., 2006). Isolated strains from diseased corn salad cotyledons grown from contaminated seeds were compared and found identical to Acidovorax valerianellae strains described by Gardan et al. (2003). Grondeau and Samson (2009) described a detection method for Av on corn salad seeds based on the use of a semi-selective medium. However, this method proved to be inefficient in routine testing of corn salad seed samples. Av grows slowly on media and its identification was difficult due to the presence of fast- growing saprophytes.
A grow-out test using a sweat box assay was developed by Rijk Zwaan NL in 2005 (H. Linders, personal communication). It comprised sowing seeds on a substrate in a sweat box, observation of Av symptoms that developed on cotyledons, foci formation, and finally, confirmation of suspect Av isolates in a PCR test. Av foci develop from one single contaminated seed. Foci have a round to confluent shape. One focus includes one to several seedlings with Av symptoms on the cotyledons.
Cotyledons damping-off which interfered with the observation of Av symptoms and recording was frequently observed in initial tests. GEVES-SNES compared blotter, sand, soil and vermiculite substrates for Av disease development and saprophytic growth levels. Although in most substrates damping-off was observed, development and observation of Av symptoms were best when seeds were sown on vermiculite. Suspect isolates were confirmed to be Av in a PCR test (V. Grimault, personal communication, 2008).
The effect of two different incubation conditions on the development of Av symptoms in sweat boxes was subsequently compared (Grimault et al., 2008). Sweat boxes were incubated at 20°C with 12 h light/12 h dark and at 25°C with 12 h light, 18°C with 12 h dark. Both sets of conditions

ISTA Method Validation Reports Grimault & Politikou: New method Acidovorax on Valerianella
OGM14-06 Method Validation Reports for ISTA Rules 2015.docx 2014-04-15 12:30 Approved by ECOM and RUL Decision No. 853 2014-02-10 Page 22/50
were found to be equivalent in the development of typical Av disease symptoms on corn salad cotyledons. In the case of dormant seeds, an incubation period of 7 days at 5oC in the dark was applied post sowing. A grow-out was then performed with the seeds in the above mentioned incubation conditions.
Saprophytic growth in sweatboxes was, nevertheless, found to cause cotyledons damping-off and mask Av symptoms. The efficacy of fungicides applied as a substrate treatment to control saprophytic growth without inhibiting the development of Av was tested in a peer validation study with 3 laboratories. The highest saprophytic control in the sweatboxes was seen with the application of the fungicide Thiram at a rate of 4 g/kg of seeds on vermiculite. Moreover, Thiram didn’t inhibit disease development at this concentration (Serandat, 2008) but did so at concentrations above 12 g/kg seeds (G. Hiddink, personal communication, 2007).
Specific primers for the detection of Av were developed by Enza Zaden NL in 2004 (J. Heldens, personal communication) and several studies were carried out to validate their specificity. Pathogenicity and PCR tests were performed on a collection of 28 Av isolates and saprophytes at GEVES-SNES to validate these primers. A correlation of 100% was shown between the two tests (Mazouni, 2007). Additional validation of the specificity of these primers was done by UMR Pavé (INRA-Angers-Nantes) by comparing 41 Av strains, 8 Acidovorax spp. strains and 3 strains of closely related genera as part of the BASELE project (Portier, 2010). The expected PCR amplification products were generated with these primers for all Av strains but not for the other bacteria.
The proposed method for the detection of Av on corn salad seed is based on a grow-out test in a sweat box and confirmation of Av cotyledons with a PCR test. The method has been in use by several public and company seed health testing laboratories since 2006. It can be used to test untreated seed, seeds treated with fungicides, and seeds that have been chemically or physically disinfected.
Aim and objective of the comparative test The aim of this comparative test was to evaluate the proposed method for the Av detection on corn salad seed. The ultimate objective is to develop an internationally accepted seed health testing method for detecting Av on corn salad seed lots.
Materials and Methods Seed lots and subsamples Three untreated corn salad (Valerianella locusta) seed lots with variable levels of natural Av contamination and saprophytes were selected by the GEVES-SNES Laboratory in France. The seed lots (O 086397, O 086398 and O 083751) were characterized prior to the comparative test based on the average number of Av foci that developed in the sweatboxes. They were sown on a Thiram-treated substrate and tested using the proposed method to characterise them. From each seed lot 2 subsamples of 5,000 seeds were tested. In the lots O 086397, O 086398 and O 083751 an average of 16, 6.5 and zero foci were recorded. Thus, contamination in the seed lots was characterized as being medium, low and healthy, respectively.
The distribution of Av in the low and medium contamination-level seed lots was then evaluated in a homogeneity test that ran on 10 and 15 subsamples of 5,000 seeds using the Thiram-treated substrate. The “Homogeneity Test” Excel spreadsheet application developed by the ISTA Statistics Committee showed that the Av distribution was homogeneous in both seed lots (Appendix I).
For the comparative test each participating laboratory received six 5,000-seed subsamples from each of the three seed lots. These 18 subsamples were randomly coded to ensure a blind comparative test. One 1,000-seed subsample from the medium seed lot and one 1,000-seed subsample from the healthy seed lot were included as positive and negative controls, respectively. These controls were made known to the participating laboratories. Laboratories 1 and 4 received an

ISTA Method Validation Reports Grimault & Politikou: New method Acidovorax on Valerianella
OGM14-06 Method Validation Reports for ISTA Rules 2015.docx 2014-04-15 12:30 Approved by ECOM and RUL Decision No. 853 2014-02-10 Page 23/50
extra set of 20 seed subsamples to be tested with a combination of soil and vermiculite substrate. All seed subsamples were prepared by the sampling department of GEVES-SNES with the use of the rotary sample divider apparatus based on the thousand-seed weight of each seed lot.
All available seed material was utilised in the homogeneity and comparative tests. Therefore, no “Stability Test” was performed by the test organiser.
Grow-out method Treated and untreated substrates
One chlorine disinfected sweatbox (e.g. Rotho, Ref. 4045, 10 L, 40 cm x 33.5 cm x 17 cm) was labelled with the number corresponding to each of the 20 seed subsamples. Three from the six coded seed subsamples per seed lot were randomly selected by the test organiser to be sown on to Thiram-treated and untreated substrates. The seed samples coded 2, 3, 5, 6, 7, 10, 13, 16 and 18, and the positive and negative control seed subsamples were sown on vermiculite treated with Thiram 80% WP (bis(dimethylthiocarbamoyl) disulphide, C6H12N2S4) at a rate of 4 g Thiram / kg of seeds.
Laboratories weighted each seed subsample that was to be grown on Thiram-treated substrate. The corresponding amount of Thiram was then measured based on each subsample’s weight. The measured quantity of Thiram was then dissolved in 1L de-ionised water and poured into the corresponding sweatbox. During this process the laboratories took appropriate safety precautions (European chemical Substances Information System (ESIS) http://ecb.jrc.ec.europa.eu/esis/). In the remaining sweatboxes 1L of de-ionised water was added. Finally, all sweatboxes were filled with 2L of medium-sized vermiculite.
Laboratories 1 and 4 prepared 20 additional sweatboxes for the extra set of seed subsamples they received. The seed subsamples coded 2, 3, 5, 6, 7, 10, 13, 16 and 18 from the extra set of seeds were sown on potting soil treated with Thiram following the above mentioned procedure. Seed sowing, incubation and inspection of symptoms The seeds of each subsample were spread evenly over the whole surface of the vermiculite substrate into the corresponding sweatbox. Laboratories 1 and 4 sowed the extra set of 20 seed subsamples over the 2 L potting soil substrate and covered the seeds with 1 L of medium-sized vermiculite. Laboratory 1 added 0.5 L of vermiculite under the seeds to further impede the growth of saprophytes in the sweatboxes and covered them with 0.5 L of vermiculite.
All sweatboxes were then closed with a lid and incubated in one of the two conditions: i) 20°C with 12 h light/dark and ii) 25°C with 12 h light, 18°C with 12 h dark.
On the 14th and 21st days of incubation corn salad cotyledons were inspected for typical Av symptoms: small, circular, black water soaked lesions. Development of Av foci and saprophytic growth were also inspected and recorded in the provided data record sheet.
PCR confirmation Collecting and grinding symptomatic cotyledons On the 21st day, from every sweatbox 1-8 Av-symptomatic cotyledons from different foci were collected with aseptic tweezers and placed in containers (e.g. Extraction bags from Universal, Art. No. 430 100, BioReba, Switzerland) with a maximum of four cotyledons per container. A similar number of Av-symptomatic and symptomless cotyledons were collected from the positive and negative control sweatboxes, respectively. In sweatboxes where no Av symptoms were observed no cotyledons were collected and no PCR confirmation test was performed.
Each sample of collected cotyledons was ground in 3 ml of 0.85% sterile saline (8.5 g NaCl/1,000 mL de-ionised water, autoclaved at 121oC, at 15 psi for 15 min) with the use of a press
ISTA Method Validation Reports Grimault & Politikou: New method Acidovorax on Valerianella
OGM14-06 Method Validation Reports for ISTA Rules 2015.docx 2014-04-15 12:30 Approved by ECOM and RUL Decision No. 853 2014-02-10 Page 24/50
grinder (e.g. hand homogeniser) or equivalent tool and 1mL of the extract was collected in a separate Eppendorf tube. One (1) mL of the 0.85% sterile saline used for grinding was also collected in a separate Eppendorf tube and served as “process control”.
Av DNA extraction from collected cotyledon samples The cotyledon extracts and the process control were centrifuged at 6000-7000 x g for 5 min. The supernatant was discarded and the pellet re-suspended with 200 µL sterile water. The suspensions were incubated at 100oC for 5 min and on ice for 5 min. A 10-fold dilution with sterile water was prepared from each suspension in a separate Eppendorf tube. PCR primers, positive and negative controls, reaction mixture, profile and products visualisation Laboratories used DNA of their own reference Av strain as PCR positive control and sterile water as PCR negative control. The primers set developed by Enza Zaden with DNA amplification product size of 346 bp targeting Av were used. The primers were:
ZTO57-F: GAT CGT GGG GGA TAA CGG A ZTO58-R: GTC ATG AGC TCT CTT TAT TAG AAA CAG
The PCR was carried out in a 25 µL reaction mixture containing 1 µL of DNA extract in 19.8 µL sterile Milli Q, 1 x Buffer (10x concentrated PCR reaction buffer with Mg+, from Roche Cat. Number: 11271318001 with composition: 10mM Tris-HCl, 15mM MgCl2 and 500mM KCl), 0.1mM dNTP’s, 0.4 pmol/µL each of upstream and downstream primers and 0.05 U/µL of Taq polymerase.
Laboratories that didn’t use the recommended mixture from Roche used their own in-house recipe. These PCR mixes contained a 1.5 mM final concentration of MgCl2 and 1x final concentration of the Buffer.
The PCR profile was 2 min incubation at 94oC followed by 35 cycles of 30 sec at 94oC, 1 min at 63oC and 1 min at 72oC. A final 5 min incubation at 72oC and infinity at 4oC. Ten (10) µL of each PCR-sample and of the PCR negative control (sterile saline) were run on a 1.5% agarose gel in 1x TAE buffer. A 100bp DNA ladder was included. The samples ran on the agarose gel by electrophoresis in 1x TAE buffer. The gel was stained with ethidium bromide. The amplification products were analysed for an Av specific product of 346 bp under UV-light. The PCR result of each tested sample was recorded next to the corresponding sweatbox in the data record sheet.
Data analysis All 8 participating laboratories submitted the results they had generated. For each (laboratory x contamination level x treatment x sweatbox/seed subsample) combination the number of Av foci and the saprophytic growth rated on a scale of 1-3 were recorded on the 14th and on the 21st days. Values of the same variables including the number of symptomatic and/or doubtful cotyledons in those collected and the PCR positives of the total tested samples were additionally recorded per combination on the 21st day.
The decision on whether a seed sample and the combinations (laboratory x contamination level x treatment x sweatbox/seed subsample) were Av positive or negative was determined based on either the grow-out result or the PCR result on the 21st day. A seed subsample was considered Av negative if there were no symptomatic cotyledons observed or if the samples of collected cotyledons – symptomatic or doubtful – were found negative in the PCR test. A seed subsample was considered Av positive if at least one sample of collected cotyledons - symptomatic or doubtful - gave a PCR positive result.

ISTA Method Validation Reports Grimault & Politikou: New method Acidovorax on Valerianella
OGM14-06 Method Validation Reports for ISTA Rules 2015.docx 2014-04-15 12:30 Approved by ECOM and RUL Decision No. 853 2014-02-10 Page 25/50
The statistical analysis was performed on the final results (binary data; positive or negative) of the 1-6 laboratories. Results of Laboratories 7 and 8 were not included in the statistical analysis as there was a low number of positive seed subsamples found in the two contaminated seed lots and a positive result in the healthy (zero-contamination) lot (Table 1). The unexpected results of the Laboratories 7 and 8 were attributed to their lack of experience with identifying Av symptoms and performing the PCR test.
The norm NF EN ISO 16140 (AFNOR, 2003) was followed to evaluate the performance criteria - sensitivity, specificity and accuracy - for contamination levels and treatments. This evaluation was performed by comparing the expected results of all laboratories with those obtained. The results were in the form of positive and negative agreements and deviations (see Appendix II).
For each contamination level and treatment, accordance (repeatability of qualitative data) and concordance (reproducibility of qualitative data) was evaluated using the definitions developed by Joesefsen et al. (2004), viz. the percentages of finding the same result positive or negative from two similar samples analysed in the same or different laboratories respectively and under standard repeatability conditions. The method and tool developed by Langton et al. (2002) was used to evaluate accordance and concordance.
The effect of Thiram-treated substrate on saprophytic growth in the sweatbox was studied in a χ2 test. The test was performed on the ratings for saprophytic growth (on the scale 1-3) for all three seed lots recorded on the 21st day. Data generated by Laboratories 1, 2, 3, 5, and 6 were analysed. As Laboratory 4 rated saprophytic growth in all 18 sweatboxes as 2 its data was not included in the analysis.
No statistical analysis was performed on the results of the extra set of seed subsamples that Laboratories 1 and 4 received and sowed on soil-vermiculite combination. Results
Laboratory 4 recorded zero foci and zero doubtful cotyledons in all sweatboxes with seed subsamples from the healthy seed lot (data not shown). Thereafter, no PCR test was performed and the final result for these seed subsamples was recorded based on the grow-out, where the absence of symptomatic cotyledons was considered to be a ‘negative’ result.
Laboratories 1, 3, 5 and 6 recorded zero number of collected Av symptomatic cotyledons but a variable number of cotyledons with doubtful symptoms in sweatboxes 1, 4, 4 and 2, respectively. Cotyledons with doubtful Av symptoms were confirmed negative in the PCR test by Laboratories 1, 3 and 6.
However, for one subsample from a healthy lot (no. 16) Laboratory 5 confirmed the pure extract of 1 cotyledon with doubtful symptoms as being Av positive, whilst its dilution gave a doubtful result. This seed subsample was finally considered to be positive based on the PCR result of the pure cotyledon extract (data not shown). For another subsample of the same lot (no. 8) Laboratory 5 reported a negative PCR result for the pure extract of 1 cotyledon with doubtful symptoms but a doubtful PCR result on its dilution. The subsample no. 8 was considered to be negative.
The remaining seed subsamples from the healthy seed lots from Laboratories 1, 3, 5 and 6 were Av negative based on the grow-out.
Av cotyledons and cotyledons with doubtful symptoms collected by Laboratory 2 in 4 sweatboxes containing healthy seed subsamples were confirmed Av negative in the PCR test (data not shown). The remaining healthy seed subsamples of Laboratory 2 were Av negative as no symptoms were recorded.
Regarding the low and medium contamination levels all 6 laboratories observed Av symptoms on the cotyledons and recorded a variable number of Av foci in all subsamples sown on both treated and untreated substrates. All collected Av cotyledon samples were confirmed PCR positive. Laboratories 2 and 5 collected a variable number of cotyledons with doubtful symptoms. Three out

ISTA Method Validation Reports Grimault & Politikou: New method Acidovorax on Valerianella
OGM14-06 Method Validation Reports for ISTA Rules 2015.docx 2014-04-15 12:30 Approved by ECOM and RUL Decision No. 853 2014-02-10 Page 26/50
of 5 samples that Laboratory 2 tested were found to be PCR positive. Laboratory 5 confirmed all its doubtful samples as being PCR negative (data not shown).
The expected and the obtained results from Laboratories 1-6 are presented for contamination levels and substrate treatment in Table 1. The sensitivity of the evaluated grow-out and PCR confirmation method was 100% for the low, medium and the low+medium contaminated seed lots and treatments (Table 2). In other words, no false negative results were obtained.
The specificity of the method was 100% for the combination healthy x untreated substrate as there were no false positives and 94.44% for the healthy x Thiram- treated substrate (Table 2).
The accuracy was 100% for the low, medium and the low+medium contaminated seed lots and treatments and for the healthy x untreated substrate combination. It was 94.44% for the healthy x Thiram-treated substrate. Accordance and concordance values were high in all cases (Table 2). The values that were less than 100% in the specificity, accuracy, accordance and concordance criteria in the healthy x Thiram-treated combination were due to the decision to consider seed subsample no. 16 of Laboratory 5 to be PCR positive.
No significant difference was shown between the Thiram-treated and the untreated substrate on the level of saprophytic growth based on the test (Tables 3 and 4).
The results obtained by the PCR test for seed subsamples sown by Laboratories 1 and 4 on soil-vermiculite were identical to those of seed subsamples sown on vermiculite substrate (Table 5). Both laboratories recorded zero Av symptomatic cotyledons in the seed subsamples from the healthy lots and a variable number of Av foci in the seed subsamples from the contaminated lots (data not shown). However, Laboratory 4 didn’t record any Av symptoms on the cotyledons from the positive control seed subsample. Discussion and conclusions
No PCR test was performed if there were no Av symptoms observed on the cotyledons. The PCR test confirmed typical and doubtful Av symptoms that were recorded on the cotyledons of seed subsamples from the three seed lots.
In this comparative test symptoms were confirmed on the last day of incubation. Typical Av symptoms can also be clearly observed on the 14th day of incubation. In such cases symptoms can be confirmed in a PCR test without waiting to day 21. A PCR positive result would bring the test to an end. In case of a negative PCR result or no symptoms observation on the 14th day, incubation must be extended to the full 21 days where the final recording and PCR confirmation are performed.
Although the healthy seed lot was identified as being Av negative by the test organiser, the possibility that it was very weakly contaminated by Av cannot be excluded (as it wasn’t tested in the homogeneity test). This might explain the PCR positive result that Laboratory 5 found on a doubtful symptomatic cotyledon from a healthy seed subsample.
The evaluated grow-out and PCR confirmation method for the detection of Av on corn salad seeds was shown to be repeatable (high accordance values) and reproducible (high concordance values) with high sensitivity, specificity and accuracy at all three contamination levels. Therefore, it is highly recommended for routine seed health testing for the detection of Av on corn salad seed. The minimum recommended sample size to be tested for the detection of Av is 10,000 seeds divided in 2 subsamples of 5,000 seeds.
The results of this comparative test didn’t show a significant effect of Thiram on saprophytic growth, which is opposed to findings of previous studies (Serandat, 2008). However, in case of high (suspected) saprophytic load in the seed subsamples it is recommended to treat the substrate with Thiram as it will reduce damping-off on corn salad cotyledons and ensure discernible Av symptoms in the sweatbox. Yet, if more than 20% of the corn salad seedling population is damped-off due to fungal infection and no Av symptoms can be observed in the sweatbox this must be indicated in the test result. In this case the test result is considered invalid and it is recommended to repeat the test

ISTA Method Validation Reports Grimault & Politikou: New method Acidovorax on Valerianella
OGM14-06 Method Validation Reports for ISTA Rules 2015.docx 2014-04-15 12:30 Approved by ECOM and RUL Decision No. 853 2014-02-10 Page 27/50
with sufficient seeds to compensate for seedling loss with the option of a Thiram-treated substrate. If, however, Av symptoms are observed on the cotyledons and confirmed in the PCR, the test result is valid and the seed-subsample is infected.
The comparable final results obtained from seed subsamples grown on a soil substrate and on vermiculite support the use of the former as an alternative in the grow-out test. Acknowledgements The cooperation of participating laboratories from France, The Netherlands and U.S.A. is acknowledged. The authors would like to thank GEVES-SNES for carrying out the characterization and homogeneity tests and preparing the seed subsamples for all participants. Finally, special thanks to S.D. Langton that provided the Excel tool for the calculation of Accordance and Concordance values and to M. El Yakhlifi for his help with the statistical analysis. Bibliography ESIS: European chemical Substances Information System (http://ecb.jrc.ec.europa.eu/esis/). Gardan, L., Stead, D. E., Dauga, C. and Gillis, M. (2003). Acidovorax valerianellae spp. nov., a novel
pathogen of lamb’s lettuce (Valerianella locusta (L.) Laterr.), International Journal of Systematic and Evolutionary Microbiology, 53, 795-800.
Grimault, V., Olivier, V., Guyot, L., Valette, N., Viallevieille, F. and Lybeert, H. (2006). Seed transmission of Acidovorax valerianellae on corn salad. Proceedings of the 3rd International Seed Health Conference, 6-8 September 2006, Bydgoszcz, Poland.
Grondeau, C., Cerceau, V., Bureau, C. and Samson, R. (2003). Evidence that Acidovorax valerianellae, bacterial blak spot of corn salad (Valerianella locusta) agent, is soil transmitted. In Pseudomonas syringae and related pathogens, 89-91, N.S. Lacobellis et al., (eds), Kluwer Academic Publishers.
Grondeau, C. and Samson, R. (2009). Detection of Acidovorax valerianellae in corn-salad seeds, seed ransmission of the pathogen and disease development in the field. Plant Pathology 58, 846-852.
Grimault, V., Olivier, V., Mathis, R., Oosterhoff, J., Geraats, B., Mazouni, F., Guyot, L., Valette, N. and Lybeert, H. (2008). Setting up a grow-out method to detect Acidovorax valerianellae on corn salad seeds, Proceedings of the SHC symposium 14-18 April 2008, page 30.
Josefsen, M. H., Cook, N., Agostino, M.D., Hansen, F., Wagner, M., Demnerova, K., Heuvelink A. E., Tassios, P. T., Lindmark, H., Kmet, V., Barbanera, M., Fach, P., Loncarevic, S. and Hoorfar, J. (2004). Validation of a PCR-based method for detection of food-borne thermotolerant Campylobacters in a multicenter collaborative trial. Applied and Environmental Microbiology, 70, 4379-4383.
Langton, S. D., Chevennement, R., Nagelkerke, N. and Lombard, B. (2002). Analysing collaborative trials for qualitative microbiological methods: accordance and concordance, International Journal of Food Microbiology, 79, 175-181.
Mazouni, N.A. (2007). Optimisation de la détection sur semences de Xanthomonas campestris pv. campestris et d’Acidovorax valerianellae, Rapport de Master, Université d’Angers, Institut National d’Horticulture, GEVES-SNES, 34 pp.
Association Française de Normalisation AFNOR, Octobre 2003, Microbiologie des aliments – Protocole pour la validation des méthods alternatives NF EN ISO 16140. www.afnor.org
Portier, P. (2009). PCR specificity test using ZT057/ZT058 primers for the identification of Acidovorax valerianellae, UMR—INRA Angers-Nantes report, 3pp.
Serandat, I. (2008). Seed pre-treatment for detection of Acidovorax valerianellae on corn salad seeds, GEVES-SNES report, 11 pp.

ISTA Method Validation Reports Grimault & Politikou: New method Acidovorax on Valerianella
OGM14-06 Method Validation Reports for ISTA Rules 2015.docx 2014-04-15 12:30 Approved by ECOM and RUL Decision No. 853 2014-02-10 Page 28/50
Table 1. Final results of participant laboratories of the grow-out and PCR confirmation method for the detection of Av on cornsalad seeds.
No. of obtained positive seed subsamples Laboratories
Seed Lot Contamination Level Treatment a No. of expected positive seed subsamples 1 2 3 4 5 6 7 b 8 b O 083751 Healthy T 0 0 0 0 0 1 0 1 0
N/T 0 0 0 0 0 0 0 0 0 O 086398 Low T 3 3 3 3 3 3 3 0 1
N/T 3 3 3 3 3 3 3 3 1 O 086397 Medium T 3 3 3 3 3 3 3 1 3
N/T 3 3 3 3 3 3 3 2 3 a T= Treatment with Thiram fungicide, N/T=No treatment applied. b Results were excluded due to lack of experience with the method.
Table 2. Statistical evaluation of 1-6 participant laboratories final results of the grow-out and PCR confirmation method for the detection of Av on cornsalad seeds.
Seed Lot Contamination Level Treatment Sensitivity (%) Specificity (%) Accuracy Accordance (%) Concordance (%)
O 083751
Healthy T a N/A b 94.44 94.44 88.9 88.9
N/T a N/A b 100 100 100 100
O 086398
Low
T a 100 N/A b 100 100 100
N/T a 100 N/A b 100 100 100
O 086397
Medium
T a 100 N/A b 100 100 100
N/T a 100 N/A b 100 100 100
All positive levels
T a 100 N/A b 100 100 100
N/T a 100 N/A b 100 100 100
a T= Treatment with Thiram fungicide, N/T=No treatment applied. b N/A= Not applicable.
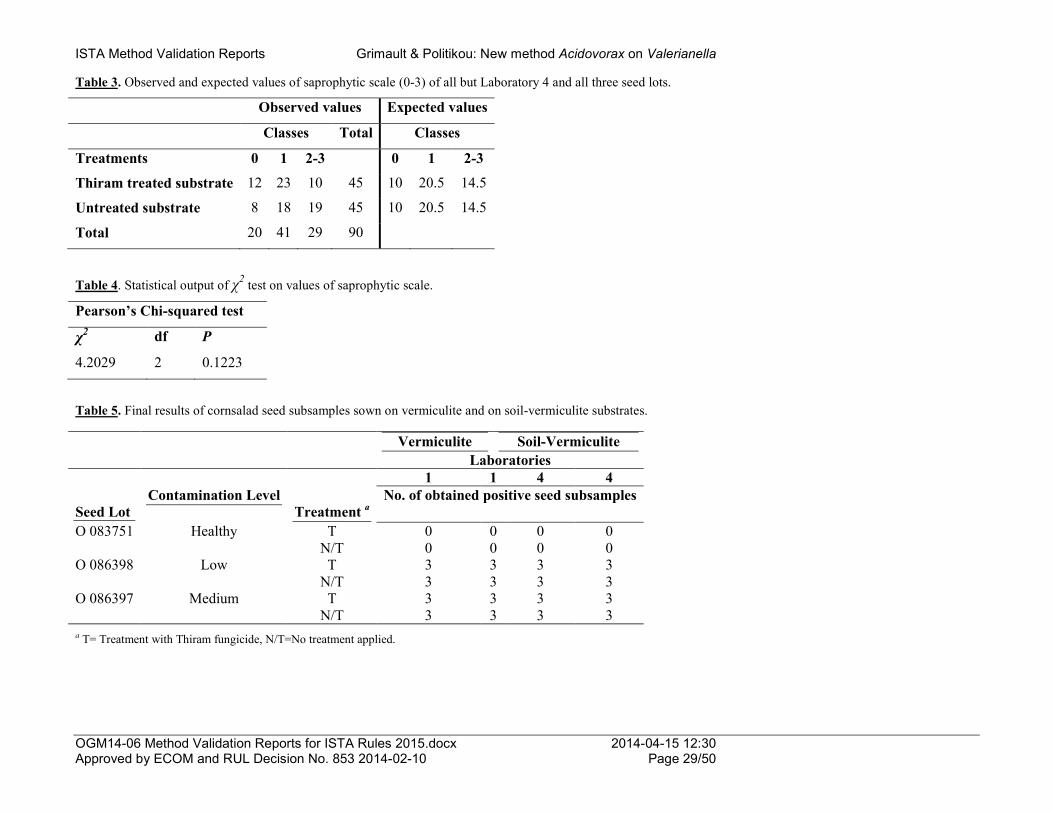
ISTA Method Validation Reports Grimault & Politikou: New method Acidovorax on Valerianella
OGM14-06 Method Validation Reports for ISTA Rules 2015.docx 2014-04-15 12:30 Approved by ECOM and RUL Decision No. 853 2014-02-10 Page 29/50
Table 3. Observed and expected values of saprophytic scale (0-3) of all but Laboratory 4 and all three seed lots.
Observed values Expected values
Classes Total Classes
Treatments 0 1 2-3 0 1 2-3
Thiram treated substrate 12 23 10 45 10 20.5 14.5
Untreated substrate 8 18 19 45 10 20.5 14.5
Total 20 41 29 90
Table 4. Statistical output of χ2 test on values of saprophytic scale.
Pearson’s Chi-squared test
χ2 df P
4.2029 2 0.1223
Table 5. Final results of cornsalad seed subsamples sown on vermiculite and on soil-vermiculite substrates.
Vermiculite Soil-Vermiculite Laboratories 1 1 4 4 Seed Lot
Contamination Level Treatment a
No. of obtained positive seed subsamples
O 083751 Healthy T 0 0 0 0 N/T 0 0 0 0
O 086398 Low T 3 3 3 3 N/T 3 3 3 3
O 086397 Medium T 3 3 3 3 N/T 3 3 3 3
a T= Treatment with Thiram fungicide, N/T=No treatment applied.

ISTA Method Validation Reports Grimault & Politikou: New method Acidovorax on Valerianella
OGM14-06 Method Validation Reports for ISTA Rules 2015.docx 2014-04-15 12:30 Approved by ECOM and RUL Decision No. 853 2014-02-10 Page 30/50
Appendix I – Homogeneity test results for the Av contaminated seed lots. Low level lot
Medium level lot
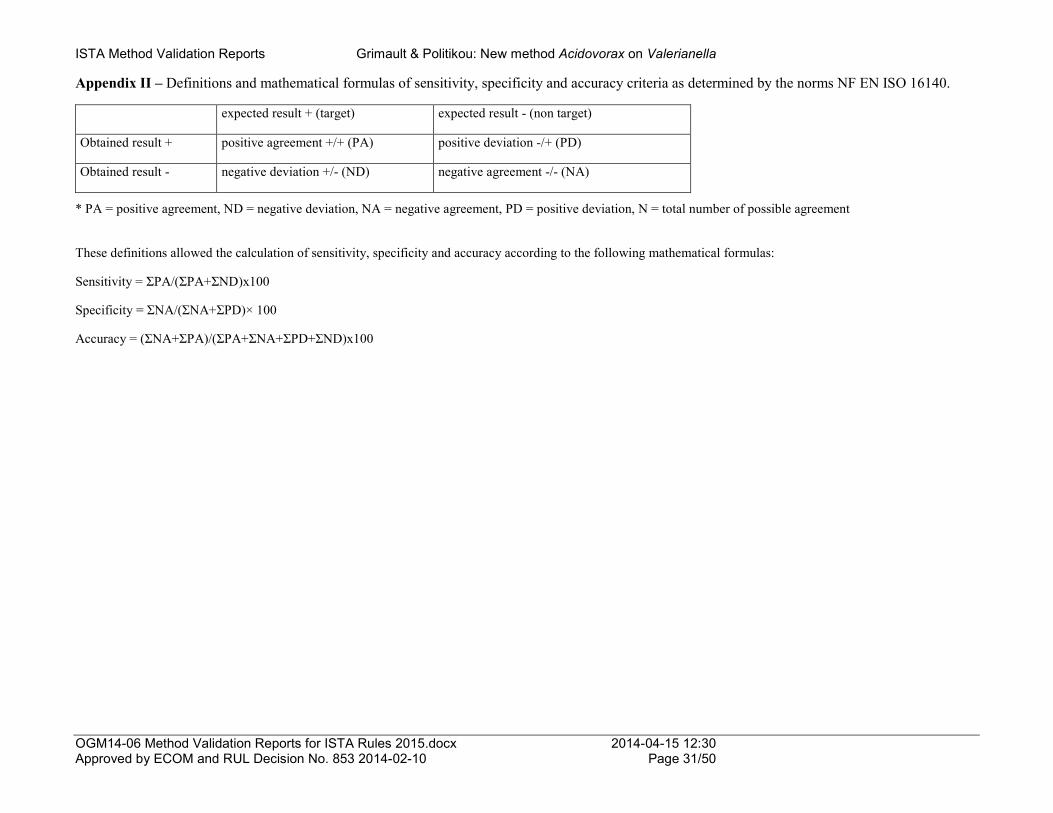
ISTA Method Validation Reports Grimault & Politikou: New method Acidovorax on Valerianella
OGM14-06 Method Validation Reports for ISTA Rules 2015.docx 2014-04-15 12:30 Approved by ECOM and RUL Decision No. 853 2014-02-10 Page 31/50
Appendix II – Definitions and mathematical formulas of sensitivity, specificity and accuracy criteria as determined by the norms NF EN ISO 16140.
expected result + (target) expected result - (non target)
Obtained result + positive agreement +/+ (PA) positive deviation -/+ (PD)
Obtained result - negative deviation +/- (ND) negative agreement -/- (NA)
* PA = positive agreement, ND = negative deviation, NA = negative agreement, PD = positive deviation, N = total number of possible agreement
These definitions allowed the calculation of sensitivity, specificity and accuracy according to the following mathematical formulas:
Sensitivity = ΣPA/(ΣPA+ΣND)x100
Specificity = ΣNA/(ΣNA+ΣPD)× 100
Accuracy = (ΣNA+ΣPA)/(ΣPA+ΣNA+ΣPD+ΣND)x100
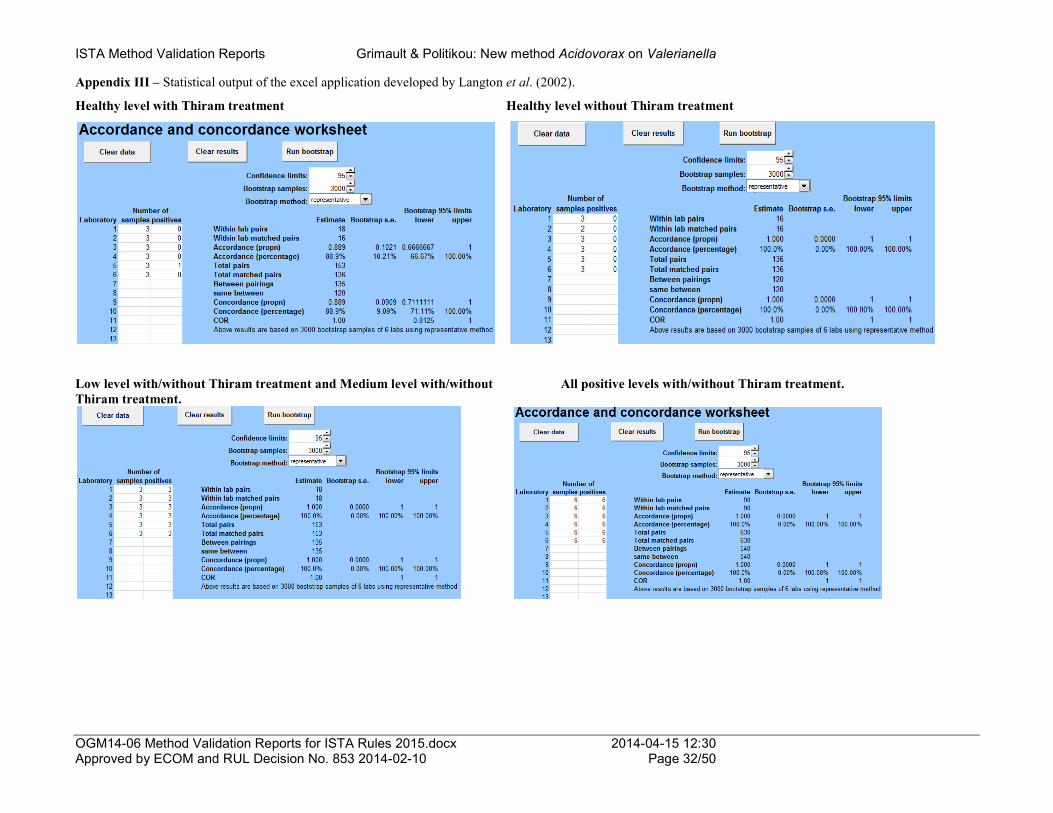
ISTA Method Validation Reports Grimault & Politikou: New method Acidovorax on Valerianella
OGM14-06 Method Validation Reports for ISTA Rules 2015.docx 2014-04-15 12:30 Approved by ECOM and RUL Decision No. 853 2014-02-10 Page 32/50
Appendix III – Statistical output of the excel application developed by Langton et al. (2002).
Healthy level with Thiram treatment Healthy level without Thiram treatment
Low level with/without Thiram treatment and Medium level with/without All positive levels with/without Thiram treatment. Thiram treatment.

ISTA Method Validation Reports Khajeh-Hosseini et al: Conductivity test for Cicer arietinum
OGM14-06 Method Validation Reports for ISTA Rules 2015.docx 2014-04-15 12:30 Approved by ECOM and RUL Decision No. 853 2014-02-10 Page 33/50
Proposal for the addition of Cicer arietinum (Kabuli type) as a species to which the conductivity test for seed vigour can be applied Mohammad Khajeh-Hosseini1, Carina Gallo2 and Hulya Ilbi3
1Department of Crop Science, Faculty of Agriculture, Ferdowsi University of Mashhad, Mashhad, Iran. [email protected] or [email protected] 2. National Institute of Agricultural Research, Oliveros Experimental Station, Oliveros, Argentina 3 Seed Technology Centre, Department of Horticulture, Faculty of Agriculture, Ege University, Izmir, Turkey
Summary Six seed lots of Cicer arietinum (Kabuli type), all having a laboratory germination of >80%, were tested by three laboratories using the electrical conductivity test, as described in the ISTA Rules for Pisum sativum for 24h in two runs in each laboratory. All laboratories consistently identified the same significant differences in the seed lot conductivity and the data was repeatable within laboratories and reproducible between laboratories. This provides evidence in support of the addition of Cicer arietinum (Kabuli type), to the ISTA Rules as a species for which the conductivity test can be applied.
Introduction The conductivity test is validated in the ISTA Rules as a test that can be applied to species of Pisum sativum (garden pea only, excluding petit-pois varieties), Phaseolus vulgaris and Glycine max. This test is based on the leakage of solutes that occurs from all seeds that are soaked in water. These solutes include sugars, amino acids and most importantly for the test, electrolytes. Thus the incidence of leakage can be detected by measurement of the electrical conductivity (EC) of the seed soak-water. The test was developed following the observation of the correlation between solute leakage and field emergence in wrinkled-seeded vining peas (Pisum sativum). Low leakage and therefore low conductivity was associated with seeds that emerged well, that is seeds with high vigour; whereas low vigour seeds with poor emergence had high levels of leakage and conductivity (Matthews and Whitbread, 1968). The conductivity test has also been used as an indicator of field emergence in field beans (Vicia faba, Hegarty, 1977), Phaseolus beans (Matthews and Bradnock, 1968; Powell et al., 1986), soybean (Oliveria et al., 1984; Yaklich et al., 1984) and long bean (Vigna sesquipedalis; Abdullah et al., 1991). Leakage has also been related to emergence in the light-coloured, larger seeded Kabuli type chickpea (Cicer arietinum) (Khajeh-Hosseini et al., 2007; Khajeh-Hosseini and Rezazadeh, 2011). Investigations are currently in progress using the coloured, smaller-seeded Desi type (ISTA Vigour Committee, 2013-2016). The test identifies where solute leakage occurs as a result of decreased membrane integrity and the death of tissue during the ageing of seeds. The objective of this study was to demonstrate that the conductivity test applied to Cicer arietinum (Kabuli type), is both repeatable within laboratories and reproducible between laboratories.
Materials and Methods Samples of six seed lots of Cicer arietinum were obtained from Plant Research Institute, Ferdowsi University of Mashhad. The seeds originated from Iran and all had a normal germination above 80%. Coded samples of the seed lots were sent from Mashhad, Iran to the participating laboratories, namely Department of Crop Science, Ferdowsi University of Mashhad, Mashhad, Iran, Department of Horticulture, Ege University, Izmir, Turkey; National Institute of Agricultural Research, Oliveros Experimental Station, Oliveros, Argentina. Each laboratory completed two runs of the conductivity

ISTA Method Validation Reports Khajeh-Hosseini et al: Conductivity test for Cicer arietinum
OGM14-06 Method Validation Reports for ISTA Rules 2015.docx 2014-04-15 12:30 Approved by ECOM and RUL Decision No. 853 2014-02-10 Page 34/50
test using the same method as that described for peas in the ISTA Rules (ISTA, 2013) i.e. four replicates of 50 seeds in each run, each soaked in 250 ml deionised/ distilled water for 24 h at 20oC. The conductivity was measured after 24 h and expressed as µS cm-1 g-1 of seed.
The data from each run of conductivity was analysed separately using
(a) Analysis of Variance: Data were analysed by two way analysis of variance using the statistical package SAS (Version 9.1) followed by the calculation of the LSD.
(b) calculation of z-scores and
(c) the statistical tool developed by S. Grégoire according to ISO 5725-2 to calculate h-values and k-values. The statistical tool is available for download at the ISTA website: http://www.seedtest.org/upload/cms/user/ISO572511.zip Results The means for each of the seed lots in both runs of the test of measurements of the conductivity showed clear and significant differences in seed leachate conductivity and hence vigour (Tables 1, and 3). Overall, seed lots of A, D and F had the highest conductivity in both runs of measurements, i.e. lowest vigour, followed by lot C, while lots B and E had the lowest conductivity indicating the highest vigour.
Application of Table 15B from the ISTA Rules (ISTA, 2013) showed that, the replicate data (Appendix 1 and 2) for lots B, C and E in each laboratory were in tolerance with one another. The mean conductivity measurements for lots A, D and F were all greater than 53.9, the highest value for which there is a tolerance value in Table 15B (ISTA, 2013). However, if the value for a mean of 53.9 µS cm-1 g-1 i.e. 13.8 is applied, the data for these lots is in tolerance, with the exception of lot D in the first run in Lab 2. The range in the replicate data for lot D in Lab 2, run 1 was clearly different from that seen in all other tests on this lot, suggesting that there was a particular problem during testing.
There were small, but significant, differences in the overall means from the three laboratories (Tables 1 and 3). However, the lot means from individual labs were in tolerance for lots B, C and E in both runs. Since the overall means for lots A, D and F were above 53.9, the maximum tolerance value in Table 15D (ISTA, 2013) was applied i.e. 12.4. The lab means for lot A were therefore in tolerance in Run 1 and means for all three lots (A, D and F) were in tolerance in Run 2.
The Coefficient of Variation for the comparative test was 5.9 a value comparable with that reported (6.4%) for the method validation of conductivity for Glycine max (Powell, 2012).
Calculation of the z-scores (Tables 2 and 4) revealed that all data fell within the values that are acceptable within ISTA proficiency tests.
Repeatability and reproducibility were analysed with the statistical tool developed by S. Grégoire, based on ISO 5725-2; this allows the calculation of h- and k-values. The h-values show the tendency for a laboratory to give over-estimations or under-estimations compared to the mean of all the results available whereas the k-values give a measure of the variability of the repeats. Higher values indicate greater under- or over-estimations (h-values) or greater variability between replicates (k-values).
No significant h-values were found in both runs (Figure 1 and 3), indicating that the measurements were not over or underestimated. There was only one significant k-value, namely for lot D in lab 2 in the first run (Figure 2) indicating that there was greater variability between replicates.
Repeatability and reproducibility values are affected by the examined species and the seed quality of the lots tested, with low vigour seeds often having higher values. It is therefore not possible to compare directly the data from comparative tests using different seed lots. The values obtained for
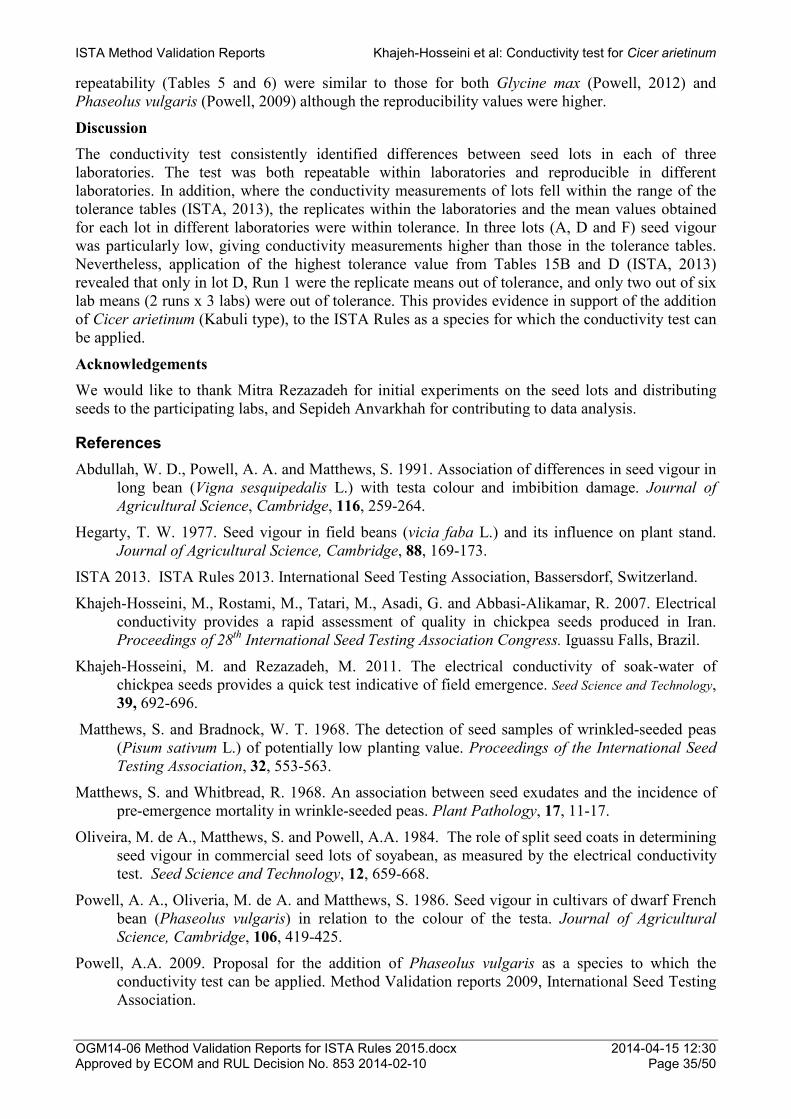
ISTA Method Validation Reports Khajeh-Hosseini et al: Conductivity test for Cicer arietinum
OGM14-06 Method Validation Reports for ISTA Rules 2015.docx 2014-04-15 12:30 Approved by ECOM and RUL Decision No. 853 2014-02-10 Page 35/50
repeatability (Tables 5 and 6) were similar to those for both Glycine max (Powell, 2012) and Phaseolus vulgaris (Powell, 2009) although the reproducibility values were higher.
Discussion The conductivity test consistently identified differences between seed lots in each of three laboratories. The test was both repeatable within laboratories and reproducible in different laboratories. In addition, where the conductivity measurements of lots fell within the range of the tolerance tables (ISTA, 2013), the replicates within the laboratories and the mean values obtained for each lot in different laboratories were within tolerance. In three lots (A, D and F) seed vigour was particularly low, giving conductivity measurements higher than those in the tolerance tables. Nevertheless, application of the highest tolerance value from Tables 15B and D (ISTA, 2013) revealed that only in lot D, Run 1 were the replicate means out of tolerance, and only two out of six lab means (2 runs x 3 labs) were out of tolerance. This provides evidence in support of the addition of Cicer arietinum (Kabuli type), to the ISTA Rules as a species for which the conductivity test can be applied.
Acknowledgements We would like to thank Mitra Rezazadeh for initial experiments on the seed lots and distributing seeds to the participating labs, and Sepideh Anvarkhah for contributing to data analysis.
References Abdullah, W. D., Powell, A. A. and Matthews, S. 1991. Association of differences in seed vigour in
long bean (Vigna sesquipedalis L.) with testa colour and imbibition damage. Journal of Agricultural Science, Cambridge, 116, 259-264.
Hegarty, T. W. 1977. Seed vigour in field beans (vicia faba L.) and its influence on plant stand. Journal of Agricultural Science, Cambridge, 88, 169-173.
ISTA 2013. ISTA Rules 2013. International Seed Testing Association, Bassersdorf, Switzerland.
Khajeh-Hosseini, M., Rostami, M., Tatari, M., Asadi, G. and Abbasi-Alikamar, R. 2007. Electrical conductivity provides a rapid assessment of quality in chickpea seeds produced in Iran. Proceedings of 28th International Seed Testing Association Congress. Iguassu Falls, Brazil.
Khajeh-Hosseini, M. and Rezazadeh, M. 2011. The electrical conductivity of soak-water of chickpea seeds provides a quick test indicative of field emergence. Seed Science and Technology, 39, 692-696.
Matthews, S. and Bradnock, W. T. 1968. The detection of seed samples of wrinkled-seeded peas (Pisum sativum L.) of potentially low planting value. Proceedings of the International Seed Testing Association, 32, 553-563.
Matthews, S. and Whitbread, R. 1968. An association between seed exudates and the incidence of pre-emergence mortality in wrinkle-seeded peas. Plant Pathology, 17, 11-17.
Oliveira, M. de A., Matthews, S. and Powell, A.A. 1984. The role of split seed coats in determining seed vigour in commercial seed lots of soyabean, as measured by the electrical conductivity test. Seed Science and Technology, 12, 659-668.
Powell, A. A., Oliveria, M. de A. and Matthews, S. 1986. Seed vigour in cultivars of dwarf French bean (Phaseolus vulgaris) in relation to the colour of the testa. Journal of Agricultural Science, Cambridge, 106, 419-425.
Powell, A.A. 2009. Proposal for the addition of Phaseolus vulgaris as a species to which the conductivity test can be applied. Method Validation reports 2009, International Seed Testing Association.

ISTA Method Validation Reports Khajeh-Hosseini et al: Conductivity test for Cicer arietinum
OGM14-06 Method Validation Reports for ISTA Rules 2015.docx 2014-04-15 12:30 Approved by ECOM and RUL Decision No. 853 2014-02-10 Page 36/50
Powell, A.A. 2012. Proposal for the addition of Glycine max as a species to which the conductivity test for seed vigour can be applied. Method Validation Reports 2012, International Seed Testing Association.
Yaklich, R.W., Kulik, M.M. and Anderson, J.D. 1984. Evaluation of vigour tests in soybean seeds: relationship of ATP, conductivity, and radioactive tracer multiple criteria laboratory tests to field performance. Crop Science, 19, 806-810
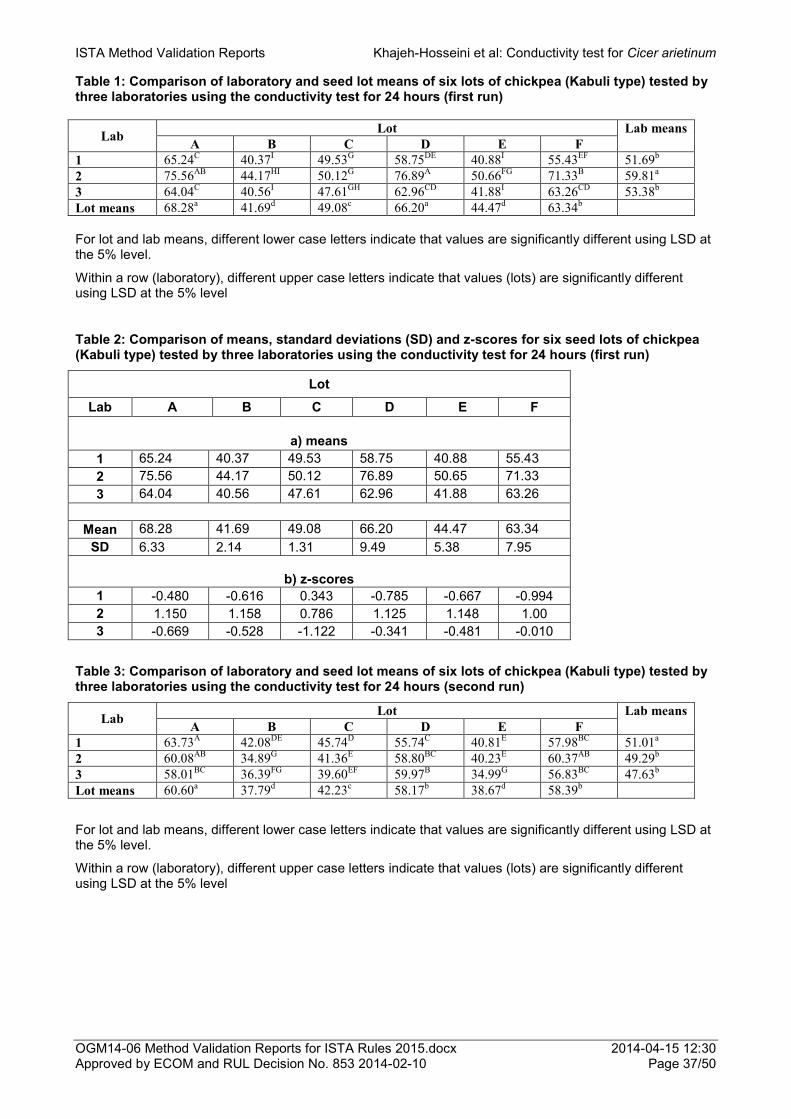
ISTA Method Validation Reports Khajeh-Hosseini et al: Conductivity test for Cicer arietinum
OGM14-06 Method Validation Reports for ISTA Rules 2015.docx 2014-04-15 12:30 Approved by ECOM and RUL Decision No. 853 2014-02-10 Page 37/50
Table 1: Comparison of laboratory and seed lot means of six lots of chickpea (Kabuli type) tested by three laboratories using the conductivity test for 24 hours (first run)
Lab Lot Lab means A B C D E F
1 65.24C 40.37I 49.53G 58.75DE 40.88I 55.43EF 51.69b 2 75.56AB 44.17HI 50.12G 76.89A 50.66FG 71.33B 59.81a 3 64.04C 40.56I 47.61GH 62.96CD 41.88I 63.26CD 53.38b Lot means 68.28a 41.69d 49.08c 66.20a 44.47d 63.34b For lot and lab means, different lower case letters indicate that values are significantly different using LSD at the 5% level.
Within a row (laboratory), different upper case letters indicate that values (lots) are significantly different using LSD at the 5% level
Table 2: Comparison of means, standard deviations (SD) and z-scores for six seed lots of chickpea (Kabuli type) tested by three laboratories using the conductivity test for 24 hours (first run)
Lot Lab A B C D E F
a) means
1 65.24 40.37 49.53 58.75 40.88 55.43 2 75.56 44.17 50.12 76.89 50.65 71.33 3 64.04 40.56 47.61 62.96 41.88 63.26
Mean 68.28 41.69 49.08 66.20 44.47 63.34
SD 6.33 2.14 1.31 9.49 5.38 7.95
b) z-scores 1 -0.480 -0.616 0.343 -0.785 -0.667 -0.994 2 1.150 1.158 0.786 1.125 1.148 1.00 3 -0.669 -0.528 -1.122 -0.341 -0.481 -0.010
Table 3: Comparison of laboratory and seed lot means of six lots of chickpea (Kabuli type) tested by three laboratories using the conductivity test for 24 hours (second run)
Lab Lot Lab means A B C D E F
1 63.73A 42.08DE 45.74D 55.74C 40.81E 57.98BC 51.01a 2 60.08AB 34.89G 41.36E 58.80BC 40.23E 60.37AB 49.29b 3 58.01BC 36.39FG 39.60EF 59.97B 34.99G 56.83BC 47.63b Lot means 60.60a 37.79d 42.23c 58.17b 38.67d 58.39b
For lot and lab means, different lower case letters indicate that values are significantly different using LSD at the 5% level.
Within a row (laboratory), different upper case letters indicate that values (lots) are significantly different using LSD at the 5% level

ISTA Method Validation Reports Khajeh-Hosseini et al: Conductivity test for Cicer arietinum
OGM14-06 Method Validation Reports for ISTA Rules 2015.docx 2014-04-15 12:30 Approved by ECOM and RUL Decision No. 853 2014-02-10 Page 38/50
Table 4: Comparison of means, standard deviations (SD) and z-scores for six seed lots of chickpea (Kabuli type) tested by three laboratories using the conductivity test for 24 hours (second run)
Lot Lab A B C D E F
a) means
1 63.73 42.08 45.74 55.74 40.81 57.98 2 60.06 34.89 41.36 58.80 40.22 60.36 3 58.01 36.39 39.60 59.97 34.98 56.83
Mean 60.60 37.79 42.23 58.17 38.67 58.39
SD 2.90 1.06 3.16 2.18 3.21 1.80
b) z-scores 1 1.079 1.051 1.110 -1.114 0.666 -0.227 2 -0.182 -2.731 -0.275 0.288 0.482 1.094 3 -0.893 -1.320 -0.832 0.825 -1.149 -0.866
Table 5: Values for repeatability and reproducibility of results from the conductivity test for 24 hours (first run) on Cicer arietinum (Kabuli type)
Lot Repeatability Reproducibility A 2.9413 6.8287 B 2.6171 3.1164 C 3.1967 3.0626 D 5.1384 10.4841 E 2.0213 5.6599 F 3.7064 8.5755
Table 6: Values for repeatability and reproducibility of results from the conductivity test for 24 hours (second run) on Cicer arietinum (Kabuli type)
Lot Repeatability Reproducibility A 1.3704 3.1318 B 3.1056 4.6488 C 3.0902 4.1419 D 2.8252 3.2793 E 1.8312 3.5785 F 3.0154 3.1754
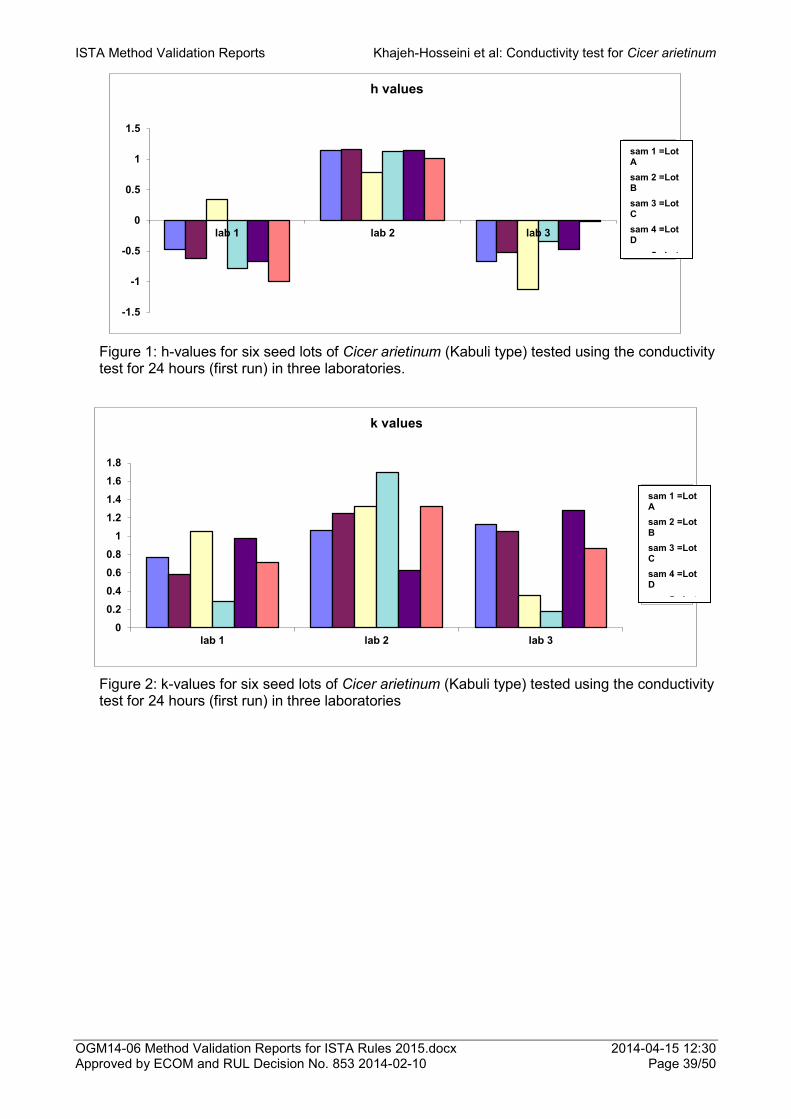
ISTA Method Validation Reports Khajeh-Hosseini et al: Conductivity test for Cicer arietinum
OGM14-06 Method Validation Reports for ISTA Rules 2015.docx 2014-04-15 12:30 Approved by ECOM and RUL Decision No. 853 2014-02-10 Page 39/50
Figure 1: h-values for six seed lots of Cicer arietinum (Kabuli type) tested using the conductivity test for 24 hours (first run) in three laboratories.
Figure 2: k-values for six seed lots of Cicer arietinum (Kabuli type) tested using the conductivity test for 24 hours (first run) in three laboratories
-1.5
-1
-0.5
0
0.5
1
1.5
lab 1 lab 2 lab 3
h values
sam 1
sam 2
sam 3
sam 4
sam 5
sam 6
00.20.40.60.8
11.21.41.61.8
lab 1 lab 2 lab 3
k values
sam 1
sam 2
sam 3
sam 4
sam 5
sam 6
sam 1 =Lot A
sam 2 =Lot B
sam 3 =Lot C
sam 4 =Lot D
5 L t
sam 1 =Lot A
sam 2 =Lot B
sam 3 =Lot C
sam 4 =Lot D
5 L t
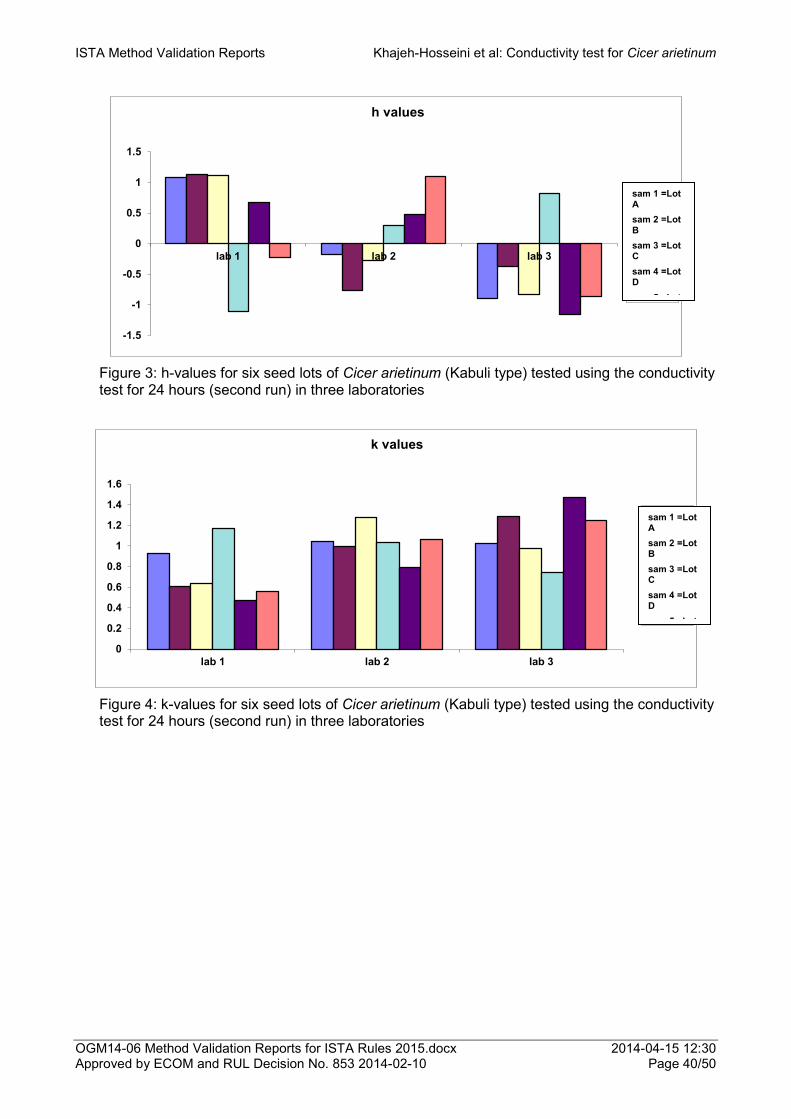
ISTA Method Validation Reports Khajeh-Hosseini et al: Conductivity test for Cicer arietinum
OGM14-06 Method Validation Reports for ISTA Rules 2015.docx 2014-04-15 12:30 Approved by ECOM and RUL Decision No. 853 2014-02-10 Page 40/50
Figure 3: h-values for six seed lots of Cicer arietinum (Kabuli type) tested using the conductivity test for 24 hours (second run) in three laboratories
Figure 4: k-values for six seed lots of Cicer arietinum (Kabuli type) tested using the conductivity test for 24 hours (second run) in three laboratories
-1.5
-1
-0.5
0
0.5
1
1.5
lab 1 lab 2 lab 3
h values
sam 1
sam 2
sam 3
sam 4
sam 5
sam 6
0
0.2
0.4
0.6
0.8
1
1.2
1.4
1.6
lab 1 lab 2 lab 3
k values
sam 1
sam 2
sam 3
sam 4
sam 5
sam 6
sam 1 =Lot A
sam 2 =Lot B
sam 3 =Lot C
sam 4 =Lot D
5 L t
sam 1 =Lot A
sam 2 =Lot B
sam 3 =Lot C
sam 4 =Lot D
5 L t

ISTA Method Validation Reports Khajeh-Hosseini et al: Conductivity test for Cicer arietinum
OGM14-06 Method Validation Reports for ISTA Rules 2015.docx 2014-04-15 12:30 Approved by ECOM and RUL Decision No. 853 2014-02-10 Page 41/50
Appendix 1:
Data for each replicate conductivity reading for each of six lots taken in each of three laboratories (first run)
Lot Rep Lab
1 2 3 A 1 62.86 77.03 66.08 2 64.44 70.87 65.33 3 65.43 76.91 65.67 4 68.23 77.44 59.08 Mean 65.24 75.56 64.04 B 1 42.39 46.10 36.57 2 40.37 45.52 42.13 3 38.69 45.74 40.91 4 40.02 39.30 42.64 Mean 40.37 44.17 40.56 C 1 47.02 50.94 47.19 2 46.24 55.08 46.83 3 52.65 49.71 49.29 4 52.19 44.75 47.14 Mean 49.53 50.12 47.61 D 1 57.02 64.93 63.13 2 58.16 75.82 63.49 3 60.36 83.57 61.65 4 59.46 83.22 63.56 Mean 58.75 76.89 62.96 E 1 38.71 52.44 39.67 2 41.77 49.54 43.41 3 39.86 50.02 44.74 4 43.16 50.63 39.69 Mean 40.88 50.66 41.88 F 1 57.53 65.99 61.37 2 56.57 77.27 64.63 3 56.03 73.04 59.97 4 51.58 69.03 67.07 Mean 55.43 71.33 63.26

ISTA Method Validation Reports Powell et al: Radicle emergence test for oil seed rape
OGM14-06 Method Validation Reports for ISTA Rules 2015.docx 2014-04-15 12:30 Approved by ECOM and RUL Decision No. 853 2014-02-10 Page 42/50
Early counts of radicle emergence as a vigour test for oil seed rape A.A. Powell1, S. Matthews1, L. Kerr3, G. McLaren4 and M.-H. Wagner2
1 School of Biological Sciences, Cruickshank Building, 23 St Machar Drive, University of Aberdeen, AB24 3UU, UK ([email protected]) 2 GEVES, Station Nationale d’Essais de Semences (SNES) Angers, France 3 Alexander Harley Seeds (Milnathort) Ltd, Milnathort, Tayside, KY13 7RF, UK 4 SASA, Roddinglaw Rd, Edinburgh, EH12 9FJ, UK Summary Radicle emergence (RE) of nine seed lots of oilseed rape was assessed after 30h at 20o C by each of three laboratories. Clear and significant differences were observed between lots in all laboratories. All results were within tolerance and both repeatability and reproducibility were good, there being no evidence of over-dispersion. It is proposed that the RE test be validated as a vigour test for oilseed rape. Introduction Early counts of radicle emergence of maize (after 6d at 13oC or 66 h at 20oC), have been shown to be closely related to the rate of germination, as expressed by the mean germination time (MGT) and to vigour, reflected in the rate of and final field emergence (Matthews et al., 2011a,b). This resulted in the introduction of the radicle emergence (RE) vigour test for maize to the ISTA Rules in 2010. Similar highly significant relationships have been seen in several other crop species (Matthews and Powell, 2011). Recent work on oilseed rape (Brassica napus) (Matthews et al., 2012) has shown that single counts of radicle emergence of oilseed rape, taken after 30h at 20oC are also indicative of the rate of germination and vigour. Thus, single counts of radicle emergence predicted the MGT (R2 = 0.920), 7 day field emergence (R2 = 0.961) and maximum field emergence (R2 = 0.713). In addition, the results were highly consistent between three laboratories (Matthews et al. 2012). The aim of this report is to analyse the data from the three laboratories to illustrate the repeatability and reproducibility of the test method. Materials and Methods Seed Material Nine seed lots of the winter oilseed rape cultivar Vision were selected from samples of seed lots sent to Alexander Harley (Milnathort) Seeds Ltd., Scotland for routine testing by their associated company Senova Ltd. The seed had been produced in the south of England. The standard germinations of the lots were all high, 95% or above for all except one lot which had a standard germination of 90% (table 1).
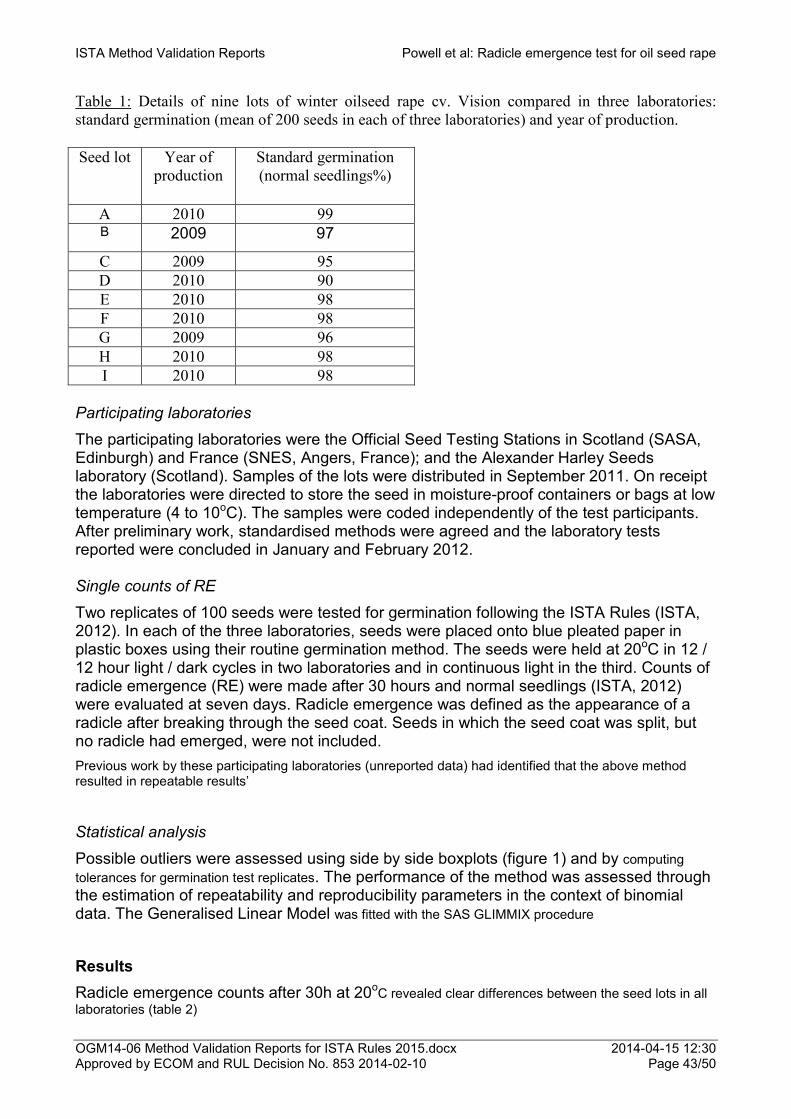
ISTA Method Validation Reports Powell et al: Radicle emergence test for oil seed rape
OGM14-06 Method Validation Reports for ISTA Rules 2015.docx 2014-04-15 12:30 Approved by ECOM and RUL Decision No. 853 2014-02-10 Page 43/50
Table 1: Details of nine lots of winter oilseed rape cv. Vision compared in three laboratories: standard germination (mean of 200 seeds in each of three laboratories) and year of production. Seed lot Year of
production Standard germination (normal seedlings%)
A 2010 99 B 2009 97
C 2009 95 D 2010 90 E 2010 98 F 2010 98 G 2009 96 H 2010 98 I 2010 98
Participating laboratories
The participating laboratories were the Official Seed Testing Stations in Scotland (SASA, Edinburgh) and France (SNES, Angers, France); and the Alexander Harley Seeds laboratory (Scotland). Samples of the lots were distributed in September 2011. On receipt the laboratories were directed to store the seed in moisture-proof containers or bags at low temperature (4 to 10oC). The samples were coded independently of the test participants. After preliminary work, standardised methods were agreed and the laboratory tests reported were concluded in January and February 2012. Single counts of RE Two replicates of 100 seeds were tested for germination following the ISTA Rules (ISTA, 2012). In each of the three laboratories, seeds were placed onto blue pleated paper in plastic boxes using their routine germination method. The seeds were held at 20oC in 12 / 12 hour light / dark cycles in two laboratories and in continuous light in the third. Counts of radicle emergence (RE) were made after 30 hours and normal seedlings (ISTA, 2012) were evaluated at seven days. Radicle emergence was defined as the appearance of a radicle after breaking through the seed coat. Seeds in which the seed coat was split, but no radicle had emerged, were not included. Previous work by these participating laboratories (unreported data) had identified that the above method resulted in repeatable results’
Statistical analysis
Possible outliers were assessed using side by side boxplots (figure 1) and by computing tolerances for germination test replicates. The performance of the method was assessed through the estimation of repeatability and reproducibility parameters in the context of binomial data. The Generalised Linear Model was fitted with the SAS GLIMMIX procedure
Results Radicle emergence counts after 30h at 20oC revealed clear differences between the seed lots in all laboratories (table 2)

ISTA Method Validation Reports Powell et al: Radicle emergence test for oil seed rape
OGM14-06 Method Validation Reports for ISTA Rules 2015.docx 2014-04-15 12:30 Approved by ECOM and RUL Decision No. 853 2014-02-10 Page 44/50
Table 2: Radicle emergence (%) after germination 30h at 20oC of nine lots of oilseed rape in each of two 100-seed replicates in three laboratories. Seed lots are placed in order of their overall mean RE test results, with the highest test result placed at the top of the table. Data in columns having the different upper case letters are significantly different (p< 0.05). Lot Lab 1 Lab 2 Lab 3 Overall lot
mean Rep 1
Rep 2
Mean Rep 1
Rep 2
Mean Rep 1
Rep 2
Mean
1 97 93 95 97 90 94 97 97 97 95 A
2 96 92 94 93 99 96 94 91 91 94 A
3 93 88 91 83 86 85 92 90 91 89 B
4 88 91 90 83 84 84 78 75 77 83 C
5 85 87 86 87 88 88 83 90 87 87 BC
6 76 76 76 74 63 69 66 61 64 70 D
7 77 74 76 70 67 69 70 59 65 70 D
8 59 59 59 53 46 50 55 48 52 53 E
9 58 56 57 50 50 50 47 45 46 51 E
Overall lab mean
80 A 76 B 74 B
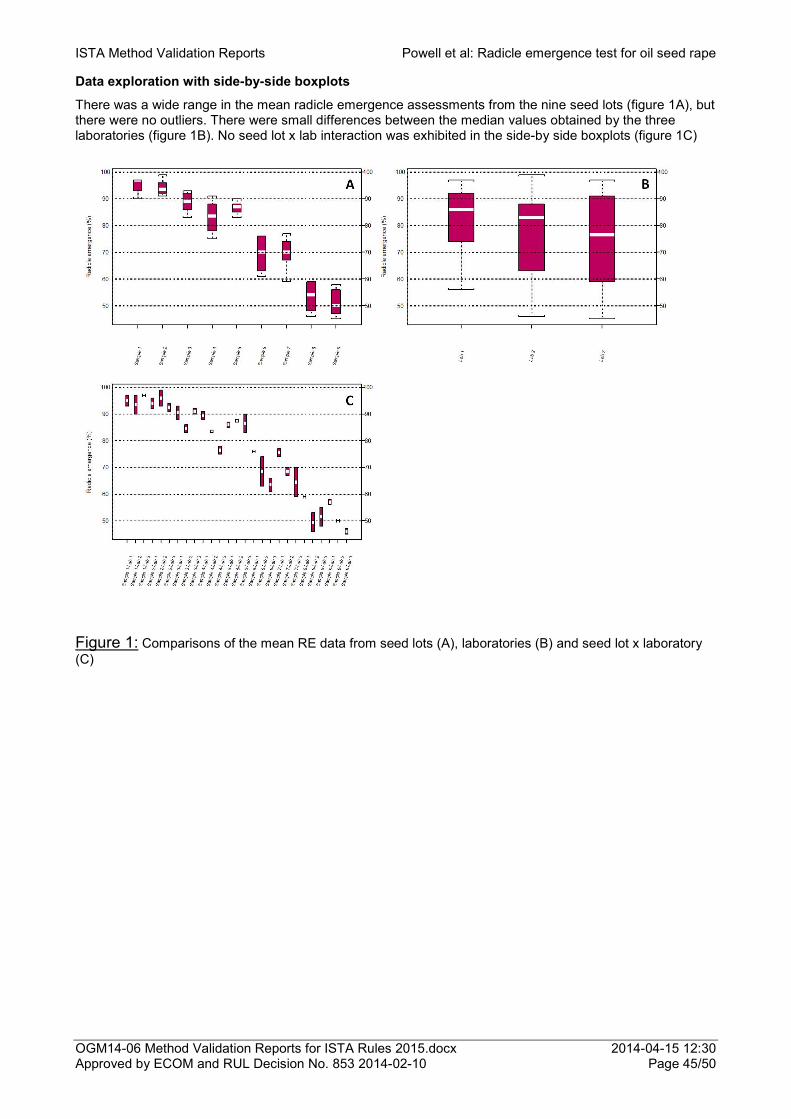
ISTA Method Validation Reports Powell et al: Radicle emergence test for oil seed rape
OGM14-06 Method Validation Reports for ISTA Rules 2015.docx 2014-04-15 12:30 Approved by ECOM and RUL Decision No. 853 2014-02-10 Page 45/50
Data exploration with side-by-side boxplots
There was a wide range in the mean radicle emergence assessments from the nine seed lots (figure 1A), but there were no outliers. There were small differences between the median values obtained by the three laboratories (figure 1B). No seed lot x lab interaction was exhibited in the side-by side boxplots (figure 1C)
Figure 1: Comparisons of the mean RE data from seed lots (A), laboratories (B) and seed lot x laboratory (C)

ISTA Method Validation Reports Powell et al: Radicle emergence test for oil seed rape
OGM14-06 Method Validation Reports for ISTA Rules 2015.docx 2014-04-15 12:30 Approved by ECOM and RUL Decision No. 853 2014-02-10 Page 46/50
Data checking
All the data was in tolerance (table 3)
Table 3: Mean germinations and tolerance ranges (2 replicates x 100 seeds) for nine lots of oilseed rape tested in three laboratories.
Seed lot Lab 1 Lab 2 Lab 3 1 Maximum tolerance range 7 8 6 Observed range 4 7 0 Mean 95 93.5 97 2 Maximum tolerance range 8 6 9 Observed range 4 6 3 Mean 94 96 92.5 3 Maximum tolerance range 9 11 9 Observed range 5 3 2 Mean 90.5 84.5 91 4 Maximum tolerance range 9 11 13 Observed range 3 1 3 Mean 89.5 83.5 76.5 5 Maximum tolerance range 11 10 11 Observed range 2 1 7 Mean 86 87.5 86.5 6 Maximum tolerance range 13 15 15 Observed range 0 11 5 Mean 76 68.5 63.5 7 Maximum tolerance range 13 15 15 Observed range 3 3 11 Mean 75.5 68.5 64.5 8 Maximum tolerance range 15 16 16 Observed range 0 7 7 Mean 59 49.5 51.5 9 Maximum tolerance range 15 16 15 Observed range 2 0 2 Mean 57 50 46

ISTA Method Validation Reports Powell et al: Radicle emergence test for oil seed rape
OGM14-06 Method Validation Reports for ISTA Rules 2015.docx 2014-04-15 12:30 Approved by ECOM and RUL Decision No. 853 2014-02-10 Page 47/50
Repeatability
Let:
. I be the total number of samples
. J be the total number of labs
. Kij be the number of reps of m seeds in sample i and lab j
. ijkp be the percentage for sample i, lab j and rep k
The repeatability standard-deviation is computed as:
( )2 100... ...r r
p pS f
m−
=
where:
. ...p is the overall average percentage.
. 2rf
is an estimate of the dispersion parameter:
2 1 ijr
i , j ij
var_ obsf
IJ var_ bin= ∑
where:
( )211ij ijk ij .
kij
var_ obs p pK
= −− ∑ and
( )100ij . ij .ij
p pvar_ bin
m−
= withij .p being the average percentage
in sample i and lab j
If 2rf > 1 one speaks of overdispersion because the data have larger variance than expected under the
assumption of a binomial distribution.
Results:
...p Sr fr
76.78 4.16 0.98
There is no evidence for overdispersion as 2rf .is not > 1.
Reproducibility
The reproducibility standard-deviation is computed as:
( )21
1ij . i ..
Ri j
p pS
I J−
=−∑∑
where:
. i = 1, 2, …, I j = 1, 2, …, J
. ij .p is the percentage in sample i and lab j

ISTA Method Validation Reports Powell et al: Radicle emergence test for oil seed rape
OGM14-06 Method Validation Reports for ISTA Rules 2015.docx 2014-04-15 12:30 Approved by ECOM and RUL Decision No. 853 2014-02-10 Page 48/50
. ij .
ji ..
pp
J=
∑
Assuming a binomial distribution, the variance of ij .p is:
( ) ( )100Var ij . ij .
ij .
p pp
n−
=
where n = 200. We then compute the following quantity to characterize overdispersion when Lab and Sample by Lab variations are considered:
( )2
2
100R
R... ...
n Sfp p
=−
where ij .
i , j...
pp
IJ=
∑
The square root of 2Rf is then compared to the f value defined by Miles (1963) in equation AG4 and which is
used to develop ISTA tolerance tables for comparing germination results from different labs.
Results:
...p SR fR f
76.78 4.58 1.53 1.74
The fR value is smaller than the f value, therefore there is no evidence of overdispersion.
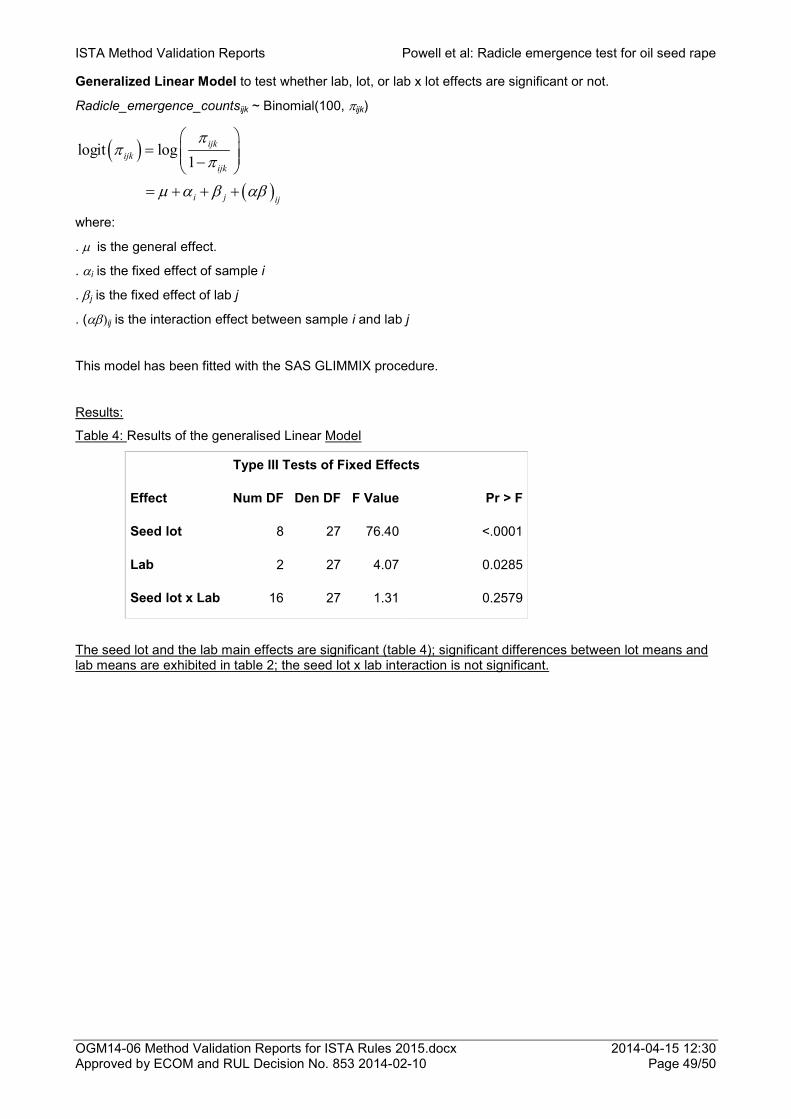
ISTA Method Validation Reports Powell et al: Radicle emergence test for oil seed rape
OGM14-06 Method Validation Reports for ISTA Rules 2015.docx 2014-04-15 12:30 Approved by ECOM and RUL Decision No. 853 2014-02-10 Page 49/50
Generalized Linear Model to test whether lab, lot, or lab x lot effects are significant or not.
Radicle_emergence_countsijk ~ Binomial(100, πijk)
( )
( )
logit log1
ijkijk
ijk
i j ij
ππ
π
µ α β αβ
= − = + + +
where:
. µ is the general effect.
. αi is the fixed effect of sample i
. βj is the fixed effect of lab j
. (αβ)ij is the interaction effect between sample i and lab j
This model has been fitted with the SAS GLIMMIX procedure.
Results:
Table 4: Results of the generalised Linear Model
Type III Tests of Fixed Effects
Effect Num DF Den DF F Value Pr > F
Seed lot 8 27 76.40 <.0001
Lab 2 27 4.07 0.0285
Seed lot x Lab 16 27 1.31 0.2579
The seed lot and the lab main effects are significant (table 4); significant differences between lot means and lab means are exhibited in table 2; the seed lot x lab interaction is not significant.

ISTA Method Validation Reports Powell et al: Radicle emergence test for oil seed rape
OGM14-06 Method Validation Reports for ISTA Rules 2015.docx 2014-04-15 12:30 Approved by ECOM and RUL Decision No. 853 2014-02-10 Page 50/50
Discussion
The significant differences in the radicle emergence of seed lots, revealed here across three laboratories have previously been shown to predict both the rate of, and final, emergence of the lots in the field (Matthews et al. 2012) and therefore predict differences in seed vigour of the lots. The standard germination (%) was also significantly correlated with the rate of, and final, emergence. However, the difference between the lowest and highest standard germination was small, only 9% when all lots were considered, and only 5% different for eight of the nine lots. Clear differences in vigour between the lots would therefore not be identified. In contrast, the range of RE test results was from 51 to 95%, clearly distinguishing differences between the lots. Thus, lots E and F were clearly identified as having higher vigour than lots I and H even though they all had the same standard germination, 98% (Table 1). In addition the repeatability and reproducibility of the data supports the proposal that the radicle emergence test can be used routinely to reveal differences in seed vigour of oilseed rape Acknowledgements
We are very grateful to Jean-Louis Laffont for completing the statistical analysis and thank Senova Ltd. for the supply of seed and information
References ISTA (2012) International Rules for Seed Testing. International Seed Testing Association, Bassersdorf,
Switzerland. Matthews, S. and Powell, A.A. (2011). Towards automated single counts of radicle emergence. Seed Testing
International, 142, 44-48. Matthews, S., Beltrami, E., El-Khadem. R., Khajeh Hosseini, M., Nasehzadeh, M. And Urso, G. (2011a).
Evidence that time for repair during early germination leads to vigour differences in maize. Seed Science and Technology, 39, 501-509.
Matthews, S., Wagner, M.-H., Ratzenboeck, A., Khajeh Hosseini, M. Casarini, E., El-Khadem, R., Yakhlifi, M. and Powell, A.A. (2011b). Early counts of radicle emergence during germination as a repeatable and reproducible vigour test for maize. Seed Testing International, 141, 39-45.
Matthews, S., Wagner, M.-H, Kerr, L., McLaren, G. and Powell, A.A. (2012). Automated determination of germination time courses by image capture and early counts of radicle emergence lead to a new vigour test for winter oilseed rape (Brassica napus L). Seed Science and Technology, 40, 413-424