information technology - eagb
TRANSCRIPT
a State of the Market Reportin Greater BaltimoreInformation Technology
prepared by:
10.24.2012
Michael Combs Research & Market Analyst
Patrick Dougherty Research & Business Development Associate

1 E. Pratt Street, Suite 200, Baltimore, MD 21202 | 410.468.0100 | 888.298.4322 | www.greaterbaltimore.org
Greater Baltimore is part of arguably the strongest Information Technology (IT) market in the US. The Baltimore-Washington region is one of the largest and most concentrated in the nation, in company with markets like Silicon Valley, New York and Boston. The area is home to many of the nation’s top IT and defense firms alongside nearly all of the nation’s federal agencies that rely on private sector firms. There are 282,080 IT professionals and 10,569 IT companies in Baltimore-Washington, making it one of the largest in the US.
In 2012, major publications and organizations have pointed to Greater Baltimore as one of the top markets for technology jobs and firms. Forbes ranked Baltimore the 5th best market for tech job growth.1 Fast Company magazine called Baltimore a “thriving tech hub.”2 The US Chamber of Commerce ranked Maryland #1 in entrepreneurship and innovation3 and CNBC ranked the state in the top ten for technology.4 Bloomberg Online called the area a “startup hot spot” due to the relationship between startups and technologies at Fort Meade.5
The purpose of this report is to better understand the drivers behind the recent national attention placed on the Baltimore market and to clarify how Greater Baltimore is positioned to compete and grow in the evolving market. This report aims to determine Greater Baltimore’s place in the Baltimore-Washington region.
Key Findings:
• Greater Baltimore is part of a larger ecosystem of firms and talent that move fluidly throughout the larger Baltimore-Washington region.
• The Greater Baltimore market is substantial and growing, both in terms of employment and production of goods and services.
• The region is one of the most concentrated major markets in the US in terms of employment in IT industries.
• The Baltimore-Washington region has more IT professionals than any market except New York and has a higher concentration of IT professionals than any market except Phoenix.
• Greater Baltimore/Central Maryland accounts for 37% of all IT employees in the Baltimore-Washington region.
• Greater Baltimore and Metropolitan DC are two of the most highly educated markets in the US and continue to educate thousands of students in IT-related fields annually.
• Greater Baltimore is one of the top US metros for research and development spending and investment.
• While the Baltimore-Washington region is the 7th largest recipient of venture capital investment, securing VC dollars remains a key distinguishing component between the Baltimore-Washington market and other large IT markets like Silicon Valley and New York.
Introduction
2

1 E. Pratt Street, Suite 200, Baltimore, MD 21202 | 410.468.0100 | 888.298.4322 | www.greaterbaltimore.org
Defining the Market
While Greater Baltimore is a clearly defined geographical area, the region is part of a larger economic area that extends across traditionally defined statistical areas. Firms in Greater Baltimore employ talent from all around the Washington-Baltimore region, and the transportation network allows a fluid relationship with the two intertwined markets.
Baltimore MSA6
With a 2011 population of 2,729,110, the Baltimore MSA ranks 20th in size among all US MSAs. It is comprised of Baltimore City and the surrounding counties of Anne Arundel, Baltimore, Carroll, Harford, Howard and Queen Anne’s. Cecil County is a partner of the Economic Alliance, but is not included in the official metro data for Greater Baltimore. MSAs that are comparable in size include San Diego, St. Louis, Tampa, Pittsburgh and Denver.
Baltimore MSA Maryland DC Suburbs
Washington DC Northern Virginia
Washington-Baltimore CSA7
With a 2011 population of 8,718,083, the Washington-Baltimore-Northern Virginia CSA ranks 4th in size among all US CSAs. The CSA region is comprised of the Baltimore MSA, the Winchester, VA MSA, and the Culpepper, VA and Lexington, MD Micropolitan Statistical Areas.
Central Maryland
When discussing talent and labor, this report will use Central Maryland as the statistical region when possible. Commuting patterns (on the next page) reveal a strong network of commuters to and from the Maryland DC Suburbs. This region is comprised of the Baltimore MSA and the counties of Frederick, Montgomery and Prince George’s.
Geographic Definitions
3

1 E. Pratt Street, Suite 200, Baltimore, MD 21202 | 410.468.0100 | 888.298.4322 | www.greaterbaltimore.org
More than 118,000 DC metro area residents commute to Greater Baltimore for work daily. Additionally, more than 190,000 Greater Baltimore residents commute to the DC metro area for work daily. Commuters from the Maryland suburbs that are traditionally defined as the DC Metro constitute nearly one-tenth of the Greater Baltimore labor pool. Combined, these two regions create Central Maryland, which is used as the statistical base for the Greater Baltimore region when appropriate.
Defining the Market
Regional Commuters
From Baltimore MSA to:
From MD Suburbs of DC to:
From DC to:
From Northern VA to:
Baltimore MSA 902,984 102,839 6,599 9,062
MD/DC Suburbs 148,113 466,768 38,620 46,558
DC 28,964 201,811 158,871 12,097
Northern VA 15,448 81,130 34,633 660,503
Source: US Census Bureau, Longitudinal Employer-Household Dynamics, OnTheMap, 2010
The Baltimore-Washington region is well connected internally and to the East Coast through comprehensive interstate, rail and air networks and hubs. Amtrak trains go from New York to 3 stations in Baltimore and Central Maryland in less than 2.5 hours. The MARC Train offers low cost travel between Greater Baltimore and the DC Metro. BWI is one of the fastest growing airports in the US and offers frequent flights to cities nationally and internationally.
These regional connections allow for the fluid movement of residents from one market to the next, which expands the talent pool and market of Greater Baltimore far into the DC Metro area.
Commuting Patterns
4

1 E. Pratt Street, Suite 200, Baltimore, MD 21202 | 410.468.0100 | 888.298.4322 | www.greaterbaltimore.org
Defining the Market
The Greater Baltimore economy relies on companies and employees getting around the region and the world efficiently. The following are some of the options available to workers and businesses.
• Amtrak is efficiently connected to major markets across the northeast corridor from Washington to Boston. The MARC Train is a state-subsidized commuter train that efficiently connects Baltimore to Washington, DC at a low cost.
• The east coast’s major thoroughfare, I-95, passes directly through Baltimore and Central Maryland. The I-695 loop and I-70 connect the central and western parts of Maryland to other states.
• The Baltimore Metro Subway connects Owings Mills through Baltimore to Johns Hopkins Hospital. The Baltimore Light Rail connects Hunt Valley through Baltimore to BWI Airport.
• The three major Baltimore-Washington area airports (BWI, DCA and IAD) provide direct service to all major US cities and most international destinations.
APPROVEDINTER-COUNTY
CONNECTOR (ICC)
83
50
95
95
95
495495
270
70
295
97
695
695
301
50
50
140
795
Che
sape
ake B
ay
Patapsco River
AMTRAK / M
ARC RAIL
LIN
E
Amtrak / MARCRail Station
ANNEARUNDEL
BALTIMORECOUNTY
CALVERT
CAROLINE
CARROLL
CECIL
CHARLESDORCHESTER
FREDERICK
HARFORD
HOWARD
MONTGOMERY
PRINCEGEORGE’S
QUEENANNE'S
ST. MARY'S
SOMERSET
TALBOT
BALTIMORE CITY
DISTRICTOF COLUMBIA
ADAMS CHESTERYORK LANCASTER
ARLINGTON
FAIRFAX
SPOTSYLVANIAWESTMORELAND
KING GEORGE
PRINCEWILLIAM
STAFFORD
LOUDOUN
PENNSYLVANIA
VIRGINIA
Columbia
Towson
BethesdaAnnapolis
Bowie
Woodlawn
Owings Mills
Hunt Valley
White Marsh
Middle River
Dundalk
Aberdeen
Havre de Grace
Elkton
Westminster
Port Deposit
Rockville
Baltimore
Washington
Frederick
REAGANNATIONALAIRPORT
BWI AIRPORT
DULLES AIRPORT
FortMeade
AberdeenProvingGround
APG Edgewood
NSAFDA
NIH
Pentagon
Johns HopkinsApplied Physics Lab
National Institutesof Standards and Technology
NSF
NASAGoddard
Fort Detrick
Centers for Medicareand Medicaid Services
National Cancer Institute
NIH
Social SecurityAdministration
Census Bureau
University of MarylandBaltimore County
Johns HopkinsUniversity
University ofMaryland, Baltimore
University of MarylandCollege Park
Transportation Options
5
1 E. Pratt Street, Suite 200, Baltimore, MD 21202 | 410.468.0100 | 888.298.4322 | www.greaterbaltimore.org
Overview of the IT Market
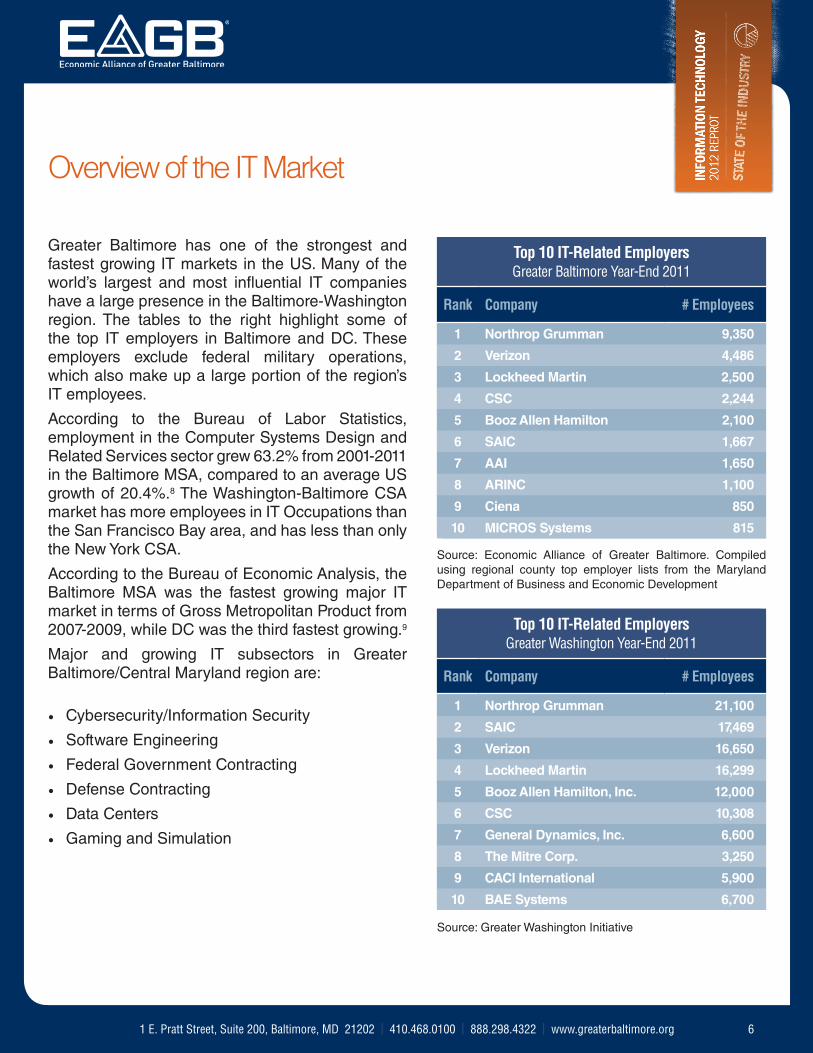
Greater Baltimore has one of the strongest and fastest growing IT markets in the US. Many of the world’s largest and most influential IT companies have a large presence in the Baltimore-Washington region. The tables to the right highlight some of the top IT employers in Baltimore and DC. These employers exclude federal military operations, which also make up a large portion of the region’s IT employees.
According to the Bureau of Labor Statistics, employment in the Computer Systems Design and Related Services sector grew 63.2% from 2001-2011 in the Baltimore MSA, compared to an average US growth of 20.4%.8 The Washington-Baltimore CSA market has more employees in IT Occupations than the San Francisco Bay area, and has less than only the New York CSA.
According to the Bureau of Economic Analysis, the Baltimore MSA was the fastest growing major IT market in terms of Gross Metropolitan Product from 2007-2009, while DC was the third fastest growing.9
Major and growing IT subsectors in Greater Baltimore/Central Maryland region are:
• Cybersecurity/Information Security
• Software Engineering
• Federal Government Contracting
• Defense Contracting
• Data Centers
• Gaming and Simulation
Top 10 IT-Related EmployersGreater Baltimore Year-End 2011
Rank Company # Employees
1 Northrop Grumman 9,350
2 Verizon 4,486
3 Lockheed Martin 2,500
4 CSC 2,244
5 Booz Allen Hamilton 2,100
6 SAIC 1,667
7 AAI 1,650
8 ARINC 1,100
9 Ciena 850
10 MICROS Systems 815
Top 10 IT-Related EmployersGreater Washington Year-End 2011
Rank Company # Employees
1 Northrop Grumman 21,100
2 SAIC 17,469
3 Verizon 16,650
4 Lockheed Martin 16,299
5 Booz Allen Hamilton, Inc. 12,000
6 CSC 10,308
7 General Dynamics, Inc. 6,600
8 The Mitre Corp. 3,250
9 CACI International 5,900
10 BAE Systems 6,700
Source: Economic Alliance of Greater Baltimore. Compiled using regional county top employer lists from the Maryland Department of Business and Economic Development
Source: Greater Washington Initiative
6

1 E. Pratt Street, Suite 200, Baltimore, MD 21202 | 410.468.0100 | 888.298.4322 | www.greaterbaltimore.org
IT Workforce
IT Employment by Industry
Given the limitations of data, it is difficult to precisely quantify the IT workforce across markets. This report uses several data categories and techniques to best capture the IT workforce in Baltimore and other major US markets.
The professional, scientific and technical services (PST) industry subsector of the Bureau of Labor Statistics (BLS) Current Employment Survey (CES) provides the most complete look at the IT labor force from an industry perspective. The data also includes non-IT researchers, engineers, bio professionals and lawyers; therefore, it is difficult to distinguish how many employees are actually in IT. The table below shows that Greater Baltimore has one of the most concentrated markets in the US, with 43% more of its labor force concentrated in PST services than the US average. When including the Maryland DC suburbs, the region is only behind San Francisco and neighboring DC.
Computer systems design and related services is a more specific subsector of PST and provides a more isolated look at the IT market. The most complete data comes from the US Census County Business Patterns, and data for this subsector lags behind two years. 2010 data indicates that Greater Baltimore is one of the most concentrated markets in the US. When including the Maryland DC suburbs, Greater Baltimore is the second most concentrated market behind neighboring DC. It is also the third largest market in terms of total employees, only behind DC and New York.
Source: Bureau of Labor Statistics, Current Employment Survey
Professional, Scientific & Technical Services 25 Largest US Metros
Year-End 2011
Rank Metro Area US Index
1 Washington, D.C. 2.69
2 San Francisco 1.90
Baltimore/Central MD 1.67
3 San Diego 1.66
4 Boston 1.57
5 Detroit 1.51
6 Denver 1.46
7 Baltimore 1.43
8 New York 1.34
9 Seattle 1.31
10 Atlanta 1.30
Computer Systems Design and Related Services25 Largest US Metros
2010
Rank Metro Area US Index Total
1 Washington, D.C. 5.72 172,629
Baltimore/Central MD 2.71 61,372
2 San Francisco 2.25 50,594
3 Baltimore 2.19 29,570
4 Denver 2.01 26,559
5 Atlanta 1.86 47,451
6 Boston 1.54 43,728
7 Dallas 1.48 47,466
8 Saint Louis 1.36 20,264
9 Philadelphia 1.32 40,800
10 Phoenix 1.29 23,898
Source: US Census Bureau County Business Patterns
7

1 E. Pratt Street, Suite 200, Baltimore, MD 21202 | 410.468.0100 | 888.298.4322 | www.greaterbaltimore.org
IT Workforce
IT Employment by Occupation
BLS Occupational Employment Statistics (OES) survey provides more granular IT employment data. Whereas the CES counts all employees at an IT firm as IT labor, the OES takes into account what the individual employee actually does for the firm. EAGB selected 13 IT-specific occupation categories (see appendix) to quantify the IT labor market.
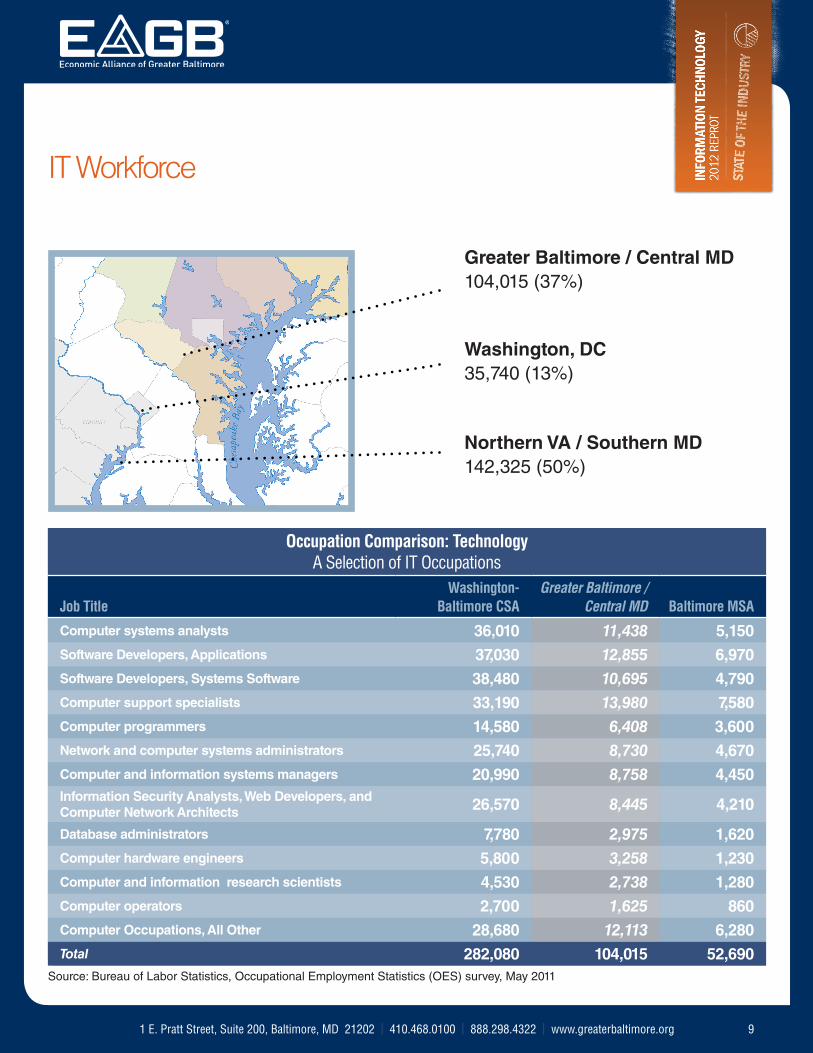
According to the OES, the Baltimore-Washington region is the 2nd most concentrated IT market in the US behind Phoenix. The Greater Baltimore/Central MD region also has one of the highest concentrations in the US. The Baltimore-Washington region is also the 2nd largest in the US behind New York. Greater Baltimore/Central MD has particularly high concentrations of software engineers, support specialists, systems analysts and systems managers.
The following page details how employment is distributed throughout the Baltimore-Washington CSA. More than 104,000 or 37% of all IT workers in the region are in Greater Baltimore/Central MD. More than half of the CSA computer operators, information research scientists and hardware engineers are in Greater Baltimore/Central MD.
Source: Bureau of Labor Statistics, Occupational Employment Statistics (OES) survey, May 2011
Note: CSA data is not available; figures were derives by adding core MSA components for each CSA.
IT Occupations21 Largest CSAs
Year-End 2011
Rank Metro Area US Index
1 Phoenix MSA 2.68
2 Washington-Baltimore 2.32
3 San Francisco-San Jose 2.27
4 Austin MSA 2.20
5 Seattle 2.08
6 Raleigh-Durham 1.81
7 Denver 1.66
Baltimore/Central MD 1.64
8 Minneapolis 1.45
Baltimore MSA 1.44
9 Dallas 1.36
10 Atlanta 1.35
IT Occupations21 Largest CSAs
Year-End 2011
Rank Metro Area Total
1 New York 307,000
2 Washington-Baltimore 282,080
3 San Francisco-San Jose 213,780
4 Los Angeles 176,520
5 Phoenix MSA 132,760
6 Chicago 120,590
7 Boston 120,300
8 Dallas 117,100
9 Seattle 111,880
Baltimore/Central MD 104,015
10 Atlanta 90,770
Baltimore MSA 52,690
8
1 E. Pratt Street, Suite 200, Baltimore, MD 21202 | 410.468.0100 | 888.298.4322 | www.greaterbaltimore.org
IT Workforce
Occupation Comparison: Technology A Selection of IT Occupations
Job TitleWashington-
Baltimore CSAGreater Baltimore /
Central MD Baltimore MSA
Computer systems analysts 36,010 11,438 5,150 Software Developers, Applications 37,030 12,855 6,970 Software Developers, Systems Software 38,480 10,695 4,790 Computer support specialists 33,190 13,980 7,580 Computer programmers 14,580 6,408 3,600 Network and computer systems administrators 25,740 8,730 4,670 Computer and information systems managers 20,990 8,758 4,450 Information Security Analysts, Web Developers, and Computer Network Architects 26,570 8,445 4,210
Database administrators 7,780 2,975 1,620 Computer hardware engineers 5,800 3,258 1,230 Computer and information research scientists 4,530 2,738 1,280 Computer operators 2,700 1,625 860 Computer Occupations, All Other 28,680 12,113 6,280 Total 282,080 104,015 52,690
Source: Bureau of Labor Statistics, Occupational Employment Statistics (OES) survey, May 2011
Greater Baltimore / Central MD104,015 (37%)
Washington, DC35,740 (13%)
Northern VA / Southern MD142,325 (50%)
9

1 E. Pratt Street, Suite 200, Baltimore, MD 21202 | 410.468.0100 | 888.298.4322 | www.greaterbaltimore.org
Education
Source: US Census Bureau, American Community Survey 2011, 5-year estimates
Percent with Bachelor’s Degree or Higher25 Largest US Metros
2011
Rank Metro Area %
1 Washington D.C. 48.0%
2 San Francisco 43.9%
3 Boston 43.1%
Baltimore/Central MD 39.3%
4 Minneapolis 38.5%
5 Denver 38.4%
6 Seattle 37.1%
7 New York 36.2%
8 Baltimore 35.8%
9 Atlanta 34.5%
10 Chicago 34.2%
US 28.5%
Percent with Graduate or Professional Degree25 Largest US Metros
2011
Rank Metro Area %
1 Washington D.C. 22.9%
2 Boston 19.0%
Baltimore/Central MD 17.8%
3 San Francisco 17.4%
4 Baltimore 15.1%
5 New York 14.9%
6 Denver 13.6%
7 Seattle 13.6%
8 Chicago 13.0%
9 Philadelphia 13.0%
10 Minneapolis 12.8%
US 10.6%
Educational Attainment
Greater Baltimore consistently ranks as one of the most highly educated markets in the US. According to the 2011 US Census American Community Survey, the Baltimore region ranked 4th in highest percentage of its population having graduate or professional degrees, while neighboring DC ranked 1st. When including the Maryland DC suburbs, Greater Baltimore/Central Maryland is ranked with the DC, Boston and San Francisco markets.
The region is ranked one of the top college destinations and is home to some of the nation’s top ranked universities with strong technology programs. In October 2012, the American Institute for Economic Research (AIER) ranked Greater Baltimore the 5th best major metro college destination in the US.10 US News and World Report’s 2013 rankings featured Johns Hopkins University as the #13 national university, the US Naval Academy as the #1 public liberal arts college, Loyola University Maryland as the #2 regional university in the north, and the University of Maryland, Baltimore County as the #1 up-and-coming school for the fourth year in a row.11
10

1 E. Pratt Street, Suite 200, Baltimore, MD 21202 | 410.468.0100 | 888.298.4322 | www.greaterbaltimore.org
Education
Source: Maryland Higher Education Commission, selected and
compiled by the Economic Alliance of Greater Baltimore and the
Maryland Department of Business and Economic Development
*Unknown/Non-Degree students are not reflected in the Total.
Enrollment and Degree Programs
The region continues to educate students for the next generation of IT professionals. From 2007-2011, more than 14,000 students graduated with IT-related bachelor’s and higher degrees from Maryland Universities. In 2011, over 17,000 students were enrolled in IT-related programs.
Maryland’s community college network serves more than 140,000 annually12 and offers specialized training assistance in cyber and IT related fields. Many of the area’s community college networks now have 2+2 programs for students interested in an IT profession. The community colleges work with the area’s 4-year degree institutions to track community college students into the universities after two years at the community college. These programs broaden the access to IT programs for more students in the area.
Area universities and colleges like University of Maryland, Baltimore County, Johns Hopkins University, Loyola University and Baltimore City Community College have specialized degree programs in IT fields like cybersecurity, information systems security and homeland security. In August 2012, University of Maryland, Baltimore County, Towson University, and Harford Community College were awarded funds through the National Science Foundation’s CyberCorps: Scholarships for Service program. The grants total $4.7 million and support students in select cyber security programs by covering up to two years of tuition, room and board, and a stipend. Scholarship recipients will then serve in a federal cyber security position for two years.13
IT Degrees Conferred (2007-2011) and IT Enrollment (2011) from Maryland Colleges and Universities
Level Conferred Enrolled
Bachelor’s 1,775 6,162
Master’s 4,542 7,019
Doctorate 736 828
Certificate 7,200 3,010
Unknown/Non-Degree* N/A 25,202
Total 14,253 17,019
Computer and Information Science Degrees ConferredBachelor’s and Higher 2005
Rank Metro Area %
Baltimore-Washington 5,382
1 New York 3,953
2 Washington, DC 3,730
3 Chicago 3,067
4 Los Angeles 2,159
5 Atlanta 1,883
6 Boston 1,756
7 Baltimore 1,652
8 Pittsburgh 1,425
9 Philadelphia 1,350
10 Santa Ana-Anaheim 1,218
Source: Atlanta Regional Consortium for Higher Education
2007 (most recent as of 2012)
11
1 E. Pratt Street, Suite 200, Baltimore, MD 21202 | 410.468.0100 | 888.298.4322 | www.greaterbaltimore.org
Innovation and Research
Research Expenditures
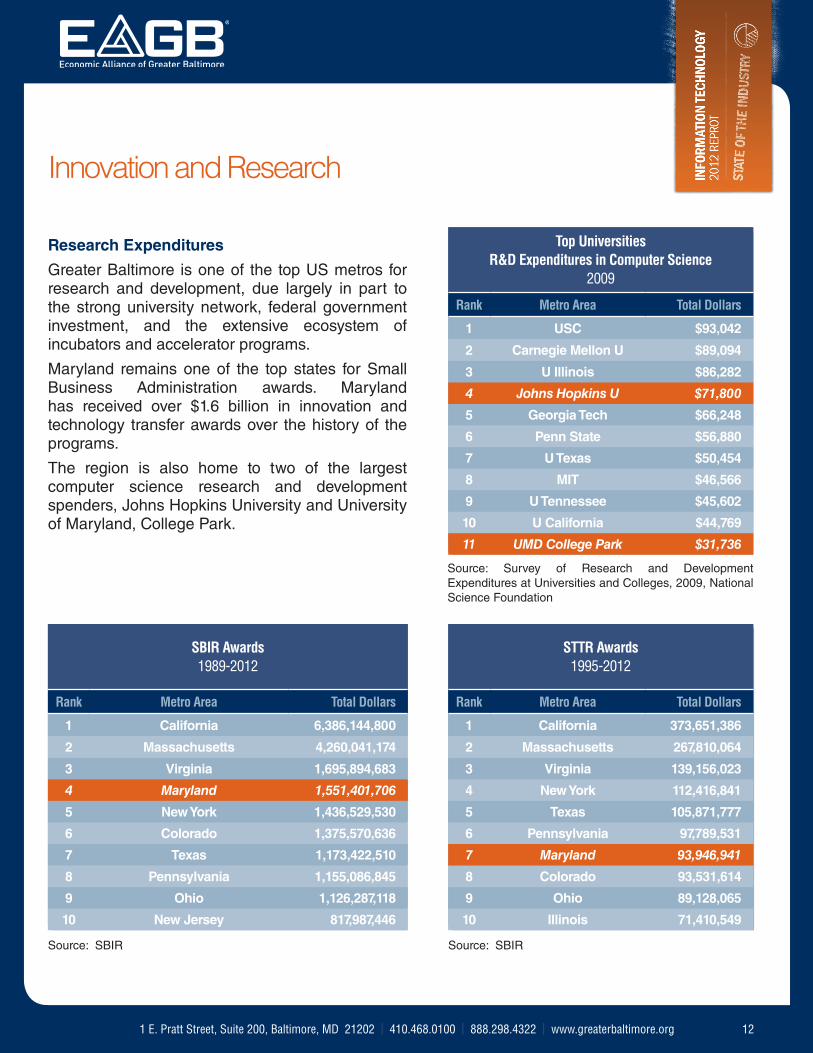
Greater Baltimore is one of the top US metros for research and development, due largely in part to the strong university network, federal government investment, and the extensive ecosystem of incubators and accelerator programs.
Maryland remains one of the top states for Small Business Administration awards. Maryland has received over $1.6 billion in innovation and technology transfer awards over the history of the programs.
The region is also home to two of the largest computer science research and development spenders, Johns Hopkins University and University of Maryland, College Park.
SBIR Awards1989-2012
Rank Metro Area Total Dollars
1 California 6,386,144,800
2 Massachusetts 4,260,041,174
3 Virginia 1,695,894,683
4 Maryland 1,551,401,706
5 New York 1,436,529,530
6 Colorado 1,375,570,636
7 Texas 1,173,422,510
8 Pennsylvania 1,155,086,845
9 Ohio 1,126,287,118
10 New Jersey 817,987,446
Source: SBIR
STTR Awards1995-2012
Rank Metro Area Total Dollars
1 California 373,651,386
2 Massachusetts 267,810,064
3 Virginia 139,156,023
4 New York 112,416,841
5 Texas 105,871,777
6 Pennsylvania 97,789,531
7 Maryland 93,946,941
8 Colorado 93,531,614
9 Ohio 89,128,065
10 Illinois 71,410,549
Top UniversitiesR&D Expenditures in Computer Science
2009
Rank Metro Area Total Dollars
1 USC $93,042
2 Carnegie Mellon U $89,094
3 U Illinois $86,282
4 Johns Hopkins U $71,800
5 Georgia Tech $66,248
6 Penn State $56,880
7 U Texas $50,454
8 MIT $46,566
9 U Tennessee $45,602
10 U California $44,769
11 UMD College Park $31,736
Source: SBIR
Source: Survey of Research and Development Expenditures at Universities and Colleges, 2009, National Science Foundation
12
1 E. Pratt Street, Suite 200, Baltimore, MD 21202 | 410.468.0100 | 888.298.4322 | www.greaterbaltimore.org
Innovation and Research
Venture Capital
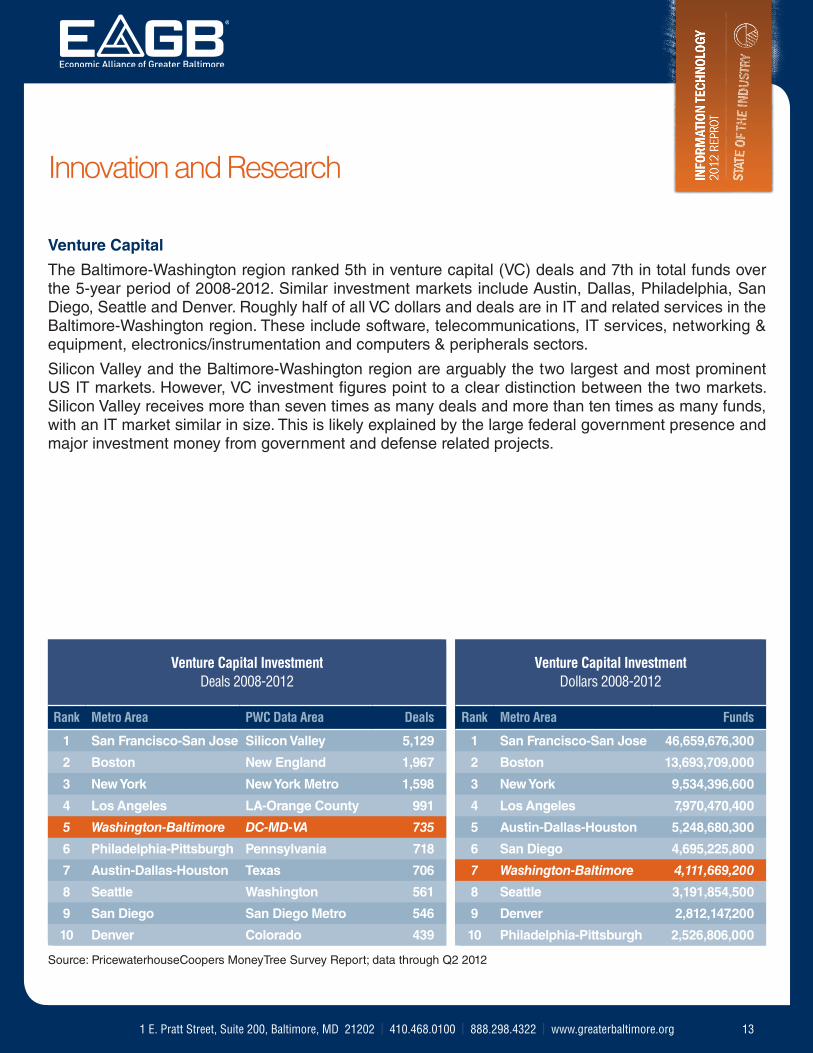
The Baltimore-Washington region ranked 5th in venture capital (VC) deals and 7th in total funds over the 5-year period of 2008-2012. Similar investment markets include Austin, Dallas, Philadelphia, San Diego, Seattle and Denver. Roughly half of all VC dollars and deals are in IT and related services in the Baltimore-Washington region. These include software, telecommunications, IT services, networking & equipment, electronics/instrumentation and computers & peripherals sectors.
Silicon Valley and the Baltimore-Washington region are arguably the two largest and most prominent US IT markets. However, VC investment figures point to a clear distinction between the two markets. Silicon Valley receives more than seven times as many deals and more than ten times as many funds, with an IT market similar in size. This is likely explained by the large federal government presence and major investment money from government and defense related projects.
Venture Capital InvestmentDeals 2008-2012
Rank Metro Area PWC Data Area Deals
1 San Francisco-San Jose Silicon Valley 5,129
2 Boston New England 1,967
3 New York New York Metro 1,598
4 Los Angeles LA-Orange County 991
5 Washington-Baltimore DC-MD-VA 735
6 Philadelphia-Pittsburgh Pennsylvania 718
7 Austin-Dallas-Houston Texas 706
8 Seattle Washington 561
9 San Diego San Diego Metro 546
10 Denver Colorado 439
Source: PricewaterhouseCoopers MoneyTree Survey Report; data through Q2 2012
Venture Capital InvestmentDollars 2008-2012
Rank Metro Area Funds
1 San Francisco-San Jose 46,659,676,300
2 Boston 13,693,709,000
3 New York 9,534,396,600
4 Los Angeles 7,970,470,400
5 Austin-Dallas-Houston 5,248,680,300
6 San Diego 4,695,225,800
7 Washington-Baltimore 4,111,669,200
8 Seattle 3,191,854,500
9 Denver 2,812,147,200
10 Philadelphia-Pittsburgh 2,526,806,000
13

1 E. Pratt Street, Suite 200, Baltimore, MD 21202 | 410.468.0100 | 888.298.4322 | www.greaterbaltimore.org
The Federal Market
Baltimore-Washington is home to nearly all of the nation’s key federal defense agencies and home to some of the nation’s largest and most influential federal military installations. The major presence of the commands and agencies is one of the principle drivers of the IT market in the region. The table below provides a sample of some of the largest federal government employers and grantors of major IT related contracts.
Command/Agency Mission/Goal
US Department of Defense Provide military forces needed to deter war and protect the security of the US.
National Institutes of Health Primary agency responsible for biomedical and health-related research.
US Department of Homeland SecuritySecure and manage American borders, including the prevention of terrorism and the enhancement of security in land, air, sea, and cyberspace.
Federal Bureau of InvestigationIntelligence-driven national security and law enforcement agency focused on threats on US soil, cyber attacks, and the defense of America's economy and democracy.
US Marshals ServicePrimary agency for fugitive investigations and performs tactical operations for missions involving homeland security, national emergencies, and domestic crises.
Naval Air Systems Command Material support for aircraft and airborne weapon systems for the US Navy.
Nuclear Regulatory CommissionOversees reactor safety and security, radioactive material safety, and aims to protect the public and promote the common defense
National Security Agency Responsible for the collection and analysis of foreign signals and communications.
Aberdeen Proving GroundHouses the construction and testing and evaluation of various military technologies, including unmanned aircraft systems and chemical and biological defense tools.
Joint Base Andrews Naval Air Facility Military installation serving as the home for Air Force One.
Fort MeadeMaintain excellence in information, intelligence, and cyber through innovation and partnership.
Indian Head Naval Surface Weapons CenterEnergetics facility that works to provide solutions to current and new threats on the battlefield.
United States Cyber CommandOrganizes existing cyber resources and synchronizes defense of US military networks.
C4ISRDevelop, acquire, and sustain C4ISR systems and battle command capabilities to maintain situational awareness on the battlefield.
DISA IT and communications support to the highest levels of US government.
14
1 E. Pratt Street, Suite 200, Baltimore, MD 21202 | 410.468.0100 | 888.298.4322 | www.greaterbaltimore.org
Looking Ahead
The Greater Baltimore-Washington region is clearly established as one the premier IT markets in the US alongside Silicon Valley and New York. The Baltimore market alone is one of the top second tier markets, alongside areas like Austin, San Diego, Seattle and Denver. As we move into 2013 and beyond, business, government and higher education will need to continue to strengthen and improve the technology ecosystem to compete with the top US markets.
Government and Defense
As the Baltimore and Washington markets continue to grow, the balance between government and commercial contracting will remain an important aspect of the IT ecosystem. Currently, the market is closely tied with the federal agencies and military operations throughout Maryland, DC and Northern Virginia, and the opportunities offered by the federal government are too great for area IT firms to ignore. Beginning in 2013, an estimated $5.4 billion in cuts to federal research funding could affect Maryland businesses and agencies.14 It is unclear how much of this will affect the IT market, but $2.1 billion is targeted in cuts is expected for defense-related projects.15 Some have speculated that IT security spending will increase in 2013, as more than half of US federal agencies plan to ramp up cybersecurity systems and spending.16 Likewise, President Obama has identified cybersecurity as a critical focus for the US government.17 Moving forward, a balance of commercial and government-related IT firms would make the Baltimore-Washington corridor less exposed to changes in federal spending.
Education
Greater Baltimore’s universities and colleges have remained on the forefront of unique and targeted education programs to train the next wave of IT professionals. Many area colleges and universities have worked closely with the business community, military and government to craft specialized programs aimed to service the ongoing and upcoming needs of firms and agencies. Similarly, Greater Baltimore has been recognized as an emerging Education Technology (EdTech) ecosystem.18 The region is already home to a number of Education Technology success stories. EdTech is a combination of learning with and about technology. It enables current and future entrepreneurs and innovators to adapt to the changing needs of today’s information economy. EdTech innovators and entrepreneurs are central to moving classrooms and the economy into the 21st century and beyond.
Business Support and Financing
Venture capital awarded to IT firms in the Baltimore-Washington area dropped from $1.1 billion between 1997-2001 to only $262 million from 2002-2006. This significant drop worried IT services firms in the region, as VC was more available in markets like New York and Silicon Valley. Since then, venture capital available to Baltimore-Washington IT firms has rebounded to $368 million from 2007-2012, an 88.97% increase in total VC funding to IT Services firms. Over $2.7 billion in venture capital was invested in IT-related sectors in the Baltimore-Washington region between 2007 and 2012.19 Availability of VC funds will remain a critical factor in the growth of the commercial IT market in Greater Baltimore.
15
1 E. Pratt Street, Suite 200, Baltimore, MD 21202 | 410.468.0100 | 888.298.4322 | www.greaterbaltimore.org
Appendix
Works Cited
1. Kotkin, J. (2012, May 17). The Best Cities For Tech Jobs. Retrieved from Forbes: http://www.forbes.com/sites/joelkotkin/2012/05/17/the-best-cities-for-tech-jobs/
2. Fast Company. (2012, June 11). 15 Tech Scenes In Places You’d Never Think To Look. Retrieved from Fast Company: http://www.fastcompany.com/pics/why-start-united-states-innovation?slide=1#15
3. National Chamber Foundation. (2012, June 13). Enterprising States 2012. Retrieved from the National Chamber Foundation: http://ncf.uschamber.com/library/2012/06/enterprising-states-2012
4. Thompson, C. (2012, July 10). The Top 10 States For Technology. Retrieved from CNBC.com: http://www.cnbc.com/id/48058147/The_Top_10_States_For_Technology?slide=1
5. Majmudar, N. (2012, January 13). Fort Meade as Cyber Hub Turns Maryland Into a Startup Hot Spot. Retrieved from Bloomberg: http://www.bloomberg.com/news/2012-01-30/fort-meade-as-cyber-hub-turns-maryland-into-a-startup-hot-spot.html
6. U.S. Census Bureau. Census Geographic Glossary. Retrieved from the US Census: http://www.census.gov/geo/lv4help/cengeoglos.html
7. Ibid.
8. Bureau of Labor Statistics, Economic Alliance of Greater Baltimore using Current Employment Statistics. Retrieved from: http://www.bls.gov/data/#employment
9. Bureau of Economic Analysis, Economic Alliance of Greater Baltimore using Gross Domestic Product by Metropolitan Area. Retrieved from: http://www.bea.gov/regional/index.htm
10. AIER (2012, October 1). College Destinations Index, 2012-2013. Retrieved from AIER: https://www.aier.org/cdi
11. US News and World Report. (Accessed October 2012). Best Colleges Rankings. Retrieved from: http://colleges.usnews.rankingsandreviews.com/best-colleges
12. Maryland Higher Education Commission. (2012). 2012 Data Book. Retrieved from MHEC: http://www.mhec.state.md.us/publications/research/index.asp
13. Gantz, S. (2012, August 17). Baltimore-area colleges win $4.7M in cyber security grants. Retrieved from the Baltimore Business Journal: http://www.bizjournals.com/baltimore/news/2012/08/17/baltimore-area-colleges-win-47m-in.html?ana=e_du_pub&s=article_du&ed=2012-08-17
14. Sentementes, G. (2012, September 28). Maryland braces for mandatory federal spending cuts. Retrieved from the Baltimore Sun: http://articles.baltimoresun.com/2012-09-28/business/bs-bz-maryland-sequestration-impact-20120928_1_federal-budget-cuts-maryland-braces-federal-grants
15. Dance, S. (2012, October 18). Federal cuts could cost Md. $5.4B in research funding. Retrieved from the Baltimore Sun: http://articles.baltimoresun.com/2012-10-18/health/bs-bz-sequestration-impact-20121018_1_federal-cuts-federal-research-nasa
16. Moyle and Kelley. (2012, April 20). Research: Federal Government Cybersecurity Survey. Retrieved from Information Week: http://reports.informationweek.com/abstract/104/8769/government/research-federal-government-cybersecurity-survey.html
17. National Security Council. Cybersecurity. Retrieved from the White House: http://www.whitehouse.gov/cybersecurity
18. Wan, T. (2012, August 21). EdSurge’s Top 10 EdTech Trends. Retrieved from EdSurge: https://www.edsurge.com/n/edsurge-s-top-10-edtech-trends
19. PricewaterhouseCoopers. (Accessed October 2012). MoneyTree Report. Retrieved from PWC: https://www.pwcmoneytree.com/MTPublic/ns/index.jsp
16

1 E. Pratt Street, Suite 200, Baltimore, MD 21202 | 410.468.0100 | 888.298.4322 | www.greaterbaltimore.org
Appendix
Bureau of Labor Statistics OccupationsThe Economic Alliance of Greater Baltimore defines the Information Technology cluster as the following 13 occupations, listed below with the official Bureau of Labor Statistics definition of each:
• Computer and Information Systems Managers: plan, direct, or coordinate activities in such fields as electronic data processing, information systems, systems analysis, and computer programming.
• Computer and Information Research Scientists: conduct research into fundamental computer and information science as theorists, designers, or inventors. Develop solutions to problems in the field of computer hardware and software.
• Computer Systems Analysts: analyze science, engineering, business, and other data processing problems to implement and improve computer systems. Analyze user requirements, procedures, and problems to automate or improve existing systems and review computer system capabilities, workflow, and scheduling limitations. May analyze or recommend commercially available software.
• Computer Programmers: create, modify, and test the code, forms, and script that allow computer applications to run. Work from specifications drawn up by software developers or other individuals. May assist software developers by analyzing user needs and designing software solutions. May develop and write computer programs to store, locate, and retrieve specific documents, data, and information.
• Computer Software Engineers, Applications: develop, create, and modify general computer applications software or specialized utility programs. Analyze user needs and develop software solutions. Design software or customize software for client use with the aim of optimizing operational efficiency. May analyze and design databases within an application area, working individually or coordinating database development as part of a team. May supervise computer programmers.
• Computer Software Engineers, Systems Software: research, design, develop, and test operating systems-level software, compilers, and network distribution software for medical, industrial, military, communications, aerospace, business, scientific, and general computing applications. Set operational specifications and formulate and analyze software requirements. May design embedded systems software. Apply principles and techniques of computer science, engineering, and mathematical analysis.
• Database Administrators: administer, test, and implement computer databases, applying knowledge of database management systems. Coordinate changes to computer databases. May plan, coordinate, and implement security measures to safeguard computer databases.
• Network and Computer Systems Administrators: install, configure, and support an organization’s local area network (LAN), wide area network (WAN), and Internet systems or a segment of a network system. Monitor network to ensure network availability to all system users and may perform necessary maintenance to support network availability. May monitor and test Web site performance to ensure Web sites operate correctly and without interruption. May assist in network modeling, analysis, planning, and coordination between network and data communications hardware and software. May supervise computer user support specialists and computer network support specialists. May administer network security measures.
• Computer Support Specialists: provide technical assistance to computer users. Answer questions or resolve computer problems for clients in person, or via telephone or electronically. May provide assistance concerning the use of computer hardware and software, including printing, installation, word processing, electronic mail, and operating systems.
• Information Security Analysts, Web Developers, & Computer Network Architects: this OES occupation is a combination of data collected for the 2010 SOC occupations 15-1122 Information Security Analysts, 15-1134 Web Developers, 15-1143 Computer Network Architects and the 2000 SOC occupation 15-1081 Network Systems and Data Communications Analysts.
• Computer Occupations, All Other: this OES occupation is a combination of data collected for the 2010 SOC occupation 15-1199 Computer Occupations, All Other and the 2000 SOC occupation 15-1099 Computer Specialists, All Other.
• Computer Hardware Engineers: research, design, develop, or test computer or computer-related equipment for commercial, industrial, military, or scientific use. May supervise the manufacturing and installation of computer or computer-related equipment and components.
• Computer Operators: monitor and control electronic computer and peripheral electronic data processing equipment to process business, scientific, engineering, and other data according to operating instructions. Monitor and respond to operating and error messages. May enter commands at a computer terminal and set controls on computer and peripheral devices.
17