information to users - home - the university of...
TRANSCRIPT
The determination of cultural item biasin the California Achievement Tests.
Item Type text; Dissertation-Reproduction (electronic)
Authors McGrogan, Harold James, Jr.
Publisher The University of Arizona.
Rights Copyright © is held by the author. Digital access to this materialis made possible by the University Libraries, University of Arizona.Further transmission, reproduction or presentation (such aspublic display or performance) of protected items is prohibitedexcept with permission of the author.
Download date 20/05/2018 20:21:55
Link to Item http://hdl.handle.net/10150/184721
~-:",-;:..::..~"!-~ ...... ~'.-•.. , •.
INFORMATION TO USERS
The most advanced technology has been used to photograph and reproduce this manuscript from the microfilm master. UMI films the text directly from the original or copy submitted. Thus, some thesis and dissertation copies are in typewriter face, while others may be from any type of computer printer.
The quality of this reproduction is dependent upon the quality of the copy submitted. Broken or indistinct print, colored or poor quality illustrations and photographs, print bleedthrough, substandard margins, and improper alignment can adversely affect reproduction.
In the unlikely event that the author did not send UMI a complete manuscript and there are missing pages, these will be noted. Also, if unauthorized copyright material had to be removed, a note will indicate the deletion.
Oversize materials (e.g., maps, drawings, charts) are reproduced by sectioning the original, beginning at the upper left-hand corner and continuing from left to right in equal sections with small overlaps. Each original is also photographed in one exposure and is included in reduced form at the back of the book. These are also available as one exposure on a standard 35mm slide or as a 17" x 23" black and white photographic print for an additional charge.
Photographs included in the original manuscript have been reproduced xerographically in this copy. Higher quality 6" x 9" black and white photographic prints are available for any photographs or illustrations appearing in this copy for an additional charge. Contact UMI directly to order.
U·M·I University Microfilms International
A 8ell & Howell Information Company 300 North Zeeb Road, Ann Arbor, M148106-1346 USA
313/761-4700 800/521-0600


Order Number 8919044
The determination of cultural item bias in the California Achievement Tests
McGrogan, Harold James, Jr., Ph.D.
The University of Arizona, 1989
V·M·I 300 N. Zeeb Rd. Ann Arbor, MI 48106


THE DETERMINATION OF CULTURAL ITEM BIAS IN THE
CALIFORNIA ACHIEVEMENT TESTS
BY
Harold James McGrogan. Jr.
A Dissertation Submitted to the Faculty of the
DIVISION OF EDUCATIONAL FOUNDATIONS AND ADMINISTRATION
In Partial Fulfillment of the Requirements For the Degree of
DOCTOR OF PHILOSOPHY
WITH A MAJOR IN EDUCATIONAL PSYCHOLOGY
In the Graduate College
THE UNIVERSITY OF ARIZONA
1 9 8 9

THE UNIVERSITY OF ARIZONA GRADUATE COLLEGE
As members of the Final Examination Committee, we certify that we have read
the dissertation prepared by Harold James McGrogan. Jr.
entitled The Determination of Cultural Item Bias in the California
Achievement Tests
and recommend that it be accepted as fulfilling the dissertation requirement
for the Degree of Doctor of Philosophy
4-13-89 Date
4-13-89 Date
4-13-89 Date
Date
Date
Final approval and acceptance of this dissertation is contingent upon the candidate's submission of the final copy of the dissertation to the Graduate College.
I hereby certify that I have read this dissertation prepared under my direction and recommend that it be accepted as fulfilling the dissertation requirement.
~: ./ ? . K }!.;-- > , "
<-_//,"//;AC ///'( ~-<'('//;:$;'1 / 4-13-89 /issertation Director /// Date
STATEMENT BY AUTHOR
This dissertation has been submitted in partial fulfillment of requirements for an advanced degree at the Cniversity of Arizona and is deposited in the University Library to be made available to borrowers under rules of the Library.
Brief quotations from this dissertation are allowable without special permission. provided that accurate acknowledgement of source is made. Requests for permission for extended quotation from or reproduction of this manuscript in whole or in part may be granted by the head of the major department or the Dean of the Graduate College when in his or her judgment the proposed use of the material is in the interests of scholarship. In all other instances. however. permission must be obtained from the aU1:hor.
SIGNED:
ACKNOWLEDGEMENTS
1 wish to thank Drs. John Bergan. Shitala Mishra.
Harley Christiansen, James King, and Sigmund Hsaio for
their guidance and expertise in the preparation of my
dissertation. Special thanks are directed at Drs. John
Bergan and Shitala Mishra for their support and
encouragement throughout my graduate studies .
. 1 wish to express my sincere gratitude to Dr. James
King, mentor. professor. and most of all friend. whose
inexorable inspiration has convinced me that anything is
possible.
1 thank Mr. Mark Borgstrom for his dedication and
perseverance through a difficult computer analysis.
Most of all. I wish to express my deepest appreciation
to my wife. Alicia Judith. whose unconditional love has
provided me with the strength to continue. 1 also wish to
express my deepest appreciation to my children. Michael and
Cynthia. for their endurance and patience throughout the
preparation of this research.
4

5
TABLE OF CONTENTS
Page
LIST OF TABLES ......................................... 7
ABSTRACT ............................................... 8
CHAPTER 1
INTRODUCTION. . . . . . . . . . . . . . . . . . . . . . . . . . . . . . . . . . . . . . . . . .. 9
CHAPTER 2
REVIEW OF THE LITERATURE ............................... 17
Outcomes of Bias .................................. 19
Potential Sources of Bias ......................... 21
Bias and Unfairness ............................... 23
Test Bias Def ined. . . . . . . . . . . . . . . . . . . . . . . . . . . . . . . .. 24
External Indicators of Bias ....................... 27
Internal Indicators of Bias ....................... 28
I tem Bias.............. . . . . . . . . . . . . . . . . . . . . . . . . . .. 31
Popular Methods of Detecting Item Bias ............ 35
Judgmental Method ........................... 35 Group X Item Analysis of Variance ........... 38 Chi-Square Method ........................... 39 Item Response Theory ........................ 41
Measurement of Bias Between Groups ................ 44
IRT Computer Analyses ............................. 45
Limitations of Detection Methods .................. 35

6
TABLE OF CONTENTS (Continued)
Page CHAPTER 3
METHOD ............................................... " 48
Subjects .......................................... 48
Instrument ........................................ 48
General Descr ipt ion ......................... 48 Derived Scores .............................. 49 Standardization ............................. 50 Reliability ................................. 50 Validity .................................... 51 Subtest Description ......................... 52
Hypothesis ........................................ 53
Statistical Procedure ............................. 53
Procedure. . . . . . . . . . . . . . . . . . . . . . . . . . . . . . . . . . . . . . . .. 60
CHAPTER 4
RESULTS ................................................ 63
Anglo and Black Group Analysis .................... 66
Anglo and Hispanic Group Analysis ................. 68
Conclusion ........................................ 69
CHAPTER 5
SUMMARY AND DISCUSSION ................................. 71
Implications for Future Research .................. 75
APPENDIX ............................................... 78
REFERENCES. . . . . . . . . . . . . . . . . . . . . . . . . . . . . . . . . . . . . . . . . . . .. 79

LIST OF TABLES
Table 1. Logist form values for the a and b parameters with and without equality constraints
Page
across items and between groups ........................ 67
Table 2. Logist form values for the a and b parameters with and without equality constraints across items and between groups ........................ 69
Table 3. Raw score means, standard deviations and z scores across groups ............................. 78
7

ABSTRACT
A three parameter model of Item Response Theory
reported by Lord (1968, 1980) was used to determine whether
cultural item bias existed in the Reading Comprehension
subtest of the California Achievement Tests. Item
responses from 1500 second graders from Southern Arizona
schools with 500 responses from each of three groups
(Anglo. Black. and Hispanic) were analyzed via MULTILOG
program (Thissen. 1984) using the likelihood ratio chi
square (IRT-LR) method. Results indicated that there were
no significant differences in item difficulty across items
and groups. However. the typical group mean differences
often reported wherein Anglos usually score between .5 to 1
standard deviation above the group means of other
minorities on standardized tests did appear. The resl!lts
of this study were also consistent with and supportive of
the notion that most standardized tests today are not
biased against specific minority groups. Selected items
from the Reading Comprehension subtest on the California
Achievement Tests arp. being used to date as anchor items
for newer arhievement tests. As such. this study lends
support and credence to those items. Other implications
for future research are discussed.
8
CHAPTER 1
INTRODUCTION
Test bias and the serious potential consequences of
bias are of great concern to test users (e.g., psychome
trists, psychologists, and educators), test developers and
publishers, and the general public. Whenever an individual
or group is favored over another the threat of bias exists.
When the results of tests indicate differences between
groups, heated debates over the validity of such tests
often ensues. Thus, the question of test bias has been
debated by psychologists and professionals in related
fields for the past eight decades (Cronbach, 1975). And,
perhaps, never before has there been as much public aware
ness of and debate over a psychological controversy as
demonstrated by the legal mandates brought about by law
suit~ over bias in tests (e.g., Brown v. Board of
Education, 1954; Hobson v. Hansen, 1967; Diana v. State
Board of Education, 1970; Guadelupe v. Tempe Elementary
School District, 1972; Laura v. Board of City of New York.
1978; Larry P. v. Riles, 1972, 1974, 1979). As a result,
several court decisions have brought about legislation that
require tests to be valid for all purposes which they are
9
applied and fairness be maintained in the use of their
results.
Clearly. there have been many potentially legitimate
objections regarding the use of educational and psycho
logical tests that have been raised by black and other
minority psychologists (e.g .• Williams, 1970, 1974:
Hilliard. 1979: Jackson. 1975), and by test developers
(e.g .• Mercer. 1973. 1979: Cattell. 1979). The objections
often associated with bias in tests administered to
minority groups have generated considerable research and
have been reported and characterized by many authors
(e.g., Hilliard. 1979; Rechley, 1979: Jensen. 1979. 1980;
Flaugher. 1978; Wright & Isenstein. 1977). However, little
consensus can be found among these authors. and. conse
quently. multiple explanations for test bias are abundant
in the literature.
Basically. the determination of bias is and should be
the result of scientific analysis that involves the use of
a specific test for two or more specific populations. As
such, test bias becomes a psychometric issue. To date. test
bias has been psychometrically approached from two broad
perspectives. In accordance with the first approach,
researchers have examined bias from an external validity
viewpoint. This persuasion focuses its investigations on
the fairness of a test with respect to predicting a common
10

criterion across different cultures or ethnic groups within
a culture (i.e., predictive validity). Although Jensen
(1980) includes other conditions (e.g., examiner bias,
inequitable social consequences, and so forth) as possible
contributors to external bias, Reynolds (1982) suggests
that these conditions are unacceptable from a scientific
perspective because they can neither be investigated
easily, nor are they generally free from moral value
systems or emotional contents that could sufficiently lend
themselves readily to any rational resolutions.
In agreement with the second approach, researchers have
examined bias in tests from the standpoint of the test's
internal validity. This position concentrates its investi
gations on either the appropriateness of a test for
different cultures or ethnic groups within a culture by
examining the underlying constructs of the test (i.e.,
construct validity) or the extent to which individual items
or subtests of a test (i.e .• internal consistency or
content validity) are free from ethnic bias.
Most accusations of bias to date have been directed
primarily at intelligence tests when test results seem to
favor one group over another and at selected ethnocultural
groups. Not surprisingly then, the preponderance of
literature on differential performance among groups has
focused on the observed average difference in the
11
performances between blacks and whites on virtually all
tests of cognitive ability. Interestingly though.
achievement tests are reported to be far more susceptible
to cultural influence and bias than current standardized
cognitive or aptitude tests (Reynolds. 1982; Sattler.
1982) . Yet. these tests receive the least attention from
the proponents of test bias.
Analyses from a large portion of this research
indicates that the concern of these investigations has been
directed at issues regarding the predictive validity of the
test. Essentially. these investigative approaches to
predictive validity have examined the correlations between
test scores and some external criterion such as job
performance or academic achievement. However. a growing
and changing interest for investigations on other types of
bias. such as construct and. especially. content validity
bias. seems to be emerging. In addition. content validity
issues are focusing in on the items of a test. For
example. Berk (1982) suggests that the analysis of items is
perhaps the best approach to a unified conceptualization of
determining bias in tests because items are at the very
root of the test. Although he admits that item analysis
is not sufficient in making predictions about future
performance. he adds that predictive validity analysis at
the subtest or total test score levels does not preclude
12

potential bias at the item level. Item bias and predictive
validity bias methodologies are only superficially
different, and do not necessarily imply different concept
ualizations of bias (Shepard, 1982).
Because the majority of accusations were aimed at
intellectual assessment and, consequently, research had
concentrated on intelligence and aptitude tests, empirical
work on the possibility of bias in achievement tests did
not really begin until the late 1970s. Thus, up to that
point, test publishers had little to guide them in dealing
with the current accusations of bias. However, with the
emergence of more robust statistical procedures designed to
determine bias even at the item level (e.g., Item Response
Theory), test publishers and researchers developed and
provided the opportunity to demonstrate empirically
a test's freedom from bias. However, little research
exists on the use of Item Response Theory (IRT) techniques
with achievement tests. Existing research generally
concentrated on comparison of statistical methodologies
with studies using either real data (e.g., Ironson &
Subkoviak. 1979; Linn, 1980; Rudner & Convey, 1978;
Shepard, 1980) or simulation data (e.g., Morz & Grossen,
1979; Rudner, Getson, & Knight, 1980). or real data with
implanted biased items (e.g .• Craig & Ironson, 1981;
Subkoviak, Mack. & Ironson. 1981).
13
The purpose of those studies was to design a
scientific inquiry to demonstrate the superiority of the
IRT model compared to other traditional methods rather than
to evaluate the biasness or unbiasness of the items. Thus.
because these studies had a methodological focus. no
attempts were made to study the item response curves to
identify differences that may have had practical signifi-
cance.
Unfortunately. the controversy over test bias lingers.
Perhaps the illusiveness of the definition remains in part
as the problem as Reynolds (1982) suggests. However. one
need only peruse the literature to gain some insight to the
complexity of the term test bias and the multiple
approaches (and avoidances) exercised to address the issue.
Clearly. every test is susceptible to some form of bias on
some level. Whether bias occurs by definition. by
application. by usage of the results. or by statistical
artifact. research on this topic can not and should not be
impeded or ceased.
This study was based on the assumption that achievement
tests are being used in educational institutions to make
decisions that affect minority groups. As such. these
types of tests are more threatening to minority psycholo
gists and supporters of minority groups in terms of test
bias because achievement tests are more susceptible to
14

cultural bias than other types of tests. For example, both
Sattler (1982) and Humphreys (1971) suggest that achieve
ment tests appear to be more culture bound than intelli
gence tests. Although, ideas of the possibility of
culture-fair and culture-free tests have generated
much research to develop intelligence type tests (e.g.,
Mercer, 1979; Cattell, 1979), there has been the least
amount of research on bias with achievement type tests
(Jensen, 1980). In addition, this study, in agreement with
Berk's (1982) proposal that items are the best way "to
determine bias, was concerned with potential bias at the
item level.
With the development of more powerful detection methods
such as IRT, one would expect a proliferation of research
with achievement tests as well. However, most research on
item bias to date has been concerned with the comparison of
methodological procedures, and no published, systematic,
IRT research has focused on item bias issues beyond
comparison of the black and white cultures. Thus, as test
publishers admit, the determination of cultural biases is
left primarily up to and dependent upon subjective,
judgmental methods to determine the validity of their tests
across cultures.
One purpose of this study was to fill what appears to
be a gap in the literature. To date, no published research
15
or investigations has been directed at the use of IRT
techniques to determine the extent that item bias oxists in
standardized achievement tests for different ethnocultural
groups. This study used one such standardized achievement
test, namely, the California Achievement Tests, developed
by the California Testing Service. This test is still
being used in many educational institutions. In addition,
some of the items on the Reading Comprehension and
Mathematics subtests are being used as anchor items for new
tests being developed for future use. The specific
objective of this study was to investigate possible biased
items in the Reading Comprehension subtest of the
California Achievement Tests as a function of ethnocultural
group using an IRT, three parameter statistical model.
16

CHAPTER 2
REVIEW OF THE LITERATURE
Although the primary focus of this study was on item
bias in achievement tests. any review that avoids other
bias issues and detection methodologies may indeed not be
useful. A framework is helpful and necessary to review the
convoluted and proliferated literature available to date on
test bias and to sort out the multiple contributions
presented by many authors. However. it becomes evident
quickly that any attempt to categorize this literature is
difficult because there is considerable overlap in the
conceptualizations of bias. and a plethora of studies have
taken various directions to investigate the issue. For
example. in some instances. such as examiner bias or
inequitable social consequences. it is difficult at best to
fit the bias issue neatly under anyone category.
Another problem confronted immediately is to determine
the number of categories. As mentioned previously, Jensen
(1980) partitioned validity bias issues under the
categories of predictive. internal construct. and external
construct validity to study the influence of potential
bias. On the other hand. Reynolds (1982) remained with
what Berk (1982) referred to as the traditional trinary of
17

validity (i.e., content, criterion-related, and construct
validity). In addition, a recent trend is emerging towards
a unified conceptualization for the study of potential
validity bias (Chronbach, 1980; Linn, 1980; Shepard, 1982)
on the basis that compartmentalizing validity bias issues
has generally led to the false notion that tests free from
bias on one level (e.g., predictive validity) are free from
bias on other levels (e.g., item or content validity).
Contemporary literature on test bias remains a
labyrinth replete with investigations concentrating in some
areas (e.g., predictive validity studies with ability
tests) and deficient with investigations in other areas
(e.g., item bias studies with achievement tests). Thus,
there is no clear direction through the material, rather
the path is often ambiguous and nebulous with significant
gaps in some areas. Because this study was concerned with
cultural bias at the item level and with achievement tests
specifically. only a brief overview of other bias issues
and methodological procedures are included for convenience.
For an in depth review, the reader is referred to Jensen
( 1980) .
Perhaps the best place to begin is at the very root of
the problem of bias that provoked the investigations of
tests. Minority psychologists and supporters of minority
groups began to question the disproportionate placement for
18
different groups based on specific test results. These
questions soon changed to accusations that the tests were
biased. In a very general sense, these accusations can be
conveniently divided into two broad classifications: the
outcome of bias~ which fundamentally is concerned with the
use of tests. and the potential sources of bias. which
essentially is concerned with the tests themselves.
Outcome of Bias
Perhaps the major thrust of the argument for the
outcome of bias in tests lies with the position that biased
tests result in test scores that lead to inequitable social
consequences. This position holds that. as a result of
bias in the tests, minority children are disproportionally
relegated to dead end tracks in education; low test results
often produce negative expectancies in teachers. and
minorities experience the negative effects of labeling
(e.g., Williams. 1970). This view, then, is concerned
primarily with the fairness of the test with rospect to how
the results are used. This tenet has facilitated the
growth of a number of selection models (see, Flaugher,
1978; Angoff. 1976, 1982; Petersen & Novick. 1976; Jensen.
1980) .
Selection models fostered to date have as their
philosophy three basic conceptions of f.airness. Hunter and
19

Schmidt (1976) have summarized and described these
conceptions as:
1. Unqualified individualism, in which a fair selection strategy selects from the available pool of applicants those individuals with the highest predicted criterion performance using whatever predictor variable yields the highest predictive validity. Also, the same test or other predictor variables need not be used for all applicants.
2. Qualified individualism, like unqualified individualism, advocates maximizing predictive validity for all individuals but maintains that the identification of an individual's group membership should not enter into the selection procedure.
3. Quotas, in which fair selection consists of not treating everyone alike or in trying to maximize predictive validity and minimize errors of selection, but rather it involves some degree of trade-off of the former advantages for other desired advantages deemed as having greater social importance.
When considering a particular selection model, Nichols
(1978) suggests that, prior to choosing a selection model,
it is essential to decide whether the ultimate goal is
equality of opportunity. in which selection is based on
abiiity; equality of outcome, in which selection is based
on deficits; or representative equality. in which selection
is based on the numerical representativeness of subgroups.
Reynolds (1982) cautions, however. that selection models
used to examine bias generally concentrate on societal
decision making rather than on the tests themselves. Thus,
in bias issues selection models can easily impede or
preclude scientific explanations and resolutions.
20
Potential Sources of Bias
The objections for potential sources of bias can
usually fit into one or more of the following categories:
1. Inappropriate standardization in which ethnic minorities are underrepresented in normative data. Test developers may systematically exclude nonwhite children from standardization samples. For example. prior to the 1974 edition of the Stanford-Binet Intelligence Test. no blacks were included in the standardization sample.
2. Examiner and language bias in which. for example. most school psychologists are white and English speaking. and thus. intimidate black and other minority children. In addition., some other proponents (e.g .. Sattler, 1979) suggest tha~ verbal and nonverbal cues can lead to misunderstandings between white examiners and minorities. Also, others (e.g .• Williams. 1971) state that differences in dialect lead to potential interference during test administration and responding. And still others (e.g .• Johnson. 1974) hold that test outcomes are affected because some minorities lack spontaneity in re~ponding.
3. Measurements of different constructs in which standardized tests may measure different attributes in minority children than in white, middle class children (e.g., Hillard. 1979; Jackson, 1975).
4. Differential predictive validity in which standardized tests fail to predict at an acceptable level any relevant criteria for minority children (Williams. 1971; Jackson. 1975).
5. Inappropriate content because minorities have not been exposed to some material involved in the test questions (Williams. 1974). That is, test items contain information that is geared towards white, middle class homes and values and often overlook other cultural mores. Mercer (1979), for example. suggests that current tests like the Wechsler Intelligence Scale for Children-Revised (WISC-R) measure only a child's degree of anglocentrism.
On the surface. these possible sources of bias seem
21
well grounded and viable. however. all too frequently these
objections are viewed as facts without an extensive review
of any available significant empirical evidence (Jensen.
1974. 1976. 1980; Reynolds. 1982). A substantial
literature base exists addressing these issues of test
bias that has recently emerged over the past decade. This
literature base has been reviewed and summarized
extensively by many writers (e.g .• Anastassi, 1976. 1982;
Gutkin & Reynolds. 1981; Rechley. 1978; Jensen. 1979. 1980;
Reynolds. 1982;Cronbach. 1970. 1984; Berk. 1982; Sattler.
1982). Interestingly. the overwhelming consensus of this
body of literature supports the notion that the majority of
standardized tests in use today are not biased against
minorities. Reynolds (1982) and Jensen (1980). for
example. argue that the preponderance of available evidence
contradicts the belief that standardized tests used at
present are culturally biased against ~inorities. They add
that acceptable criteria of bias are necessarily based on
(1) the test's validity for predicting the performance (in
schools. on the job. and so forth) of individuals from
majority and minority groups, (2) the test's ability to
measure validly the same construct for majority and
minority groups, and (3) the test's internal consistency
with respect to relative item difficulty, factorial
composition. and internal consistency and reliability.
22
They further suggest that variables in the testing
situation, such as the race or language of the tester, are
negligible sources of racial group differences, and that
most standardized tests today include sufficient
representation of minority cultures in their normative
sample. Thus, evidence for potential bias has empirically
been generated from studies on issues concerned with the
predictive validity of tests, in which the test may
potentially predict differently between groups (Cleary,
1968); issues concerned with the construct validity of
tests, in which the test may potentially assess different
attributes for different groups (Anastasi, 1982), and
issues concerned with content validity of tests, in which
individual test items may be potentially more difficult for
one group over another (Jensen, 1979; 1980).
Bias and Unfairness
Critical to the understanding of bias in tests is the
conviction that test bias and unfairness are separate
entities of the same presenting problem. However, it is
essential to distinguish between the two concepts. Jensen
(1979, 1980) states that bias is an objective, statistical
property of a test in relation to two or more groups. For
example, predictive validity bias refers to systematic
errors of measurement in which the obtained measurement
(test score) consistently overestimates or underestimates
23

the true (error free) score of members of one group
compared to members of another group. Thus, the scores
have different meaning or predict differently for members
of one group than members of another group. It is perhaps
important to note that all measurements are subject to
random errors and standard errors of measurement. Biased
measurements, then, include systematic errors.
The concept of unfairness is concerned with the way
the tests or test scores are used in the selection of
individuals. For example, a test would be considered
unfair if it resulted in overrepresentation of minorities
in programs that are ineffective, or if minorities received
no planned interventions at all (Reschly, 1979). Under
these conditions, the tests may not be biased but there may
be little benefit to the individual based on the test
result. Thus, it is possible that an unbiased test may be
used unfairly, and conversely a biased test might and could
be used fairly (Jensen, 1980).
Test Bias Defined
Although a test may not be biased but rather used
unfairlY and an ample body of evidence indicates that
ethnocultural groups do not differ significantly in test
scores on standardized tests, the debate continues over
test bias. This is perhaps in part due to the myriad of
and inconsistent definitions of test bias found in the
24

literature to date. One needs only to peruse the
literature to concur with the notion that the problem of
defining test bias is yet unresolved (e.g .• Berk. 1982;
Reynolds. 1982).
Close examination of recent definitions of bias reveals
both varying conceptions and similar criteria (Hunter &
Schmidt. 1976). For examples. Flaugher (1978) identified
eight separate concepts of bias in tests; Petersen and
Novick (1976) and Rechley (1979) define bias in terms of
enhancing fairness versus social equity in selection; and
Jensen (1980) defines bias as a function of systematic
errors of measurement. However. the majority of
definitions rely heavily on the differential prediction of
some specified criterion (Anastasi. 1980; Cleary, 1968;
Hunter & Schmidt, 1976; Petersen & Novick, 1976). Other
literature (e.g .• Pine, 1977; Scheuneman, 1975) has focused
on the differential differences in item difficulty in
defining bias in tests.
According to Reynolds (1982), bias can occur within any
of the three basic types of validity: construct. predictive
(or criterion-referenced), and content validity. Berk
(1982) refers to these validity biases as the "traditional
trinary" of construct, predictive, and content bias.
Reynolds (1982) provides summative definitions of bias
under these types of validity. For construct validity
25

bias. he suggests that:
Bias exists in regard to construct validity when a test is shown to measure different hypothetical traits (psychological constructs) for one group than another or to measure the same trait but with differing degrees of accuracy (p. 194).
For predictive validity bias, he suggests that:
A test is considered biased with respect to predictive validity when the inference drawn from the test score is not made with the smallest feasible random error or if there is consistent error in an inference or prediction as a function of membership in a particular group (p. 201).
For content validity bias, he suggests that:
An item or subscale of a test is considered to be biased in content when it is demonstrated to be relatively more difficult for members of one group than another when the general ability level of the groups being compared is held constant and no reasonable theoretical rationale exists to explain group differences on the item (or subscale) in question (p. 188).
Jensen (1980) has further divided validity biases into
internal and external categories in which there can be
indications of bias. Group differences in predictive
validity would fit under the external category as an
external indicator of bias, and group differences in
construct and content validity would fit under the
internal category as internal indicators of bias. The
following is a brief overview of these indicators. More
detailed coverage can be found in Jensen (1980).
26
External Indicators of Bias
External indicators of bias are concerned with
correlations between test scores and other variables
external to the test. That is, factors in the external
testing situation interact with individuals or groups to
produce systematic error in their test scores (Jensen,
1980). Jensen (1980) has identified six factors which have
been examined in the literature: (1) test sophistication,
such as the effects of prior practice or coaching on
similar tests; (2) interpersonal effects, such as the
attitude, expectancy, and dialect of the examiner, and the
manner in which the test was administered, such as
delivering instructions, motivating the examinee, and
rewarding the examinee; (3) individual versus group
administration of tests and the effects of morale and
discipline on test performance; (4) timed versus untimed
tests; (5) the interaction of the race and sex of the
examiners with the race and sex of the examinee; and (6)
biased scoring of test performance due to halo effects.
Because external indicators of bias focus on the
relationship between test scores and external variables and
predictive validity is concerned with the relationship
between the test scores and some external criteria, it is,
perhaps, safe to add, to this list, predictive validity, in
which the test score predicts to some external criterion.
27
Thus. to the extent to which an external criterion produces
differences between groups or to the extent that a test
predicts differently for two groups. bias could be said to
exist.
Predictive validity bias is investigated with the aid
of linear regression techniques by examining the slope and
the intercept of the regression lines of bivariate
distributions of test scores (Anastasi. 1982)'. For
example. when the slope of the regression line. which
represents the validity coefficient of the test. is
different for two groups. the difference may be described
as slope bias. In this type of bias. the test predicts
with unequal accuracy (Jensen. 1980). Thus. the test means
different things for the two groups.
However. a test may yield the same validity coefficient
for two groups but the regression line intercepts the axis
at different points. This is referred to as intercept bias
(Anastasi. 1982). Thus. if a test has intercept bias it
will systematically underpredict or ove~predict criterion
performance for a particular group.
Internal Indicators of Bias
Jensen (1979) reports that internal indicators of bias
are the psychometric properties of the test itself. such as
the test's internal consistency which is a measure of
28
homogeneity (Anastasi, 1982), the factorial structure of
the test or battery, the rank order of item difficulty
(percent passing each item), the significance and magnitude
of the items x groups interaction in the analysis of
variance of the item matrix for two groups, and the
relative attractiveness of distractor responses for
multiple choice questions. Thus, construct and content
validity can be viewed under internal indicators of bias.
If differences between groups exist for these criteria, the
findings could indicate that the test is bias.
Bias in construct validity is more difficult to detect
than content validity. Construct validation of a test is
problematic because it relies on indirect measures of an
unobservable construct it purports to measure. That is, it
has no single objectively measurable external referent
(Jensen, 1980). It can be defined statistically as the
correlation between the test score and the construct the
test is intended to measure. Thus, detecting bias often
involves the test's correlation with other external
criterion and the test items' correlation with the test
itself. One popular method used to detect construct
validity bias is factor analysis (Cronbach, 1984), in which
clusters of test items or subtests correlate highly with
one another. Bias is said to exist if the test scores
cluster or load differently for two groups.
29

Recently, content validity bias or item bias has become
the center of attention with respect to potential test
bias. Investigations of item bias in ability tests have
taken two major empirical approaches (Schmeiser, 1982):
statistical (e.g., Item Response Theory or group x item
analysis of variance) and subjective (e.g., judgmental
methods). Although some writers (e.g., Schmeiser, 1982)
suggest that combining both methods would minimize bias in
the content of the test, to date the emphasis has been on
either the statistical or judgmental approach. In part,
this may be due to the lack of detectable patterns or
common characteristics of item bias in carefully written
items (Reynolds. 1982).
The goal of statistical approaches is to identify which
items are biased for one or more subgroups by objective
systematic means. These methods are usually applied after
the items had been administered, although the use of Item
Response Theory (IRT) has permitted evaluation before the
test is administered to the total population. The goal of
judgmental methods is to detect item bias through
subjective, judgmental means by having a panel of minority
and majority judges rate the items as either biased or
not biased. This method is generally applied before the
test is administered.
30

On the surface. external and internal indicators of
bias seem to differ only in their relationship to the test
itself. That is. external indicators relate to events
outside the test. and internal indicators relate to the
test itself. However. Berk (1982) and Reynolds (1982) are
quick to point out that these partitions are not mutually
exclusive. but rather they overlap. For example. in her
definition of item discrimination. Anastasi (1982) writes
that items may be evaluated and selected on the basis of
their relationship to the same external criterion as the
test as a whole. In addition. Jensen (1980) admits that
prediction from an IQ test to scholastic achievement is not
unheard of. although IQ tests rely heavily on construct
validity. Thus. content validity bias could reasonably be
evaluated in terms of external or internal indicators.
Hence. the current trend is towards developing a unified
conceptualization of validity in order to assess bias
(e.g .• Cronbach. 1980; Linn. 1980; Messick. 1979). Such a
trend would deemphasize the types of bias and concentrate
on and emphasize the data gathering process and the methods
to obtain the kinds of evidence essential to address bias
questions (Berk. 1982).
Item Bias
Interestingly. bias in items of a test is not a novel
concern. Early test pioneers (e.g .• Binet. 1905; Binet &
31
Simon. 1916; Goddard. 1910; Spearman. 1917; Terman. 1916)
focused on internal characteristics of tests as indicators
of bias. For example. Binet and Simon (1916) were
concerned that their test of general ability be as free as
possible from items that required a background of
schooling. In addition. Binet (1911) and others (Goddard.
1910; Terman. 1916) examined possible item bias for
individuals with different socioeconomic status. These
early studies addressed the issue of differential
difficulty of various kinds of test items. However. these
early studies had little consensus and were replete with
methodological problems. Jensen (1980) suggests that one
major problem with these early investigations lies in their
statistical approach to item difficulty. For example. he
states that. in one statistical approach. the percentage of
items passed across groups was used to determine bias in
the items of the test. However. he suggests that this may
be problematic because the percentage passing the item can
not properly be compared at all levels of difficulty across
social class because the percentage passing is not an
interval scale.
The first two systematic studies on item bias occurred
four decades later and were the classic studies of Eells
et. al. (1951) and McGurk (1951). Both of these studies
were a result from their interest in apparent differences
32
in performance on IQ tests, and the possibility that the
differences were a function of the test itself. Eells
concentrated on IQ differences between upper and lower
social status, and McGurk was concerned with differences
found between blacks and whites. Although the studies were
different in approach, the importance of their
contributions lies in the consideration that the test items
may be ,the source of the difference.
Between 1950 and 1970, research on item bias declined
and gave way to literature on the predictive validity of
tests. Nonetheless, the sporadic investigations on item
bias expanded to include aptitude (e.g., Cardall & Coffman,
1964; Cleary & Hilton, 1968) and achievement tests (e.g.,
Potthoff, 1966).
During the late 1970s, the Educational Testing Service
(ETS) and other test publishers recognized the need to pay
particular attention to certain specific segments of the
population, particularly women, blacks, Hispanics, Native
Americans. and Asian Americans, in order that they be
represented in the test passages and by items in a manner
free from negative stereotyping and offensiveness. They
commissioned several investigators to examine items of
several aptitude tests for potential bias in the form of
race (e.g., Angoff & Ford, 1973; Cardall & Coffman, 1964:
Cleary & Hilton, 1968; Humphrey, 1979: Lord, 1977; Sinnott,
33
1980; Spencer, 1972; Stricker, 1981; Swineford, 1976), in
the form of sex (e.g., Cowell & Swineford, 1976: Donlon,
1973; Donlon, Hicks, & Wallmark, 1980; Sinnott. 1980;
Strassberg-Rosenberg & Donlon, 1975), and in the form of
language (e.g., Alderman & Holland, 1981: Angoff & Sharon,
1971, 1972; Sinnott, 1980). The summaries of these studies
and their results are available from ETS. It is important
to note, however. that the bias investigated for race,
sex, and language for ETS is not the familiar bias heard
today in th~ outcries of minority psychologists (e.g.,
Williams, 1970) and others (e.g., Mercer. 1979). The
concern of ETS was with offensiveness and negative
stereotyping. Nonetheless, these studies, although
directed primarily at aptitude tests, were an important
turning point in the history of item bias because the
concerted effort to examine items in tests was again in the
forefront.
Presently, there is growing concern for the detection
and determination of item bias in virtually all types of
tests as evidenced by the increase of studies on item bias
presented in literature reviews (e.g., Jensen, 1980:
Reynolds. 1982; Berk. 1982). Recent advances in
methodological and statistical procedures have undoubtedly
facilitated this rise.
34
Prior to the review of the empirical studies of item
bias, some basic understanding of the popular methods used
to detect item bias in tests is helpful. It is intended as
an overview of proc~dures. For more detail, the reader is
referred to such authors as Lord (1980), Lord and Novick
(1968), and Rasch (1960).
Popular Methods for Detecting Item Bias
FundamentallY, item bias methods detect items that
behave differently for different groups. The approaches
are varied, but their goals are rudimentarily the same.
These methods can be comfortably divided into subjective
(i.e., judgmental) and objective (i.e., statistical)
techniques. The subjective method has only one approach,
but the statistical methods have many. Only those
currently and popularly used are reviewed here. For
comprehensive coverage of statistical item bias methods,
the reader is referred to Berk (1982), Jensen (1980), and
Lord and Novick (1968).
Judgmental Method
This method reflects a belief about the content
validity or item validity of a test. The focus of. the
judgments includes two areas concerned with the face
validity of the test (i.e., stereotyping and fair
representation of the groups in question); a third area
35
concerned with both face validity and content validity
(i.e., equal familiarity or experience of subgroups with
nominal content of the items): and a fourth area concerned
with content and construct validity (i.e., the opportunity
to learn item content and processes). Thus, judgmental
methods have an important role with respect to responding
to the criticisms that items may be biased towards a
specific group (Tittle, 1982).
Generally, a panel of judges or experts is selected to
review the items of a proposed test. Ideally, all ~acial
and sex groups would be represented. Items are then judged
to be fair or unfair. Such information is said to be
useful for two reasons. One, it can be used to eliminate
from the item pool those items judged to be biased against
a particular group (Tittle, 1982). Two, it can be used for
rapport and public relations (Anastassi, 1982: ·Sandoval &
Miille, 1980).
To date, most standardized achievement tests have used
this 'method as the sole criterion for validation (Shepard,
1982) on the basis of the notion that achievement tests are
less vulnerable to bias than ability tests (Flaugher,
1978). However, measurement experts are beginning to
support the idea that even achievement tests require
content and construct validation through statistical
methods for empirical support (Hambelton, 1980; Linn, 1979;
36

Messick, 1975). And, some (e.g., Green, 1980; Reynolds,
1982) argue that achievement type tests are more
susceptible to· cultural bias than ability tests. The
debate may be clouded by the notion that, generally
speaking, criterion measures do not exist for achievement
tests. Thus, for the most part, only the internal
characteristics of achievement tests have been examined for
validity and for bias, and attempts to reduce bias in these
types of tests have commonly used procedures (such as
judgmental methods) which in effect assume overall validity
of the test for all groups but may contain some items that
are unfair or offensive to specific groups (Angoff, 1975:
Green, 1975).
Research on judgmental methods has primarily focused on
the comparison of this method with other traditional
statistical methods. Thus, comparisons for ability tests
(e.g., Jensen, 1976: Miele, 1979: Sandoval & Miille, 1980),
for aptitude tests (e.g., Jensen, 1976), and for
achievement tests (e.g., Plake. 1979) have appeared in the
literature. The results of these studies strongly suggest
that there is little relationship between items identified
as biased through subjective methods and items identified
as biased through objective methods (Plake. 1979); that
there is little more than chance that judgmental methods
are able to identify biased items with any degree of
37

accuracy (Jensen, 1980); and that no common characteristics
of items that are found to be biased can be ascertained by
either minority or nonminority expert judges (Reynolds,
1982).
Analysis of Varience: Group X Item Interaction
This objective or statistical method is concerned with
the interaction effects of items by groups. Whenever the
differences in variability across items are not uniform for
all groups, bias is said to exist. This method is perhaps
the most widely used. It involves an analysis of variance
(ANOVA) procedure wherein random samples are drawn from
each of the groups, and a difficulty index is calculated
for each item for each sample for each group. The variance
of item difficulties across samples within groups provides
the estimate of error. Once a significant item by group
interaction is determined, post hoc tests are used to
identify the items that are principal contributors to the
interaction. Several studies are availab~e using this
method (e.g., Angoff & Sharon, 1974; Cardall & Coffman,
1964; Cleary & Hilton, 1968).
One problem with the use of the ANOVA procedure is that
it is sensitive to differences in dispersions of item
difficulties between. or among, the groups. Thus, it may
yield significant results, even when there may be no true
38

item by group interaction. and an item may be identified as
biased for artifactual reasons (Angoff. 1982).
Jensen (1980) suggests that the interaction of items
and groups can also be approached through correlations
between item difficulty indices across groups. With this
approach. the difficulty of each item is determined within
each of the groups. followed by correlating the pairs of
groups' item difficulties. If all items have nearly the
same rank order of difficulty. the items are said to be
unbiased.
Several studies investigating item bias using these two
approaches have been reported for ability tests (e.g ..
Jensen. 1976: Miele. 1979: Sandoval. 1979), for aptitude
tests (e.g., Angoff & Sharon. 1974: Cleary & Hilton. 1968:
Jensen, 1976), and for achievement tests (e.g., Green &
Draper, 1972: Jensen, 1976). Two conclusions are apparent
from these data. One, factors contributing to the relative
difficulties of items are the same for all groups, and,
two, where interactions do occur, they are usually a
product of statistical artifacts.
Chi-Square Method.
The chi-square techniques assume that a test is (1)
valid. so that the total test score may be used as an
estimate of ability, (2) reliable within usual standards.
39
and (3) homogeneous. One of the advantages of the
techniques is the absence of an assumption about the shape
of the distribution of observed scores. These scores do
not have to be normally distributed or representative of
the distribution of ability in the population of interest.
Sample size. however. is constrained by the required
expected cell frequency.
Two techniques have been popularized in the literature.
First. chi-square correct (Scheuneman. 1975. 1979) which
focuses on correct responses given to an item. Second.
chi-square full (Camilli. 1979; Nungester. 1977) which
focuses on both the correct and incorrect responses to a
given item. Both procedures involve only two steps.
First. three to five ability intervals are established. and
second. the chi-square value is subsequently tested for
significance.
The two methods differ in statistical distribution. in
the hypotheses tested, in the degrees of freedom and power,
in the sensitivity to contributions of different cells. and
in sample size requirements. They also share several
advantages. They are advantageous in that they are
intuitively understandable to the practitioner. require
smaller sample sizes than other methods, and may be
subjected to significance tests that allow dichotomous
biased or unbiased classifications.
40

According to Scheuneman (1975) an item is unbiased if,
for all individuals having the same score on a homogeneous
subtest containing the item, the proportion of individuals
getting the item correct is the same for each population
group being considered. For example. if the p-values of
correct responses are higher for one culture than another
the item could be said to be biased.
Both procedures. however. share disadvantages. With
both procedures. there is arbitrariness in setting cutoffs
for the intervals. In addition. there are problems in
using the total test score as a measure of ability.
especially since the chi square methods are sensitive to
the distribution of total test scores (Nungester (1977).
Moreover. neither procedure uses all available information
because the continuous nature of variable (i.e .• ability)
is treated essentially in a categorical manner.
Item Response Theory (IRT)
IRT has emerged from the familY of latent trait models.
Often the terms latent trait model, item characteristic
curve, and IRT are used interchangeably. IRT is concerned
with the probabilistic relationship between the response to
some test item and the attribute of the person the test
item is intended to measure. Test items may be problems on
ability. aptitude, or achievement tests. questions on an
41
attitude scale, or behaviors on a behavioral checklist.
The attribute of the person may be a cognitive ability, an
attitude, or a personality construct (either state'or
trait). The attribute of the person is usually referred to
as that person's ability or theta. (See Chapter 3 for a
more extensive description.)
The major advantage IRT has over other methods is that
it permits the use of all of the information included in an
examinee's response to a question or test item. It can be
used for tests requiring a dichotomous choice or tests
requiring one of many choices (Thissen, 1984). IRT permits
the use of the information in any particular choice of an
item response to be used to estimate the value of that
person's trait or ability.
IRT has available a one, two, and three parameter
model. In the one parameter model, the probability of a
correct response is a function of the examinee's ability
and item difficulty. In the two parameter model, the
proba'bili ty of a correct response is a function of the
examinee's ability, a difficulty parameter, and a
discrimination parameter. In the three parameter model, a
guessing parameter is added, and the probability of a
correct response is a function of the examinee's ability, a
discrimination parameter, a difficulty parameter and a
guessing parameter. This guessing parameter addition is
42
beneficial because it lessens the possibility of
confounding by only using the other two parameters. while
considering the third parameter.
IRT makes use of an item characteristic curve (ICC).
ICCs depict in mathematical functions the relationship
between ability and the probability of answering the item
correctly. The curves are usually described by a
cumulative logistic or normal ogive curve provided by the
parameters.
An unbiased item will have the same ICCs for all
groups. Green and Draper (1972) introduced the notion of
examining observed ICCs to indicate bias. Subsequently.
several researchers (a.g .• Linn & Harnish. 1981: Lord.
1977. 1980: Pine. 1975: Rudner. 1977: Thissen. 1984:
Thissen. Steinberg. & Gerrard. 1986) adapted the three
parameter item characteristic curve model for use in
investigating item bias.
One major problem associated with the use of IRT's
three parameter model is the necessity of large samples.
Ironson and Subkoviak (1979) and Lord (1977) recommend a
minimum group size of 100 and 300 subjects respectively for
minority representation and 1000 subjects for the majority
culture. Linn and Harnish (1981). however. adopted a lack
of fit procedure to be used with smaller sample sizes. In
addition. data analyses are usually complex and generally
43

require computer computation. Thus. analyses can be quite
time consuming in gathering data and quite costly in
determining if biases exist.
Sadly, the three parameter model has not been used as
often as would be expected given its flexibility and
robustness. There are virtually no published systematic
studies that have been conducted for the sole purpose of
detecting biased items in achievement tests using this
model, and a dearth of literature exists on its use with
ability and aptitude tests. The majority of available
literature exists on comparative methodology studies and
studies using simulated data for descriptive interests.
Measurement of Bias Between Groups
Green and Draper (1972) first introduced the notion of
examining observed ICCs to indicate bias. Subsequently,
several researchers (e.g., Linn & Harnish, 1981: Lord 1970,
1980; Pine, 1975: Rudner, 1977) adapted the three
parameter item characteristic curve model for use in
investigating item bias. Parameters are usually, but not
always, estimated separately for each group. Procedures
used to compare the ICCs of the two groups include the
following:
A. Difference between ICC's as measured by the area between the curves (signed or unsigned) or summed squared differences (e.g., Ironson & Subkoviak, 1979: Rudner, 1977):
44

B. A test of Pmrameter equality as measured by a composite test of simultaneous differences in a, b, and c parameters or an investigation of the b parameter alone or the a parameter alone (Linn et al, 1980);
C. A measure of lack of fit derived from an examination of differences between observed data and what would be expected from an estimated model ( e . g., Lord. 1980);
D. An estimation of confidence intervals around ICCs; and
E. A test measuring differences in empirical response functions.
According to Lord (1980) an unbia~ed item should have
the same item characteristic curves in both groups. One
interesting advantage of the three parameter model is that
the model is not limited to detecting uniform bias favoring
one group over another. That is, the three parameter model
can detect a biased item against group 1 at low ability and
against group 2 at high ability.
IRT Computer Analyses
Several computer programs, such as LOGIST (Wood & Lord,
1976; Wood, Wingersky, & Lord, 1976), ANCILLES (Urry,
1976), CARIF (Lissak & Wytmar, 1981), and MULTILOG
(Thissen, 1984), may be used to estimate the parameters for
each item and an ability level for each person. LOGIST
requires more time to run because it first estimates
ability from the distribution and then estimates the
parameters. Once the parameters are estimated, LOGIST
45

reestimates ability. This process continues until the data
begin to fit the model (Ironson, 1982). Other programs
(e.g., CARIF and ANCILLES) are used in conjunction
with LOGIST when the user wishes to run a three parameter
model.
MULTILOG (Thissen, 1984) has advantages over LOGIST
in that the program yields maximum likelihood estimates,
rather than LOGIST's conditional likelihood estimates.
Ability is estimated by the relative likelihood of the
observed response sequence as a function of ability.
Limitations of Detection Methods
As would be expected, methodologies for detecting item
bias also have limitations. Shepard (1982) points out that
these methods cannot detect pervasive bias because
generally they lack an external criterion. That is, item
bias methods are all based and rely upon a criterion
internal to the test itself (Petersen, 1977), and by using
the total test score or the average item to identify
individuals of equal ability, they ultimately specify the
standard of unbiasness. Thus, this defense becomes
circular. Using an external criterion will not necessarily
solve the problem if the criterion possesses the same type
of bias that affects the items. Therefore, methodological
procedures are validated only by the collective'
46
justification of both subjective and objective evidence to
verify that items measure what is purported to be measured
for all groups.
47

CHAPTER 3
METHOD
Subjects
In 1981, the California Achievement Test was
administered to approximately 203,000 Arizona State public
school children (except Maricopa County) attending 1st
through 10th grades. The subjects for this study were
randomly selected from approximately 12,000 second graders.
The sample (N:1500) was stratified to represent 500
children for each of 3 ethnic groups (Anglo, Black, and
Hispanic) containing an equal number of males and females.
The stratified random sampling procedure (Mason & Bramble,
1978) was accomplished by using a table of random numbers.
Instrument
Responses by the subjects to the first 15 items on the
Reading Comprehension subtest from the Reading content area
of the California Achievement Tests (CAT) were used to
determine potential cultural item bias in this instrument.
The following is a description of the California
Achievement Tests:
General Description
The CAT (CTB/McGraw Hill, 1977, 1978) consists of a
series of norm-referenced and criterion-referenced tests
48
used to assess skill development in six content areas in
grades Kindergarten through twelve. The series includes
measures in skill development in prereading, reading,
spelling, language, mathematics, and the use of references.
There are two forms of the test (CAT C and D), with ten
overlapping levels (levels 10 to 19) in form C and seven in
form D (levels 13 to 19). Two "locator tests" are
available. These are used as pretests, and facilitate
functional-level testing, that is, assessment of students
at their functioning level rather than their grade level.
Level 10 of the series is a prereading or readiness test,
and is a revision of the earlier Comprehensive Test of
Basic Skills. Although levels 11 to 19 are based on the
tradition of the earlier California Achievement Test (Tiegs
& Clark, 1970), the test is not considered a revision. It
consists of a new st~ucture and all new items (Technical
Bulletin I, 1979).
Derived Scores
Five kinds of derived scores are obtainable for the
CAT: percentile ranks. stanines, grade equivalents, normal
curve equivalents, and scale scores (ranging from 000 to
999). A variety of information systems are available
including individual test records, graphic frequency
distributions, summary reports, and class test records.
49
In addition. schools may obtain criterion-referenced data
on objectives mastered by individuals or by classes. norm
referenced data comparing student performance to national
norms. or demographic norm reports comparing class or
school performance to the performance of schools with
comparable demographic makeup (Technical Bulletin 2.
1980) .
Standardization
The CAT were standardized with both Spring and Fall
norms based on a sample size of approximately 200.000
students in grades K through 12 from public and Catholic
schools with a stratified random sampling procedure
(Technical Bulletin 1. 1979).
Reliability
Three kinds of reliability data are reported for the
CAT: internal consistency and test-retest reliabilities
on test scores and reliability estimates for category
objectives on the criterion-referenced use of the CAT. An
extensive amount of data are reported for the internal
consistency of raw scores and the standard error of
measurement for raw scores. scale scores and grade
equivalents for each subtest at each of the ten
levels. Internal consistency coefficients for subtests
range from .59 to .95. with the majority between .75 and
50

.90. Internal consistency coefficients for total scores
(e.g., total reading, total mathematics) generally exceed
.85. Two sets of data are reported on the test-retest
reliability of the CAT. The authors report a test-retest
reliability over a two to three week interval for grades K,
1, and 2 (levels 10 to 12). Subtest reliabilities ranged
from .23 to .81 with the majority ranging from .60 to .70,
and total score reliabilities ranged from .52 to .94 with
most greater than .90. Reliability estimates for category
objectives are reported as mastery bands, and the reli
ability of these scores ranged from .36 to .87 with most
greater than .70 (Technical Bulletin 1, 1979; Technical
Bulletin 2, 1980).
Validi ty
The authors report considerable support for content
validity. The procedures for selection of objectives
consisted of review of the State Department of Education,
large city curriculum guides, and selection of objectives
from two other tests (the Diagnostic Mathematics Inventory
and the Prescriptive Reading Inventory). Items were also
subjected to judgments by a panel of minority professionals
for potential racial, ethnic, and sex biases. Items were
then selected and tried to insure adequate coverage of
content within each category objective, and insure adequate
51

statistical discriminatorY power (Techni~al Bulletin 1,
1979; Technical Bulletin 2, 1980).
Subtest Description
The Reading content ar~a has four subtests: Phonic
Analysis, in which a measure of decoding assesses skill in
relating sounds to graphic illustrations of those sounds;
Structural Analysis, in which recognition and understanding
of compound words, syllables, contractions, base words, and
affixes are assessed; Reading Vocabulary, in which the
understanding of word meaning is assessed, and Reading
Comprehension, in which derived meaning of written
sentences and passages is assessed.
The Spelling content area has one subtest in which the
skill of distinguishing correct from incorrect spellings of
words is assessed.
The Language content area has two subtests: Language
Mechanics, in which capitalization and punctuation skills
are assessed, and Language Expression, in which written
expression, word usage, and understanding of sentence
structure and paragraph organization are assessed.
The Mathematics content area has two subtests: Mathe
matics Computation, in which the solutions to addition,
subtraction, multiplication, and division problems
involving whole numbers, fractions, mixed numbers,
52
decimals. and algebraic expressions is assessed. and
Mathematics Concepts and Applications. in which the
application of a wide range of mathematical concepts is
assessed.
Hypothesis
The hypothesis tested in this study was that no
significant differences would be found among items across
groups. That is. the item difficulty parameters would
remain constant for all cultural groups indicating the
subtest questions to be unbiased. although population mean
distributions may differ. The basic premise. then. for a
biased item would be one that functions significantly
different for persons of the same ability in different
groups. Thus. a measure of a lack of fit derived from an
examination of differences between observed data and what
would be expected from an estimated model would indicate
that a particular item was biased (Lord. 1980). Consistent
with the notion that reading subtests of achievement and
aptitude tests are more susceptible to bias than other
kinds of subtests (e.g .• Ironson & Subkoviak. 1979). a
number of items should be found to be significantly biased
across groups.
Statistical Analyses
Because this study was conce.rned wi th the detection of
test bias at the item level. it used the conceptualization
53
offered by Item Response Theory (IRT). This conceptuali
zation pertains to how IRT addresses the problem of how
much of the observed difference in item responses between
majority and minority groups is due to ability and how much
is due to bias. Some basic understanding of this concept-
ualization is needed to understand the statistical
methodology of this study.
The most common application of IRT is with dichotomous
choice responses on a test (i.e., yes/no, right/wrong, and
so forth), although IRT can be and has been used wi~h other
types of test item responses (i.e., multiple choice, Likert
type scales. open ended responses, and so forth) (Thissen,
1986). Thus, although the majority of applications to date
have focused on tests of cognitive ability, IRT applies as
well to other types of tests, such as achievement, free or
open response questionnaires. personality inventories,
interests tests, and so forth. But perhaps the greatest
attraction for its use in test construction and test
evaLuation lies in its ability to distinguish between true
group differences in item responses and biased items
(Thissen, 1986).
Basic to IRT is the concept of a latent trait.
However, this label is somewhat misleading, and requires
further explanation. If several tests on the same subject
matter were administered to a group of examinees, in
54

general. some examinees would consistently score high on
the tests and some examinees would consistently score low.
That is. there is consistency found in the performance of
examinees on different tests. One explanation of this
consistency is to assume that the examinees have something
inside that causes them to score consistently. In IRT that
something is called a mental "trait". although the term
trait. as it is used. is not to be confused with something
necessarily innate. Because there is no physical referent
for this mental trait. it is never observed or measured
directly. Hence. it is referred to as a "latent" trait.
The scale of a latent trait is usually assigned the
Greek letter theta, and exists on a continuum from minus
infinity to plus infinity. It has no natural zero point or
unit scale, and therefore the zero point and unit are often
taken as the mean and standard deviation, respectively, of
some reference sample of examinees. Thus, values of theta
usually vary from -3 to +3, but may be observed outside
that range, and the abilities of a sample need not be
distributed normally.
Theta belongs to an individual; it is, essentially. his
or her ability level. Tests are traditionally designed to
assess this theta or ability level. That is. the purpose
of a test is to measure the relative position of the
individual on a theta scale and the test or measuring
55
instrument interprets the individual's theta and produces a
measurement of ability (raw score, number right, etc.).
Another important characteristic of IRT is the concept
of local independence. That is, an examinee's performance
on one item does not affect his/her performance on other
items. In addition, it implies that the probability of a
correct response to a particular item depends only on the
ability of the examinee not on the number of people at a
particular ability level or on the number of people at
other levels of ability. Hence, a change in ability does
not result in a change in parameters. Stated differently,
the probability of a correct response is a function of the
examinees ability and item characteristics. Thus, IRT pro
vides a powerful tool for test construction and test evalu
ation especially for detecting item cultural bias.
Unlike most of the basic precepts and definitions of
classical test theory, the assumptions of IRT theory are
explicit and have the potential of empirical testing. That
is, IRT's procedures make it possible to discover if the
data meet the assumptions. The assumptions underlying IRT
are that the normal ogive (cumulative normal distributions)
or logistic (logarithmic relations) model adequately
represents the data and that the test is unidimesional
(i.e., item responses are assumed to be attributable to a
single trait) in nature.
56
57
IRT can be approached through the use of a one, two, or
three parameter model. and generally the probability of a
correct response as a function of ability is expressed in
terms of an item characteristic curve (ICC). An ICC is a
mathematical function which depicts the relationship
between ability (theta) and the probability of answering an
item correctly. A primary distinction among the three
models is in the mathematical form of the ICCs.
The one parameter logistic model (also referred to as
the Rasch model) was developed by Georg Rasch (1966). It
is concerned solely with the difficulty of a set of items.
This model is based on the assumption that all items have
equal discriminating power; guessing is negligible; and
items vary only in terms of difficulty. The mathematical
function for the ICC for this model can be expressed as:
Da(9 - bgl
p~(e) =--~-+-e--Da-(9--~-)-
in which a is the common level of discrimination for all
the items; g is the particular item; b is the index of item
difficulty; and 0 is a constant used to maximize the
agreement between the logistic model and the normal ogive
model.
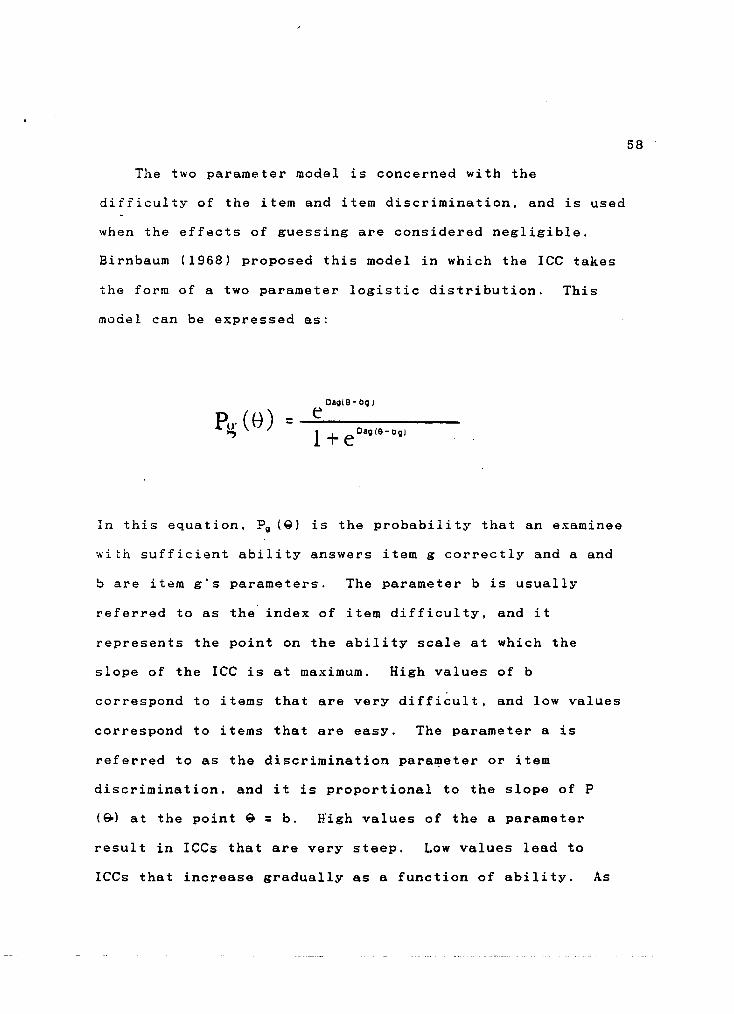
58
The two parameter model is concerned with the
difficulty of the item and item discrimination. and is used
when the effects of guessing are considered negligible.
Birnbaum (1968) proposed this model in which the ICC takes
the form of a two parameter logistic distribution. This
model can be expressed as:
Dagle- bg)
Po' ((1) = --..;e~ __ _ .., 1 + eoag(e-o g)
In this equation. Pg (Q) is the probability that an examinee
with sufficient ability answers item g correctly and a and
b are item g's parameters. The parameter b is usually
referred to as the" index of item difficulty. and it
represents the point on the ability scale at which the
slope of the ICC is at maximum. High values of b
correspond to items that are very difficult. and low values
correspond to items that are easy. The parameter a is
referred to as the discrimination para~eter or item
discrimination, and it is proportional to the slope of P
(&) at the point & = b. High values of the a parameter
result in ICes that are very steep. Low values lead to
ICCs that increase gradually as a function of ability. As

59
with the one parameter model. D is the constant used to
maximize the agreement between the logistic model and the
normal ogive model.
The three parameter model can be obtained from the two
parameter model by adding a third parameter called the
guessing parameter. This model is the most theoretically
sound and statistically complex procedure for measuring
bias (Lord. 1980: Petersen. 1977). however this model takes
full advantage of all the information available from the
response to an item. The mathematical form of the three
parameter,logistic curve can be expressed as:
e Oag(&-bgi
1 + e Oag,&- bg)
In this equation. the parameter c is the lower asymptote of
the ICC and represents the probability of examinees with
low ability correctly answering the item. Lord (1968)
suggests that the purpose of adding the c parameter in the
model is an uttempt to account for the misfit of ICes at
the low end of the ability scale. Also. the c parameter
affects the curve by squeezing it into a smaller vertical
range. The c parameter typically assumes values that are
smaller than the value that would result if examinees of
low ability were to guess randomly on the item. Parameter
a represents the discriminating power of the item or the
degree to which item response varies with abilit~ level.
Parameter b represents item difficulty and determines the
position of the curve along the ability scale (i.e., the
more difficult the item the further the curve is to the
right). Parameter c represents the guessing parameter or
the probability of a person completely lacking in ability
will answer the item correctly.
In order to obtain stable, accurate estimates of the
parameters. large samples are recommended, and the specific
size depends on the parameter one wishes to estimate
accurately. For example, for estimating the a parameter
(which is less stable than estimates of the b parameter,
but more stable than estimates for the c parameter), as
many as 50 items and 1,000 subjects have been recommended.
Other major advantages accrue from the theoretical
model and focus on the difficulty parameter that
researchers' have been unable to estimate fairly well. The
major disadvantages include the possibility that some items
may not fit the model, and, in some cases, may be
identified through simpler less costly procedures.
Procedure
Selection procedures for the subjects were accomplished
by stratifying children's responses to the CAT by ethnic
60

PLEASE NOTE:
Page(s) not included with original material and unavailable from author or university. Filmed as received.
61
62
U·M·I
CHAPTER 4
RESULTS
The means and standard deviations of the raw score
correct responses were computed for the Anglo group (mean:
12.71. sd: 3.12). the Black group (mean: 10.80. sd: 3.81)
and the Hispanic group (mean: 10.56. sd: 4.11). These
scores were converted to z scores and reported for
convenience and refer~nce in the Appendix. This data
analysis shows the mean population distributions as being
different across groups. This finding is consistent with
research (e.g .. Williams. 1970. 1974; Mercer. 1979; Jensen.
1980: Anastasi. 1982; Reynolds. 1982) demonstrating that
minority groups. especially Black. consistently score at
least .5 standard deviation below the mean of the white
majority. However. a psychometric statistical procedure
was used to determine if bias exists in the test.
The Item Response Theory. Likelihood Ratio chi square
test (IRT-LR). as defined by Lord (1980) and described by
Thissen (1988) was used to detect potential bias in the
first 15 items of the Reading Comprehension subtest from
the California Achievement Tests. The IRT-LR procedures
were used to test the differences in b parameters between
63
Anglo and Black population distributions and Anglo and
Hispanic population distributions. Essentially, IRT-LR is
a test that is concerned with the investigation of
equivalence of item parameters across groups. Data were
run using the computer programs, INFORLOG and MULTI LOG
(Thissen, 1986).
Raw data were converted to binary form for the computer
runs in which correct responses received a 1 and incorrect
responses received a O. The raw data were initially
processed with the INFORLOG program. Basically, this
program structures and prepares the data in a manner to
facilitate the MULTILOG program run. The distribution of
theta in both groups was unit normal with a mean of 0.0 and
a standard deviation of 1.0 for the reference group.
During the fit wherein bR = b, • the means and standard
deviations of the focal groups (Black and Hispanic) were
free to vary. During the fit wherein bg =/= bF ' all group
standard deviations were fixed to 1.0. Fifty cycles for
maximum marginal likelihood estimates were used to converge
the estimators below 0.001. The principal of maximum
likelihood requires one to choose as the estimate that
possible value of theta making the likelihood take on its
largest value (Hays, 1973). Fundamentally, this principal
suggests that given the availability of several parameter
values, any of which might be the true value of the
64

population, the best choice would be the one which would
have made the actual obtained sample have the highest prior
probability. That is, the best choice for the estimator is
the one which would have made the obtained result most
likely.
In the IRT-LR analyses, the null hypotheses of no group
differences in item difficulty parameters (b parameters)
was tested across three steps for each group comparison
(Anglo and Black, Anglo and Hispanic). That is, the b
parameters of the Reference group (Anglo) equals the b
parameters of the Focal group (Black or Hispanic). It is
common knowledge (Lord, 1980; Thissen, 1982, 1986, 1988)
that there is very little information about the value of
the guessing parameter (c parameter) in data from
relatively easy items. Because these item responses were
selected from the first part of the subtest, it was assumed
that they would be easier than the latter items in the
subtest. Therefore, as suggested by Lord (1986), the c
parameters were constrained to be equal across items,
groups and fits. During Step 1, the IRT model was fitted
simultaneously to the data of b~ and bF There were no
between group equality constraints placed on the items
(i.e., b~ =/= b,). Maximum likelihood estimates of the
parameters were computed. During Step 2, the IRT model was
refitted under the equality constraint that b~ = b, And
65

during Step 3. the difference value of the loglikelihood
ratio chi squares between fits was subjected to a table of
significant values for a chi square distribution.
Anglo and Black Group Analysis
Table 1 shows the a and b parameter logist form values.
The a parameters were included to demonstrate that they
were varying during this fit. These parameter values
fitted without equality constraints (i.e .. b R =/= b f
resulted in a negative twice the loglikelihood (loglikeli
hood ratio) value of -2347.0. The logist form values for
the a and b parameters across items and between groups are
different because these parameters were free to vary. When
equality constraints were imposed (e.g .. b R = b F ). the a
and b parameters were equalized between groups by items
(i.e .. Item 1. Group I=Item 1. Group 2; Item 2. Group
l=Item 2. Group 2; Item 3. Group l=Item 3. Group 2; Item 4.
Group I=Item 4. Group 2; Item 5. Group I=Item 5. Group 2
and so forth through Item 15. Group l=Item 15. Group 2).
These results are categorized under the heading of "With
Constraints". The negative twice the loglikelihood value
for this fit was -2329.9. The difference value between the
loglikelihood ratios was 13.1. Thus. Anglo and Black
groups did not differ significantly on item difficulty
parameters (X&= 13.1 (df=30) p.>.05). and. therefore. no
biased items were found in the Black group. The mean sco~e
66
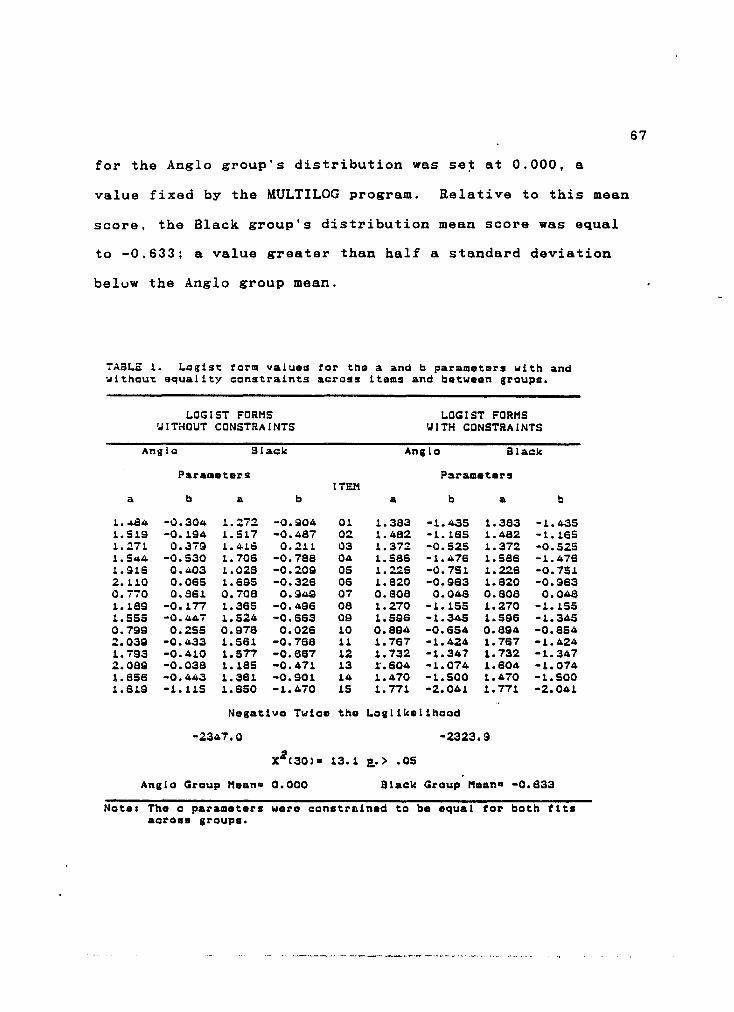
for the Anglo group's distribution was se~ at 0.000, a
value fixed by the MULTILOG program. Relative to this mean
score, the Black group's distribution mean score was equal
to -0.633; a value greater than half a standard deviation
beluw the Anglo group mean.
TABl.E: 1. Lagist tarm yalue. tor the a and b parametors with and 1JithauT. equality constraints across Ltems and betweon groups.
LOGIST FORMS LOGIST FORMS WITHOUT CONSTRAINTS WITH CONSTRAINTS
Anglo Slack Angio Black
Parameters Parameters ITEM
a b a b a b II b
1 • ..a4 -0.304 1.272 -0.904 01 1.a63 -1.435 1.363 -1.435 1.519 -0.194 1.517 -0.467 02 1.462 -1.165 1.462 -1.165 1.271 0.379 1.4113 0.211 03 1.372 -0.525 1.372 -0.525 1.544 -0.530 1.706 -0.786 04 1.566 -1.476 1.56S -1.476 1.:HS 0.403 1.028 -0.209 as 1.226 -0.751 1.226 -0.751 2.110 0.065 1.695 -0.326 06 1.820 -0.963 1.820 -0.963 0.770 0.661 0.706 0.949 07 0.606 0.046 0.606 0.048 1.169 -0.177 1.365 -0.496 06 1.270 -1.155 1.270 -1.155 1.SSS -0.447 1.S211. -0.663 09 1.596 -1.345 1.596 -1.345 0.799 0.255 0.978 0.026 10 0.694 -0.654 0.694 -0.654 2.039 -0.433 1.561 -0.7S8 11 1.767 -1.424 1.767 -1.424 1.793 -0.410 1.577 -0.667 12 1.732 -1.347 1.732 -1.347 2.089 -0.038 1.185 -0.471 13 1'.604 -1.074 1.604 -1.074 1.656 -0.11.43 1.361 -0.901 14 1.470 -1.500 1.470 -1.500 1.819 -1.115 1.650 -1.470 15 1.771 -2.041 1.771 -2.041
NegatiYe Twice tho LaglLkalihaod
-2347.0 -2323.9
XZ(30)a 13.1 2,.> .05
Anglo Group Moana 0.000 Black Group 11 ... n a -0.633
Note: The c paramotors were constrained to bo equal tar both tits acros. IIroups.
67
68
Anglo and Hispanic Group Analysis
In a similar fashion to the Anglo and Black group
analysis. the'a and b item parameters for'the Anglo and
Hispanic groups were allowed to vary. during the fit in
These values can be seen in Table 2
under the heading of "Without Constraints". This fit
resulted in a negative twice the loglikelihood value of
-2351.6. When refitted. the a and b parameters for each
item were constrained to oe equalized between groups by
items (i.e .• Item 1. Group I=Item 1. Group 2; Item '2. Group
I=Item 2. Group 2; ...... Item 15. Group I=Item 15. Group 2).
This fit resulted in a negative twice the loglikelihood-
value of -2342.6. The difference value between the
loglikelihood ratios was 9.0. Thus. no significant group
differences were found between the Anglo and Hispanic group J.
item difficulty parameters (X = 9.0 (df=30) p.> .05), and
therefore no biased items were found in this group
analysis. The mean distribution score value for the Anglo
group was set at 0.000 by the MULTILOG program. Relative
to the Anglo mean distribution score value. the HIspanic
group mean distribution was -.0713; a value almost three
quarters of a standard deviation below the mean of the
Anglo group.
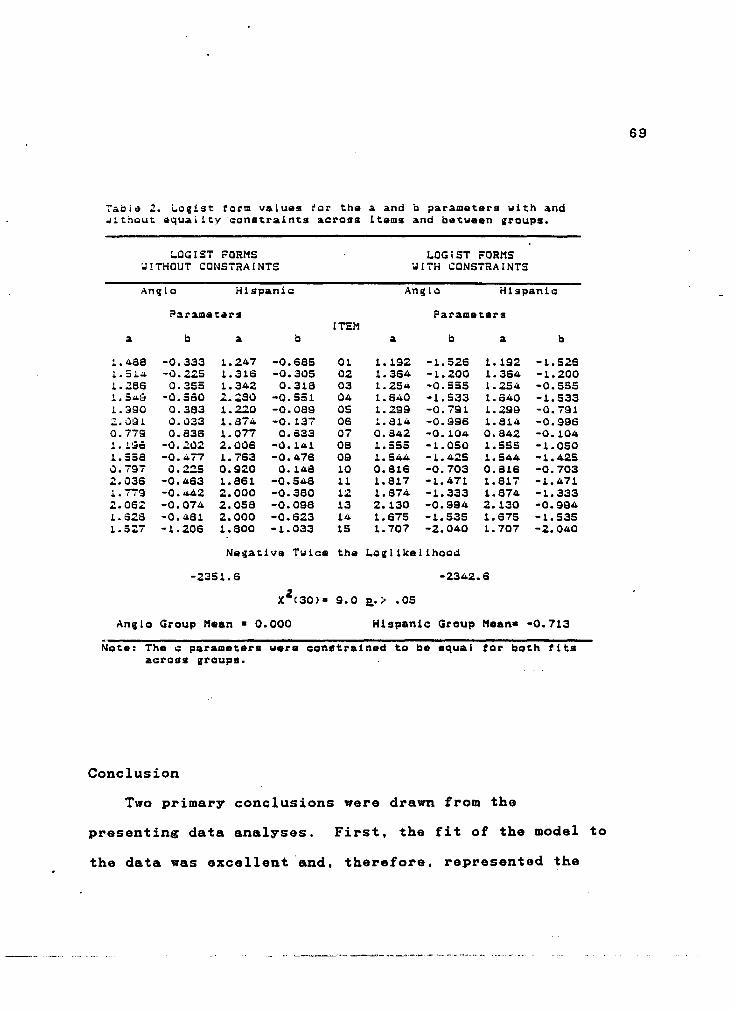
7aoi~ 2. ~ogist torm values tor the a and b parameters with and J~~~out ~quai1ty constraints across items and between groups.
L.OGIST FORMS U!THOUT CONSTRAINTS
:'.488 1.514 1.~a6 l.S ... 9 1.990 :':'.;)91 0.779 l.l.!dc 1.558 u.797 2.036 1.779 2.062 1.626 1.5.7
b
-0.333 -U.22S 0.355
-1l.SSO 0.383 0.033 0.836
-O.21l2 -0.477
O.2:!5 -0.463 -0.<1042 -0.074 -0.~81 -1.206
Hispanic
a
1.247 1. 316 1.342 2.ZS0 1.220 1.674 1.077 2.01l6 1.763 0.920 1.8S1 2.000 2.058 2.000 1.800
-0.685 -0.305 0.318
-0.551 -0.089 -0.137 0.633
-0.141 -0.476 0.lA6
-0.548 -0.380 -0.098 -0.623 -1.033
-2351.6
Anilo Group Hean - 0.000
ITEM
01 02 03 04 05 06 07 08 09 10 11 12 13 14 15
1..0GtST FORMS ~iTH CONSTRAINTS
Anglo Hispanic
a
1.192 1.364 1.254 1.640 1.299 l. .:314 0.642 1.555 1.544 0.616 1.617 1.674-2.130 1.675 1.707
Parameters
b
-1. 526 -1.200 -0.555 -1. 533 -0.791 -0.996 -0.104 -1.050 -1.425 -0.703 -1.471 -1.333 -0.994 -1.535 -2.040
a
1.192 1.364 1.254 1.640 1.299 1.S14 0.842 1.555 1.544 0.616 1.817 1.874 2.130 1.675 1.707
-2342.6
b
-1. 526 -1.200 -0.555 -1. 533 -0.791 -0.996 -0.104 -1.050 -1.425 -0.703 -1.471 -1. 333 -0.994 -1. 535 -2.040
Hispanic Group Hean- -0.713
Note: The c parameters were constrained to ba equal tar bath tits across groups.
Conclusion
Two primary conclusions were drawn from the
presenting data analyses. First. the fit of the model to
the data was excellent 'and. therefore. represented the
69
data. Thus. item responses seem to be attributable to a
single trait. ability.
Second. data from the IRT-LR analyses indicated that
there were no significant differences in the responses of
Black and Hispanic groups due to item difficulty. although
the means of the three populations were different. There
fore. group mean differences do not automatically mean bias
in the test itself. During these analyses. the Anglo group
item parameters served as the designated anchor items
because the presumption was made that the Anglo items would
function similarly for subjects of both groups. Although
it is unimportant which group items serve as the designated
group anchor items. the items from the Anglo group were
chosen in order to demonstrate mean group population
differences between white and nonwhite populations does not
necessarily dictate bias against minority cultures as a
function of the test.
70
CHAPTER 5
. SUMMARY AND DISCUSSION
Test bias continues to be an important concern to both
the developers, the users and the recipients of tests. The
complexity involved in the issues of test bias remains even
in the face of a convincing plethora of evidence supporting
the notion that most standardized tests are not culturally
biased. Regardless of the purpose of a test or its
validity for that purpose, a test should result in
distributions that are statistically equivalent across
groups in order for it to be considered nonbiased for these
groups. Some difficulty is encountered with the majority
of statistical procedures in that most of these methods
yield results that may be artifacts of the method itself.
However, the alternative of leaving the determination of
validity of a test to judgmental methods seems empirically
unsound.
With the development of more robust statistical
procedures such as IRT, 3 parameter models, determination
of bias within a test becomes a priority for psychometri
cians to not only demonstrate a test's freedom from bias
but also to educate the public. Using these types of
statistical methods, decisions about test bias can be made
71

with greater confidence. Current IRT methods seem to be
better detectors of bias than other traditional methods.
The three parameter model is, perhaps, the most effective
because it uses all the information of the item by
estimating all of its parameters. In addition, IRT-LR
seems to be better at determining bias between groups than
even LOGIST. Clearly, IRT based procedures that depend on
multiple logistic calibrations do not automatically result
in tests of null hypotheses or estimates of parameter
differences that are optimal. Moreover, even the marginal
maximum likelihood procedures are not optimal when the
assumed model is wrong. Thus, when the model fits the
data, as it has been shown here to do, confidence can be
placed in the results. This is not necessarily the case
with some other traditional tests for bias (e.g., ANOVA
methods) in which results may be artifacts of the
statistical procedures themselves.
Of primary importance, however, is the establishment of
a clear definition of bias. Perhaps, a~ this study has
adopted, the best approach is to define bias in scientific,
psychometric terms allowing the issue to be subjected to
empirical evaluation. In this respect, Jensen's (1980)
conceptualization seems to meet the criteria. Thus, bias
in tests can and should be viewed as systematic error,
rather than be viewed as an emotional unempirical approach.
72

Although on a small scale. this study addressed the
bias issue at the item level with achievement tests,
consistent with Berk's (1982) opinion that items are at the
very root of the test, and freedom from bias at a total
test score does not preclude the ~ndividual items from
potential bias. In addition, this study was directed at
achievement tests consistent with the notion that these
types of tests are more susceptible to cultural biases than
cognitive ability tests. Moreover, this study was an
attempt to contribute to the test bias literature base to
bridge the gap between predictive validity bias with
cognitive tests and item bias in achievement tests.
Despite the analyses of these data that the IRT-LR
assessment of item bias did not detect differences between
the item difficulty values of Anglo and Black groups or
between the item difficulty values of Anglo and Hispanic
groups, the study was empirically sound. As such, it
contributes to the scientific literature and is of
practical importance. Thus, although no group item
difficulty differences were found in this study, the
results a~e meaningful because some of the items on the
Reading Comprehension subtest in the CAT are still being
used as anchor items for tests being developed today, This
study supports the idea that at least the first fifteen
items on this subtest are not culturally biased against any
73

group. However. it is important to note that this study
does not represent all items on the Reading Comprehension
subtest or achievement tests in general .. Consequently, any
generalization of these results to all achievement tests
should be made with caution at best. Nonetheless, this
study could very well be the start of investigations
designed to assess achievement tests in general, and remove
some of the doubt that achievement type tests are biased
against minority groups.
Inter~stingly. the rRT-LR mean distribution score of
the Black group (-0:663) and the mean distribution score of
the Hispanic group (-0.713) are consistent with the raw
score means (10.80 and 10.56. respectively. see Appendix).
and are in agreement with the notion that minority groups
generally score between 0.5 and 1.0 standar.d deviation
below the mean of the majority group. Given these
population mean score results, this study could have easily
fallen into the trap of the framework of the egalitarian
fallapy. if another statistical method was used.
Test bias remains an unresolved issue; in part because
group mean differences consistently appear in the results
of both cognitive ability and achievement tests. One
reasonable explanation for this difference in performance
is that some test items may simply function differently for
examinees drawn from one group or another or they may
74
"measure different things" for members of one group as
opposed to members of another. As such, tests containing
such items may have reduced validity for between-group
co~parisons, because their score~ may be indicative of a
variety of attributes other than those the test is intended
to measure. Although this did not seem the case for the
present study, its results should not suspend future
research from investigating such claims. Another reason
might be that bias in items may not be due to identifiable
traits in one groups over another. Biased items might
exhibit a type of multidimensionality that involves small,
unique effects on items in one or both groups. And,
perhaps, another reason might be that item bias is simply
an artifact of test construction, that is, other items may
be included with items designed to measure the purported
trait under investigation.
Implications for Future Research
The present study addressed potential item bias in the
Reading Comprehension subtest of the CAT using a robust
statistical procedure, namely IRT-LR. It was not designed
to address all issues of test bias, but rather begin the
contributions towards a better understanding of potantial
bias in achievement tests. Some modifications to the
present study could yield different results. For example,
sample sizes could be increased. This study used
75
relatively small sample sizes for the groups under study.
Because the focal group sample sizes had only 500 subjects
each, perhaps, smaller differences may not have been
readily detected. It is likely that the detection of
smaller differences may be found reliably only with larger
sample sizes. However, increases in sample sizes will
increase costs, and this may prevent this type of method
from being conducted for large scale test analyses. In
addition, an a priori assumption was made that the items
from the Anglo group consisted of items that did not
exhibit bias. Bias detected by IRT-LR, as performed in
this study, is bias relative to·the differences between
groups on the anchor items. That is, the determination of
bias may have been reached if the group differences for the
Black and Hispanic item responses were different from the
item responses from the Anglo group, provide~ the Anglo
group responses were free of bias. Uniform group
differences are not detected by such analyses as IRT-LR.
Moreover, the items used to determine bias were the
first fifteen items of the Reading Comprehension subtest.
It is presumed that these items were the easiest compared
to items that would be found towards the latter part of the
subtest. It may be that future research could find
differences between groups at the higher end of the item
response spectrum (i.e., the last fifteen items).
76
Several other implications exist for future research
based on this study's methodology. IRT methods are a
powerful and more sophisticated means to detect bias in
items. Future research might provide support to other
traditional statistical methodolgies by investigating item
bias in cognitive ability tests. Potential sex differences
on all types of tests might prove to be interesting and
used in conjunction with subjective validity measures.
Determining potential bias across grade levels in
achievement tests might also provide information on
potential bias in items across different forms or levels of
such tests. Finally, there is a need to include other
minority groups (e.g., native american and asian groups).
This study and future studies are necessary for
psychometric, scientific inquiry because it is objective
rather than subjective. The detection methodology used in
this study provides a robust procedure to determine
potential bias in items apart from group mean differences.
If scientific inquiry is stopped or prevented, measurement
will regress to subjective choices and the result may be
far greater opportunity for bias against different
ethnocultural groups.
77
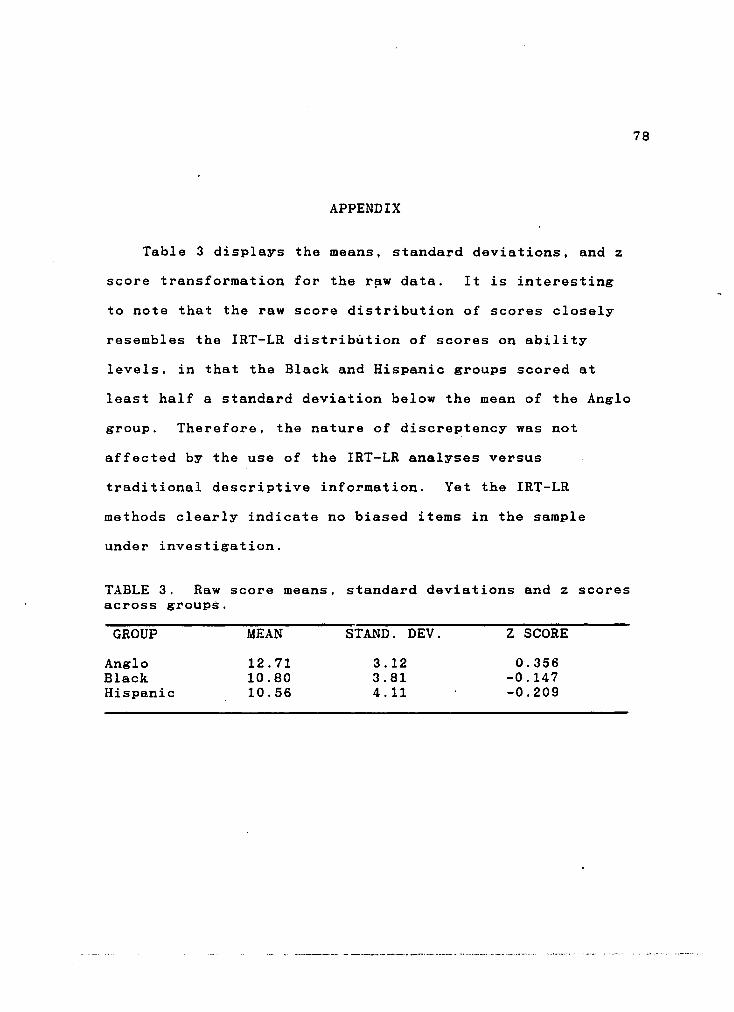
APPENDIX
Table 3 displays the means, standard deviations, and z
score transformation for the r~w data. It is interesting
to note that the raw score distribution of scores closely
resembles the IRT-LR distribution of scores on ability
levels, in that the Black and Hispanic groups scored at
least half a standard deviation below the mean of the Anglo
group. Therefore, the nature of discreptency was not
affected by the use of the IRT-LR analyses versus
traditional descriptive information. Yet the IRT-LR
methods clearly indicate no biased items in the sample
under investigation.
TABLE 3. Raw score means, standard deviations and z scores across groups.
GROUP
Anglo Black Hispanic
MEAN
12.71 10.80 10.56
STAND. DEV.
3.12 3.81 4.11
Z SCORE
0.356 -0.147 -0.209
78

REFERENCES
Alderman. D. L. & Holland. P. W. Item performance across native language groups on the Test of English as a Foreign Language. (TOEFL Research Reports. Report 9; ETS Research Report 81-16). Princeton: Educational Testing Service. 1976.
Anastassi. A. Macmillan.
Psychological testing (4th ed.). New York: 1976.
Anastassi. A. Abilities and the measurement of achievement. New Directions for Testing and Measurement. 1980. 5. 1-10.
Anastassi. A. Psychological testing (5th ed.). New York: Macmillan. 1982.
Angoff. W. H. The investigation of test bias in the absense of an outside criterion. Paper presented at the National Institute of Education Conference on test bias. Washington. D. C. 1975.
Angoff, W. H. Group membership as a predictor variable: A comment on McNemar. American Psychologist. 1976. 31. 612.
Angoff. W. H. Use of difficulty and discrimination indices for detecting item bias. In R. A. Berk (Ed.), Handbook of methods for detecting test bias. Baltimore: John Hopkins University Press, 1982.
Angoff. W. H. & Ford, S. F. Item race interaction on a test of scholastic aptitude. Journal of Educational Measurement, 1973, 10, 95-105.
Angoff. W. H. & Sharon. A. T. A comparison of scores earned on the Test of English as a Foreign Language by native american college students and foreign applicants to U.S. colleges. TESOL Quarterly, 1971, 5. 129-136.
Angoff. W. H. & Sharon. A. T. Patterns of test and item difficulty for six foreign language groups on the Test of English as a Foreign Language. ETS Resoarch Bulletin No. 72-2. Princeton: Educational Testing Service. 1972.
79

Angoff. W. H. & Sharon. A. T. The evaluation of differences in test performance of two or more groups. Education and Psychological Measurement, 1974, 34. 807-816.
Berk, R. A. Handbook of methods for detecting test bias. Baltimore: John Hopkins University Press, 1982.
Binet, A. & Simon, T. The development of intelligence in children (E. S. Kite, translation). Baltimore: Williams and Wilkins, 1916.
Birnbaum, A. Some latent trait models and their use in inferring an examinee's ability. In F. M. Lord & M. R. Novick (Eds.), Statistical theories of mental test scores. Massachusetts: Addison-Wesley, 1968.
California Achievement Tests: Technical Bulletin I, Monterey, California 1979. CTB/McGraw Hill.
California Achievement Tests: Technical Bulletin 2, Monterey, California 1980.
Camilli, G. A critique of the chi-square method for assessing item bias. Laboratory of Educational Research, University of Colorado, 1979.
Cardall, C. & Coffman, W. E. A method for comparing the performance of different groups on the items in a test. College Entrance Examination Research and Development Report 64-5, No.9; ETS Research Bulletin 64-61. Princeton: Educational Testing Service, November 1964.
Cattell, R. B. Personality and learning theory, Vol. I: The structure of personality and its environment. New York: Springer, 1979.
Cleary, T. A. Test bias: Prediction of grades of negro and white students in integrated colleges. Journal of Educational Measurement, 1968, 5, 115-124.
Cleary, T. A. & Hilton, T. L. An investigation of item bias. Educational and Psychological Measurement, 1968, 28, 61-75.
Cowell, W. & Swineford, F. Comparisons qf test analysis data for white male canidates with white female canidates. In Law School Admission Council, Reports of LSAC sponsored research: Volume II. Princeton: Law School Admission Council, 1976.
80
Craig, R. & Ironson, G. H. The validity and power of selected item bias techniques using an a priori classification of items. Paper presented at the annual meeting of the American Educational Research Association, Los Angeles, August 1981.
Cronbach, L. J. Essentials of psychological testing (3rd ed.). New York: Harper and Row, 1970.
Cronbach, L. J. Five decades of public controversy over mental testing. American Psychologist, 1975, 30, 1-14.
Cronbach, L. J. Validity on parole: How can we go straight? In W. B. Schrader (Ed.), New directions for testing and measurement (No.5), Measuring achievement: progress over a decade. San Francisco:Jossey Bass, 1980.
Cronbach, L. J. Essentials of psychological testing (4th ed.). New York: Harper and Row, 1984. CTB/McGraw Hill.
Diana v. State Board of Education. C-70 37 RFP. District Court for Northern District of.California. February 1970.
Donlon, T. F. Content factors in sex differences on test questions. ETS Research Memorandum 73-28. Princeton: Educational Testing Service. 1973.
Donlon. T. F., Hicks, M. M .• & Willmark. M. M. Sex differences in item responses on the Graduate Record Exam. Applied Psychological Measurement. 1980, 4, 9-20.
Eells K., Davis. A. Havighurst. R. J., Herrick. V. E .• & Tyler. R. W. Intelligence and cultural differences. Chicago:University of Chicago Press, 1951.
Flaugher. R. L. The many definitions of test '·ias. American Psychologist, 1978. 33. 671-679.
Goddard, H. H. A measuring scale of intelligence. Training School. 1910, 6, 146-155.
Green, D. R. Procedures of assessing bias in achievement tests. Paper presented at the National Institute of Education Conference on test bias. Washington. D. C. 1975.
81

Green. D. R. & Draper, J. F. Exploratory studies of bias in achievement tests. Paper presented at the annual meeting of the American Psychological Association, Honolulu. September 1972. (ERIC Document Reproduction Service No. ED 070 794).
Guadelupe v. Tempe Elementary School District, 71-435. District Court for Arizona, January 1972.
Gutkin. T. B. & Reynolds. C. R. Factorial similarity of the WISC-R for white and black children from the standardization sample. Journal of Educational Psychology. 1981, 73, 227-231.
Hambelton, R. K. Test score validity and standard setting methods. In R. A. Berk (Ed.), Criterion-referenced measurement: The state of the art. Baltimore: John Hopkins University Press, 1980.
Hambelton, R. K. & Cook, L. L. Latent trait models and their use in the analysis of educational test data. Journal of Educational Measurement, 1977, 14, 75-96.
Hilliard. A. G. Standardization and cultural bias as impediments to the scientific study and validation of "intelligence". Journal of Research and Development in Education. 1979, 12, 47- 58.
Humphreys, L. G. Statistical definitions of test validity for minority groups. Journal of Applied Psychology, 1973, 58, 1-4.
Humphreys, L. G. The construct of general intelligence. Intelligence, 1979, 3, 105-120.
Hunter, J. E. & Schmidt, F. L. A critical analysis of the statistical and ethical implications of various definitions of "test bias". Psychological Bulletin, 1976, 83, 1053-1071.
Ironson, G. H. Use of chi-square and latent trait approaches for detecting item bias. In R. A. Berk (Ed.), Handbook of methods for detecting test bias. Baltimore: John Hopkins University Press, 1982.
Ironson, G. H. & Subkoviak, M. A. A comparison of several methods of assessing item bias. Journal of Educational Measurement, 1979, 16, 209-225.
82
Jackson. C. D. On the report of the Ad Hoc Committee on Educational Uses of Tests with Disadvantaged Students: Another psychological view from the Association of Black Psychologists. American Psychologist, 1975, 30, 86-90.
Jensen. A. R. How biased are culture-loaded tests? Genetic Psychology Monographs, 1974, 90, 185-224.
Jensen, A. R. Test bias and construct validity. Phi Delta Kappan, 1976, 58, 340-346.
Jensen, A. R. An examination of culture bias in the Wonderlic Personnel Test. Intelligence, 1979, 1, 51-64.
Jensen. A. R. Bias in mental testing. New York:Free Press, 1980.
Larry P. et al. v. Wilson Riles et al., United States District Court, Northern District of California (C-71-2270 RFP) , 1979.
Linn, R. L. Issues of validity in measurement for competency- based programs. In M. S. Bunda & J. R. Sanders (Eds.), Practices and problems in competency-based education. Washington D.C.: National Council on Measurement in Education, 1979.
Linn, R. L. Issues of validity for criterion-referenced measures. Applied Psychological Measurement, 1980, 4, 547-581.
Linn, R. L. & Harnish, D. Interactions between item content and group membership on achievement test items. Journal of Educational Measurement, 1981, 18, 109-118.
Lissak, R. I. & Wytmar, III, R. CARIF: A computational program for item information functions and item characteristic curves. Behavior Research Methods and instrumentation, 1981, 13, 360.
Lord, F. M. A study of item bias, using item characteristic curves theory. In Y. H. Poortinga (Ed.), Basic problems in cross-cultural psychology. Amsterdam: Swets and Zeitlinger, 1977.
Lord, F. M. Applications of item response theory to practical testing problems. New Jersey: Lawrence Erlbaum Associates, 1980.
83
Lord. F. M. & Novick. M. R. Statistical theories of mental test scores. Massachusetts: Addison-Wesley. 1968.
Mercer. J. R. The pluralistic assessment project: Sociocultural effects in clinical assessment. School Psychology Digest. 1971. 2. 10-17.
Mercer. J. R. System of Multicultural Pluralistic Assessment (SOMPA): Technical manual. New York: Psychological Corporation. 1979.
Merz. W. R. & Grossen, N. F. An empirical investigation of six methods for examining test item bias. Paper presented at the annual meeting of the National Council on Measurement in Education, San Francisco. April 1979. (ERIC Reproduction Service No. ED 178 566).
Messick, S. The standard problem: Meaning and values in measurement and evaluation. American Psychologist. 1975, 30. 955-966.
Messick. S. Test validity and the ethics of assessment. Paper presented at the annual meeting of the American Psychological Association, New York, September 1979.
Miele, F. Cultural bias in the WISC. 3, 149-164.
Intelligence, 1979,
Nichols, R. C. Policy implications of the IQ controversy. In L. S. Shulman (Ed.), Review of research in education (Vol. 6). Itasca, Ill.: Peacock, 1978.
Nungester, R. J. An empirical examination of three models of i~em bias. Doctoral Dissertation, Florida State University. Dissertation Abstracts International, 1977, 38, 2726A. (University Microfilms No. 77-24, 289)
Petersen, N. S. test. Paper Symposium on Netherlands,
Bias in the selection rule: Bias in the presented at the Third International Educational Testing, University of Leyden, June 1977.
Petersen, N. S. & Novick, M. R. An evaluation of some models for culture-fair selection. Journal of Educational Measurement, 1976, 13, 3-29.
Pine, S. M. Applications of the latent trait test model for reducing ethnic bias in testing. Paper presented at the annual meeting of the Psychometric Society, Princeton, New Jersey, 1975.
84
Pine, S. M. Applications of item characteristic curve theory to the problems of test bias. In D. J. Weiss (Ed.), Applications of computerized &daptive testing. Minneapolis: University of Minnesota, 1977.
Plake, B. An investigation of a reviewer's ability to identify items which function differently for selected groups of subjects. Paper presented at the annual meeting of the National Council of Measurement in Education. San Francisco, April 1979.
Potthoff, R. F. Statistical aspects of the problem of biases in psychological tests. Chapel Hill: University of North Carolina, 1966.
Rasch, G. Probabilistic models for some intelligence and attainment tests. Copenhagen: Denmarks Paedagogiske Institut, 1960.
Rechley, D. Comparisons of bias in assessment with conventional and pluralistic measures. Paper presented at the annual meeting of the Council for Exceptional Children, 1978. (ERIC Document Reproduction Service, ED 153 386)
Rechley, D. Nonbiased assessment. In G. Phye & D. Rechley (Eds.), School Psychology: Perspectives and issues. New York: Academic Press, 1979.
Reynolds, C. R. The problem of test bias in psychological assessment. In C. R. Reynolds & T. B. Gutkin (Eds.), The handbook of school psychology. New York:Wiley, 1982.
Rudner, L. M. An approach to biased item identification using latent trait measurement theory. Paper presented at the annual- meeting of the American Educational Research Association, New York, April 1977.
Rudner, L. M. & Convey, J. J. An evaluation of select approaches for biased item identification. Paper presented at the annual meeting of the American Educational Research Association, Toronto, March 1978. (ERIC Document Reproduction Service No. ED 157 942)
Rudner, L. M., Getson, P. R., & Knight, D. L. A Monte Carlo comparison of seven biased item detection techniques. Journal of Educational Measurement, 1980, 17, 1-10.
,-
85

Sandoval. J. The WISC-R and internal evidence of test bias with minority groups. Journal of Consulting and Clinical Psychology. 1979. 47. 919-927.
Sandoval. J. & Miille. M. P. W. AccuracY'of judgments of WISC-R item difficulty for minority groups. Journal of Consulting and Clinical Psychology. 1980. 48. 249-253.
Sattler. J. M. Standard intelligence tests are valid instruments for measuring the intellectual potential of urban children: Comments on pitfalls in the measurement of intelligence. Journal of Psychology. 1979. 102. 107-112.
Sattler. J. M. Assessment of children's intellignece and special abilities (2nd ed.). Boston: Allyn and Bacon. Inc .. 1982.
Scheuneman. J. D. A new method of assessing bias in test items. Paper presented at the annual meeting of American Educational Research Association. Washington D.C .. April 1975. (ERIC Document Reproduction Service No. ED 106 359)
Scheuneman. J. D. A method of assessing bias in test items. Journal of Educational Measurement. 1979. 16. 143-152.
Schmeiser. C. B. Use of experimental design in statistical item bias studies. In R. A. Berk (Ed.). Handbook of methods for detecting bias. Maryland: John Hopkins University Press. 1982.
Shepard. L. A. Definitions of bias. In R. A. Berk (Ed.). Handbook of methods for detecting bias. Maryland: John Hopkins University Press. 1982.
Sinnott. L. W. Differences in item performance across groups. ETS Research Report 80-19. Princeton: Educational Testing Service. 1980.
Spearman. C. The abilities of man. New York: Macmillan. 1917.
Strassberg-Rosenberg. B. & Donlon. T. F. Content influences on sex differences in performance on aptitude tests. Paper presented at the annual meeting of the National Council on Measurement in Education. Washington D.C .• April 1975.
86

Striker. L. J. A new index of differential subgroup performance: Application to the GRE Aptitude Test. GRE Board Professional Report GREB No. 78-7P; ETS Research Report 81-13. Princeton: Educational Testing Service. 1981.
Subkoviak. M. J .• Mack. J. S., & Ironson, G. H. Item bias detection procedures: Empirical validation. Paper presented at the annual meeting of the American Educational Research Association. Los Angeles. April 1981.
Swineford, F. Comparisons of black canidates and chicano canidates with white canidates. In Law School Admission Council, Reports of LSAC sponsored research: Volume II. Princeton: Law School Admission Council, 1976.
Thissen. D. MULTILOG: Multiple categorical item analysis and test scoring (Users manual, Ver. 5), 1984.
Thissen, D., Steinberg, L., & Gerrard, M. Beyond group-mean differences: The concept of item bias. Psychological Bulletin, 1986, 99, 118-128.
Thissen, D., Steinberg, L., & Wainer, H. Use of item response theory in the study of group differences in trace lines. In Wainer & Braun (Eds.) Test validity. Lawrence Erlbaum Associates:New Jersey, 1988.
Tiegs, E. W. & Clark, W. W. CTB/McGraw Hill: California Achievement Tests. Monterey, 1970.
Tittle, C. K. Use of judgmental methods in item bias studies. In R. A. Berk (Ed.), Handbook of methods for detecting test bias. Baltimore: John Hopkins University Press, "1982.
Urry, V. W. Ancillary estimators for the item parameters of mental tests. In W. A. Gorham (Chair), Computerized testing: Steps toward the inevitable conquest (PS-76-1). Washington, D.C.: Personnel Research and Development Center, U.S. Civil Service Commission, 1976. "
Williams, R. L. Danger: Testing and dehumanizing black children. Clinical Child Psychology Newsletter, 1970, 9, 5-6.
87
Williams. R. L. Abuses and ~isuses in testing black children. Counseling Psychologist. 1971. '2. 62-77.
Williams. R. L. From dehumanization to black intellectual genocide: A reJ01ner. In G. J. Williams & S. Gordon (Eds.). Clinical child psychology: Current practices and future perspectives. New york: Behavioral Publications. 1974.
Wood. R. L. & Lord, F. M. A user's guide to LOGIST. ETS Research Memorandum 76-4. Princeton: Educational Testing Service, 1976.
Wood. R. L., Wingersky, M. S., & Lord, F. M. LOGIST: A computer program for estimating examinee ability and item characteristic curve parameters. ETS Research Memorandum 76-6. Princeton: Educational Testing Service. 1976.
Wright, B. J. & Isenstein. V. R. Psychological tests and minorities (DHEW Pub. No. 78-482). Rockville, Md.: National Institute of Mental Health, 1977.
88