information to users - open...
TRANSCRIPT
Recovery of gold and silver from ammoniacal thiosulfatesolutions containing copper by resin ion exchange method
Item Type text; Thesis-Reproduction (electronic)
Authors Atluri, Vasudeva Prasad, 1959-
Publisher The University of Arizona.
Rights Copyright © is held by the author. Digital access to this materialis made possible by the University Libraries, University of Arizona.Further transmission, reproduction or presentation (such aspublic display or performance) of protected items is prohibitedexcept with permission of the author.
Download date 31/05/2018 07:42:27
Link to Item http://hdl.handle.net/10150/276566

INFORMATION TO USERS
This reproduction was made from a copy of a document sent to us for microfilming. While the most advanced technology has been used to photograph and reproduce this document, the quality of the reproduction is heavily dependent upon the quality of the material submitted.
The following explanation of techniques is provided to help clarify markings or notations which may appear on this reproduction.
1.The sign or "target" for pages apparently lacking from the document photographed is "Missing Page(s)". If it was possible to obtain the missing page(s) or section, they are spliced into the film along with adjacent pages. This may have necessitated cutting through an image and duplicating adjacent pages to assure complete continuity.
2. When an image on the film is obliterated with a round black mark, it is an indication of either blurred copy because of movement during exposure, duplicate copy, or copyrighted materials that should not have been filmed. For blurred pages, a good image of the page can be found in the adjacent frame. If copyrighted materials were deleted, a target note will appear listing the pages in the adjacent frame.
3. When a map, drawing or chart, etc., is part of the material being photographed, a definite method of "sectioning" the material has been followed. It is customary to begin filming at the upper left hand corner of a large sheet and to continue from left to right in equal sections with small overlaps. If necessary, sectioning is continued again—beginning below the first row and continuing on until complete.
4. For illustrations that cannot be satisfactorily reproduced by xerographic means, photographic prints can be purchased at additional cost and inserted into your xerographic copy. These prints are available upon request from the Dissertations Customer Services Department.
5. Some pages in any document may have indistinct print. In all cases the best available copy has been filmed.
University MicnSilms
Internationa! 300 N. Zeeb Road Ann Arbor, Ml 48106


Order Number 1332409
Recovery of gold and silver from ammoniacal thiosulfate solutions containing copper by resin ion exchange method
Atluri, Vasudeva Prasad, M.S.
The University of Arizona, 1987
U M I 300 N. Zeeb Rd. Ann Arbor, MI 48106


PLEASE NOTE:
in all cases this material has been filmed in the best possible way from the available copy. Problems encountered with this document have been identified here with a check mark •/ .
1. Glossy photographs or pages
2. Colored illustrations, paper or print
3. Photographs with dark background
4. Illustrations are poor copy
5. Pages with black marks, not original copy \/
6. Print shows through as there is text on both sides of page
7. Indistinct, broken or small print on several pages
8. Print exceeds margin requirements
9. Tightly bound copy with print lost in spine
10. Computer printout pages with indistinct print
11. Page(s) lacking when material received, and not available from school or author.
12. Page(s) seem to be missing in numbering only as text follows.
13. Two pages numbered . Text follows.
14. Curling and wrinkled pages
15. Dissertation contains pages with print at a slant, filmed as received
16. Other ___
UMI

RECOVERY OF GOLD AND SILVER FROM AMMONIACAL
THIOSULFATE SOLUTIONS CONTAINING COPPER
BY RESIN ION EXCHANGE METHOD
by
Vasudeva Prasad Acluri
A Thesis Submitted to the Faculty of the
DEPARTMENT OF MATERIALS SCIENCE AND ENGINEERING
In Partial Fulfillment of the Requirements for the Degree of
MASTER OF SCIENCE
in the Graduate College
THE UNIVERSITY OF ARIZONA
19 8 7
2
STATEMENT BY AUTHOR
This thesis has been submitted in partial fulfillment of requirements for an advanced degree at The University of Arizona and is deposited in the University Library to be made available to borrowers under the rules of the Library.
Brief quotations from this thesis are allowable without special permission, provided that accurate acknowledgment of source is made. Requests for permission for extended quotation from or reproduction of this manuscript in whole or in part may be granted by the head of the major department or the Dean of the Graduate College when in his or her judgment the proposed use of the material is in the interests of scholarship. In all other instances, however, permission must be obtained from the author.
SIGNED:
APPROVAL BY THESIS DIRECTOR
This thesis has been approved on the date shown below:
Srini Raghavan Professor of Materials Science and Engineering
DEDICATED WITH DEEP RESPECT & GRATITUDE
TO
MY PARENTS
MR. SEETA RAMAIAH ATLURI
&
THE LATE MRS. KAMALA DEVI ATLURI
4
ACKNOWLEDGEMENTS
The author wishes to express his deep appreciation to Dr. Srini
Raghavan for his guidance and technical advice which were of very
valuable importance in the preparation of this thesis. I am especially
grateful to Dr. Mark Pritzker for his suggestions, comments and
teachings on the subject of ion exchange. I also want to extend my
gratitude to all the friends who helped in this venture, especially
Ramabrahmam Inturi, Prasad Rao Erabelli, Daraa Gopal, Mahender. Reddy
Alluri and Vibhakar Shah.
I would also like to thank the Materials Science and
Engineering Department for their support during my studies. The
financial aid from the Mining and Metals Resources Research Institute
fellowship was deeply appreciated. Finally, I would like to thank my
parents and family for spiritual and financial support throughout my
academic career and motivating me to achieve my goal.

5
TABLE OF CONTENTS
LIST OF ILLUSTRATIONS 7
LIST OF TABLES 11
ABSTRACT 13
1. INTRODUCTION 14
2. BACKGROUND AND LITERATURE REVIEW 18
2.1 Solution Chemistry of Copper, Silver and Gold 18
2.2 Chemistry of Thiosulfate Leaching 26
2.3 Ion Exchange 36 2.4 Selection of Resins for the
Research 46 2.5 Chemistry of Adsorption and
Elution of resins 58
3. EXPERIMENTAL MATERIALS AND METHODS 62
3.1 Materials 62 3.2 Methods 62
3.2.1 Adsorption Studies .......... — 66 3.2.2 Desorption Studies 69
3.3 Experiments Performed 70
4. RESULTS 80
4.1 Eh-pH Diagrams 80 4.2 Experimental Results 94
5. DISCUSSION 129
6. CONCLUSIONS 168
APPENDIX A: Maximum Theoretical Loading of Competing Anion Species in Solution . 172
APPENDIX B: Statistical Linear Regression Model to Fit Data 188
APPENDIX C: Application of Film Diffusion Model to Gold, Silver & Copner Loading onto the Amberlite IRA-400 Re^in 191
6
Table of Contents - Cont.
APPENDIX D: Bed Volumes of Resin Required for a Typical Column Test 206
LIST OF REFERENCES 212

7
LIST OF ILLUSTRATIONS
Figure
2.1 Eh;pH diagram for copper-water system (a) with Cu, Cu , CuO and C^O and (b) with Cu, Cu , CU2O and Cu(OH)2 19
2.2 Eh-pH diagram for (a) silver-water system and (b) gold-water system 22
2.3 Classification of the resins on the basis of the functional groups 39
2.4 Resin structures ..... 41
2.5 Structures of Type I and Type II resins 48
2.6 Illustration of the recovery of gold by the use of Amborane resins 50
2.7 Silver - adsorption capacity of various resins 52
2.8 Structures of the resins used in this research 53
2.9 A comparison of silyer - eluting rate between Amberlite IRA - 68 and Amberlite IRA - 400 resins by 30% regeneration sol'ution 57
3.1 Illustration of the (a) Experimental setup for batch tests and (b) Top view of the lid for the reactor 65
9 . 4.1 Eh-pH diagrams for the CU-S2O3 -H2O system at different S2O3 concentrations in the presence of (a) 0.0031 M Cu and (b) 0.0125 H Cu 86
4.2 Eh-pH diagrams for the Cu-S203^~-NH3-H2O system at different S^Oj concentrations in the presence of 0.324 M NH3 and (a) 0.0031 M Cu or (b) 0.0125 M Cu . . . 88
4.3 Eh-pH diagrams for the Cu-S203^~-NH3-H2O system at different S20q concentrations in the presence of 1.765 M NH3 and (a) 0.0031 M Cu or (b) 0.0125 M Cu . . . . 90
4.4 Eh-pH digram for the (a) Ag-^O-j^"-NH3-H2O and fb) AU-S2O3 -NH3-H2O system at different S203^" concentrations in the presence of 1.765 M NH3 and 20 ppm. Ag or Au . 92

8
List of Illustrations - Gont.
o _ 4,5 Eh-pH diagram for the AU-S2O3 system at
different IjH3 concentrations in the presence of 0.18 M S2O3 and 20 ppm. Au 93
9 _ 4.6 Eh-pH diagrams for Ag-Cu-S203 -NH3-&>0 system
with 20 ppm. Ag, 0,0031 M Cu, 0.18 M S2O3 and (a) 0.324 M NH3 or (b) 1.765 M NH3 95
4.7 Eh-pH diagrams for Au-Cu-SoO^"-NH-j-HnO system with 20 ppm. Au, 0.0031 M Cu, 0.18 M S2O3 " and (a) 0.324 M NH3 or (b) 1.765 M NH3 96
4.8 Effect of variation in thiosulfate concentration (a) and copper concentration (b) on the loading of silver onto Amberlite IRA-400 resin 98
4.9 Desorption of silver loaded onto IRA-400 by an ammoniacal thiosulfate solution containing copper 100
4.10 Effect of variation of the stirrer speed on the loading of silver (a) and copper (b) onto the Amberlite IRA-400 resin from thiosulfate solutions containing 20 ppm. Ag, 0.0031 M Cu, 0.18 M S203 and 0.324 M NH3 102
4.11 Effect of variation in NH3 concentration on the loading of Ag (a) and Cu (b) onto Amberlite IRA-400 resin from S203 solutions containing 20 ppm. Ag, 0.0031 M Cu and 0.18 M S2032" ; 103
4.12 Effect of variation in initial Ag concentration on the loading of Ag onto Amberlite IRA-400 resin 105
4.13 Effect of using different compounds of S2O3 on the loading of Ag (a) and Cu (b) onto Amberlite IRA-400 resin from solutions containing 20 ppm. Ag, 0.0031 H Cu and 0.324 NH3 106
4.14 Effect of using different concentrations of NaOH solution for maintaining the required alkalinity in the solution on the adsorption of Ag by Amberlite IRA-400 resin from S203 solutions containing 20 ppm. Ag, 0.0031 M Cu and 0.18 M S203 " 109
4.15 Loading of Ag and Cu onto IRA-400, IRA-68 and IRA-94 resins from S2<>3 solutions containing 20 ppm. Ag, 0.0031 M Cu, 0.18 M S2032" and 0.324 M NH3 ...... Ill
9
List of Illustrations - Cont.
4.16 Effect of NaOCl on the loading of Ag (a) and Cu (b) onto IRA 400 resin from S2O3 solutions containing 20 ppm. Ag, 0,0031 M Cu, 0,18 M S2O3 and 0.324 M NH3 114
4.17 Glution characteristics of Amberlite IRA-400 resin with respect to solution containing Ag and Cu . . . . 115
4.18 Elution characteristics of Amberlite IRA-68 resin with respect to solution containing Ag and Cu 117
4.19 Effect of variation in the degree of agitation on the loadimj of Au (a) and Cu (b) onto IRA-400 resin from S2O3 containing 20 ppm. Au, 0.0031 M Cu, 0.18 M S2032" and 0.324 M NH3 119
4.20 Loading of Au and Cu onto IRA-400, IRA-68 and IRA-94 resins from S2032" solutions containing 20 ppm. Au, 0.0031 M Cu, 0.18 M S2032" and 0.324 M NHj 121
2 -4.21 Effect of different compounds of S203 on the loading of Au (a) and Cu (b) onto IRA-400 resin from S203 solutions containing 20 ppm. Au, 0,0031 M Cu, 0.18 H S2032" and 0.324 M KH3 123
4.22 Effect of using different compounds to maintain the alkalinity in the solution on the loading of Au (a) and Cu (b) onto IRA-400 resin from S203 solutions containing 20 ppm. Au, 0.0031 M Cu and 0,81 M S2032" 125
4.23 Elution characteristics of IRA-400 resin with respect to solution containing Au and Cu 126
4.24 Elution characteristics of IRA-68 resin with respect to solution containing Au and Cu 128
5.1 Fit of experimental data obtained for Ag loading onto IRA-400 to Freundlich type adsorption isotherm 153
5.2 Fit of experimental data obtained for Ag (a) and Cu (b) loading onto IRA-400 to the film diffusion model 158
5.3 Fit of experimental data obtained for Au (a) and Cu (b) loading onto IRA-400 to the film diffusion model 159
10
List of Illustrations - Gont.
5.4 Trend observed in the Eh and pH values In an experimental run with sodium thiosulfate in a solution containing Ag and Cu . 162
5.5 Comparison of exhaustion characteristic curves between IRA-400 and IRA-68 resins using Process ECP-2 wash water 167

11
LIST OF TABLES
Table
2.1 Chemical reactions to be considered In the aqueous ammonlacal thiosulfate leach system . 35
2.2 Resins used for recovery of precious metals 47
2.3 Properties of Amberlite IRA-400, Amberlite IRA-68 and Amberlite IRA-94 54
3.1 Chemicals used in this research 63
3.2 Linear ranges of operation of the Perkin Elmer atomic absorption spectrophotometer (model 2380) for copper, gold and silver 68
3.3 Composition of the ammonlacal thiosulfate solution 71
3.4 Adsorption studies performed on silver - copper a m m o n l a c a l t h i o s u l f a t e s y s t e m . . . . . . . 7 2
3.5 Adsorption studies performed on gold - copper a m m o n l a c a l t h i o s u l f a t e s y s t e m . . . . 7 5
3.6 Desorption studies performed on Amberlite IRA-400 and Amberlite IRA-68 with respect to silver-copper ammonlacal thiosulfate system .... 77
3.7 Desorption studies performed on Amberlite IRA-400 and Amberlite IRA-68 with respect to gold-copper a m m o n l a c a l t h i o s u l f a t e s y s t e m . . . . 7 8
4.1 Free energy values for selected copper species 81
4.2 Free energy values for selected silver species 82
4.3 Free energy values for selected gold species 83
4.4 Summary of the range of concentrations used in the construction of Eh-pH diagrams 84
5.1 Composition of the leach solution mostly used in this research 134
5.2 Theoretical maximum number of moles of thiosulfate complexes of silver, copper and gold that can be formed in the leach system ....... 135

12
List of Tables - Cont.
5.3 Percent of active sites on Amberlite IRA-400 occupied by the thiosulfate complexes that are present in the silver-copper thiosulfate system 136
5.4 Percent of active sites on Amberlite IRA-68 occupied by the thiosulfate complexes that are present in the silver-copper thiosulfate system 137
5.5 Percent of active sites on Amberlite IRA-94 occupied by the thiosulfate complexes that are present in the silver-copper thiosulfate system 138
5.6 Percent of active sites on Amberlite IRA-400 occupied by the thiosulfate complexes that are present in the gold-copper thiosulfate system 139
5.7 Percent of active sites on Amberlite IRA-68 occupied by the thiosulfate complexes that are present in the gold-copper thiosulfate system 140
5.8 Percent of active sites on Amberlite IRA-94 occupied by the thiosulfate complexes that are present in the gold-copper thiosulfate system 141
5.9 Partition factors for silver, copper and gold on different resins . 143
5.10 Selectivity coefficients for the resins in the silver-copper and gold-copper thiosulfate systems during the loading phase 145
5.11 Selectivity coefficients for the resins in the silver-copper and gold-copper thiosulfate systems during the elution phase 148
5.12 Number of bed volumes required to attain breakthrough 165

13
ABSTRACT
The recovery of gold and silver from many ores has been found
feasible with an ammoniacal thiosulfate lixiviant in the presence of
small amounts of cupric ion for enhancing the kinetics of the leaching
process. This research was undertaken to study the suitable physico-
chemical conditions for the selective recovery of gold and silver from
simulated thiosulfate leach liquors containing copper, gold or silver,
ammonia and thiosulfate using three anion exchange resins (Amberlite
IRA-400, Amberlite IRA-68 and Amberlite IRA-94). In particular, the
effect of chemical variables such as thiosulfate, cupric ion and ammonia
concentrations and the solution potential of the system on the batch
loading of silver and gold onto the resins have been investigated in
detail. Pourbaix diagrams have been constructed to understand the
stability of this complex system under various Eh and pH conditions. The
experimental results indicate that IRA-400 resin has the highest
capacity for both silver and gold compared to IRA-68 and IRA-94. All the
'three resins investigated are not selective to silver and gold over
copper. The elution studies using ammonium thiosulfate solutions have
revealed that selective elution of silver from copper is not possible,
while some selectivity can be achieved between gold and copper. An
attempt has been made to explain the results using Pourbaix diagrams and
selectivity coefficient calculations.

14
CHAPTER 1
INTRODUCTION
In the recent years, there has been growing interest in precious
metals, especially gold and silver, because of their large role in the
world economy and increased usage in industrial applications. The
principal producers of gold are South Africa, Soviet Union, Canada and
USA, with South Africa alone accounting for nearly one - half of known
world resources [1,2]. About 1300-1500 metric tonnes (42.4-49.1 million
ounces) of gold is produced annually around the world [2]. Major silver
producing countries are Mexico, USA, Peru, Canada, Soviet Union and
Australia [1,2]. The total world production of silver is about 12,200
metric tonnes (400 million ounces) annually [2]. The U.S.A remains an
important producer of gold (about 5% of total world production) and
silver (about 16% of total world production) [2]. Due to an
unprecedented rise in the price of gold and silver on the international
market during the past few years, a number of marginal producers have
dramatically increased their production, including some in U.S.A [1].
Gold is found mainly in the native state disseminated in quartz
rocks and gold-bearing films, and in alluvial deposits, or diggings,
arising from the disintegration of these rocks [3]. These deposits tend
to occur in folded sedimentary rocks such as those that are found in the
Americas, Australia and South Africa [2]. In the native form, gold is
usually combined with silver and a small amount of copper [2].
15
Silver is found in the native state in nature, often mixed with
other metals (Au, Hg, Sb, Cu, Pt in particular) [3]. Native silver is
now much rarer than native gold as most of. the silver mines as Asia
Minor, Greece, Spain and the Americas have been exhausted. Only a small
fraction of the world's production comes from the amalgamation and
cyanidation processes and that largely as a byproduct of gold extraction
[2]. Silver is mainly extracted from sulphide minerals such as
argentite, tetrahedrite, polybasite, pyroargyrite and stephanite. Of
these, only argentite (Ag2S) is the simple sulphide, the others being
complexes with antimony and copper. In addition, the silver sulphides
are usually found associated with other minerals such as lead, zinc and
copper sulphides so that extraction is a complicated business and silver
is a co- or byproduct in the production of these other metals [2].
World wide practice for extracting precious metals from ores by
leaching or lixiviation is carried out using cyanide solutions, mainly
sodium cyanide [4]. There has been a growing interest in the development
of viable alternatives to the cyanide leaching of precious metal ores
containing gold and silver. The primary factors reponsible for this
interest are the concerns regarding the toxicity of cyanide and the
inability of cyanide solutions to effectively leach difficult-to-treat
silver and gold ores containing copper, arsenic, antimony, selenium,
tellurium and manganese. Copper and manganese, particularly manganese,
are especially poisonous to cyanide solutions. Large quantities of
cyanide solutions are required to treat these ores. This in turn implies
increased operational costs [4].
16
The ability of gold and silver to form stable anionic complexes
with thiosulfate has been exploited in the development of alkaline
thiosulfate leaching methods for ores and leaching tailings containing
gold and silver values. Ammonium thiosulfate has been used for many
decades as a fertilizer and consequently, from an environmental
standpoint, it has a definite advantage over cyanide. Besides,
thiosulfate has the capacity to reduce manganese dioxide thereby
facilitating the treatment of manganiferous ores. As such, a leaching
method involving the usage of thiosulphate solutions may be more
suitable technically, economically and health-wise.
The techniques most commonly used in industry for the recovery of
precious metals from leach solutions are cementation, chemical
precipitation, solvent extraction, and resin ion exchange [5-7]. The
advantages of ion exchange when compared with other methods are low
operating pressure, automated column operation and use of electrolysis
to recover gold and silver from the regenerant [7], No pH adjustment is
required before recovery of precious metals with the use of proper type
of resins. Also, other methods remove gold and silver, but leave zinc,
iron, nickel and copper species in solution [5] . The presence of these
elements, especially copper, was shown by previous workers [4,8-11] to
decrease the dissolution of gold and silver. Ion exchange becomes more
beneficial than other processes for recovering very low concentrations
(around 20 ppm.) of gold and silver that are present in leach liquors of
many ore bodies, particularly difficult-to-treat ores, and chemical
wastes [12]. As such, development of resin ion exchange methods is vital

17
for the processing of ammoniacal thiosulfate leach solutions containing
trace quantities of gold and silver.
This research was undertaken to study the effects that solution
conditions have on the selective resin ion exchange of gold and silver,
with the view to recovering these from anraionlacal thiosulfate leach
liquors containing copper. In particular, the effect of solution
conditions such as pH, solution redox potential and concentration of the
competing ions have been studied in' detail. The results have been
explained on the basis of the Eh-pH diagrams constructed for the
o _ o . systems AU-CU-S2O3 -NH3-H2O and Ag-Cu-S203 -NH3-H2O systems.
Particular attention has been paid to the solution chemistry_of this
complex system. Three different resins of anionic nature of both gel
(with weak and strong basisity) and macrorecticular type (weak base
only) have been studied for .their loading and eluting characteristics
for the selective recovery of gold and silver.
18
CHAPTER 2
BACKGROUND AND LITERATURE REVIEW
This chapter gives a brief review of the solution chemistry of
copper, silver and gold and the chemistry involved in thiosulfate
leaching and ion exchange. On the basis of these, reasons for selecting
particular resins in this study along with the chemistry of adsorption
and elution of the strong and weak base resins are given.
2.1. Solution chemistry of copper, gold and silver:
The elements of group I-B have one s electron in the outermost
(n) shell (valence level) and a completely filled (n-1) d shell [13],
The d shell is fairly unstable. For this reason, it is possible to
remove one or two electrons from this group in addition to the s
electron. Hence these elements can form compounds in which the +1, +2
and +3 oxidation states exist with varying stabilities from case to case
[14]. The most stable oxidation state of copper is +2, of silver is +1
and of gold is +3. For the +2 and +3 oxidation states, ligand field
effects lead to peculiar stabilities for certain complexes [13].
2.1.1. Copper:
Figures 2.1 (a) and 2.1 (b) give the Pourbaix (Eh-pH) diagrams
for the system Cu - H2O, at 25°C. The solid substances considered in
figure 2.1 (a) are Cu, C^O and CuO and in figure 2.1 (b) are Cu, C^O

19
1.4
1.2
1 . 0 —
0 . 8 —
S as a
0 .6
0 . 4
0 . 2 —
0 .0
-0 .2
(a)
CuO (s)
pH
Cu(OH)a (s)
Cu20 (s)
Figure 2.1 Eh-pH diagram for copper-water system (a) with Cu1"1", Cu, CuO and C^O. (b) with Cu"1"4*, Cu, CU2O and CuCOH^.
20
and Cu(OH)2- The hydroxide, Cu(0H>2i is less stable than the oxide CuO
and tends to be converted into the oxide with an affinity of 1790
calories. Therefore, figure 2.1 (a) represents the stable equilibria and
figure 2.1 (b) represents the metastable equilibria [3],
Copper is a relatively noble metal, at least in the absence of
complexing substances and is found in nature in the Creat Lakes
region of North America [3]. Copper can exist in oxidation states of +1
and +2 in aqueous solutions. The equilibrium constant for the
disproportionation reaction in water
2Cu+ <-> Cu2+ + Cu° (2.1)
is 10^ and therefore only small amounts of Cu+ can exist unless it is
stabilized by complexing agents [13], Thus, the reduction of Cu in
J. nitric or sulphuric acid goes to the metal, although the unstable Cu
may be formed as an intermediate. However, in the presence of various
ions or molecules, the +1 state is stabilized and the equilibrium
shifted far to the right [14]. The only important hydrolysis product of
Cu+ is CU2O, which is insoluble enough to limit the concentration of
Cu which can coexist with copper as the pH is increased. This,
rt 1 » unfortunately, limits the usefulness of the Cu^ /Cu electrode. C^S
is very insoluble {[Cu+]2 [S2"] - 10"^®} and will likely form in a
2-i-reducing environment with sulphide present [13]. The Cu ion at
ordinary concentrations begins to hydrolyze above pH 4 and precipitates
the oxide or hydroxide soon thereafter i.e. it hydrolyzes only to a
slight extent at moderate concentrations before precipitation occurs.
21
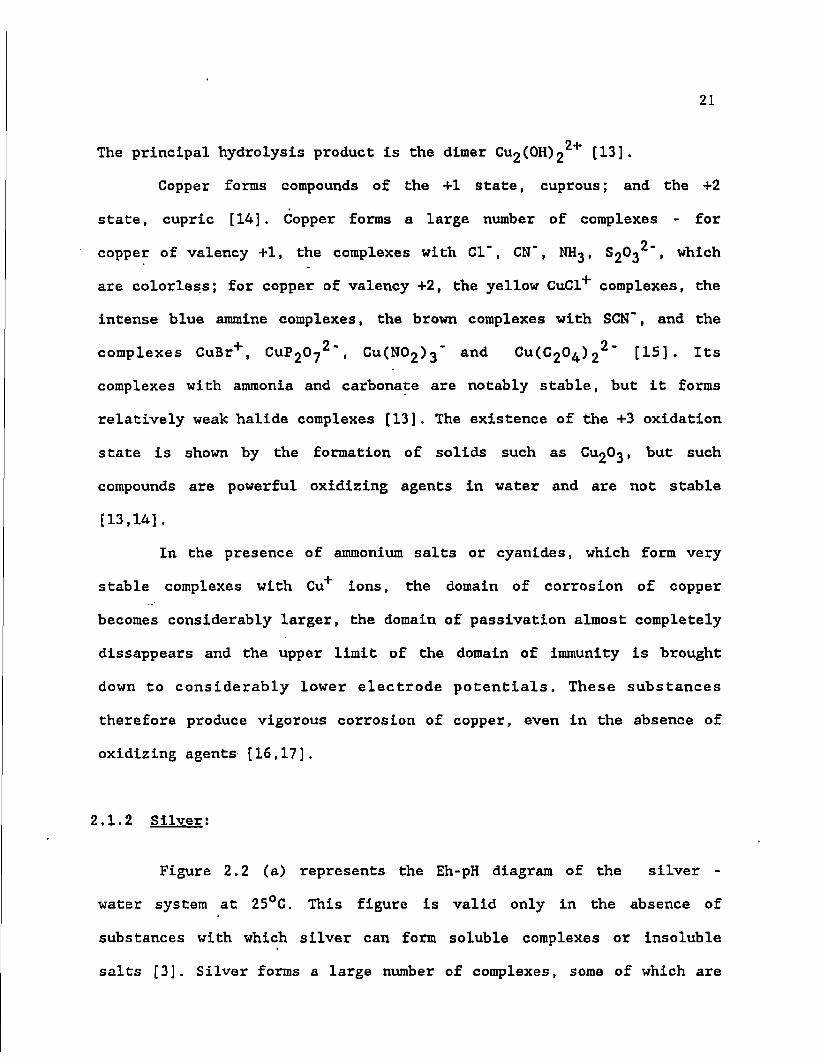
2+ The principal hydrolysis product is the dimer Cu2(0H)2 [13].
Copper forms compounds of the +1 state, cuprous; and the +2
state, cupric [14]. Copper forms a large number of complexes - for
_ o _ copper of valency +1, the complexes with Cl , CN , NHj, S2O3 , which
are colorless; for copper of valency +2, the yellow CuCl+ complexes, the
intense blue ammine complexes, the brown complexes with SCN~, and the
1 n m 9 complexes CuBr , CUP2O7 , Cu(N02)3 and Cu(C20^)2 [15]. Its
complexes with ammonia and carbonate are notably stable, but it forms
relatively weak halide complexes [13], The existence of the +3 oxidation
state is shown by the formation of solids such as CU2O3, but such
compounds are powerful oxidizing agents in water and are not stable
[13,14].
In the presence of ammonium salts or cyanides, which form very
stable complexes with Cu+ ions, the domain of corrosion of copper
becomes considerably larger, the domain of passivation almost completely
dissappears and the upper limit of the domain of immunity is brought
down to considerably lower electrode potentials. These substances
therefore produce vigorous corrosion of copper, even in the absence of
oxidizing agents [16,17].
2,1.2 Silver:
Figure 2.2 (a) represents the Eh-pH diagram of the silver -
water system at 25°C. This figure is valid only in the absence of
substances with which silver can form soluble complexes or insoluble
salts [3]. Silver forms a large number of complexes, some of which are

22
o > JS «
1 . 4
1 . 2
1.0 —
0 . 8
0 .6
0 . 4
0 . 2 —
0 .0
- 0 . 2
(a) 6 8
PH
Ag+
• AgaO (s)
*
* * Ok w
Ag (s) Ag(OH)J
* • — .
1 1 1 1 1 1 10 12 14
o >
J£ a
1 . 4 -
1 . 2 —
1 . 0 —
0 . 8 —
0.6 —
0 . 4 —
0 . 2 —
0.0 "
-0.2
(b)
Au(OH)j
HaAuOJ
HAUO®-
Au (s)
6 8
PH
10 12 14
Figure 2.2 Eh-pH diagram for (a) silver-water system and (b)"gold-water system.

23
very stable eg. the thiosulfuric and cyanide complexes of monovalent
silver. Almost all silver salts are sparingly soluble; the nitrate,
perchlorate, fluoride, acetate and chlorate are soluble [15].
Silver is a very noble metal as its domain of stability covers a
very large portion of the domain of stability of water (figure 2.2 a).
Silver is perfectly stable in the presence of water and aqueous
solutions of all pH's free from oxidizing agents and complexing
substances; it is not attacked appreciably by dry or moist air (provided
that the air is free from ozone, sulphuric acid, halogens and ammonia)
[18]. Silver can be dissolved by acid oxidizing solutions to give
colorless Ag+ ions (HNOj, concentrated HjSO^, HC1 in the presence of
oxidizing agents). In alkaline solutions, silver is generally stable
[ 3 1 .
Silver can exist in +1, +2 and +3 oxidation states. The +1 silver
ion forms many slightly soluble compounds and slightly ionized complex
ions [14], The +2 and +3 oxidation states of silver are powerful
oxidizing agents which react with water itself. There is not much
2+ 3+ * information on the species of Ag , but Ag occurs in base as Ag(OH)^
[13] . The +1 oxidation state is stable and its equilibria have been
widely studied, particularly by potentiometric techniques because of
the excellent reversibility of the Ag+/Ag, AgCl/Ag and Ag20/Ag
i-electrodes. Like other monovalent ions, Ag exhibits only slight
tendency to hydrolyze [13], The hydrolysis of Ag+ is simple, leading to
only two species, AgOH and Ag(0H)2~ [13]. The addition of alkali to Ag+
solutions produces a dark brown precipitate, which is difficult to
24
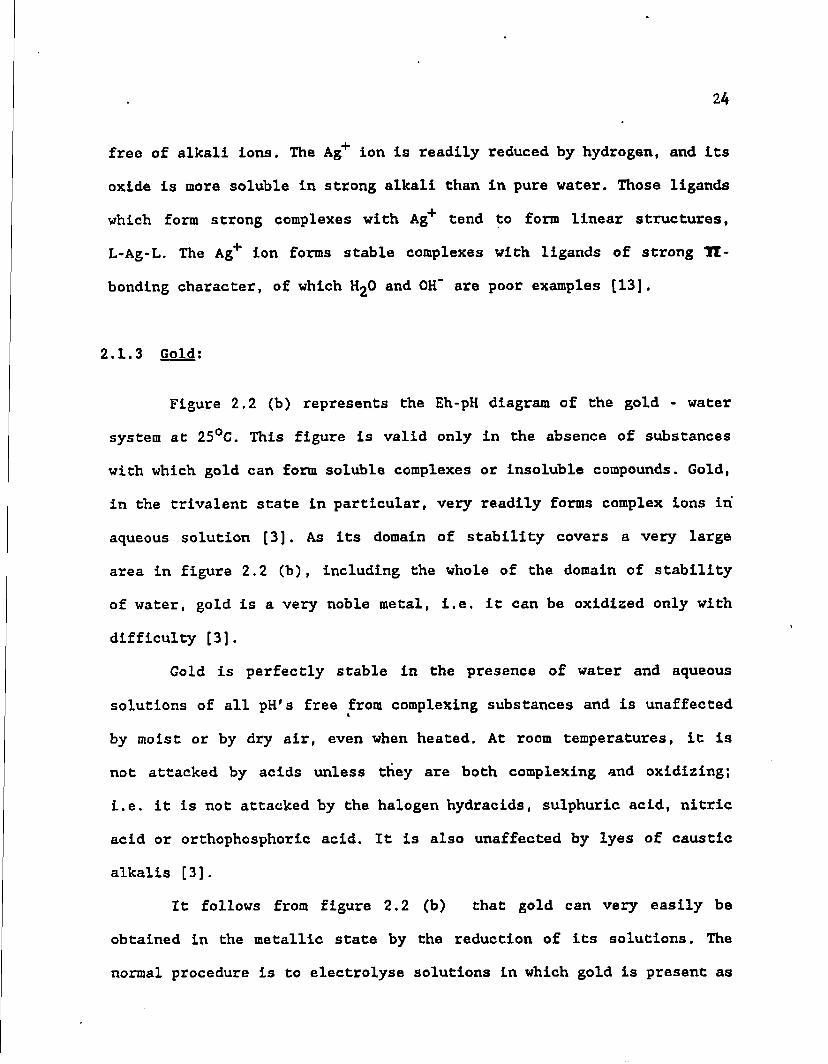
free of alkali ions. The Ag+ ion is readily reduced by hydrogen, and its
oxide is more soluble in strong alkali than in pure water. Those ligands
which form strong complexes with Ag+ tend to form linear structures,
L-Ag-L. The Ag+ ion forms stable complexes with ligands of strong 71-
bonding character, of which H2O and OH" are poor examples [13].
2.1.3 Gold:
Figure 2.2 (b) represents the Eh-pH diagram of the gold - water
system at 25°C. This figure is valid only in the absence of substances
with which gold can form soluble complexes or insoluble compounds. Gold,
in the trivalent state in particular, very readily forms complex ions in
aqueous solution [3]. As its domain of stability covers a very large
area in figure 2.2 (b) , including the whole of the domain of stability
of water, gold is a very noble metal, i.e. it can be oxidized only with
difficulty [3].
Gold is perfectly stable in the presence of water and aqueous
solutions of all pH's free from complexing substances and is unaffected
by moist or by dry air, even when heated. At room temperatures, it is
not attacked by acids unless they are both complexing and oxidizing;
i.e. it is not attacked by the halogen hydracids, sulphuric acid, nitric
acid or orthophosphoric acid. It is also unaffected by lyes of caustic
alkalis [3].
It follows from figure 2.2 (b) that gold can very easily be
obtained in the metallic state by the reduction of its solutions. The
normal procedure is to electrolyse solutions in which gold is present as
complexes (chlorides, bromides, cyanides and ferrocyanides) using
cathodes of silver, copper and their alloys. Other metals such as Zn,
Cd, Pb, Ni, Fe have to be copper- or brass-plated before being electro-
gilded [3].
Gold (I) and gold (III) form complex species in aqueous solution
and they are generally strong oxidizing agents. For example,
AUC14" + 3e~ <-> Au° + 4C1" (E° - 1.00 V) (2.2)
The +3 valence state produces species which are generally more
stable than those of the +1 state. An exception is the remarkably stable
cyanide complex of gold (I), which permits the ready oxidation of the
metal
Au° + 2CN" <-> Au(CN)2" + e" (E° - 0.611 V) (2.3)
in the cyanide process for the extraction of gold [13]. Thiosulfate
complexes of gold (I) have also been reported to be very stable [19]. A
number of compounds of gold (II) have been prepared, as for example
AUCI2, at high temperatures but the only one which is stable in contact
with water appears to be sulphide. This sulphide is formed by the action
of hydrogen sulphide upon auric chloride and is soluble in polysulphide
to form thioaurates [14], The following complexes can be considered as
the more important gold complexes : yellow-red hydrochloric complexes
(AuCl^", AuCl^OH", etc.)> red-brown hydrobromic complexes (AuBr^") and
red-brown thiocyanide complexes [Au(SCN)^" ].; monovalent gold forms
stable colorless thiosulfuric complexes and extremely stable cyanide
complexes. Gold sulphide AU2S3 (black) is sparingly soluble [15].

26
2•2 Chemistry of thiosulfate leaching of precious metals
o _ Thiosulfates are compounds containing the group S2O3 which is a
structural analog of sulphate with one oxygen atom replaced by a sulphur
atom. The two sulphur atoms are not equivalent and the salts and ester
salts can be considered to be derived from S02~(0H) (SH). The unique
2 - 2 -chemistry of the thiosulfate ion, S2O3 or SSO3 , is dominated by the
sulphide-like sulphur atom which imparts reducing properties, strong
complexing tendencies, and sulphide-forming capabilities [19], Oxygen
2 _ slowly oxidizes thiosulfate to sulphur and SO3 . Thiosulfates can also
be readily reduced to sulphides. The best known reactions of thiosulfate
are its oxidation to tetrathionate by iodine, widely used in analytical
chemistry, and its ability to dissolve silver halides through complex
formation, which is the basis of the most important commercial
application in photography [19],
The two most important salts of thiosulfate are sodium
thiosulfate (known also as "hypo"), ^28203 or ^28203 • , and
ammonium thiosulfate, (^4)28203. Sodium thiosulfate is available as
colorless, long ("rice form") crystals or white granules. They are
fairly stable under ordinary conditions in air, efflorescing in warm dry
air, and deliquescing slightly in moist air [19]. Ammonium thiosulfate
occurs as anhydrous, colorless or white tabular crystals belonging to
the monoclinic system and is very soluble in water. It is marketed both
as a 60% aqueous solution and in the form of the anhydrous crystals
[19] .
Thiosulfate forms complex ions with a variety of metals, eg.

27
gold, silver, copper, iron, platinum, nickel, cobalt etc. [19]. The
first reported use of thiosulfate for precious metal recovery dates back
to the early 1900's. In a method known as the Patera's process [20]
which has been used in South America for many years, gold and silver
ores were first given a chloridizing roast and then leached with sodium
thiosulfate. The chemistry of the thiosulfate leaching of gold and
silver has been found to be very complex by the previous workers [4,8-
10,20-22]. Gold and silver disolve in thiosulfate solutions in the
presence of oxygen forming stable complexes [23-26]. The works of
Kakovskii [25] and Tyurin & Kakovskii [26] supported the mechanism
whereby gold is solubilized solely as a thiosulfate complex
4Au° + 8S2032" + 2H20 + 02 <-> 4AU(S203)23" + 40H" (2.4)
while silver is solubilized predominantly as the thiosulfate complex
4Ag° + 8S2032" + 2H20 + 02 <-> 4Ag(S203)23" + 40H" (2.5)
with a relatively small portion forming the amine complex
4Ag° + 8NH3 + 2H20 + 02 <-> 4Ag(NH3)2+ + 40H" (2.6)
Copper ions were reported to exhibit a strong catalytic effect on the
rates of dissolution of the noble metals.
In a more recent study of the dissolution of elemental gold in
ammoniacal sodium thiosulfate solutions, Umetsu & Tozawa [27] confirmed
and extended the previous investigations, covering a temperature range
of 18 to 180°C. According to them, gold dissolves in thiosulfate
solutions in the presence of oxygen as
2Au° + 4S2032" + H20 + 1/2 02 <-> 2Au(S203)23* + 20H" . . . (2.7)
Their studies suggest that the dissolution of gold is accelerated

28
by the presence of cupric amine complex ions and proceeds in the
following four stages with the rise of temperature:
1. dissolution rate increases up to 65°C.
2.dissolution rate decreases between 65°C and 100°C
because the gold surface.receives a copper sulphide coating by the
reactions
Cu2+ + S2032" + H20 <-> CuS + S042" + 2H+ <2.8)
2Cu(S203)2^" + 1/2 02 + H20 <-> 2CuS + 2S2032* + 20H' . . . . ( 2 . 9 )
It has been reported by Okabe [28] that the oxidation of ammonium
thiosulfate is accelerated by increasing temperature, partial pressure
of oxygen and the amount of copper sulphate added. The decrease in
solubilization of gold at temperatures over 65°C can therefore be
considered at least in part, due to the increase in the oxidation of
thiosulfate,
3. gold redissolves above 100°C because gold reacts immediately
with S203 ion formed on the gold surface by the reaction
2CuS + 8NH3 + 202 + H20 <-> 2Cu(NH3)42+ + S2032" + 20H" . . (2.10)
4. dissolution rate decreases again above 140°C because of the
O. decrease of S203 concentration by oxidation. Excessive oxygen partial
pressure and stirring velocity were found to have limits to avoid the
oxidation of thiosulfate.
Tozawa and co - workers [9] investigated the dissolution of pure
(metallic) gold in ammoniacal thiosulfate solutions with regard to the
extraction of native gold from complex sulphide ores containing copper
ions. A complex behaviour with respect to temperature was reported as
29
noted in the previous work [27].
In 1983, Flett, Derry and Wilson [10] published a paper which
discussed the chemistry of the leaching of silver sulphide by
thiosulfate solutions that contained added copper sulphate. They believe
that copper sulphide (Cu2S in the absence of air and CuS in the presence
of air) is a reaction product during the leaching of Ag2S. According to
them, leaching of silver sulphide with ammonium thiosulfate - cuprous
thiosulfate solutions showed better results than just with ammonium
thiosulfate. In the absence of air, the leaching reaction conforms to
the stoichiometry
CU2S2O2.2(NH^)2®2®3 Cu2S + Ag2^202.2(NH4)2^263 • C2.ll)
whereas in the presence of air, this reaction is eventually superseded
by an overall reaction stoichiometry that involves the cupric rather
than the cuprous state:
5(NH4)2S203 + CuS04 + Ag2S + 1/2 Oj + HgO <-> CuS +
' Ag2S203.2(NH4)2S203 + (NH4)2S40g + (NH4)2S04 + 2NH40H . . .(2.12)
Flett et al.[10] reported that the presence of the ammonium ion
helps to stabilize the cupric state. They also reported that leaching
with sodium thiosulfate - cuprous thiosulfate in place of ammonium
thiosulfate - cuprous thiosulfate provided the same stoichiometry as for
the ammonium system in the absence of air.
The interest in the thiosulfate use was revived by Berezowsky and
Sefton [8] after many decades of its known use In Patera's process [20].
They developed an atmospheric ammoniacal thiosulfate leach process to
recover gold and silver from residues of the ammoniacal oxidation of

30
sulphide copper concentrates and various pressure-oxidation leach
residues. They reported a quite complex chemical behaviour in the
system. In spite of this, they not only attained higher extractions than
conventional methods such as cyanidation or brine leaching, but were
also able to readily accommodate the bleed streams in the primary
oxidation leach system. This is very much preferred from an
environmental standpoint.
Berezovsky and Sefton [8] reported that oxidative degradation of
thiosulfate to tetrathionate occurred in the presence of air,
particularly when both soluble copper and sulphides were present and
this reduced the efficiency of the lixiviant. The degradation was less
when nitrogen purge was used. In some cases, however, in nitrogen at
elevated temperatures, copper sulphide precipitated after the initial
rapid extraction of gold and silver. They concluded this as the result
of a reaction between cupric and thiosulfate ions in solution.
Precipitation of appreciable quantities of precious - metal values with
the copper were reported. In these cases, mild oxidizing conditions were
recommended by them to achieve high extraction of the precious metals.
Tozawa and co-workers [9] reported oxidative degradation of the
thiosulfate when rapid stirring enhanced oxygen transfer to the leach
solution and when the oxygen partial pressure was high. This led to the
reduced extraction as noted in previous Canadian work [8].
Forward and Mackiv [29] have reported significant thiosulfate ion
formation during the ammoniacal oxidation pressure leaching of copper-
nickel-cobalt sulphide concentrates. The oxidation of sulphide sulphur
31
was shown to proceed through a series of reactions involving the
formation of thiosulfate, with subsequent oxidation to thionates which
in turn were oxidized to sulphate and sulphamate. They had also found
soluble copper to be an effective catalyst for the sulphur oxidation
reactions.
The use of ammoniacal thiosulfate leaching for the recovery of
gold and silver from difficult-to-treat ores such as those containing
copper and manganese was first reported by Genik-Sas-Berezowsky et al
[21] in the form of a patent. This patent proposes the use of ammonium
thiosulfate as a secondary leach for the recovery of silver and gold, in
conjuction with a hydrometallurgical process for the recovery of copper
from the copper-bearing sulphidic ore. An improvement over previous
processes was reported by B. Kerley [4,22] in the form of two patents.
He mentioned the use of sulphite ions to control the stability of
solutions during leaching. Kerley claimed that sulphite ions complexed
sulphide ions in solution thereby preventing precipitation of metal
sulphides. The improvements are said to be achieved by maintaining a pH
value greater than 7 and sulphite ion concentration of atleast 0.05%
which was said to be stabilising the thiosulfate ion in the system.
Flett et al '[10] suggested the use of sulphite ions to prevent
the formation of the tetrathionate ions, but this was found to reduce
silver extraction. It was also suggested that the use of excess of
thiosulfate or the addition of sulphite being required to stabilize the
system. Addition of ammonium sulphite to the solution, as proposed by
Kerley [22], on the other hand, could produce thiosulfate from

32
tetrathionate by the reaction
<NH4)2S03 + 2NH4OH + (NH4)2S406 <-> 2(NH4)2S203 + (NH4)2S04 + H20
(2.13)
It is generally believed that the addition of copper sulphate to
a thiosulfate solution results in the formation of cuprous thiosulfate
together with tetrathionate ions [10]. The relevant reaction for
ammonium thiosulfate is
3(NH4)2S203 + 2CUS04 <-> Cu2S203 + 2(NH4)2S04 + (NH4)2S406
(2.14)
in which the tetrathionate is formed by the oxidation of the thiosulfate
as the cupric ions are reduced to the cuprous state. The cuprous
thiosulfate itself is insoluble in water, but is soluble in excess
thiosulfate through the formation of complex cuprous thiosulfate -
ammonium thiosulfate salts. These complexes have been isolated and
identified [30,31]. When the molar ratio of thiosulfate to added copper
was more than 2.5:1 a preferable representation of the above reaction is
[10]
5(NH4)2S203 + 2CUS04 <-> Cu2S203.2(NH4)2S203 + 2(NH4)2S04 +
(NH4)2S406 . . . . (2.15)
When such a solution is used to leach silver sulphide the
reaction that is expected is [32]
Cu2S203.2(NH4)2S203 + Ag2S Cu2S + Ag2S203,2(NH4)2S203
(2.16)
the complex Ag2S203.2(NH4)2S20'3 being soluble in water [31], whereas
silver thiosulfate and the complex Ag2S203.(NH4)2S203 are both
33
insoluble.
It is very necessary to compare the stability of Cu(NH3)4 and
Cu(S203)23~ ions since the ammoniacal thiosulfate solution contains both
O NH3 and S2O3 ions. The equilibrium reaction between these species can
be represented by the chemical equation [27]
2CU(NH3)42+ + 20H" + 4S2032" <-> 2Cu(S203)23" + 8NH3 + HjO
+ 1/2 02 (2.17)
1 1 The equilibrium constant for this reaction at 25°C is 1.5 x 10 , after
9 « o substitution of the dissociation constant of Cu(NH3)4 and Cu(S203)2
along with the chemical potential of each substance into the expression.
Hence, it can be concluded that, at higher concentration of ammonia and
2+ oxygen pressure, Cu ion can be considered to be in Cu(NH3)4 form only.
C Whereas, copper can be considered as present as Cu(S203)3 at higher
concentrations of thiosulfate and higher pH values present in the leach
system.
The chemistry involved in the oxidation of thiosulfate by the
tetrammine gold (III) ion in aqueous solution was studied in detail by
Gwyneth Nord, Skibsted, L.H. and Halonin, A.S. [33], According to them,
2 - 3+ the stoichiometry of the oxidation of S2O3 by Au(NH3)4 in acid
solution is
Au(NH3)43+ + 4S2032" + 4H+ <-> Au(S203)23' + S40g2" + 4NH4+
(2.18)
2+ Also, the main role of Cu(NH3)4 in the course of dissolution of
gold and silver is that of an oxidising agent described by the following
reaction

34
CU(NH3)42+ + e" <-> CU(NH3)2+ + 2NH3 (2.19)
At this point, It is worthwhile comparing the stability of
CU(NH3)^ +̂ and Cu(NH3)2+ ions by considering the following reaction
2Cu(NH3)42+ + 20H" <-> 2CU(NH3)2+ + 4NH3 + H20 + 1/2 02 . . (2.20)
According to Umetsu and Tozawa [27], from the above reaction, the
2+ stability and oxidizing power of Cu(NH3)^ decreases with an Increase
in the temperature. In this study, the presence of cupric amine,
Cu(NH3) 2̂+, is very much preferred as it promotes the selective recovery
of anionic complexes of gold and silver from ammoniacal thiosulfate
solutions containing copper. Consequently, It is advisable to run the
experiments at lower temperatures.
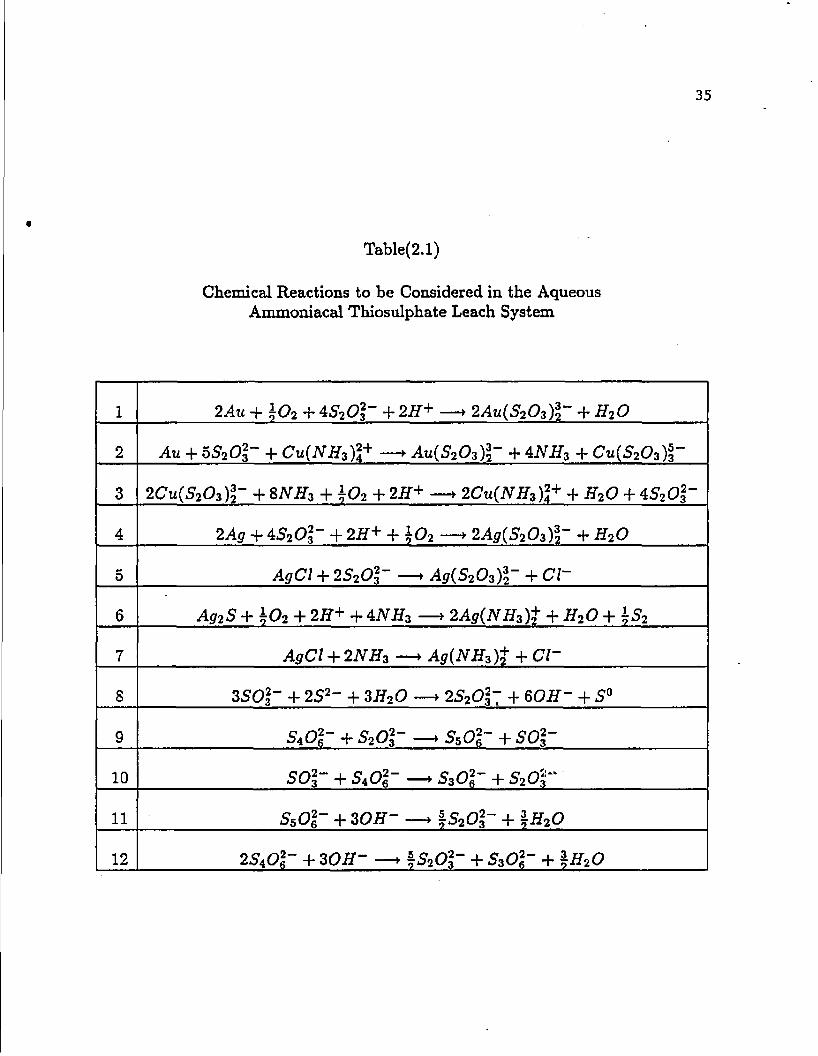
Table 2.1 summarizes some of the important chemical reactions
that may take place during the ammoniacal thiosulfate dissolution of
gold and silver ores in the presence of cupric ions. Equation (1) shows
the overall stoichiometry for the dissolution of gold in aqueous
thiosulfate solutions in the presence of oxygen. The role of cupric
tetrammine as an oxidant during the solubilization of gold is shown in
equation (2). Equation (3) depicts the cupric/cuprous equilibrium that
exists in ammoniacal thiosulfate solutions. The solubilization of
different forms of silver (native, silver chloride and silver sulphide)
are presented in equations (4) through (7).
The beneficial effect of the addition of sulfite Ions in
increasing the stability of the system (which incidentally is the basis
of a patent assigned to B. Kerley) is shown in equation (8). Sulphite
ions react with any sulphide ions in solution thereby preventing the
35
Table(2.1)
Chemical Reactions to be Considered in the Aqueous Ammoniacal Thiosulphate Leach System
1 2 Au + \02 + 4 S2Ol~ + 2H+ —• 2 Au(S203)l~ + H20
2 Au + 55202~ + Cu(i\TJf3)2+ Au(52o3)3- + 4JVff3 + Cu{S2Ost~
3 2Cu{S2O z)1~ + 8iVif3 + ̂02 + 2tf+ —> 2CU(NHZ)L+ + H20 + 4520f-
4 2Ag + 4S20l- + 2if+ + \02 —> 2Asr(5203)2~ + #20
5 + 2520r —• Ag{S20 z)%- + C/~
6 Ag2S + h02 + 2H+ + 4NH3 —> 2Ag(NH3)f + H20 + hS2
7 AgCl + 2NH$ —* Ag(NH z)t + Cl~
8 3SOl' + 252~ + 3H20 —• 252O37 + *OH~ + 5°
9 54Ofi2~ + S2Ol~ —• 5sO^ + 502"
10 502" + 54062" —- 5302' + 520|-
11 5sor + 3 OH- — f s2ol~ + \H2O
12 2SAOl~ + 3OH- —> $S2Ol- + SZ02r~ + %H*0
36
precipitation of any metal sulphides, especially Ag2S. It is worth
mentioning that Ag2S precipitation can also be caused by the presence of
CU2S according to the following metathetic reaction :
Cu2S + 2Ag(S203)23" <-> Ag2S + 2CU(S203)2
3" (2.21)
Equations (9) through (11) have been considered by Byerly et al
[34] as the pathways for thiosulfate decomposition. The overall
stoichiometry is represented by equation (12) and shows that the main
oxidation product of thiosulfate, tetrathionate, can be partially
converted to thiosulfate in alkaline solutions. It can be easily shown
from this equation that the theoretical regeneration efficiency of
thiosulfate is approximately 60%.
2.3 Ion Exchange
It was mentioned earlier that gold and silver form stable
thiosulfate complexes and It is worthwhile using ion exchange technology
to recover these complexes from the ammoniacal thiosulfate leach liquors
as these minerals are present usually in very small concentrations In
difficult-to-treat ores and chemical wastes. As such, it is very
important to review some critical aspects of ion exchange technology at
this point.
Ion-exchange may be defined as the reversible interchange of ions
between a solid and a liquid phase in which there is no permanent change
in the structure of the solid. The solid is the ion-exchange resin which
is porous and insoluble [35]. Although similarities exist in the nature

37
of exchange of ions in all the ion exchange systems, the various
explanations that have been presented have been widely divergent. The
explanations that have been proposed may be grouped conveniently into
three categories [36] - 1. the crystal lattice exchange theory; 2. the
double-layer theory and 3. the donnan membrane theory.
Ion exchange is one of the unit operations used in
hydrometallurgy to purify and concentrate the metal values from leach
liquors. Ion exchange technology adapted to hydrometallurgical processes
can be described by a two stage sequence [37].
1. Adsorption - utilization of an anionic or cationic organic
resin to remove metal ions from an aqueous solution when that solution
is passed through a bed of resin.
2. Elution - the recovery of metal ions in a concentrated and
purified form (aqueous solution) by passing a small volume of suitable
solution (eluent or regenerant) through the loaded resin bed.
An ion exchange reaction can be represented by the reversible
reaction (written for an anionic ion exchanger) as
RV(r) + B-(aq) <-> R+B" (R) + A" (aq) (2.22)
where-: R+A~ - functional group in an anionic ion exchange resin.
R+ - fixed ion in the functional group.
A" - exchangeable anion in the resin.
B" - exchangeable anion (counter ion) in the solution.
B" - B" ion loaded onto the resin.
A" - counter ion released from the resin into the solution.
At equilibrium, both the resin and the solution compete for the

38
counter ion species, A" and B". But under proper conditions, the resin
generally has a greater selectivity for one species over another. Ion
exchange reactions are heterogeneous and can be controlled by one or
more of the following three mechanisms - 1. film diffusion, 2. particle
diffusion and 3. exchange reaction [37-42]. The slowest of these
mechanisms, usually, determines the overall rate of the reaction. The
exchange reaction seldom controls the rate of the reaction, unless a
chelating type of resin is used [43]. Thus, the rates are normally
dependent on diffusion phenomena. Film diffusion is the diffusion of
ions through a Nernst film layer around the resin beads [44]. The Nernst
layer is more prominent when exchange rates at the active (exchange)
sites are fast and solution mixing is low. A good mathematical treatment
of these mechanisms involved in the ion exchange terminology are given
in references [39-41,45].
Modern ion exchange resins are synthetic polymers in which
hydrocarbon groups make up a three dimensional network and hold stable,
reactive ionic groups [37]. Thus, ion exchange resins consist of two
principal parts, a structural portion (polymer matrix) and a functional
portion (ion-active group) [35]. These resins can be classified into
three main categories on the basis of the functional groups present in
them [42] - 1. cationic, 2. anionic and 3. miscellaneous. These main
categories can again be sub-divided and Figure 2.3 gives the division of
the resins on the basis of the functional groups present in them.
Resins can also be categorized into two groups on basis of the
structure involved in them [46-48] - 1. gel type and 2. macroreticular

39
< -
Cationic Anionic
Miscellaneous
Weakly Acidic
Strongly Strongly Acidic
Homogeneous Heterogeneous
Ion Exchange Membranes
Chelating Resins
Adsorbent Resins
Ion Exchange Resina
Amphoteric Resins
Liquid Ion Exchangers
Oxidation & Reduction Resins
Figure 2.3 Classification of the resins on the basis of the functional groups [after Incze'dy (reference no. 42)].

AO
type. Figure 2.4 illustrates the structures of the gel and
macrorecticular type of resins.
Gel-type resins do not contain any t*ue porosity. Ions to be
exchanged must diffuse through the gel structure to the exchange sites
[47] . The intermolecular distances which will limit the size of the ion
that can migrate through the gel is often referred to as the apparent
porosity. Even in low crosslinked gel-type resins, the apparent porosity
is usually no greater than 40 Angstrom units [47].
To avoid the resin poisoning which occurs easily in the gel-type
structures, macrorecticular-type resins were introduced [46]. These
resins can best be described by comparing them with a small ball of
tough, rigid sponge-like material, having large discrete pores [47].
Macrorecticular resins offer a number of advantages over the
conventional gel-type resins. First of all, the large discrete pores
mean that high molecular weight ions can be more completely removed from
solution and more completely eluted from the resin on regeneration than
would be the case with other materials. Secondly, the open structure of
the macrorecticular resins permits the use of tough copolymers which
would be too dense to effectively act as ion exchange resins if they
were used in a strictly gel-type system [47]. Although the
macrorecticular resins, on the whole, do have a somewhat lower capacity
than the gel-type resins because of the presence of a considerable
proportion of holes in the resin, this is often offset by the longer
operating life of the macrorecticular resins or the fact they will
effect removals not possible by the gel-type resins [47].

41
Macroporous
Macrorecticular Type
-Gel
Type
Isoporous Macrorecticular
Type
Figure 2.4 Resin structures [after Arden (reference no. 46)].
42
The macrorectlcular-type resins can be classified as being
isoporous or macroporous on the basis of the uniformity of the pores
present in them [46]. In macroporous resins, pores are of different
sizes. In spite of all the above mentioned advantages, macroporous
macrorecticular resins possess a serious defect which partially counter
balances their obvious advantages. The method of their production,
whether by the over-expansion or the sintering procedure, results in a
structure with tightly-knotted regions which hold the simple inorganic
ions more firmly than gel-type resins [46], Therefore, it is difficult
to remove these ions during regeneration and a greater quantity of
regenerant is required. Consequently, in addition to a loss of total
capacity, there is an increase in the quantity of regenerant required to
achieve a given operating capacity [46]. In order to avoid this problem,
isoporous macrorecticular-type resins, which have a substantially same
pore size, were introduced. In these resins, the tightly knotted regions
are no longer present. They also do not have the disadvantage of reduced
capacity as with macroporous resins [46].
Some of the properties to be considered in selecting a resin to
be used in a particular process, other than functional group, are
capacity, durability, solubility, density, resin bead (particle) size,
moisture content, hydraulic expansion and selectivity [35-
37,45,47,49,50]. To have longer durability, physical and chemical
stabilities and resistance against solubility are important
characteristics of modern-day resins [35,37]. Physically, resins need to
support their own bed weight and the weight of the liquid phase. Resins
43
are often subjected to acidic, basic, oxidizing or reducing conditions
and to radiation [35] and so their chemical stability is very important.
The loading of the resin is dependent on its capacity. Capacity
is useful for characterizing the resin. Ion exchange capacity can be
expressed in several ways [41] - 1. Total capacity. 2, Operating
capacity. 3. Apparent (Effective) capacity. 4. Sorption capacity. 5.
Useful capacity and 6. Breakthrough capacity.
The moisture content specification is essentially a measure of
the degree of the crosslinking or porosity. Crosslinking controls such
factors as reaction rate, selectivity and swelling of the ion exchange
resin [37].
The affinity of an ion exchange resin for various ions present in
the solution differs, i.e. some ions are held more strongly than others
[37] . The preference of the ion exchange resin for one of the two
counter-ions is often expressed as the selectivity coefficient which is
derived from the equilibrium constant of the exchange reaction [37]. For
example, consider the reactions
R+C1" + A" <-> R+A" + CI" (2.23)
R+C1" + B" <-> R+B" + CI" (2.24)
where the counter ions A" and B", present in the solution, are competing
for the reactive sites of the ion exchange resin. The selectivity
coefficient is given by the relation [35,37]
[R+B"] [A"] K — ----—... . . (2.25)
[R+A"] [B-]
where the brackets represent the concentration of various species.

44
In certain practical applications, equilibrium is most
conveniently expressed in terms of the distribution coefficient of the
counter ions [37]. The distribution coefficient is defined as
[R+A"] D - (2.26)
[A" ]
and can be calculated from the selectivity coefficient for specified
conditions. However, there is no simple explicit relationship between
these two [37]. The use of the distribution coefficient is particularly
advantageous if the species of interest is present only in trace
amounts. The ion exchange resin will prefer the ions that have a large
selectivity coefficient or distribution coefficient [37],
Ion exchange techniques may be carried out by either intermittent
or continuous operations [41]. The intermittent type includes batch and
columnar operations. In batch operations, the ion exchange resin is
simply agitated in a vessel together with a given quantity of the
solution to be treated. When the target endpoint is reached, the treated
solution is removed by decanting, and the resin may be regenerated in
place or transferred to a column for regeneration. This method is only
of slight usefulness since maximum removal (neutralization, etc.) is
limited by the equilibrium between resin and solutes. When viscous
solutions are being processed or when the reactions are irreversible,
batch contact may offer some advantages, however [41].
Ion exchange operations are usually carried out in columns [41].
Ion exchange resin is placed in a vertical column to form a bed. The
feed solution continuously enters the column and barren solution leaves
45
the column. The process continues until the resin has been loaded and a
"breakthrough" has occurred. Breakthrough volume is usually defined as
the volume fed to the column until the effluent contains the metal ion
to be exchanged at a concentration equal to a certain percentage
(usually 2%) of that in the feed solution [51]. After the breakthrough
is reached, the resin is removed and stripped to recover the metal
values. At this point, the resin may be regenerated to use in another
cycle. By columnar operations, extreme removal of solute is obtained. In
equilibrium operation, the solution continuously contacts the resin,
free of solute, and consequently there is a high driving force for the
removal of solute from solution. In order to achieve maximum removal,
the resin at the effluent end of the column must be most highly
regenerated. Ordinary concurrent regeneration is not as effective with
strongly dissociated resins; consequently reverse regeneration such as
upflow regeneration may be useful. Another useful technique involves air
mixing of the regenerated resin to prevent segregation of a band of
poorly regenerated resin at the base of a column [41] .
Recently, continuous operation of ion exchange resins has been
advocated by some sources. This involves the transfer of resin through
regenerating, rinsing and exhaustion zones. The objective is to gain
greater resin utilization and higher chemical effeciency. Also,
continuous operation favors concentration operations over removal
processes. But, these complicated devices coupled with attrition losses
do not make continuous processing too attractive in most situations
today [41].

46
2.4 Selection of resins for this research
Recovery and concentration of precious metals by the use of ion
exchange has been gr&wing tremendously in recent years and It is quite
different from the recovery of other common heavy metals in that the 4
precious metals are generally present in solution as anionic complexes.
Since these complexes are large and often have a valence of greater than
one, anion exchange resins are very selective for them compared with
other anions commonly found in water [52].
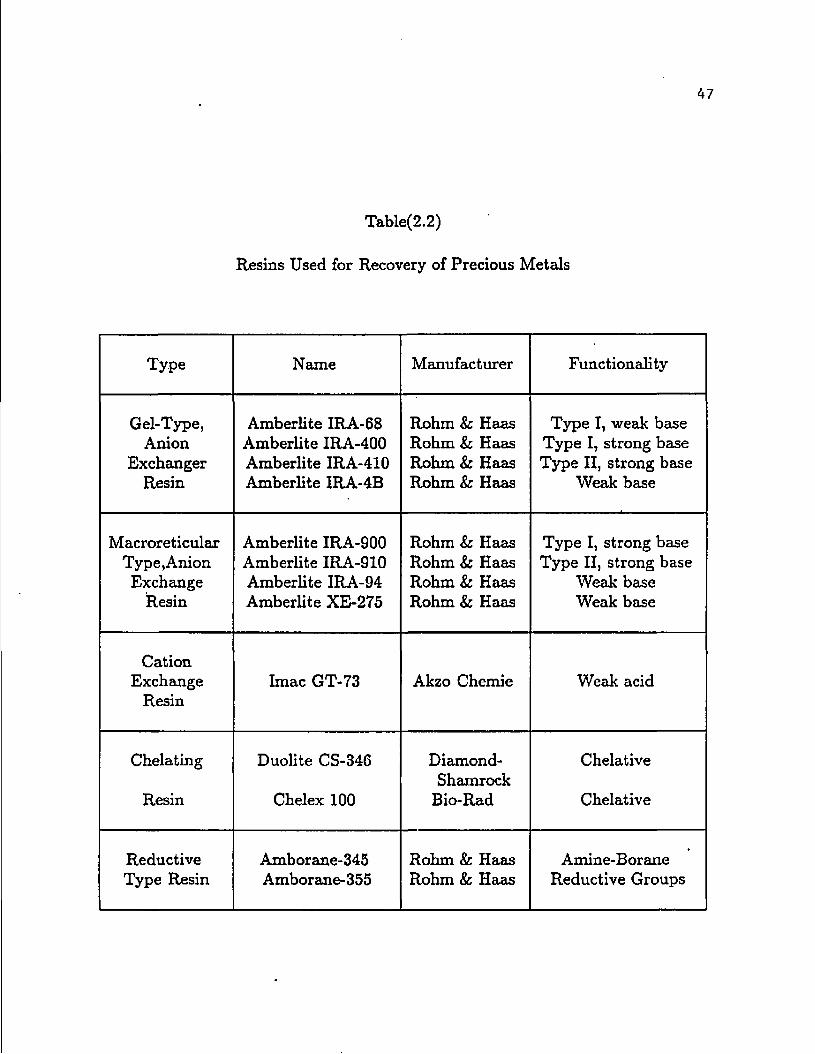
Table (2.2) gives the list of the resins used In the recovery of
gold and silver from chemical wastes and leach residues [7,52-55]. Type
I and Type II resins have a quaternary ammonium functional group (Figure
2.5). In Type I resin, the four substituents on the nitrogen atom
consist of a polymeric benzyl and three methyl groups. In Type II
resins, one-of the methyl groups is replaced by an ethanol group. These
resins differ primarily in their relative affinities for chloride and
hydroxide ions. Type II resin Is more efficiently converted to the
hydroxide form than Type I resin. It also has a slightly lower base
strength than Type I resin, but Type I resin is inherently more stable,
especially in the hydroxide form [7]. Amborane-345 and Amborane-355 are
the relatively new resins with reducing properties introduced by Rohm &
Haas Co. for the recovery of the precious metals [53-55]. The major
differences in these two materials are their respective polymeric
backbones - Amborane-345 being acrylic based and Amborane-355 being
styrene based. The reactivity of these resins is comparable to monomeric
amine-boranes in the functionality of reducing the precious metals [55].
Table(2.2)
Resins Used for Recovery of Precious Metals
Type Name Manufacturer Functionality
Gel-Type, Anion
Exchanger Resin
Amberlite IRA-6 8 Amberlite IRA-400 Amberlite IRA-410 Amberlite IRA-4B
Rohm & Haas Rohm & Haas Rohm & Haas Rohm & Haas
Type I, weak base Type I, strong base Type II, strong base
Weak base
Macroreticular Type,Anion
Exchange Resin
Amberlite IRA-900 Amberlite IRA-910 Amberlite IRA-94 Amberlite XE-275
Rohm & Haas Rohm & Haas Rohm & Haas Rohm & Haas
Type I, strong base Type II, strong base
Weak base Weak base
Cation Exchange
Resin Imac GT-73 Akzo Chemie Weak acid
Chelating
Resin
Duolite CS-346
Chelex 100
Diamond-Shamrock
Bio-Rad
Chelative
Chelative
Reductive Type Resin
Amborane-345 Amborane-355
Rohm & Haas Rohm & Haas
Amine-Borane Reductive Groups

48
CH3
I 3
— N — C H 3 CI
CH'
Type I
_ f"3
R —ch2—'jJ—CH3 C1
CH2CH2OH
Type II
Figure 2.5 Structures of Type I and Type II resins [after Chou (reference no. 7)].
49
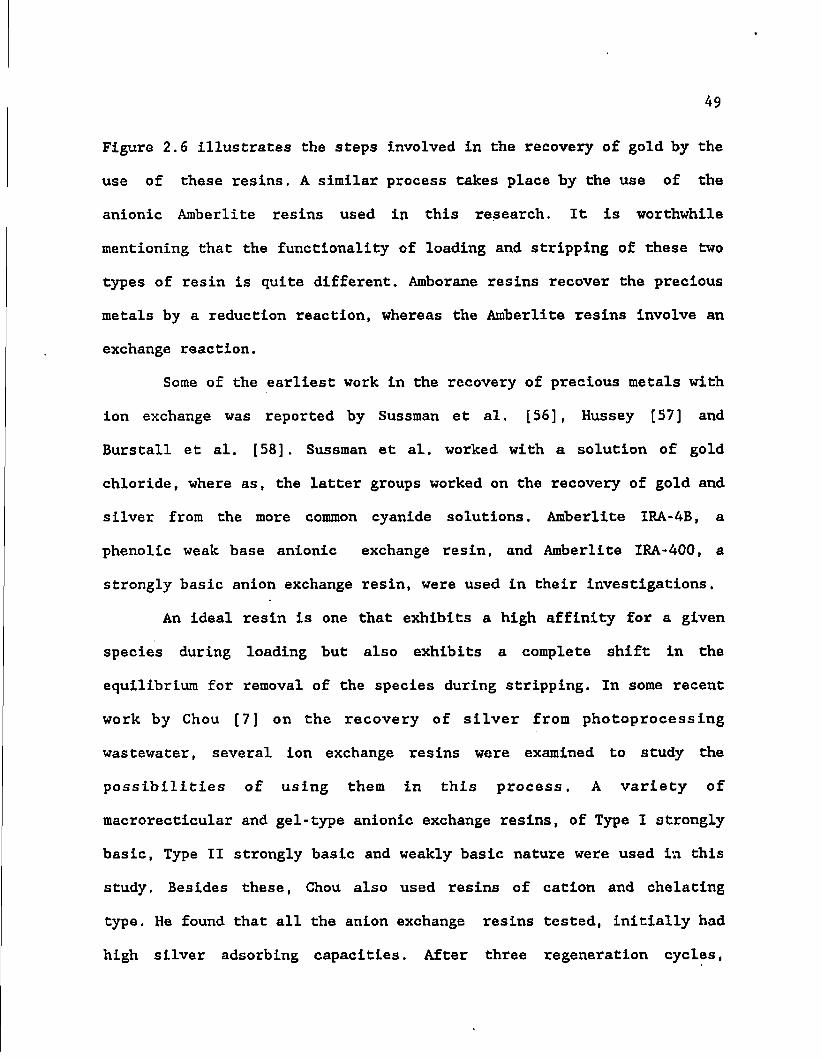
Figure 2.6 illustrates the steps involved in the recovery of gold by the
use of these resins. A similar process takes place by the use of the
anionic Amberlite resins used in this research. It is worthwhile
mentioning that the functionality of loading and stripping of these two
types of resin is quite different. Amborane resins recover the precious
metals by a reduction reaction, whereas the Amberlite resins involve an
exchange reaction.
Some of the earliest work in the recovery of precious metals with
ion exchange was reported by Sussman et al. [56] , Hussey [57] and
Burstall et al. [58] . Sussman et al. worked with a solution of gold
chloride, where as, the latter groups worked on the recovery of gold and
silver from the more common cyanide solutions. Amberlite IRA-4B, a
phenolic weak base anionic exchange resin, and Amberlite IRA-400, a
strongly basic anion exchange resin, were used in their investigations.
An ideal resin is one that exhibits a high affinity for a given
species during loading but also exhibits a complete shift in the
equilibrium for removal of the species during stripping. In some recent
work by Chou [7] on the recovery of silver from photoprocessing
wastewater, several ion exchange resins were examined to study the
possibilities of using them in this process. A variety of
macrorectlcular and gel-type anionic exchange resins, of Type I strongly
basic, Type II strongly basic and weakly basic nature were used ivi this
study. Besides these, Chou also used resins of cation and chelating
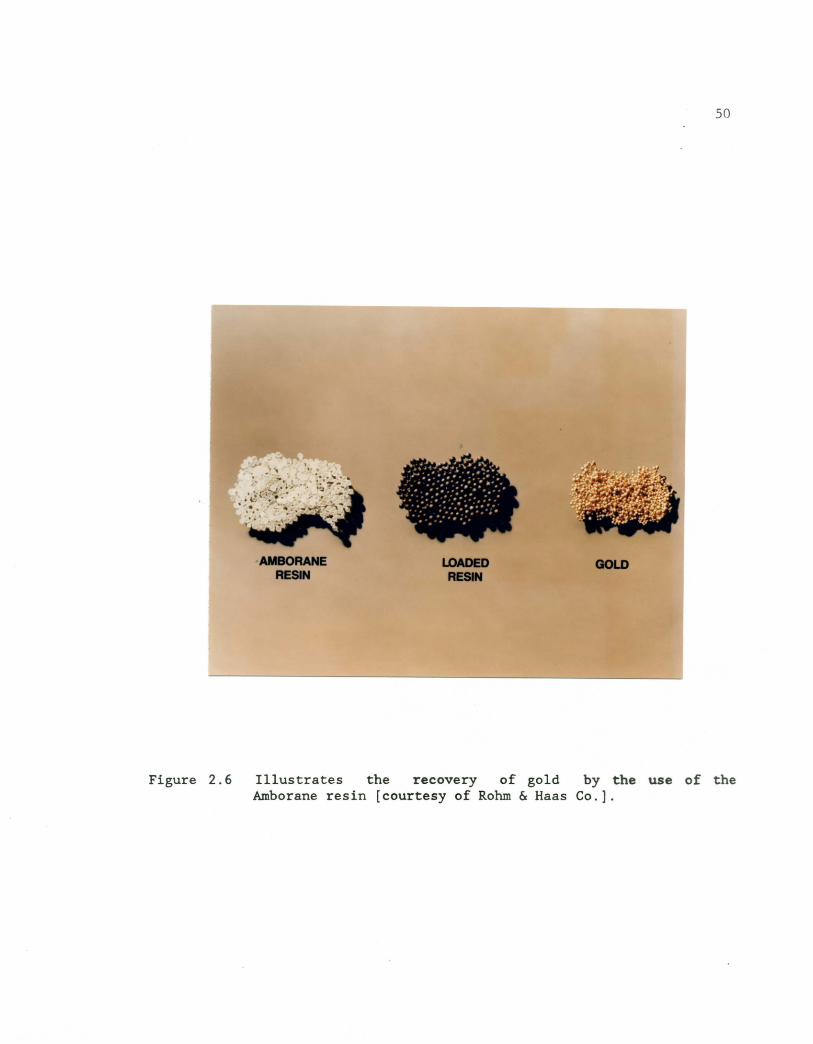
type. He found that all the anion exchange resins tested, initially had
high silver adsorbing capacities. After three regeneration cycles,
·AIIBORANE RESIN
LOADED RESIN
so
GOLD
Figure 2. 6 Illustrates the recovery of gold by the use of the Amborane resin [courtesy of Rohm & Haas Co.].

51
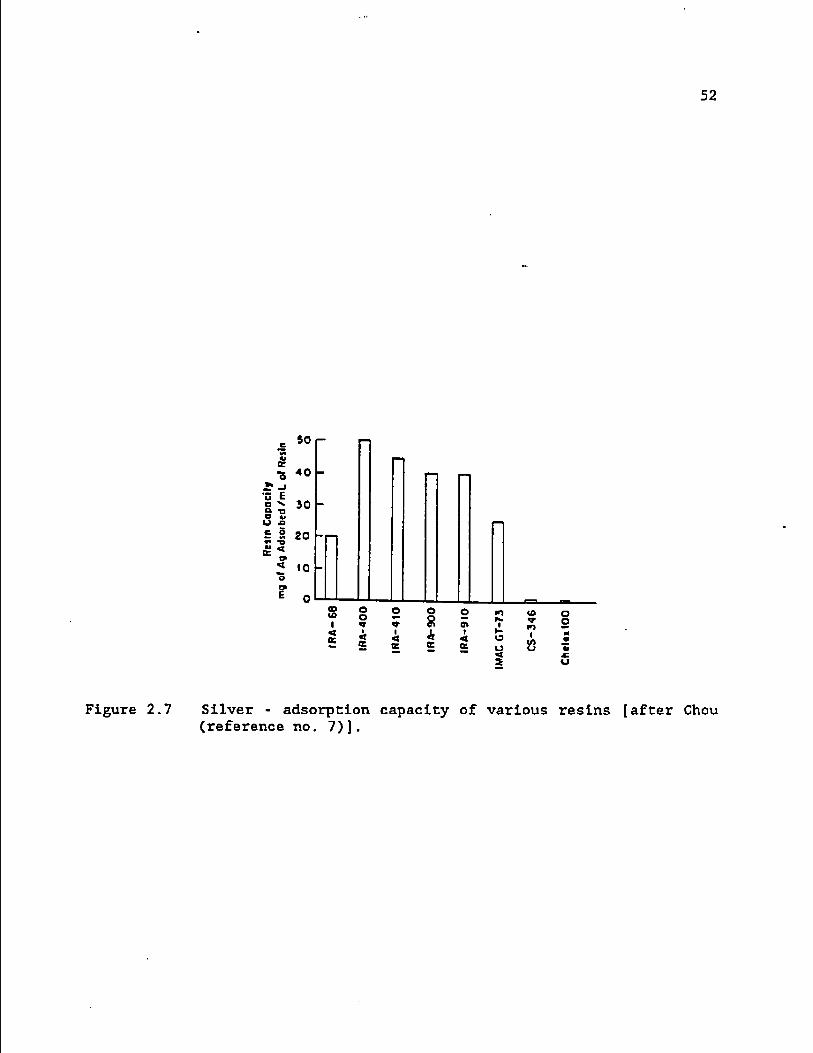
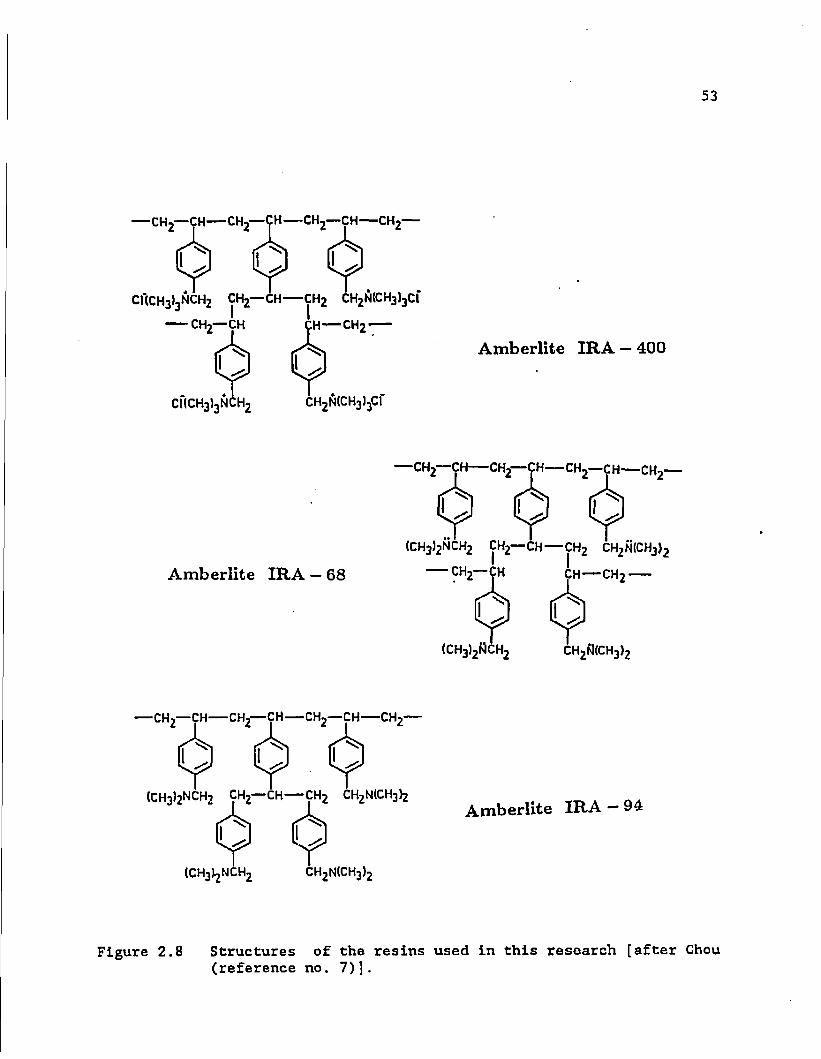
however, only Amberllte IRA-400 and Amberllte IRA-68 resins had an
acceptable capacity (Figure 2.7). Amberllte IRA-400 resin is a strong
base, Type I, anion exchange resin (Figure 2.8). The basicity of the
resin is derived from the quaternary ammonium functionality [7,47,59].
Amberllte IRA-68 (Figure 2.8) resin is a weak base anion exchange resin
with a tertiary amine functionality [7,47,60]. Both these resins have
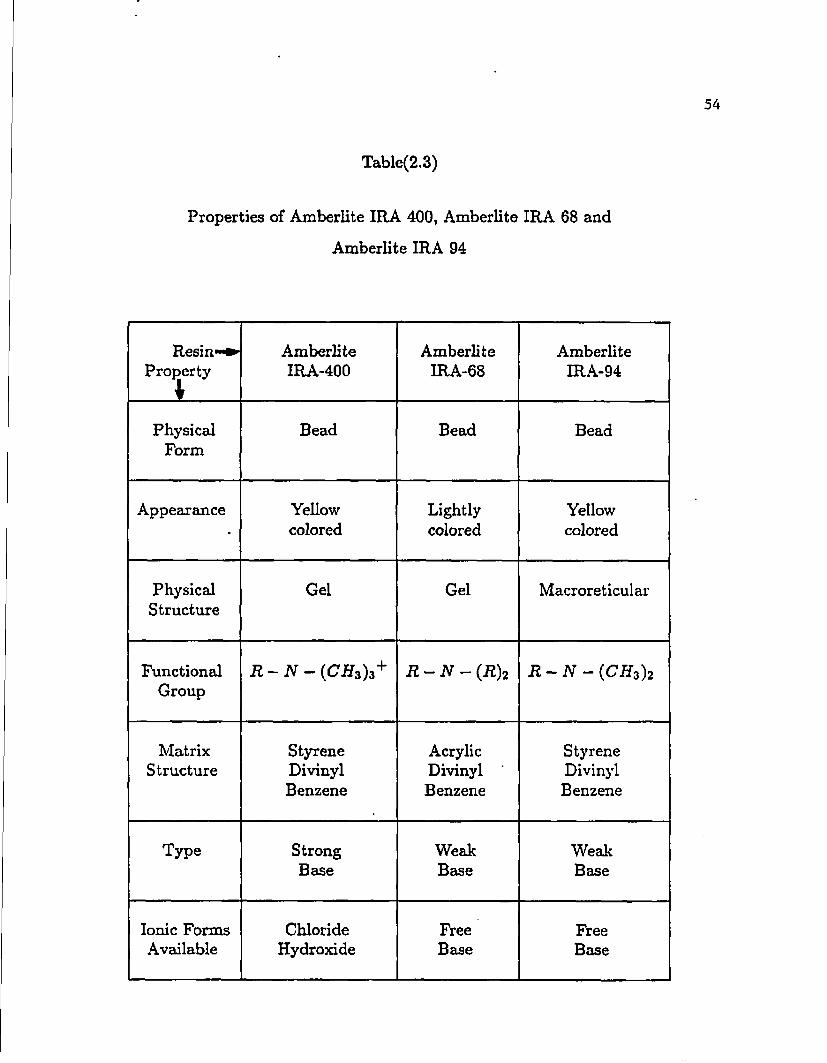
gel-type structure. Table (2.3) gives some of the properties of these
resins [7,59,60].
Chou reported that in the regeneration studies of these resins by
30 wt.% ammonium thiosulfate "(Figure 2.9), only six bed volumes were
required to remove 90% of the silver from the Amberllte IRA-68 while the
same volume of the regenerant removed only 60% of the silver from the
Amberllte IRA-400. In succeeding cycles, the capacity of Amberlite-IRA
400 for silver dropped from 50 gm./liter to 20 gm./liter when the resin
was regenerated with 30 wt.% ammonium thiosulfate. To rejuvenate the
resin, a second regenerant of 5% sulphuric acid was added on the third
cycle which restored the capacity to 45 gm./liter. The average capacity
of Amberllte IRA-68 over eight cycles was 27 gm./liter when regenerated
with 30 wt.% ammonium thiosulfate.
Sometimes, gold and silver recovery operations require large
scale equipment with high levels of hydraulic loading and frequent
cycles. These conditions may result in attrition of gel-type resins,
ultimately affecting performance with respect to gold and silver
adsorption [61]. To overcome this, the use of a macrorecticular anion
exchanger such as Amberlite-IRA 94 (Figure 2.8) has been recommended
52
50 i-
K •5 *0
*3 E g ̂ 30 £ 13 O tf U a S I 20 •I ^
10
CD O «> O 1 * < X 2 2
i a
o
* a o» » < q: o
o < 2
to V PO I s
o o
Figure 2.7 Silver - adsorption capacity of various resins [after Chou (reference no. 7)].
53
—cn2— CH—CH2—CH—CH2—CH—CH2—
CrtCH3)3NCH2 CH2—CH—CH2 CH2N(CH3)3Cl'
CH2—CH CH—CH2
^ Amberlite IRA — 400
Cf(CH3]3NCH2 CH2N(CH3)3Cf
—CH2—CH CH2—CH—CH2—CH—CH2—
fS ifS IH"
(CH3)2NCH2 CH2—CH—CH2 CH2N(CHj)2
Amberlite IRA — 68 ?H2 ?H lH—CH2 —
(CH3)2NCH2 CH2M(CH3)2
—CH2—CH CH2—CH CH2—CH CH2—
O O . (
(CH3)2NCH2 CH2—CH CH2 CH^ICH^ Amberlite IRA — 94
(CHJ^NCHJ CH2NCCH3)2
Figure 2.8 Structures of the resins used in this research [after Chou (reference no. 7)].
54
Table(2.3)
Properties of Amberlite IRA 400, Amberlite IRA 68 and
Amberlite IRA 94
Resin-n^ Property
1
Amberlite IRA-400
Amberlite IRA-68
Amberlite IRA-94
Physical Form
Bead Bead Bead
Appearance Yellow colored
Lightly colored
Yellow colored
Physical Structure
Gel Gel Macroreticular
Functional Group
R - N - { C H z)3+ R - N — (R)2 R - N - { C H Z ) 2
Matrix Structure
Styrene Divinyl Benzene
Acrylic Divinyl Benzene
Styrene Divinyl Benzene
Type Strong Base
Weak Base
Weak Base
Ionic Forms Available
Chloride Hydroxide
Free Base
Free Base
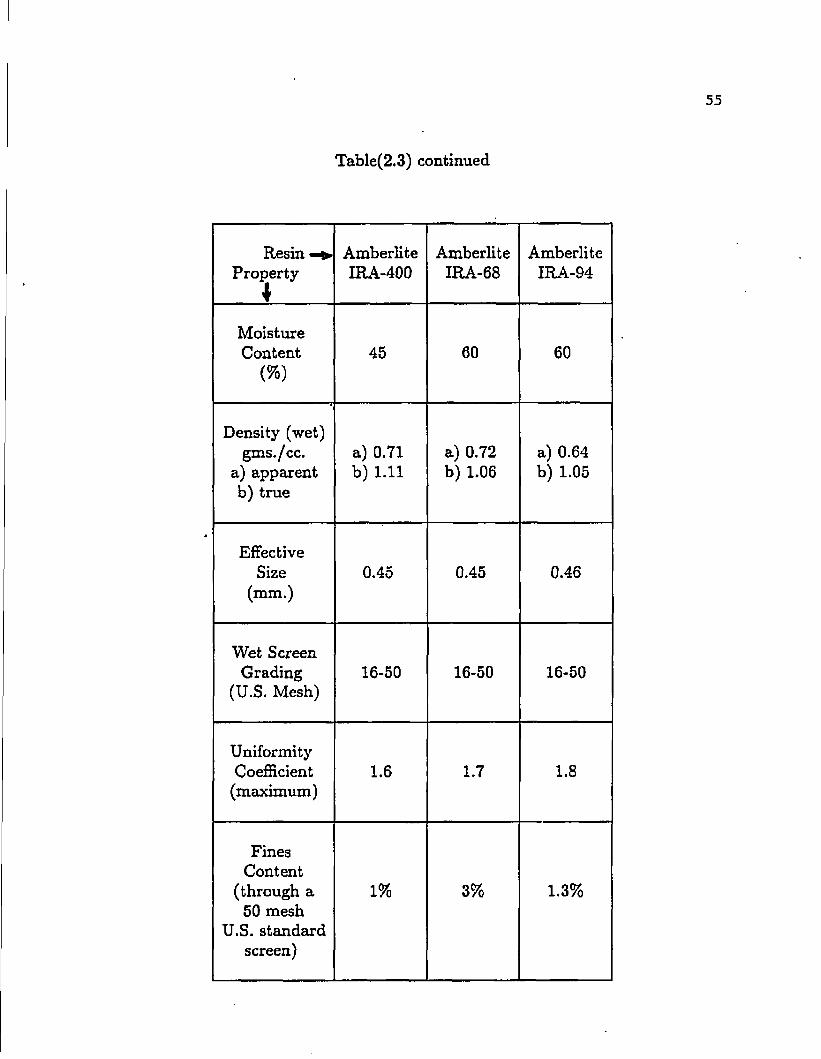
Table(2.3) continued
Resin Property
•
Amberlite IRA-400
Amberlite IRA-68
Amberlite IRA-94
Moisture Content
(%) 45 60 60
Density (wet) gms./cc.
a) apparent b) true
a) 0.71 b) 1.11
a) 0.72 b) 1.06
a) 0.64 b) 1.05
Effective Size
(mm.) 0.45 0.45 0.46
Wet Screen Grading
(U.S. Mesh) 16-50 16-50 16-50
Uniformity Coefficient
(maximum) 1.6 1.7 1.8
Fines Content
(through a 50 mesh
U.S. standard screen)
1% 3% 1.3%
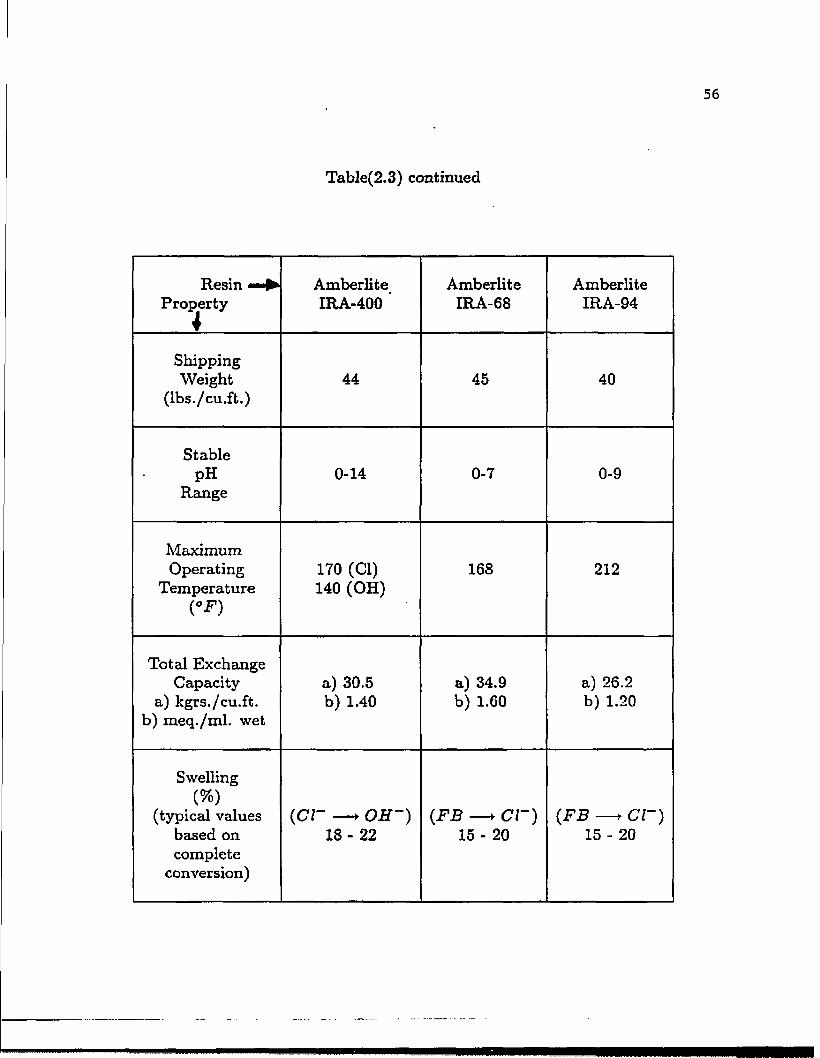
Table(2.3) continued
Resin —• Property
4
Amberlite IRA-400 '
Amberlite IRA-68
Amberlite IRA-94
Shipping Weight
(lbs./cu.ft.) 44 45 40
Stable pH
Range 0-14 0-7 0-9
Maximum Operating
Temperature (°F)
170 (CI) 140 (OH)
168 212
Total Exchange Capacity
a) kgrs./cu.ft. b) meq./ml. wet
a) 30.5 b) 1.40
a) 34.9 b) 1.60
a) 26.2 b) 1.20
Swelling (%)
(typical values based on complete
conversion)
(cr —• OH~)
18 - 22 (FB —• Cl~)
15 - 20 (FB —• cr)
15 - 20

57
100
• 0
60
4 0
20
0 2 10 6 18 14 22 26
Bed Volume el Ptgtntrant
Figure 2.9 A comparison of silver-eluting rate between Amberlite IRA-68 and Amberlite IRA-400 resins by 30 wt.% (^4)28203 regeneration solution [after Chou (reference no, 7)].

58
[62,63]. It is a weak base anion exchange resin with a tertiary amine
functional group (see Table 2.3) [47,64], The gain in stability and
reliability in performance can outweigh the slightly lower exchange
capacity of this macrorecticular ion exchange resin [see Section 2.3].
2.5 The Chemistry of Adsorption and Elutlon
Strong-base resins:
The functional group of a strong base resin is a quaternary amine
possessing a permanent positive charge [65]. Gold thiosulfate, silver
thiosulfate and other anions are therefore extracted by an ion exchange
reaction, which is shown here for gold thiosulfate :
3|-NR3X" + AU(S203)23" <-> |-NR3AU(S203)23" + 3X" (2.27)
where the symbol | - denotes the inert backbone or matrix of the resin,
which is generally polystyrene, R represents the methyl group and X
indicates the ion on the resin that can be replaced [12,65].
The metal thiosulfate complexes on the resin can be eluted from
the resin either by ion exchange , in which the equilibrium depicted in
equation (2.27) can be forced to the left by an increase in the
concentration of X", or by conversion of the metal ions to non -
anionic complex species [65]. The latter method has been extensively
exploited in the Soviet Union [66,67] and involves the neutral thiourea
ligand. In an acid environment, thiourea reacts with aurocyanide to form
a stable gold-thiourea complex.

59
l-NR3+Au(CN)2" + 2<NH2)2CS + 2HX <-> |-NR3+X" + [Au{(NH2)2CS)2]+
+ X' + 2HCN .... (2.28)
This complex is cationic, and is therefore readily eluted from the
anion-exchange resin. The same process can also be used for elutlng gold
and silver thlosulfate complexes [12]. Alternatively, an anion can be
chosen that is adsorbed onto a strong - base resin more strongly than
complexes of silver or gold, in which case the equilibrium in equation
(2.27) would lie naturally to the left hand side [65]. A considerable
5 . amount of work has been done with zinc cyanide, Zn(CN)4 , to recover
aurocyanide from the resin surface [12]. The elution of a strong base
resin with zinc cyanide followed by acid regeneration of the resin is
depicted in equations (2.29) and (2.30):
2(| -NR3Au(CN)2") + Zn(CN)42" <-> ( | -NR3 )2Zn(CN)4
2" + 2AU(CN)2"
(2.29)
(|-NR3)2Zn(CN)42" + 4HX <-> 2|-NR3X~ + ZnX2 + AHCN . . . . (2.30)
Weak-base resins:
Weak base resins contain primary, secondary, or tertiary amine
functional groups (or a mixture of these), and the ion - exchange
properties of weak base resins are governed by the pH of the solution in
contact with the resin [65] . In the free-base form, the resin is
uncharged. It is therefore necessary for the resin to be protonated
prior to the extraction of thiosulfate complexes of gold and silver
[12]:
60
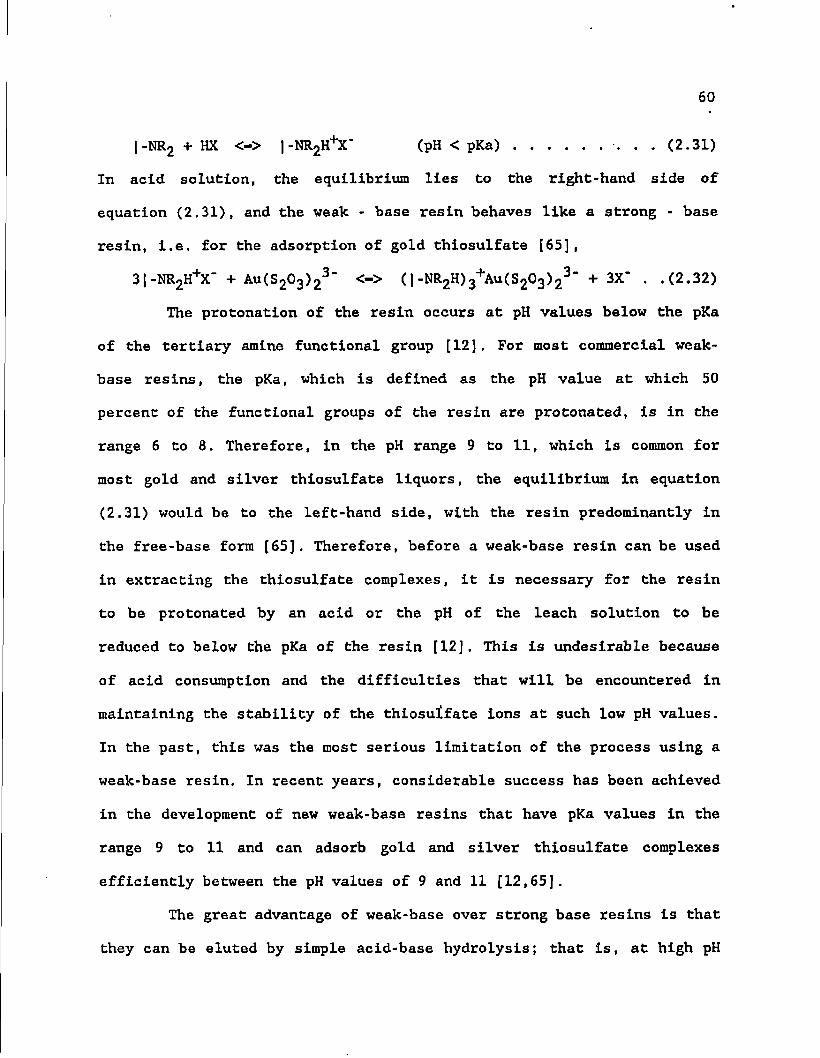
|-NR2 + HX <-> |-NR2H+X" (pH < pKa) (2.31)
In acid solution, the equilibrium lies to the right-hand side of
equation (2.31), and the weak - base resin behaves like a strong - base
resin, i.e. for the adsorption of gold thiosulfate [65],
3|-NR2H+X" + AU(S203 )23" <-> (|-NR2H)3+Au(S203 )2
3" + 3X" . . (2.32)
The protonation of the resin occurs at pH values below the pKa
of the tertiary amine functional group [12]. For most commercial weak-
base resins, the pKa, which is defined as the pH value at which 50
percent of the functional groups of the resin are protonated, is in the
range 6 to 8. Therefore, in the pH range 9 to 11, which is common for
most gold and silver thiosulfate liquors, the equilibrium in equation
(2.31) would be to the left-hand side, with the resin predominantly in
the free-base form [65]. Therefore, before a weak-base resin can be used
in extracting the thiosulfate complexes, it is necessary for the resin
to be protonated by an acid or the pH of the leach solution to be
reduced to below the pKa of the resin [12]. This is undesirable because
of acid consumption and the difficulties that will be encountered in
maintaining the stability of the thiosulfate ions at such low pH values.
In the past, this was the most serious limitation of the process using a
weak-base resin. In recent years, considerable success has been achieved
in the development of new weak-base resins that have pKa values in the
range 9 to 11 and can adsorb gold and silver thiosulfate complexes
efficiently between the pH values of 9 and 11 [12,65] .
The great advantage of weak-base over strong base resins is that
they can be eluted by simple acid-base hydrolysis; that is, at high pH
61
values, the equilibrium in equation (2.31) lies to the left-hand side,
and the functional groups of the resin, in the free-base form, are no
longer able to hold anions [65]. The elution of gold thiosulfate from a
weak-base resin by hydrolysis is illustrated in equation (2.33) :
(|-NR2H)3Au(S203)23" + 30H" <-> 3|-NR2 + Au(S203)23' + 3H20
(2.33)
Weak-base resins can also be eluted in acid solution by an ion-
exchange reaction involving the use of an anion that can be adsorbed
onto a weak-base resin more strongly than gold thiosulfate. But in
practice, the method shown in equation (2.33) is much more efficient,
simple and inexpensive and so is generally preferred [65],
When a weak-base resin is being chosen for the extraction of
gold and silver thiosulfate complexes, it is important that it have as
low a content of strong-base functional groups as possible. These groups
arise in a weak-base resin as a result of cross-linking of the tertiary
amine groups, and can account for 10 to 15 percent of the capacity of a
weak-base resin. Elution of the thiosulfate complexes loaded on these
groups will be difficult and could lead to leakage of high metal values
in the barren solution when the resin is recycled to the adsorption
circuit [12].
62
CHAPTER 3
EXPERIMENTAL MATERIALS AND DETAILS
3.1 Materials
Three types of resins, Amberlite IRA-400, Amberlite IRA-68 and
Amberlite IRA-94, all manufactured by Rohm and Haas Co. were used in
this study. Of these three resins, the first two are gel-type and the
third one is of macrorecticular type. Amberlite IRA-400 was chosen
because of its high affinity for anionic complexes and Amberlite IRA-68
due to its great regeneration capacity [see Section 2.4]. Amberlite IRA
94 was selected to study the affect of resin structure on the recovery
of gold and silver from thiosulphate leach liquors. The chemicals used
in this study along with their formula weights, manufacturers and
purpose of use are given in Table 3.1. Copper sulphate, silver nitrate
and gold dissolved in dilute aqua regia were used as standards for
elemental analysis by atomic absorption spectroscopy. These standards
were either bought from chemical companies or indigeneously prepared in
the laboratory by the procedures given in the atomic absorption manual
[ 6 8 ] .
3.2 Experimental methods
A schematic diagram of the experimental set-up used for the batch
tests is given in Figure 3.1 (a). The experiments were done at room
temperature with 10 gms of resin and 500 ml of leach solution in a 1000
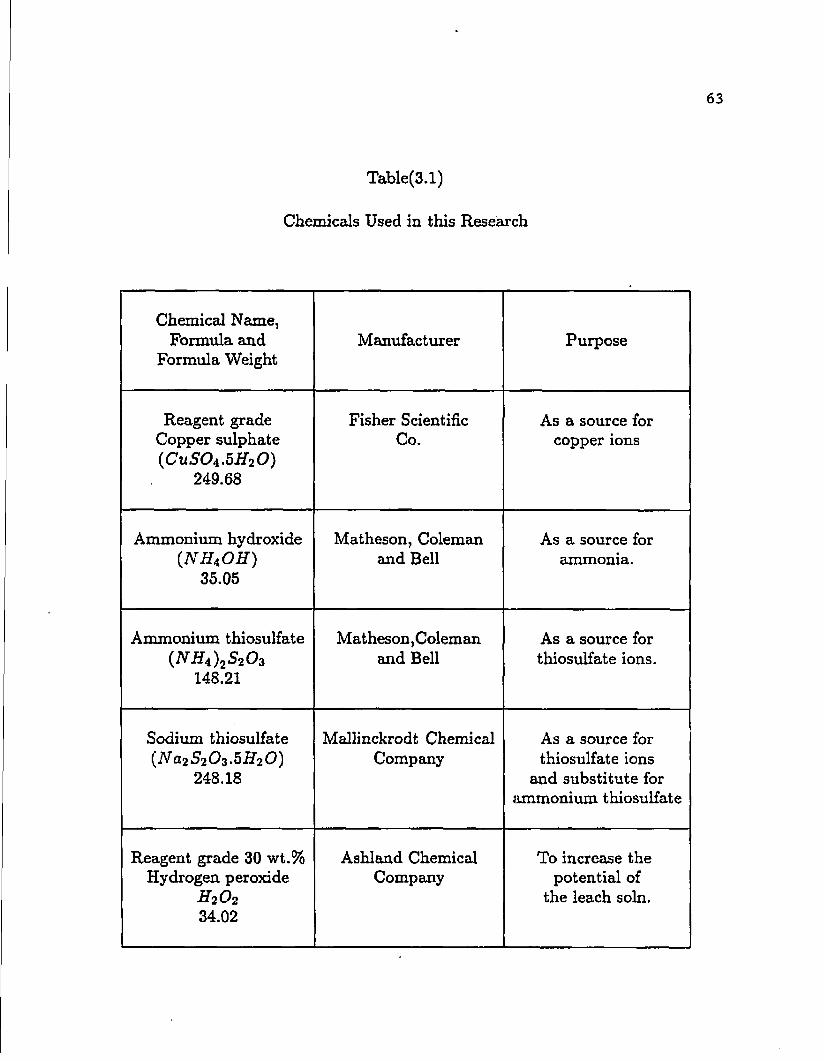
63
Table(3.1)
Chemicals Used in this Research
Chemical Name, Formula and
Formula Weight Manufacturer Purpose
Reagent grade Copper sulphate (iCuS0i.5H20)
249.68
Fisher Scientific Co.
As a source for copper ions
Ammonium hydroxide {NHAOH)
35.05
Matheson, Coleman and Bell
As a source for ammonia.
Ammonium thiosulfate {NHa)2S2O z
148.21
Matheson,Coleman and Bell
As a source for thiosulfate ions.
Sodium thiosulfate (Na.2S2O3.5H2O)
248.18
Mallinckrodt Chemical Company
As a source for thiosulfate ions
and substitute for ammonium thiosulfate
Reagent grade 30 wt.% Hydrogen peroxide
H202
34.02
Ashland Chemical Company
To increase the potential of
the leach soln.
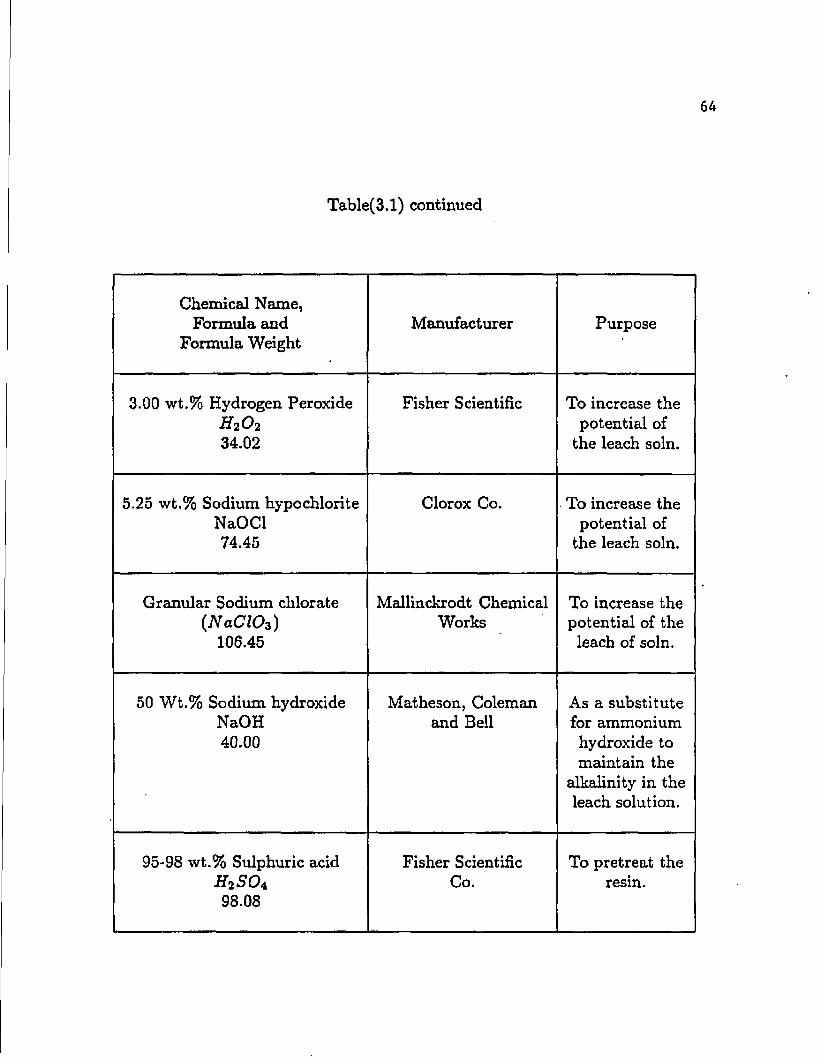
64
Table(3.1) continued
Chemical Name, Formula and
Formula Weight Manufacturer Purpose
3.00 wt.% Hydrogen Peroxide h2o2
34.02
Fisher Scientific To increase the potential of
the leach soln.
5.25 wt.% Sodium hypochlorite NaOCl 74.45
Clorox Co. To increase the potential of
the leach soln.
Granular Sodium chlorate (.NaCIOz)
106.45
Mallinckrodt Chemical Works
To increase the potential of the
leach of soln.
50 Wt.% Sodium hydroxide NaOH 40.00
Matheson, Coleman and Bell
As a substitute for ammonium hydroxide to maintain the
alkalinity in the leach solution.
95-98 wt.% Sulphuric acid H2SO4 98.08
Fisher Scientific Co.
To pretreat the resin.

65
Stirrer Rod
£li MHtf
• »
• s
# * • 0 ^
3 • * . 1 • • • •
d #
•/ • * •
m •
• m m 9 0 • m
pH MaUr
# • 1 « -
* i «
• • • • •
i
1 V •Pk • • * *0. •/
•
• /
, tbifbmbhttr
v.
• * • • • ••
• • • • ! • • • • • • • > » « * » , » « » m * • y
A
Eb Prob* pH Prob»
Figure 3.1 Illustration of the (a) experimental setup for batch tests and (b) top view of the lid for the reactor.
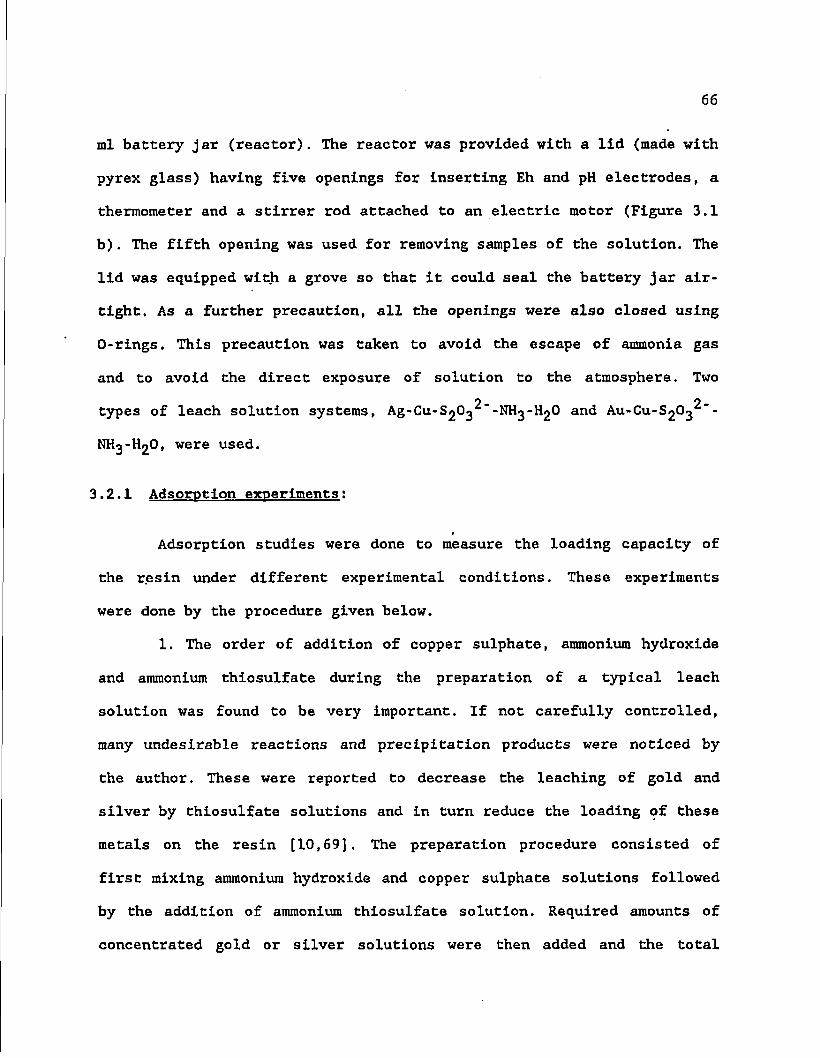
66
ml battery jar (reactor). The reactor was provided with a lid (made with
pyrex glass) having five openings for inserting Eh and pH electrodes, a
thermometer and a stirrer rod attached to an electric motor (Figure 3.1
b). The fifth opening was used for removing samples of the solution. The
lid was equipped with a grove so that it could seal the battery jar air
tight. As a further precaution, all the openings were also closed using
O-rings. This precaution was taken to avoid the escape of ammonia gas
and to avoid the direct exposure of solution to the atmosphere. Two
2 - 2 -types of leach solution systems, Ag-Cu-S20j -NH3-H2O and AU-CU-S2O3
were used.
3.2.1 Adsorption experiments:
Adsorption studies were done to measure the loading capacity of
the resin under different experimental conditions. These experiments
were done by the procedure given below.
1. The order of addition of copper sulphate, ammonium hydroxide
and ammonium thiosulfate during the preparation of a typical leach
solution was found to be very important. If not carefully controlled,
many undesirable reactions and precipitation products were noticed by
the author. These were reported to decrease the leaching of gold and
silver by thiosulfate solutions and in turn reduce the loading of these
metals on the resin [10,69], The preparation procedure consisted of
first mixing ammonium hydroxide and copper sulphate solutions followed
by the addition of ammonium thiosulfate solution. Required amounts of
concentrated gold or silver solutions were then added and the total

67
volume was adjusted to be 500 ml by appropriate dilution with distilled
water. The contents of the beaker were then thoroughly and uniformly
stir mixed. A gold or silver leach solution of 20 ppm strength was used
in all the experiments.
2. Before the addition of the resin, a 2 ml sample was pipetted
out into a glass vial to be analysed by atomic absorption
spectrophotometry (Perkin-Elmer model 2380) for the initial metal
concentrations in the leach solution. Eh, pH , color and temperature
were also noted before the addition of the resin to the leach system.
The pH of the suspension was measured with Fisher Accumet pH controller
(model 650). The redox-potential of the solution was measured with an
Orion platinum redox electrode using an Orion ion analyzer (model 701
A).
3. The experiments were initiated by adding a weighed quantity of
the resin (in most cases 10 gins.) to the leach solution. 2 ml. aliquots
of the leach solution were withdrawn at regular intervals for atomic
absorption analysis. The pH, Eh, color and temperature of the leach
solution were also noted at these time intervals for the length of the
experiment.
4. All the sample solutions were promptly diluted so that they
were within the linear range (Table 3.2) of operation of the atomic
adsorption spectrophotometer for the element of interest as mentioned in
the spectrophotometer manual [68]. Then these solutions were analysed by
the atomic absorption spectrophotometer (Perkin Elmer model 2380). From
these values, the amounts of copper and gold or silver adsorbed by the

63
Table(3.2)
Linear Ranges of Operation of the Perkin Elmer Atomic Absorption Spectrophotometer (Model 2380) for Copper, Gold and Silver
Element Copper Gold . Silver
Wave length, nm. 325 243 328
Light source Hollow cathode lamp
Hollow cathode lamp
Hollow cathode lamp
_ Flame type Air-acetylene
flame oxidizing (lean, blue)
Air-acetylene flame oxidizing
(lean, blue)
Air-acetylene flame oxidizing
(lean, blue)
Linear working range, ppm.(/i/ml.) 0-5 0-20 0-4
69
resin were calculated and plotted as a function of time.
3.2.2. Desorotlon studies:
Desorption studies were done to investigate the elution of the
metal values (gold,silver and copper) from the loaded resin by using a
regenerant. In these studies, ammonium thiosulfate solution was used as
an eluting reagent. The general procedure followed in performing the
desorption studies is described in detail below.
1. To start with, all the five steps involved in the adsorption
study were performed.
2. Then at the end of the adsorption (loading) phase, the set up
was dismantled and the solution was filtered using a vacuum filtration
unit and the residual resin was washed with deionized water in the same
unit and put back in the battery jar.
3. A 500 ml. solution of thiosulfate of desired strength was then
added and the experiment was repeated as before by taking the samples at
regular intervals for the desired length of time. At these intervals,
pH, Eh, color and temperature of the leach solution were also noted.
Three different concentrations of ammonium thiosulfate (0.9 M, 1.8 M and
9 . 2.7 M S2O3 ) were used as the regenerant solutions.
4. As in the case of absorption studies, sample solutions were
analysed by the atomic absorption spectrophotometer and the amounts of
copper and gold or silver desorbed from the resin were plotted as a
function of time,
A precaution was taken to refrigerate the sample solutions until

70
they were chemically analyzed. This caution was taken as thiosulfates
are very sensitive to light. Before performing the chemical analysis,
the solutions were brought back to the room temperature to avoid
erroneous measurements.
3.3 Experiments performed;
Adsorption and desorption studies were made on two types of leach
systems involving gold and silver, respectively. The systems were Ag-Cu-
0 - 9 -^2®3 " an<i AU-CU-S2O3 -NH3-H2O. These studies were done at
25°C and an agitation speed of 500 rpm., under different experimental
conditions to study the effect of competing ions, solution conditions
(Eh and pH), type and nature of resin on the selective recovery of gold
and silver by resin ion exchange method from copper-containing
ammoniacal thiosulfate solutions. The composition of the leach system
used in this study is given in Table 3.3 [70]. These compositions
resemble the ammonium thiosulfate leach liquors obtained after treating
difficult-to-treat ores and chemical wastes. Tables 3.4 through 3.7
summarize the different experimental conditions used in this research.
Adsorption studies were done at first with ammoniacal thiosulfate
solutions containing silver and copper. On the basis of these results,
experiments were done with ammoniacal thiosulfate solutions containing
gold and copper. An additional experiment not listed in Table 3.4 was
done to investigate whether copper present in the aimnoniacal thiosulfate
solution was replacing the loaded silver from the resin surface. In this
experiment, 6 gm. of IRA 400 resin was initially loaded with silver from
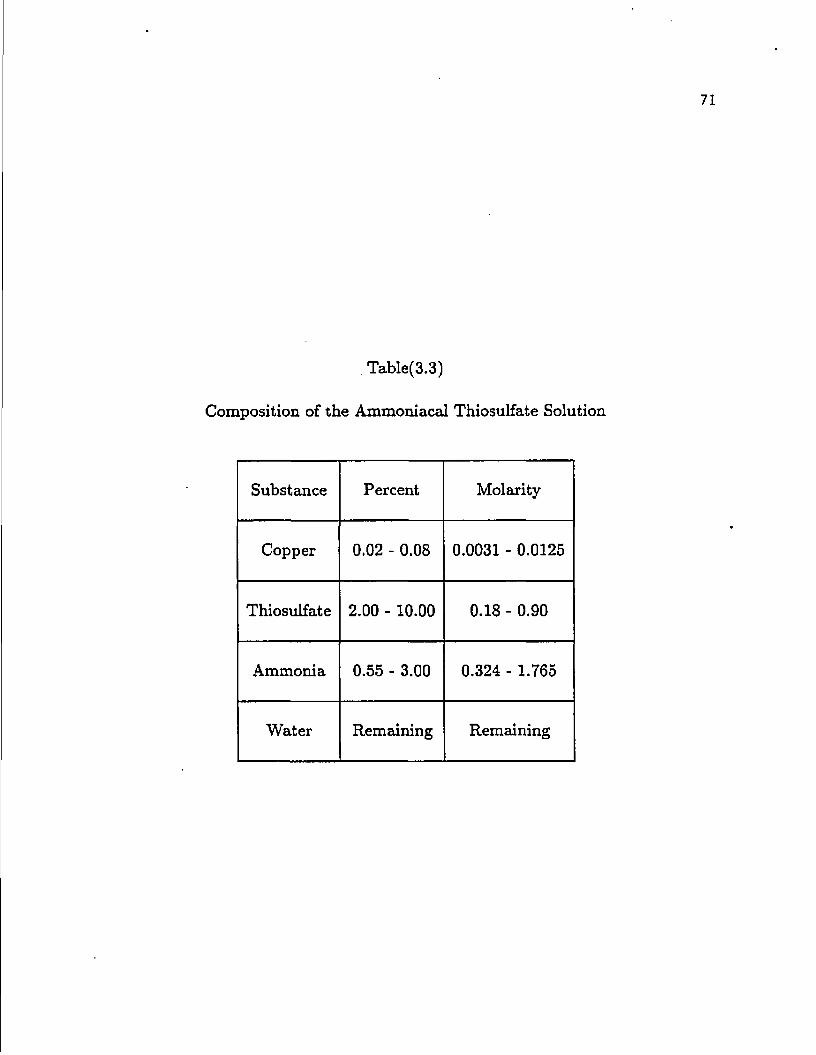
Table(3.3)
Composition of the Ammoniacai Thiosulfate Solution
Substance Percent Molarity
Copper 0.02 - 0.08 0.0031 - 0.0125
Thiosulfate 2.00 - 10.00 0.18 - 0.90
Ammonia 0.55 - 3.00 0.324 - 1.765
Water Remaining Remaining
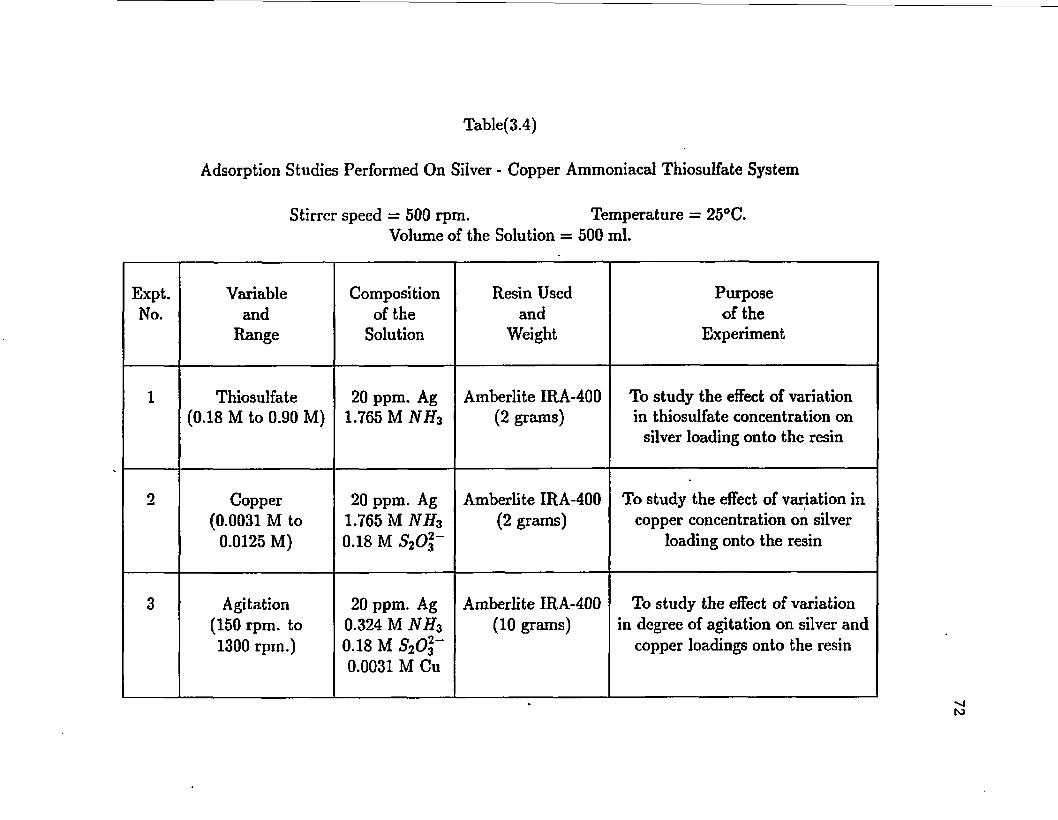
Table(3.4)
Adsorption Studies Performed On Silver - Copper Ammoniacal Thiosulfate System
Stirrer speed = 500 rpm. Temperature = 25°C. Volume of the Solution = 500 ml.
Expt. No.
Variable and
Range
Composition of the
Solution
Resin Used and
Weight
Purpose of the
Experiment
1 Thiosulfate (0.18 M to 0.90 M)
20 ppm. Ag 1.765 M NH3
Amberlite IRA-400 (2 grams)
To study the effect of variation in thiosulfate concentration on
silver loading onto the resin
2 Copper (0.0031 M to
0.0125 M)
20 ppm. Ag 1.765 M NH3
0.18 M S2Ol~
Amberlite IRA-400 (2 grams)
To study the effect of variation in copper concentration on silver
loading onto the resin
3 Agitation (150 rpm. to 1300 rpm.)
20 ppm. Ag 0.324 M NHZ
0.18 M S20\~
0.0031 M Cu
Amberlite IRA-400 (10 grams)
To study the effect of variation in degree of agitation on silver and
copper loadings onto the resin
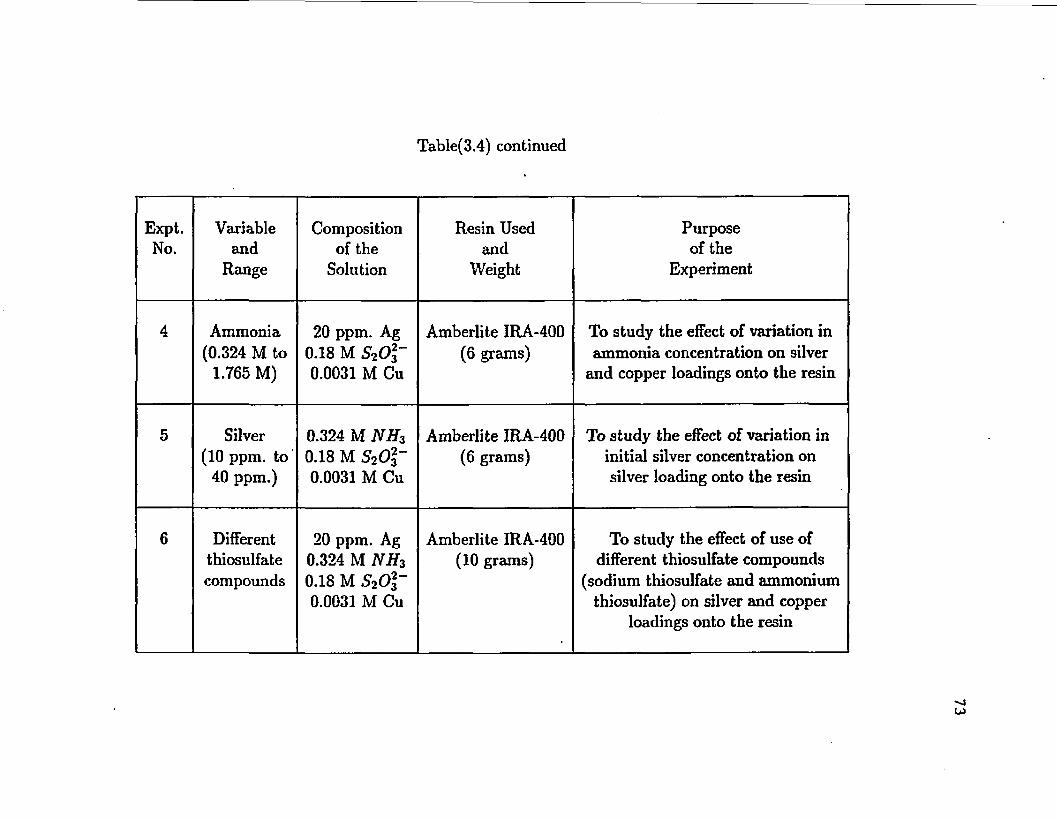
Table(3.4) continued
Expt. No.
Variable and
Range
Composition of the
Solution
Resin Used and
Weight
Purpose of the
Experiment
4 Ammonia (0.324 M to
1.765 M)
20 ppm. Ag 0.18 M S2Ol"
0.0031 M Cu
Amberlite IRA-400 (6 grams)
To study the effect of variation in ammonia concentration on silver
and copper loadings onto the resin
5 Silver (10 ppm. to
40 ppm.)
0.324 M NH2
0.18 M S2Ol~
0.0031 M Cu
Amberlite IRA-400 (6 grams)
To study the effect of variation in initial silver concentration on silver loading onto the resin
6 Different thiosulfate compounds
20 ppm. Ag 0.324 M NH3
0.18 M S20\~
0.0031 M Cu
Amberlite IRA-400 (10 grams)
To study the effect of use of different thiosulfate compounds
(sodium thiosulfate and ammonium thiosulfate) on silver and copper
loadings onto the resin
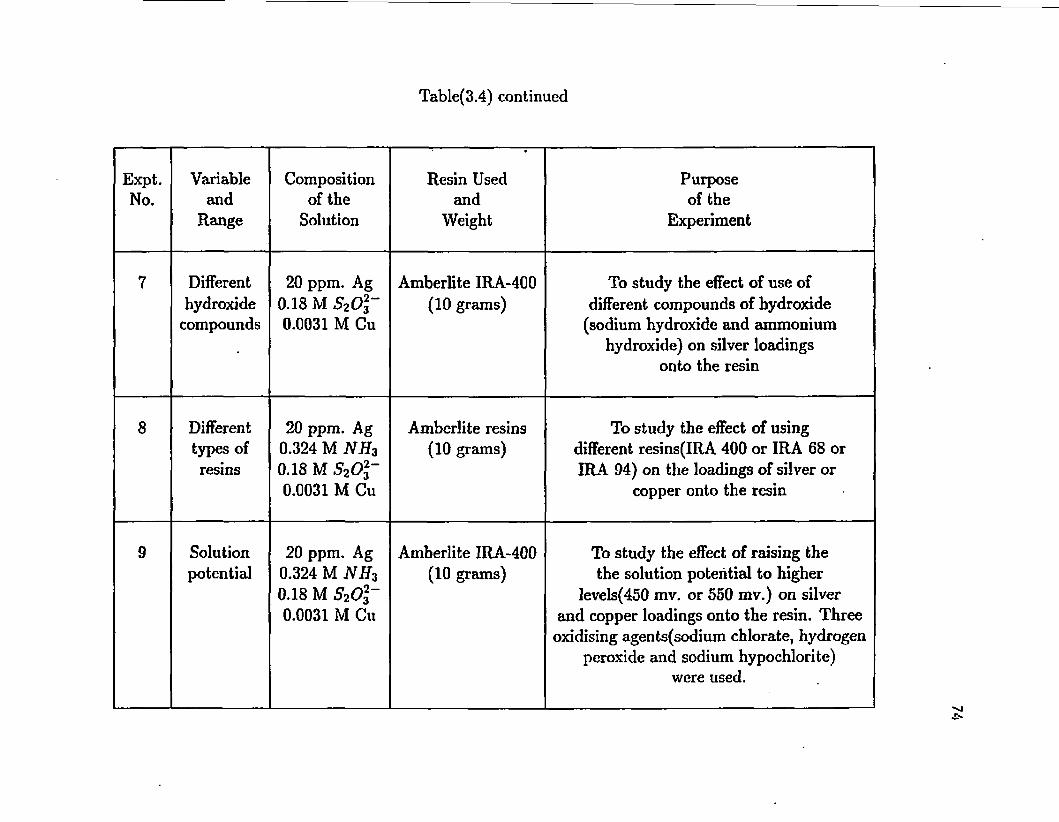
Table(3.4) continued
Expt. No.
Variable and
Range
Composition of the
Solution
Resin Used and
Weight
Purpose of the
Experiment
7 Different hydroxide
compounds
20 ppm. Ag 0.18 M S20\~
0.0031 M Cu
Amberlite IRA-400 (10 grams)
To study the effect of use of different compounds of hydroxide
(sodium hydroxide and ammonium hydroxide) on silver loadings
onto the resin
8 Different types of resins
20 ppm. Ag 0.324 M NH3
0.18 M S20\-
0.0031 M Cu
Amberlite resins (10 grams)
To study the effect of using different resins(IRA 400 or IRA 68 or IRA 94) on the loadings of silver or
copper onto the resin
9 Solution potential
20 ppm. Ag 0.324 M NH3
0.18 M S2Ol~
0.0031 M Cu
Amberlite IRA-400 (10 grams)
To study the effect of raising the the solution potential to higher
levels(450 mv. or 550 mv.) on silver and copper loadings onto the resin. Three
oxidising agents(sodium chlorate, hydrogen peroxide and sodium hypochlorite)
were used.
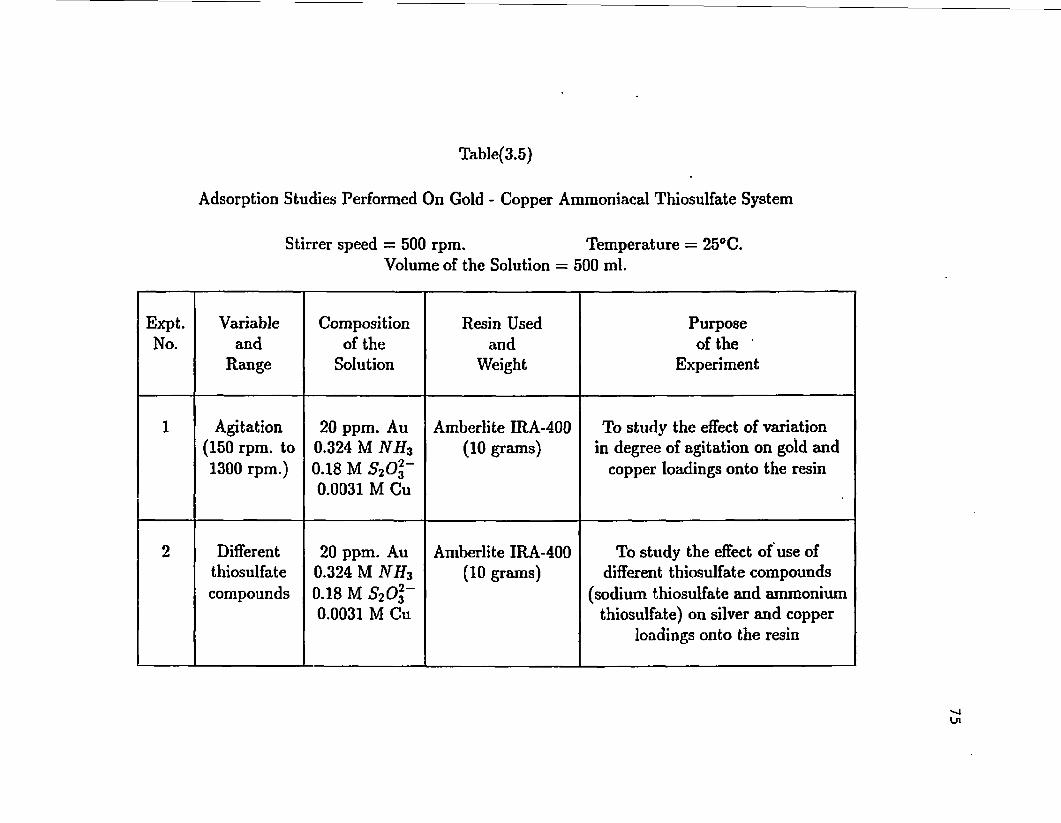
Table(3.5)
Adsorption Studies Performed On Gold - Copper Ammoniacal Thiosulfate System
Stirrer speed = 500 rpm. Temperature = 25°C. Volume of the Solution = 500 ml.
Expt. No.
Variable and
Range
Composition of the
Solution
Resin Used and
Weight
Purpose of the "
Experiment
1 Agitation (150 rpm. to 1300 rpm.)
20 ppm. Au 0.324 M NH3
0.18 M S2Ol~
0.0031 M Cu
Amberlite IRA-400 (10 grams)
To study the effect of variation in degree of agitation on gold and
copper loadings onto the resin
2 Different thiosulfate compounds
20 ppm. Au 0.324 M NHZ
0.18 M S20\-
0.0031 M Cu
Amberlite IRA-400 (10 grams)
To study the effect of use of different thiosulfate compounds
(sodium thiosulfate and ammonium thiosulfate) on silver and copper
loadings onto the resin
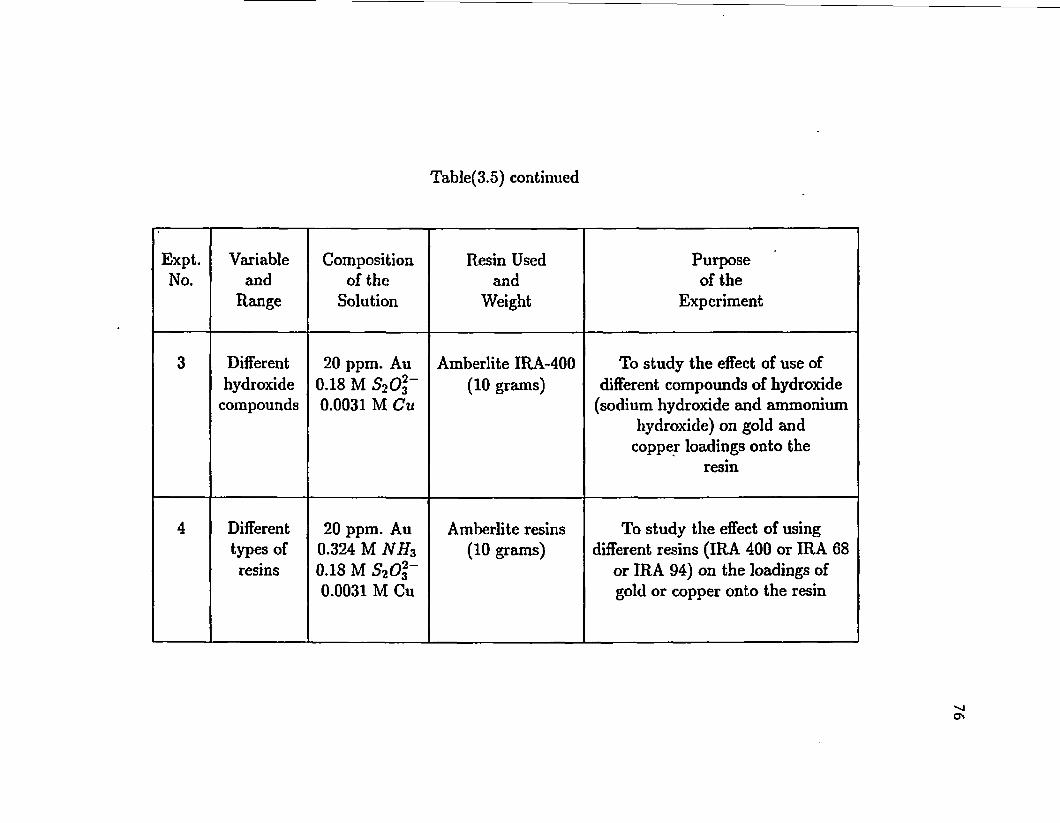
Table(3.5) continued
Expt. Variable Composition Resin Used Purpose No. and of the and of the
Range Solution Weight Experiment
3 Different 20 ppm. Au Amberlite IRA-400 To study the effect of use of hydroxide 0.18 M S20\~ (10 grams) different compounds of hydroxide
compounds 0.0031 M Cu (sodium hydroxide and ammonium hydroxide) on gold and
copper loadings onto the resm
4 Different 20 ppm. Au Amberlite resins To study the effect of using types of 0.324 M NH3 (10 grams) different resins (IRA 400 or IRA 68 resins 0.18 M S2Ol~ or IRA 94) on the loadings of
0.0031 M Cu gold or copper onto the resin

Table{3.6)
Desorption Studies Performed On Amberlite IRA 400 And Amberlite IRA 68 With Respect To Silver - Copper Ammoniacal Thiosulfate System
Stirrer speed = 500 rpm. Temperature = 25°C. Volume of the Solution = 500 ml.
Expt. No.
Resin Used and
Weight
Composition of the
Solution
Regenerant Used
Purpose of the
Experiment 1 Amberlite
IRA 400 (10 grams)
A. Loading phase 20 ppm. Ag
0.324 M NHZ
0.18 M S2Oj-
0.0031 M Cu
B. Elution phase S20\~ solution
a) 0.90 M S20\~
b) 1.80 M S2Ol~
c) 2.70 M S2Ol~
To study the elution characteristics of the resin with respect to silver
and copper
•
2 Amberlite IRA 68
(10 grams)
A. Loading phase 20 ppm. Ag
0.324 M NHZ
0.18 M S20\~
0.0031 M Cu
B. Elution phase S20%~ solution
a) 0.90 M S20\~
b) 1.80 M S20\~
c) 2.70 M S2Ol~
To study the elution characteristics of the resin with respect to silver
and copper

Table(3.7)
Desorption Studies Performed On Amberlite IRA 400 And Amberlite IRA 68 With Respect To Gold - Copper Ammoniacal Thiosulfate System
Stirrer speed = 500 rpm. Temperature = 25° C. Volume of the Solution = 500 ml.
Expt. No.
Resin Used and
Weight
Composition of the
Solution
Regenerant Used
Purpose of the
Experiment 1 Amberlite
IRA 400 (10 grams)
A. Loading phase 20 ppm. Au
0.324 M NHZ
0.18 M S2Oj~
0.0031 M Cu
B. Elution phase S2Ol~ solution
a) 0.90 M S20\~
b) 1.80 M S2Ol~
c) 2.70 M S2Ol~
To study the elution characteristics of the resin with respect to gold
and copper
2 Amberlite IRA 68
(10 grams)
A. Loading phase 20 ppm. Au
0.324 M NH3
0.18 M S2Ol~
0.0031 M Cu
B. Elution phase S20%~ solution
a) 0.90 M S2Ol~
h.) 1.80 M S20\~
c) 2.70 M S2Oj~
To study the elution characteristics of the resin with respect to gold
and copper
79
ammoniacal thiosulfate solution containing 20 ppm; silver, 0.18 M
thiosulfate and 0.324 M ammonia. Then, the resin was filtered from the
solution and washed with deionized water to remove any physically
adsorbed silver and was put back in a solution containing 0,0031 M
copper, 0.18 M thiosulfate and 0.324 M ammonia. The experiment was done
at room temperature with 500 rpra. degree of agitation.
When sodium hypochlorite was used to increase the solution
potential of ammoniacal thiosulfate system containing silver and copper,
about 150 ml. and 350 ml. of 5.25 wt.% strength were required to get the
system to 450 mv. and 550 mv. respectively.
Desorption studies were done on the IRA-400 and IRA-68 resins.
The elution characteristics of IRA-94 resin were not studied as many
difficulties ware encountered in pipetting out the sample solutions
because of the size of the resin beads and the high density of the
thiosulfate solution used as regenerant. During each loading run, 10
gms. of resin was contacted with a solution containing 20 ppm. gold or
silver, 0.0031 M copper, 0.324 M ammonia and 0,18 M thiosulfate. Three
strengths of ammonium thiosulfate solution (0.90 M, 1.8 M and 2.7 M
thiosulfate) were used in the elution phase. The experiments were
performed according to the general procedure given earlier in this
chapter for desorption studies (see Section 3.2.2).
80
CHAPTER 4
RESULTS
4.1 Eh-pHfPourbatx^ diagrams:
Measurement of Eh and pH has become a routine procedure in many
branches of science, especially in chemistry and biology. The method of
using Eh and pH as characterizing variables in reactions involving
dissolved species permits the presentation of mineral stability diagrams
in a most convenient form [71}. To understand and characterize the
chemistry of the thiosulfate-ammonia-copper solutions containing gold or
silver, it was first decided to construct several Eh-pH diagrams. These
diagrams were constructed for different concentrations of thiosulfate
O J, (S2O3 ) , copper (Cu) and ammonia/ammonium (NH3/NH4 ) at fixed
concentrations of gold and silver. The concentrations of gold and silver
in copper-containing ammoniacal thiosulfate solutions of interest are
usually very low (in range of 10 ppra. to 40 ppm.). Hence, the variation
in their concentration should not make much difference on the chemistry
of the leach system. The thermodynamic data used for the various silver,
gold and copper species expected to be present in these systems are
tabulated in Tables 4.1-4.3 [71-79]. Table 4.4 summarizes the range of
concentrations for which these diagrams have been constructed and are
presented in weight percent, molarity and parts per million (ppm). The
Pourbaix diagrams were constructed with the use of a computer program
[80]. In the construction of these diagrams, an Eh range of -0.2 to 1.2
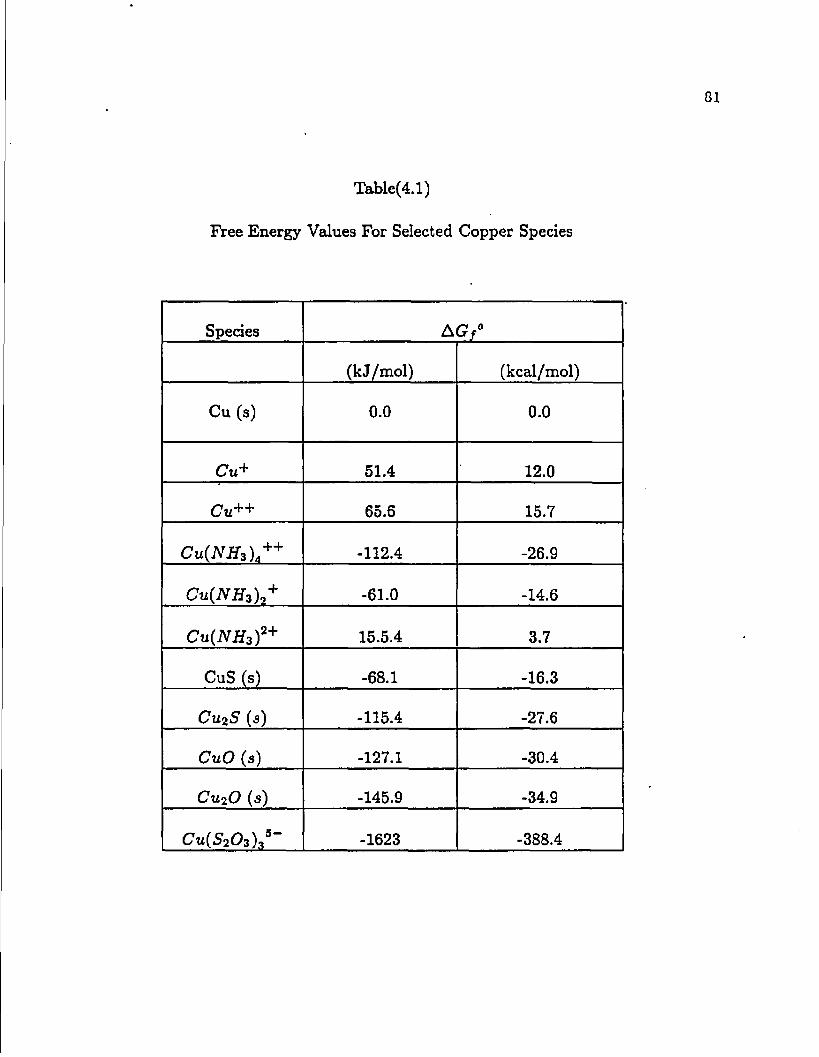
Table(4.1)
Free Energy Values For Selected Copper Species
Species A CV
(kJ/mol) (kcal/mol)
Cu (s) 0.0 0.0
Cu+ 51.4 12.0
Cu++ 65.6 15.7
CU(NH3 )++ -112.4 -26.9
Cu{NH3 ) + -61.0 -14.6
CU(NH3 )2 + 15.5.4 3.7
CuS (s) -68.1 -16.3
CU^S (5) -115.4 -27.6
CuO ( S ) -127.1 -30.4
CUIO (S) -145.9 -34.9
Cu(S203),s" -1623 -388.4

Table(4.2)
Free Energy Values For Selected Silver Species
Species AG/0
(k J/mol) (kcal/mol)
Ag (s) 0.0 0.0
Ag+ 77.0 18.4
Ag 2S (5) -74.4 -17.8
Ag 20 (s) -10.7 -2.5
AgO+ 229.9 55.0
Ag(0H) 9 - -263.4 -63.0
Ag(NH 3 ) ,+ -17.4 1 to
Ag(S 2Os)~ -504.1 -121.3
Ag(S 20z) 73 -1063.0 -254.2
Ag(S 20 3 ) , 5~ -1599.0 -382.6
Ag 2{S 20*\A - -1451.0 -374.0
Ag${S 2Oz)z -2396.0 -573.2
Ags(S 2Oz)^Q -3865.0 -924.6

Table(4.3)
Free Energy Values For Selected Gold Species
Species A G f °
(kJ/raol) (kcal/mol)
Au (s) 0.0 0.0
Au+ -163.0 39.0
Au+3 433.1 103.6
A112S (s) 200.7 48.0
AU2OZ {$) 163.0 39.0
HAuO\" -115.4 -27.6
H-iAuO$~ -191.5 -45.8
HzAuOz -258.4 -61.8
AuOz z~ -24.2 -5.8
Au{OH)^s) -289.7 -69.3
Au(NH z ) + -41.1 -9.8
Au(Si0 3 ) , S - -1048 -250.8
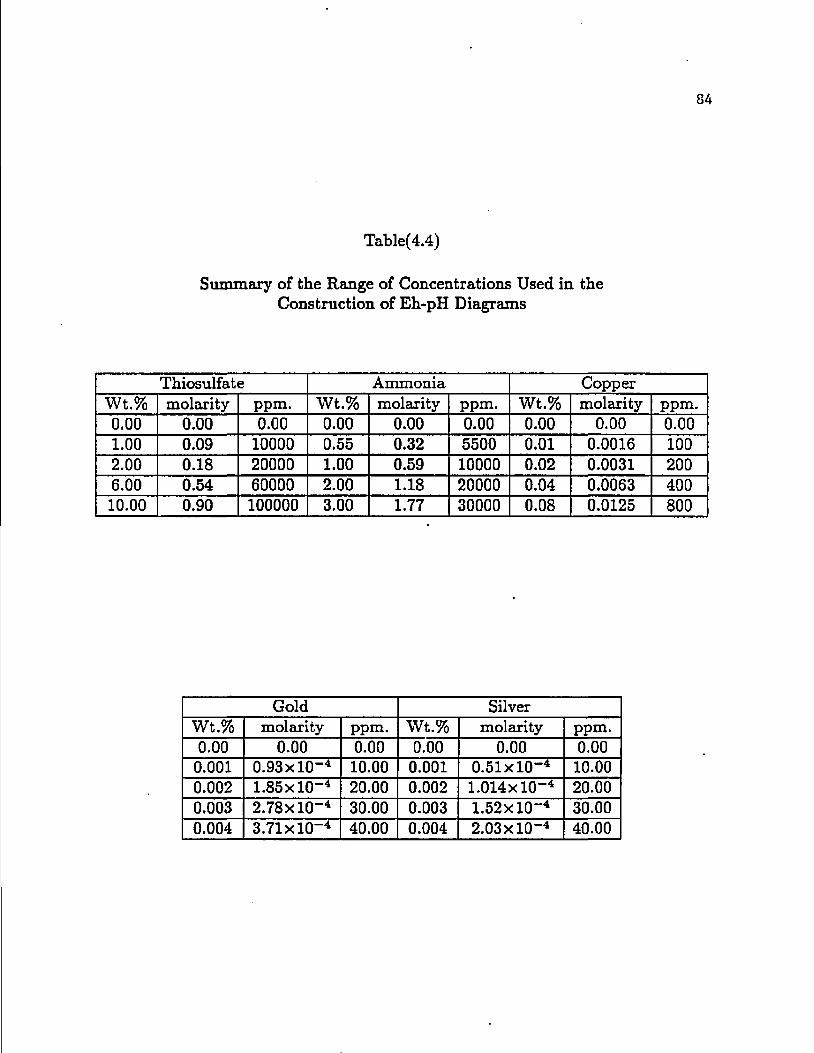
84
Table(4.4)
Summary of the Range of Concentrations Used in the Construction of Eh-pH Diagrams
Thiosulfate Ammonia Copper Wt.% molarity ppm. Wt.% molarity ppm. Wt.% molarity ppm. 0.00 0.00 0.00 0.00 0.00 0.00 0.00 0.00 0.00 1.00 0.09 10000 0.55 0.32 5500 0.01 0.0016 100 2.00 0.18 20000 1.00 0.59 10000 0.02 0.0031 200 6.00 0.54 60000 2.00 1.18 20000 0.04 0.0063 400 10.00 0.90 100000 3.00 1.77 30000 0.08 0.0125 800
Gold Silver Wt.%J molarity ppm. Wt.% molarity ppm. 0.00 0.00 0.00 0.00 0.00 0.00
0.001 0.93xl0~4 10.00 0.001 0.51xl0~4 10.00 0.002 1.85xl0~4 20.00 0.002 l.OHxlO"4 20.00 0.003 2.78xl0~4 30.00 0.003 1.52xl0~4 30.00 0.004 3.71 xl0~4 40.00 0.004 2.03 xl0~4 40.00

85
volts and a pH range of 0 to 14 were considered. However, it should be
mentioned that measurement of Eh and pH values of the lixiviant solution
indicated the Eh values to be in the range 150 mv. to 250 mv. (on
hydrogen scale) depending on the thiosulfate and copper concentrations,
while the pH. value was buffered in the vicinity of pH 10. In the
presence of solid resins, the Eh was found to be less dependent on the
thiosulfate concentration and remained stable around 230 mv. The order
in which these diagrams were constructed along with any pertinent
explanations are given below.
2 _ The Eh-pH diagrams for the CU-S2O3 -H2O system appear in Figure
4.1. These were constructed for two different concentrations of copper
(0.0031 M and 0.0125 M) and three different concentrations of
thiosulfate. The predominant copper species present at all
concentrations of copper and at higher thiosulfate concentrations (0.54
M and 0.90 M) are Cu++, CuO, CuS, C^S and 01(3203)3"*". An additional
species, C^O, is present in the system at the low thiosulfate
concentration (0.18 M). The most stable copper species at a pH of 10 and
an Eh of 230 mv. is the cuprous thiosulfate complex, Cu(S20.j) 3"*".
Changing the thiosulfate concentration from 0.18 M to 0.90 M does not
affect the predominant copper species at the Eh-pH conditions of
ammoniacal thiosulfate solution. However, it can be noted that an
increase in thiosulfate concentration narrows the region of stability of
Cu"*-*", CuS, CU2S and CuO and expands the stability region of ̂ (3203)3"*".
Another important change that can be noted from the Figure 4.1 is the
2+ narrowing of the stability region of cuprous thiosulfate and Cu and

86
1.0
CuO 0.8
i ae 1
0.4
vv
CuS 0.0
-0.2
0 e 10 12 14 2 8 4
(a) pH
1.2
1.0
0.8 CuO
a 0.6 o
W* 0.4
0.2
CuS 0.0
-0.2
PH
Figure 4.1 Eh-pH diagram for the Cu-SjOg -I^O system at different ®2°3 concentrations in the presence of (a) 0.0031 M Cu and (b) 0.0125 M Cu. ( 0.18 M, 0.54 M and 0.90 M)
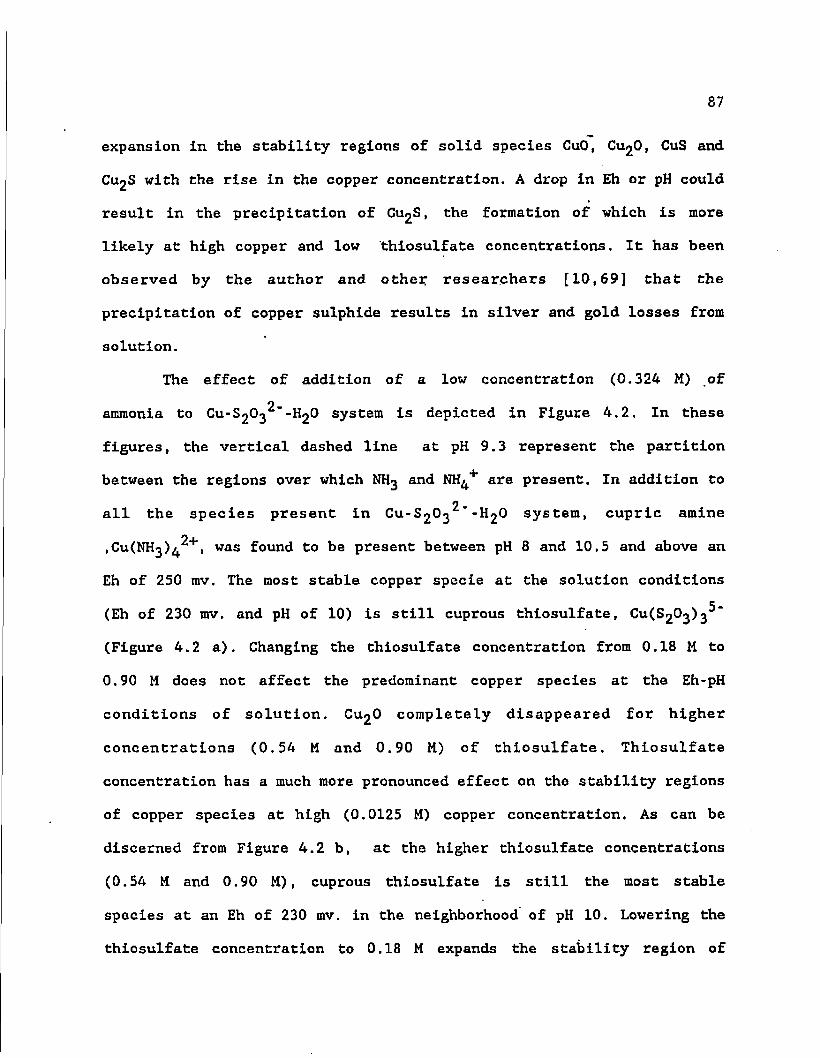
87
expansion in the stability regions of solid species CuO, CujO, CuS and
CU2S with the rise in the copper concentration. A drop in Eh or pH could
result in the precipitation of C^S, the formation of which is more
likely at high copper and low "thiosulfate concentrations. It has been
observed by the author and other researchers [10,69] that the
precipitation of copper sulphide results in silver and gold losses from
solution.
The effect of addition of a low concentration (0.324 M) of
o ammonia to CU-S2O3 -H2O system is depicted in Figure 4.2. In these
figures, the vertical dashed line at pH 9.3 represent the partition
between the regions over which NH3 and NH^+ are present. In addition to
all the species present in CU-S2O3 -H2O system, cupric amine
,Cu(NH3)^ , was found to be present between pH 8 and 10.5 and above an
Eh of 250 rav. The most stable copper specie at the solution conditions
(Eh of 230 rav. and pH of 10) is still cuprous thiosulfate, Cu(S20j)3^"
(Figure 4.2 a). Changing the thiosulfate concentration from 0.18 M to
0.90 M does not affect the predominant copper species at the Eh-pH
conditions of solution. C^O completely disappeared for higher
concentrations (0.54 M and 0.90 M) of thiosulfate. Thiosulfate
concentration has a much more pronounced effect on the stability regions
of copper species at high (0.0125 M) copper concentration. As can be
discerned from Figure 4.2 b, at the higher thiosulfate concentrations
(0.54 M and 0.90 M), cuprous thiosulfate is still the most stable
species at an Eh of 230 mv. in the neighborhood of pH 10. Lowering the
thiosulfate concentration to 0.18 M expands the stability region of

88
HU; .NJl i
\
CufSjOjlj' %
1.2
1.0 CuO
0.8 CuO
0.6
0.4
0.2
CuS 0.0
-0.2
0 2 4 6 8 10 12
(b) pH
Figure 4.2 Eh-pH diagram for the Cu-S203^"-NH3*H20 system at different s2°3 concentrations in the presence of 0.324 M NH3 and (a) 0.0031 M Cu or (b) 0.0125 M Cu. ( 0.18 M, — — 0.54M and 0.90 M)

• . 89
cuprammonium and in fact, for the solution conditions, cuprammonium is
more stable than the cuprous thiosulfate complex. This change in the
nature (anionic or cationic) of the most stable copper complex may have
implications in the selection of ion exchange resins for the selective
recovery of gold and silver from ammoniacal thiosulfate solutions.
Another important change that can be noted from Figures 4.2 is the
expansion in the stability regions of the solid species, particularly
CU2S, with the decrease in the thiosulfate concentration and increase in
the copper concentration. As mentioned earlier, precaution should be
taken to avoid the precipitation of C^S.
Figure 4,3 depicts the regions of stability for aqueous copper
species and solid copper compounds as a function of Eh and pH at a high
ammonia concentration (1.765 M). An important observation to be made is
2+ that an additional copper species, Cu(NH-j) , is added to the system
compared to the one with the low ammonia/ammonium concentration. This
species is present in the pH range of 5 to 6 and above Eh values of 0.85
o 1 volts. The stability region of Cu(NH3> becomes smaller with the rise
in copper concentration and disappears completely for high copper
concentration (0.0125 M). The most stable copper species at a pH of 10
2+ and an Eh of 230 mv. is the cuprammonium complex, C^NHg)^ , Changing
the thiosulfate concentration from 0.18 M to 0.90 M does not affect the
predominant copper species at the Eh-pH conditions of the experiments.
The precipitation of Cu£S is more of a problem in high ammonia systems
2+ because of the very small separation between the C^NHj)^ and C^S
domains. Comparing Figures 4.2 and 4.3, it can be said that with the

90
NH,
CuO
x
4 1.0
0.8 CuO
i 0.0 o
0.4
0.2 \
CuS
0.0
-0.2
1.2 Nil ,
CuO 1.0
0.8
2 0.6 CuO
»* 0.4
0.2
CuS - s 0.0
Figure 4.3 Eh-pH diagram for the Cu^O^'-NHj-I^O system at different S2O3 * concentrations in the presence of 1.765 M NH3 and (a) 0.0031 M Cu or (b) 0.0125 M Cu. ( 0.18 M, 0.54 M and 0.90 M)

91
increase in ammonia concentration there is a decrease in the stability
c _ regions of CuO and Cu(S20j>3 and also an increase in the region of
stability of CuCNHg)^ . No effect can be seen on the solid copper
94* species and Cu with the rise in the concentration of ammonia.
Figure 4.4 (a) shows the effect of the variation in thiosulfate
2 concentration on the Eh-pH diagrams for the Ag-SjOj -NH3-H2O system at
a silver concentration of 20 ppm. and for an ammonia concentration of
1.765 M. The most stable silver species under the experimental
0. _
conditions (pH 10, Eh 230 mv.) is Ag(S20-j>2 . Depending on the
thiosulfate concentration, pure silver can form in the neighborhood of
pH 12. Silver sulphide precipitation is not likely to be a problem at pH
10 unless the solution conditions become reducing in nature. In the Au-
o S2O3 -NH3-H2O system, the gold thiosulfate complex {Au(S203)2 ) is the
more stable species below a pH of about 9.0, while the gold amine
complex (AuCNHj^*) complex predominates in more alkaline conditions. It
is likely that under the typical experimental conditions (pH 10, Eh 230
mv.) the two species may coexist in solution. An important observation
to be noted from Figure 4.4 is that a variation in thiosulfate
concentration, in the range of interest for this research, has a very
negligible effect on the stability of both silver and gold complexes.
Silver was found not to form any complexes with ammonia as can be
seen from Figure 4.4 (a). Hence, it can be concluded that variation in
ammonia/ammonium concentration should not have any effect on the silver
system. Figures 4.4 (b) and 4.5 illustrate the effect of variation in
thiosulfate and ammonia concentrations on the gold system. Formation of
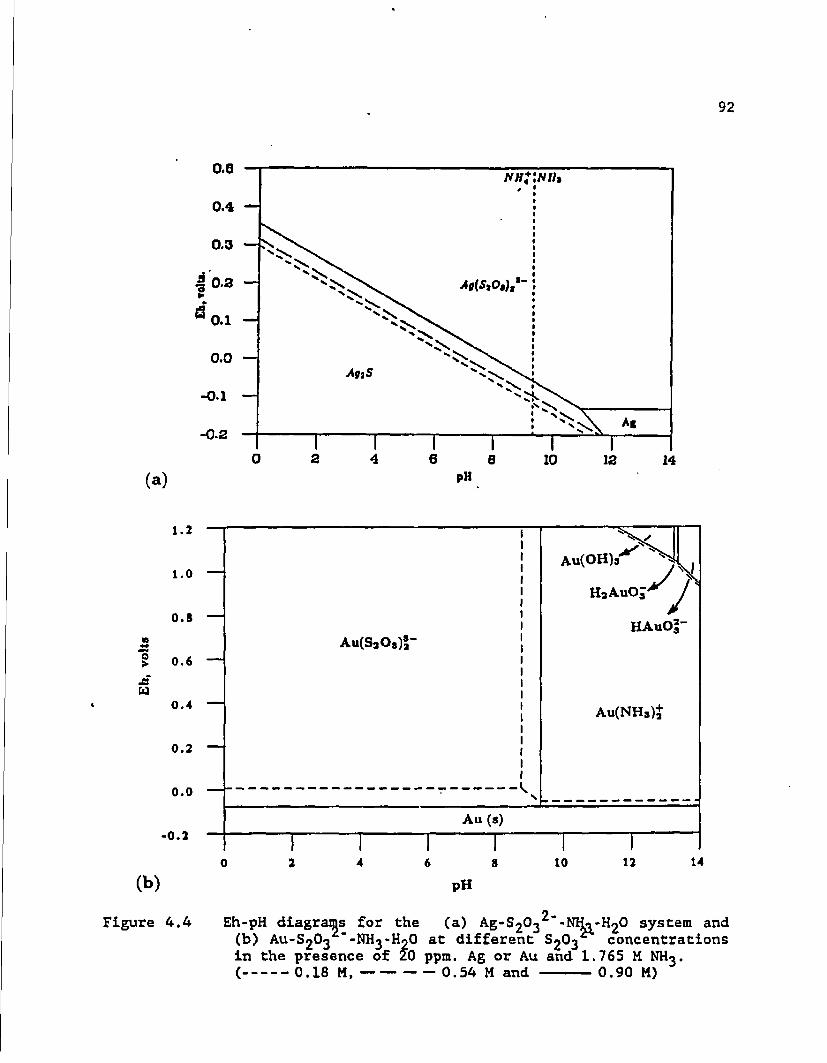
92
0.6
(a)
AG{S*09)M
-b m
1 .2
1 . 0 —
0 . 8 —
g 0 .6
0.4 —
0.2 —
0 . 0 — '
-0.2
(b)
Figure 4.4
Au(SaO»)2-
Au (s)
1 0 2 4 6 8
PH
Au(OH)3
HaAuO* J
10
Eh-pH diagrams for the (a) Ag-S203 -NE3-H2O system and (b) AU-S2O3 -NHj-HaO at different S2O3 concentrations in the presence of 20 ppm. Ag or Au and 1.765 K NH3. ( 0.18 M, 0.54 M and 0.90 M)
HAuO| 2-
AU(NHJ)J
12 14

93
1.2
Au(OH)s
1.0 — HAAUOJ ~
l\ • \\ vr
r 0.8 — HAuOj"
Au(SaOs)|" 0.6 —
0.4 — AU(NH3)J
0.2 —
L 0.0 \ \
Au (s)
1 1 1 1 1 1 0 2 4 6 8 10 12 14
ph
p „ Figure 4.5 Eh-pH diagram for the Au-SjO^ -NH^-HjO system at different
NHj concentrations in the presence of 20 ppm. Au and 0.18 M
( 0.324 M and 1.765 M)
94
pure gold is not likely to be a problem at pH 10 unless the solution
conditions become reducing in nature.
2_ Composite pourbiax diagrams for the systems Ag-Cu-S20j -NH3-H2O
and Au-Cu-S20-j^"-NH3-H20 with 0.0031 M Cu, 0.18 M thiosulfate and two
different concentrations of ammonia (0.324 M and 1.765 M) are shown in
Figures 4.6 and 4.7. These figures are obtained by superimposing the
diagrams for copper and silver systems and those for copper and gold
systems.
4.2 Experimental Results;
Adsorption and desorption studies were done to examine the
selective recovery of gold and silver from ammoniacal thiosulfate
solutions [see Chapter 3]. They proved to be of very valuable interest
in this search for best ion exchange resin and physicochemical
conditions for the recovery of gold and silver from the ammoniacal
thiosulfate solutions containing copper. Most of the adsorption studies
were done using Amberlite IRA-400, as it was found to have good
extraction capacities by previous workers [7,58]. Two other resins,
Amberlite IRA-68 and Amberllte IRA-94, were also used to study the
effect of basicity and structure of the resin on loading and elution
characteristics of gold and silver. All the experiments were done at
ambient temperature and atmospheric pressure. The results are presented
below for silver - copper and gold-copper systems. Adsorption (loading)
densities are reported in units of both gm.metal/gm.resin and mmoles
metal/gm. resin.
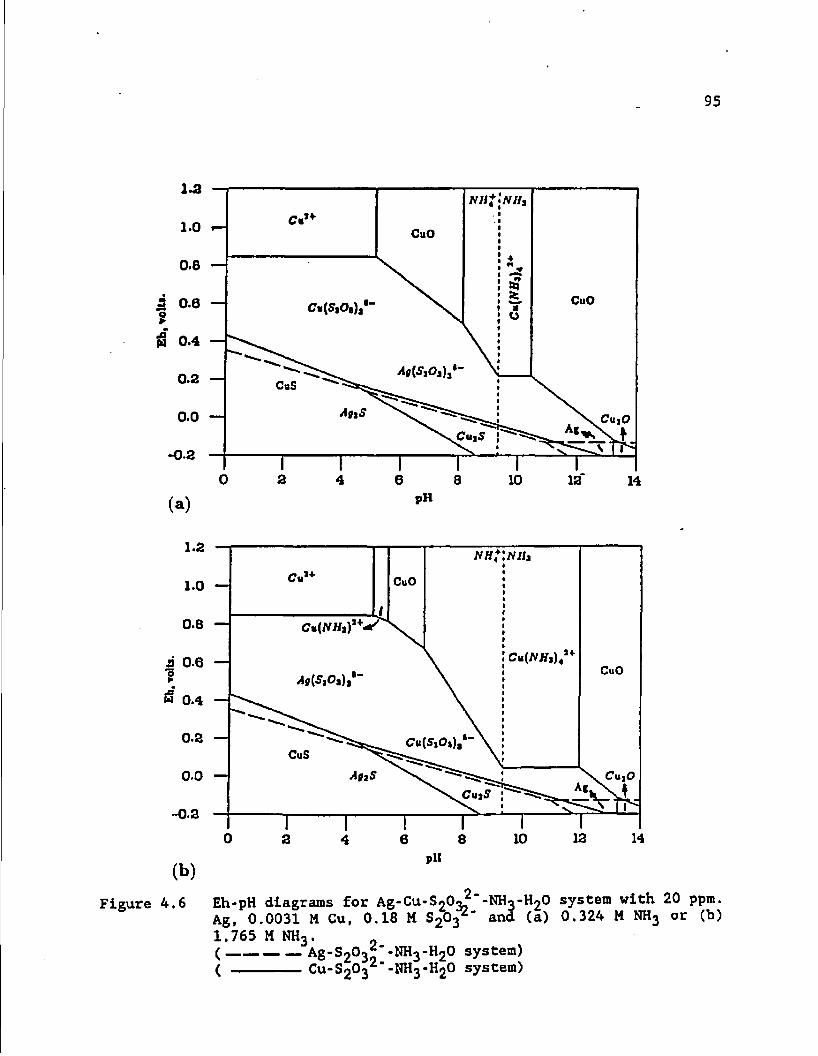
95
c«.(s,o,),'
vi,(5,oa),
Figure 4.6
Cu[NH»y^
CU{NH,)4 a 0.0 — ^ir(5)0s),
W 0.4 —
CU(STOI)*
Eh-pH diagrams for Ag-Cu-S20j? -NH3-H2O system with 20 ppm. Ag, 0.0031 M Cu, 0.18 M S20;j " and (a) 0.324 M NH3 or (b)
1.765 M NH3. ( AG-S203^"-NHj-H20 system)
( CU-S2O3 -NH3-H2O system)
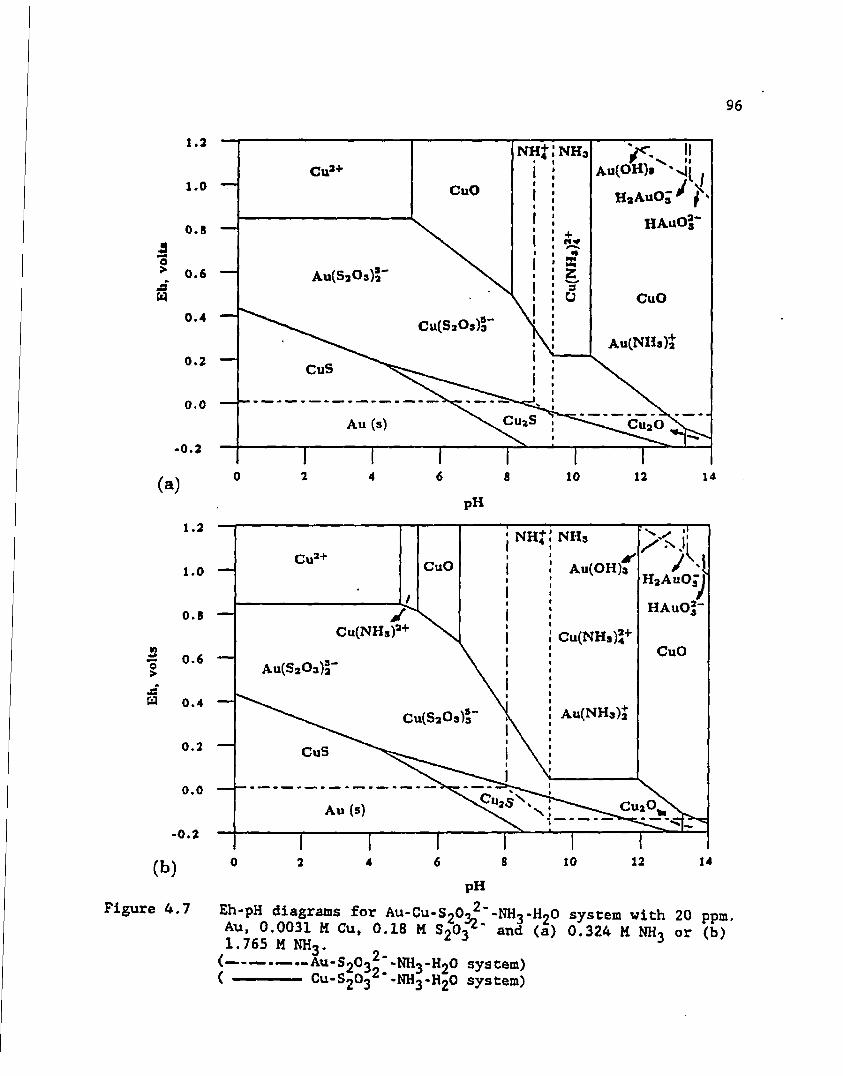
96
1 .2 NH|
1.0 CuO
0.8
0.6
CuO
0.4
0.2 CuS
0.0 Au (s)
-0.2
6 2 4 0 8 10 12 14
ph
. 2 NHt NHs
CuO 0
CuO 0.6
0.4 AU(NH3);
0.2 CuS
0.0 Au (s)
-0.2
14 6 12 8 10 0 4 2
PH
Figure 4.7 Eh-pH diagrams for Au-Cu-SjO,2"-NH3-HoO system with 20 ppm.
Au, 0.0031 M CM, 0.18 M S20{2' and (a) 0.324 M NH, or (b) 1.765 M NH3. 3
Au-S203^ -NH3-H2O system) ( • •' CU-S2O3 "-NH3-H2O system)
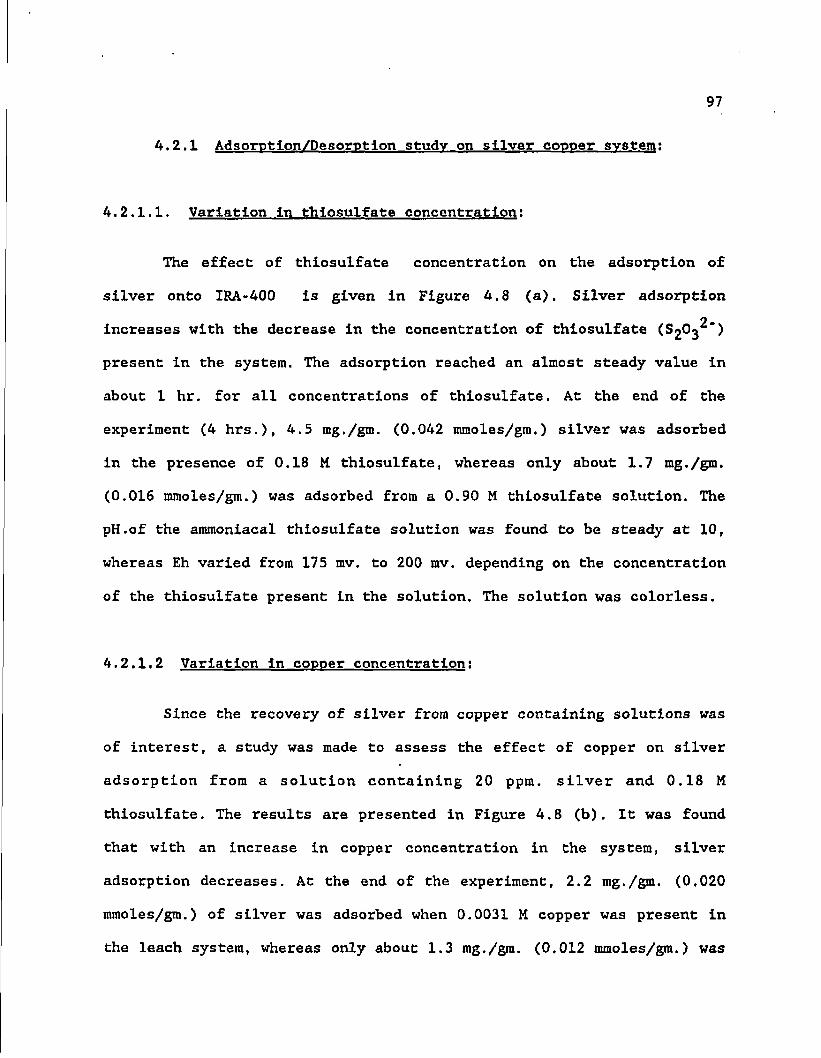
97
4.2.1 Adsorption/Desorptlon study on silver copper system:
4.2.1.1. Variation In thiosulfate concentration;
The effect of thiosulfate concentration on the adsorption of
silver onto IRA-400 is given in Figure 4.8 (a). Silver adsorption
o. increases with the decrease in the concentration of thiosulfate (SjO^ )
present in the system. The adsorption reached an almost steady value in
about 1 hr. for all concentrations of thiosulfate. At the end of the
experiment (4 hrs.), 4.5 mg./gm. (0.042 mmoles/gra.) silver was adsorbed
in the presence of 0.18 M thiosulfate, whereas only about 1.7 mg./gm.
(0.016 mmoles/gra.) was adsorbed from a 0.90 M thiosulfate solution. The
pH.of the ammoniacal thiosulfate solution was found to be steady at 10,
whereas Eh varied from 175 mv. to 200 rav. depending on the concentration
of the thiosulfate present in the solution. The solution was colorless.
4.2.1.2 Variation In copper concentration;
Since the recovery of silver from copper containing solutions was
of interest, a study was made to assess the effect of copper on silver
adsorption from a solution containing 20 ppm. silver and 0.18 M
thiosulfate. The results are presented in Figure 4.8 (b). It was found
that with an increase in copper concentration in the system, silver
adsorption decreases. At the end of the experiment, 2.2 mg./gm. (0,020
mmoles/gm.) of silver was adsorbed when 0.0031 M copper was present in
the leach system, whereas only about 1.3 mg./gm. (0.012 mmoles/gm.) was
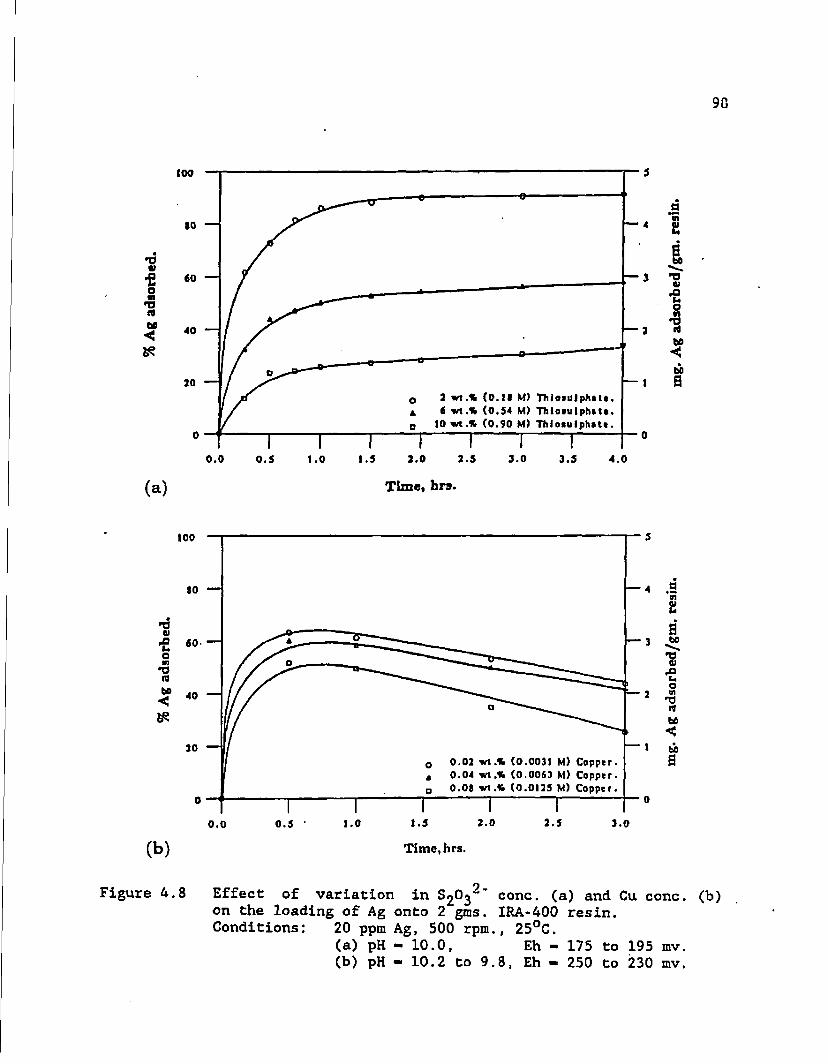
q 2 wt.% (0.11 M) ThioiuJphtlt. 4 6 wt.% (0.54 M) Thloaulphttt. D 10 wt.% (0.90 M) Thiotulphtlt.
0.0 0.5 1.0 1.5 2.0 2.5 3.0 3.5 4.0
(a) Time, bra.
too
•o v •£ o » •o (0 bo < is
(b)
0.02 wt.% (0.0031 M) Copper. 0.04 wt.% (0.0063 M) Copper. 0.08 wt.% (0.0123 M) Copper
Time, hrs.
Figure 4.8 Effect of variation in 8203^" conc. (a) and Cu conc. on the loading of Ag onto 2 gms. IRA-400 resin. Conditions: 20 ppm Ag, 500 rpm., 25°C.
(a) pH - 10.0, Eh - 175 to 195 mv. (b) pH - 10.2 to 9.8, Eh - 250 to 230 mv.

99
adsorbed with 0.0125 M copper present in the leach system. The pH was
found to be initially at 10.2 and then decreased to 9.8 by the end of
the experiment. Similarly, Eh decreased from 250 mv. to around 230 mv. A
light blue color characteristic of copper (II) was present throughout
the experiment. The intensity of. color increased with the increase in
percentage of copper present in the system.
The silver adsorption shows an initial increase but decreases
after 30 min. for all concentrations of copper present in the leach
system. This may be due to the competition of copper thiosulfate ions
with silver thiosulfate ions for the active sites on the resin. To check
this, an experiment was done by initially loading the resin with silver
from a 0.18 M thiosulfate solution containing 20 ppm. silver, but no
copper, and having Eh and pH of 195 mv. and 10, respectively. The resin
was then filtered, washed with deionized water to remove any physically
adsorbed material and put back into a solution containing 0.0031 M
copper but no silver. The Eh and pH values of the copper containing
solution were 230 mv. and 9.8, respectively. The analysis of the
solution at regular intervals is shown in Figure 4.9. About 0.95 mg./gm.
(0.009 mmoles/gm.) of silver was adsorbed without copper present in the
system. Approximately 0.5 mg. (0.005 milliraoles) of this loaded silver
was desorbed (eluted) when placed in a solution containing copper and
thiosulfate. At the same time, nearly 5.75 mg./gra.(0.091 mmoles/gm.) of
copper was loaded onto the resin at the end of the experiment. There
exist roughly a 10:1 stoichiometric ratio between copper adsorbed and
silver desorbed. Copper loading reached a maximum of 6.7 mg./gm.(0.105
100
m 01
•d 01 •a o n •a <• m < bo 0
A| tdioibfd.in initial I hr. A{ dooibed In Utt 2,hr. Cu tdtoibcd In Uit 2 hr.
0.0 3.0
Time,hrs.
Figure 4.9 Desorption of Ag loaded onto 6 gins. IRA-400 resin by an amraoniacal thiosulfate solution containing Cu. Conditions: 500 rpm., 25°C.
(I) pH - 10.0, Eh - 195 mv. (II) pH - 10.0, Eh - 230 mv.

101
mmoles/gm.) before decreasing to 5.75 mg./gm.(0.091 mmoles/gm.) by the
end of 3 hrs. This slight desorption of copper m&y be due to the
replacement of cuprous thiosulfate ions by the thiosulfate or
tetrathionate ions.
4.2.1.3. Variation In stirring speed:
Figures 4.10 a,b give the effect of variation in the stirring
speed on the loading of silver and copper onto the resin. At the end of
the experiment (60 mln.) about 0.94 nig. (0.0087 milliraoles), 0.91 mg.
(0.0084 millimoles) and 0.82 mg. (0.0076 milliraoles) of silver and 6.55
mg. (0.103 millimoles), 5.3 mg. (0.083 millimoles) and 3.9 mg. (0.061
millimoles) of copper were adsorbed per gram of resin at stirring speeds
150, 500 and 1300 rpm. respectively. Loading of both silver and copper
was lowest at a stirring speed of 1300 rpm. Variation in stirring was
found to have no effect on the pH, Eh and color of the leach solution.
In all cases of stirring, the leach solution had a blue color, pH and Eh
around 10 and 230 mv. respectively.
4.2.1.4. Variation in ammonia concentration:
The results of experiments conducted to study the effect of
ammonia on copper and silver loading onto IRA-400 are shown in Figure
4.11. At the end of the experiment, about 2,12 mg./gm.(0.021 mmoles/gm.)
and 2.40 mg./gm.(0.024 mmoles/gm.) of silver was adsorbed in the
amraoniacal thiosulfate systems with 0.324 M and 1.765 M ammonia
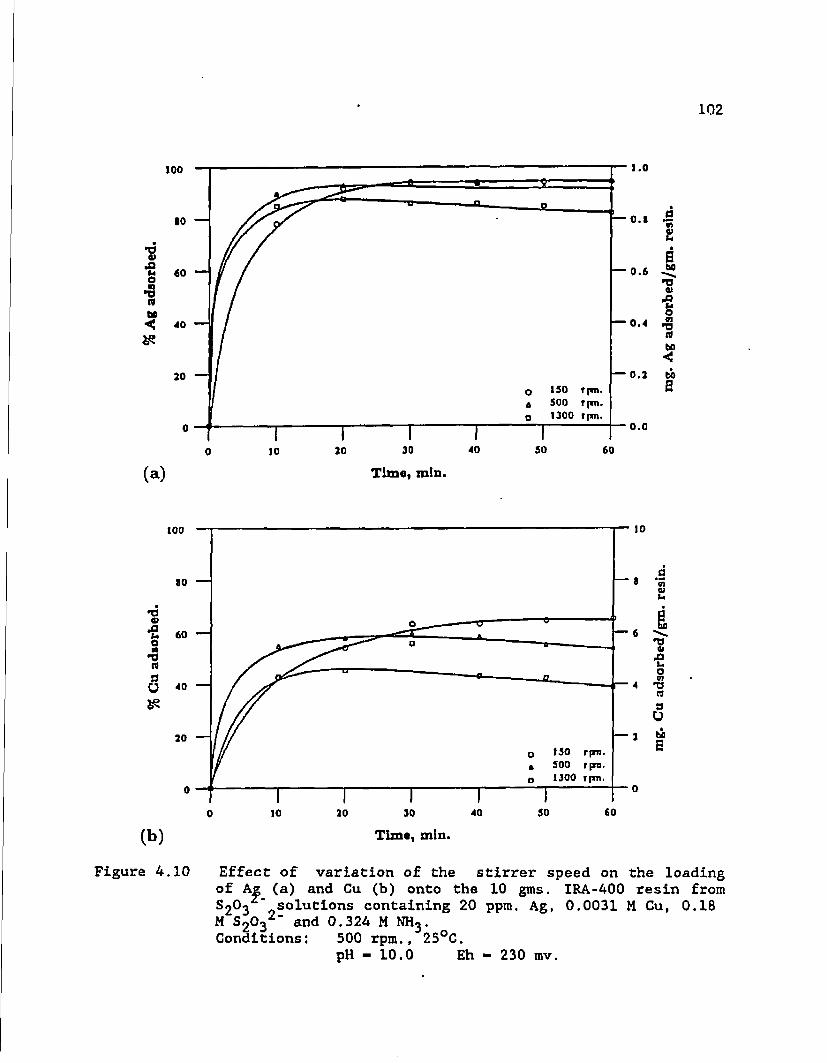
102
100
•o 0) •s e n T3 n be < is
to
60 —
40
20 —
(a) Time, mm.
i.o
— O.i
— 0.6
— 0.4
— o.i o ISO f [TO. t 500 tpro. a 1300 rpm.
0.0
40 50 60
100
tj Of
•s o m nj id
80 —
60 —
(3 40 —
is
20
(b)
1300 ff*n
Time, min.
Figure 4.10 Effect of variation of the stirrer speed on the loading of Ag (a) and Cu (b) onto the 10 gms. IRA-400 resin from S2°3 "0soluti°ns containing 20 ppm. Ag, 0,0031 M Cu, 0.18 M S2032' and 0.324 M NHj. Conditions: 500 rpm., 25°C.
pH - 10.0 Eh - 230 mv.
Figure 4.11 Effect of variation in NHj concentration on the loading of Ag (a) and Cu (b) onto 6 gms. IRA-400 resin from S2O3" solutions containing 20 ppm. Ag, 0.0031 M Cu and 0.18 M s2°3 • Conditions: 500 rpm., 25°C.
pH - 10.1 (with 0.324 M ammonia). 10.5 (with 1.765 M ammonia).
Eh - 240 rav.

09 c
fl>
% Cu adsorbed.
Ok o
s
w 0
1 o m
to O
HiMi
O t-*
M»
w c > (b
rort w o
• h*
rt
o 3
P> o
» ̂ h)
o o 3
rt
P>
p- (5
_ i-»
? h-
h- c p
3
ft
g o* o 3
cm n> 2
° rt
-•«
°
•g ci
>
00 co
o
o
u) 5
i •c* o
o u> n o a n cd 3
rt
»-t 0> rt
h o
» s a
to
o h- o
p 3 p
§ i??
5-1 •
° w o
" 61
~ o a
"w
h-j.
rod
s
"(m
9
a o# 0
M*
b
i—n
r «"
m w
m o
us
mg. Cu adsorbed/gm. res
jn.
P,
% A
g ad
sorb
ed.
m *
oi
m 5
o
o
e
o
o
°
o
s w*
a
o
©
•jl
o
u
mg. Ag adsorbed/gm. res
in.

104
respectively. In the case of copper, about 6.47 mg./gm. (0.1018
mmoles/gm.) and 8.62 mg./gm.(0.1357 mmoles/gm.) were adsorbed from the
leach systems in these two cases. Both for silver and copper, an
increasing trend in amount adsorbed with time was noticed and reached a
steady value after about 30 min. The pH of the solution was around 10.1
and 10.5 for the leach solution with 0.324 M and 1.765 M ammonia
respectively. The Eh was around 240 mv. and was found not to be affected
by variation in ammonia concentration. The intensity of the blue color
was found to increase slightly by the increase in the ammonia
concentration.
4.2.1.5. Variation In the initial concentration of silver;
From Figure 4.12, it is quite obvious that the percent silver
adsorbed increased with an increase in the initial silver concentration
in solution. There was nearly a four-fold increase in silver loading,
from 0.68 mg. to 2.62 mg. , by Amberlite IRA-400 resin when the silver
concentration was increased from 10 ppm. to 40 ppm. The Eh, pH and color
of the leach solution were not effected by the variation in the initial
concentration of the silver. Eh was around 240 mv. and pH around 10.2.
The color was initially dark blue and after sometime the intensity
slightly decreased.
4.2.1.6. Use of sodium thlosulfate as the source of thlosulfate:
Figures 4.13 a,b show the effect of using sodium thlosulfate

105
3.0
T 30
Time, mln.
T 40
O 10 pim. a 20 p|m. q 40 pjm-
SO 60
Figure 4.12 Effect of variation in initial silver concentration on the loading of Ag onto 6 gms. IRA-400 resin. Conditions: 500 rpm., 25QC.
pH - 10.2, Eh - 240 mv.
o . Figure 4.13 Effect of using different compounds of S2O3 on the
loading of Ag (a) and Cu (b) onto 10 gms. IRA-400 resin from solutions containing 20 ppm. Ag, 0.0031 M Cu and 0.324 M NH3. Conditions: 500 rpm., 25QC.
pH - 10.0 with (NH4)2S203.
11.8 with Na2S20^.5H2O. Eh - 255 mv. with (NH^r^Oj.
350 to 260 mv. witn Na2S203.5H20.
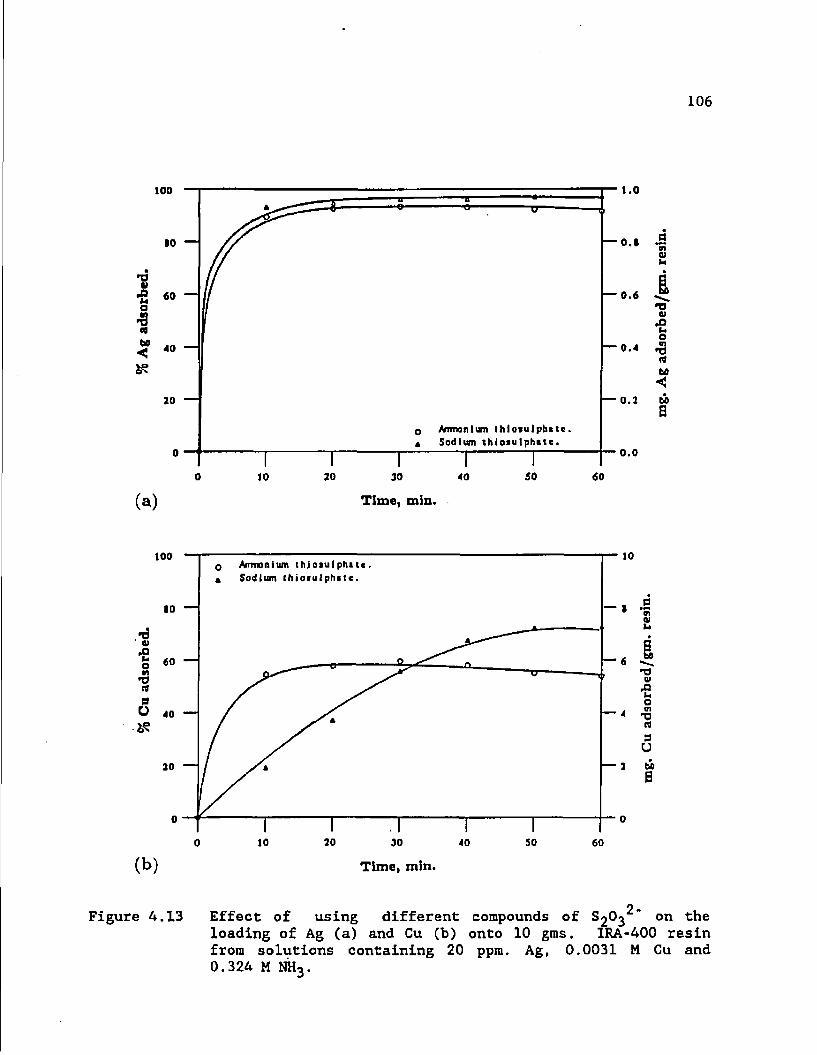
106
too
»
•fi o •8 n to < fi?
10 —
60 —
40 —
jo —
0 Arnnonlvm thiotulphite. « Sodium thiotulphite.
10 T 30
1.0
O.t tn u
— 0.6 60
— 0.4
— 0 . 1
•o 01 •e o o» 73 rt 60 < bo a
0.0
(a)
30 40
Time, mill.
50 60
100 AiTTnonium thiotulphite Sodium thiotulphite.
•d w •b o n 19 0 u is
— 6
— ' *5 v u
•o V
JO u o n T3 id 9 u bb h
(b) Time, min.
Figure 4.13 Effect of using different compounds of S2O3 on the loading of Ag (a) and Cu (b) onto 10 gms. IRA-400 resin from solutions containing 20 ppm. Ag, 0.0031 M Cu and 0.324 M NH3.

107
instead of ammonium thiosulfate on the loading of silver and copper onto
the Amberlite IRA-400 resin. While the pH of the solution was buffered
at about 10.0 with ammonium thlosulfate, the. pH remained fairly steady
at 11.8 for the initial 20 minutes, but then dropped to 10.7 by the end
of the experiment when sodium thlosulfate was used. The Eh was found to
stay steady at around 255 mv. in the system containing ammonium
thlosulfate. However, in the case of sodium thlosulfate, the Eh began at
approximately 360 mv. and decreased to 230 mv. by the end of the
experiment. A light blue color existed throughout the experiment in the
ammonium thlosulfate solution, whereas a change in color from dark blue
to light blue was observed when sodium thlosulfate was present.
There was only a slight increase in silver adsorption as a result
of the use of sodium thlosulfate instead of ammonium thlosulfate. At the
end of 60 min., about 0.91 mg./gm.(0.008 mmoles/gm.) and 0.97
mg./gm.(0.009 mmoles/gm.) of silver were adsorbed from the ammonlacal
ammonium thlosulfate and ammonlacal sodium thlosulfate solutions,
respectively.
Use of sodium thlosulfate had an interesting effect on the copper
loading phenomenon as can be seen from Figure 4.13 (b). With ammonium
thlosulfate, copper adsorption increased until 30 minutes and then a
decrease of about 6 wt.% was noticed by the end of the experiment. In
the case of sodium thlosulfate, the adsorption was less than that for
the case of ammonium thiosulfate for the first 30 minutes, but then
continued to increase during the next 30 minutes reaching about nearly
20 wt,% more than that obtained by using ammonium thiosulfate at the end

108
of the experiment. At the end of the experiment (60 mln.), about 5.4
mg./gm.(0,085 mmoles/gm.) and 7.2 mg./gm. (0.113 mmoles/gm.) of copper
were loaded onto the resin with thiosulfate present as ammonium
thiosulfate and sodium thiosulfate, respectively, in the solution.
4.2.1.7. Use of sodi-um hydroxide to maintain the alkalinity:
Figure 4.14 shows the effect on silver adsorption by using sodium
hydroxide instead of ammonium hydroxide. In this study, the initial
thiosulfate concentration was 0.18 M. The pH of the solution was around
9.75 and 10.25 with the use of 1 ml. of 50 wt.% and 3 ml. of 50 wt.%
sodium hydroxide solutions, respectively. Eh was around 215 mv. and 210
mv. with 1 ml. of 50 wt.% and 3 ml. of 50 wt.% sodium hydroxide
solutions, respectively. In both cases, the color was found to be on
overall milkish though a green color existed for a very short time when
copper sulphate was added to thiosulfate and sodium hydroxide. It was
observed that the silver adsorption decreased with an increase in the
quantity of the sodium hydroxide present in the system. At the end of
the experiment, about 1.85 mg./gm.(0.017 mmoles/gm.) and 1.5 mg./gm.
(0.014 mmoles/gm.) of silver was adsorbed from the leach solution, with
1 ml. of 50 wt.% sodium hydroxide solution and 3 ml. of 50 wt.% sodium
hydroxide solution. In both cases, there was an increase in silver
adsorption for the first 45 minutes and a slight decrease thereafter.
This trend was more obvious in the case of 1 ml. of 50 wt.% of sodium
hydroxide.
From Figures 4.11 and 4.14, it can be noticed that 1.85 mg.

109
too
T3 w •e o n
T3 rt be < tz
o *
t ml. SOwr.ft NiOM tolutloa. 3 ml. SO wt.k NiGU (elation.
10 —
<0 —
40
30 —
— 4
— J
— 3
— 1
.9 *55 E
01 Ji u o a» t3 n bo < w 0
0.0 T
0.5 1.0
Time, min.
1.5 3.0
Figure 4.14 Effect of using NaOH for maintaining the required alkalinity in the solution on the adsorption of Ag by 10 gms. IRA-400 resin from S0O3 solutions containing 20 ppm. Ag, 0,0031 M Cu and 0.18 M S2O3 Conditions: 500 rpm., 25°C.
pH - 9.75 (with 1 ml. NaOH soln.) 10.25 (with 3 ml. NaOH soln.)
Eh - 215 mv. (with 1 ml. NaOH soln.) 210 mv. (with 3 ml. NaOH soln.)
110
(0.017 mmoles), 2.40 mg. (0.024 mmoles), 1.46 (0.014 mmoles) and 2.12
mg. (0.021 mmoles) of silver were adsorbed per gram of resin with 1 ml.
of 50 wt.% sodium hydroxide, 1.765 M ammonia, 3 ml. of 50 wt.% sodium
hydroxide and 0.324 M ammonia present in the ammoniacal thiosulfate
leach solution, respectively. This implies that presence of lower
concentrations of sodium hydroxide or higher concentrations of ammonium
hydroxide or higher concentrations of ammonium hydroxide in the
ammoniacal thiosulphate solutions yield better loadings of silver.
Hence, it is possible to say that ammonia helps loading, whereas
hydroxide hinders it.
4.2.1.8. Use of different types of resins:
The loading capacities for silver and copper of three different
types of resins -- IRA-400, IRA-68 and IRA-94 are shown in Figure 4.15.
Changing the type of resin used was found to have no effect on the
solution conditions such as pH, Eh and color. pH and Eh were around 10.0
and 255 mv. respectively. A moderate to light blue color existed by the
use of any of these three resins. The loading capacity for silver and
•copper followed the order IRA-400 > IRA-68 > IRA-94. The loading
capacity of Amberlite IRA-400 for silver and copper were 0.91
mg./gm. (0.0084 mmoles/gm.) and 5.3 mg./gm. (0.0834 mmoles/gm.),
respectively.
4.2.1.9. Increase of solution potential of the leach system:
An experiment was done to increase the solution potential of the

I l l
100
t? tl •£ o <n t3 « be < 4s
io —
60 —
40 —
30 —
1.0
O.t -S 91 Of U
(a)
o IKA 61. « IRA 94. O IRA 400.
— 0.6
— 0.4
tj 0) •b o an •a (9 60 < U b
Time, mln.
too
t3 a> .a u o *1 a
6 &
to —
60 —
40 —
30 —
o A
a
IRA 6B. IRA 94. IKA 400.
a a
— 6
— 4
— 3
I •o V A U o VI *0 rt 9 o bo 6
(b) 30 30 40
Time, min.
\ 50 60
Figure 4.15 Loading of Ag (a) and Cu (b) onto 10 gras. of IRA-400, IRA-68 and IRA-94 resins from So'O-j
2 3 rr ppm. Ag, 0.0031 M Cu, 0.18 M S90^z" and 0.324 M NH Conditions: 500 rpm., 25°C.
pH - 10.0, Eh - 255 mv.
solutions containing 20
3 ̂ and 0.324 M NH3.
112
ammoniacal thiosulfate solution, so that copper will be present as
cationic amine complex and silver as anionic thiosulfate complex [see
Figure 4.6]. The presence of these complexes, is very much preferred in
view of the anionic resins used in this research. As such, when sodium
chlorate was used to increase the solution potential, it was observed
that the solution potential actually decreased and the rate of decrease
increased with the quantity of sodium chlorate. Approximately the same
trend was noticed when hydrogen peroxide was used. In this case, the
solution potential initially decreased to as low as 120 mv. and then
suddenly increased back to about 220 mv. with the onset of a very
vigorous exothermic reaction. Temperatures as high as 40°C were
reached. The leach solution was colorless initially and then became dark
blue in color with the addition of more hydrogen peroxide. The color
was much more intense than in the presence of ammonia alone in the
solution. Initially, the pH decreased to 9.3 and then increased to 10.3,
before coming to a steady value of 9.8. Overall, it was very difficult
to control the solution potential with the use of hydrogen peroxide.
Sodium hypochlorite was next tried as an oxidising agent to
increase the solution potential. It was found that the solution
potential could be controlled easily and only a very slight increase in
temperature (about 4 to 5°C) was noticed. The color of solution was
moderate blue before the addition of sodium hypochlorite. With the
addition of sodium hypochlorite, the solution first turned to a slight
yellow color and then colorless. But after a few minutes, the solution
became a darker blue than was the original solution. The pH remained at
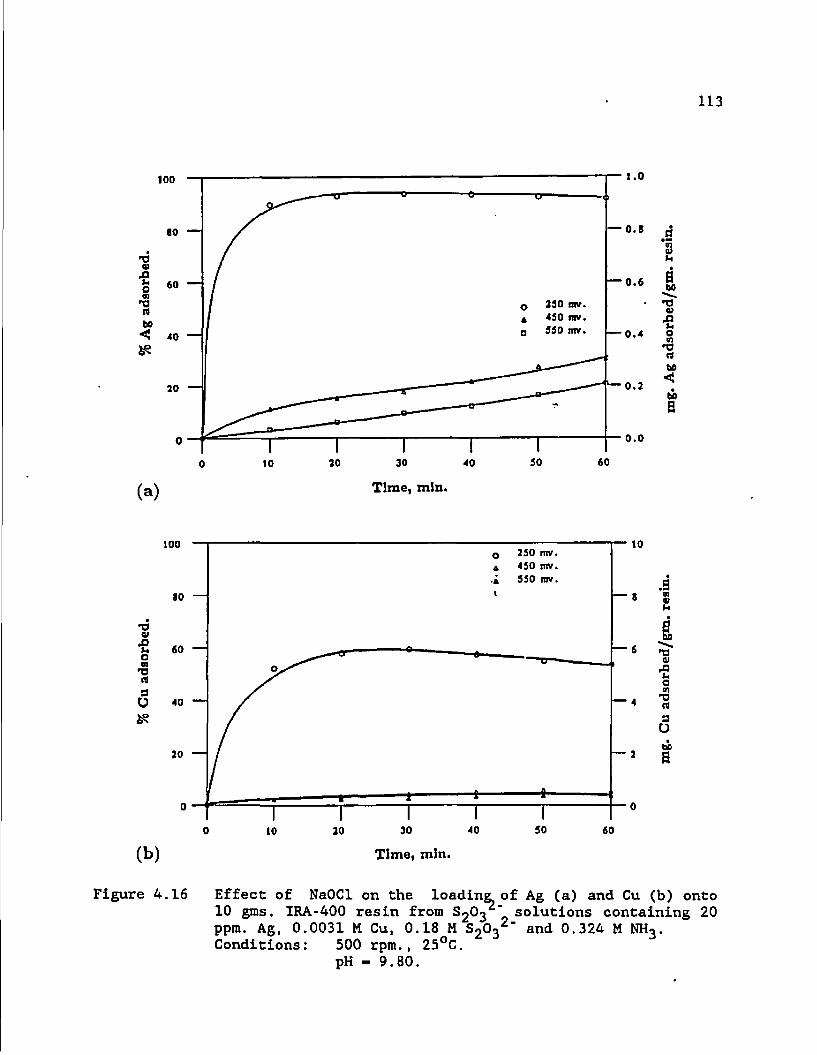
113
100 1.0
tj « -2 S t3 (9 bO < is
10 —
60
40 —
30 —
0 330 mv. 4 430 mw. • 550 mv.
— 0.8
— 0.6
— 0.4
(a) Time, mm.
3 hi * b bo "o o> U o n t3 rt u < bo
0.0
100
tj v •2 o a t3 rt a o
0 250 mv. ^ 450 mv.
550 nrr. 1
10
— 8
— 6
— 4
0] 0) U
tl w •2 S t3 rt 9 u bo a
(b) Time, mln.
Figure 4.16 Effect of NaOCl on the loading, of Ag (a) and Cu (b) onto 10 gms, IRA-400 resin from S2O3 solutions containing 20 ppm. Ag, 0.0031 M Cu, 0.18 M S2032' and 0.324 M NH3. Conditions: 500 rpm., 25°C.
pH - 9.80.
114
around 10.1 . Figure 4.16 shows the effect of solution potential
(adjusted with hypochlorite) on the silver and copper adsorption. The
amount of silver and copper loaded onto IRA-400 resin decreased
significantly when the solution potential was raised from 250 mv. to 450
mv. The decreasing trend increased with the increase in the solution
potentials. At a solution potential of 450 mv., about 0.3 mg. (0.0028
mmoles) of silver and 0.505 mg. (0.0080 mmoles) of copper were loaded
onto the resin, whereas, with the solution potential at 550 mv. only
0.21 mg. (0.0020 nunoles) of silver and 0.326 mg. (0.0051 mmoles) of
copper were adsorbed per gm. of resin.
4.2.1.10. Desorption of sliver and copper from Amberllte IRA-400:
Figures 4.17 a,b give the results of the elution of silver and
copper from IRA-400. In these experiments, copper and silver were first
loaded onto the resin for one hour and then the resin beads were placed
in thiosulfate solutions of different strength. During the loading
phase, the pH and Eh remained at approximately 10 and 250 mv., while the
color changed from dark blue to light blue color. While stripping the
resin of the loaded silver and copper, the pH was about 8.0, Eh about
180 mv. and color of the regenerant solution was colorless. The pH and
Eh values during the elution phase slightly varied depending on the
strength of the thiosulfate solution used as regenerant. A black
precipitate was noticed to form on the resin beads at higher
concentrations of thiosulfate. At the end of the loading period, 0.92
mg./gm. (0.0085 mmoles/gm.) of silver and 6 mg./gm. (0.0944 mmoles/gm.)

115
1.0 O Adiorbed. 4 Dtiorbed by 30 wA ihlo, a Detorbcd by 30 wt .* thio. * Deiotbcd by 10 wt.* thlo.
40 CO
Time, min
10
M
3 O fab s
(b)
i —
6 —
4 —
o * a *
Adiorbid. Dtiorbed by 30wt.K thlo. Deiorbed by 20 wt.* thio. Dtiorbed by 10wt.% thlo.
r 30 40 60 BO
Time, mln.
130
Figure 4.17 Elution characteristics of IRA-AOO resin with respect to solutions containing Ag and Cu.

116
of copper were adsorbed onto the resin. In the range of thiosulfate
concentrations investigated, the elution of silver was not found to
significantly depend on the eluant concentration. It was found possible
to elute nearly 60 wt.% of the loaded silver from the resin (Figure 4.17
a). In case of copper, the elution of resin was found to improve with a
decrease in the thiosulfate concentration. There was an increase of
nearly 10 wt.% in the amount of copper eluted for a decrease of 10 wt.%
in the strength of ammonium thiosulfate. Of the 6.3 mg. (0.0991
millimoles) of copper per gram of resin loaded onto the Amberlite IRA-
400 resin (figure 4.17 b), about 4.1 mg. (0.0645 millimoles), 4.6 mg.
(0.0724 millimoles) and 5.0 mg. (0.0787 millimoles) of copper were
stripped from the resin using 2.7 M, 1.8 M and 0.90 M thiosulfate
solutions, respectively.
4.2.1.11. Desorptlon of silver and copper from Amberlite IRA-68:
Figures 4.18 a,b give the elution characteristics of IRA-68 with
respect to silver and copper, respectively. The experiment was performed
as with the other (Amberlite IRA-400) resin. The solution conditions
were found to be very similar to the conditions observed in the previous
experiments. The pH and Eh values slightly varied depending on the
strength of the thiosulfate solution used as regenerant. A black
precipitate was observed at higher concentrations of thiosulfate. Silver
elution from IRA-68 was found to be better with 1.8 M thiosulfate
solution rather than with 0.90 M thiosulfate solution. Of the 0.22
mg./gm. (0.0020 mmoles/gm.) of silver loaded, 0.19 mg. /gin. (0.0018
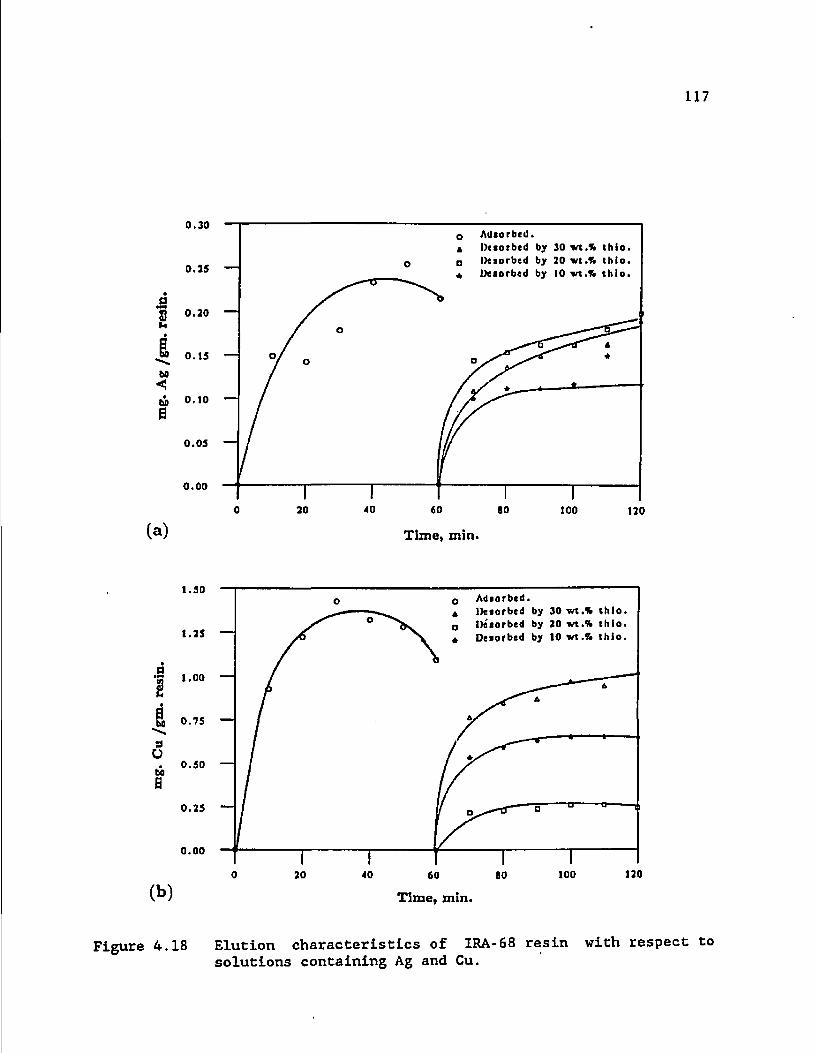
117
(a)
0.30
0,15 —
a g 0.20
0.15 —
ti 0.10 0
0.05 —
0.00
q Adsorbed• a Dcforbcd by 30wt.% ihlo D IMiorbed by 30 Wl.t thlo # Deaorbed by 10 wt.% thio.
Time, min
130
1.50
1.25 —
| l-°o hi
a u ti a
0.75 —
0.50 —
0.35 —
0.00
(b)
Adtarbcd. Detorbcd by 30wt.% thlo. Dciorbed by 30 wt.% thlo. Deiorbed by lOwt.ft Ihlo.
Time, min.
120
Figure 4.18 Elution characteristics of IRA-68 resin with respect to solutions containing Ag and Cu.
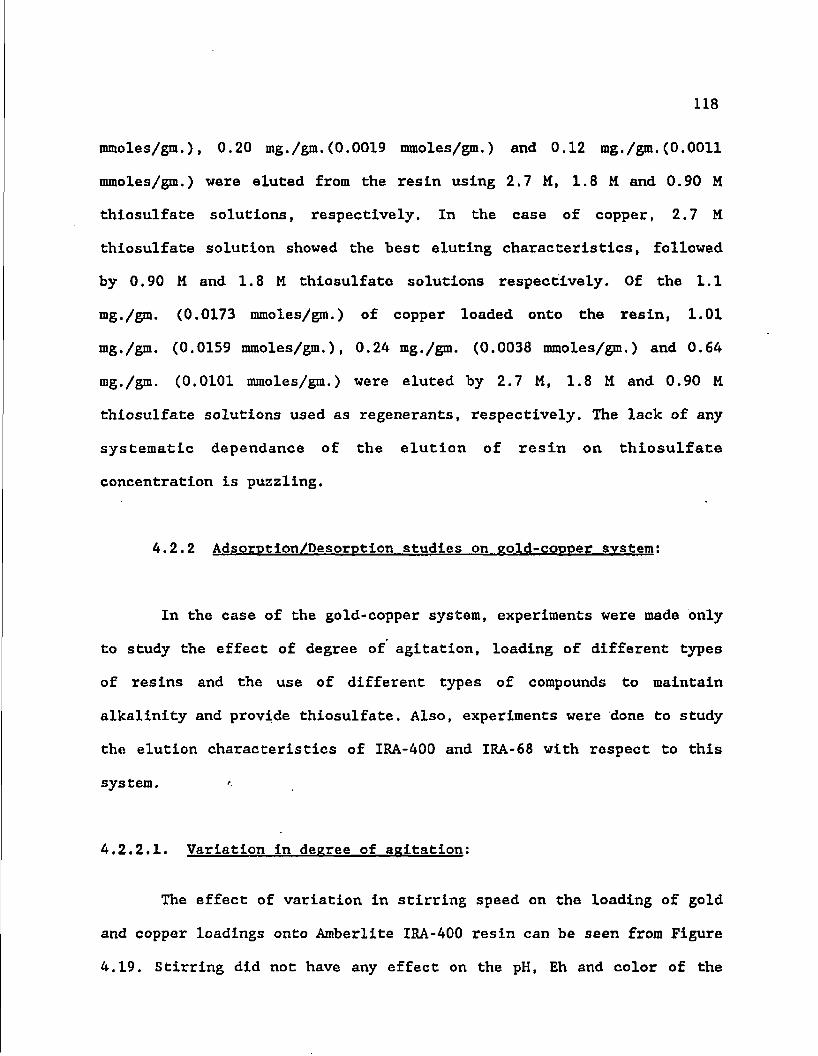
118
mmoles/gm.) , 0.20 mg./gm. (0.0019 mmoles/gm.) and 0.12 rag./gin. (0.0011
mmoles/gm.) were eluted from the resin using 2.7 M, 1.8 M and 0.90 M
thiosulfate solutions, respectively. In the case of copper, 2.7 M
thiosulfate solution showed the best eluting characteristics, followed
by 0.90 M and 1.8 M thiosulfate solutions respectively. Of the 1.1
mg./gm. (0.0173 mmoles/gm.) of copper loaded onto the resin, 1.01
mg./gm. (0.0159 mmoles/gm.), 0.24 mg./gm. (0.0038 mmoles/gm.) and 0.64
mg./gm. (0.0101 mmoles/gm.) were eluted by 2.7 M, 1.8 M and 0.90 M
thiosulfate solutions used as regenerants, respectively. The lack of any
systematic dependance of the elution of resin on thiosulfate
concentration is puzzling.
4.2.2 Adsorptlon/Desorptlon studies on gold-copoer system:
In the case of the gold-copper system, experiments were made only
to study the effect of degree of agitation, loading of different types
of resins and the use of different types of compounds to maintain
alkalinity and provide thiosulfate. Also, experiments were done to study
the elution characteristics of IRA-400 and 1RA-68 with respect to this
system.
4.2.2.1. Variation in degree of agitation:
The effect of variation in stirring speed on the loading of gold
and copper loadings onto Amberlite IRA-400 resin can be seen from Figure
4.19. Stirring did not have any effect on the pH, Eh and color of the
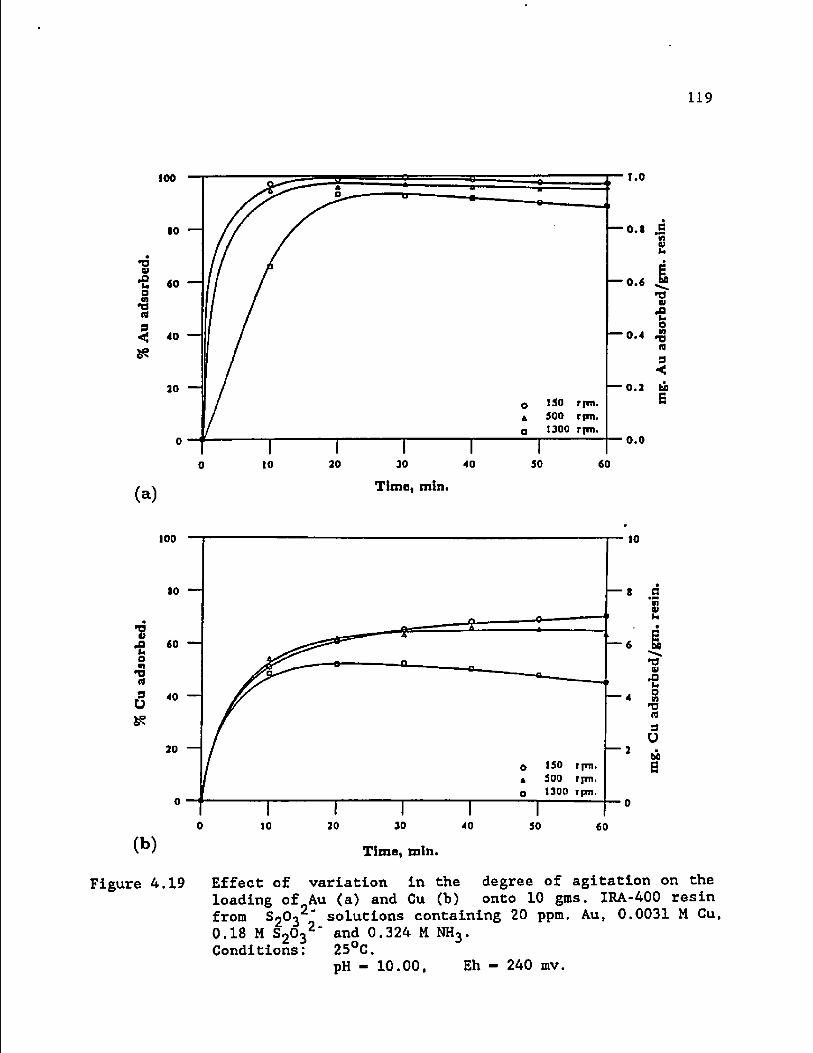
119
too
*o w •s o at •b a
5 4s
(a) Time. min.
l.o
— 0.8 B
q ISO r|*n. 4 500 rpm. o 1300 rjm.
— 0.6
0.4
— 0.3
' 0.0
k *
E bo -b 0) •e o m d n a <
bo E
•8 •2 o « •o rt s u js
100
so —
60 —
40 —
30 —
O 150 rpn. a 500 rjm. o 1300 rpm.
10 30
(b)
Figure 4.19
T 30
Time, mln.
40 T 50
10
— 8
60
Effect of variation in the degree of agitation on the loading of Au (a) and Cu (b) onto 10 gms. IRA-400 resin from solutions containing 20 ppm. Au, 0.0031 M Cu,
0.18 M S2032" Conditions:
and 0.324 M NH3, 25°C.
pH - 10.00, Eh - 240 mv.

120
leach solution. For all stirring speeds, the leach solution had a blue
color, pH and Eh around 10 and 240 mv. At the end of the experiment,
about 0.98 mg./gm.(0.0050 mmoles/gm.), 0.95 rag./gm. (0.0149 mmoles/gm.)
and 0.85 mg./gm. (0.0043 mmoles/gm.) of gold and 7.03 mg./gm. (0.1106
mmoles/gm.), 6.3 mg./gm. (0.0991 mmoles/gm.) and 4.5 mg./gm. (0.0708
mmoles/gm.) of copper were adsorbed at stirring speeds 150, 500 and 1300
rpm., respectively. The gold adsorptions reached a maximum value after
about 20 min. in the case of all three stirring speeds. At a stirring
speed of 1300 rpm., the initial rate of adsorption of gold was
significantly lower than that with the other stirrer speeds. The initial
rate of copper loading was less sensitive to stirring, although some
desorption of loaded copper seemed to occur at 1300 rpm.
4.2.2.2. Loading of different types of resins:
Figures 4.20 a,b show the loading capacities of the three
different resins for gold and copper from a solution containing 20 ppm.
gold, 0.0031 M copper and 0.18 M thiosulfate. The pH, Eh and color of
the leach solution were not affected by the use of different resins. pH
and Eh were around 10 and 255 mv. A moderate to light blue color existed
by the use of any of these three resins. Araberlite IRA-400 showed the
best adsorption capabilities for both gold and copper. On IRA-400,
loadings of about 0.95 rag./gm. (0.0048 mmoles/gm.) of gold and 6.5
mg./gm.(0.1022 mmoles/gm.) of copper were measured at the end of 60 min.
Both IRA-94 and IRA-68 showed much lower loading capacities -- 0.4
mg./gm. (0.0020 mmoles/gra.) and 0.36 mg./gm. (0,0018 mmoles/gm.) of
121
tj *> •s o -3 eg
3 ir
100
10 —
60 —
40 —
20 —
tRA 61 tRA 94. IRA 4no
1.0
— o . i . 2 in 9
— 0 . 6
0.4
— 0.1
0.0
e bo *o 0) •e s tj n 3 < bb £
(a) Time, min.
too
•o 01 •2 o « -a (9
8 &
so —
60
40 —
20 —
o • a
IRA 68. IRA 94. IRA 400.
(b) Time, min.
10
— 8 to v
— 6
— 4
— 2
"T3 w JO U o n 13 rt 9 o ti b
Figure 4.20 Loading of Au (a) and Cu (b) 68 and IRA-94 resins from ppm. Au, 0.0031 M Cu, Conditions: 500 rpm., 25°C
pH - 10.0. Eh - 255 mv.
onto
®2^3 o 0.18 M S2032"
10 gins. of IRA-400, IRA-solutions containing 20 and 0.324 M NH3.
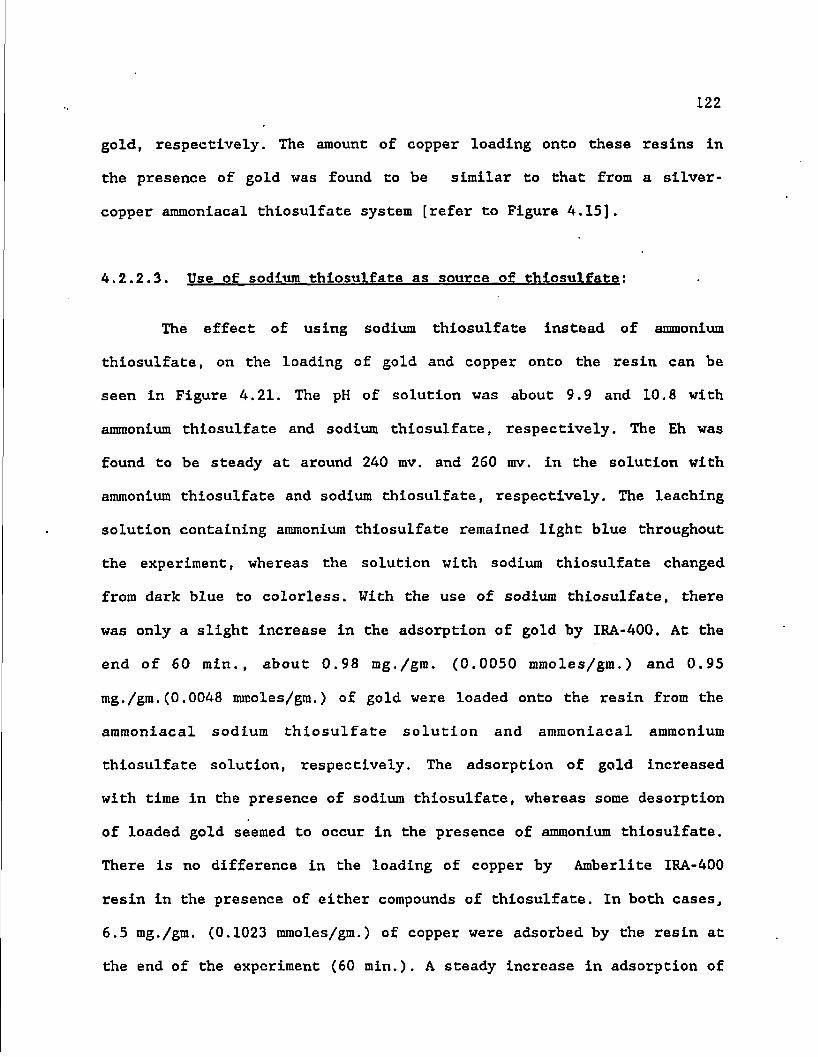
122
gold, respectively. The amount of copper loading onto these resins in
the presence of gold was found to be similar to that from a silver-
copper ammoniacal thiosulfate system [refer to Figure 4.15].
4.2.2.3. Use of sodium thiosulfate as source of thiosulfate;
The effect of using sodium thiosulfate instead of ammonium
thiosulfate, on the loading of gold and copper onto the resin can be
seen in Figure 4.21. The pH of solution was about 9.9 and 10.8 with
ammonium thiosulfate and sodium thiosulfate, respectively. The Eh was
found to be steady at around 240 mv. and 260 rav. in the solution with
ammonium thiosulfate and sodium thiosulfate, respectively. The leaching
solution containing ammonium thiosulfate remained light blue throughout
the experiment, whereas the solution with sodium thiosulfate changed
from dark blue to colorless. With the use of sodium thiosulfate, there
was only a slight increase in the adsorption of gold by IRA-400. At the
end of 60 min. , about 0.98 mg./gm. (0.0050 mmoles/gm.) and 0.95
mg./gm. (0.0048 mmoles/gm.) of gold were loaded onto the resin from the
ammoniacal sodium thiosulfate solution and ammoniacal ammonium
thiosulfate solution, respectively. The adsorption of gold increased
with time in the presence of sodium thiosulfate, whereas some desorption
of loaded gold seemed to occur in the presence of ammonium thiosulfate.
There is no difference in the loading of copper by Amberlite IRA-400
resin in the presence of either compounds of thiosulfate. In both cases,
6.5 mg./gm. (0.1023 mmoles/gm.) of copper were adsorbed by the resin at
the end of the experiment (60 min.). A steady increase in adsorption of

o . Figure 4.21 Effect of different compounds of S2O3 on the loading of
Au (a) and Cu (b) onto 10 gms. IRA-400 resin from S9O3 solutions containing 20 ppra. Au, 0.0031 M Cu, 0.18 M
S2032" and 0.324 M NH3. Conditions: 500 rpm., 25°C.
pH - 9.90 with (NH4)2S203.
10.8 with Na2S20<j.5H20. Eh - 260 mv. with (NH^)2S203.
240 mv. with ̂ 28203.51^0.
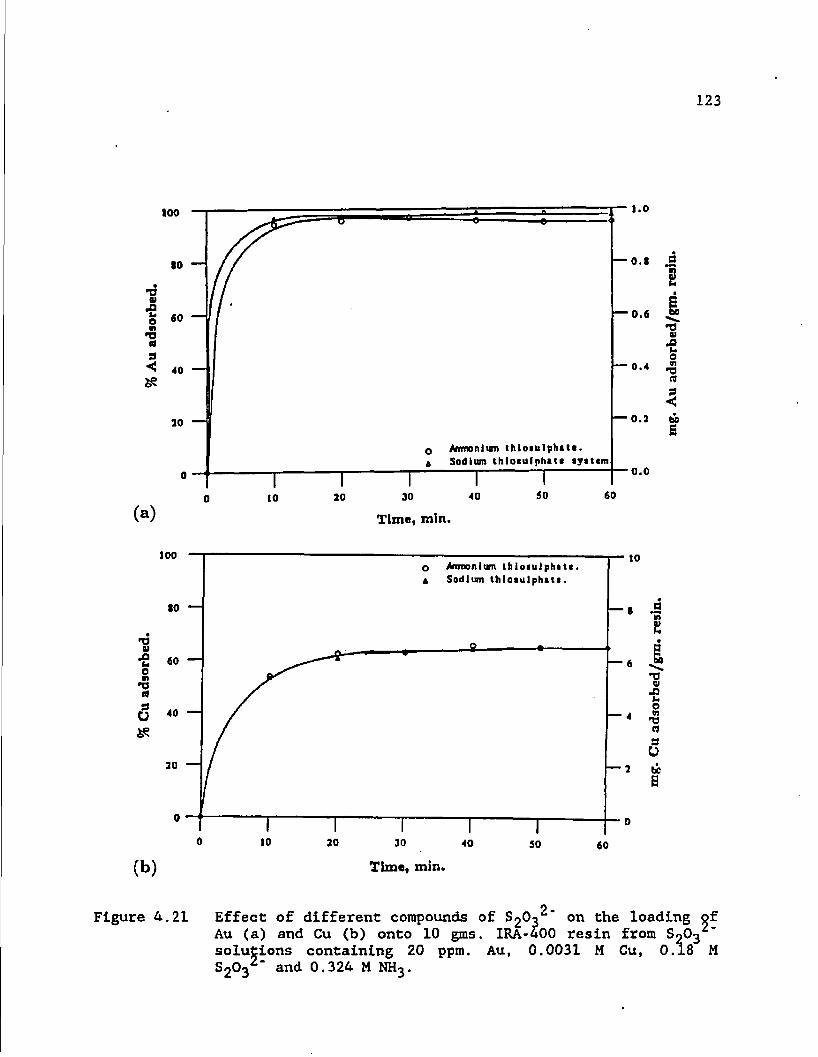
123
too
10 —
•e o •o <a a •< is
60 —
40
30 —
(a)
i.o
— 0.1 .5
0 Mmonium thioiulphitt. A Sodium ihloiulphat* tyiiem
s — 0.6
— 0.4
— 0.3
0.0
*o u f S t3 a a •< u E
30 40 SO 60
Time, mln.
loo
u 0) •s o n 73 rt S o if?
to —
60 —
40
30 —
O Amonium tbioiulphitt. A Sodium thlotulphtie.
to
— i ja
e I
— 4
— 3
tj « 03 o « -a a 3 o be s
(b) 10 30 30 40
Time, min.
so 60
o_ Figure 4.21 Effect of different compounds of S2O3 on the loading of
Au (a) and Cu (b) onto 10 gms. IRA-400 resin from S0O3 solutions containing 20 ppm. Au, 0.0031 M Cu, 0.18 M S2032' and 0.324 M NH3.
124
copper was noticed by the use of both compounds.
4.2.2.4 Use of sodium hydroxide to maintain the alkalinity;
Figures 4.22 a,b show the loading of gold and copper onto IRA-400
using sodium hydroxide in place of anunonium hydroxide. About 3 ml. of 50
wt.% sodium hydroxide solution was required to attain a pH value of
about 9.6 and Eh about 230 mv. A milkish color existed throughout the
experiment with sodium hydroxide. When anunonium hydroxide was used, the
pH remained at 9.8, Eh at 255 mv. and the solution was blue in color.
The use of either hydroxide compound did not have much effect on the
loading of gold. But, some desorption of loaded gold was noticed during
the latter stages of the experiment in the presence of ammonium
thiosulfate (Figure 4,22 a). On the other hand, the use of the different
hydroxides has a large effect on the copper adsorption by IRA-400.
Loadings of about 8.2 mg./gm. (0.1290 mmoles/gm.) and 6.5 mg./gm.(0.1023
mmoles/gm.) of copper were obtained using sodium hydroxide and ammonium
hydroxide, respectively (Figure 4.22 b).
4.2.2.5. Desorption of cold and silver from Amberlite IRA-400:
Figures 4.23 a,b give the elution characteristics of IRA-400 with
respect to gold and copper. These experiments were done similar to those
with respect silver-copper system and Amberlite IRA-400 [see Section
4.2.1.li]. The solution conditions were found to be slightly different
from those of the silver-copper system. 2.7 M and 1.8 M thiosulfate

Figure 4.22 Effect of using different compounds to maintain the alkalinity in the solution on the loading of Au (a) and Cu (b) onto 10 gms. IRA-400 resin from S9O3 solutions containing 20 ppm. Au, 0.0031 M Cu and 0.18 M SjO j Conditions: 500 rpm., 25°C.
pH - 9.60 with NaOH. 9.80 with NH4OH.
Eh - 230 mv. with NaOH. 255 mv. with NH^OH.

125
too
•o 91 •2 o m 73 m 9 < is
•0 —
«0
40 —
20 —
0 Arrmonlura hydroiidi. h Sodium hydrocld*.
T to
T 30
1.0
O.t c CM vi 9>
— 0.6
— 0.4
— 0.2
0.0
(a) 30 40
Time, mln.
50 60
t3 V
•s o *o n 3 < fab
100 10
•s •s o •» tj « 9 o is
— 6
— 4
— 2
(b) 30 40
Time, mln.
Atmonlurrt hydroxide. Sodium hydroxid*.
"1 50 60
u u
T3 4)
-e o q> tj (4
a o
bo b
Figure 4.22 Effect of using different compounds to maintain the alkalinity in the solution on the loading of ̂ u (a) and Cu (b) onto 10 gms. IRA-400 resin from S-O3 solutions
containing 20 ppm. Au. 0.0031 M Cu and 0.18 K S203 .
126
o * o *
Adiotbcd. Dctotbid by 30 wit* thlo. Deiofbed by 10 wt.* thlo. Deiorbtd by 10 wt.% thlo.
(a) 20 40 60 80
Time, mill.
100 120
(b)
o Adiorbcd. * Deiofbed by 30 wt.% ihio. o 'l)eforbed by 20 vt.« thlo. * Detorbtd by 10 vt,( thlo.
60 80
Time, mln.
100 120
Figure A.23 Elution characteristics of IRA-400 resin with respect to solutions containing Au and Cu.
127
solutions showed better elution characteristics than 0.90 M thlosulfate
solution for stripping gold from the resin. From Figure 4.23 (a), it can
be noted that of the 0.97 mg./gm. (0.0049 mmoles/gm.) of gold loaded,
approximately 0.2 mg./gm. (0.0013 mmoles/gm.) was stripped from the
resin with the thlosulfate solutions. This shows that a very poor
elution of gold was attained.
The elution of copper from IRA-400 was found to increase with a
decrease in the strength of thlosulfate solution used as the regenerant.
Of the 6.3 mg./gm.(0.0991 mmoles/gm.) of copper loaded onto the resin ,
about 4.1 mg./gm. (0.0645 mmoles/gm.), 5.1 mg,/gm. (0.0802 mmoles/gm.)
and 5.4 mg./gm. (0,0850 mmoles/gm.) were stripped of the resin by 2.7
M, 1.8 M and 0.90 M thlosulfate solutions in 60 min.
4.2.2.6. Desorptlon of gold and copper from Amberlite IRA-68:
The elution characteristics of IRA-68 with respect to gold and
copper are given in Figure 4.24. The solution conditions were found to
be in the same rangers with other desorption studies. The elution of
gold decreased with a decrease in the strength of thlosulfate solution
from 2.7 M to 0.90 M. With a 2.7 M thlosulfate solution, complete
stripping was possible in one hour (Figure 4.24 a). The stripping of
copper from the resin was found to be best with a 1.8 M solution. Nearly
90% of the loaded copper was eluted from the resin by using 1.8 M
thlosulfate solution (Figure 4.24 b). These data show that a good
separation between copper and gold was not obtained using this resin.

128
0.5
0.4
0.3 —
O.J —
0.1 —i
0.0
0 Adiorbed. a Deiorbed by 30 wt.% thlo a Deiorbed by 20 wt.% thlo * Dttorbed by to wt.% thlo
20 40
(a) Time, min
a s u
1.50
1.25 —
! .00 —
0.75 —
3 u t* 0.50
0.25 —
0.00
(b)
O Adiorbed. * Deiorbed by 30 wt.% thlo q Deiorbed by 20 wt.% thlo + Deiorbed by 10 wt.% thio
Time, min.
120
Figure 4.24 Elution characteristics of IRA-68 resin with respect to solutions containing Au and Cu.
129
CHAPTER 5
DISCUSSION
5.1 Eh-pH Diagrams
The objective of the present research was to selectively recover
gold and silver from ammoniacal thlosulfate solutions containing copper.
Eh-pH diagrams were constructed to help understand and characterize the
chemistry of the thlosulfate-ammonia-copper solutions containing gold or
silver. These diagrams were constructed for different concentrations of
the involved species and used to predict the predominant species that
exist under the conditions of the experiments. These diagrams also gave
an insight to understand the stability of the ammoniacal thiosulfate
system to precipitation of metal values.
When thiosulfate is added to the copper-water system (Figure
2.1), the pure copper has completely dlssappeared and was mostly used up
to form copper sulphides (CuS and CU2S) and cuprous thiosulfate
(Cu(S203)3^_} complexes (Figure 4.1). The regions of stability for C^O,
CuO and Cu^+ have been very much reduced. The most stable species of
copper at the solution conditions (Eh- 185 mv. and pH-10.0) is cuprous
thiosulfate. With the addition of more thiosulfate, the regions of
stability for CuS, C^S, C^O, CuO and Cu++ narrowed and that of
Cu(S203)j^" expanded. These trends clearly indicate that copper has more
affinity to form copper thiosulfate complex than oxides at the solution
conditions. As can be inferred from Figure 4.1, the variation in copper

130
has very little effect on the stability of copper-thiosulfate-water
system. This may be because of the presence of very small amount of
copper in the system compared to thiosulfate..
Copper has an affinity to form cupric amine complexes with
ammonia. These complexes are cationic in nature. This aspect of copper
was exploited by introducing ammonia into the system (Figures 4.2 and
4.3). The presence of cupric amine in ammoniacal thiosulfate solutions
is very much appreciated in view of the resins used in this research.
The resins are anionic in nature and so have the capability of adsorbing
the anionic metallic complexes. Gold and silver form stable anionic
thiosulfate complexes. Silver does not form any complexes with ammonia
(Figure 4.4), whereas gold forms amine complexes at pH greater than 9.0
(Figure 4.5). In fact, at the solution conditions the anionic
thiosulfate complex of silver is very stable. In the case of gold,
either complexes (thiosulfate and amine) can exist in the system at the
same time. There is also an possibility that complexes of gold with both
o ammonia and thiosulfate such as Au(NHj)(§203)2 should have been
forming. The stability of the anionic thosulfate complexes of gold and
silver are not much affected by the variation in thiosulfate and ammonia
concetrations (Figures 4.4 and 4.5). On the otherhand, the stability of
the cupric amine region is affected by a variation in concentration of
thiosulfate, copper and ammonia (Figures 4.2 and 4.3). Hence, depending
on the concentrations of copper, thiosulfate and ammonia, cuprous
thiosulfate or cupric amine may be present in the solution. It can be
discerned from Figures 4.2 and 4.3 that at lower thiosulfate
131
concentration and higher copper concentration in the ammoniacal
thiosulfate solutions, cuprammoniura is more stable at the solution
conditions. However, it should also be pointed out that the region of
stability of Cu2S increases at the same time. Cu2S is present very close
to the Eh and pH conditions of the solution. Thus the precipitation of
CU2S is possible, if necessary precautions are not taken. This
precipitate was reported to effect the loading of gold and silver
complexes by the resin [7-10,27], It can be suggested at this point that
the presence of lower concentrations of thiosulfate, copper and ammonia
in the solution are advantages as the possibility of Cu2S precipitating
is narrowed. Also, the stability region of cupric amine narrows with the
increase in the copper concentration at constant concentrations of
thiosulfate and ammonia (Figures 4.2 through 4.3). This may be due to
the tendency of copper to hydrolyse to CuO.
The changes in the stability of Cu(NH|j)^^+ and Cu(S203)3^~
domains can be explained by the following equilibrium reaction [27]:
2Cu(NH3)42+ + 20H" + 6S2032" <-> 2Cu(S203)35" + 8NH3 + H20 +
+ l/202 (5.1)
The equilibrium constant, K, for this reaction at 25°C after
2+ 5 -substitution of the dissociation constant of Cu(NH3)^ and Cu(S203)3
along with the chemical potential of each substance into the expression
[27], is
[Cu(NH3)42+]2[S2032"]6 [OH-]2 —
[Cu(S203)35-]2[NH3]8 Po21/2

132
- 1.5 x 10¹³ (5.2)
The ratio of Cu(NH3)^+ to 011(8203)3"'" becomes
[CU(NH3)42+] 1.5 x 10¹³ x [NH3]4 PQ21/4
; 5"5 (5.3) [Cu(S203)35-] [S2°2 r [OH"]
According to this equation, with the rise in thiosulfate [S2O32"]
concentration at fixed concentration of ammonia the ratio decreases
implying that more of copper thiosulfate [(^(8203)3"'"] is present in the
system. Equation (5.3) is very important in relating the effect of
S>203^"' OH", NH3, etc. on the ratio [Cu(NH3)^2+]/[Cu(S203)3^*] which in
turn plays an important role on their adsorption onto the resin.
In view of this present research, it can be concluded from the
discussion of the Eh-pH diagrams, that the best concentrations of
thiosulfate, copper and ammonia are 0.18 M, 0.0031 M and 1.765 M
respectively and the solution conditions are pH between 8 and 11 and
above 0.1 volts for solution potential (Eh). At these conditions, the
2+ possibility of the presence of (^1(^3)4 is more compared to that of
^(8203)3^" in the system. Also, anionic thiosulfate complex of silver
is very stable at these conditions. Although, gold may be present either
1 as Au(NH3>2 or Au(S203)2 complex. There is a possibility of gold
forming complexes with both ammonia and thiosulfate, such as
Au(NH3) ̂203)2 . The leach solution in this study had Eh values in the
range 150 - 250 mv. and pH between 9.6 and 10,3 depending on the
concentrations of thiosulfate, copper and ammonia. This alkaline pH was
maintained by the use of ammonium hydroxide which serves as a source of

133
ammonia. Ammonia also helped in the formation of cupric amine complexes,
CU(NH3)42+ and Cu(NH3)2+.
5.2. Experimental Results:
The composition of the leach solution most commonly used in this
research is shown in Table 5.1. Table 5.2 gives the maximum number of
moles of thiosulfate complexes of gold, silver and copper that can be
formed for this leach solution composition. It also gives the maximum
number of moles of thiosulfate that are required to form these
complexes. From these tables, it is clear that nearly half of the
thiosulfate added should be present in the uncomplexed state.
5.2.1. Adsorption and desorptlon of eold and silver bv the resins:
All the resins used in this study were anion exchange resins and
hence had the capacity to load thiosulfate complexes of gold, silver and
copper and any free thiosulfate and tetrathionate ions. Tables 5.3 - 5.8
give the theoretical maximum capacity and actual loading of different
anionic complexes in the ammoniacal thiosulfate system onto the resins
(Amberlite IRA-400, Amberlite IRA-68 and Amberlite IRA-94) used in this
study (Appendix A). These were calculated from the wet capacity values
quoted by the manufacturer [47,59,60,64], Experimental loading values
for thiosulfate and tetrathionate are not given since the leach solution
was not analysed for these anions. Gold, silver and copper thiosulfate
complexes, each occupy five, five and three active sites on the resin

Table(S.l)
Composition of the Leach Solution Mostly Used in this Research
Substance Concentration (moles)
Copper 9.25 x 10"5
Thiosulphate 8.92 x 10"3
Ammonia 9.79 x 1(T2
Gold or Silver 20 ppm.
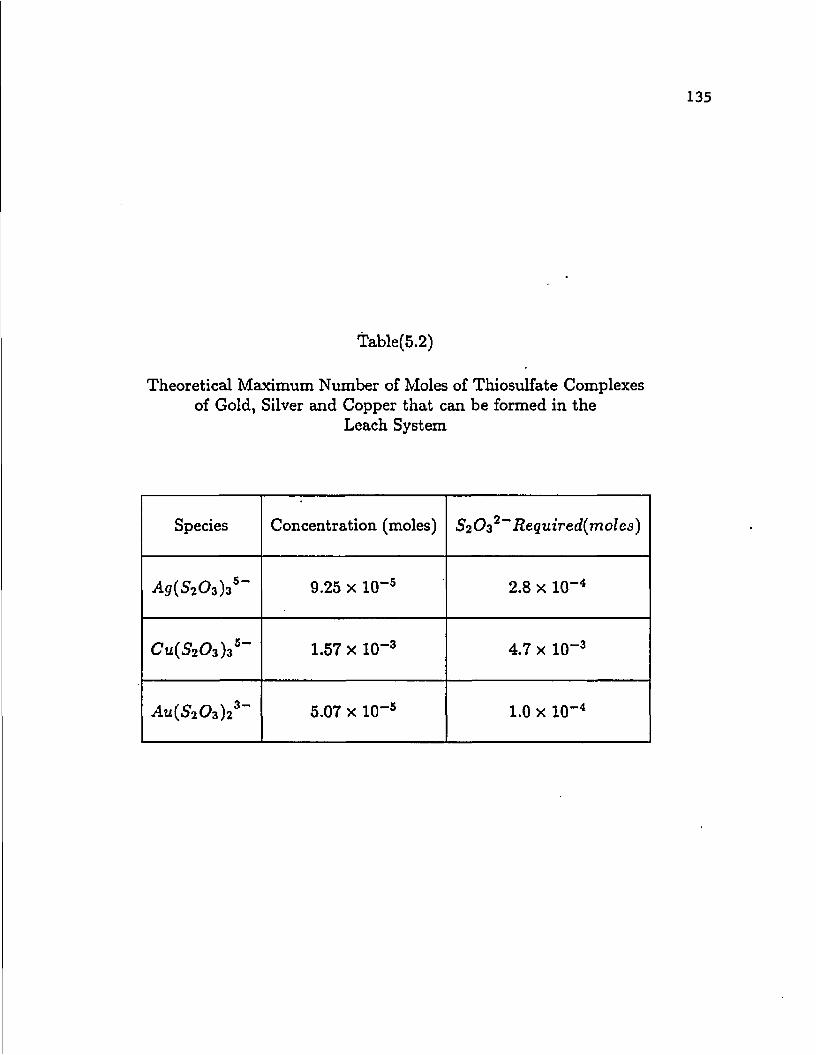
Table(5.2)
Theoretical Maximum Ntimber of Moles of Thiosulfate Complexes of Gold, Silver and Copper that can be formed in the
Leach System
Species Concentration (moles) 52O32 Required(moles)
Ag(S20$)z5 9.25 x 1(T5 2.8 x 10"4
Cu{S2O z) 35 - 1.57 x 10~3 4.7 x 1(T3
AU{S20z)%3 5.07 x 10⁻⁵ 1.0 x 10~4

136
Table(5.3)
Percent of Active Sites on Amberlite IRA 400 Occupied by Thiosulfate Complexes that are Present in the Silver-Copper Thiosulfate System
s*ol~ &
O
& to 1
Ag(S20z)35 Cu{S2Oz) 35-
Maximum Loading Possible
Theoretically (Moles)
9.9 x 10~3 9.9 x 10~3 3.9 x 10~3 3.9 x 10~3
Amount " Initially Present in the Leach
Solution (Moles)
8.92 x 10"3 8.92 x 10~3 9.25 x 10"*5 1.57 x 10~3
Loading Obtained
in the Experiment
(Moles)
- - 8.44 x 10~5 8.34 x 10⁻⁴
Percent1* of Sites
Occupied - - 2.16 21.39
* Assume 100% loading

137
Table(5.4)
Percent of Active Sites on Amberlite IRA 68 Occupied by Thiosulfate Complexes that Eire Present in the Silver-Copper Thiosulfate System
S2OI- SaO\- Cu(S2O z)35-
Maximum Loading Possible
Theoretically (Moles)
1.1 x 10"2 1.1 x 10~2 4.4 x 10~3 4.4 x 10"3
Amount Initially Present in the Leach
Solution (Moles)
8.92 x 10~3 8.92 x 10"3 9.25 x 10"5 1.57 x 10~3
Loading Obtained
in the Experiment
(Moles)
- — 2.23 x 10⁻⁵ 1.57 x 10~4
Percent* of Sites
Occupied
- - 0.51 3.57
* Assume 100% loading

130
Table(5.5)
Percent of Active Sites on Amberlite IRA 94 Occupied by Thiosulfate Complexes that are Present in the Silver-Copper Thiosulfate System
s2ot s4ol~ Cu(S2O z)3s-
Maximum Loading Possible
Theoretically (Moles)
9.4 x 10"3 9.4 x 10"3 3.7 x 10~3 3.7 x 10"3
Amount Initially Present in the Leach
Solution (Moles)
8.92 x 10~3 8.92 x 10~3 9.25 x 10"5 1.57 x 10~3
Loading Obtained
in the Experiment
(Moles)
- - 1.76 x 10~5 7.87 x 10~5
Percent* of Sites
Occupied
- - 0.48 2.13
* Assume 100% loading
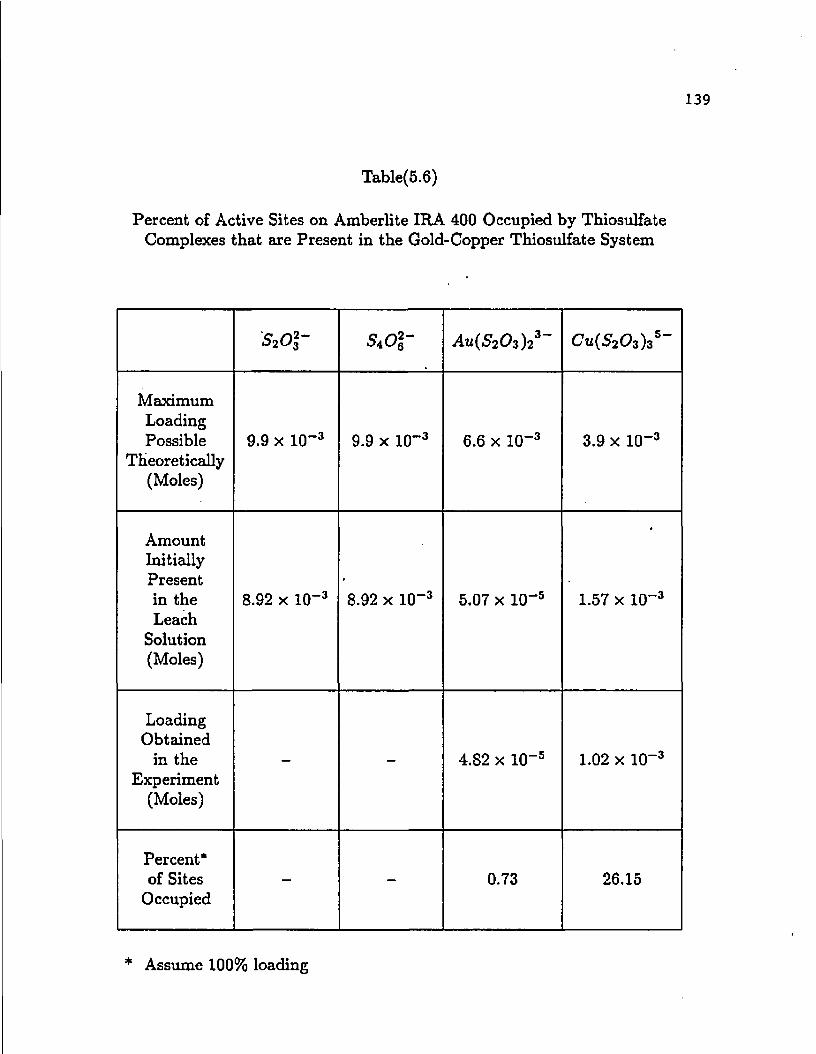
139
Table(5.6)
Percent of Active Sites on Amberlite IRA 400 Occupied by Thiosulfate Complexes that are Present in the Gold-Copper Thiosulfate System
s2o\- SiO*- Ait (S2 03)2 3 CU(S203)35~
Maximum Loading Possible
Theoretically (Moles)
9.9 x 10~3 9.9 x 10~3 6.6 x 10⁻³ 3.9 x 10⁻³
Amount Initially Present in the Leach
Solution (Moles)
8.92 x 10"3 8.92 x 10⁻³ 5.07 x 10"5 1.57 x 10~3
Loading Obtained
in the Experiment
(Moles)
- - 4.82 x 10"5 1.02 x 10"3
Percent* of Sites
Occupied - - 0.73 26.15
* Assume 100% loading
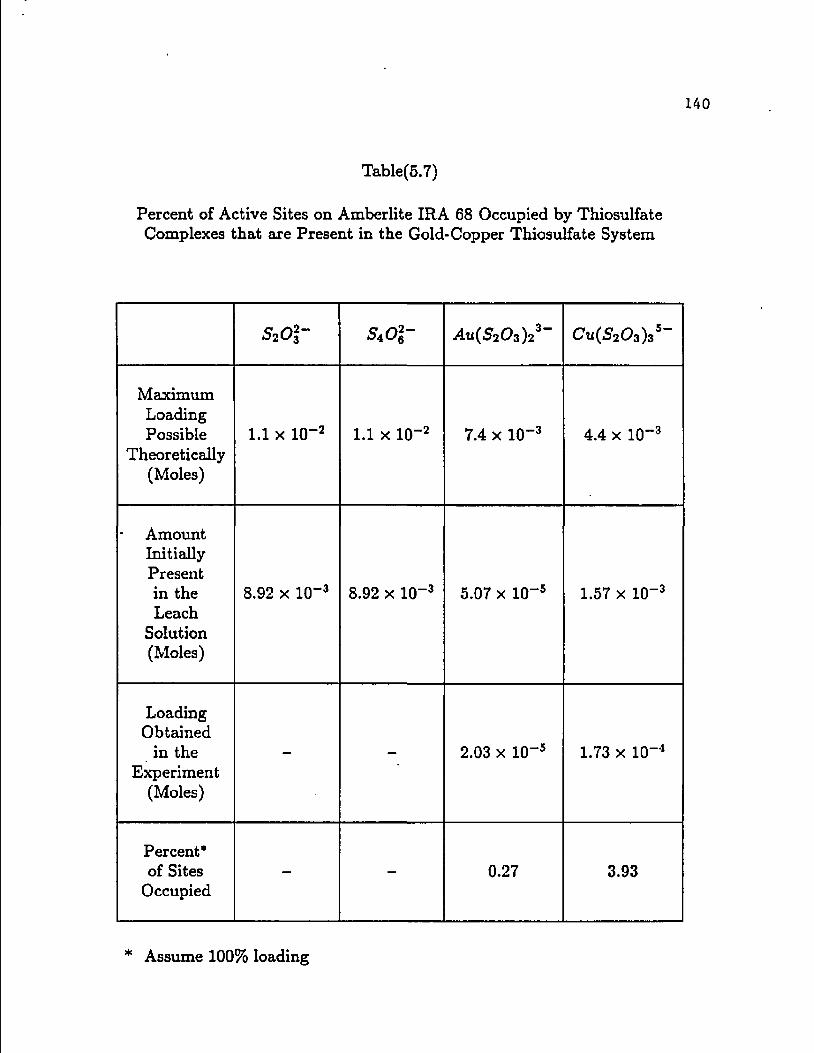
140
Table(5.7)
Percent of Active Sites on Amberlite IRA 68 Occupied by Thiosulfate Complexes that are Present in the Gold-Copper Thiosulfate System
s2ot SAO\- j4.U(.?2C?3)23 Cu(S20 3 ) 3 S ~
Maximum Loading Possible
Theoretically (Moles)
1.1 X 10"2 1.1 X 10⁻² 7.4 x 10~3 4.4 x 10"3
Amount Initially Present in the Leach
Solution (Moles)
8.92 x 10~3 8.92 x 10⁻³ 5.07 x 10~5 1.57 x 10"3
Loading Obtained
in the Experiment
(Moles)
- - 2.03 x 10~5 1.73 x 10"4
Percent* of Sites
Occupied - - 0.27 3.93
* Assume 100% loading
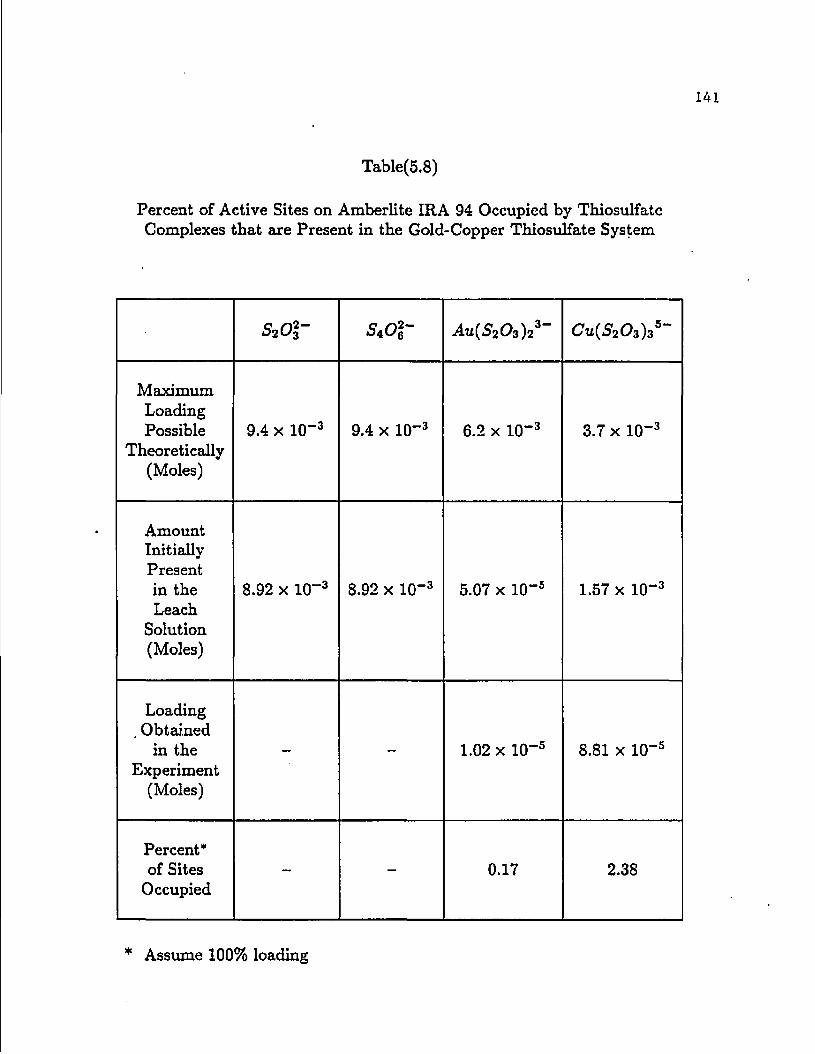
141
Table(5.8)
Percent of Active Sites on Amberlite IRA 94 Occupied by Thiosulfate Complexes that are Present in the Gold-Copper Thiosulfate System
52 01' S40$- j4.u(i>203)23 Cu{S2O z) a5"
Maximum Loading Possible
Theoretically (Moles)
9.4 x 10"3 9.4 x lO"3 6.2 x 10⁻³ 3.7 x 10"3
Amount Initially Present in the Leach
Solution (Moles)
8.92 x 10~3 8.92 x 10"3 5.07 x 10~5 1.57 x 10~3
Loading , Obtained
in the Experiment
(Moles)
- 1.02 x 10"5 8.81 x 10~5
Percent* of Sites
Occupied - - 0.17 2.38
* Assume 100% loading
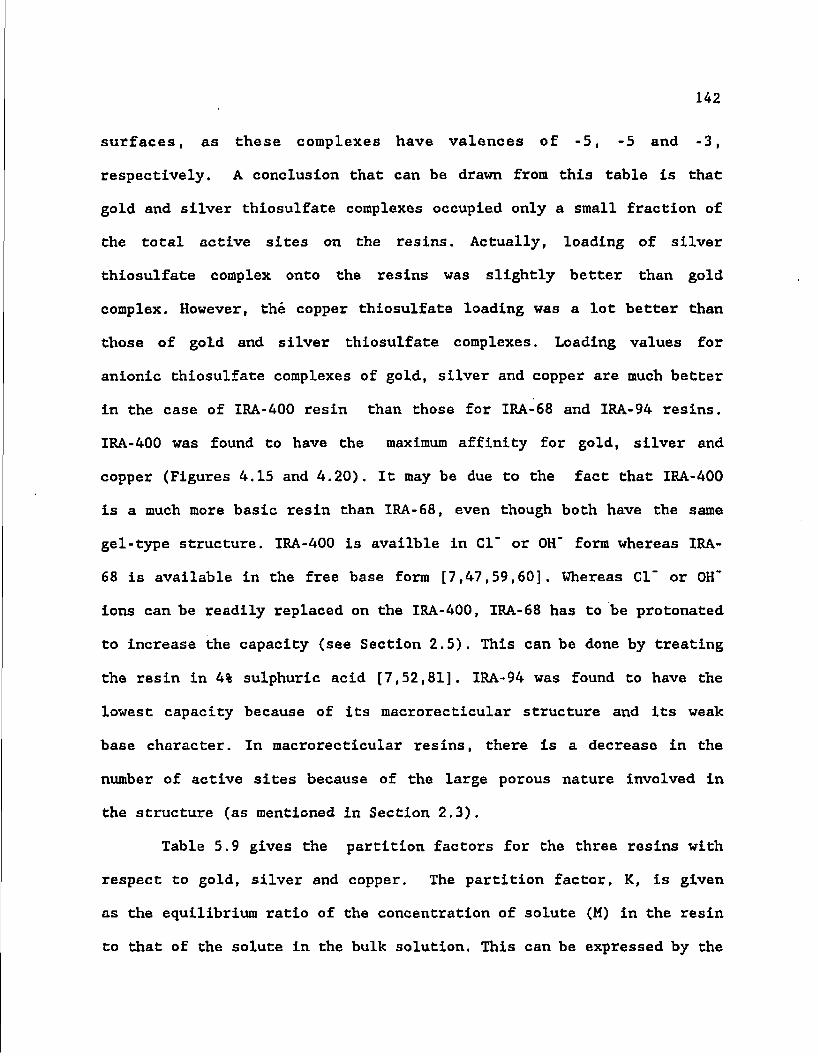
142
surfaces, as these complexes have valences of -5, -5 and -3,
respectively. A conclusion that can be drawn from this table is that
gold and silver thiosulfate complexes occupied only a small fraction of
the total active sites on the resins. Actually, loading of silver
thiosulfate complex onto the resins was slightly better than gold
complex. However, the copper thiosulfate loading was a lot better than
those of gold and silver thiosulfate complexes. Loading values for
anionic thiosulfate complexes of gold, silver and copper are much better
in the case of IRA-400 resin than those for IRA-68 and IRA-94 resins.
IRA-400 was found to have the maximum affinity for gold, silver and
copper (Figures 4.15 and 4.20). It may be due to the fact that IRA-400
is a much more basic resin than IRA-68, even though both have the same
gel-type structure. IRA-400 is availble in CI" or OH" form whereas IRA-
68 is available in the free base form [7,47,59,60]. Whereas Cl~ or OH"
ions can be readily replaced on the IRA-400, IRA-68 has to be protonated
to increase the capacity (see Section 2.5). This can be done by treating
the resin in 4% sulphuric acid [7,52,81]. IRA-94 was found to have the
lowest capacity because of its macrorecticular structure and its weak
base character. In macrorecticular resins, there is a decrease in the
number of active sites because of the large porous nature involved in
the structure (as mentioned in Section 2.3).
Table 5.9 gives the partition factors for the three resins with
respect to gold, silver and copper. The partition factor, K, is given
as the equilibrium ratio of the concentration of solute (M) in the resin
to that of the solute in the bulk solution. This can be expressed by the
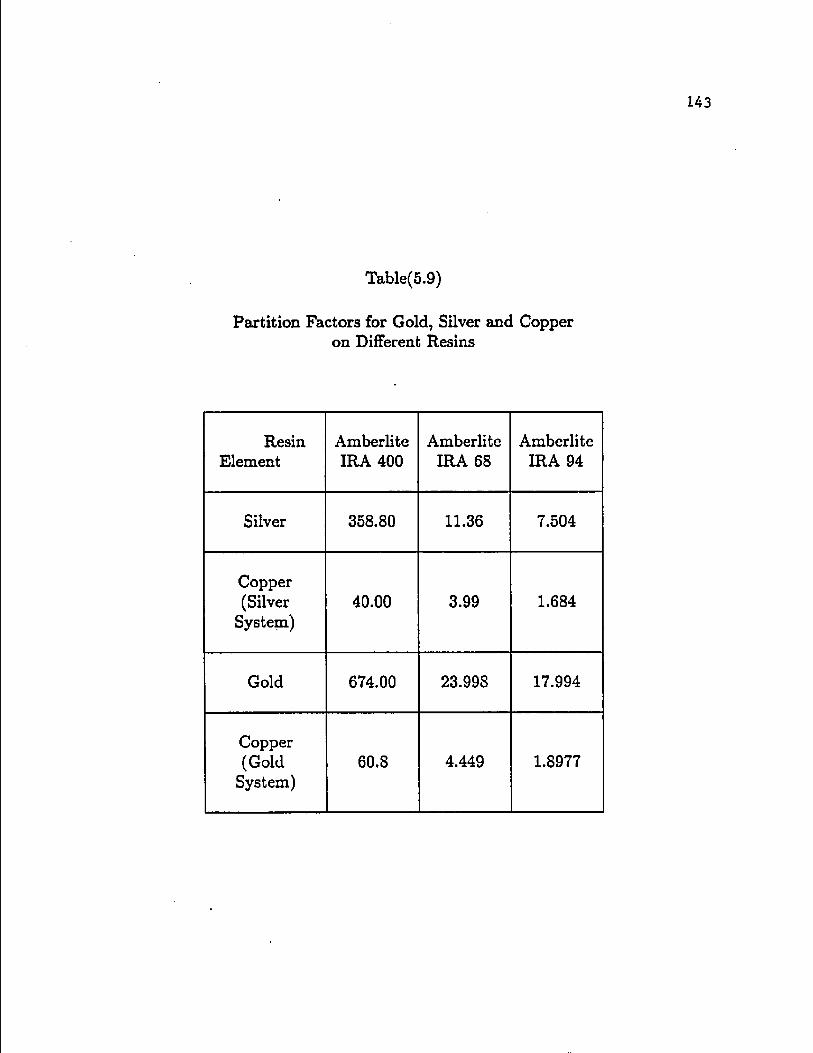
Table(5.9)
Partition Factors for Gold, Silver and Copper on Different Resins
Resin Element
Amberlite IRA 400
Amberlite IRA 68
Amberlite IRA 94
Silver 358.80 11.36 7.504
Copper (Silver
System) 40.00 3.99 1.684
Gold 674.00 23.998 17.994
Copper (Gold
System) 60.8 4.449 1.8977
144
relation
resin K - (5.4)
f^bulk aoln.
A value of partition factor greater than one would indicate that
the concentration of solute in resin is greater than the concentration
of solute in the solution. Table 5.9 indicates that the partition of
gold between the resin and solution is much higher than that of silver
or copper. All these three elements can be seen to be present in larger
quantities on IRA-400 resin than IRA-68 or IRA-94 (see Table 5.9).
Table 5.10 gives the selectivity coefficient, S^, of the resins
for the adsorption experiments. These coefficients are calculated by the
following relation (see Section 2.3)
[Ag or Au]resin [Cu]bulk solni — t • • • • * t • • (5.5)
[Ag or Au]bulk fioln> [Cu]resin
These data indicate that IRA-400 has a better selectivity for
both gold and silver than IRA-68 or IRA-94. On the basis of this, it is
better to use IRA-400 resin for loading these metals. The above results
were also reported by the previous researchers [7,51,58,61].
Trends of peculiar nature were observed in the experiments done
to study the elution characteristics of IRA-400 and IRA-68 resins with
respect to silver-copper and gold-copper ammoniacal thiosulfate systems.
Three different concentrations of ammonium thiosulfate were used as
regenerant solutions. Ammonium thiosulfate was selected on the basis of
work done by Chou [7]. He reported that 30 wt.% ammonium thiosulfate,

Table(5.10)
Selectivity Coefficients for the Resins in the Silver-Copper and Gold-Copper Thiosulfate Systems During the Loading Phase
Experiment With SA{Ag/Cu) SA(AU/CU)
0.324M NHZ 8.643 10.231
1.765M NH3 57.31 -
50 wt.% NaOH - 21.732
N Q-iSiOz 12.57 26.39
{NHa)2S20* 8.613 10.231
150 rpm. 8.252 20.701
500 rpm. 8.967 11.159
1300 rpm. 7.125 6.926

Table(5.10) continued
Experiment With SA^Ag/Cu) SA(AU/CU)
Dry Resin 7.026 -
Wet Resin 8.967 -
250 mv. 8.967 -
450 mv. 8.14 -
550 mv. 7.89 -
Amberlite IRA 400 8.967 10.23
Amberlite IRA 68 2.842 5.394
Amberlite IRA 94 4.46 9.842
147
compared to other reagents, was able to strip the maximum amount of
silver from the resin surface. He loaded the resin with sliver present
in photographic wash water. Table 5.11 gives the selectivity
coefficients, SD, for these resins during the elution phase with respect
to silver-copper and gold-copper systems. These coefficients are the
ratios of amount of silver or gold and copper left on the resin surface
after elution with ammonium thlosulfate. This can be expressed by the
equation
[Ag or Au]left on resin
[Culleft on resin
A smaller Sq indicates better selective elution. It can be
concluded from Table 5.11 that both IRA-400 and IRA-68 show better
elution characteristics with the use of a 2.7 M thlosulfate solution for
silver-copper system. For the gold-copper system, IRA-400 is most
selectively stripped of gold with 1.8 M thlosulfate solution, while IRA-
68 required 2.7 M thlosulfate solution.
On the overall, it can be said from the above discussion that
with the use of IRA-400 resin, selective recovery of both gold and
silver can be obtained from the ammoniacal thlosulfate leach systems
containing copper. But, Amberlite IRA-68 has the best stripping
characters.
5.2.2. Variation In the thlosulfate concentration:
The variation in the thiosulfate concentration has a very
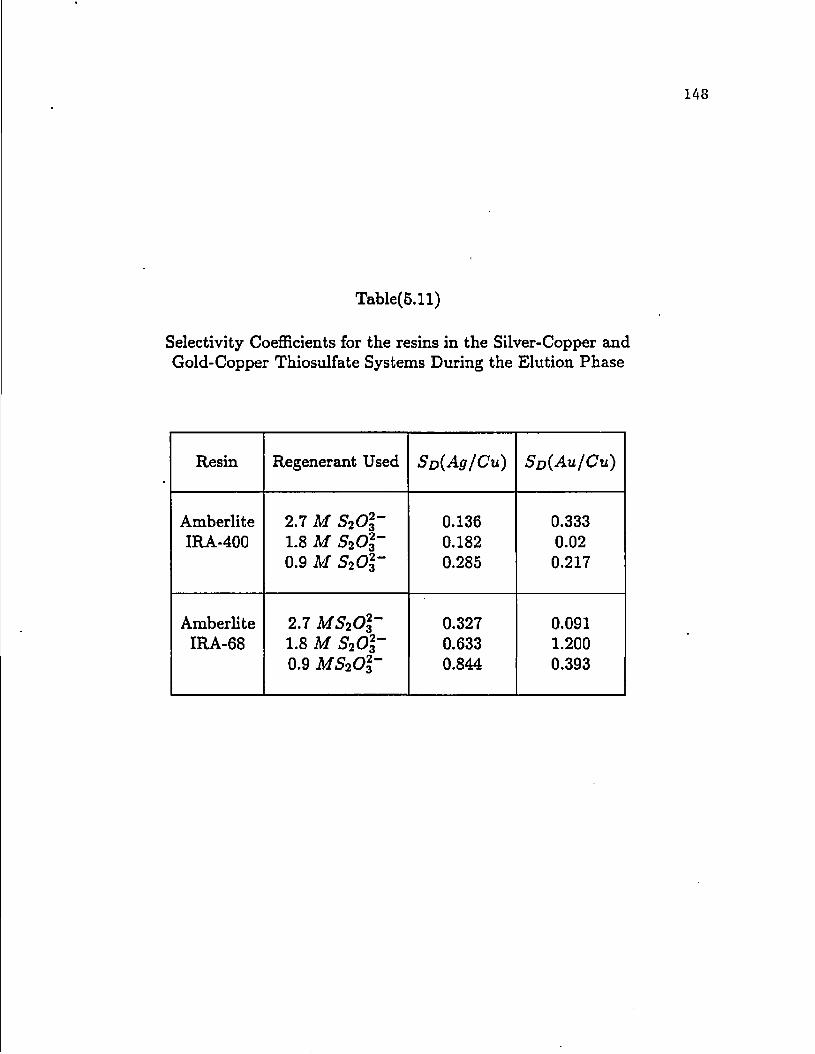
Table(5.11)
Selectivity Coefficients for the resins in the Silver-Copper and Gold-Copper Thiosulfate Systems During the Elution Phase
Resin Regenerant Used SoiAg/Cu) Sd{Au/CU)
Amberlite 2.7 M S2Ol~ 0.136 0.333 IRA-400 1.8 M S2Ol~ 0.182 0.02
0.9 M S20\- 0.285 0.217
Amberlite 2.7 MS2Ol~ 0.327 0.091 IRA-68 1.8 M S202
3~ 0.633 1.200 0.9 MS20\- 0.844 0.393
149
little effect on the stability of the regions of silver and gold
thiosulfate complexes (Figure 4.4). This may be due to the very small
amounts of gold and silver present in the ammoniacal thiosulfate
solutions. In the experiments to load silver onto IRA-400 resin (Figure
4.8 a), better silver loading was obtained when solution concentration
of thiosulfate was low. Nearly 4.5 mg./gra. silver was loaded with 0.18 M
thiosulfate in the ammoniacal thiosulfate system, whereas only 1.7
mg./gm. silver was loaded with 0.90 M thiosulfate present. This may be
due to the increase in the number of free thiosulfate ions with the rise
in thiosulfate concentration. These free ions may be competing with
Ag(S20^)3^~ ions for the active sites on the resin. There is also a
possibility of some thiosulfate (SjOj ) ions oxidizing to tetrathionate
p (S^Og ) ions with the increase in solution potential due to the
increase in thiosulfate concentration. Anions having high molecular
weight usually exhibit high exchange potentials [47], As such, IRA-400
o . resin might be more selective for tetrathionate (S^Og ) than
thiosulfate (S2O3 ) because of the increase in the size of the ion.
5.2.3. Effect of copper on sliver extraction:
The kinetics of silver and gold recovery by ammoniacal
thiosulfate leaching was reported to be enhanced by the presence of
copper salt [4,8-10,21,22,25-32]. Unfortunately the presence of copper
in the solution seems to have an adverse effect on the subsequent silver
loading (see Figures 4.8 (b) and 4.9). There was a drop in the amount of
silver adsorbed by IRA-400 resin, When copper concentration was
150
increased (4.5 mg./g» 2.2 mg./gm. and 1.25 mg./gm. silver was adsorbed
with 0.0 H, 0.0031 M and 0.0125 M copper present in the ammoniacal
thiosulfate leach system, respectively). This may be due to the
utilization of more of the free thiosulfate ions in the leach system to
form more of cuprous thiosulfate ions with the rise in copper
concentration. This change is also observed in the Eh-pH diagrams
constructed for CU-S2O3 -NH3-H2O system (Figures 4.2 and 4.3). These
cuprous thiosulfate ions may be competing with silver thiosulfate ions
for the active sites on the IRA-400 resin. According to Table 5.3, about
21.4% and 2.16% of the active sites on the IRA-400 resin were occupied
by copper and silver thiosulfate complexes, respectively. These values
are reported on the basis of 0.0031 M copper and 20 ppm. silver present
in the leach solution. Similar trends have been reported by Stamboliadis
et al [5,11] for cyanide solution. They found that 73.7% and 1.47% of
the total resin capacity were occupied by copper and gold or silver
anionic complexes.
Copper should be present as copper thiosulfate for it to be
loaded onto the anionic IRA-400 resin. But according to the Eh-pH
diagram (Figures 4.6 a, b), when the Eh is 230 mv. and pH is 10, copper
should be present as cupric amine in the solution. In spite of this, it
is surprising to note that the silver loading by Amberlite IRA-400 resin
decreased in the presence of copper. Yet another very important
observation was that after a certain time desorption of silver was
noticed with the presence of copper in the leach system. This may be due
to the escape of some ammonia from the system during the course of the
151
experiment which would shrink the stability region of cupric amine and
expand that of cuprous thiosulfate. This is supported by the
experimental observation that there was a change in color from dark blue
to light blue at the end of the experiment. This clearly shows that
cuprous thiosulfate can displace adsorbed silver from the resin.
According to Figure 4.9, when the silver-loaded resin is placed in an
ammoniacal thiosulfate solution containing only copper, about 0.5
mg./gra. silver was desorbed. However, from Figure 4.8 (b), more loaded
silver than this (as much as 1 mg./gm.) was desorbed by the end of the
experiment (60 min.). A small desorption of loaded copper is also
evident from Figure 4.8. These trends indicate that copper is not the
only species responsible for the desorption of silver from the resin. It
may be that other anions such as thiosulfate or tetrathionate ions might
be competing for the active sites on the Amberlite IRA-400 resin.
5.2.4. Effect of ammonia on silver - copper system :
The rise in silver adsorption with the rise in the ammonia
concentration (Figure 4.11 a) may be attributed to an increase in the
conversion of cuprous thiosulfate to cupric amine ions. The leach
solution conditions were such that cuprous thiosulfate, Cu(S20<j)3^~,
o i and cupric amine, Cu(NH<j)^ , were the most stable species in the
silver-copper leach system with 0.324 M and 1.765 M ammonia respectively
24-(Figure 4.6). The region of stability of the cupric amine, (^(NHj)^ ,
expanded with the rise in ammonia concentration. These conclusions are
supported by the experimental observations that there was a drop in the
152
amount of copper adsorbed and increase in the silver loaded by IRA-400
resin (Figure 4.11). Amberlite IRA-400 resin present in the leach system
with high concentration of ammonia (1.765 M) has more selectivity for
silver than when it is present in the leach system with 0.324 M ammonia
(Table 5.10).
5.2.5 Effect of variation In the initial silver concentration:
The amount of silver loaded onto IRA-400 increased with the
increase in the initial concentration of silver added to the leach
system (Figure 4.12). This literally indicates that more of silver
thiosulfate complex ions should have formed. An attempt was made to fit
the data to a Freundllch type adsorption isotherm [82]:
[Ag]eq, resin " a[Ag] ̂ ^ ̂ eqw soln. • (^.7)
where a and n are constants with n > 1.
This isotherm states that with the increase in equilibrium
concentration of silver in the leach solution. more of silver can be * t
loaded onto the resin. Freundlich isotherm assumes that sites of
different activity exist on the resin. This isotherm is derived by
assuming Langmuir adsorption at each type of site. A plot of log [Ag]e(j
resin and lo&[AS]eq. soln. whlch appears in Figure 5.1, indicates that
Freundlich equation indeed fits the data. A linear regression analysis
is used to fit the data [Appendix B].
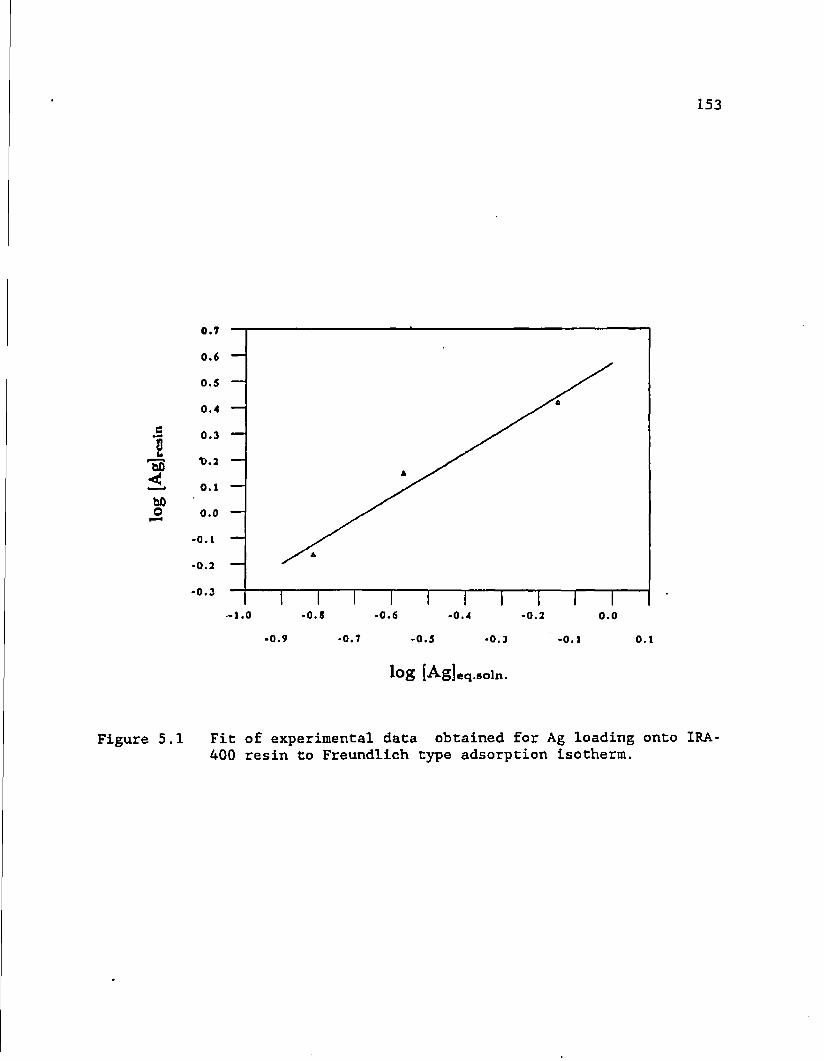
153
Figure 5.1 Fit of experimental data obtained for Ag loading onto IRA 400 resin to Freundlich type adsorption isotherm.
154
5.2.6 Increase of solution potential with sodium hypochlorite;
o . o _ Pourbaix diagrams for Ag-Cu-S20<j -NH3-H2O and AU-CU-S2O3 -NH3-
H2O systems for the low (0.324 M) and high (1.765 M) concentrations of
ammonia are shown in Figures 4.6 and 4.7. According to these figures,
for the leach solution conditions and 1.765 M ammonia, the most stable
5 - 1+ species are Ag(S203>3 and CuCNI^)^ for the silver system, Whereas
in the ammoniacal thiosulfate leach system with 0.324 M ammonia,
Ag(8203)3"'" very stable but the Eh values are such that cuprous
thiosulfate, £^(5203)3"*", is the stable species of copper in the leach
system (Figures 4.6 a). The presence of cuprous thiosulfate in the
solution is not desirable in view of the anion exchange resins used. In
the case of gold, it may be existing as either gold thiosulfate or gold
amine depending on the strengths of thiosulfate and ammonia present in
the solution (see Figures 4.4 (b) and 4.5). At lower concentrations of
ammonia, the occurance of gold thiosulfate complex Is more higher. Also,
there is a probability of gold being present as a complex of both
ammonia and thiosulfate {AuNH3(S203)2 ) • The existence of this complex
is higher at higher concentrations of thiosulfate and lower
concentrations of ammonia. Most of the experiments in this study were
run using 0.324 M ammonia, as it was found that variation in ammonia
beyond this concentration had a negligible effect on the loading of
silver and copper onto IRA-400 (see Figure 4.11),
In order to overcome the problem of the existence of copper
thiosulfate in the solution, oxidising agents such as sodium
hypochlorite, sodium chlorate and hydrogen peroxide were used to raise
155
the solution potential to higher levels so that the more stable copper
species would be cupric ammine. In this study, only sodium hypochlorite
was found to be useful and was able to increase the solution potentials
to two different levels (450 mv. and 550 mv.). A decrease in both silver
and copper adsorptions by IRA-400 was noticed with the use of sodium
hypochlorite. Without sodium hypochlorite, about 0.91 mg./gm. silver and
5.4 mg./gm. copper were adsorbed, as compared to 0.30 mg./gm. silver and
0.51 mg./gm. copper when the solution potential was raised to 450 mv.
Loading dropped further to 0.21 mg./gm, silver and 0.33 mg./gm. copper
by increasing the potential to 550 mv.(Figure 4.16). The color of leach
solution remained dark blue at solution potentials of 450 mv. and 550
mv. throughout the experiments, indicating the presence of cupric amine.
On the otherhand, the color varied from dark blue to light blue without
sodium hypochlorite (at normal solution potential). Thus, it can be
concluded that the decrease in copper adsorption with the rise in
solution potential may be due to the conversion of most of the copper to
the cationic cupric ammine form. Unfortunately, the silver loading onto
IRA-400 also drastically decreased on increasing the solution potential.
This may be explained by the oxidation of thiosulfate necessary to
complex silver to tetrathionate. The free thiosulfate and tetrathionate
ions should be competing with the formed silver thiosulfate ions for the
active sites on the resin. By the comparison of the selectivity
coefficients (Table 5.10) calculated for the ammoniacal thiosulfate
systems at different solution potentials, it can be said that at normal
potentials IRA-400 had better selectivity for silver than when the

156
system was at 450 mv. or 550 mv, It can also be noted from this table
that the selectivity coefficients for IRA-400 at different solution
potentials differed by small values. However, more of silver was
adsorbed at normal potentials. In conclusion, it can be said that
raising the solution potential is not a useful method to increase the
selective loading of silver from the ammoniacal thiosulfate solutions
containing copper.
A vigorous exothermic reaction occurred when hydrogen peroxide
was used to increase the potential of the ammoniacal thiosulfate
solution (see Section 4.2.1.9). This reaction was accompanied with the
evolution of a lot of oxygen. These effects may be due to the
decomposition of hydrogen peroxide into water and oxygen, which can be
represented by the following reaction
2H202 <-> 2H20 + 02 (5.8)
Sodium chlorate is a good oxidising agent in acidic media. As
such, when it was used to increase the potential of the alkaline
ammoniacal thiosulfate solution, the Eh decreased. Hence, both hydrogen
peroxide and sodium chlorate turned out to be of no use in this study.
5.2.7 Effect of variation in agitation:
It is evident from Figures 4.10 and 4.19 that the loading of
silver, gold and copper was significantly affected by the degree of
agitation. This points to film diffusion being a possible rate
controlling step. The particular mechanism controlling the loading of
157
these metals onto the resin Is also dependent on other factors such as
temperature and concentration of different Ions present In the solution.
A film diffusion (external mass transfer control) model can be
postulated as follows (Appendix C):
1 dN - - - - - - - - f e f [ ( G y J ^ i k - ( C v ) s u r f a c e 1 ( 5 . 9 )
. N4Ha dt
where,
dNv Rate of Change of Metal Content (moles)
dt in the bulk solution.
(Cv)bulk —" Concentration of metal in bulk solution.
(Cv)surface "— Concentration of metal at the surface of the resin.
a Radius of a resin particle.
N Total number of resin particles in the system.
kf .... External mass transfer coefficient.
If film diffusion is the rate controlling step, a plot of ln(-Xv)
vs. t should yield a straight line and from the slope of the plot the
mass transfer coefficient can be calculated [84]. A plot of the
experimental data at different agitation speeds according to equation
(5.9) appears in Figures 5.2 and 5.3. These figures indicate that the
uptake of gold, silver and copper at different stirring speeds might be
film diffusion controlled for an initial period of the experiment (about
20 min.). The specific diffusion mechanism controlling the uptake of

158
1.50
1.25
1.00
0.75
0.50
0.25
0.00
0 30 60 10 30 40 50
(a) Time, min.
>
0 .6
0.5 —
0.4 —
0.3 —
0 . 2 —
0.1
0.0 —J
(b)
20 30 40
Time, min.
o 150 rpn. a 500 rim. o 1300 rpm.
60
Figure 5,2 Fit of experimental data obtained for Ag (a) and Cu (b) loading onto IRA-400 resin to the film diffusion model.

159
> x
i
3.0
2.5 —
2.0 —
1.5 —
« 1.0 —
0.5 —
0.0
(a) 30 40
Time, min.
O 150 rpn. A 500 rpn. • 1300 rpn.
T 50 <0
0.7
0.6 —1
0.5 —
0.4 —
0.3 —
0 . 2 —
0.1 —
0.0
(b)
20 30 40
Time, min.
O 150 rpn. a 500 rpa. a 1300 rpn.
«0
Figure 5.3 Fit of experimental data obtained for Au (a) and Cu (b) loading onto IRA-400 resin to the film diffusion model.
160
silver, gold and copper by IRA-400 can be thoroughly understood by
carrying out experiments such as the effect of temperature and
interruption tests. For an interruption test, the resin and solution are
mixed for a finite time and then separated to allow the exchanging ions
to diffuse into the resin and to the exchange sites. This Interruption
is usually carried out for a predetermined period of time. Only with
particle diffusion control is the exchange rate higher upon rcimmersion
than at the moment of interruption, because internal concentration
gradients have had time to level out [43,85].
At the highest stirring speed (1300 rpm.), a large vortex, which
might have trapped more oxygen in the leach system, was observed. The
trapped oxygen may oxidize some of the thiosulfate to tetrathionate
leading to a decrease in the formation of silver and copper thiosulfate
complexes. Stirring at lower speeds (150 and 500 rpm.) did not have
much of an effect on the loading of silver or copper by IRA-400. This
supports the idea that the oxidising conditions were not very much
enhanced with the lower degrees of agitation. Hence, all the experiments
were performed at 500 rpm. Stirring was found to have the same effects
on the ammoniacal thiosulfate leach system with gold and copper.
Selectivity of Araberlite IRA-400 resin was found to be better for silver
at 500 rpm. and gold at 150 rpm. (Table 5.10).
5.2.8 Effect of use different compounds of thiosulfate:
The presence of the thiosulfate compounds (either sodium
thiosulfate or ammonium thiosulfate) in the solution were able to form

161
the anionic thiosulfate complexes of gold and silver in the ammoniacal
thlosulfate solutions. The existence of these anionic complexes is very
much preferred in view of the anionic resins used in this research. When
sodium thiosulfate was used as a source of thiosulfate, initially less
copper was adsorbed compared to that with the use of ammonium
thiosulfate In the silver-copper ammoniacal thiosulfate system (ammonium
hydroxide was present in either cases) (Figure 4.13 b) . This may be due
to the reaction of sodium thiosulfate with ammonium hydroxide leading to
the formation of sodium hydroxide according to the following reaction
Na2S2°3 + 2nh40h <_> 2NaOH + 2NH3 + S2032" + 2H+ (5.10)
This reaction should result in an increase of pH of the solution.
Experimentally, it was found that the pH of the solution was 11.8 for
the first 20 minutes and then decreased to 10.7 by the end of the
experiment. So, by the Eh-pH diagram for the Ag-Cu-S203 -NH3-H2O system
(Figure 5.4), initially cupric oxide (CuO) was present in the system.
But as time passed by the free ammonia must have been used up in the
2+ formation of cupric amine, (^(NHj)^ , or escaped leading to the
decrease in the pH. But the decreasing trend in Eh was such that cuprous
thiosulfate was the most stable species from about 20 minutes to the end
of the experiment. Hence, more copper was adsorbed onto .the IRA-400 in
the final stage of the experiment.
There was very little difference in the silver adsorption with
the use of either sodium thlosulfate or ammonium thiosulfate in the
system (see Figure 4.13 a). This may be due to the fact that the most

162
1.2 Nil,
1.0 CuO
0.8
CuO 0.6
W 0-4 Begin
0.2 CuS End
0.0
-O.S
0 4 0 8 10 2 12 14
Figure 5.4 Trend observed in Eh and pH values in an experimental run with Na2S203 in a solution containing Ag and Cu.
163
c _ stable species is silver thiosulfate, Ag(S203)3 , at the solution
conditions by the use of either compounds of thiosulfate (Figure 4.6).
Calculation of selectivity coefficients indicate that Amberlite IRA-400
in the solution with sodium thiosulfate has more affinity for silver
(Table 5.10). The difference in the selectivity coefficients indicate
that these values also depend on the amount of copper adsorbed.
The use of sodium thiosulfate as a source of thiosulfate was
found to have not much affect on the gold - copper systems. The loadings
of gold and copper onto Amberlite IRA-400 were about the same in both
the systems (Figures 4.21). Amberlite IRA-400 resin has more affinity
for gold in the leach system with sodium thiosulfate (Table 5'. 10).
5.2.9 Desorption studies on Amberlite IRA-400 and Amberlite IRA-68:
These studies were done to investigate the elution
characteristics of IRA-400 and IRA-68 resins with respect to loaded
silver, gold and copper. In the case of IRA 400, as the concentration of
thiosulfate regenerant increased, the elution of copper decreased
(Figures 4,17 and 4.23). This somewhat puzzling result may be due to the
formation of C^S precipitate on the resin bead at the high thiosulfate
concentration. At high thiosulfate concentration, highly reducing
conditions may develop around the copper and silver (or gold) loaded
surface sites on the resin bead resulting in the formation of C^S, as
predicted by the Pourbaix diagrams (Figures 4,6 (a) and 4.7 (a)). In
fact, formation of a black precipitate (typical of C^S) was noticed
during the elution tests. The formation of C^S precipitate in copper

164
containing anunoniacal thiosulfate solutions has been reported by other
researchers [4,9,10,22,27,69,86].
However, the same reasoning doesn't seem to hold good for the4
case of IRA-68 (Figures 4.18 and 4.24). This may be due to the fact that
IRA-68 does not load as much copper as IRA-400 (Figures 4.15 and 4.20).
5.3 Column studies
Ion exchange operations are usually carried out in columns [41].
Ion exchange resin is placed in a vertical column to form a densely
packed bed. The feed solution continuously enters the column and barren
solution leaves the column. The process proceeds until the resin has
been loaded and a "breakthrough" (see Section 2.3) has occurred. At this
point, the resin can be eluted for use in another operation. In
equilibrium operation, the solution continuously contacts the resin free
of solute, and consequently there is a high driving force for the
removal of solute from solution. By columnar operations, extreme removal
of solute is obtained [41]. In spite of the importance of column
operations, it was not performed in this research because of the large
quantities of gold and silver leach solutions required to achieve the
breakthrough point. Table 5.12 gives the total number of bed volumes of
the ammoniacal thiosulfate solution of 20 ppm. silver or gold strength
required to totally load a resin bed with these precious metals. Values
are reported for three types of resins used in this study. Usually the
minimum bed depth and diameter of the columns are 24 in. (61 cm.) and 1
in. (2.54 cm.) respectively. On the basis of these dimensions, each bed
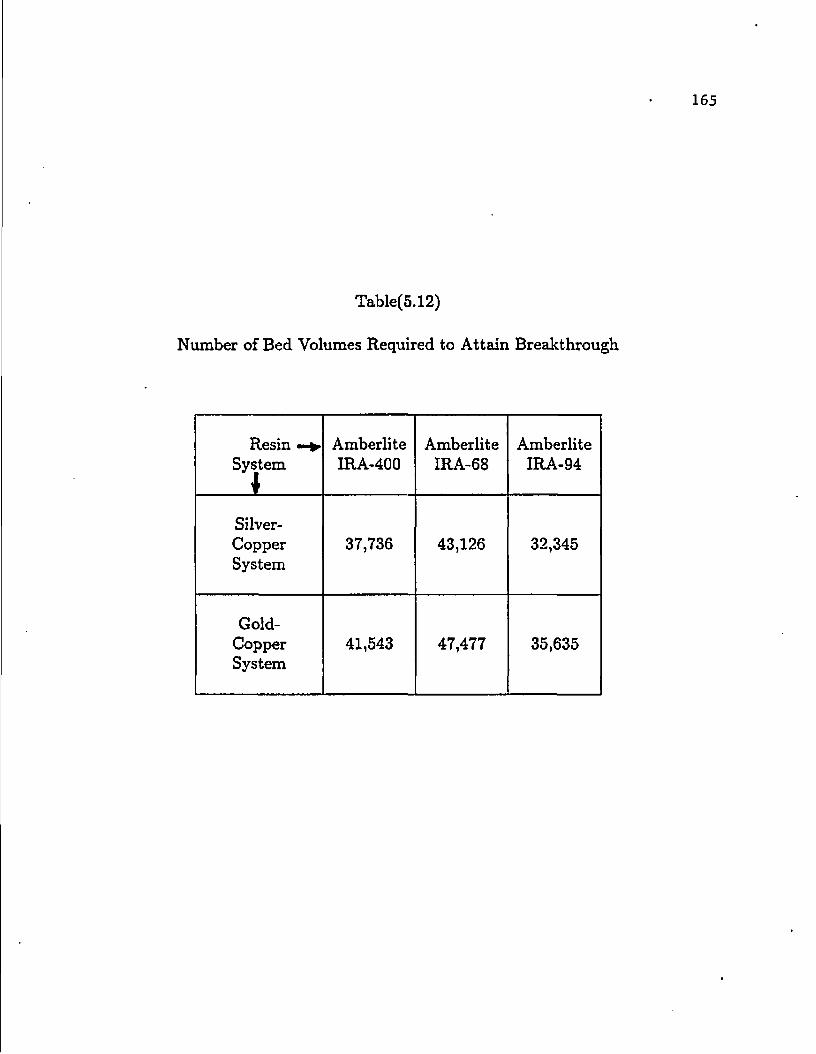
Table(5.12)
Number of Bed Volumes Required to Attain Breakthrough
Resin •-* System
J
Amberlite IRA-400
Amberlite IRA-68
Amberlite IRA-94
Silver-Copper System
37,736 43,126 32,345
Gold-Copper System
41,543 47,477 35,635
166
volume of the resin has a capacity of about 0.225 liters (see Appendix
D). According to Table 5.12, large quantities of ammoniacal thiosulfate
leach solution with 20 ppm. gold or silver were required to achieve the
breakthrough of the resins under study. These results are supported by
the work done by Chou [7] on the recovery of silver from photographic
waste waters. It was observed that a sharp breakthrough occurred after
2700 bed volumes for IRA 400 and after 1700 bed volumes for IRA 68
(Figure 5.5). The effluent silver concentration of IRA 400 remained
below 500 ppb. (parts per billion) until breakthrough occurred. In this
work, each bed volume had a capacity of about 0.1 liter and 15 ppm.
silver was present in the solution. Such large quantities of the gold
and silver leach solutions that were required to attain breakthrough
was beyond the scope of this research.

167
3
IRA-68 I
9
T
5
3
35 40 30 IS 20 25 Bii Volum* Trtotcd X10"1
O 5 10
Figure 5.5 Comparison of exhaustion characteristic curves between IRA-400 and IRA-68 resins using Process ECP-2 wash water [after Chou (reference no. 7)].

160
CHAPTER 6
CONCLUSIONS
1. On the basis of the Pourbaix diagrams, thiosulfate complex of
silver is the most stable species in ammoniacal thiosulfate solution at
a Eh of 230 mv. and a pH of 10. Whereas, at these solution conditions
either gold thiosulfate or gold amine is the most stable species
depending on the concentration of thiosulfate and amonia.
2. The stable species of copper for the solution conditions of
the ammoniacal thiosulfate system is either cuprous thiosulphate or
cupric amine complex. The stability of these species are affected by the
variations in the concentrations of ammonia, thiosulfate and copper.
3. Anionic resins should be more suitable for the recovery of
gold and silver from ammoniacal thiosulfate leach liquors containing
copper at the solution conditions (Eh - 230 mv. and pH - 10) of interest
in this research.
4. Amberlite IRA-400, a strong base gel-type anionic resin, has
maximum capacity for both gold and silver. Amberlite IRA-68, a weak base
gel-type anionic resin, has slightly better adsorption capacity than
Amberlite IRA-94, a weak base macrorecticular-type anionic resin. This
indicates that gel-type resins have slightly higher capacities than
macroreticular-type resins and strong base resins are better than weak
base resins.
165
5. The loading of silver onto these resins must be in the form
5 * of anionic thiosulfate complex, Ag(S20.j).j . Whereas, gold may be
loading as either anionic thiosulfate complex {Au(S2C>3)2 1 or anionic
O complex formed by both thiosulfate and ammonia {Au(NH3>(8203)2 }.
6. Silver adsorption by Amberlite IRA-400 resin increased with
the decrease in the concentration of ammonium thiosulfate and copper
present in the system. The same may hold good for loading of gold
complexes.
7. Gold, silver and copper adsorption by Amberlite IRA-400 was
affected by the variation in the degree of agitation of the ammoniacal
thiosulfate solution. The decrease in loading of these metals at higher
degree of agitation may be due to the higher rate of oxidation of
thiosulfate to tetrathionate.
8. Sodium hypochlorite can be used to increase the solution
potential of the ammoniacal thiosulfate system, so that cupric amine
will be the most stable copper complex. Unfortunately, a decrease in the
amount of silver loading onto Amberlite IRA-400 was observed. This
decreasing trend increased with the rise in the solution potential.
9. Use of sodium hydroxide in place of ammonia to maintain the
required solution alkalinity was found to have no particular added
advantages in the recovery of gold and silver with Amberlite IRA-400
resin. The same was observed with the use of sodium thiosulfate instead
of ammonium thiosulfate in the system.
170
10. The elution characteristics of Amberlite IRA-400 and
Amberlite IRA-68 resins for copper, gold and silver showed peculiar
trends. They did not follow a particular order with respect to the
concentration of thiosulfate solutions used as the eluting reagents.
11. Desorption of gold from Amberlite IRA-400 was quite
difficult even with 2.7 M thiosulfate solution added as ammonium
thiosulfate. Amberlite IRA-68 exhibits slightly better elution
characteristics than Amberlite IRA-400. Elution of silver from both IRA-
400 and IRA-68 is much better than gold.
12. On the basis of the selectivity coefficients calculated,
selective elution of copper from silver does not seem promising for the
resins investigated. Reasonable selectivity can be achieved between
elution of copper and gold.
13. A black precipitate, typical of copper sulphide (C^S), was
observed to form at higher concentrations of thiosulfate solution used
as regenerant for eluting loaded gold, silver and copper from Amberlite
IRA-400 and Amberlite IRA-68 resins. This may be due to the increase in
the reducing power of thiosulfate with the increase in its
concentration.
14. At the higher concentrations of thiosulfate solution used as
the eluting agent, there is a possibilty of some of the loaded gold and
silver thiosulfate complexes getting trapped in the copper sulphide
precipitate formed around the resin beads. There is a great chance of
171
silver sulphide, Ag2S, forming at high concentrations of thiosulfate
solution.

172
APPENDIX A
MAXIMUM THEORETICAL LOADING OF COMPETING ANIONIC SPECIES IN SOLUTION
APPENDIX Al Maximum Theoretical Thiosulfate Loading
APPENDIX A2, Maximum Theoretical Tetrathionate Loading
APPENDIX A3 Maximum Theoretical Silver Thiosulfate Loading
APPENDIX A4 Maximum Theoretical Gold Thiosulfate Loading
APPENDIX A5 Maximum Theoretical Copper Thiosulfate Loading
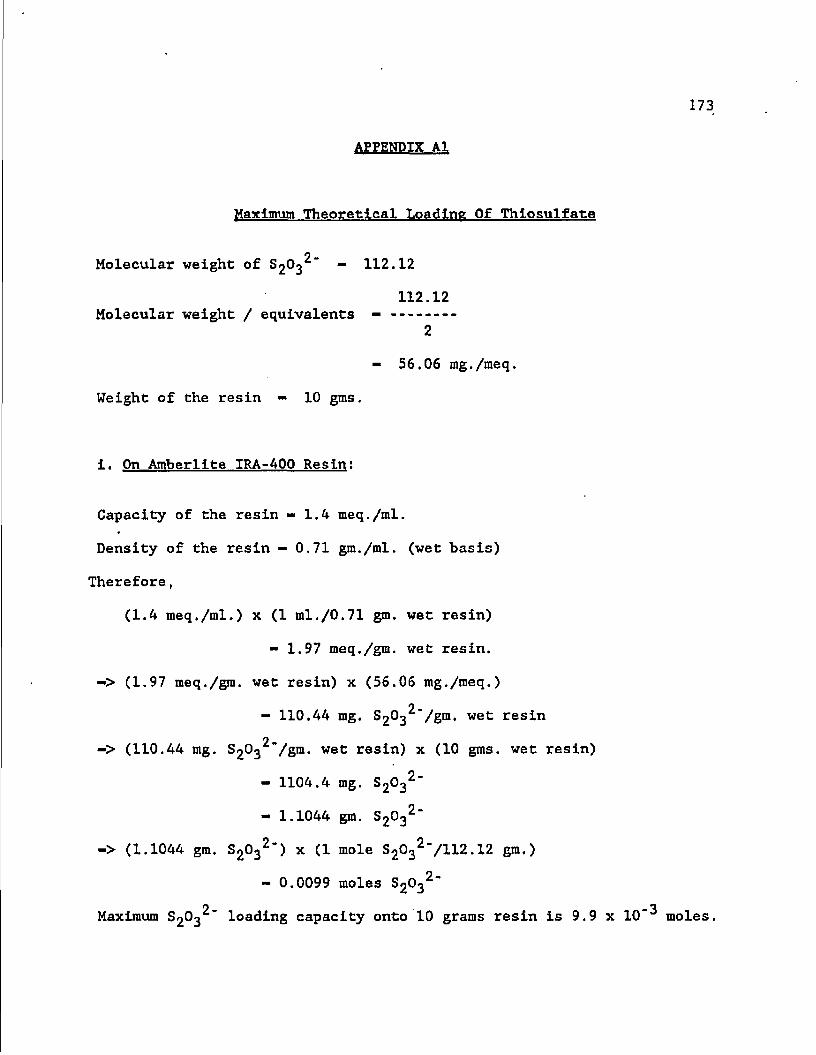
APPENDIX A1
173
Maximum Theoretical Loading Of Thlosulfate
Molecular weight of 8203^" - 112.12
112.12 Molecular weight / equivalents —
2
- 56.06 mg./meq.
Weight of the resin - 10 gms.
i. On Amberllte IRA-400 Resin:
Capacity of the resin - 1.4 meq./ml.
Density of the resin - 0.71 gm./ml. (wet basis)
Therefore,
(1.4 meq./ml.) x (1 ml./0.71 gm. wet resin)
- 1.97 meq./gm. wet resin.
-> (1.97 meq./gra. wet resin) x (56.06 mg./meq.)
- 110.44 mg. S2O3 /gm. wet resin
O * -> (110.44 mg. S2O3 /gm. wet resin) x (10 gms. wet resin)
- 1104.4 mg. S2032"
- 1.1044 gm. S2032"
-> (1.1044 gm. S2O32") x (1 mole S2032"/112.12 gra.)
- 0.0099 moles S2O32"
0 - 3 Maximum S2O3 loading capacity onto 10 grams resin is 9.9 x 10 moles.
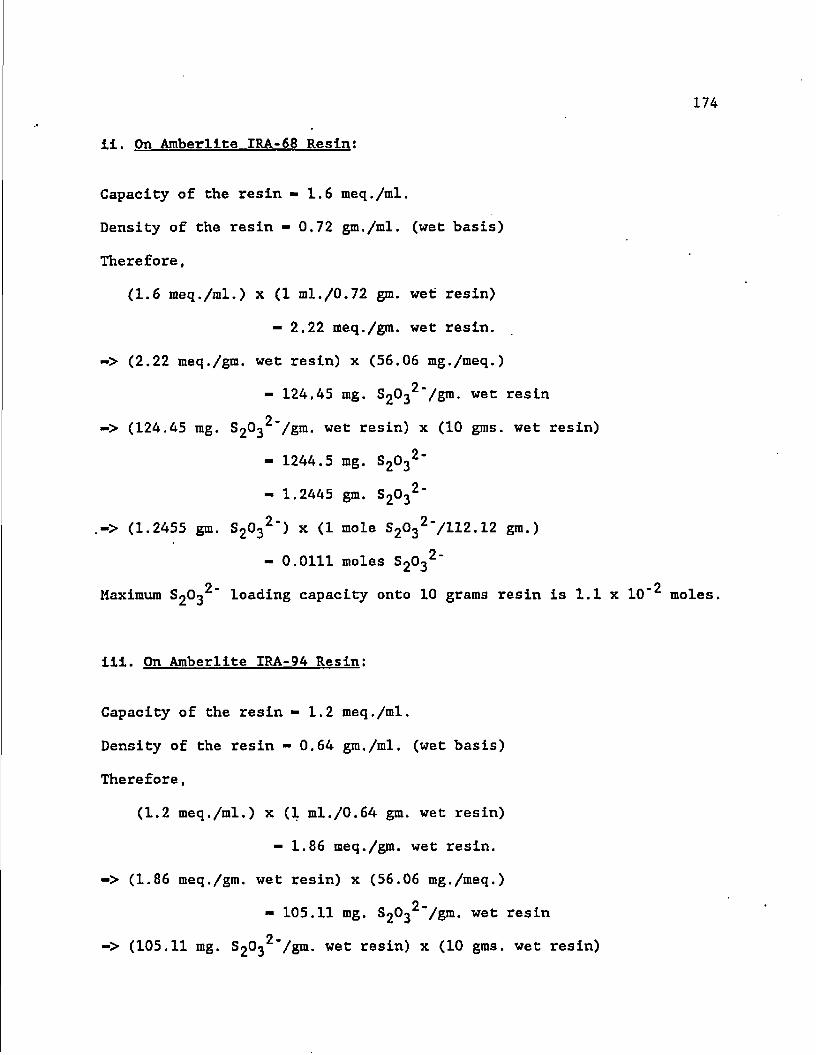
174
ii. On Amberllte IRA-68 Resin:
Capacity of the resin - 1.6 meq./ml.
Density of the resin - 0,72 gm./ml. (wet basis)
Therefore,
(1.6 m e q . / m l.) x (1 ml./0.72 gm. wet: resin)
- 2.22 meq./gm. wet resin.
-> (2.22 meq./gm. wet resin) x (56.06 mg./meq.)
9 . - 124,45 mg. S203 /gm. wet resin
o. -> (124.45 mg. S203 /gm. wet resin) x (10 gms. wet resin)
- 1244.5 mg. S2032"
- 1.2445 gm. S2032"
.-> (1.2455 gm. S2032') x (1 mole S2032"/H2.12 gm.)
- 0.0111 moles S2032-
9 o
Maximum S203 loading capacity onto 10 grams resin is 1.1 x 10 moles,
ill. On Amberllte IRA-94 Resin:
Capacity of the resin •• 1.2 meq./ml.
Density of the resin - 0.64 gm./ml. (wet basis)
Therefore,
(1.2 meq./ml.) x (1 ml./0.64 gm. wet resin)
- 1.86 meq./gm. wet resin.
-> (1.86 meq./gm. wet resin) x (56.06 mg./meq.)
9 „
- 105.11 mg. S203 /gm. wet resin
9 -> (105.11 mg. S203 /gm. wet resin) x (10 gms. wet resin)

175
- 1051.1 mg. S2032*
- 1.0511 gm. S2O32"
-> (1.0511 gra. S2O32") x (1 mole S203^"/112.12 gm.)
- 0.0094 moles SJOJ2"
9 Q Maximum S2O3 loading capacity onto 10 grams resin is 9.4 x 10 moles.
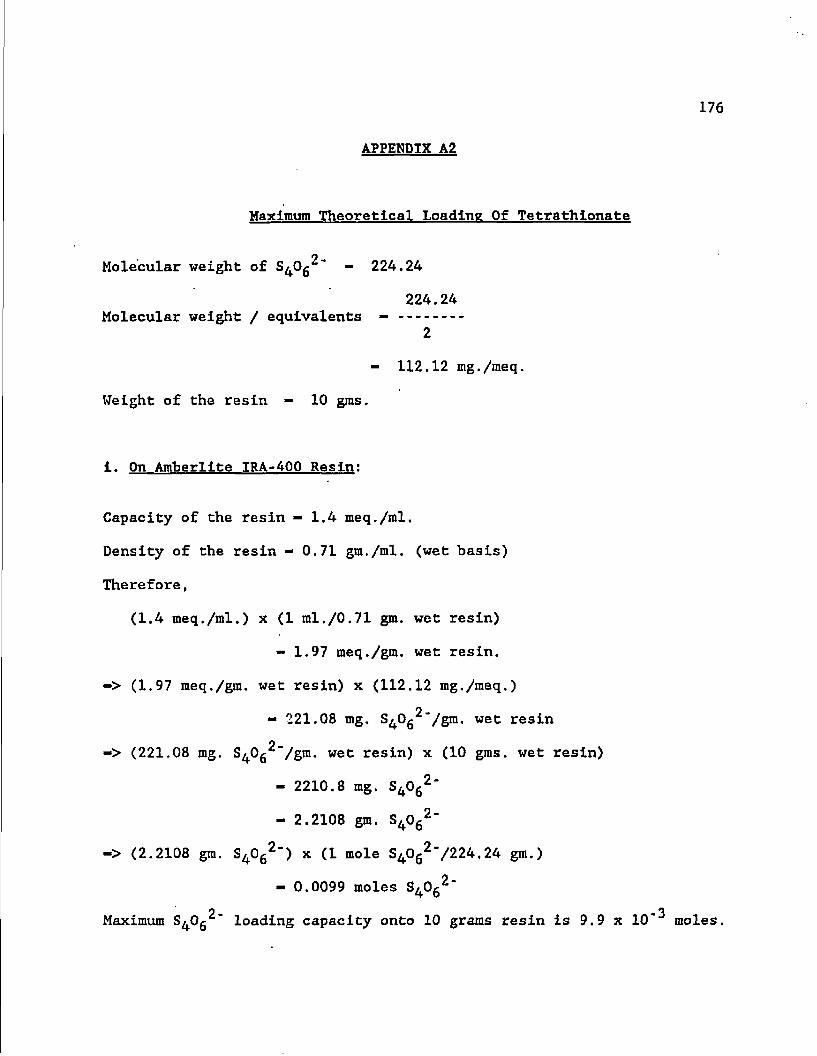
176
APPENDIX A2
Maximum Theoretical Loading Of Tetrathlonate
Molecular weight of S^Og2"* - 224.24
224.24 Molecular weight / equivalents -
2
- 112.12 mg./meq.
Weight of the resin - 10 gms.
1. On Amberllte IRA-400 Resin:
Capacity of the resin - 1.4 meq./ml.
Density of the resin - 0.71 gra./ml. (wet basis)
Therefore,
(1.4 meq./ml.) x (1 ml./0.71 gm. wet resin)
- 1.97 meq./gm. wet resin.
-> (1.97 meq./gm. wet resin) x (112.12 mg./meq.)
- 221.08 mg. S^Og^'/gm. wet resin
-> (221.08 mg. S^Og^'/gm. wet resin) x (10 gms. wet resin)
- 2210.8 mg. S40g2"
- 2.2108 gm. S40g2"
-> (2.2108 gm. S^Og2") x (1 mole S40g2"/224.24 gm.)
- 0.0099 moles S^Og2"
2- -3 Maximum S^Og loading capacity onto 10 grams resin is 9.9 x 10 moles.
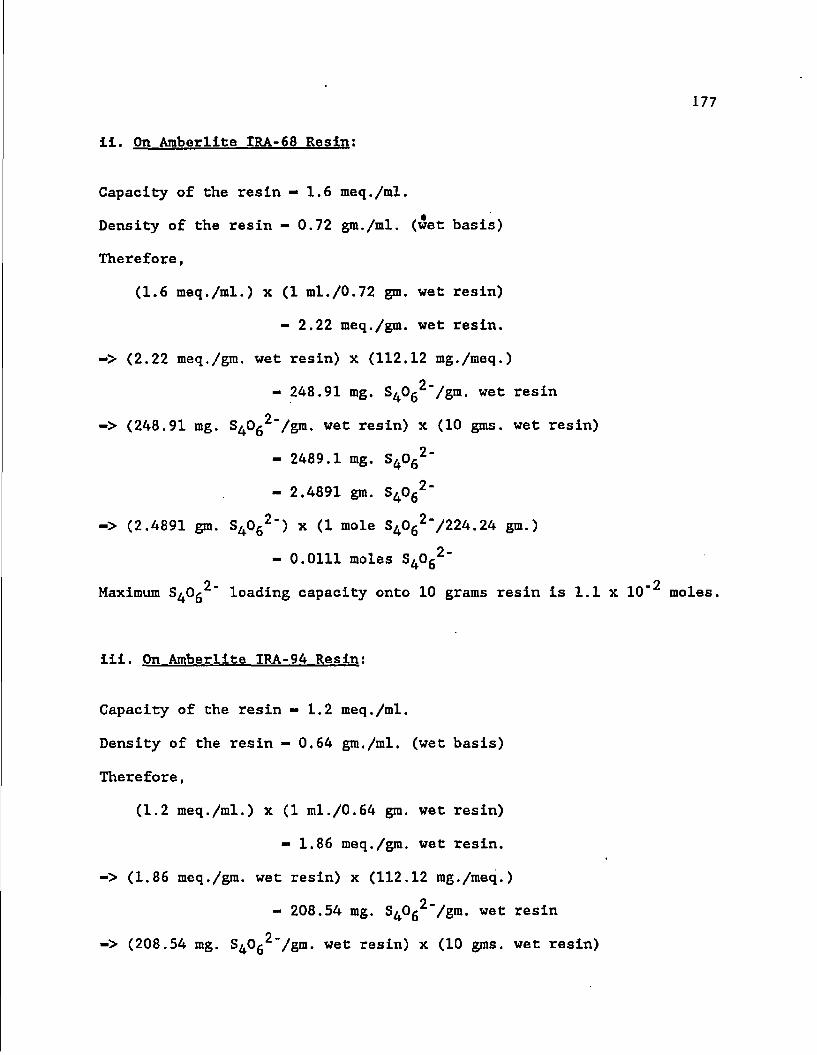
177
II. On Amberllte IRA-68 Resin:
Capacity of the resin -1.6 meq./ml.
Density of the resin - 0.72 gm./ml. (wet basis)
Therefore,
(1.6 meq./ml.) x (1 ml./0.72 gm. wet resin)
- 2.22 meq./gm. wet resin.
-> (2.22 meq./gra, wet resin) x (112.12 mg./meq.)
- 248.91 mg. S^Og^'/gni. wet resin
-> (248.91 mg. S^Og^'/gm. wet resin) x (10 gms. wet resin)
- 2489.1 mg. S4Ofi2"
- 2.4891 gm. S4062"
-> (2.4891 gm. S^Og2') x (1 mole S40g2*/224.24 gm.)
- 0.0111 moles S^Og2"
9 -2 Maximum S^Og loading capacity onto 10 grams resin is 1.1 x 10 moles.
Hi. On Amberllte IRA-94 Resin:
Capacity of the resin - 1.2 meq./ml.
Density of the resin - 0.64 gm./ml. (wet basis)
Therefore,
(1.2 meq./ml.) x (1 ml./0.64 gm. wet resin)
- 1.86 meq./gm. wet resin.
-> (1.86 meq./gra. wet resin) x (112.12 mg./meq.)
- 208.54 mg. S40g2"/gm. wet resin
-> (208.54 mg. S^Og^Vgm. wet resin) x (10 gms. wet resin)
178
- 2085.4 mg. S^Og^"*
- 2.0854 gm. S^Og^"
-> (2.0854 gm. S^Og^") x (1 mole S^Og^"/224.24 gm.)
- 0.0093 moles S^Og^"
o _ ri Maximum S^Og loading capacity onto 10 grams resin Is 9.3 x 10 moles.

179
APPENDIX A3
Maximum Theoretical Loading Of Sliver Thlosulfate
Molecular weight of Ag(S203)3"'~ — 444.24
444.24 Molecular weight / equivalents -
5
- 88.85 mg./meq.
Weight of the resin - 10 gms.
1. On Amberllte IRA-400 Resin:
Capacity of the resin - 1.4 meq./ml.
Density of the resin - 0.71 gm./ml. (wet basis)
Therefore,
(1.4 m e q . / m l . ) x (1 ml./0.71 gm. wet resin)
- 1.97 meq./gm. wet resin,
-> (1.97 meq./gra. wet resin) x (88.85 mg./meq.)
- 175.04 mg. Ag(S203)3^"/gm. wet resin
-> {175.04 mg. Ag(S203)-j^"/gm. wet resin} x (10 gms. wet resin)
- 1750.4 mg. Ag^jOg^"*"
- 1.7504 gm. Ag(S203)3^"
-> {1.7504 gm. Ag(S203)3^"} x {1 mole Ag(S203)3^"/444.24 gm.)
- 0.0039 moles Ag(S203)3^"
c _ *3 Maximum Ag(S203)3 loading capacity onto 10 grams resin is 3.9 x 10
moles.
180
11. On Amberllte IRA-68 Resin:
Capacity of the resin - 1.6 meq./ml.
Density of the resin - 0.72 gm./ml. (wet basis)
Therefore,
(1.6 meq./ml.) x (1 ml./0.72 gm. wet resin)
- 2.22 meq./gm. wet resin.
-> (2.22 meq./gm. wet resin) x (88.85 mg./meq.)
- 197.25 mg. Ag(S203)35"/gm. wet resin
-> {197.25 mg. Ag(S203)35'/gm. wet resin) x {10 gms. wet resin)
- 1972.5 mg. Ag(S203)3^"
- 1.9725 gm. Ag(S203)3̂ ~
-> {1.9725 gra. Ag(S203)35") x (1 mole Ag(S203)35"/444.24 gm.)
- 0.0044 moles Ag(S203)3̂ "
c _ o Maximum Ag(S203)3 loading capacity onto 10 grams resin is 4.4 x 10
moles.
ill. On Amberllte IRA-94 Resin:
Capacity of the resin - 1.2 meq./ml.
Density of the resin - 0.64 gm./ml. (wet basis)
Therefore,
(1.2 meq./ml.) x (1 ml./0.64 gm. wet resin)
- 1.86 meq./gm. wet resin.
-> (1.86 meq./gm. wet resin) x (88.85 mg./meq.)
C „ - 165.26 mg. Ag(S203)3 /gm. wet resin
181
-> (165.26 mg. Ag(S203)32"/gm. wet resin) x (10 gms. wet resin)
- 1652.6 mg. Ag(S203)35"
- 1.6526 gm. Ag(S203>32" .
-> (1.6526 gm. Ag^OjJg5") x (1 mole Ag(S203)35"/^44.24 gm.)
- 0.0037 moles Ag(S203)3"*~
c _ 3 Maximum Ag(S203)3 loading capacity onto 10 grams resin is 3.7 x 10
moles.
182
APPENDIX A4
Maximum Theoretical Loading Of Gold Thlosulfate
Molecular weight of AU(S20J)2^" — 421.44
421.44 Molecular weight / equivalents -
3
- 140.48 mg./meq.
Weight of the resin - 10 gins.
i. On Amberllte IRA-400 Resin:
Capacity of the resin - 1.4 meq./ml.
Density of the resin - 0.71 gm./ral. (wet basis)
Therefore,
(1.4 meq./ml.) x (1 ml./0.71 gm. wet resin)
- 1.97 meq./gm. wet resin.
-> (1.97 raeq./gra. wet resin) x (140.48 mg./meq.)
- 276.75 mg. Au(S203)2 /gm. wet resin
-> {276.75 mg. Au(S203)2^"/gni. wet resin) x {10 gms. wet resin)
- 2767.5 mg. AU(S20.J)2^~
- 2.7675 gm. AU(S203)2^~
-> {2.7675 gm. AU(S20<J)2''~ ) x {1 mole AU(S203>2^"/421 .44 gm.)
- 0.0066 moles Au(S20"j)2^~
3 -3 Maximum Au(S203)2 loading capacity onto 10 grams resin is 6.6 x 10
moles.

183
II. On Amberlite IRA-68 Resin:
Capacity of the resin — 1.6 meq./ml.
Density of the resin - 0.72 gm./ml. (wet basis)
Therefore,
(1.6 meq./ml.) x (1 ml./0.72 gm. wet resin)
- 2.22 meq./gm. wet resin. .
-> (2.22 meq./gm. wet resin) x (140.48 mg./meq.)
- 311.87 mg. Au(S203)2^Vgni. wet resin
O -> {311.87 mg. AU(S203)2 /gm. wet resin) x {10 gms. wet resin)
- 3118.7 mg. AU(S203)2^"
- 3.1187 gm. AU(S203)2^"
-> {3.1187 gm. Au(S203)2^") x {1 mole Au(S203)2^"/421.44 gm.)
- 0.0074 moles Au(S203)2^"
*1 .3 Maximum Au(S203)2 loading capacity onto 10 grams resin is 7.4 x 10
moles.
ii. On Amberlite IRA-94 Resin:
Capacity of the resin - 1.2 meq./ml.
Density of the resin - 0.64 gm./ml. (wet basis)
Therefore,
(1.2 meq./ml.) x (1 ml./0.64 gm. wet resin)
- 1.86 meq./gm. wet resin.
-> (1.86 meq./gm. wet resin) x (140.48 mg./meq.)
- 261.29 mg. Au(S203)23"/gni. wet resin
184
-> (261.29 mg. AuCSjOj^^Vgm. wet resin) x {10 gms. wet resin}
- 2612.9 mg. AU(S203)2^"
- 2.6129 gm. Au(S203>2^"
-> {2.6129 gm. AU(S203)23~) X {1 mole Au(S203)/hll.44 gra.)
- 0.0062 moles Au(S203>2^~
Q -3 Maximum AU(S20.J)2 loading capacity onto 10 grams resin is 6.2 x 10
moles,

185
APPENDIX A5
Maximum Theoretical Loading Of Copper Thlosulfate
Molecular weight of (^(8203)3"'" - 399.93
399.93 Molecular weight / equivalents -
5
- 79.99 mg./meq.
Weight of the resin - 10 gms.
1. On Amberllte IRA-400 Resin:
Capacity of the resin - 1.4 meq./ml.
Density of the resin - 0.71 gm,/ml. (wet basis)
Therefore,
(1.4 meq./ml.) x (1 ml./0.71 gm. wet resin)
- 1.97 meq./gm. wet resin.
-> (1.97 meq./gm. wet resin) x (79.99 mg./meq.)
- 157.58 mg. Cu(S203)3^"/gm. wet resin
C -> (157.58 mg. Cu(S203)3 /gm. wet resin) x {10 gms. wet resin)
- 1575.8 mg. Cu(S203)3''~
- 1.5758 gm. Cu(S203)35"
-> {1.5758 gm. Cu(S203)3^") x {1 mole Cu(S203)3^"/399.93 gm.)
- 0.0039 moles Cu(S203)3^"
c .3 Maximum Cu(S203)3 loading capacity onto 10 grams resin is 3.9 x 10
moles.

186
ii. On Amberlite IRA-68 Resin:
Capacity of the resin - 1.6 meq./ml.
Density of the resin - 0.72 gm./ml. (wet basis)
Therefore,
(1.6 meq./ml.) x (1 ml./0.72 gm. wet resin)
- 2.22 meq./gm. wet resin.
-> (2.22 meq./gm. wet resin) x (79.99 mg./meq.)
- 177.58 mg. Cu(S203)3^~/gra. wet resin
e -> [177.58 rag. 011(8203)3 /gm. wet resin} x {10 gms. wet resin}
- 1775.8 mg. Cu(S203)35"
- 1.7758 gm. Cu(S203)35"
-> (1.7758 gm. Cu(S203)35") x {1 mole Cu(S203)35"/399.93 gm.}
- 0.0044 moles Cu(S203)3*'~
C _ O Maximum (^(8203)3 loading capacity onto 10 grams resin is 4.4 x 10
moles.
lii. On Amberlite IRA-94 Resin:
Capacity of the resin - 1.2 meq./ml.
Density of the resin - 0.64 gm./ml. (wet basis)
Therefore,
(1.2 meq./ml.) x (1 ml./0.64 gm. wet resin)
- 1.86 meq./gm. wet resin.
-> (1.86 meq./gm. wet resin) x (79.99 mg./meq.)
- 148.78 mg. Cu(S203)3^"/gm. wet resin

1S7
C -> {148.78 mg. Cu(S203)3 /gm. wet resin} x (10 gms. wet resln}
- 1487.8 mg. Cu(S203)35"
- 1.4878 gm. Cu(S203)35" .
-> (1.4878 gm. Cu(S203)3^") x (1 mole Cu(S203)3^"/399.93 gm.)
- 0.0037 moles ^(8263)3^"
C „ O Maximum 011(8203)3 loading capacity onto 10 grams resin is 3.7 x 10
moles.
APPENDIX B
STATISTICAL LINEAR REGRESSION MODEL TO FIT DATA

APPENDIX B 189
Liner Regression Model vlth an Intercept at the Origin
The linear regression model minimizes the sum of the squares of
the residuals, where the residual is the difference between the
experimental data point and the best fitting line.
The data points are given as (x^.y^), (X2iy2) • • • suc^
that:
yi - bxx
y i
y3
— bXr
bx-:
y„ - bx_ -'n n
The minimization process can be obtained by taking the derivative
and setting it equal to zero, or by taking the matrix and multiplying
through by its transpose.
matrix A -
X1
x2
x3
n
, coefficient b - [b], matrix B -
yi
y i
y z
rn
The transpose of A - A - xn]
AATb - ATB

n , n
<£ *i ) <b> - S *1*1 i-1 i-1
n b - li xiyi
i-1
190
X1
x2
X3J
[X^Xj.XJ , » • • f xj [b] - [x 1 ,x 2 lx 3 l . . . xn ] n
y z
y 3
* n 'n
n s . x i 1-1
191
APPENDIX CI
APPENDIX C2
APPENDIX C3
APPENDIX C4
APPENDIX C5
APPENDIX C
APPLICATION OF FILM DIFFUSION MODEL TO GOLD, SILVER AND COPPER LOADING ONTO AMBERLITE IRA-400 RESIN
Derivation Of Film Diffusion Model
Silver Loading Onto Amberlite IRA-400 Resin
Copper (From Ag-Cu System) Loading onto Amberlite IRA-400 Resin
Gold Loading Onto Amberlite IRA-400 Resin
Copper (From Au-Cu System) Loading Onto Amberlite IRA-400 Resin

APPENDIX CI
Derivation Of Film Diffusion model
Solution volume V • - 500 ml.
Resin 16 - 30 mesh
Average diameter of resin - 0.046 cm.
rQ - 0.023 cm.
1 dNv " kft<cv>bulk " ^v^ surface]
-NB(4Hr02 ) dt ^v^ surface]
<Cv)bulk concentration of metal in bulk
surface concentration of metal at resin surface
NB number of resin beads
V dCv 9 ~ kf<cv>bulk
Nb<^V ) dt
surface " 0 at surface
NB (4TCr02)
Let K -V
dcv - -Kkfdt
Cv
Integration yields the following result

193
In C, -Kkft t
0
In Cv - In Cv° - -Kkft
K -log (1 - X^,) - kft
2.303
Kkf Let b -
2.303
-log (1 - V - b t
A plot of -log (1 - Xy) vs. t should yield a straight line with
slope b if film diffusion is rate controlling.
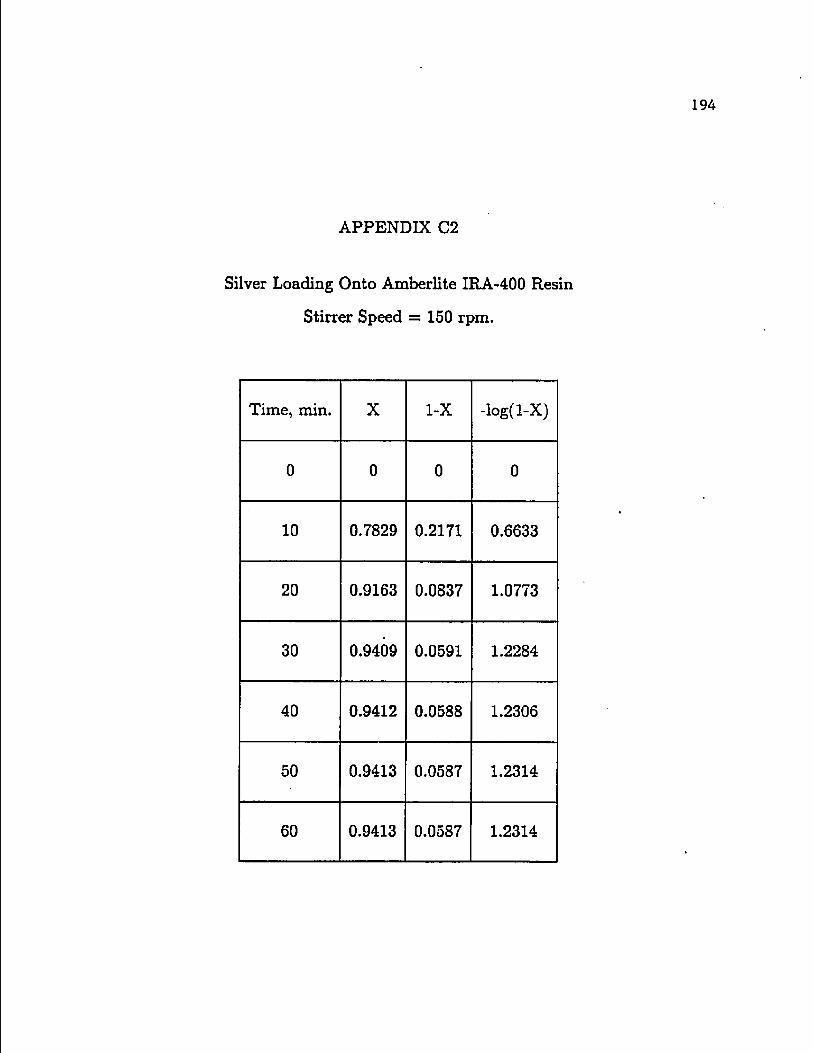
APPENDIX C2
Silver Loading Onto Amberlite IRA-400 Resin
Stirrer Speed = 150 rpm.
Time, min. X 1-X -log(l-X)
0 0 0 0
10 0.7829 0.2171 0.6633
20 0.9163 0.0837 1.0773
30 0.9409 0.0591 1.2284
40 0.9412 0.0588 1.2306
50 0.9413 0.0587 1.2314
60 0.9413 0.0587 1.2314

APPENDIX C2 (continued)
Silver Loading Onto Amberlite IRA-400 Resin
Stirrer Speed = 500 rpm.
Time, min. X 1-X -log(l-X)
0 0 0 0
10 0.8951 0.1049 0.9792
20 0.9268 0.0732 1.1355
30 0.9362 0.063S 1.1952
40 0.9324 0.0676 1.1701
50 0.9213 0.0787 1.1040
60 0.9145 0.0855 1.0680

APPENDIX C2 (coatinued)
Silver Loading Onto Amberlite IRA-400 Resin
Stirrer Speed = 1300 rpm.
Time, min. X 1-X -log(l-X)
0 0 0 0
10 0.8503 0.1497 0.8248
20 0.8771 0.1229 0.9105
30 0.8611 0.1389 0.8573
40 0.8584 0.1416 0.8489
50 0.8476 0.1524 0.8170
60 0.8236 0.1764 0.7535
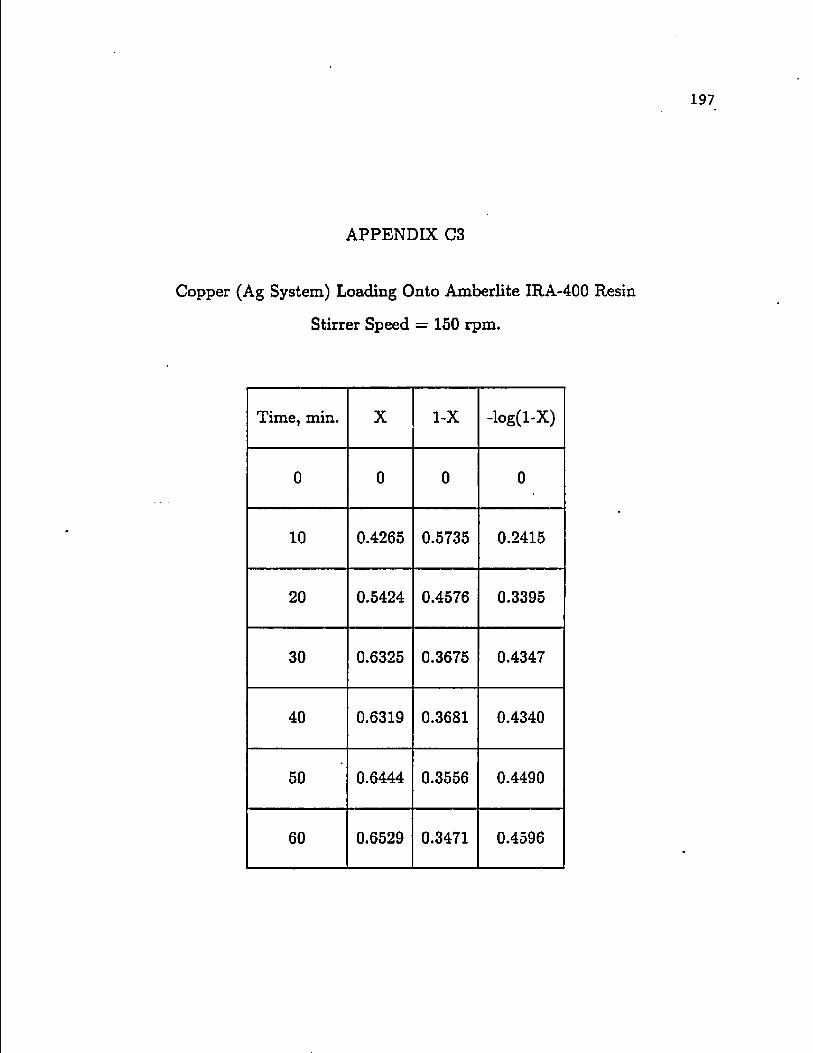
APPENDIX C3
Copper (Ag System) Loading Onto Amberlite IRA-400 Resin
Stirrer Speed = 150 rpm.
Time, min. X 1-X -log(l-X)
0 0 0 0
10 0.4265 0.5735 0.2415
20 0.5424 0.4576 0.3395
30 0.6325 0.3675 0.4347
40 0.6319 0.3681 0.4340
50 0.6444 0.3556 0.4490
60 0.6529 0.3471 0.4596

198
APPENDIX C3 (continued)
Copper (Ag System) Loading Onto Amberlite IRA-400 Resin
Stirrer Speed = 500 rpm.
Time, min. X 1-X -log(l-X)
0 0 0 0
10 0.5458 0.4542 0.3428
20 0.5775 0.4225 0.3742
30 0.5947 0.4053 0.3922
40 0.5794 0.4206 0.3761
50 0.5500 0.4500 0.3468
60 0.5368 0.4632 0.3342

APPENDIX C3 (continued)
Copper (Ag System) Loading Onto Amberlite IRA-400 Resin
Stirrer Speed = 1300 rpm.
Time, min. X 1-X -log(l-X)
0 0 0 0
10 0.4312 0.5688 0.2450
20 0.4548 0.5452 0.2634
30 0.5566 0.4434 0.3532
40 0.4312 0.5688 0.2450
50 0.4230 0.5770 0.2388
60 0.3875 0.6125 0.2129

APPENDIX C4
Gold Loading Onto Amberlite IRA-400 Resin
Stirrer Speed = 150 rpm.
Time, min. X 1-X -log(l-X)
0 0 0 0
10 0.9693 0.0307 1.5129
20 0.9877 0.0123 1.9101 •
30 0.9953 0.0047 2.3279
40 0.9877 0.0123 1.9101
50 0.9755 0.0245 1.610S
60 0.9693 0.0307 1.5129

APPENDD? C4 (continued)
Gold Loading Onto Amberlite IRA-400 Resin
Stirrer Speed = 500 rpm.
Time, min. X 1-X -log(l-X)'
0 0 0 0
10 0.9433 0.0567 1.2464
20 0.9552 0.0048 2.3188
30 0.9642 0.0358 1.4461
40 0.9552 0.0048 1.3487
50 0.9463 0.0537 1.2700
60 0.9493 0.0507 1.2950

APPENDIX C4 (continued)
Gold Loading Onto Amberlite IRA-400 Resin
Stirrer Speed = 1300 rpm.
Time, min. X 1-X -log(l-X)
0 0 0 0
10 0.6576 0.3424 0.4655
20 0.9305 0.0695 1.1580
30 0.9251 0.0749 1.1255
40 0.9144 0.0856 1.0675
50 0.8984 0.1016 0.9931
60 0.8824 0.1176 0.9296

203
APPENDIX C5
Copper (Au System) Loading Onto Amberlite IRA-400 Resin
Stirrer Speed = 150 rpm.
Time, min. X 1-X -log(l-X)
0 0 0 0
10 0.5096 0.4904 0.3095
20 0.6084 0.3916 0.4072
30 0.6521 0.3479 0.4585
40 0.6814 0.3186 0.4968
50 0.6892 0.3108 0.5075
60 0.7030 0.2970 0.5272
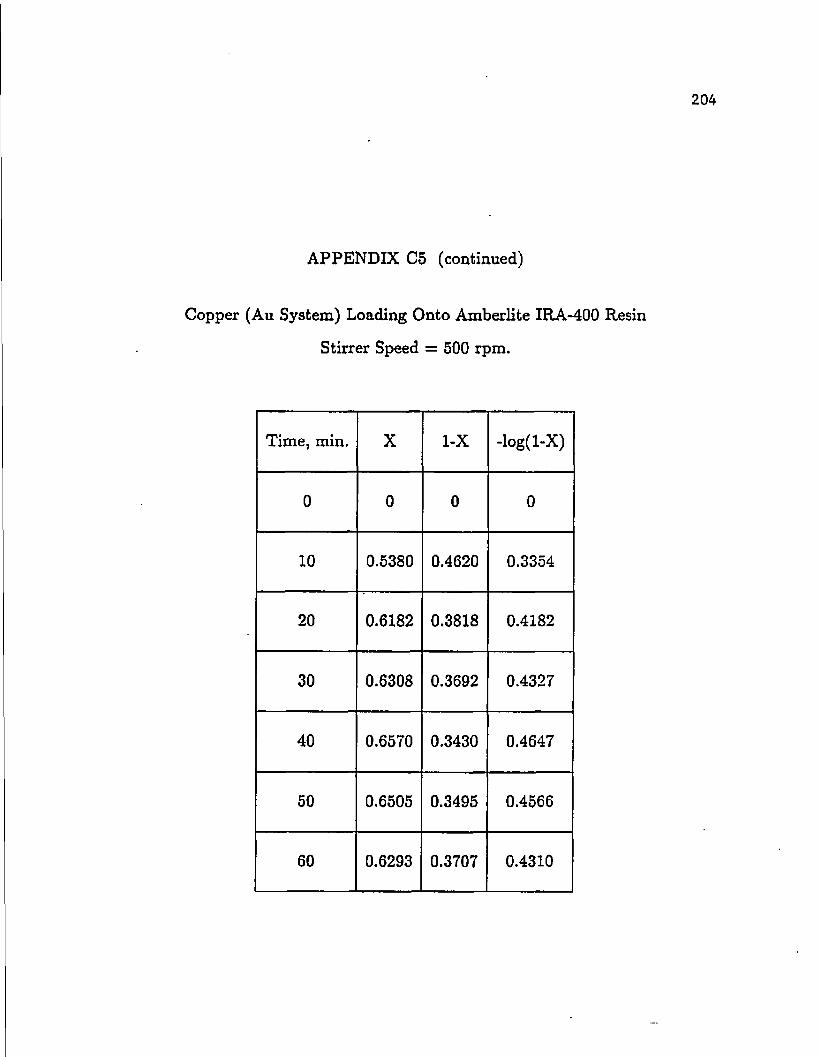
APPENDIX C5 (continued)
Copper (Au System) Loading Onto Amberlite IRA-400 Resin
Stirrer Speed = 500 rpm.
Time, min. X 1-X -log(l-X)
0 0 0 0
10 0.5380 0.4620 0.3354
20 0.6182 0.3818 0.4182
30 0.6308 0.3692 0.4327
40 0.6570 0.3430 0.4647
50 0.6505 0.3495 0.4566
60 0.6293 0.3707 0.4310
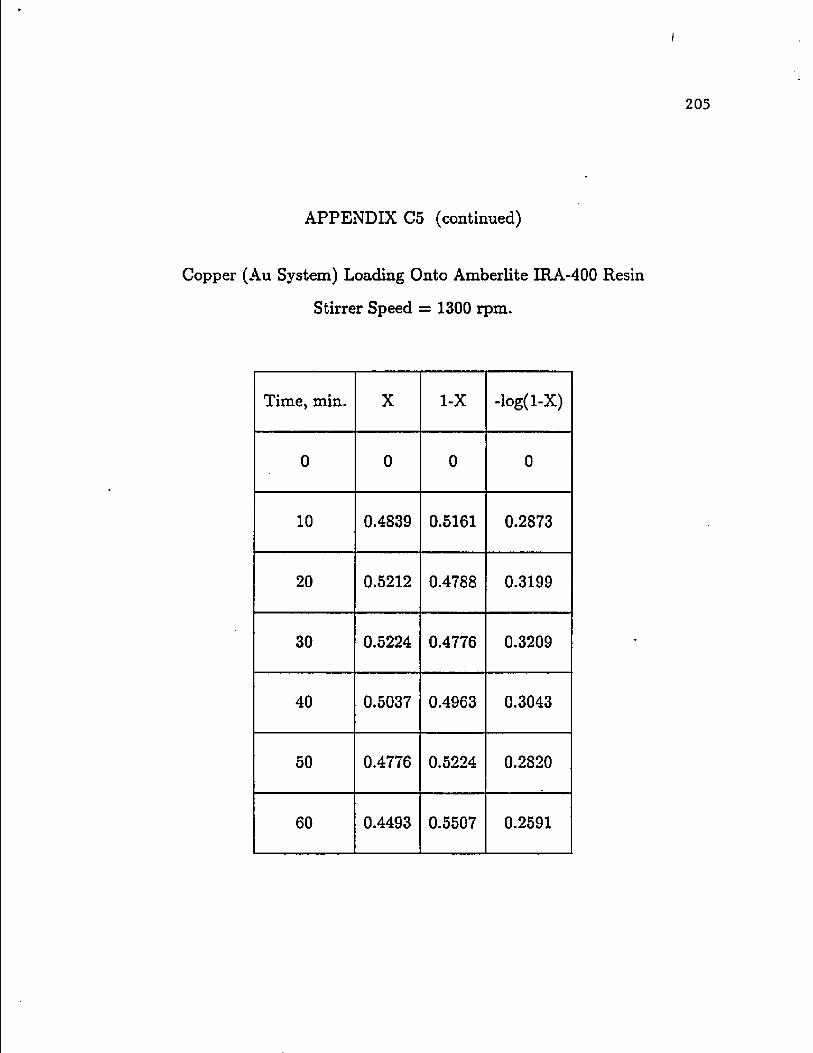
APPENDIX C5 (continued)
Copper (Au System) Loading Onto Amberlite IRA-400 Resin
Stirrer Speed = 1300 rpm.
Time, min. X 1-X -log(l-X)
0 0 0 0
10 0.4839 0.5161 0.2873
20 0.5212 0.4788 0.3199
30 0.5224 0.4776 0.3209
40 0.5037 0.4963 0.3043
50 0.4776 0.5224 0.2820
60 0.4493 0.5507 0.2591

206
APPENDIX D
BED VOLUMES OF RESIN REQUIRED FOR A
TYPICAL COLUMN TEST
APPENDIX D1 Ammoniacal Thiosulfate Solutions With Silver And Copper
APPENDIX D2 Ammoniacal Thiosulfate Solutions With Gold And Copper
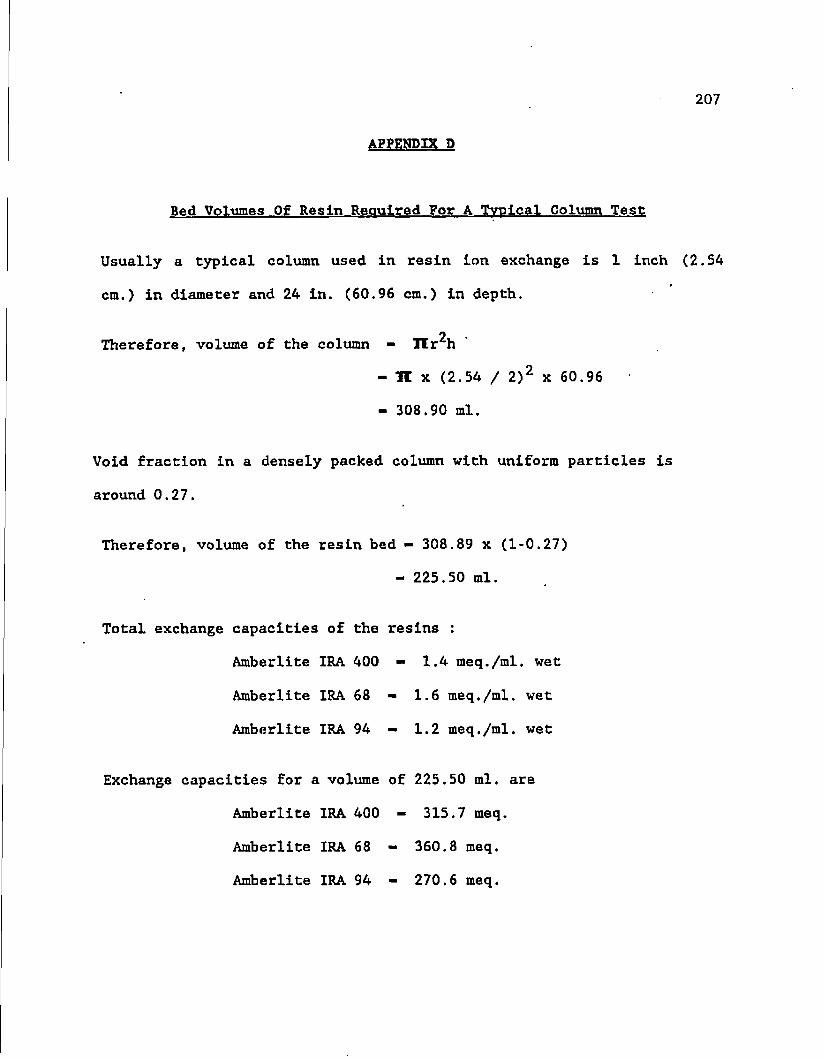
207
APPENDIX D
Bed Volumes Of Resin Required For A Typical Column Test
Usually a typical column used in resin ion exchange is 1 inch (2.54
cm.) in diameter and 24 in. (60.96 cm.) in depth.
Therefore, volume of the column - TIr h
- 31 x (2.54 / 2)2 x 60.96
- 308.90 ml.
Void fraction in a densely packed column with uniform particles is
around 0.27.
Therefore, volume of the resin bed - 308.89 x (1-0.27)
- 225.50 ml.
Total exchange capacities of the resins :
Amberlite IRA 400 - 1.4 meq./ml. wet
Amberlite IRA 68 - 1.6 meq./ml. wet
Amberlite IRA 94 - 1.2 meq./ml. wet
Exchange capacities for a volume of 225.50 ml. are
Amberlite IRA 400 - 315.7 meq.
Amberlite IRA 68 - 360.8 meq.
Amberlite IRA 94 - 270.6 meq.
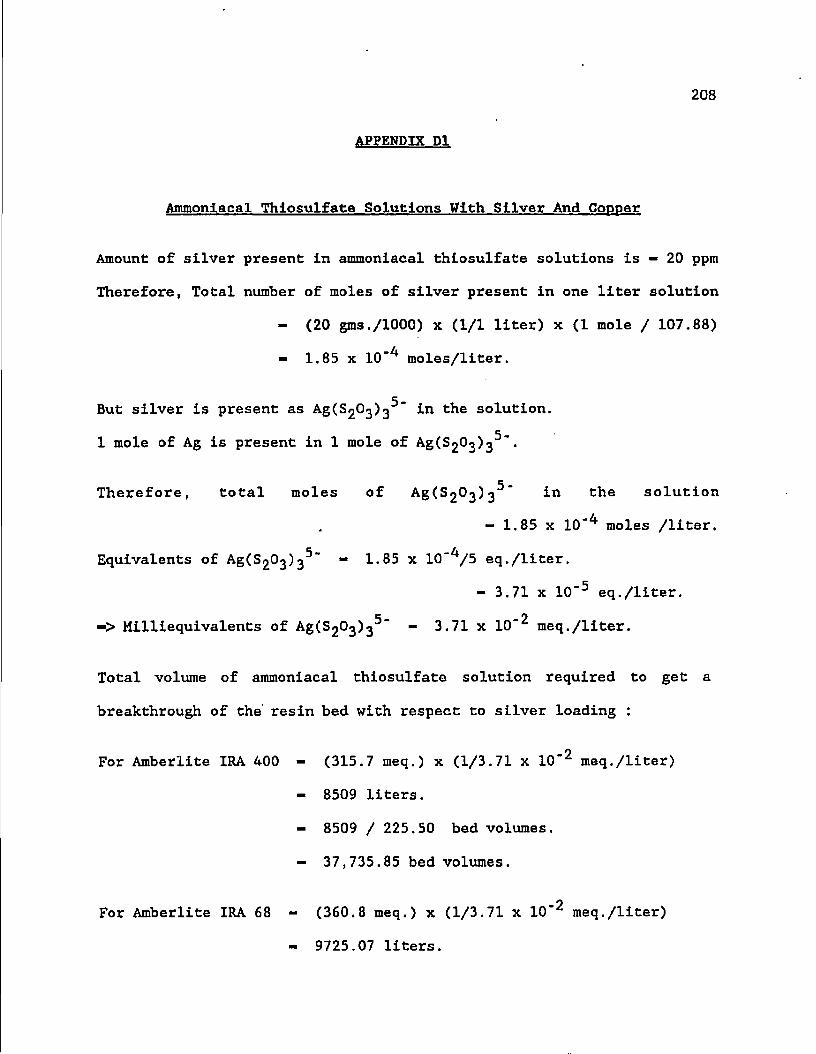
APPENDIX Dl
208
Ammonlacal Thlosulfate Solutions With Sliver And Copper
Amount of sliver present In ammonlacal thlosulfate solutions Is - 20 ppm
Therefore, Total number of moles of silver present In one liter solution
- (20 gms,/1000) x (1/1 liter) x (1 mole / 107.88)
- 1.85 x 10'^ moles/liter.
C _ But silver is present as Ag(S2C>3)3 in the solution.
1 mole of Ag is present in 1 mole of Ag(S20^)3
c . Therefore, total moles of Ag(S20j)3 in the solution
— 1.85 x 10"^ moles /liter.
Equivalents of Ag(S203)3^" - 1.85 x 10"^/5 eq./liter.
- 3.71 x 10"^ eq./liter.
-> Milliequivalents of Ag(S20j)3^" - 3.71 x 10"^ meq./liter.
Total volume of ammonlacal thlosulfate solution required to get a
breakthrough of the resin bed with respect to silver loading :
For Amberlite IRA 400 - (315.7 meq.) x (1/3.71 x 10"^ meq./liter)
- 8509 liters.
- 8509 / 225.50 bed volumes.
- 37,735.85 bed volumes.
For Amberlite IRA 68 - (360.8 meq.) x (1/3.71 x 10"^ meq./liter)
- 9725.07 liters.

For Amberlite IRA 94
209
9725.07 / 225.50 bed volumes.
43,126.68 bed volumes.
(270.6 meq.) x (1/3.71 x 10~2 meq./liter)
7,293.8 liters.
7,293.8 / 225.50 bed volumes.
32,345.01 bed volumes.

APPENDIX D2
210
Ammonlacal Thiosulfate Solutions With Gold And Copper
Amount of gold present In ammonlacal thiosulfate solutions is — 20 ppm.
Therefore, Total number of moles of gold present in one liter solution
- (20 gms./lOOO) x (1/1 liter) x (lmole / 197.20)
- 1.01 x 10"^ moles/liter.
But gold is present as Au(S203)2 in the solution.
3 -1 mole of Au is present in 1 mole of Au^gOg^
3 . Therefore, total moles of Au(S20^)2 i-*1 che solution
- 1.01 x 10"^ moles /liter.
Equivalents of Au(S203)2^" " 1.01 x 10"^/3 eq./liter.
- 3.37 x 10"^ eq./liter
-> Milliequivalents of Au(S203)2^~ - 3.37 x 10*^ meq./liter.
Total volume of ammonlacal thiosulfate solution required to get a
breakthrough of the resin bed with respect to gold loading :
For Amberlite IRA-400 - (315.7 meq.) x (1/3.37 x 10"^ meq./liter)
- 9367.95 liters.
- 9367.95/225.50 bed volumes.
- 41,543.03 bed volumes.
For Amberlite IRA-68 — (360.8 meq.) x (1/3.37 x 10"^ meq./liter)
- 10,706.23 liters.

For Amberlite IRA-94
211
10,706.23 / 225.50 bed volumes.
47,477.75 bed volumes.
(270.6 meq.) x (1/3.37 x 10"^ meq./liter)
8035.6 liters.
8035.6 / 225.50 bed volumes.
35,634.63 bed volumes.
REFERENCES
212
1. Gilbert J. Donahue, " Precious metals: International economic and strategic policy concerns" in Precious metals 1983-International precious metals institute. Davifl A.Reese, editor. Pergamon press, New york, June, 1983, p. 100-102.
2. Mark Grimwad, Introduction to precious metals. Newnes Technical Books, Boston, 1985, p. 2-10.
3. Marcel Pourbaix, Atlas of Electrochemical Equilibria in Aqueous Solutions. National Association of Corrosion Engineers, Dallas, 1974, p. 387-404.
4. Kerley B.J,, rt Recovery of precious metals from difficult ores." US Patent 4,369,061, January 18, 1983.
5. Stamboliadis, E. , McHardy, J. and Salman , T. " Ion exchange techniques for the recovery of gold from cyanide solutions. " CIM Bulletin, August 1978, p. 124 - 127.
6. George A. Lorenzo, " A review of electrolytic silver recovery for the regeneration of bleach-fix solutions. " Journal of Applied Photographic Engineering, vol. 5, no. 3, Summer 1979. p. 141 - 143.
7. Howard W. Chou, " Silver recovery from wash water with ion exchange." Journal of Applied Photographic Engineering, vol. 6, no. 1, February 1980. p. 14 - 18.
8. Berezowsky R.M.G.S. and Sefton V.B., " Recovery of gold and silver from oxidation leach residues by ammoniacal thiosulfate leaching." Paper presented at the 108th AIME annual meeting, New Orleans, Louisiana, February 18 - 22, 1979.
9. Tozawa, K. , Inui,Y. and Umetsu.Y. , " Dissolution of gold in ammoniacal thiosulfate solution." Paper presented at the 110th annual meeting of AIME, Chicago, Illinois, February 1981; Pap. TMS A81-25.
10. Flett, D.S., Derry, R. and Wilson, J.C., "Chemical study of thiosulfate leaching of silver sulphide." Trans.Instn. Min. Metall. (Sect. C: Mineral Process. Extr. Me tall".), vol. 92, December 1983. p. C216 - C223.
11. Stamboliadis, E. , McHardy, J. and Salman , T. " The effect of copper ions on the cyanidation of gold ore." Submitted to CIM for publication.

213
References - Cont.
12. Fleming, C.A., Nicol, M.J. " Alternative processes to filtreation: carbon-in-pulp and resin-in-pulp in the metallurgical industry." Hydrometallurgy, 1981, p. C2/1 - C2/15.
13. Charles F. Baes Jr., and Robert E. Mesmer, The hvdrolvsis of cations. John Wiley and Sons, New York, 1976, p. 267-279.
14. Wendell M. Latimer, The oxidation states of the elements and their potentials in aqueous solutions. Prentice - Hall, Inc., New York, 1952, p. 183-196.
15. Chariot, G., L'analyse qualitative et les reactions en solution. 4th ed., Masson, Paris, 1957, p. 222.
16. Pourbaix, M., Thermodvnamique des solutions aoueuses diluees-Representation graphiaue du role du PH et du potential. Thesis, Delft, 1945, Beranger, Paris and Liege.
17. Pourbaix, M., Lecons sur la corrosion electrochimique - Part 3 . Rapport Technique RT.49 of Cebelcor, July, 1957.
18. Pascal, P., Nouveau traite de chimie minerale - Vol. III. Masson, Paris, 1957.
19. Kirk - Othmer Encyclopedia of Chemical Technology - Second Completely Revised Edition. Vol. 20. Eva Parolla Dukes, associate editor. John Wiley & Sons, Inc., New York, 1969, p. 227-247.
20. Liddell D.M., Handbook of non-ferrous metallurgy, volume 2 : Recovery of the metals. Mcgraw-Hill Co., New York, 1945, p. 357.
21. Genik-Sas-Berezowsky, R.M., Sefton, V.B. and Gormely, L. , "Recovery of precious metals from metal sulphides." US Patent 4,070,182., January 24, 1978.
22. Kerley, B.J., " Recovery of precious metals from difficult ores." US Patent 4,269,622., May 26, 1981.
23. Gribanov, A. P., " Dissolution of native gold in media originating during the oxidation of some sulphides." Izv. Tomsk. Politekh: Inst. 1975, vol. 254, 3 - 8. Chemical Abstracts, vol. 87: 9106t, 1977.
24. James, T. H., ed., C.E.K. Mees. Theory of the Photographic Process. 3rd ed. The Macmillan Co., New York, 1966.
214
References - Cont.
25. Kakovskii, I. A., " Theory of the Hydrometallurgy of Noble Metals," Izv. Akad. Nauk, SSR, Otd. Techn, Nauk, 1957, No. 7, p. 29 - 34. (Report of the Academy of Sciences of the USSR, Metallurgy and Combustibles).
26. Tyurin, N.G., and Kakovskii, I.A., Tsvetnaya Metallurgiya (Byull. Inst. Tsvetmetinformatsiya) 1959, No. 22, p. 26 - 32. Quoted in Autoclave Processes in Non - Ferrous Metallurgy. Metallurgiya, Moscow, 1969, p. 221 - 222.
27. Umetsu, Y. and Tozowa, K. , " Dissolution of Gold in Ammoniacal Sodium Thiosulfate Solution ," Tohoku Daigaku Senko Seiren Kenkyusho Iho, 1972, vol, 28 (1), p. 97 - 104.
28. Okabe, T. et al, " Formation of Ammonium Sulfamate in the Oxidation of Low Valence Sulphur Compounds ," March (1970), Laboratory of Industrial Inorganic Chemistry, Dept. Applied Chem., Faculty of Engineering, Tohoku Univ.
29. Forward, F.A. and Mackiw, V.N., " Chemistry of the ammonia pressure process for leaching Ni, Cu and Co from Sherritt Gordon Sulphide Concentrates ." Journal of Metals, vol. 6, March 1955, p. 457 - 463.
30. Rosenheim, A. and Steinhauser, S., Z. anorg. allgem. chem., 1900, 25 - 81.
31. Bassett, H. and Durrant, R.G., " Action of thlosulfates on cupric salts." J. Chem. Soc., Lond., 123, 1923, 1279 -91.
32. Mellor, J. W., Comprehensive treatise on inorganic and theoretical chemistry, volume X. Longmans Green and Co., London, 1930, p. 530 - 536.
33. Gwyneth Nord, Skibsted, L. H. and Halonin, A.S., " The oxidation of thiosulfate by the tetramminegold(III) ion in aqueous solution." Acta Chem. Scand. A 29, No. 5, 1975, p. 505 - 512.
34. Byerley, J. J., Fouda, S. A. and Rempel, G. L. , " Kinetics and mechanisms of the oxidation of thiosulfate ions by copper (II) ions in aqueous ammonia solution." J. Chem. Soc., Dalton Trans., 1973, p. 889 - 893.
215
References - Cont.
35. R.M. Wheaton and A.H. Seamster, " A basic reference on ion exchange. " Dowex Ion Exchange Resins. John Wiley and Sons Inc., New York, 1966, p. 871-887.
36. Robert Kunin and Robert J. Myers, Ion Exchange Resins. John Wiley and Sons Inc., New York, 1950, p. 5, 141-156,
37. J.D. Miller and H.H. Haung, " Solution Concentration and Purification " in Unit Processes in Extractive Metallurgy - Hvdrometallurgy. L.G. Twidwell, project coordinator, p. 6.4 .1 - 6.4.7.
38. Kitchener, J.A., Ion Exchange Resins. John Wiley & Sons Inc., New York, 1957, p. 49-66.
39. Jacob A. Marinsky and Yizhak Marcus, Ion Exchange and Solvent Extraction, vol. 7. Marcel Dekker, Inc., New York, 1977 p. 1 - 2 8 .
40. F.C. Nachod and Jack Schubert, Ion Exchange Technology. Academic Press Inc., New York, 1956, p. 67-73.
41. J.E. Salmon and D.K. Hale, Ion Exchange. A Laboratory Manual. Academic Press Inc., Publishers, New York, 1959, p. 44-48.
42. J. Incze'dy, Analytical Applications of Ion Exchangers. Pergamon Press, New York, 1966, p. 23, 61-68, 346-396.
43. F. Helfferich, "Ion - Exchange Kinetics." Ion Exchange. Marcel Dekker Inc., New York, 1966, p. 68.
44. Y. Marcus and A.S. Kertes , Ion Exchange and solvent extraction of metal complexes. John Wiley and Sons Ltd., New York, 1969, p. 254.
45. Friedrich Helfferich, Ion Exchange. McGraw Hill Book Co. Inc., New York, 1962, p. 15-36, 116-130, 250-322.
46. Arden, T. V., Water Purification bv Ion Exchange. Plenum Press, New York, 1968, p. 24-26, 106-108.
47. Amberlite Ion Exchange Resins Laboratory Guide. Rohm and Haas Co., Philadelphia, September, 1979, p. 1-47.
48. "Dowex Macroporous Resins " in Ion + Exchange applications, recommendations and materials. Vol. 3. No. 1. Dow Chemical U.S.A., February, 1973.

216
References - Cont,
49. Jack Fabian, n Ion Exchange Resins : separation concentration - replacement -. catalysis " in Chemalog Hi - Lites. Vol, 3. No. 3. Chemical Dynamics Corp., September, 1979.
50. Robert Kunin, Elements of Ion Exchange. Reinhold Publishing Corporation, New York, 1960, p. 42-44, 51-70.
51. Robert C. Menhitt, The Extractive Metallurgy of Uranium. Johnson Publishing Co., Boulder Colorado, 1971, p. 145.
52. William H. Waitz, Jr., " Recovery of precious metals with Amberlite ion exchange resins " in Amber-hi-lites. No. 171. Fluid Process Chemicals Department, Rohm and Haas Company, Philadelphia, Autumn, 1982.
53. Process Considerations - Recovery of precious metals from ore concentrates using Amborane 345. No. PIC - 83-1. Industrial Chemicals Division, Rohm and Haas Company, Philadelphia, December, 1983.
54. Amborane 345 - Reductive resin for precious metal recovery. No. DIC-79-2. Industrial Chemicals Division, Rohm and Haas Company, Philadelphia, December, 1983.
55. Manziek, L. , " Amborane Resins : A new approach to the recovery of precious metals." Presented at the 6th International Precious Metals Conference, Harriott Hotel, Newport Beach, California, June 7-11, 1982.
56. Sussman, S. , Nachod, F.C. and Wood, W. , Ind. Eng. Chem. t 37, 618, 1945.
57. Hussey, S.J., U.S. Bureau of Mines, Rept. Invest., 4374, January, 1949.
58. Burstall, F.H., Forrest, P.J., Kember, N.F. and Wells, R.A. , Ind. Eng. Chera., 45, 1648.
59. " Amberlite IRA - 400 " in Amberlite Ion Exchange Resins. No. IE - 69 - 62 / 76 / 78. Fluid Process Chemicals Division, Rohm and Haas Company, Philadelphia, February, 1981.
60. " Amberlite IRA - 68 : technical notes." Technical Bulletin Fluid Process Chemicals Division, Rohm and Haas Company, Philadelphia, May, 1979, No. IE - 255.
217
References - Cont.
61. " Recovery of Gold by Ion Exchange." A Technical Note, Rohm and Haas Company, Philadelphia..
62. Private communication with Ian Harris of Rohm & Haas Company, Philadelphia, Pennsylvania.
63. Private communication with Charlie Dickert of Rohm & Haas Company, Philadelphia, Pennsylvania.
64. " Amberlite IRA - 94 n in Amberlite Ion Exchange Resins. No. IE - 239 / 78. Fluid Process Chemicals Division, Rohm and Haas Company, Philadelphia, June, 1980.
65. Fleming, C.A. and Cromberge, G. , " The extraction of gold from cyanide solutions by strong - and weak - base anion - exchange resins." J. S. Afr. Inst. Min. Metall., Vol. 84, No. 5, May, 1984, p. 125 - 137.
66. Demidov, V.I., Kreines, R.Z., Ivanova, M.I. and Kartasheva, A.S., Soviet J. Non - Ferr. Metals, 1967, 8 (8), 53.
67. Fridman, I.D., Zdorova, E.P., Pochkina, L.E., Yu Bek, R. , Maslii, A.I., and Il'ichev, S.M., Soviet J. Non - Ferr. Metals, 1971, 12 (10), 76.
68. "Analytical Methods for Atomic Absorption Spectrophotometry" (Perkin - Elmer Co., Norwalk, Connecticut, Flushing, 1981).
69. Zipperian, D. and Raghavan, S., Unpublished Work.
70. Private communication with Joe Wilson of Kerley Chemicals, Sahuarita, Arizona.
71. Robert M. Garrels and Charles L. Christ, Solutions. Minerals and Equilibria. Freeman, Cooper & Company, San. Francisco, 1965.
72. Sillen, L. G., and A. E. Martell, Stability Constants of Metal - Ion Complexes. Special Publication No. 17, The Chemical Society, London, 1964; Supplement No. 1, Special Publication No. 25, 1971.
73. M. Kh. Karapet'yants and M. L. Karapet'yants, Thermodynamic Constants of Inorganic and Organic Compounds. Humphrey Science Publishers, Ann Arbor, 1970.
218
References - Cont.
74. Herbert E. Bamer and Ricard V. Scheuerman, Handbook of Thermochemical Data for Compounds and Aqueous Species. John Wiley & Sons, New York, 1978.
75. Robert M. Smith and Arthur E. Martell, Critical Stability Constants- Vol. 4 : Inorganic Complexes. Plenum Press, New York, 1976.
76. I. Barin and 0. Knacke, Thermochemical Properties of Inorganic Substances. Springer-Verlag, New York, 1973.
77. N. A. Shumilova and G. V. Zhuteva, " Silver " in Encyclopedia of Electrochemistry of the Elements. Vol. 8. Allen J. Bard, editor. Marcel Dekker, Inc., 1978, p. 2 - 147.
78. G. M. Schmid and M. E. Curley-Fiorino, "Gold" in Encyclopedia of Electrochemistry of the Elements. Vol. 4. Allen J. Bard, editor. Marcel Dekker, Inc., 1975, p. 87 - 178.
79. Ugo Bertocci and Dennis R. Turner, "Copper" in Encyclopedia of Electrochemistry of the Elements. Vol. 2. Allen J. Bard, editor. Marcel Dekker, Inc., 1974, p. 383 - 497.
80. Steven D. Emerson. " Program for Generating Pourbaix Diagrams Based on General Concepts Developed by Barry H. Rosof, Satellite Division Cabot Corporation, Kukomu, Indiana; Fall 1974." Metallurgical Engineering Department, University of-Arizona, Spring, 1977.
81. Noah Bohenstein, "A Preliminary Technical Information-Recovery of silver from Plating Rinse Waste Streams with Arabulite Ion Exchange Resins." Industrial Chemicals Division, Rohm and Haas Co., Philadelphia, Pennsylvania.
82. Paul C. Hiemenz, Principles of Colloid and Surface Chemistry. Marcel Dekker, Inc., New York, New York, 1977, p. 293.
83. J. M. Smith, Chemical Engineering Kinetics - 3rd Edition. McGraw-Hill Book Compnay, New York, 1981, p. 319.
84. J, Crank, The Mathematics of Diffusion. Clarenden Press, Oxford, 1975, p 89-103.
85. T.R.E. Kressman and J. A. Kitchener, "Cation Exchange with Synthetic Phenobulphonate resin" in Faradav Society Discussions - Vol. 5-7. Gurndy and jackson, London, 1949, p 99-102.
219
References - Cont.
86. Umetsu, Y. , K. Tozawa and K. in Ammonia Solutions Kogyo Kaishi 87 (994)
Sasaki, " Dissolution of Silver under Oxygen Pressure ", Nippon
1971, pp. 29 - 32.