informs 2014 - the integration quality gap in service system networks
TRANSCRIPT
Stephen K. Kwan
Lucas Professor of Service Science
Lucas Graduate School of Business
San José State University
San José, CA, USA
Presented at
INFORMS Annual Meeting
San Francisco, November 9-12, 2014
Peter Hottum
Karlsruhe Service Research Institute
Karlsruhe Institute of Technology
Karlsruhe, Germany
1

2
Service providers often have to construct networks of
partners to fulfill service obligations to customers.
We introduce an integration service quality gap that
represents the difference between customer service
quality expectation and perceived service quality in
his service journey in a service system network. The
integration service quality gap is incorporated with
traditional service quality gaps to form a more
complete treatment of service quality metrics in such
an environment.
3
Kwan, SK, Hottum, P (2014) Maintaining Consistent Customer
Experience in Service System Networks, Service Science, Vol. 6, No. 2,
pp. 1-12. (Presented at 2013 Naples Forum)
Kwan SK, Hottum P, Kieliszewski CA (2012) Moving from B2X to
B2X2Y value propositions in service system networks. Presentation at
the 1st International Conference on the Human Side of Service
Engineering, July 24, San Francisco.
Kwan SK, Muller-Gorchs M (2011) Constructing effective value
propositions for stakeholders in service system networks. Sprouts:
Working Papers Inform. Systems 11:Article 160.
Freund L, Kwan SK (2010) Co-production process quality management
for service systems. Presentation at the 19th Frontiers in Services
Conference, June 10–13, Karlstad, Sweden.

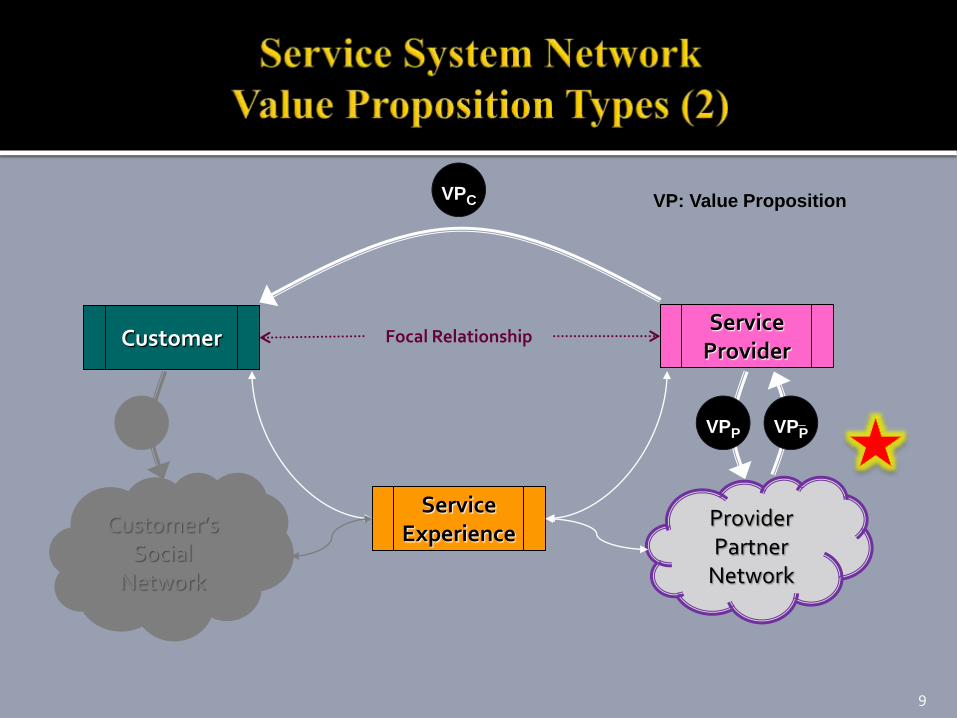
Customer’sSocial
Network
Customer
ServiceExperience
ServiceProvider
Focal Relationship
Provider Partner
Network
VP: Value PropositionVPC
VPS VPP VPP
Kwan, S. K. & Yuan, S. T. ”Customer-Driven Value Co-Creation in Service Networks”, in Demirkan, H., Spohrer, J.C. and Krishna, V. ed.,
The Science of Service Systems, volume in Service Science: Research and Innovation (SSRI) in the Service Economy series, Springer, 2010.4
5
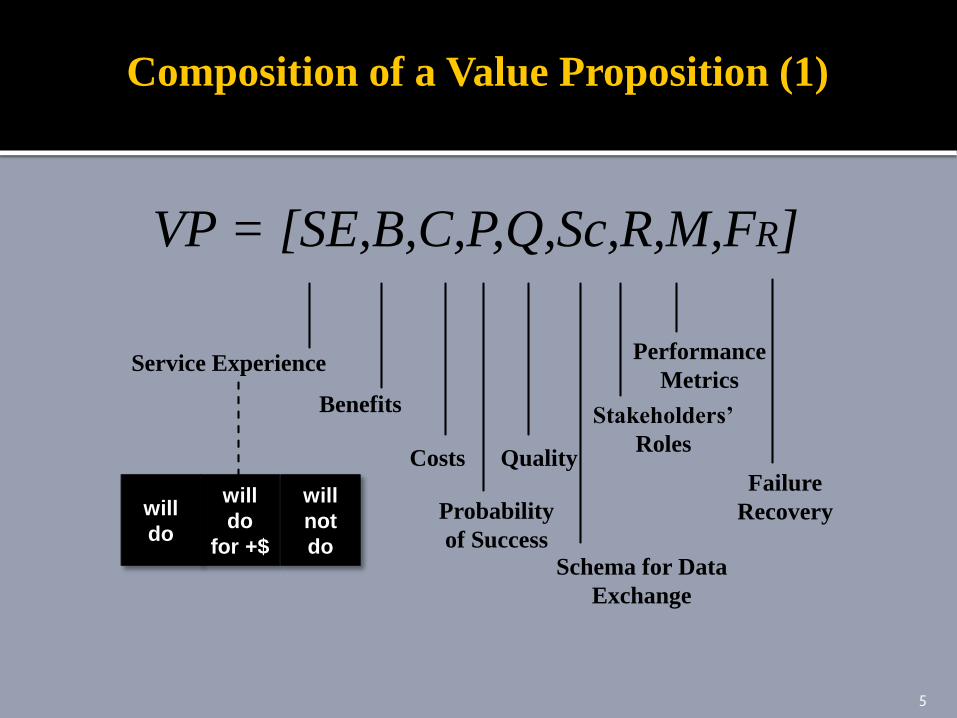
Composition of a Value Proposition (1)
Benefits
Costs
Probability
of Success
Quality
Schema for Data
Exchange
Stakeholders’
Roles
Performance
MetricsService Experience
VP = [SE,B,C,P,Q,Sc,R,M,FR]
will
do
will
do
for +$
will
not
do
Failure
Recovery
6
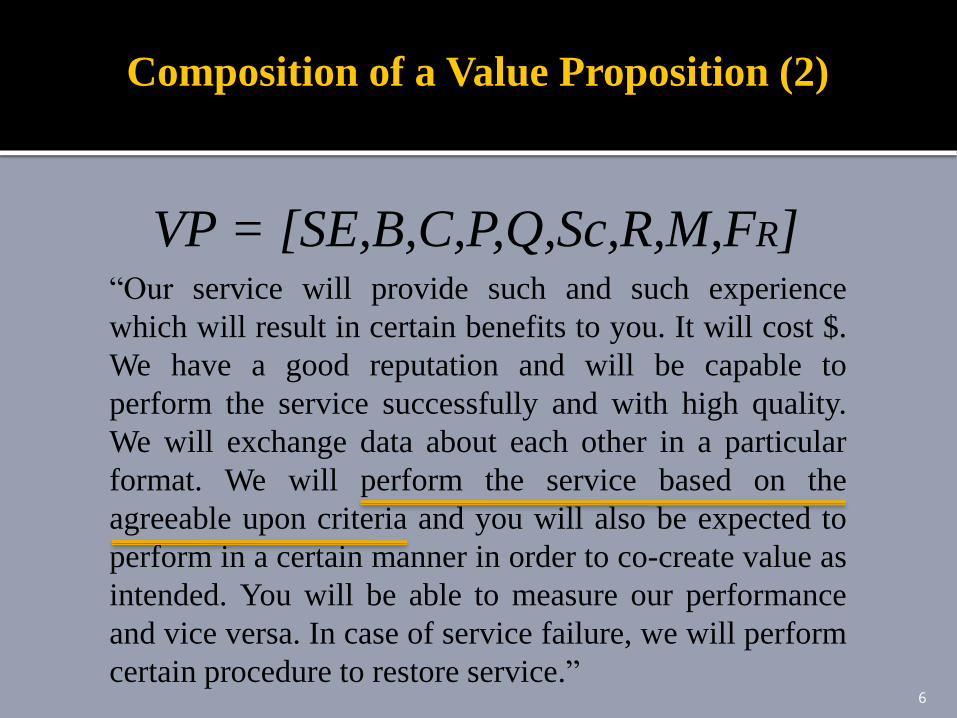
Composition of a Value Proposition (2)
VP = [SE,B,C,P,Q,Sc,R,M,FR]“Our service will provide such and such experience
which will result in certain benefits to you. It will cost $.
We have a good reputation and will be capable to
perform the service successfully and with high quality.
We will exchange data about each other in a particular
format. We will perform the service based on the
agreeable upon criteria and you will also be expected to
perform in a certain manner in order to co-create value as
intended. You will be able to measure our performance
and vice versa. In case of service failure, we will perform
certain procedure to restore service.”
77
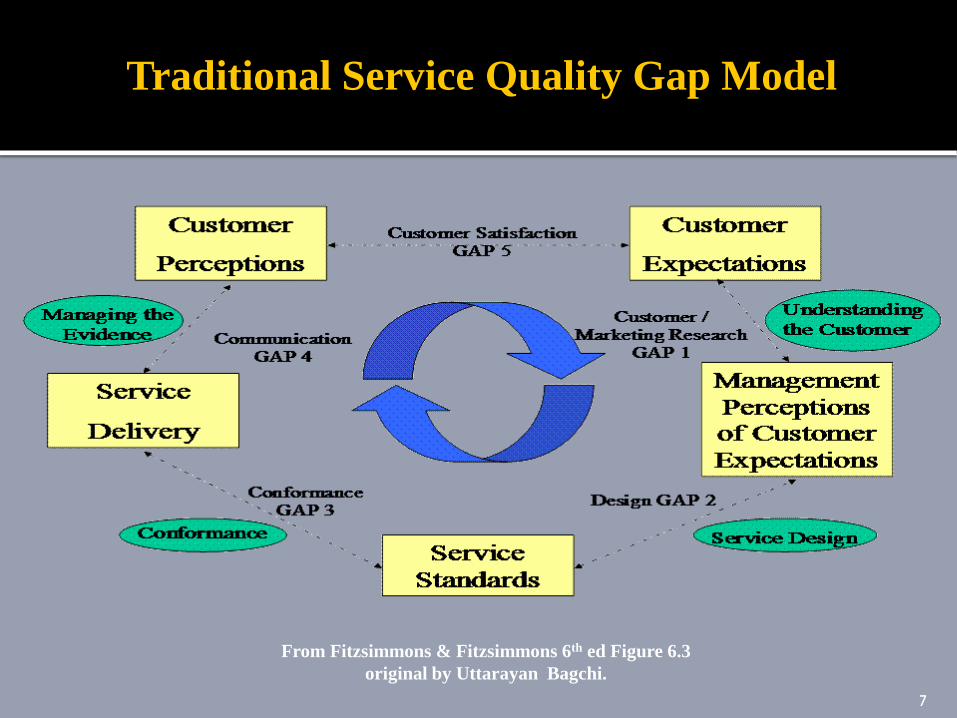
From Fitzsimmons & Fitzsimmons 6th ed Figure 6.3
original by Uttarayan Bagchi.
Traditional Service Quality Gap Model
8
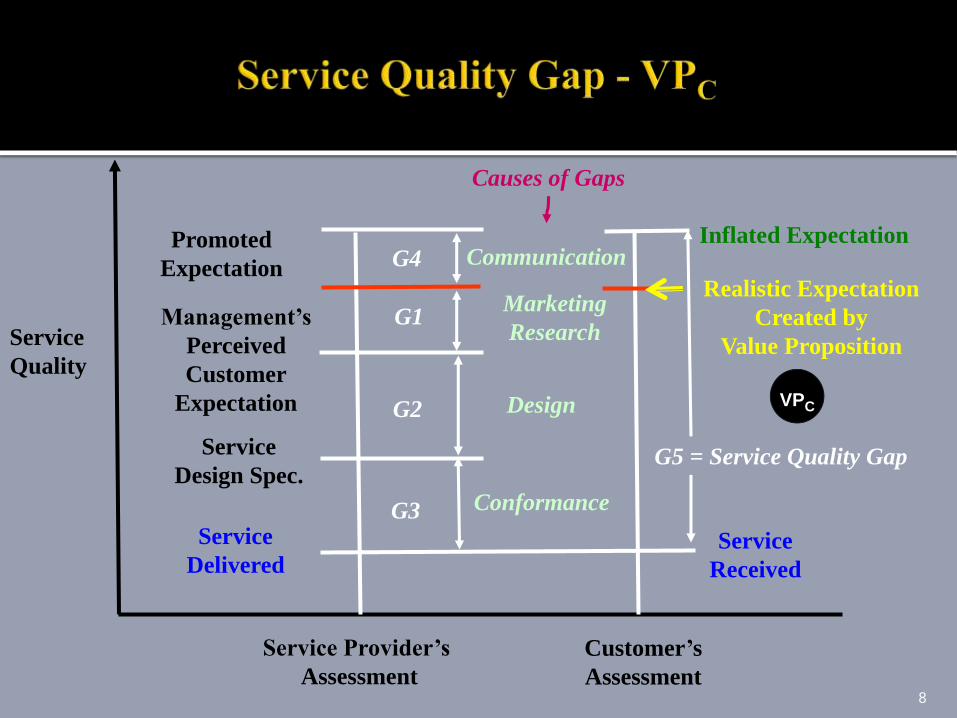
Customer’s
Assessment
Inflated ExpectationPromoted
Expectation
Service Provider’s
Assessment
Management’s
Perceived
Customer
Expectation
Service
Design Spec.
Service
Delivered
G1
G2
G3
G4
Service
Received
G5 = Service Quality Gap
Conformance
Design
Marketing
Research
Communication
Causes of Gaps
Service
Quality
Realistic Expectation
Created by
Value Proposition
VPC
Customer’sSocial
Network
Customer
ServiceExperience
ServiceProvider
Focal Relationship
Provider Partner
Network
VP: Value PropositionVPC
VPS VPP VPP
9
10
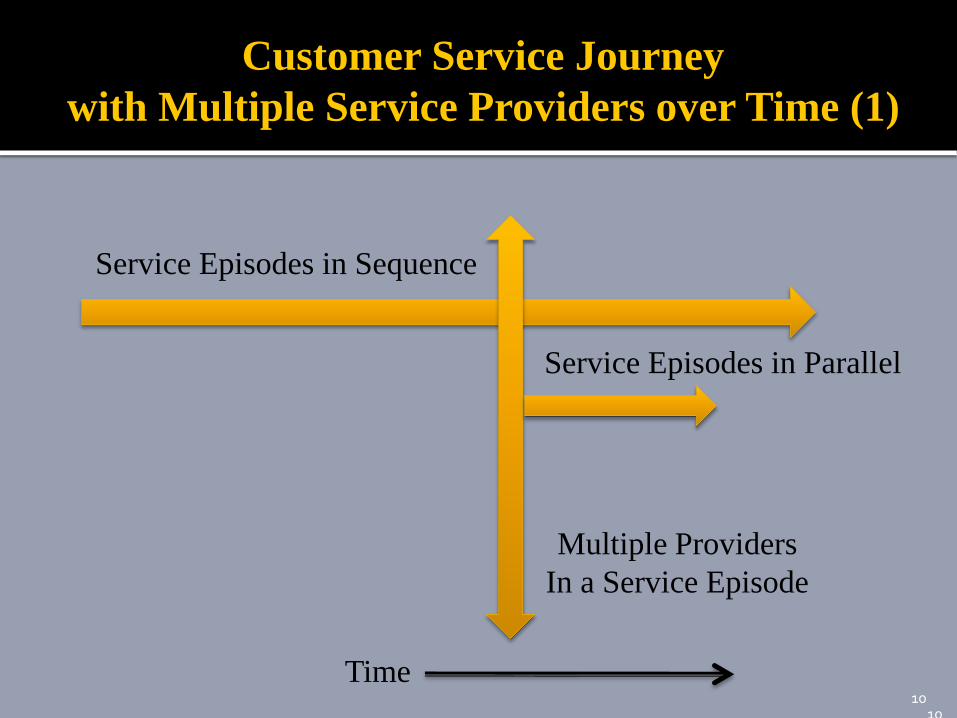
Customer Service Journey
with Multiple Service Providers over Time (1)
Service Episodes in Sequence
Time
Multiple Providers
In a Service Episode
Service Episodes in Parallel
10
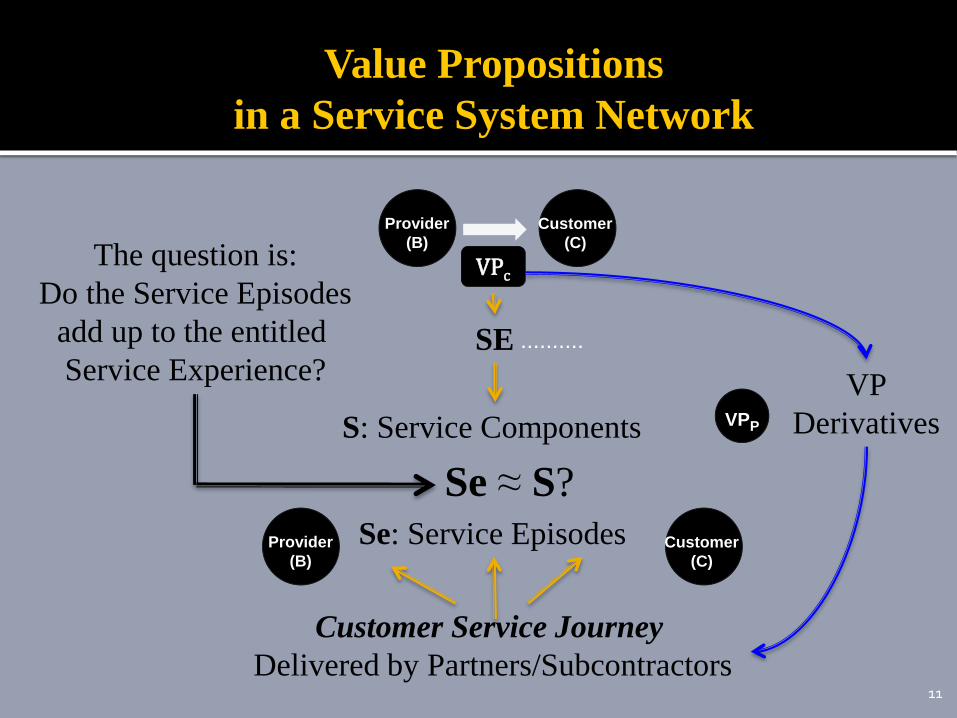
Value Propositions
in a Service System Network
Customer
(C)
Provider
(B)
VPc
Provider
(B)
Customer
(C)
Se: Service Episodes
Customer Service Journey
Delivered by Partners/Subcontractors
SE
S: Service Components
……….
The question is:
Do the Service Episodes
add up to the entitled
Service Experience?
Se ≈ S?
11
VP
DerivativesVPP
12
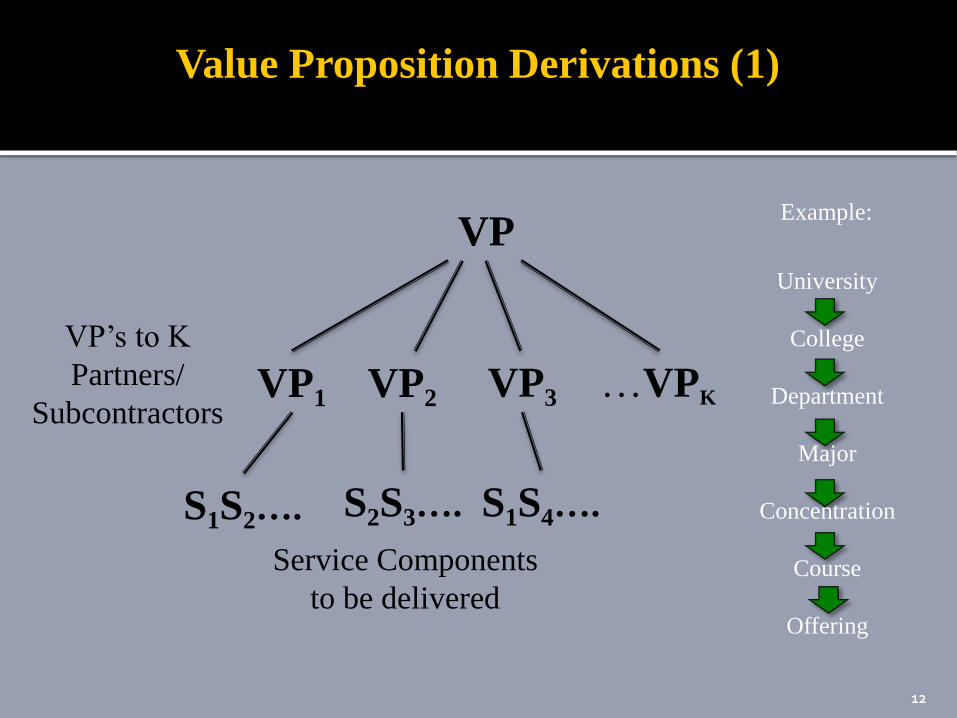
VP
VP1 VP2 VP3 …VPK
S1S2…. S2S3…. S1S4….
VP’s to K
Partners/
Subcontractors
Service Components
to be delivered
University
College
Department
Major
Concentration
Course
Offering
Example:
12
Value Proposition Derivations (1)
13
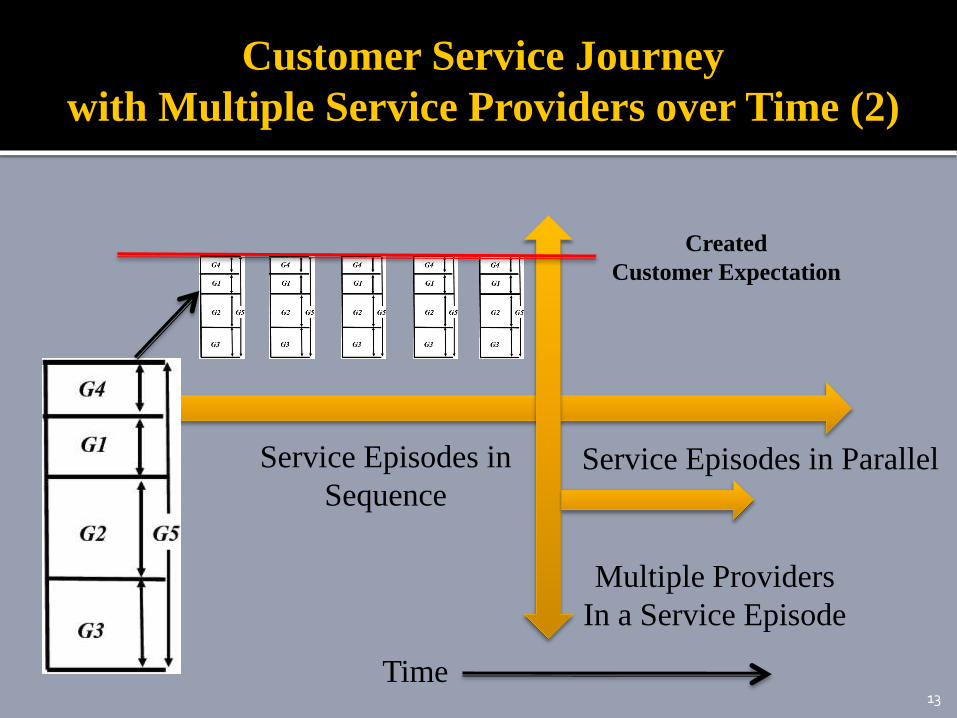
Customer Service Journey
with Multiple Service Providers over Time (2)
Service Episodes in
Sequence
Time
Multiple Providers
In a Service Episode
Service Episodes in Parallel
Created
Customer Expectation
14
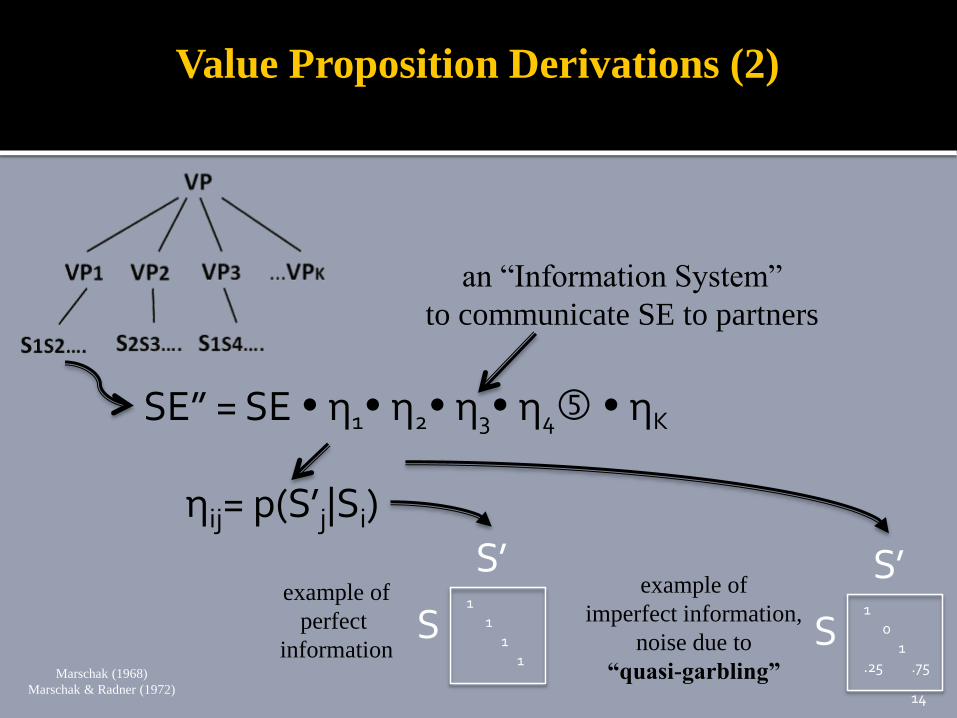
ηij= p(S’j|Si)
SE” = SE η1 η2 η3 η4 ηK
an “Information System”
to communicate SE to partners
S
S’1
11
1
example of
perfect
informationS
S’1
01
.25 .75
example of
imperfect information,
noise due to
“quasi-garbling”Marschak (1968)
Marschak & Radner (1972)
Value Proposition Derivations (2)
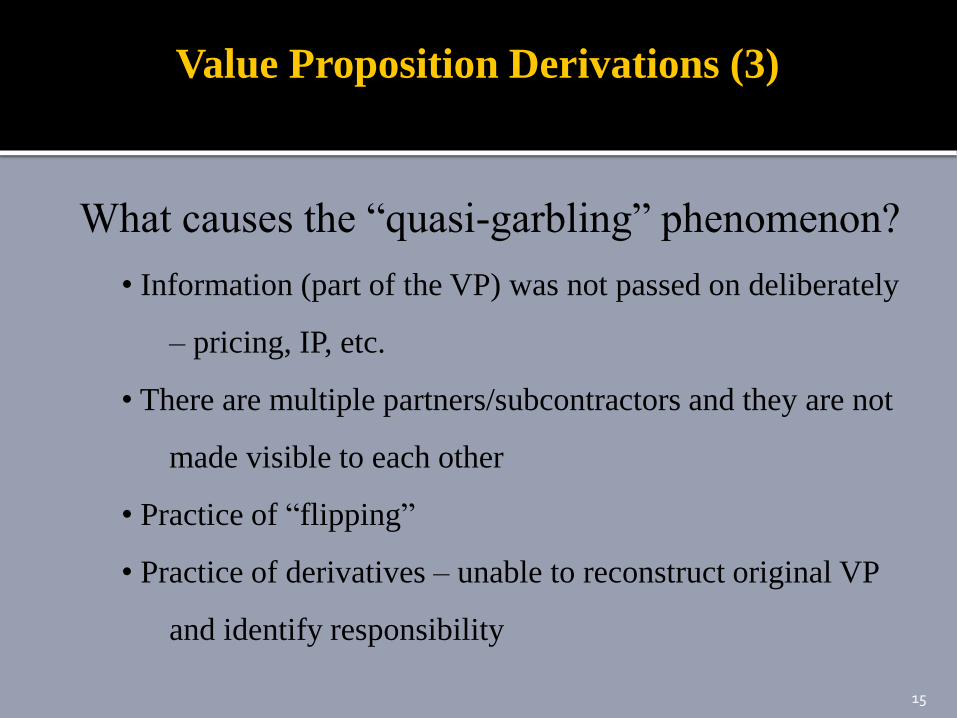
What causes the “quasi-garbling” phenomenon?
• Information (part of the VP) was not passed on deliberately
– pricing, IP, etc.
• There are multiple partners/subcontractors and they are not
made visible to each other
• Practice of “flipping”
• Practice of derivatives – unable to reconstruct original VP
and identify responsibility
Value Proposition Derivations (3)
15

16
Customer’s
Assessment
Inflated Expectation
Service Provider’s
Assessment
G1
G2
G3
G4
G5 = Service Quality Gap
Conformance
Design
Marketing
Research
Communication
Causes of Gaps
Service
Quality
Realistic Expectation
Created by
Value Proposition
VPC
Service
Delivered
Service
Received
G0 Integration
“quasi-garbling”
caused by
VP Derivations
VPP
17
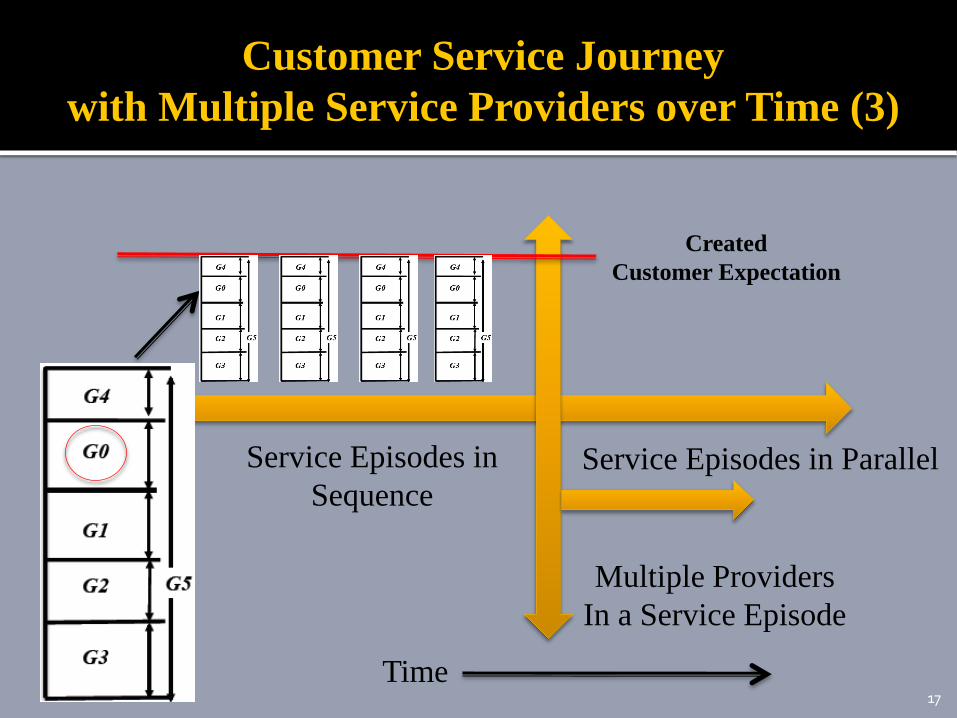
Customer Service Journey
with Multiple Service Providers over Time (3)
Service Episodes in
Sequence
Time
Multiple Providers
In a Service Episode
Service Episodes in Parallel
Created
Customer Expectation

1818
Future Research on these Approaches:
1. Derive “loss-less” Value Propositions for
partners/subcontractors. Would it be possible to re-
construct the original VP from the sub-VP’s?
1. Measure the quality of the customer service experience
based on individual service episodes, service components,
partner/subcontractors, as well as the whole experience.
Would it be possible to measure the “Integrity Quality
Gap”: Se ≈ S caused by multiple service providers in the
experience?

Stephen K. Kwan
Lucas Professor of Service Science
Lucas Graduate School of Business
San José State University
San José, CA, USA
Presented at
INFORMS Annual Meeting
San Francisco, November 9-12, 2014
Peter Hottum
Karlsruhe Service Research Institute
Karlsruhe Institute of Technology
Karlsruhe, Germany
19