infrared spectroscopy of interstellar apolar ice...
TRANSCRIPT

Astron. Astrophys. 328, 649–669 (1997) ASTRONOMYAND
ASTROPHYSICS
Infrared spectroscopy of interstellar apolar ice analogsP. Ehrenfreund1, A.C.A. Boogert2, P.A. Gerakines1,3, A.G.G.M. Tielens4, and E.F. van Dishoeck1
1 Leiden Observatory, P.O. Box 9513, 2300 RA Leiden, The Netherlands2 Kapteyn Astronomical Institute, P.O. Box 800, 9700 AV Groningen, The Netherlands3 Department of Physics, Applied Physics & Astronomy, Rensselaer Polytechnic Institute, Troy, NY 12180-3590, USA4 NASA Ames Research Center, Mail Stop 245-6, Moffett Field, CA 94035, USA
Received 23 April 1997 / Accepted 22 July 1997
Abstract. Apolar ices have been observed in several regionsin dense clouds and are likely dominated by molecules such asCO, CO2 and the infrared inactive molecules O2 and N2. Inter-stellar solid CO has been well characterized by ground-basedhigh resolution measurements. Recent ISO results showed theubiquitous presence of abundant CO2 ice and the presence ofCO2-rich ice mantles towards several molecular clouds. CO andCO2 have sharp bands in the infrared and their band shape de-pends strongly on the ice composition. The profiles of the strongCO and CO2 bands can therefore provide important informationon the composition, temperature and thermal history of inter-stellar and precometary ices.
We address, in this paper, the infrared spectra of 70 apo-lar ice mixtures of pure, binary, and multicomponent type. Westudied their spectral properties at 10 K, during warm up andUV photolysis, and derived the optical constants. We discuss theimportance of particle shape calculations for strong transitionssuch as CO and CO2.
In the laboratory context, we investigate the formation ofCO2 in the interstellar medium by UV photolysis of interstel-lar ices. Together with astronomical spectra taken by the ISOsatellite these laboratory data will be extremely valuable for thedetermination of the grain mantle composition in dense clouds.
Key words: ISM: molecules; dust – infrared: interstellar: lines– methods: laboratory
1. Introduction
Interstellar dust plays an important role in physical and chem-ical processes in the interstellar medium (ISM). Different dustpopulations are found in circumstellar envelopes, in the diffuseinterstellar medium, and in dense clouds (see Dorschner & Hen-ning 1995 for a review). Interstellar molecular clouds are nothomogeneous but show a clumpy structure (Stacey et al. 1993)
Send offprint requests to: P. Ehrenfreund
and offer a variety of environmental conditions. The cold anddense environment in quiescent molecular clouds provides anideal basis for the accretion of icy grain mantles and coagula-tion of particles. These clouds evolve from an initial cold, lowdensity and quiescent phase (T=10 K, n = 103 cm−3) to warm,dense and active protostellar regions (T=100K, n=106 cm−3).Energetic protostellar outflows create shocks which can raisethe temperatures locally to more than 2000 K. In these star-formation regions, heating, radiation, and shocks provoke grainprocessing in the form of desorption, grain explosions, or totalgrain destruction. Therefore a strong connection is evident be-tween interstellar gas and grain species, which greatly influencesboth interstellar chemistry and molecular abundances. Grainsare exposed to considerable changes during their lifetime whilethey cycle back and forth between diffuse and dense clouds. En-ergetic ultraviolet photo-processing of icy grain mantles resultsin a variety of new molecules and radicals (e.g., d’Hendecourtet al. 1985, Gerakines et al. 1996), which could subsequentlyre-enter the gas phase. Also, simple molecules which are ac-creted in dense clouds are converted into complex organics bythe UV irradiation in diffuse regions.
Infrared observations toward obscured sources have shownthe existence of different grain populations and a variety ofmolecules which reside on interstellar grains (e.g., Willner etal. 1982, Grim et al. 1991, Whittet et al. 1996). Comparisonsof laboratory spectra of astrophysically relevant ice mixtureswith interstellar observations have led to first-time detections ofsolid-state molecules and to studies of gas-grain interactions ininterstellar clouds (see reviews by Whittet 1993, Schmitt 1994,d’Hendecourt & Ehrenfreund 1996). Observations to date showthat interstellar ices contain H2O, CO, CH3OH, CO2, CH4, OCS,and some other molecules in lower abundances. Recent observa-tions with the Infrared Space Observatory (ISO) across the en-tire mid-infrared spectrum allow to study the complete inventoryof interstellar ices (Whittet et al. 1996). The nearly ubiquitouspresence of CO2 ice, the low abundance of CH4 ice, and otherimportant new results are summarized in the ISO Special Issueof Astron. Astrophys. 315 (e.g., de Graauw et al. 1996, Boogertet al. 1996).
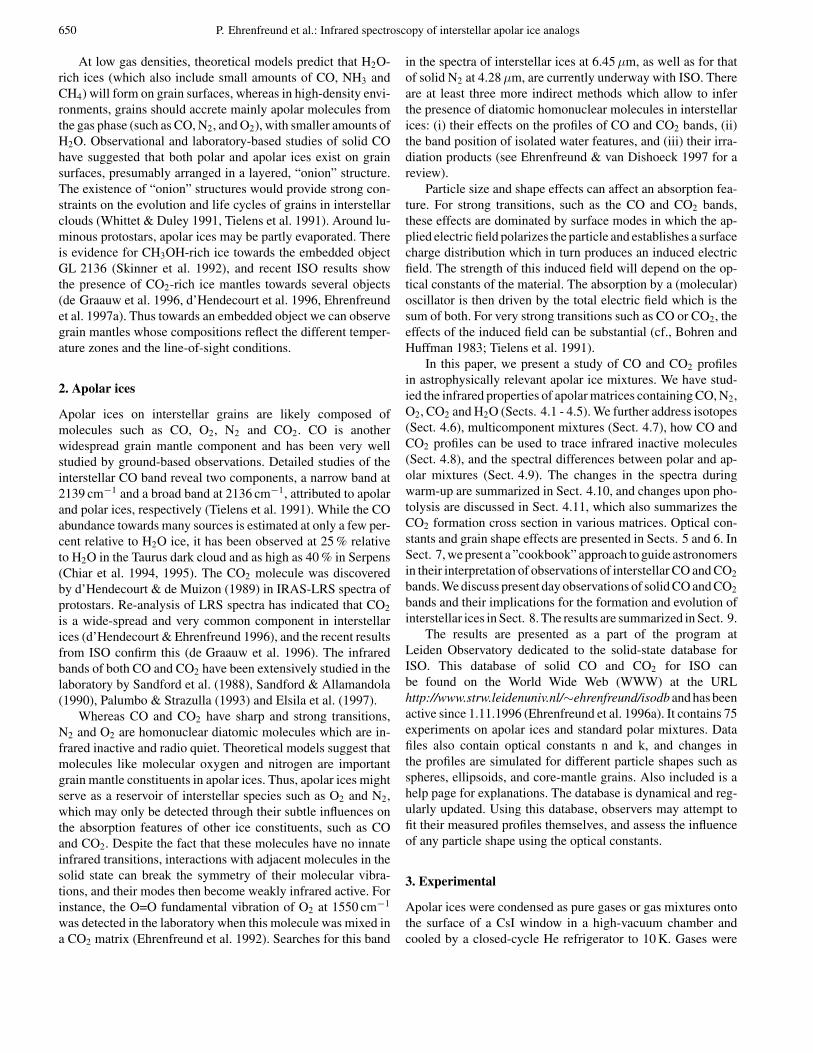
650 P. Ehrenfreund et al.: Infrared spectroscopy of interstellar apolar ice analogs
At low gas densities, theoretical models predict that H2O-rich ices (which also include small amounts of CO, NH3 andCH4) will form on grain surfaces, whereas in high-density envi-ronments, grains should accrete mainly apolar molecules fromthe gas phase (such as CO, N2, and O2), with smaller amounts ofH2O. Observational and laboratory-based studies of solid COhave suggested that both polar and apolar ices exist on grainsurfaces, presumably arranged in a layered, “onion” structure.The existence of “onion” structures would provide strong con-straints on the evolution and life cycles of grains in interstellarclouds (Whittet & Duley 1991, Tielens et al. 1991). Around lu-minous protostars, apolar ices may be partly evaporated. Thereis evidence for CH3OH-rich ice towards the embedded objectGL 2136 (Skinner et al. 1992), and recent ISO results showthe presence of CO2-rich ice mantles towards several objects(de Graauw et al. 1996, d’Hendecourt et al. 1996, Ehrenfreundet al. 1997a). Thus towards an embedded object we can observegrain mantles whose compositions reflect the different temper-ature zones and the line-of-sight conditions.
2. Apolar ices
Apolar ices on interstellar grains are likely composed ofmolecules such as CO, O2, N2 and CO2. CO is anotherwidespread grain mantle component and has been very wellstudied by ground-based observations. Detailed studies of theinterstellar CO band reveal two components, a narrow band at2139 cm−1 and a broad band at 2136 cm−1, attributed to apolarand polar ices, respectively (Tielens et al. 1991). While the COabundance towards many sources is estimated at only a few per-cent relative to H2O ice, it has been observed at 25 % relativeto H2O in the Taurus dark cloud and as high as 40 % in Serpens(Chiar et al. 1994, 1995). The CO2 molecule was discoveredby d’Hendecourt & de Muizon (1989) in IRAS-LRS spectra ofprotostars. Re-analysis of LRS spectra has indicated that CO2
is a wide-spread and very common component in interstellarices (d’Hendecourt & Ehrenfreund 1996), and the recent resultsfrom ISO confirm this (de Graauw et al. 1996). The infraredbands of both CO and CO2 have been extensively studied in thelaboratory by Sandford et al. (1988), Sandford & Allamandola(1990), Palumbo & Strazulla (1993) and Elsila et al. (1997).
Whereas CO and CO2 have sharp and strong transitions,N2 and O2 are homonuclear diatomic molecules which are in-frared inactive and radio quiet. Theoretical models suggest thatmolecules like molecular oxygen and nitrogen are importantgrain mantle constituents in apolar ices. Thus, apolar ices mightserve as a reservoir of interstellar species such as O2 and N2,which may only be detected through their subtle influences onthe absorption features of other ice constituents, such as COand CO2. Despite the fact that these molecules have no innateinfrared transitions, interactions with adjacent molecules in thesolid state can break the symmetry of their molecular vibra-tions, and their modes then become weakly infrared active. Forinstance, the O=O fundamental vibration of O2 at 1550 cm−1
was detected in the laboratory when this molecule was mixed ina CO2 matrix (Ehrenfreund et al. 1992). Searches for this band
in the spectra of interstellar ices at 6.45µm, as well as for thatof solid N2 at 4.28µm, are currently underway with ISO. Thereare at least three more indirect methods which allow to inferthe presence of diatomic homonuclear molecules in interstellarices: (i) their effects on the profiles of CO and CO2 bands, (ii)the band position of isolated water features, and (iii) their irra-diation products (see Ehrenfreund & van Dishoeck 1997 for areview).
Particle size and shape effects can affect an absorption fea-ture. For strong transitions, such as the CO and CO2 bands,these effects are dominated by surface modes in which the ap-plied electric field polarizes the particle and establishes a surfacecharge distribution which in turn produces an induced electricfield. The strength of this induced field will depend on the op-tical constants of the material. The absorption by a (molecular)oscillator is then driven by the total electric field which is thesum of both. For very strong transitions such as CO or CO2, theeffects of the induced field can be substantial (cf., Bohren andHuffman 1983; Tielens et al. 1991).
In this paper, we present a study of CO and CO2 profilesin astrophysically relevant apolar ice mixtures. We have stud-ied the infrared properties of apolar matrices containing CO, N2,O2, CO2 and H2O (Sects. 4.1 - 4.5). We further address isotopes(Sect. 4.6), multicomponent mixtures (Sect. 4.7), how CO andCO2 profiles can be used to trace infrared inactive molecules(Sect. 4.8), and the spectral differences between polar and ap-olar mixtures (Sect. 4.9). The changes in the spectra duringwarm-up are summarized in Sect. 4.10, and changes upon pho-tolysis are discussed in Sect. 4.11, which also summarizes theCO2 formation cross section in various matrices. Optical con-stants and grain shape effects are presented in Sects. 5 and 6. InSect. 7, we present a ”cookbook” approach to guide astronomersin their interpretation of observations of interstellar CO and CO2
bands. We discuss present day observations of solid CO and CO2
bands and their implications for the formation and evolution ofinterstellar ices in Sect. 8. The results are summarized in Sect. 9.
The results are presented as a part of the program atLeiden Observatory dedicated to the solid-state database forISO. This database of solid CO and CO2 for ISO canbe found on the World Wide Web (WWW) at the URLhttp://www.strw.leidenuniv.nl/∼ehrenfreund/isodb and has beenactive since 1.11.1996 (Ehrenfreund et al. 1996a). It contains 75experiments on apolar ices and standard polar mixtures. Datafiles also contain optical constants n and k, and changes inthe profiles are simulated for different particle shapes such asspheres, ellipsoids, and core-mantle grains. Also included is ahelp page for explanations. The database is dynamical and reg-ularly updated. Using this database, observers may attempt tofit their measured profiles themselves, and assess the influenceof any particle shape using the optical constants.
3. Experimental
Apolar ices were condensed as pure gases or gas mixtures ontothe surface of a CsI window in a high-vacuum chamber andcooled by a closed-cycle He refrigerator to 10 K. Gases were

P. Ehrenfreund et al.: Infrared spectroscopy of interstellar apolar ice analogs 651
2160 2150 2140 2130
pure CO
Fig. 1. Infrared absorption spectra of solid CO in CO/O2 mixturesat 10 K. The band width increases with O2 concentration, reaching amaximum of 5.5 cm−1 when the amounts of CO and O2 are equal,where the band also shifts by 1.3 cm−1 to lower frequency. When O2
is more abundant in the ice than CO, the band width decreases again.Exact band parameters are listed in Table 1.
prepared in a glass vacuum manifold. The purity of the gasesCO, CO2, N2, and O2, was 99.9997 % (Messer Griesheim). In-frared transmission spectra were obtained with a BioRad FTS40A spectrometer at a resolution of 1 cm−1.
UV irradiation was performed using a microwave-excitedhydrogen flow lamp. This source has a sharp emission peak at1216 A (Lymanα) and additional bands centered at 1360, 1450,1600 and 2800 A, which produce a total UV flux of approxi-mately 1015 photons cm−2 s−1 (Weber & Greenberg 1985). Thedeposition rate and sample thickness growth rate were about1015 molec cm−2 s−1 and 1µm hr−1, respectively. Final samplethicknesses ranged from 0.05 to approximately 0.5µm, depend-ing on the experiment performed. A detailed description of theexperimental setup is given by Gerakines et al. (1995). The in-tegrated absorbances of CO, CO2 and H2O have been recentlycalculated by Gerakines et al. (1995) and were used for columndensity measurements in our experiments.
4. Results
4.1. Laboratory spectroscopy
The variations in peak position, full width at half maximum(FWHM), and profile structure of the CO and CO2 infrared ab-sorption bands are the result of a complex interplay betweenthe molecules present in the ice matrix, which includes disper-
2160 2150 2140 2130
pure CO
Fig. 2. Infrared absorption spectra of solid CO in CO/CO2 mixtures.A sharp transition in the CO band width occurs when the amount ofCO2 relative to CO exceeds 21 %. Particular complexes or additonaltrapping sites are initiated at such a concentration. This can be used as asensitive method to determine the amount of CO2 in apolar interstellarices.
sive, electrostatic, induced, and repulsive interactions (Barneset al. 1980). Variations occur during warm-up and UV irradi-ation of the ice mixtures. In apolar matrices, the interactionsare controlled by dispersive and repulsive forces, and the mea-sured shift in peak position scales approximately with the po-larizability. However, the exact position and profile of a bandis determined by the physical and chemical interactions withthe surrounding molecules. Broadening of features is caused byinteractions with neighbours and the presence of a distributionof trapping sites. The nature of interactions in molecular solidsalso determines band shifts as compared to the gas phase. Repul-sive and attractive forces both occur in ice matrices at the sametime and their relative intensities determine the crystal shapeand size. The fundamental vibration of molecules in a matrixare in general red-shifted from the gas-phase value.
Pure CO gas absorbs at 2143.3 cm−1. Gas-phase CO2 peaksat 2349 cm−1 in the stretching mode and 667.4 cm−1 in thebending mode. The fundamental transitions of the infrared-inactive molecules O2 and N2 fall at 1551 cm−1 and 2335 cm−1,respectively. In the solid state, these modes become weakly in-frared active due to interactions with surrounding molecules(Ehrenfreund et al. 1992).
Sandford et al. (1988) demonstrated that the exact position,width, and profile of the solid-state CO absorption feature near2140 cm−1 is extremely sensitive to the physical conditions
652 P. Ehrenfreund et al.: Infrared spectroscopy of interstellar apolar ice analogs
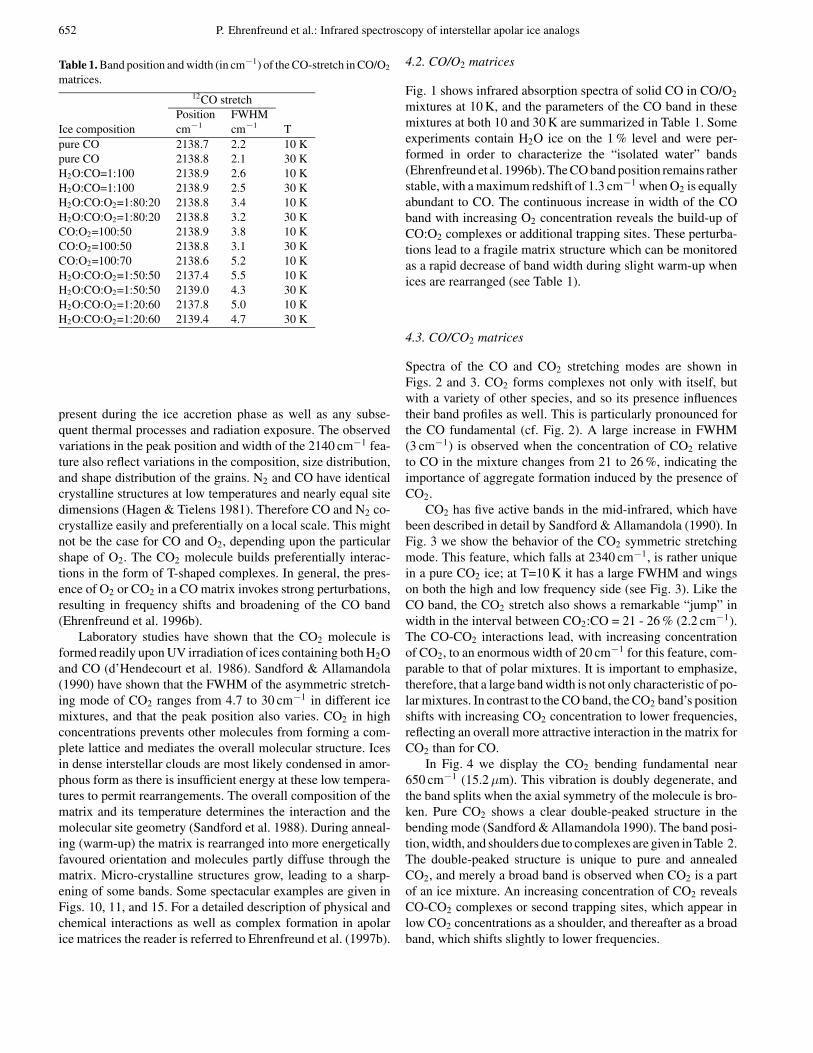
Table 1. Band position and width (in cm−1) of the CO-stretch in CO/O2
matrices.12CO stretch
Position FWHMIce composition cm−1 cm−1 Tpure CO 2138.7 2.2 10 Kpure CO 2138.8 2.1 30 KH2O:CO=1:100 2138.9 2.6 10 KH2O:CO=1:100 2138.9 2.5 30 KH2O:CO:O2=1:80:20 2138.8 3.4 10 KH2O:CO:O2=1:80:20 2138.8 3.2 30 KCO:O2=100:50 2138.9 3.8 10 KCO:O2=100:50 2138.8 3.1 30 KCO:O2=100:70 2138.6 5.2 10 KH2O:CO:O2=1:50:50 2137.4 5.5 10 KH2O:CO:O2=1:50:50 2139.0 4.3 30 KH2O:CO:O2=1:20:60 2137.8 5.0 10 KH2O:CO:O2=1:20:60 2139.4 4.7 30 K
present during the ice accretion phase as well as any subse-quent thermal processes and radiation exposure. The observedvariations in the peak position and width of the 2140 cm−1 fea-ture also reflect variations in the composition, size distribution,and shape distribution of the grains. N2 and CO have identicalcrystalline structures at low temperatures and nearly equal sitedimensions (Hagen & Tielens 1981). Therefore CO and N2 co-crystallize easily and preferentially on a local scale. This mightnot be the case for CO and O2, depending upon the particularshape of O2. The CO2 molecule builds preferentially interac-tions in the form of T-shaped complexes. In general, the pres-ence of O2 or CO2 in a CO matrix invokes strong perturbations,resulting in frequency shifts and broadening of the CO band(Ehrenfreund et al. 1996b).
Laboratory studies have shown that the CO2 molecule isformed readily upon UV irradiation of ices containing both H2Oand CO (d’Hendecourt et al. 1986). Sandford & Allamandola(1990) have shown that the FWHM of the asymmetric stretch-ing mode of CO2 ranges from 4.7 to 30 cm−1 in different icemixtures, and that the peak position also varies. CO2 in highconcentrations prevents other molecules from forming a com-plete lattice and mediates the overall molecular structure. Icesin dense interstellar clouds are most likely condensed in amor-phous form as there is insufficient energy at these low tempera-tures to permit rearrangements. The overall composition of thematrix and its temperature determines the interaction and themolecular site geometry (Sandford et al. 1988). During anneal-ing (warm-up) the matrix is rearranged into more energeticallyfavoured orientation and molecules partly diffuse through thematrix. Micro-crystalline structures grow, leading to a sharp-ening of some bands. Some spectacular examples are given inFigs. 10, 11, and 15. For a detailed description of physical andchemical interactions as well as complex formation in apolarice matrices the reader is referred to Ehrenfreund et al. (1997b).
4.2. CO/O2 matrices
Fig. 1 shows infrared absorption spectra of solid CO in CO/O2
mixtures at 10 K, and the parameters of the CO band in thesemixtures at both 10 and 30 K are summarized in Table 1. Someexperiments contain H2O ice on the 1 % level and were per-formed in order to characterize the “isolated water” bands(Ehrenfreund et al. 1996b). The CO band position remains ratherstable, with a maximum redshift of 1.3 cm−1 when O2 is equallyabundant to CO. The continuous increase in width of the COband with increasing O2 concentration reveals the build-up ofCO:O2 complexes or additional trapping sites. These perturba-tions lead to a fragile matrix structure which can be monitoredas a rapid decrease of band width during slight warm-up whenices are rearranged (see Table 1).
4.3. CO/CO2 matrices
Spectra of the CO and CO2 stretching modes are shown inFigs. 2 and 3. CO2 forms complexes not only with itself, butwith a variety of other species, and so its presence influencestheir band profiles as well. This is particularly pronounced forthe CO fundamental (cf. Fig. 2). A large increase in FWHM(3 cm−1) is observed when the concentration of CO2 relativeto CO in the mixture changes from 21 to 26 %, indicating theimportance of aggregate formation induced by the presence ofCO2.
CO2 has five active bands in the mid-infrared, which havebeen described in detail by Sandford & Allamandola (1990). InFig. 3 we show the behavior of the CO2 symmetric stretchingmode. This feature, which falls at 2340 cm−1, is rather uniquein a pure CO2 ice; at T=10 K it has a large FWHM and wingson both the high and low frequency side (see Fig. 3). Like theCO band, the CO2 stretch also shows a remarkable “jump” inwidth in the interval between CO2:CO = 21 - 26 % (2.2 cm−1).The CO-CO2 interactions lead, with increasing concentrationof CO2, to an enormous width of 20 cm−1 for this feature, com-parable to that of polar mixtures. It is important to emphasize,therefore, that a large band width is not only characteristic of po-lar mixtures. In contrast to the CO band, the CO2 band’s positionshifts with increasing CO2 concentration to lower frequencies,reflecting an overall more attractive interaction in the matrix forCO2 than for CO.
In Fig. 4 we display the CO2 bending fundamental near650 cm−1 (15.2µm). This vibration is doubly degenerate, andthe band splits when the axial symmetry of the molecule is bro-ken. Pure CO2 shows a clear double-peaked structure in thebending mode (Sandford & Allamandola 1990). The band posi-tion, width, and shoulders due to complexes are given in Table 2.The double-peaked structure is unique to pure and annealedCO2, and merely a broad band is observed when CO2 is a partof an ice mixture. An increasing concentration of CO2 revealsCO-CO2 complexes or second trapping sites, which appear inlow CO2 concentrations as a shoulder, and thereafter as a broadband, which shifts slightly to lower frequencies.

P. Ehrenfreund et al.: Infrared spectroscopy of interstellar apolar ice analogs 653
2380 2360 2340 2320
Fig. 3. Infrared absorption spectra of the stretching mode of solid CO2
in CO/CO2 mixtures. A very large band with strong red and blue wingsis characteristic for pure CO2, reflecting the strong interactions betweenCO2 molecules. A gradual shift in peak position to lower frequencies aswell as a gradual increase in the band width is evident with increasingconcentrations of CO2. Band width reaches its maximum of 19 cm−1
at equal abundances of CO and CO2.
The 13CO band at 2090 cm−1 is shown in Fig. 5. In compar-ison with Fig. 2, it is observed that the isotope 13CO behaves ina somewhat similar fashion, but not exactly the same, as 12CO.The 13CO band has an intrinsic strength which is similar to thatof 12CO (1.3×10⁻¹⁷ cm molec−1; Gerakines et al. 1995), butthe low isotopic abundance of 13C relative to 12C makes thisfeature difficult to observe in interstellar ices. The 13CO2 asym-metric stretching fundamental (ν3) falls at 2280 cm−1 and isdisplayed in Fig. 6. In comparison with Fig. 3, it is evident thatthe behavior of these two isotopes is rather different.
CO2 readily forms specific complexes with other species.The 12CO2 band is known to show a unique structure and largeband width of 12 cm−1. In contrast, the 13CO2 band is very nar-row (2.6 cm−1), which has already been discussed by Sandford& Allamandola (1990). The changes in spectral signature aredue to differences in the induced dipole moment or some decou-pling of the 13CO2 molecules from the 12CO2 phonon modes.13CO2 has also a much lower abundance than 12CO2 and is there-fore exposed to very different interactions in the ice, which mayalso result in a different infrared signature (Ehrenfreund et al.1997b). This has important implications for astronomy, see alsoSect. 4.6.
690 680 670 660 650 640
Fig. 4. Infrared absorption spectra of the bending mode of solid CO2
in CO/CO2 mixtures. The double-peaked structure is unique to pureand annealed CO2. A single band is observed in CO2 mixtures, butcomplexes or additional trapping sites produce shoulders at low CO2
concentrations and a large width at higher CO2 concentrations.
4.4. CO/O2/CO2 matrices
Figs. 7 and 8 display the behavior of the CO and CO2 stretchingmodes in CO/O2/CO2 matrices. The band widths of CO and CO2
are, with a few exceptions, comparable in these mixtures. Theband width of the CO feature seems to be determined by theinteractions between O2 and CO2. Fig. 7 shows the influence ofthese particular O2-CO2 perturbations which have been alreadyobserved by Ehrenfreund et al. (1996b). Band parameters at 10and 30 K are shown in Table 3, including additional mixtureswhich are not displayed in Figs. 7 and 8.
The CO band width in a CO:O2=100:50 mixture was mea-sured to be 3.8 cm−1 (Sect. 4.2, see Table 1), but an additionalinteraction is induced by the CO2 molecule into the ice mix-ture, resulting in a further increase of band width. This increasemay be inferred from the band width of CO in binary mixtureslisted in Tables 1 and 2. Strong differences in peak position andband width after warm-up to 30 K reflect loose aggregates be-tween the ice constituents which are rearranged during the risetemperature. The measured column densities of CO and CO2 re-mained constant at 10 K and 30 K, indicating that no sublimationhas yet occured. The variety of interactions in multicomponentmixtures and the difficulty in extracting information are eachshown in Fig. 7, where the mixtures CO:O2:CO2=100:20:11and CO:O2:CO2=100:11:20, which are similar in composition,show very different band profiles. On the contrary the mix-tures CO:O2:CO2=100:50:21 and CO:O2:CO2=100:11:20 show

654 P. Ehrenfreund et al.: Infrared spectroscopy of interstellar apolar ice analogs
Table 2. Band position and width (in cm−1) of CO and CO2 IR absorption features in CO/CO2 matrices. (s) indicates band shoulders.
12CO stretch 12CO2 stretch 12CO2 bendPosition FWHM Position FWHM Position FWHM
Ice composition cm−1 cm−1 cm−1 cm−1 cm−1 cm−1 TCO:CO2=100:4 2138.8 2.5 2346.7 3.1 659.2/660.8(s) 2.5 10 KCO:CO2=100:4 2138.8 2.3 2346.6 3.6 659.4/660.8 3.3 30 KCO:CO2=100:8 2138.9 3.0 2345.9 4.4 658.9/660.8(s) 3.5 10 KCO:CO2=100:8 2138.8 2.7 2345.8 4.5 659.2/660.8 4.0 30 KCO:CO2=100:16 2139.1 3.8 2344.6 5.4 658.7 5.3 10 KCO:CO2=100:16 2139.0 3.7 2344.5 5.3 658.7 5.4 30 KCO:CO2=100:21 2139.2 4.4 2344.2 5.3 658.4 6.2 10 KCO:CO2=100:21 2139.2 4.1 2344.2 5.3 658.5/660.8 6.2 30 KCO:CO2=100:23 2138.9 6.4 2343.4 7.7 658.3/660.8(s) 7 10 KCO:CO2=100:23 2139.2 4.6 2344.1 5.3 658.5 6.3 30 KCO:CO2=100:26 2138.4 7.4 2342.3 7.5 658.0/661.3(s) 7.4 10 KCO:CO2=100:26 2139.3 4.5 2343.9 5.3 658.1 6.7 30 KCO:CO2=100:70 2139.9 8.2 2341.4 14.8 657.6 10.6 10 KH2O:CO:CO2=1:50:56 2141.3 9.6 2339.7 19.1 656.6 10.2 10 KH2O:CO:CO2=1:50:56 2141.3 7.9 2342.8 9.4 655.5/661.0 10.3 45 K
Table 3. Band positions and widths (in cm−1) of CO and CO2 IR absorption features in CO/O2/CO2 matrices. (s) indicates band shoulders.
12CO stretch 12CO2 stretch 12CO2 bendPosition FWHM Position FWHM Position FWHM
Ice composition cm−1 cm−1 cm−1 cm−1 cm−1 cm−1 TCO:O2:CO2=100:50:4 2138.9 4.4 2346.3 4.9 658.7/661(s) 4.9 10 KCO:O2:CO2=100:50:4 2139.4 4.3 2346.6 3.2 658.9/660.9 5.0 30 KCO:O2:CO2=100:50:8 2138.1 6.0 2344.2 5.3 658.7/661.3(s) 6 10 KCO:O2:CO2=100:50:16 2137.9 6.3 2342.9 6.3 658.3/661.3(s) 7.2 10 KCO:O2:CO2=100:50:16 2139.2 4.8 2345.6 5.6 658.2/660.8/662.7 7.0 30 KCO:O2:CO2=100:50:21 2138.1 6.5 2342.5 6.3 658.3/661.5(s) 7.7 10 KCO:O2:CO2=100:50:21 2139.1 4.7 2345.0 8.0 657.5/660.8/662.7 9.6 30 KCO:O2:CO2=100:50:32 2138.9 7 2342.1 6.7 658.2/662.2(s) 8.8 10 KCO:O2:CO2=100:54:10 2137.6 5.6 2343.5 5.4 658.5/661.5(s) 7 10 KCO:O2:CO2=100:54:10 2139.1 3.7 2346.2 4.3 658.5/660.7 5.6 30 KCO:O2:CO2=100:20:11 2139.1 4.7 2345.8 5.9 658.7/660.7(s) 5.3 10 KCO:O2:CO2=100:20:11 2139.4 4.5 2345.9 6.0 659.0/660.8/662.5 5.4 30 KCO:O2:CO2=100:11:20 2138.3 6.7 2342.8 7 658.3/661.7(s) 7.2 10 KCO:O2:CO2=100:11:20 2139.6 5 2344.8 7 658.5 6.5 30 KCO:O2:CO2=100:10:23 2138.3 7.2 2342.4 7.3 658.2/661.7(s) 7.7 10 KCO:O2:CO2=100:10:23 2139.2 4.6 2344.2 5.2 658.2 6.3 30 K
Table 4. Band position and width (in cm−1) of CO2 IR absorption features in CO2/H2O matrices. The last column lists the peak ratio of thedouble-peaked CO2 bending mode.
12CO2 stretch 12CO2 bend T Intensity ratio
Ice composition Position FWHM Position FWHM 655/660
cm−1 cm−1 cm−1 cm−1 cm−1
pure CO2 2344.8 12.2 654.7/659.9 2.6/4.7 10 K 1.051pure CO2 2344.9 11.7 654.7/659.7 2.5/3.8 50 K 0.998pure CO2 2344.6 9 654.9/660.1 1.6/2.8 80 K 0.889CO2:H2O=100:1 2345.0 14.1 654.0 /659.9 2.5/5.1 10 K 1.00CO2:H2O=100:1 2344.8 15.1 654.7/659.6 2.0 /5.1 30 K 1.00CO2:H2O=10:1 2330.1 28.6 655.1 11.0 10 K -CO2:H2O=10:1 2343.9 7.4 654.0 /660.0 2.5/3.6 80 K 0.969CO2:H2O=6:1 2332.2 31 655.5 12.3 10 K -CO2:H2O=6:1 2343.9 8.5 654.8/660.0 3.0 /4 80 K 1.026

P. Ehrenfreund et al.: Infrared spectroscopy of interstellar apolar ice analogs 655
2110 2100 2090 2080
pure CO
Fig. 5. Infrared absorption spectra of solid 13CO in CO/CO2 mixtures.This isotope shows a similar behavior compared to the fundamentalmode of 12CO at 2140 cm−1 and is characterized by a rather stablepeak position and increase in width. However, the increase in bandwidth does not exactly follow that of 12CO, since 13CO is only a minorconstituent and exposed to different interactions.
very similar spectroscopic properties, indicating that the relativeabundance of O2 and CO2 molecules determines width and bandposition of the CO and CO2 bands. Fig. 8 shows the behaviorof the CO2 stretching mode and the blueshift which is observedin matrices where interactions between those molecules are re-duced (CO2 and O2 are less abundant in the ice). The interactionsbetween CO, O2 and CO2 also result in several sub-peaks whichappear superimposed on the bending mode of CO2 and are listedin Table 3 (see also Ehrenfreund et al. 1996a).
4.5. CO2/H2O mixtures
CO2/H2O mixtures reveal an outstanding behaviour and havea strong effect on the CO2 band profiles, which is of extremeimportance for the abundance determinations and studies of in-terstellar CO2. When the amount of water ice in a CO2/H2O icemixture exceeds a few percent, very strong aggregates and ad-ditional trapping sites are formed which lead to a very peculiarprofile of the CO2 stretching mode (Ehrenfreund et al. 1997b).In Fig. 9, it is shown that a second band appears at 2328 cm−1,which results in an enormous broadening of the band (FWHM= 30 cm−1) and an asymmetric profile which is shifted by about15 cm−1 to lower frequency. This particular profile remains con-stant even to equal concentrations of CO2 and H2O. In polarmixtures, where H2O is more abundant in the ice matrix, theband position peaks again around 2341 cm−1 (close to that of
2300 2290 2280 2270
Fig. 6. Infrared absorption spectra of solid 13CO2 in CO/CO2 mixtures.This isotope shows a different behavior and is much narrower than theband of 12CO2 at 2340 cm−1 (compare Fig. 3). A strong plateau isvisible when the concentration of CO2:CO exceeds 21 %, indicating acomplex formation, which can also be observed for 12CO2, see Fig. 3.
pure CO2), and the FWHM is reduced to 15 cm−1, see Sect. 4.9.The bending mode (Fig. 11) shows a similar behavior. A con-stant profile is observed in mixtures where CO2:H2O = 10:1,10:6 and 1:1, which is also characterized by a large band width(12 cm−1) and a strong redshift. Band parameters are given inTable 4.
Stepwise annealing of a CO2:H2O=6:1 mixture revealed dif-ferent components which form this unusually large and asym-metric band profile (see Fig. 10). The band of pure CO2 (at2344 cm−1) can be distinguished only at temperatures above42 K. At low temperature, the peak at 2328 cm−1, which islikely due to a second trapping site for CO2 induced by thematrix configuration, dominates the CO2 profile. This trappingsite is destroyed during warm-up between 42 and 50 K. At 75 K,the band shows a profile similar to that of pure CO2. Rearrange-ment of the ice matrix during the annealing process separatesthe CO2 and H2O molecules, which thereafter reside within thesame ice matrix in a two-phase system.
Spectroscopy of the bending mode of solid CO2 in aCO2:H2O=6:1 mixture during warm-up, shown in Fig. 11, re-veals how the matrix is rearranged during annealing. A con-version of the asymmetric band into one resembling that ofpure CO2 occurs at the same temperature as for the stretchingmode, showing the typical double-peaked structure. CO2/H2Oices show a unique behavior which is easy to distinguish fromother ice mixtures containing CO2. However, the same band po-

656 P. Ehrenfreund et al.: Infrared spectroscopy of interstellar apolar ice analogs
2160 2150 2140 2130
pure CO
Fig. 7. Infrared absorption spectra of solid CO in CO/O2/CO2 mixtures.The peak position remains constant within 1.5 cm−1, and the bandwidth varies from 4.3 cm−1 to 7.2 cm−1.
sition is observed for ices with an H2O abundance relative toCO2 in the range of 10 - 50 %, making it difficult to determinethe exact H2O content. The two peaks, shown in Fig. 11 at 42 K,can only be distinguished when H2O ice is less abundant than10 % relative to CO2. Except pure CO2 only annealed ice mix-tures display the specific double-peaked structure, as discussedin Sect. 4.1. It is interesting to note that the the band widthsof the CO2 bending mode are different in “annealed” samplesof pure CO2 and those of CO2 embedded in a mixture (see Ta-ble 4). Small changes in the peak ratio of the double peak arelisted in Table 4. The band positions, however, remain constant(see Table 4). This is of particular importance for astronomicalobservations, see Sect. 8.
4.6. Isotopes
High signal to noise spectra are required to accurately mea-sure the 12C/13C ratio of the CO2 bands near 2340 cm−1 and2280 cm−1. This ratio is of much interest for models of thechemical evolution of the galaxy, and the strong transitionof 13CO2 has already revealed preliminary 13CO2/12CO2 ra-tios towards several interstellar targets (de Graauw et al. 1996,d’Hendecourt et al. 1996). Sandford & Allamandola (1990) haveshown that the relative strengths of the isotopic CO2 bands varyslightly in different matrices but are constant and temperature in-dependent within a given matrix. As seen from Fig. 6, the 13CO2
band behaves rather differently than that of 12CO2. Thereforeobservations of 12CO2 and 13CO2 bands can provide two virtu-ally independent tests for the ice composition. In Table 5, we
2380 2360 2340 2320
Fig. 8. Infrared absorption spectra of solid CO2 in CO/O2/CO2 mix-tures. A gradual redshift is observed for increasing concentration ofCO2 (4 cm−1). The width varies from 4.9 cm−1 to 7.3 cm−1, as for theCO band (Fig. 7).
list the isotopic ratios (ratio of the integrated band intensities)of 24 mixtures. Assuming that the 13CO2/12CO2 ratio in our ex-periments has a terrestrial value of 0.0112 ( 1
89 ), it is possible toderive the correction coefficients for each ice matrix. The de-viations of the 13CO2/12CO2 ratio from the terrestrial value arebetween -10 and +20 %. The strongest deviations (up to +20 %)are observed in mixtures that show broad CO2 profiles and wherestrong interactions in the matrix are evident. Whereas errors of±3 % could be introduced by measurement inaccuracies, theremaining discrepancies are not determined. Two possible ex-planations could be that (i) near strong transitions, the refractiveindex n is very large, or that (ii) the band strength depends onthe specific matrix composition.
Band parameters of 13CO2 and of the CO2 combina-tion modes are listed in Table 6. The (ν1 + ν3) mode oc-curs near 3700 cm−1, and the (2ν2 + ν3) band falls near3600 cm−1. Both bands are relatively strong (1.4×10⁻¹⁸ and4.5×10−19 cm molec−1; Gerakines et al. 1995) and follow ingeneral the trends of the 12CO2 stretch.
4.7. Multicomponent mixtures
The behavior of the CO profile in multicomponent mixturesvaries strongly, see Fig. 12 and corresponding Table 7. As al-ready explained in Sect. 4.4, the presence of large amounts ofCO2 and O2 are responsible for a strong broadening of the COband, as well as extensive shifts in peak position. The pres-

P. Ehrenfreund et al.: Infrared spectroscopy of interstellar apolar ice analogs 657
Table 5. Isotopic ratio of 13CO2/12CO2 in various matrices. The terres-trial 13C/12C (12C/13C) ratio is defined as 0.0112 (89)
Ice matrix 13C/12C 12C/13Cpure CO2 0.01103 90.7H2O:CO2=1:100 0.0112 89.3H2O:CO2=1:10 0.0135 74.1H2O:CO2=1:6 0.01268 78.9CO:CO2=100:4 0.01015 98.5CO:CO2=100:8 0.0102 98.0CO:CO2=100:16 0.01012 98.8CO:CO2=100:21 0.01014 98.6CO:CO2=100:23 0.01049 95.3CO:CO2=100:26 0.01037 96.4H2:O:CO:CO2=1:50:56 0.01231 81.2CO:O2:CO2=100:50:4 0.01008 99.2CO:O2:CO2=100:50:8 0.01008 99.2CO:O2:CO2=100:50:16 0.01034 96.7CO:O2:CO2=100:50:21 0.00997 100CO:O2:CO2=100:50:32 0.0102 98.0CO:O2:CO2=100:54:10 0.01010 99.0CO:O2:CO2=100:20:11 0.00992 101CO:O2:CO2=100:11:20 0.01010 99.0CO:O2:CO2=100:10:23 0.01053 95.0CO:N2:CO2=100:50:20 0.0103 97.1CO:O2:N2:CO2=100:50:25:32 0.01023 97.8H2O:CO:O2:N2:CO2=1:50:35:15:3 0.00999 100H2O:CO:O2:N2:CO2=1:25:25:10:13 0.01056 94.7
ence of the N2 molecule has only a small effect on the CO pro-file. In large concentrations N2 does, however, invoke a smallblueshift of the CO band (∼ 1 cm−1). The band width is hardlyaffected (see Fig. 12). The behavior of CO2 bands in multicom-ponent mixtures is very diverse and has already been discussedby Ehrenfreund et al. (1996a).
4.8. CO and CO2 as probes of solid O2 and N2
The fundamental vibrations of O2 and N2 are very weak, and it isnot certain if these features will ever be detected in space. Evenso, the influence of these molecules on the profiles of strongbands, such as those of CO and CO2, could be used to infer theirpresence and relative abundances. In Fig. 13, it is shown that theCO2 band in a CO2:O2=1:1 mixture is very broad (16.5 cm−1)and strongly redshifted from the band position of pure CO2.With the exception of this mixture, such a strong redshift is onlyobserved (out of 30 mixtures studied) in CO2:H2O ices whichshow some other distinguishing characteristics (see Sect. 4.5).CO2 and O2 have strong interactions, which have been alreadydiscussed by Ehrenfreund et al. (1996b). These perturbations,resulting in rather particular band shapes (see Fig. 13), couldbe used to trace solid molecular oxygen. The molecule N2 isa ”silent” matrix component, leading to small blueshifts only.Elsila et al. (1997) have investigated the CO profile in apolarmixtures and claim that best matches with the narrow interstel-lar CO band can be achieved with laboratory mixtures contain-ing comparable amounts of N2, O2, CO2 and CO. Combinedanalyses of the CO and CO2 stretching and bending mode pro-
2380 2360 2340 2320
Fig. 9. Infrared spectra of the solid CO2 stretching mode in CO2/H2Omixtures. A rather peculiar profile is observed for the CO2 stretch,which is shifted to lower frequency and characterized by a large bandwidth, the largest observed in the 60 mixtures studied. Particular ag-gregates and additional trapping sites are formed between these twomolecules when the H2O abundance exceeds 10 % relative to CO2. Theprofile remains constant until equal concentration of CO2 and H2O arereached. In polar mixtures, the band position shifts again close to thefrequency of pure CO2 (2344 cm−1) and the band width decreases.
files will provide a powerful method of tracing infrared-inactivemolecules (see also Ehrenfreund & van Dishoeck 1997).
4.9. CO in polar/apolar mixtures
Fig. 14 illustrates the differences in CO band profiles in polarand apolar ice mixtures. Within polar mixtures, the CO bandprofile remains rather constant. It is important to note that abroad CO band could also arise from apolar mixtures, e.g. whenCO2 is present in concentrations above 22 % relative to CO (seeSect. 4.3).
A shoulder centered near 2150 cm−1 is observed in all polarice mixtures containing CO. This band has been described ingreat detail by Sandford et al. (1988). The authors attribute thisfeature to interstitial CO (in between host molecules), locatedwithin the pores of the amorphous H2O lattice. The interstitialsites, which absorb at 2150 cm−1, are certainly less stable thanthe sites which absorb at 2140 cm−1, and are only present inH2O-rich ices which have not experienced warm-up or strongUV irradiation. Schmitt et al. (1989) assigned the 2150 cm−1
feature to hydrogen-bonded CO-H2O complexes in water ice.Jenniskens et al. (1995) also assign this band to CO-H2O com-
658 P. Ehrenfreund et al.: Infrared spectroscopy of interstellar apolar ice analogs
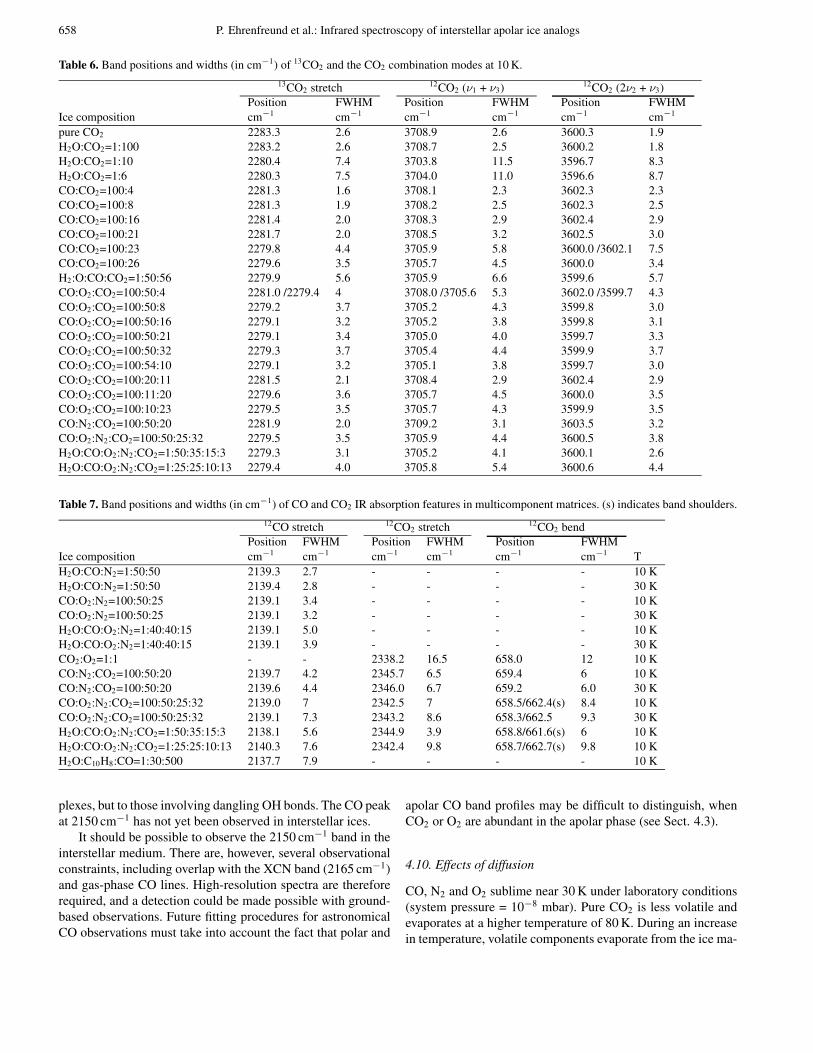
Table 6. Band positions and widths (in cm−1) of 13CO2 and the CO2 combination modes at 10 K.
13CO2 stretch 12CO2 (ν1 + ν3) 12CO2 (2ν2 + ν3)Position FWHM Position FWHM Position FWHM
Ice composition cm−1 cm−1 cm−1 cm−1 cm−1 cm−1
pure CO2 2283.3 2.6 3708.9 2.6 3600.3 1.9H2O:CO2=1:100 2283.2 2.6 3708.7 2.5 3600.2 1.8H2O:CO2=1:10 2280.4 7.4 3703.8 11.5 3596.7 8.3H2O:CO2=1:6 2280.3 7.5 3704.0 11.0 3596.6 8.7CO:CO2=100:4 2281.3 1.6 3708.1 2.3 3602.3 2.3CO:CO2=100:8 2281.3 1.9 3708.2 2.5 3602.3 2.5CO:CO2=100:16 2281.4 2.0 3708.3 2.9 3602.4 2.9CO:CO2=100:21 2281.7 2.0 3708.5 3.2 3602.5 3.0CO:CO2=100:23 2279.8 4.4 3705.9 5.8 3600.0 /3602.1 7.5CO:CO2=100:26 2279.6 3.5 3705.7 4.5 3600.0 3.4H2:O:CO:CO2=1:50:56 2279.9 5.6 3705.9 6.6 3599.6 5.7CO:O2:CO2=100:50:4 2281.0 /2279.4 4 3708.0 /3705.6 5.3 3602.0 /3599.7 4.3CO:O2:CO2=100:50:8 2279.2 3.7 3705.2 4.3 3599.8 3.0CO:O2:CO2=100:50:16 2279.1 3.2 3705.2 3.8 3599.8 3.1CO:O2:CO2=100:50:21 2279.1 3.4 3705.0 4.0 3599.7 3.3CO:O2:CO2=100:50:32 2279.3 3.7 3705.4 4.4 3599.9 3.7CO:O2:CO2=100:54:10 2279.1 3.2 3705.1 3.8 3599.7 3.0CO:O2:CO2=100:20:11 2281.5 2.1 3708.4 2.9 3602.4 2.9CO:O2:CO2=100:11:20 2279.6 3.6 3705.7 4.5 3600.0 3.5CO:O2:CO2=100:10:23 2279.5 3.5 3705.7 4.3 3599.9 3.5CO:N2:CO2=100:50:20 2281.9 2.0 3709.2 3.1 3603.5 3.2CO:O2:N2:CO2=100:50:25:32 2279.5 3.5 3705.9 4.4 3600.5 3.8H2O:CO:O2:N2:CO2=1:50:35:15:3 2279.3 3.1 3705.2 4.1 3600.1 2.6H2O:CO:O2:N2:CO2=1:25:25:10:13 2279.4 4.0 3705.8 5.4 3600.6 4.4
Table 7. Band positions and widths (in cm−1) of CO and CO2 IR absorption features in multicomponent matrices. (s) indicates band shoulders.
12CO stretch 12CO2 stretch 12CO2 bendPosition FWHM Position FWHM Position FWHM
Ice composition cm−1 cm−1 cm−1 cm−1 cm−1 cm−1 TH2O:CO:N2=1:50:50 2139.3 2.7 - - - - 10 KH2O:CO:N2=1:50:50 2139.4 2.8 - - - - 30 KCO:O2:N2=100:50:25 2139.1 3.4 - - - - 10 KCO:O2:N2=100:50:25 2139.1 3.2 - - - - 30 KH2O:CO:O2:N2=1:40:40:15 2139.1 5.0 - - - - 10 KH2O:CO:O2:N2=1:40:40:15 2139.1 3.9 - - - - 30 KCO2:O2=1:1 - - 2338.2 16.5 658.0 12 10 KCO:N2:CO2=100:50:20 2139.7 4.2 2345.7 6.5 659.4 6 10 KCO:N2:CO2=100:50:20 2139.6 4.4 2346.0 6.7 659.2 6.0 30 KCO:O2:N2:CO2=100:50:25:32 2139.0 7 2342.5 7 658.5/662.4(s) 8.4 10 KCO:O2:N2:CO2=100:50:25:32 2139.1 7.3 2343.2 8.6 658.3/662.5 9.3 30 KH2O:CO:O2:N2:CO2=1:50:35:15:3 2138.1 5.6 2344.9 3.9 658.8/661.6(s) 6 10 KH2O:CO:O2:N2:CO2=1:25:25:10:13 2140.3 7.6 2342.4 9.8 658.7/662.7(s) 9.8 10 KH2O:C10H8:CO=1:30:500 2137.7 7.9 - - - - 10 K
plexes, but to those involving dangling OH bonds. The CO peakat 2150 cm−1 has not yet been observed in interstellar ices.
It should be possible to observe the 2150 cm−1 band in theinterstellar medium. There are, however, several observationalconstraints, including overlap with the XCN band (2165 cm−1)and gas-phase CO lines. High-resolution spectra are thereforerequired, and a detection could be made possible with ground-based observations. Future fitting procedures for astronomicalCO observations must take into account the fact that polar and
apolar CO band profiles may be difficult to distinguish, whenCO2 or O2 are abundant in the apolar phase (see Sect. 4.3).
4.10. Effects of diffusion
CO, N2 and O2 sublime near 30 K under laboratory conditions(system pressure = 10−8 mbar). Pure CO2 is less volatile andevaporates at a higher temperature of 80 K. During an increasein temperature, volatile components evaporate from the ice ma-

P. Ehrenfreund et al.: Infrared spectroscopy of interstellar apolar ice analogs 659
2380 2360 2340 2320 2300
10 K
42 K
45 K
50 K
55 K
75 K
Fig. 10. Infrared absorption spectra of the stretching mode of solidCO2 in a CO2/H2O=6:1 mixture during warm-up. Stepwise annealingrevealed the two components which contribute to this large asymmetricCO2 profile. The peak at 2344 cm−1 is due to pure CO2, and the peakat 2328 cm−1 is likely due a second trapping site for CO2. This site isdestroyed when raising the temperature to 42 and 50 K. At 75 K, theband shows a profile similar to that of pure CO2. The annealing processrearranges the matrix, and after warm-up the CO2 and H2O moleculesexist within the matrix in a two-phase system.
trix and the matrix is rearranged. It is possible to monitor thesechanges through infrared spectroscopy. We have studied thespectral behavior of CO2 in CO2/H2O mixtures, which is shownin Figs. 10 and 11. In Fig. 15, we show the changes in the COband profile during warm-up to 30 K for several mixtures. Pro-files with a large band width indicate strong interactions betweenthe matrix constituents and therefore a fragile matrix. Duringthe warm-up of such an easily-destroyed matrix, complexes andaggregates are broken and the ice components are separated: re-sulting in a strong decrease in band width and blueshifts, evenfor only a small increase in temperature.
4.11. Effects of UV photolysis
CO2 is readily formed by UV photolysis of astrophysical iceanalogs. We have studied the behavior of CO and CO2 profilesin polar and apolar ice mixtures, and in “onion” structures dur-ing photolysis, see Fig. 16. An “onion” structure was simulatedin the laboratory, by depositing an apolar mixture (containingCO, O2, N2, CO2 and a small amount of H2O) on top of anH2O:CO=100:10 layer. All mixtures have a similar thickness ofup to 0.15µm (in order to ensure that they were optically thinto the UV flux). All samples were exposed to an equal amount
700 680 660 640 620
10 K
42 K
45 K
50 K
55 K
75 K
Fig. 11. Infrared absorption spectra of the bending mode of solid CO2
in a CO2/H2O=6:1 mixture during warm-up. Stepwise annealing re-vealed the two components which contribute to this large asymmetricCO2 profile. The strong asymmetric band may be due to aggregateformation, which is slowly converted into “pure” CO2, showing thetypical double-peaked structure.
of UV irradiation for 1 hr, corresponding to an interstellar ra-diation dose of ∼103 years in the outer regions of interstellarclouds and to∼108 inside dense clouds (Gerakines et al. 1996).The parameters of CO and CO2 profiles before and after UVirradiation are summarized in Table 8. Whereas the CO band israther unaffected by the UV irradiation, the profiles of both theCO2 stretching and bending modes are severely broadened. Asa result, the two peaks of the bending mode are no longer wellseparated.
UV photolysis of polar H2O/CO ice mixtures readily formsCO2, with a broad stretching mode profile (15 cm−1). The CO2
band position falls at 2341 cm−1, at lower frequencies as com-pared to that in apolar ices, with the exception of apolar mixtureswhich contain CO and CO2 in similar amounts. The irradiationof pure CO (or CO mixed in with a small amount of water ice)creates a CO2 band which is narrow and close to the position ofgaseous CO2 features. The narrow band width can be explainedbecause CO2 is only a minor species in the CO matrix and istherefore not exposed to strong interactions. The “blue” CO2
band position of 2347 cm−1 is exceptional, however.When CO2 is formed by UV photolysis from polar, apolar
or “onion” ices, the stretching mode remains rather consistentin both peak position (2341.1 - 2342.9 cm−1) and in band width(∼15 cm−1). The bending mode is not so consistent. In the polarmixture, it is redshifted and very broad (∼25 cm−1). It is also

660 P. Ehrenfreund et al.: Infrared spectroscopy of interstellar apolar ice analogs
2160 2150 2140 2130
pure CO
CO profile in multicomponent mixtures at 10 K
Fig. 12. Infrared absorption spectra of solid CO in multicomponentmatrices. At equal abundances of CO and N2, the CO band profile isblueshifted by ∼ 1 cm−1. The band width remains constant. N2 has acrystalline structure similar to that of CO and seems rather inert. Thepresence of CO2 and O2 invokes a broadening of the CO band and ashift in its peak position, depending on the exact molecular compositionof the ice mixture.
superimposed on the strong H2O libration mode, which candrastically affect the accuracy of the measurement. However,the CO2 bending mode as measured in the “onion” ices (alsosuperimposed on the water libration mode) shows a band whichis similar in band position and width to the apolar mixtures, seeTable 8. It is interesting to note, that CO2 deposited with a polarmixture and CO2 produced by UV irradiation of a polar H2O/COmixture can spectroscopically not be distinguished (see Table 8and 10).
We have furthermore determined the yield of CO2 produc-tion from various matrices, see Table 9. The initial cross sectionfor formation of CO2, σF (in cm2), may be derived from
dNdt
= φ ·Np · σF, (1)
where N is the CO2 abundance, Np the abundance of the parentCO and φ the flux of UV photons during the irradiation (seealso Gerakines et al. 1996).
In Table 9, we compare the CO2 yield of various ice mix-tures, calculated per CO molecule and per photon. Nearly all ofthe CO was converted into CO2 within the first 5 min. of irra-diation in the H2O:CO polar mixture. The spectrum remainedconstant after 1 hr of UV irradiation, reflecting that an equilib-rium between CO2 formation and destruction is reached aftera very short timescale. Apolar mixtures, containing large con-
2380 2360 2340 2320
Fig. 13. Infrared absorption spectra of solid CO2 in the presence ofO2 and N2. A strong shift to lower frequencies and a large broadeningare observed when the concentrations of O2 and CO2 are equal. Largeconcentrations of N2 cause only a small blueshift of the CO2 band andno additional broadening.
centrations of CO and O2, and “onions” lead to an efficient CO2
production (between 40 - 85 % relative that of polar mixtures).However, in apolar mixtures, a gradual increase of the CO2 pro-duction rate was monitored during 1 hr of UV exposure. In suchapolar mixtures (as well as in “onions”), competition with theproduction of O3 reduces the amount of O atoms available toform CO2. Irradiation of pure CO yields very little CO2, seealso Gerakines et al. (1996). The most efficient CO2 productionby far is achieved by irradiation of polar H2O/CO mixtures (seeTable 8).
5. Optical constants
5.1. Derivation of optical constants
The shape and peak position of strong absorption bands dependon the shape and size of the interstellar grain (see Sect. 6). Forthis correction accurate optical constants are needed. The opti-cal constants were determined using a Kramers-Kronig analysisof the transmission spectra, following the method described byHudgins et al. (1993). To summarize, the real part of the re-fractive index at all frequencies, n(ν), may be derived from theKramers-Kronig dispersion relation:
n(ν) = 1 +1
2π2
∫ ∞
0
α(ν′)(ν′ 2 − ν2)
dν′, (2)

P. Ehrenfreund et al.: Infrared spectroscopy of interstellar apolar ice analogs 661
Table 8. Band positions and widths (in cm−1) of CO and CO2 IR absorption features upon deposition (dep) and after 1 hr of UV irradiation (irr).
12CO stretch 12CO2 stretch 12CO2 bendPosition FWHM Position FWHM Position FWHM
Ice composition cm−1 cm−1 cm−1 cm−1 cm−1 cm−1
pure CO2 (dep) - - 2344.8 12.2 654.7/659.9 2.5/4.8pure CO2 (irr) - - 2343.2 15.6 655.0/659.9 11.7
pure CO (dep) 2138.6 2.5 - - - -pure CO (irr) 2138.7 2.4 - - - -
H2O:CO=100:20 (dep) 2137.3/2150 8/sh - - - -H2O:CO=100:20 (irr) 2139.8 14.1 2341.1 15.5 653.8 25.6
H2O:CO:O2:N2:CO2=1:50:35:15:3 (dep) 2138.6 5.4 2344.9 4.0 660.6 6.5H2O:CO:O2:N2:CO2=1:50:35:15:3 (irr) 2141.1 8.4 2341.8 15.5 657.4 11.1
H2O:CO=1:100 (dep) 2138.7 2.5 - - - -H2O:CO=1:100 (irr) 2138.8 2.4 2347 3.7 658.0 /660.6 4.2
H2O:CO:O2=1:50:50 (dep) 2138.6 5.5 - - - -H2O:CO:O2=1:50:50 (irr) 2139.6 7.6 2342.9 15.5 657.3/660.8 10.5
onion: (dep)bottom – H2O:CO=100:10top – H2O:CO:O2:N2:CO2=1:50:35:15:3 2138.1/2150 6.1 2344.7 3.8 - -
onion: (irr) 2141.6 10 2341.1 15 656.6 15
where α(ν) is the absorption coefficient given by
α(ν) =4πk(ν)
λ
=1h
[τ (ν) + ln
∣∣∣∣ t01t12/t02
1 + r01r12 exp(4iπhm/λ)
∣∣∣∣2]. (3)
Here, h is the thickness of the ice, τ (ν) is its measured opticaldepth, m is the total complex refractive index (m = n + ik), andtij & rij are the complex transmission and reflection coefficientsat the i−j boundary (where 0 = substrate, 1 = ice, 2 = vacuum).
In principle, we must carry out the integration in Eq. (2) overall frequencies. However, since electronic absorption bands (inthe visible and UV parts of the spectrum) are well-separatedin frequency space from the infrared, they contribute only aconstant term to the integration in Eq. (2), which may then beapproximated as:
n(ν) ≈ n0 +1
2π2
∫IR
α(ν′)(ν′ 2 − ν2)
dν′, (4)
where n0 is the real part of the ice’s refractive index at highfrequencies (as measured by previous authors; see Hudgins etal. 1993), and the integration is carried out over the infrared partof the spectrum.
Since n(ν) and k(ν) are not independent quantities, resultsmust be obtained iteratively. To begin the iteration, we assumethat at all frequencies m(ν) = n0 (values of n0 used here areidentical to those used by Hudgins et al. 1993). Once both n(ν)and k(ν) have been calculated using Eqs. (3) & (4), they areused to create an “artificial” spectrum using Eq. (3) once more,
and this is then compared to the original input spectrum. If thedifferences between the input and “artificial” spectra are toolarge, the iteration is continued with the new values of n and kas the starting point. In our case, iterations continued until thespectra agreed to within 0.1 % at each frequency point. Mostspectra in the data set achieved convergence within 30 - 40iterations, depending on the sharpness of the features and thesmoothness of the baseline. The code used to calculate n and kwas tested against a model for a Lorentz oscillator.
5.2. Baseline subtraction
To calculate accurate optical constants, the baseline of the labo-ratory spectra must be properly substracted. Ideally, the baselineof the observed transmission spectrum would have a sinusoidalpattern which is caused by interference of the waves reflectedand transmitted at the vacuum-ice and ice-substrate interfaces.This can be corrected for in the derivation of the optical con-stants at a given ice thickness. However, various experimentaleffects may deform the baseline (see e.g., Hudgins et al. 1993).Hence the baseline must be removed by a polynomial fit. Nearstrong absorption modes, like the CO2 stretching mode, the fit-ting region must be carefully chosen. The continuum at the blueand red sides of the absorption does not join up, due to a largedifference in refractive index n (e.g. Fig. 19). This is intrinsic tothe absorption band, and must not be artificially removed. Wechose to subtract a global polynomial baseline (in general oforder 4), avoiding fits close to the CO2 stretching mode. Errorsintroduced by inaccuracies of the baseline determination wereestimated to be maximally 2 %, or 5 % for some mixtures withvery broad absorption bands (e.g. mixtures containing H2O).

662 P. Ehrenfreund et al.: Infrared spectroscopy of interstellar apolar ice analogs
2180 2160 2140 2120
pure CO
CO-stretch in apolar and polar mixtures at 10 K
Fig. 14. Infrared absorption spectra of solid CO in polar and apolarmixtures. A large width is not only characteristic of polar mixtures,as previously assumed. In polar mixtures, an additional band at 2150cm−1 is always observed. This band is likely due to a CO-H2O complex.
Table 9. Yield of CO2 production after 1 hr UV irradiation (in units of10−19 cm2 per CO molecule per photon).
σF
Ice composition 10−19 cm2
pure CO 0.038H2O:CO=100:20 3.1H2O:CO:O2:N2:CO2=1:50:35:15:3 2.7H2O:CO=1:100 0.097H2O:CO:O2=1:50:50 1.2onion:bottom – H2O:CO=100:10top – H2O:CO:O2:N2:CO2=1:50:35:15:3 2.0
This uncertainty on absorbance scale is transferred directly tothe optical constants (see Sect. 6.5).
6. Grain shape effects
6.1. Resonances
The interaction of electromagnetic radiation with an interstellargrain polarizes the grain, and the molecules within it experi-ence applied and induced electric field components. This willchange the shape and peak position of strong absorption bands.In the infrared, interstellar grains are smaller than the wave-length, and electrostatic theory applies. Also, extinction due toscattering can be neglected in this limit and a simple expressionfor the absorption cross section Cabs for ellipsoidal homoge-
2160 2150 2140 2130 2120
CO profile during warm-up
10 K
30 K
10 K
30 K
10 K
30 K
Fig. 15. Infrared absorption spectra of solid CO during annealing to30 K. The profile of the CO:CO2=100:16 mixture, which has a bandwidth of 3.8 cm−1, remains nearly unchanged when heated to 30 K,whereas the width of the CO band in the CO:CO2=100:26 mixture isreduced from 7.4 cm−1 to 4.5 cm−1. A 2.6 cm−1 reduction in width isalso observed in the CO:O2:CO2=100:10:23 mixture during warm-up.Matrices with strong interacting components are easily destroyed dur-ing temperature rise.
neous particles can be derived (cf. Van de Hulst 1957, Bohrenand Huffman 1983):
Cabs/V =2π3λ
3∑i=1
2nk/L2i
(1/Li − 1 + n2 − k2)2 + (2nk)2(5)
where we have assumed that the grain resides in a vacuum. Inthis expression, V is the volume of the ellipsoid and n and kare the optical constants of the grain material, which are wave-length (λ) dependent. The geometry parameterLi (0 ≤ Li ≤ 1)characterizes the shape of the particle along each of the threemajor axes i. The summation over i assumes that the particlesare randomly oriented in space. There will be a resonance inCabs when k2 − n2 is comparable to 1/Li − 1. This impliesthat the profiles of strong absorption bands are very sensitive tothe particle shape. Near strong molecular bands, n and k varyrapidly with wavelength and the peak position will depend onLi, i.e. the particle shape. For a particular shape, the peak valueof Cabs is then proportional to 1/nk.
For spheres,Li = 1/3 along each axis, and resonances occurat k2−n2 = 2. Both weak and strong absorption bands will showa peak at large nk, near the frequency of the k peak. However,strong absorption bands will have a maximum k2 − n2 > 2,and a dominant second peak in Cabs arises at small nk towards

P. Ehrenfreund et al.: Infrared spectroscopy of interstellar apolar ice analogs 663
2180 2160 2140 2120
CO profile before and after 1 h UV irradiation
10 K
+ 1 h UV
10 K
+ 1 h UV
10 K
+ 1 h UV
2380 2360 2340 2320
+ 1 h UV
+ 1 h UV
+ 1 h UV
Fig. 16. (left) Infrared absorption spectra of solid CO in polar, apolar and “onion” type ices before and after 1 hr of UV irradiation. In the polarmixture, the shoulder of the CO band (centered near 2150 cm−1) has disappeared after photolysis. The apolar CO band profile remains constantafter photolysis, whereas the CO band broadens and shifts by 5 cm−1 to higher frequency in the “onion” ice. (right) Infrared absorption spectraof solid CO2 produced by irradiation of polar, apolar, and “onion” type ices after 1 hr of UV irradiation. A broad CO2 band is produced fromthe polar mixture, with a width of 15 cm−1. The CO2 band created by photolysis of apolar CO is narrow, since only a small amount of CO2 isformed by this process. The CO2 stretching mode formed from an “onion” type ice shows the same width and peak position than in a polar ice.
higher frequencies. For our optical constants of pure CO andCO2 ices, this second resonance is respectively 6 and 8 timesstronger than the resonance for high nk, and they have blendedin one absorption peak. For spheroidal particles Li will be thesame along two axes, due to symmetry. For example, an oblatespheroid with a minor (i = 3) over major (i = 1, 2) axis ratioof 0.5 has L3 = 0.54 and L1 = L2 = 0.23. In this case twodominant resonances will occur for strong bands, one at k2 −n2 = 1.6 along the minor axis and one at k2−n2 = 3.3 along themajor axes. Non-spheroidal ellipsoids will show three differentabsorption peaks, each resulting from an axis. Furthermore, forcoated spherical particles, the core and mantle will be differentlypolarized and surface modes at each interface will induce twoseparate resonances. For example, a grain with a silicate coretaking up 10 % of the total volume, will show resonances atk2−n2=3.28 and 0.80 (using silicate optical constants at 4.4µm;Laor and Draine 1993).
Thus, the profile of strong absorption bands dependsstrongly on the adopted dust model, and considerable devia-tions from the profile observed in the laboratory may occur. Inthis case, the laboratory ice transmission spectrum cannot be ap-plied to astrophysical conditions, and grain shape calculations(and thus accurate optical constants) are required.
6.2. Calculations
We have calculated wavelength-dependent absorption cross sec-tions for a number of different grain models in the small-particle
limit. Standard formulae were applied for ice spheres, silicatespheres coated with an ice mantle (equal volume for core andmantle), and a distribution of ellipsoidally shaped particles witheach shape equally probable (‘CDE’; e.g. Van de Hulst 1957,Bohren and Huffman 1983). Additionally, a model for a distribu-tion of coated spherical grain sizes was calculated. We assumedthat the ice mantle thickness is independent of grain size, whichfollows from simple grain growth arguments (Draine 1985). Al-though our calculations are done in the small-particle limit, andCabs/V is independent of grain size, the absorption profile isvery sensitive to the ratio of grain core versus mantle volume(compare, for example, the pure ice spheres and the core-mantlegrain in Figs. 18 and 20). Thus, in order to simulate the effectof a grain size distribution, we actually integrate over a distribu-tion of core/mantle volume ratios, for a fixed mantle thicknessand grain core size distribution. For this study, we used a mantlethickness of 0.01µm and the interstellar grain size distributionderived by Mathis, Rumple and Nordsieck (1977; ‘MRN’), i.e.a power law distribution of grain number density with grain ra-dius of index -3.5 and cutoff radii of 0.005 and 0.3µm. Notethat for this MRN model Cabs/V has been normalized to theintegrated total grain volume (cores+mantles).
We have done these calculations for the optical constants ofour database of CO and CO2 ices. For the pure ices, we com-pare the calculations using optical constants derived by differentlaboratory groups: Tielens et al. (1991; ‘T91’), Hudgins et al.(1993; ‘H93’), Trotta (1996; ‘T96’), Trotta and Schmitt (1997),

664 P. Ehrenfreund et al.: Infrared spectroscopy of interstellar apolar ice analogs
Fig. 17. The optical constants for the fundamental mode of pure COice, derived in different studies (see text for abbreviations): this work(thin solid line), B97 (dash), E97 (dash-dot), T96 (dash-triple dots), andT91 (dots). The thick solid line are the constants calculated from ourtransmission spectrum, assuming a two times larger sample thickness.
Elsila et al. (1997; ‘E97’) and preliminary data from Baratta etal. (1997; ‘B97’). Furthermore, we test the effect of possibleerrors in the sample thickness, baseline subtraction and adoptedelectronic refractive index, n0, on the optical constants andCabs
for the different grain models.
6.3. CO
The differences in the optical constants between the above men-tioned studies of the solid CO fundamental absorption mode(Fig. 17) induce a large variation in sensitivity to the grainshape. The optical constants of T96 correspond to the weak-est intrinsic strength, and are insensitive to the particle shape(Fig. 18). The peak and width of the profile are similar to thek-spectrum. Although the peak k value in the T96 data is thesame as for B97, the latter shows a blueshift of 1.5 cm−1 afterthe calculations. Also a broadening of 1 - 1.5 cm−1 occurs forthe B97 when applying size and shape distributions comparedto pure ice spheres. This difference is caused by the presenceof an extended blue wing in k for B97. The grain shape hasthe largest influence for T91 and our optical constants, induc-ing blueshifts up to 3 cm−1 compared to k, and large shifts andbroadenings (2 - 4 cm−1) between the different grain models.Both data sets have extensive wings in k towards the blue. TheE97 sample has a peak k comparable to T91, but the blue wingis less pronounced. Consequently, the peak shifts and broad-enings are reduced by almost a factor two for this sample. Weemphasize that these shifts, broadenings and their uncertainties
Fig. 18. Absorption cross sections for the pure solid CO fundamentalmode for different dust models, using the optical constants shown inFig. 17. Models in the small particle limit were calculated for pure icespheres, silicate spheres with an ice mantle of equal volume, a con-tinuous distribution of ellipsoids (CDE) and an MRN size distributionwith 0.01 µm thick ice mantles and silicate cores. The cross sectionshave been scaled by the number given in the right-lower corner of eachpanel.
(comparing the different data sets) have the same magnitude asthe matrix-induced variations discussed in this paper.
6.4. CO2
Although the peak values of k are similar for CO and CO2, thewavelength region with k > n is broader and more pronouncedfor CO2 (Fig. 19). This causes a much larger sensitivity of theabsorption profile to the shape and size of the grains (Fig. 20).Like CO, large differences exist between the optical constantsderived by different groups. Again, the T96 data have the lowestpeak k value and are least sensitive to the grain shape calcula-tions, However, in this case the effect is not negligible. Typically,peak shifts and broadenings of 5 cm−1 can occur. For the otherdatasets the effects are much larger, and in fact dominate overmatrix-induced variations for CO2-rich mixtures. The strongestbroadening is observed for H93, i.e. up to 25 cm−1 for the CDEmodel compared to the laboratory spectrum. This broadeningis only half for B97, and our data is in between these cases.For a pure CO2 ice sphere, the width is comparable to the lab-oratory spectrum. However, whereas for the CDE model thepeak is blueshifted by 6 cm−1, the ice sphere shows a muchlarger blueshift ('15 cm−1) for both B97, H93 as well as ourdata. These peak shifts and broadenings reflect the presence of adeep minimum in n, and corresponding large k values for thesedatasets. For ices with a low CO2 concentration (< 10%), k issmall compared ton and these grain shape effects are negligible.

P. Ehrenfreund et al.: Infrared spectroscopy of interstellar apolar ice analogs 665
The results for the bending mode of solid CO2 are rathersimilar to the stretching mode. The H93 spectra are, like ourdata, very sensitive to grain shape effects in the 665 - 680 cm−1
region, where k > n. For a single coated sphere this gives rise toa third absorption peak, besides the two peaks corresponding todifferent trapping sites for pure CO2 and heated CO2 mixtures.However, for the shape and size distributions this third peakmerges with the bluest of the trapping peaks. This results in astrongly asymmetric double-peaked profile, with a strong bluepeak. Not surprisingly, the T96 sample does not show this effect,although the blue peak has slightly broadened.
6.5. Error propagation
We have investigated whether the remarkable differences be-tween the CO and CO2 optical constants derived in this paperand in T96 and B97 may be ascribed to an error in the assumedsample thickness. For CO, an increase of the thickness witha factor two results in a reasonable agreement in peak k andn values (Fig. 17). However, large differences remain in thestrong absorption region long-ward of 2140 cm−1, and thus inCabs for the different grain models (Fig. 18). For the CO2 stretchmode, a 2.7 times larger thickness would be needed to obtaina peak k value corresponding with T96 (Fig. 19). However, inthis case the peak n value is too low, whereas for the bendingmode a much larger sample thickness would be needed to obtaina good match. Not surprisingly, no good match is obtained forthe corresponding cross section profiles (Fig. 20). These resultsindicate that an erroneous sample thickness (i.e. band strengthand/or ice density) is not the main explanation for the observeddiscrepancies.
T96 and Trotta & Schmitt (1997) claim that the “classical”assumptions in the optical transfer (Sect. 5) used to deriven andk from the transmission spectra, may lead to an overestimationof k. This could be a reason for the discrepancy between theresults of different groups. We refer to their work and B97 fora thorough discussion of their experimental methods.
Besides a possible error in the sample thickness, we inves-tigated the propagation of uncertainties in a number of otherparameters in the calculation of the optical constants and sub-sequent grain shape calculations. Eq. (5) shows that the peakvalue of Cabs is proportional to 1/nk, and strong peaks requireaccurate optical constants.
First, we have calculated the optical constants using severalvalues for the refractive index at high frequencies, n0 for pureCO2 ice. In this case, a 30 % spread was found inCabs for the bluepeak of the core-mantle sphere, when applyingn0 = 1.22±0.02.For the CDE and MRN models this uncertainty is reduced to10 %. Also a systematic peak shift was observed (Fig. 21).
Second, for pure CO2 a typical uncertainty of 1-2 % on ab-sorbance scale is introduced by the baseline subtraction. This istransferred directly into k and amplified in the grain shape cal-culations. This effect is the strongest for the single core–mantlespheres, up to 6 % on Cabs scale, when using our experiment ofpure CO2. This is not very important compared to the uncertain-
Fig. 19. The optical constants for the stretch (left) and bend (right) ofpure CO2 ice, derived in different studies: this work (thin solid line),B97 (dash), T96 (dash-triple dots), and H93 (dots). The thick solid lineare the constants calculated from our transmission spectrum, assuminga 2.7 times larger sample thickness.
ties discussed above, although we stress that a careful baselinecorrection is required (see Sect. 5.2).
6.6. Summary
We have derived the optical constants of pure CO and CO2 ice,applying the Kramers-Kronig analysis to the observed trans-mission spectra. Large discrepancies were found between theconstants derived in 5 other studies. Our experiments were notdesigned to address the issue of optical constants directly andindependently. Hence, no judgment can be made on this issue.
However, we do note that particle shape effects are impor-tant for strong transitions. They can lead to multiple peaks, peakshifts, and broadening of the absorption profile. The differentoptical constants were used to calculate these effects, and largedifferences were found. For CO, grain shape effects are impor-tant when the constants of E97, T91 and ours are used. Theeffects are smaller for B97, and negligible for T96. For CO2,all investigated data sets are sensitive to the grain shape. Mostsensitive are our data, H93 and B97. T96 is least sensitive, butstill peak shifts and broadenings up to 5 cm−1 occur betweenthe different dust models.
7. The astronomical cookbook
We have analysed the infrared spectra of 70 apolar mixturescontaining CO, CO2, O2 and N2. The basic rule is that O2 andCO2 invoke due to their electronic structure, strong interactionswith each other and with CO. The molecule N2 is rather inert.Therefore the strongest shifts and large broadening of CO andCO2 band profiles occur in general when the components areequally abundant in the ice. A narrow CO or CO2 band profileimplies in general that no strong interactions occur between theice components. For CO this is the case when pure or mixed

666 P. Ehrenfreund et al.: Infrared spectroscopy of interstellar apolar ice analogs
Fig. 20. Absorption cross sections for the pure solid CO2 stretch (left) and bend (right) for different dust models, using the optical constantsshown in Fig. 19. Models in the small particle limit were calculated for pure ice spheres, silicate spheres with an ice mantle of equal volume, acontinuous distribution of ellipsoids (CDE) and an MRN size distribution with 0.01µm thick ice mantles and silicate cores. The cross sectionshave been scaled by the number given in the right-lower corner of each panel.
with N2 (also in large amounts) or small amounts of O2 andCO2 (up to a few %). In this case the FWHM does not exceed 3cm−1. In CO/O2 mixtures a gradual increase in band width canbe monitored with increasing O2 concentration. A band widthmaximum of 5 cm−1 is reached when O2 and CO are equallyabundant (Sect. 4.2). In CO/CO2 mixtures a dramatic change inband width occurs when CO2 exceeds 21 % relative to CO andreaches a value of ∼ 10 cm−1, when CO and CO2 have equalabundance (see Sect. 4.3). This is also the largest band width ofCO observed within 70 mixtures. The peak position of apolarCO shifts depending on the dilutant. Pure CO peaks at 2138.7cm−1. Large amounts of N2 invoke blueshifts of < 1 cm−1.O2 in large concentrations may induce a redshift of 1.3 cm−1.Large concentration of CO2 invoke blueshifts up to 2.5 cm−1. Inmulticomponent mixtures the deviation of the CO band positionfrom pure CO is not pronounced, because the various interac-tions between all ice components tend to cancel each other out.To summarize: a narrow apolar CO band excludes the presenceof other molecules in the ice with the exception of N2. A largeband width confirms the presence of O2 and CO2, showing a redand blue shifted band respectively. When the band is broad (5 -7 cm−1) and only slightly shifted from the position of pure COit indicates in general the presence of both molecules, CO2 andO2. However, some CO/CO2 mixtures (e.g. CO:CO2=100:26)also show similar spetroscopic characteristics. Polar CO (em-bedded in a water-rich mixture) displays in general a band widthof 8 cm−1, but appears at lower frequency (2137 cm−1). Detailsare summarized in Table 10.
Pure CO2 peaks at 2344.5 cm−1 and displays a broad feature(12 cm−1) with pronounced wings. The bending mode of CO2
is unique and shows a double structure (see Sect. 4.3). A narrowCO2 band profile can only be observed when CO2 is present in
very low abundance within other components in the ice. Sucha narrow band is also accompanied by a strong blueshift closeto the gas phase position (2349 cm−1). CO2 interacts stronglywith CO and O2. In CO/CO2 mixtures the band width increasesfrom 3.1 cm−1 (4 % CO2 relative to CO) to 19 cm−1 (when COand CO2 are in equal abundances). A large band width is alsoaccompanied by a large redshift of the CO2 band (5 cm−1 in thecase of CO/CO2=1:1). Extreme profiles with band shifts up to15 cm−1 are observed in CO2/H2O mixtures when H2O exceedsa few % in the ice. Such CO2 bands are then unusually broad(up to 30 cm−1) and easily distinguishable, see Fig. 9 and 10. Awide CO2 band (> 15 cm−1) which is strongly redshifted doesindicate the presence of abundant O2. The CO2 band blue-shiftsin the presence of N2 but does not show broadening.
The spectroscopic properties of multicomponent mixturesare the result of many different interactions of the variousmolecules present. In order to derive reliable abundances ofinfrared inactive molecules, the profiles of CO and CO2 bandsas well as their isotopes have to be carefully deconvolved. PolarCO2 peaks at 2341 cm−1 and has a band width of 15 cm−1. TheCO2 bending mode is then superimposed on the H2O librationmode and polar CO2 can be well recognized. The details aresummarized in Table 10.
Warm-up leads to changes in the matrix configuration.Volatile molecules may evaporate, and species (such as H2O),which are distributed within the matrix tend to polymerize(Ehrenfreund et al. 1996b). In general, bands in multicompo-nent mixtures sharpen and shift after temperature rise and are insome cases hard to distinguish from pure ices, see Sect. 4.5. Ad-ditional changes of the profiles of the CO and CO2 bands can beinduced depending on the grain shape, summarized in Sect. 6.The effects are largest for pure CO2. For example, a blue-shift of
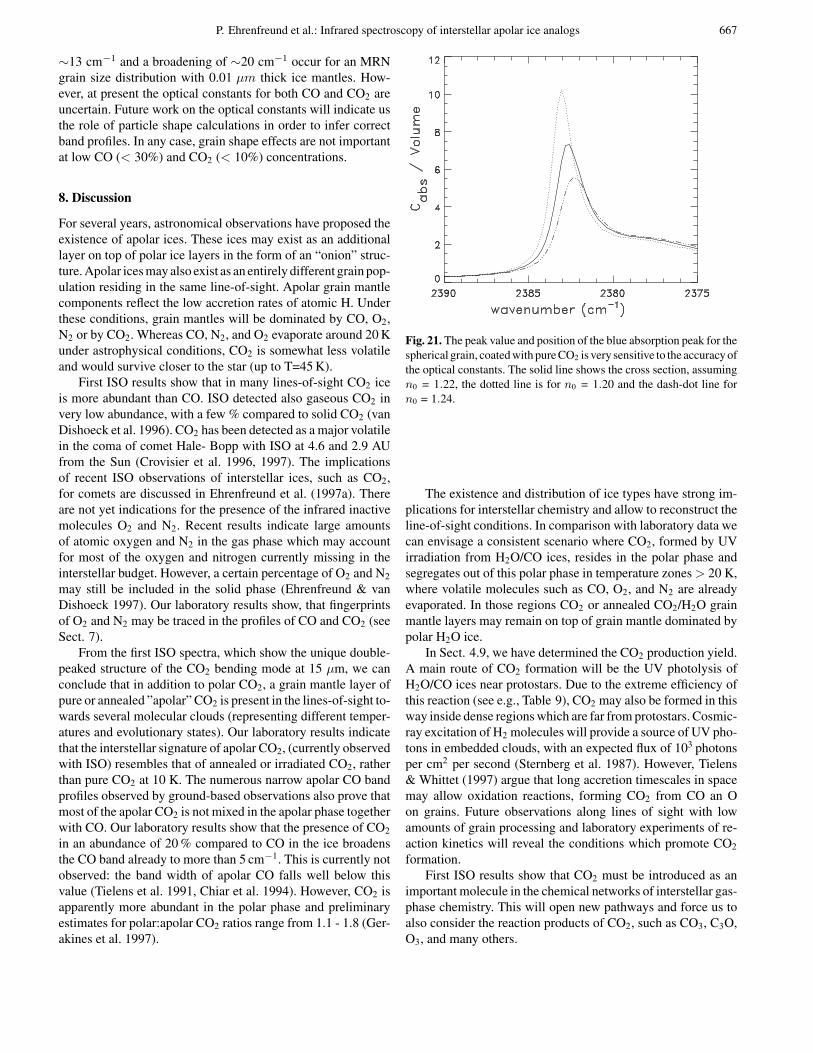
P. Ehrenfreund et al.: Infrared spectroscopy of interstellar apolar ice analogs 667
∼13 cm−1 and a broadening of ∼20 cm−1 occur for an MRNgrain size distribution with 0.01 µm thick ice mantles. How-ever, at present the optical constants for both CO and CO2 areuncertain. Future work on the optical constants will indicate usthe role of particle shape calculations in order to infer correctband profiles. In any case, grain shape effects are not importantat low CO (< 30%) and CO2 (< 10%) concentrations.
8. Discussion
For several years, astronomical observations have proposed theexistence of apolar ices. These ices may exist as an additionallayer on top of polar ice layers in the form of an “onion” struc-ture. Apolar ices may also exist as an entirely different grain pop-ulation residing in the same line-of-sight. Apolar grain mantlecomponents reflect the low accretion rates of atomic H. Underthese conditions, grain mantles will be dominated by CO, O2,N2 or by CO2. Whereas CO, N2, and O2 evaporate around 20 Kunder astrophysical conditions, CO2 is somewhat less volatileand would survive closer to the star (up to T=45 K).
First ISO results show that in many lines-of-sight CO2 iceis more abundant than CO. ISO detected also gaseous CO2 invery low abundance, with a few % compared to solid CO2 (vanDishoeck et al. 1996). CO2 has been detected as a major volatilein the coma of comet Hale- Bopp with ISO at 4.6 and 2.9 AUfrom the Sun (Crovisier et al. 1996, 1997). The implicationsof recent ISO observations of interstellar ices, such as CO2,for comets are discussed in Ehrenfreund et al. (1997a). Thereare not yet indications for the presence of the infrared inactivemolecules O2 and N2. Recent results indicate large amountsof atomic oxygen and N2 in the gas phase which may accountfor most of the oxygen and nitrogen currently missing in theinterstellar budget. However, a certain percentage of O2 and N2
may still be included in the solid phase (Ehrenfreund & vanDishoeck 1997). Our laboratory results show, that fingerprintsof O2 and N2 may be traced in the profiles of CO and CO2 (seeSect. 7).
From the first ISO spectra, which show the unique double-peaked structure of the CO2 bending mode at 15 µm, we canconclude that in addition to polar CO2, a grain mantle layer ofpure or annealed ”apolar” CO2 is present in the lines-of-sight to-wards several molecular clouds (representing different temper-atures and evolutionary states). Our laboratory results indicatethat the interstellar signature of apolar CO2, (currently observedwith ISO) resembles that of annealed or irradiated CO2, ratherthan pure CO2 at 10 K. The numerous narrow apolar CO bandprofiles observed by ground-based observations also prove thatmost of the apolar CO2 is not mixed in the apolar phase togetherwith CO. Our laboratory results show that the presence of CO2
in an abundance of 20 % compared to CO in the ice broadensthe CO band already to more than 5 cm−1. This is currently notobserved: the band width of apolar CO falls well below thisvalue (Tielens et al. 1991, Chiar et al. 1994). However, CO2 isapparently more abundant in the polar phase and preliminaryestimates for polar:apolar CO2 ratios range from 1.1 - 1.8 (Ger-akines et al. 1997).
Fig. 21. The peak value and position of the blue absorption peak for thespherical grain, coated with pure CO2 is very sensitive to the accuracy ofthe optical constants. The solid line shows the cross section, assumingn0 = 1.22, the dotted line is for n0 = 1.20 and the dash-dot line forn0 = 1.24.
The existence and distribution of ice types have strong im-plications for interstellar chemistry and allow to reconstruct theline-of-sight conditions. In comparison with laboratory data wecan envisage a consistent scenario where CO2, formed by UVirradiation from H2O/CO ices, resides in the polar phase andsegregates out of this polar phase in temperature zones > 20 K,where volatile molecules such as CO, O2, and N2 are alreadyevaporated. In those regions CO2 or annealed CO2/H2O grainmantle layers may remain on top of grain mantle dominated bypolar H2O ice.
In Sect. 4.9, we have determined the CO2 production yield.A main route of CO2 formation will be the UV photolysis ofH2O/CO ices near protostars. Due to the extreme efficiency ofthis reaction (see e.g., Table 9), CO2 may also be formed in thisway inside dense regions which are far from protostars. Cosmic-ray excitation of H2 molecules will provide a source of UV pho-tons in embedded clouds, with an expected flux of 103 photonsper cm2 per second (Sternberg et al. 1987). However, Tielens& Whittet (1997) argue that long accretion timescales in spacemay allow oxidation reactions, forming CO2 from CO an Oon grains. Future observations along lines of sight with lowamounts of grain processing and laboratory experiments of re-action kinetics will reveal the conditions which promote CO2
formation.First ISO results show that CO2 must be introduced as an
important molecule in the chemical networks of interstellar gas-phase chemistry. This will open new pathways and force us toalso consider the reaction products of CO2, such as CO3, C3O,O3, and many others.

668 P. Ehrenfreund et al.: Infrared spectroscopy of interstellar apolar ice analogs
Table 10. Variation in the CO band profile
Ice type Band position range Band width range Matrix effectscm−1 cm−1
pure CO 2138.7 2.2 -mixed with N2 (1-50 %) 2138.8-2139.4 up to 3 only very small blueshifts, no broadeningmixed with N2 and O2 2139.1 3.3 - 5 increasing concentration of O2 broadens the band,
position stablemixed with O2 (20-50 %) 2137.4-2138.8 3.3 - 5.5 small redshifts, broadening of 2 cm−1 when CO:O2=1:1mixed with CO2 (4-50 %) 2138.4-2141.3 2.5 - 9.6 increasing concentration of CO2 leads to blueshifts,
broadening of 7 cm−1 when CO:CO2=1:1!mixed with O2 and CO2 2137.6-2139.6 4.3 - 7.2 increasing concentration of CO2 broadens the band,
band position is stable, red-and blueshifts cancel outmixed with multicomponents 2137.7-2140.3 4.0 - 8.0 band width is increasing when CO2 and O2 are
abundant relative to CO, band position varies stronglypolar CO ice 2137/2150 8 (plus shoulder) -
Table 11. Variations in the CO2 stretching mode profile
Ice type Band position range Band width range Matrix effectscm−1 cm−1
pure CO2 2344.8 12.1 -mixed with O2 2338.2 16.5 large redshifts and broadening when CO2:O2=1:1mixed within CO (4-50 %) 2339.7-2346.7 3.1 - 19 redshifts and broadening with increasing CO2
concentrationmixed within CO and O2 (4-50 %) 2342.4-2346.3 4.9 - 7.3 redshifts and broadening with increasing CO2
concentrationmixed with H2O ice 2330-2332! 28 - 31 asymmetric profile with extreme redshift and
strong broadening, when H2O > 10 %mixed with multicomponents 2342.0 -2346 4.0 - 10.0 band position and width are changing
depending on the other molecules presentpolar CO2 ice 2341 15 -
Table 12. Variations in the CO2 bending mode profile
Ice type Band position range Band width range Matrix effectscm−1 cm−1
pure CO2 654.7/659.9 2.6/4.7 double peakmixed with O2 658 12 large redshifts and broadeningmixed within CO (4-50 %) 656.6 - 659.4 2.5 - 11 broadening with increasing CO2 concentration
CO2 bend reaches 11 cm−1 when CO:CO2=1:1mixed within CO and O2 (4-50 %) 658-659 5 - 8 up to 3 subpeaks and shoulders can be observed
depending on the mixturemixed with H2O ice 655 ! 11-12 asymmetric profile with extreme redshift and
strong broadeningmixed with multicomponents 658-659 6.0 - 10.0 band position and width are changing
depending on other constituentsdifferent subpeaks can be seen around 661 cm−1
polar CO2 ice 653 25 -
9. Conclusions
This paper summarizes the spectroscopic properties of adatabase of apolar ice analogs and discusses their astrophys-ical implications. We remind that this database can be found onthe www: http://www.strw.leidenuniv.nl/∼ehrenfreund/isodb,and includes a help page for explanations. Using this database,observers can try to fit their measured profiles themselves, andassess the influence of any particle shape using the optical con-stants. It has been shown that the optical constants obtained by
five different groups do differ strongly. As long as no consensusis reached on this subject, particle shape calculations have tobe used with caution. However it is evident that such particleshape calculations are important, at least for CO2 features. Ourdatabase is therefore dynamical and regularly updated.
Current ISO observations show a constant CO2 profile invarious lines-of-sight indicating the presence of CO2-rich ices,which can be explained by the wings in the CO2 stretchingmode and the double-peak structure in the CO2 bending mode.
P. Ehrenfreund et al.: Infrared spectroscopy of interstellar apolar ice analogs 669
An even larger fraction of CO2 is observed in the polar phasetowards the same targets. These two components likely indi-cate the formation of CO2 from UV photolysis of H2O/CO icesclose to the protostar and a grain mantle component formed ina temperature zone > 20 K when CO2 is segregating out of thepolar phase. In comparison with astronomical observations thelaboratory data on the stretching and bending mode of 12CO2
and the 13CO2 isotope provide a powerful diagnostic in order todetermine the exact ice composition of interstellar grains. Thepresented database will enable to derive more exact ratios ofpolar/versus apolar ices using χ2 calculation on incoming ISOdata (Gerakines et al. 1997). With additional observations of theCO band (ground based and ISO) we can determine existing ice-types, ice structure (amorphous or crystalline) and temperatureand irradiation conditions in the line-of-sight towards proto-stars. Column densities can be determined for CO and CO2 icesas well as upper limits on the presence of solid O2 and N2 ice.To reconstruct the different cloud components and line-of sightconditions towards embedded protostars will provide importantconstraints on the evolution of molecular clouds.
Acknowledgements. We want to thank G. Baratta, M. Palumbo, G.Strazulla from the University of Catania and B. Schmitt and E. Trottafrom the Laboratoire de Glaciologie Grenoble, for the permission tointegrate their unpublished optical constants for CO and CO2 ice in ourpaper, in order to allow a global overview on this still debated topic.PE wishes to thank W. Schutte for many fruitful discussions and C.Dominik for computer support. PAG wishes to thank F. Rouleau forhis help in understanding the optical constants calculations. The lab-oratory work was supported by the European Community grant ER-BCHBICT940939. PAG is supported by NASA grant NAGW-4039.PE is a recipient of an APART fellowship of the Austrian Academy ofSciences.
References
Baratta et al., 1997 (in preparation; B97)Barnes A.J., Szczepaniak K., Orville-Thomas W.J., 1980, J. Mol. Struc.
59, 39Bohren C. F., Huffman D.R., 1983, Absorption and Scattering of Light
by Small Particles. John Wiley & Sons, New York, Ch. 5Boogert A. et al., 1996, A&A 315, L377Chiar J. E., Adamson A. J., Kerr T. H., Whittet D. C. B., 1994, ApJ
426, 240Chiar J. E., Adamson A. J., Kerr T. H., Whittet D. C. B., 1995, ApJ
455, 234Crovisier J., et al., 1996, A&A 315, L 361Crovisier J., et al., 1997, Science 275, 1904d’Hendecourt L. B., Allamandola L. J., Greenberg J. M., 1985, A&A
152, 130d’Hendecourt L. B., Allamandola L. J., Grim R., Greenberg J. M.,
1986, A&A 158, 119d’Hendecourt L. B., Jourdain de Muizon M., 1989, A&A 223, L5d’Hendecourt L.B., Ehrenfreund P., 1996, Proceedings: ”The Role of
Dust in the Formation of Stars”, ESO, Munich, September 1995,301
d’Hendecourt L.B., et al., 1996, A&A 315, L365de Graauw Th. et al. 1996, A&A 315, L345Dorschner J., Henning T., 1995, A&AR 6, 271
Draine, B.T. 1985, in Protostars and Planets II, ed. D. Black & M.Mathews (Tucson: Univ. of Arizona Press), 621
Ehrenfreund P., Breukers R., d’Hendecourt L., Greenberg J. M.,1992, A&A 260, 431
Ehrenfreund P. et al. 1996a, A&A 315, L341Ehrenfreund P., Gerakines P.A., Schutte W.A., van Hemert M., E.F.
van Dishoeck, 1996b, A&A 312, 263Ehrenfreund P., van Dishoeck E.F., 1997, Advances in Space Research,
in pressEhrenfreund P., d’Hendecourt L., Dartois E., Jourdain de Muizon M.,
Breitfellner M., Puget J.L., Habing H.J., 1997, Icarus, in pressEhrenfreund P. et al. 1997b, in preparation for J. Chem. Phys.Elsila J., Allamandola L.J., Sandford S.A., 1997, ApJ 479, 818 (E97)Gerakines P.A., Schutte W. A., Greenberg J. M., van Dishoeck E. F.,
1995, A&A, 296, 810Gerakines P.A., Schutte W. A., Ehrenfreund P., 1996, A&A 312, 289Gerakines P.A. et al. 1997, in preparation for ApJGrim R.J.A., Baas F., Geballe T.R., Greenberg J.M., Schutte W., 1991,
A&A 243, 473Hagen W., Tielens A. G. G. M., 1981, J. Chem. Phys. 75, 4198Hudgins D. M., Sandford S. A., Allamandola L.J., Tielens A.G.G.M,
1993, ApJS 86, 713 (H93)Jenniskens P., Blake D.F., Wilson M.A., Pohorille A., 1995, ApJ 455,
389Laor, A., & Draine, B.T. 1993, ApJ 402,441Mathis J. S., Rumpl W., Nordsieck K. H., 1977, ApJ 217, 425Palumbo M. E., Strazulla G., 1993, A&A 269, 568Sandford S.A., Allamandola L.J., Tielens A.G.G.M., Valero L.J. 1988,
ApJ 329, 498Sandford S. A., Allamandola L. J., 1990, ApJ 355, 357Schmitt B., Greenberg J.M., Grim, P., 1989, ApJ 340, 33Schmitt B., 1994, in: Molecules and grains in space, ed. Nenner I. AIP
press, New York, 735Skinner C.J., Tielens A.G.G.M., Barlow M.J., Justtanont K., 1992, ApJ
399, L79Stacey G.J. et al., 1993, ApJ 404, 219Sternberg A., Dalgarno A., Lepp S.,1987, ApJ 320, 676Tielens A. G. G. M., Tokunaga A. T., Geballe T. R., Baas F., 1991,
ApJ 381, 181 (T91)Tielens A. G. G. M., Whittet, D.B.C., 1997, Proceedings: Molecules
in Astrophysics: Probes and Processes, ed. E.F. van Dishoeck,Kluwer Dortdrecht, 45
Trotta F., 1996, Thesis, LGGE-CNRS, Universite Joseph Fourier,Grenoble, France (T96)
Trotta F., Schmitt, B., 1997, Applied Spectroscopy (in preparation)van Dishoeck E.F., et al., 1996, A&A 315, L 349Van de Hulst H.C., 1957, Light Scattering by Small Particles. John
Wiley & Sons, New York, Ch. 6Weber P., Greenberg J. M., 1985, Nature 316, 403Whittet D.C.B., Walker H.J., 1991, MNRAS 252, 63Whittet D. C. B., Duley W. W., 1991, A&AR 2, 167Whittet D. C. B., 1993 in: Dust and chemistry in astronomy, eds. Mil-
lar T. J., Williams D. A., IOP Publ. Ltd. Bristol, 1Whittet D.C.B. et al., 1996, A&A 315, L357Willner S. P., Gillet F. C., Herter T. L., et al., 1982, ApJ 253, 174
This article was processed by the author using Springer-Verlag LaTEXA&A style file L-AA version 3.