infrareit, inc. -...
TRANSCRIPT

UNITED STATESSECURITIES AND EXCHANGE COMMISSION
WASHINGTON, D.C. 20549
FORM 8-K
CURRENT REPORTPursuant to Section 13 or 15(d)
of the Securities Exchange Act of 1934
Date of Report (date of earliest event reported): January 10, 2018
InfraREIT, Inc.(Exact name of registrant as specified in its charter)
Maryland 001-36822 75-2952822
(State or Other Jurisdictionof Incorporation)
(CommissionFile Number)
(IRS EmployerIdentification No.)
1900 North Akard StreetDallas, Texas 75201
(Address of Principal Executive Offices) (Zip Code)
Registrant’s telephone number, including area code: (214) 855-6700
(Former name or former address, if changed since last report)
Check the appropriate box below if the Form 8-K filing is intended to simultaneously satisfy the filing obligation of the registrant under any of the followingprovisions (see General Instruction A.2. below):
☐ Written communications pursuant to Rule 425 under the Securities Act (17 CFR 230.425)
☐ Soliciting material pursuant to Rule 14a-12 under the Exchange Act (17 CFR 240.14a-12)
☐ Pre-commencement communications pursuant to Rule 14d-2(b) under the Exchange Act (17 CFR 240.14d-2(b))
☐ Pre-commencement communications pursuant to Rule 13e-4(c) under the Exchange Act (17 CFR 240.13e-4(c))
Indicate by check mark whether the registrant is an emerging growth company as defined in Rule 405 of the Securities Act of 1933 (17 CFR 230.405) or Rule12b-2 of the Securities Exchange Act of 1934 (17 CFR 240.12b-2).
Emerging growth company ☒
If an emerging growth company, indicate by check mark if the registrant has elected not to use the extended transition period for complying with any new orrevised financial accounting standards provided pursuant to Section 13(a) of the Exchange Act. ☒

Item 2.02. Results of Operations and Financial Condition.
As previously announced, Brant Meleski, Chief Financial Officer of InfraREIT, Inc. (“InfraREIT” and, together with its subsidiaries, the “Company”), willbe participating in the 4 th Annual Evercore ISI Utility CEO Conference on January 11-12, 2018. A copy of the Company’s presentation for this conference isfurnished as Exhibit 99.1 to this Current Report on Form 8-K. In accordance with General Instruction B.2 of Form 8-K, the information set forth in this Item 2.02shall be deemed to be furnished and shall not be deemed to be “filed” for purposes of the Securities Exchange Act of 1934, as amended (the “Exchange Act”).
Item 8.01. Other Events.
InfraREIT is providing the following update with respect to the recently enacted legislation commonly referred to as the Tax Cuts and Jobs Act (the “TaxCuts and Jobs Act”).
The Tax Cuts and Jobs Act includes a reduction in the highest marginal U.S. federal corporate income tax rate (“corporate tax rate”) from 35% to 21%,effective for taxable years beginning on or after January 1, 2018. The Company derives revenues by leasing its transmission and distribution assets to its soletenant, Sharyland Utilities, L.P. (“Sharyland”). Currently, Sharyland’s revenue requirement assumes its recovery in rates of an income tax allowance at the 35%corporate tax rate, and the Company’s leases with Sharyland reflect this assumption.
At this time, it is uncertain how and when Sharyland’s rates or financial statements will reflect an income tax allowance at the lower corporate tax rate orother potential impacts of the Tax Cuts and Jobs Act. Sharyland and Sharyland Distribution & Transmission Services, L.L.C. (“SDTS”), InfraREIT’s regulatedsubsidiary, are required to file their next rate case by July 1, 2020, and the leases with respect to the majority of the Company’s assets are scheduled to expire at theend of 2020. When Sharyland’s rates are revised or its financial statements are impacted by incorporating an income tax allowance at the lower 21% corporate taxrate, the Company expects that lease payments for future assets placed in service will reflect that change, which would result in a reduction, relative to the existinglease terms, in the amount of lease revenue the Company receives per dollar of assets. Additionally, if the lower income tax allowance is reflected in Sharyland’srates or financial results prior to the expiration of the current leases, InfraREIT expects Sharyland to request a reduction in the existing lease payments to reflectthat change. Accordingly, the reduction in the corporate tax rate from 35% to 21% in the Tax Cuts and Jobs Act could, over time, have the effect of decreasing therelative economic benefits of owning utility assets in a real estate investment trust (“REIT”) structure, as compared to a traditional C-corporation structure.
The Tax Cuts and Jobs Act also includes provisions that reduce the tax rates applicable to individuals and that treat dividends paid to REIT shareholders asincome eligible for the new 20% deduction for business income earned from passthrough entities. These changes will have the effect of reducing the maximumincome tax rate applicable to REIT dividends paid to individual REIT shareholders from 39.6% to 29.6%. These provisions are set to expire after 2025.
2

The Company is continuing to evaluate these and other potential impacts of the Tax Cuts and Jobs Act. In consideration of the significant impact of thechange in the corporate tax rate, as well as the other potential impacts of the new legislation, InfraREIT is continuing to review its REIT election and the existinglessor-lessee relationship with Sharyland, including consideration of whether InfraREIT should terminate its REIT status and instead opt for a traditionalC-corporation structure (a “De-REIT transaction”). Any such De-REIT transaction alternatives may involve one or more of the following: combining Sharylandwith SDTS, terminating the leases between SDTS and Sharyland, terminating the Company’s operating partnership, and/or other negotiations with HuntConsolidated, Inc. and its affiliates (collectively, “Hunt”), including terminating or renegotiating the Company’s management agreement, terminating orrenegotiating the development agreement with Hunt, and engaging in related negotiations. InfraREIT has not set a specific timeline for completing this review.
Forward-Looking Statements
This report contains forward-looking statements within the meaning of the federal securities laws. These statements give the current expectations ofInfraREIT’s management. Words such as “could,” “will,” “may,” “assume,” “forecast,” “strategy,” “guidance,” “outlook,” “target,” “expect,” “intend,” “plan,”“estimate,” “anticipate,” “believe,” or “project” and similar expressions are used to identify forward-looking statements. Without limiting the generality of theforegoing, forward-looking statements contained in this report include the Company’s expectations regarding the impact of the Tax Cuts and Jobs Act andstatements regarding a potential De-REIT transaction. Forward-looking statements can be affected by assumptions used or known or unknown risks oruncertainties. Consequently, no forward-looking statements can be guaranteed and actual results may differ materially and adversely from those reflected in theforward-looking statements. Factors that could cause actual results to differ materially from those indicated in the forward-looking statements include, amongothers, the risks and uncertainties described in InfraREIT’s filings with the U.S. Securities and Exchange Commission.
Any forward-looking statement made by InfraREIT in this report is based only on information currently available to the Company and speaks only as of thedate on which it is made. InfraREIT undertakes no obligation to update or revise any forward-looking statements, whether as a result of new information, futureevents or otherwise, other than as required by applicable law.
Item 9.01. Financial Statements and Exhibits.
(d) Exhibits.
In accordance with General Instruction B.2 of Form 8-K, the information set forth in the attached exhibit is deemed to be furnished and shall not be deemedto be “filed” for purposes of Section 18 of the Exchange Act.
3

EXHIBIT NUMBER DESCRIPTION
99.1 — 2018 Evercore ISI Utility CEO Conference presentation.
4

SIGNATURES
Pursuant to the requirements of the Securities Exchange Act of 1934, the registrant has duly caused this report to be signed on its behalf by the undersignedhereunto duly authorized.
InfraREIT, Inc.
Date: January 10, 2018 By: /s/ Stacey H. Doré Stacey H. Doré Senior Vice President and General Counsel
5

2018 Evercore ISI Utility CEO Conference January 11, 2018 Exhibit 99.1
Safe Harbor Forward Looking Statements This presentation contains “forward-looking statements” about the business, financial performance, contracts, leases and prospects of InfraREIT, Inc. (the Company). Words such as “could,” “will,” “may,” “assume,” “forecast,” “position,” “predict,” “strategy,” “guidance,” “outlook,” “target,” “expect,” “intend,” “plan,” “estimate,” “anticipate,” “believe,” “project,” “budget,” “potential” or “continue” and similar expressions are used to identify forward-looking statements, although not all forward-looking statements contain such identifying words. These forward-looking statements are based on management’s current expectations and assumptions about future events and are based on currently available information as to the outcome and timing of future events. This presentation also contains forward-looking statements that have previously been publicly disclosed by the Company. These previously disclosed forward-looking statements should not be deemed reaffirmed or updated by their inclusion in this presentation. The Company’s actual results, performance or achievements could differ materially from those expressed or implied by any forward-looking statements made in connection with this presentation, and in no event should the inclusion of forecasted information in this presentation be regarded as a representation by any person that the results contained therein will be achieved. Statements about the Company’s expectations regarding the impact of the Tax Cuts and Jobs Act, the Company’s review of its REIT election, the Company’s anticipated financial and operating performance, including projected or forecasted financial results, distributions to stockholders, capital expenditures, debt ratios, capitalization matters and other forecasted metrics, as well as any other statements that are not historical facts in this presentation are forward-looking statements that involve certain risks and uncertainties, many of which are difficult to predict and beyond the Company’s control. Factors that could cause actual results to differ materially from the results contemplated by such forward-looking statements include,without limitation, the approach taken to implement the change in the corporate tax rate; the amount of available investment to grow the Company’s rate base; decisions by regulators or changes in governmental policies or regulations with respect to the Company’s organizational structure, lease arrangements, capitalization, acquisitions and dispositions of assets, recovery of investments, authorized rate of return and other regulatory parameters; the Company’s current reliance on its tenant for all of its revenues and, as a result, the Company’s dependence on its tenant’s solvency and financial and operating performance; the effects of existing and future tax and other laws and governmental regulations; the Company's failure to qualify or maintain its status as a real estate investment trust (REIT) or future changes in the tax laws applicable to REITs; and insufficient cash available to meet distribution requirements. When considering forward-looking statements, you should keep in mind the risk factors and other cautionary statements described under the heading “Risk Factors” included in the Company’s filings with the U.S. Securities and Exchange Commission. Should one or more of these risks or uncertainties materialize, or should underlying assumptions prove incorrect, actual results may vary materially from those indicated. Forward-looking statements speak only as of the date made and reaffirmed, and the Company disclaims any obligation to update or revise any forward-looking statements, whether as a result of new information, future events or otherwise, except as required by law. Non-GAAP Legend This presentation contains certain financial measures that are not recognized under generally accepted accounting principles (GAAP). InfraREIT’s management uses non-GAAP measures as important supplemental measures of its operating performance. For example, management uses the cash available for distribution (CAD) measurement when recommending dividends to its Board of Directors. These non-GAAP measures are also presented because management believes they help investors understand InfraREIT’s business, performance and ability toearn and distribute cash to its stockholders by providing perspectives not immediately apparent from net income. InfraREIT has a diverse set of investors, including investors that primarily focus on utilities, yieldcos, MLPs or REITs. Management believes that each of these different classes of investors focus on different types of metrics in their evaluation of InfraREIT. For instance, many utility investors focus on earnings per share (EPS) and management believes its presentation of non-GAAP earnings per share (Non-GAAP EPS) enables a better comparison to other utilities. Management believes it is appropriate to calculate and provide these measures in order to be responsive to these investors. Including the reporting on these measures in InfraREIT’s public disclosures also ensures that this information is available to all of InfraREIT’s investors. The presentation of Non-GAAP EPS; CAD; net income (loss) before interest expense, net, income tax expense, depreciation and amortization (EBITDA); Adjusted EBITDA; funds from operations (FFO); and adjusted FFO (AFFO) in this presentation are not intended to be considered in isolation or as a substitute for, or superior to, the financial information prepared and presented in accordance with GAAP. In addition, InfraREIT’s method of calculating these measures may be different from methods used by other companies, and, accordingly, may not be comparable to similar measures as calculated by other companies that do not use the same methodology as InfraREIT. Reconciliations of these measures to their most directly comparable GAAP measures are included in Schedules 1-6 to this presentation.

InfraREIT’s Investment Highlights Attractive Asset Portfolio Strong Track Record Stable Cash Flow $1.5 billion in regulated electric transmission and wholesale distribution assets (rate base) Increased rate base from $60 million in 2009 to $1.5 billion in 2017 Successfully developed 300 miles and 4 substations in the CREZ transmission system and significantly expanded the West Texas assets 100 percent of revenue driven by regulated asset base 90 percent of assets in transmission, remainder in wholesale distribution (no end-use retail customers) Constructive regulatory framework in Texas Ability to submit interim transmission rate filings; minimizes regulatory lag Constructive Regulation Strong Sponsor Growth Opportunities Hunt has long-term track record and relationships in Texas and the Southwest High alignment between Hunt and other stakeholders Pro-business, high-growth state with growing infrastructure needs in West and South Texas Well-positioned relative to future expansion of wind and solar generation in the Panhandle, West Texas and South Plains Pipeline of projects with Hunt Developer

InfraREIT’s Transmission Assets PANHANDLE PERMIAN BASIN Transmission HOUSTON SAN ANTONIO AUSTIN DALLAS

Pipeline of Hunt Projects Additional U.S. – Mexico DC Ties Generation Interconnections South Plains Reinforcement Southline Transmission Project Cross Valley Transmission Line Golden Spread Electric Cooperative (GSEC) Interconnection Lubbock Power & Light Interconnection Under Development Operational; Owned by Sharyland Utilities, L.P. As of January 11, 2018 Nogales DC Tie

Q3 Highlights and Recent Events Solid Q3 2017 performance; most metrics slightly better than expectations Increase in lease revenue of 4 percent driven by increased assets under lease, partially offset by lower lease pricing (leases partially included a lower allowed cost of debt assumption) Decrease in net income of 10 percent, primarily due to the lower lease revenue growth than prior periods and asset exchange transaction expenses. Interest and depreciation expenses tracked with the growth in assets placed in service Non-GAAP EPS of $0.36; compared with $0.37 in 3Q 2016 Cash available for distribution (CAD) of $22.6 million $56.2 million of capital expenditures Rate case dismissal and asset exchange transaction with Oncor Electric Delivery Company (Oncor) Completed November 9, 2017 Key regulatory parameters in place until the next rate case, which will be filed in 2020, based on a test year ending December 31, 2019

Tax Cuts and Jobs Act Implications Corporate income tax rate reduction from 35 percent to 21 percent Uncertain how and when Sharyland’s rates or financial statements will reflect an income tax allowance at the lower corporate tax rate Upon implementation, the Company expects that lease payments for future assets will reflect the lower corporate tax rate, which would result in a reduction, relative to the Company’s existing lease terms, in the amount of lease revenue received per dollar of assets If implemented prior to the expiration of the current leases, the Company expects that Sharyland will request a reduction in existing lease payments For illustrative purposes, the full-year impact of repricing InfraREIT’s leases with a 21 percent corporate tax allowance, while holding all other inputs constant, would reduce Non-GAAP EPS by approximately $0.30 The actual impact will depend on, among other factors, the timing and method of implementing the new corporate tax rate Impact on dividends to InfraREIT shareholders REIT dividends were formerly taxed as ordinary income, up to 39.6 percent Going forward, REIT dividends will be taxed as business income from pass-through entities, up to 29.6 percent after applicable deductions The Company continues to evaluate these and other potential impacts of the Tax Cuts and Jobs Act

Tax Cuts and Jobs Act Additional Implications InfraREIT will continue to review the Company’s REIT election and existing lessor-lessee relationship with Sharyland. Potential options under consideration as part of this review include: Maintain REIT status, or Convert to a traditional C-corporation structure (De-REIT Transaction), through the following potential actions: Terminate REIT status One or more of the following steps: Combining SDTS and Sharyland Terminating the leases between SDTS and Sharyland Other negotiations with Hunt and its affiliates, including seeking to terminate or renegotiate the following: Management agreement Development agreement Other related agreements InfraREIT has not set a specific timeline for completing this review

Forward Outlook Current guidance, excluding the potential impacts relating to the Tax Cuts and Jobs Act: 2017 EPS range of $1.15 to $1.19 2018 EPS range of $1.32 to $1.42 2017 Non-GAAP EPS range of $1.20 to $1.24 2018 Non-GAAP EPS range of $1.25 to $1.35 Transmission capital expenditures for 2017 – 2019 in the range of $180 million to $300 million Expect to maintain current quarterly cash dividend of $0.25 per share, or $1.00 per share annualized The Company expects to provide additional information on the forward outlook and guidance on the year-end earnings call

2017E – 2019E Footprint Capital Expenditures Transmission only; as of November 2, 2017 Transmission capex guidance range of $180 million – $300 million for 2017 – 2019 Long-term opportunities tied to generation interconnections and renewables expansion, regional growth and new projects required to improve reliability and relieve congestion $ millions 2017 2018 2019 Base Footprint Capex $30 - $40 $40 - $70 $10 - $35 Synchronous Condensers & Second Circuit $90 - $100 $10 - $30 $0 - $25 Total Footprint Capex $120 - $140 $50 - $100 $10 - $60

Growth and Financing Strategy Sign long-term leases that reflect regulated rate structure Construct Footprint Projects Opportunistically acquire regulated assets Maintain significant liquidity to support capex plan and financial flexibility Maintain 55 percent debt to capitalization at InfraREIT’s regulated subsidiary, SDTS Target consolidated credit metrics of 60 percent debt to capitalization and 12 percent AFFO to debt Focus on Regulated Asset Opportunities Maintain Strong Financial Profile Grow Dividends

Reg G Reconciliation

Schedule 1: Explanation and Reconciliation of Non-GAAP EPS Q3 2017 vs. Q3 2016 ($ thousands, except per share amounts) Q3 2017 Amount Per Share (3) Q3 2016 Amount Per Share (4) Net income attributable to InfraREIT, Inc. $ 15,330 $ 0.35 $ 17,041 $ 0.39 Net income attributable to noncontrolling interest 5,908 0.35 6,560 0.39 Net income 21,238 0.35 23,601 0.39 Base rent adjustment (1) (1,479) (0.02) (1,396) (0.02) Transaction costs (2) 1,972 0.03 — — Non-GAAP net income $ 21,731 $ 0.36 $ 22,205 $ 0.37 Non-GAAP EPS InfraREIT defines non-GAAP net income as net income (loss) adjusted in a manner the Company believes is appropriate to show its core operational performance, including an adjustment for the difference between the amount of base rent payments that the Company receives with respect to the applicable period and the amount of straight-line base rent recognized under GAAP and an adjustment for the transaction costs related to the pending asset exchange transaction with Oncor. The Company defines Non-GAAP EPS as non-GAAP net income (loss) divided by the weighted average shares outstanding calculated in the manner described in the footnotes below. The following table sets forth a reconciliation of net income attributable to InfraREIT, Inc. per diluted share to Non-GAAP EPS for the three months ended September 30, 2017 and 2016:

Schedule 1: Explanation and Reconciliation of Non-GAAP EPS YTD 2017 vs. YTD 2016 Non-GAAP EPS The following table sets forth a reconciliation of net income attributable to InfraREIT, Inc. per diluted share to Non-GAAP EPS for the nine months ended September 30, 2017 and 2016: ($ thousands, except per share amounts) YTD 2017 Amount Per Share (3) YTD 2016 Amount Per Share (5) Net income attributable to InfraREIT, Inc. $ 30,587 $ 0.70 $ 29,964 $ 0.69 Net income attributable to noncontrolling interest 11,797 0.70 11,598 0.68 Net income 42,384 0.70 41,562 0.69 Base rent adjustment (1) (180) — 4,602 0.07 Transaction costs (2) 3,909 0.06 — — Non-GAAP net income $ 46,113 $ 0.76 $ 46,164 $ 0.76

Schedule 1: Explanation and Reconciliation of Non-GAAP EPS This adjustment relates to the difference between the timing of cash base rent payments made under the Company’s leases and when the Company recognizes base rent revenue under GAAP. The Company recognizes base rent on a straight-line basis over the applicable term of the lease commencing when the related assets are placed in service, which is frequently different than the period in which the cash rent becomes due. This adjustment reflects the transaction costs related to the pending asset exchange transaction with Oncor. These costs are exclusive of the Company’s routine business operations or typical rate case costs and have been excluded to present additional insights on InfraREIT’s core operations. The weighted average common shares outstanding of 43.8 million was used to calculate net income attributable to InfraREIT, Inc. per diluted share. The weighted average redeemable partnership units outstanding of 16.9 million was used to calculate the net income attributable to noncontrolling interest per share. The combination of the weighted average common shares and redeemable partnership units outstanding of 60.7 million was used for the remainder of the per share calculations. The weighted average common shares outstanding of 43.7 million was used to calculate net income attributable to InfraREIT, Inc. per diluted share. The weighted average redeemable partnership units outstanding of 16.9 million was used to calculate the net income attributable to noncontrolling interest per share. The combination of the weighted average common shares and redeemable partnership units outstanding of 60.6 million was used for the remainder of the per share calculations. The weighted average common shares outstanding of 43.6 million was used to calculate net income attributable to InfraREIT, Inc. per diluted share. The weighted average redeemable partnership units outstanding of 17.0 million was used to calculate the net income attributable to noncontrolling interest per share. The combination of the weighted average common shares and redeemable partnership units outstanding of60.6 million was used for the remainder of the per share calculations.

Schedule 2: Explanation and Reconciliation of CAD Q3 2017 vs. Q3 2016 CAD The Company defines CAD in a manner that it believes is appropriate to show its core operational performance, which includes a deduction of the portion of capital expenditures needed to maintain its net assets. This deduction equals depreciation expense within the applicable period. The portion of the capital expenditures in excess of depreciation, which the Company refers to as growth capital expenditures, will increase the Company’s net assets. The CAD calculation also includes various other adjustments from net income, as outlined below and described in more detail on Schedules 1, 3 and 4. The following table sets forth a reconciliation of net income to CAD for the three months ended September 30, 2017 and 2016: See footnote (1) on Schedule 1 on Explanation and Reconciliation on Non-GAAP EPS See footnote (2) on Schedule 1 on Explanation and Reconciliation on Non-GAAP EPS Includes allowance for funds used during construction (AFUDC) on other funds of $0.3 million and $1.0 million for the three months ended September 30, 2017 and 2016, respectively ($ thousands) Q3 2017 Q3 2016 Net income $ 21,238 $ 23,601 Depreciation 13,328 11,828 Base rent adjustment (1) (1,479) (1,396) Amortization of deferred financing costs 1,071 1,003 Non-cash equity compensation 143 230 Transaction costs (2) 1,972 — Other income, net (3) (331) (1,024) Capital expenditures to maintain net assets (13,328) (11,828) CAD $ 22,614 $ 22,414

Schedule 2: Explanation and Reconciliation of CAD YTD 2017 vs. YTD 2016 CAD The following table sets forth a reconciliation of net income to CAD for the nine months ended September 30, 2017 and 2016: See footnote (1) on Schedule 1 on Explanation and Reconciliation on Non-GAAP EPS See footnote (2) on Schedule 1 on Explanation and Reconciliation on Non-GAAP EPS Includes AFUDC on other funds of $0.3 million and $2.9 million for the nine months ended September 30, 2017 and 2016, respectively ($ thousands) YTD 2017 YTD 2016 Net income $ 42,384 $ 41,562 Depreciation 38,997 34,312 Base rent adjustment (1) (180) 4,602 Amortization of deferred financing costs 3,101 3,010 Non-cash equity compensation 428 750 Transaction costs (2) 3,909 — Other income, net (3) (351) (2,920) Capital expenditures to maintain net assets (38,997) (34,312) CAD $ 49,291 $ 47,004

Schedule 3: Explanation and Reconciliation of EBITDA and Adjusted EBITDA Q3 2017 vs. Q3 2016 EBITDA and Adjusted EBITDA InfraREIT defines EBITDA as net income (loss) before interest expense, net; income tax expense; depreciation and amortization. Adjusted EBITDA is defined as EBITDA adjusted in a manner the Company believes is appropriate to show its core operational performance, including: (a) an adjustment for the difference between the amount of base rent payments that the Company receives with respect to the applicable period and the amount of straight-line base rent recognized under GAAP; (b) an adjustment for the transaction costs related to the pending asset exchange transaction with Oncor; and (c) adjusting for other income (expense), net. The following table sets forth a reconciliation of net income to EBITDA and Adjusted EBITDA for the three months ended September 30, 2017 and 2016: See footnote (1) on Schedule 1 on Explanation and Reconciliation of Non-GAAP EPS See footnote (2) on Schedule 1 on Explanation and Reconciliation of Non-GAAP EPS See footnote (3) on Schedule 2 on Explanation and Reconciliation of CAD ($ thousands) Q3 2017 Q3 2016 Net income $ 21,238 $ 23,601 Interest expense, net 10,357 9,379 Income tax expense 308 299 Depreciation 13,328 11,828 EBITDA 45,231 45,107 Base rent adjustment (1) (1,479) (1,396) Transaction costs (2) 1,972 — Other income, net (3) (331) (1,024) Adjusted EBITDA $ 45,393 $ 42,687

Schedule 3: Explanation and Reconciliation of EBITDA and Adjusted EBITDA YTD 2017 vs. YTD 2016 EBITDA and Adjusted EBITDA The following table sets forth a reconciliation of net income to EBITDA and Adjusted EBITDA for the nine months ended September 30, 2017 and 2016: See footnote (1) on Schedule 1 on Explanation and Reconciliation of Non-GAAP EPS See footnote (2) on Schedule 1 on Explanation and Reconciliation of Non-GAAP EPS See footnote (3) on Schedule 2 on Explanation and Reconciliation of CAD ($ thousands) YTD 2017 YTD 2016 Net income $ 42,384 $ 41,562 Interest expense, net 30,196 27,276 Income tax expense 873 778 Depreciation 38,997 34,312 EBITDA 112,450 103,928 Base rent adjustment (1) (180) 4,602 Transaction costs (2) 3,909 — Other income, net (3) (351) (2,920) Adjusted EBITDA $ 115,828 $ 105,610
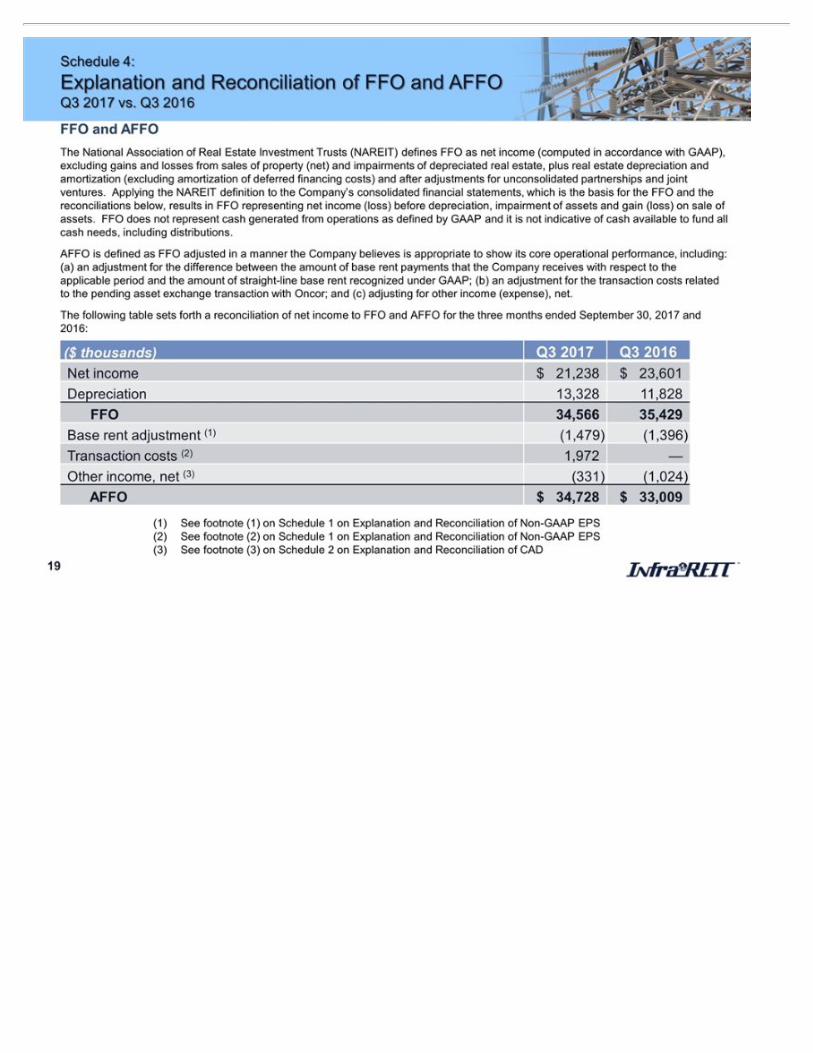
Schedule 4: Explanation and Reconciliation of FFO and AFFO Q3 2017 vs. Q3 2016 FFO and AFFO The National Association of Real Estate Investment Trusts (NAREIT) defines FFO as net income (computed in accordance with GAAP), excluding gains and losses from sales of property (net) and impairments of depreciated real estate, plus real estate depreciation and amortization (excluding amortization of deferred financing costs) and after adjustments for unconsolidated partnerships and joint ventures. Applying the NAREIT definition to the Company’s consolidated financial statements, which is the basis for the FFO and the reconciliations below, results in FFO representing net income (loss) before depreciation, impairment of assets and gain (loss) on sale of assets. FFO does not represent cash generated from operations as defined by GAAP and it is not indicative of cash available to fund all cash needs, including distributions. AFFO is defined as FFO adjusted in a manner the Company believes is appropriate to show its core operational performance, including: (a) an adjustment for the difference between the amount of base rent payments that the Company receives with respect to the applicable period and the amount of straight-line base rent recognized under GAAP; (b) an adjustment for the transaction costs related to the pending asset exchange transaction with Oncor; and (c) adjusting for other income (expense), net. The following table sets forth a reconciliation of net income to FFO and AFFO for the three months ended September 30, 2017 and 2016: ($ thousands) Q3 2017 Q3 2016 Net income $ 21,238 $ 23,601 Depreciation 13,328 11,828 FFO 34,566 35,429 Base rent adjustment (1) (1,479) (1,396) Transaction costs (2) 1,972 — Other income, net (3) (331) (1,024) AFFO $ 34,728 $ 33,009 See footnote (1) on Schedule 1 on Explanation and Reconciliation of Non-GAAP EPS See footnote (2) on Schedule 1 on Explanation and Reconciliation of Non-GAAP EPS See footnote (3) on Schedule 2 on Explanation and Reconciliation of CAD

Schedule 4: Explanation and Reconciliation of FFO & AFFO YTD 2017 vs. YTD 2016 FFO and AFFO The following table sets forth a reconciliation of net income to FFO and AFFO for the nine months ended September 30, 2017 and 2016: See footnote (1) on Schedule 1 on Explanation and Reconciliation of Non-GAAP EPS See footnote (2) on Schedule 1 on Explanation and Reconciliation of Non-GAAP EPS See footnote (3) on Schedule 2 on Explanation and Reconciliation of CAD ($ thousands) YTD 2017 YTD 2016 Net income $ 42,384 $ 41,562 Depreciation 38,997 34,312 FFO 81,381 75,874 Base rent adjustment (1) (180) 4,602 Transaction costs (2) 3,909 — Other income, net (3) (351) (2,920) AFFO $ 84,759 $ 77,556

Schedule 5: Explanation and Reconciliation of Non-GAAP EPS 2016 Quarterly and Full Year 2016 Non-GAAP EPS The following tables set forth a reconciliation of net income attributable to InfraREIT, Inc. per diluted share to Non-GAAP EPS for each quarter of 2016: ($ thousands, except per share amounts) Q1 2016 Amount Per Share (2) Q2 2016 Amount Per Share (2) Net income attributable to InfraREIT, Inc. $ 6,315 $ 0.14 $ 6,608 $ 0.15 Net income attributable to noncontrolling interest 2,462 0.14 2,576 0.15 Net income 8,777 0.14 9,184 0.15 Base rent adjustment (1) 3,035 0.05 2,963 0.05 Non-GAAP net income $ 11,812 $ 0.19 $ 12,147 $ 0.20 ($ thousands, except per share amounts) Q3 2016 Amount Per Share (3) Q4 2016 Amount Per Share (3) Net income attributable to InfraREIT, Inc. $ 17,041 $ 0.39 $ 19,990 $ 0.46 Net income attributable to noncontrolling interest 6,560 0.39 7,749 0.46 Net income 23,601 0.39 27,739 0.46 Base rent adjustment (1) (1,396) (0.02) (567) (0.01) Non-GAAP net income $ 22,205 $ 0.37 $ 27,172 $ 0.45

Schedule 5: Explanation and Reconciliation of Non-GAAP EPS 2016 Quarterly and Full Year 2016 Non-GAAP EPS The following table sets forth a reconciliation of net income attributable to InfraREIT, Inc. per diluted share to Non-GAAP EPS for the full year of 2016: ($ thousands, except per share amounts) Full Year 2016 Amount Per Share (4) Net income attributable to InfraREIT, Inc. $ 49,954 $ 1.14 Net income attributable to noncontrolling interest 19,347 1.14 Net income 69,301 1.14 Base rent adjustment (1) 4,035 0.07 Non-GAAP net income $ 73,336 $ 1.21 See footnote (1) on Schedule 1 on Explanation and Reconciliation of Non-GAAP EPS The weighted average common shares outstanding of 43.6 million was used to calculate net income attributable to InfraREIT, Inc. per diluted share. The weighted average redeemable partnership units outstanding of 17.0 million was used to calculate the net income attributable to noncontrolling interest per share. The combination of the weighted average common shares and redeemable partnership units outstanding of 60.6 million was used for the remainder of the per share calculations. The weighted average common shares outstanding of 43.7 million was used to calculate net income attributable to InfraREIT, Inc. per diluted share. The weighted average redeemable partnership units outstanding of 16.9 million was used to calculate the net income attributable to noncontrolling interest per share. The combination of the weighted average common shares and redeemable partnership units outstanding of 60.6 million was used for the remainder of the per share calculations. The weighted average common shares outstanding of 43.6 million was used to calculate net income attributable to InfraREIT, Inc. per diluted share. The weighted average redeemable partnership units outstanding of 17.0 million was used to calculate the net income attributable to noncontrolling interest per share. The combination of the weighted average common shares and redeemable partnership units outstanding of 60.6 million was used for the remainder of the per share calculations.
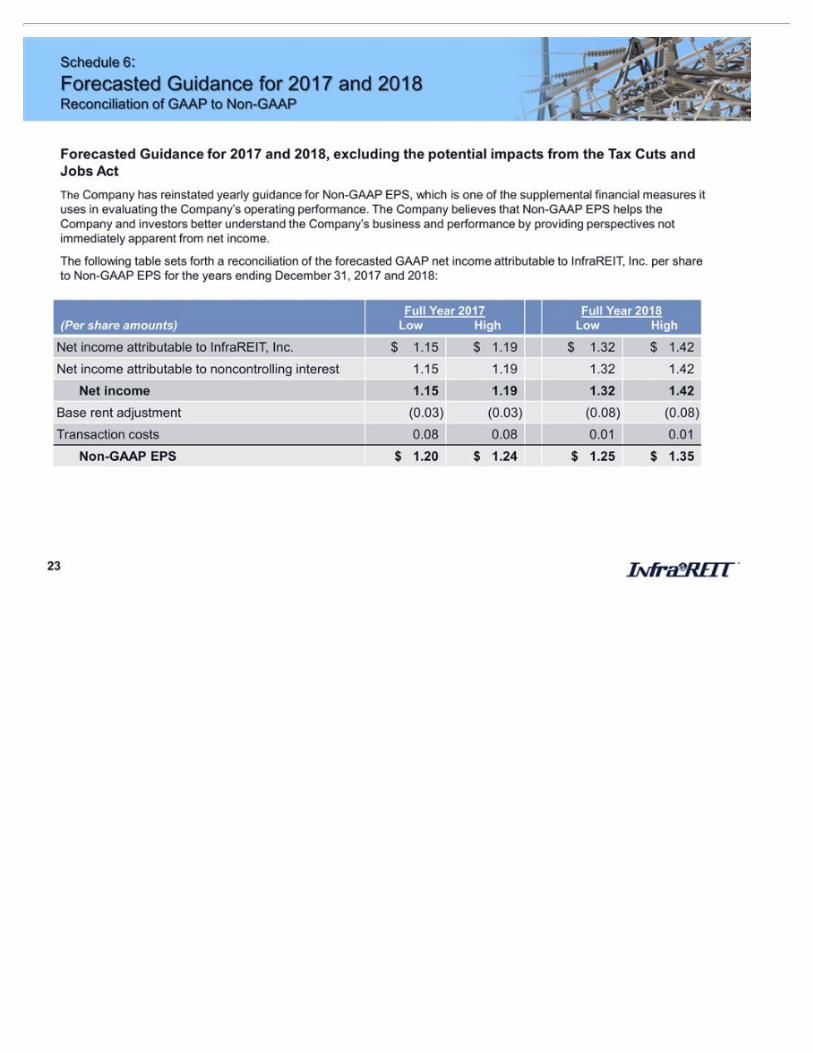
Schedule 6: Forecasted Guidance for 2017 and 2018 Reconciliation of GAAP to Non-GAAP Forecasted Guidance for 2017 and 2018, excluding the potential impacts from the Tax Cuts and Jobs Act The Company has reinstated yearly guidance for Non-GAAP EPS, which is one of the supplemental financial measures it uses in evaluating the Company’s operating performance. The Company believes that Non-GAAP EPS helps the Company and investors better understand the Company’s business and performance by providing perspectives not immediately apparent from net income. The following table sets forth a reconciliation of the forecasted GAAP net income attributable to InfraREIT, Inc. per share to Non-GAAP EPS for the years ending December 31, 2017 and 2018: (Per share amounts) Full Year 2017 Low High Full Year 2018 Low High Net income attributable to InfraREIT, Inc. $ 1.15 $ 1.19 $ 1.32 $ 1.42 Net income attributable to noncontrolling interest 1.15 1.19 1.32 1.42 Net income 1.15 1.19 1.32 1.42 Base rent adjustment (0.03) (0.03) (0.08) (0.08) Transaction costs 0.08 0.08 0.01 0.01 Non-GAAP EPS $ 1.20 $ 1.24 $ 1.25 $ 1.35

Appendix

Q3 2017 Performance Summary $ millions, except per share amounts Lease revenue slightly better than expectations; Lease revenue growth was less than the increase in rate base due to lower lease pricing; Net income was lower due to lower lease pricing, asset exchange transaction costs and reduced AFUDC-equity Net Income Attributable to InfraREIT, Inc. Common Stockholders Per Share (EPS) Lease Revenue +4% Net Income -10% -10%
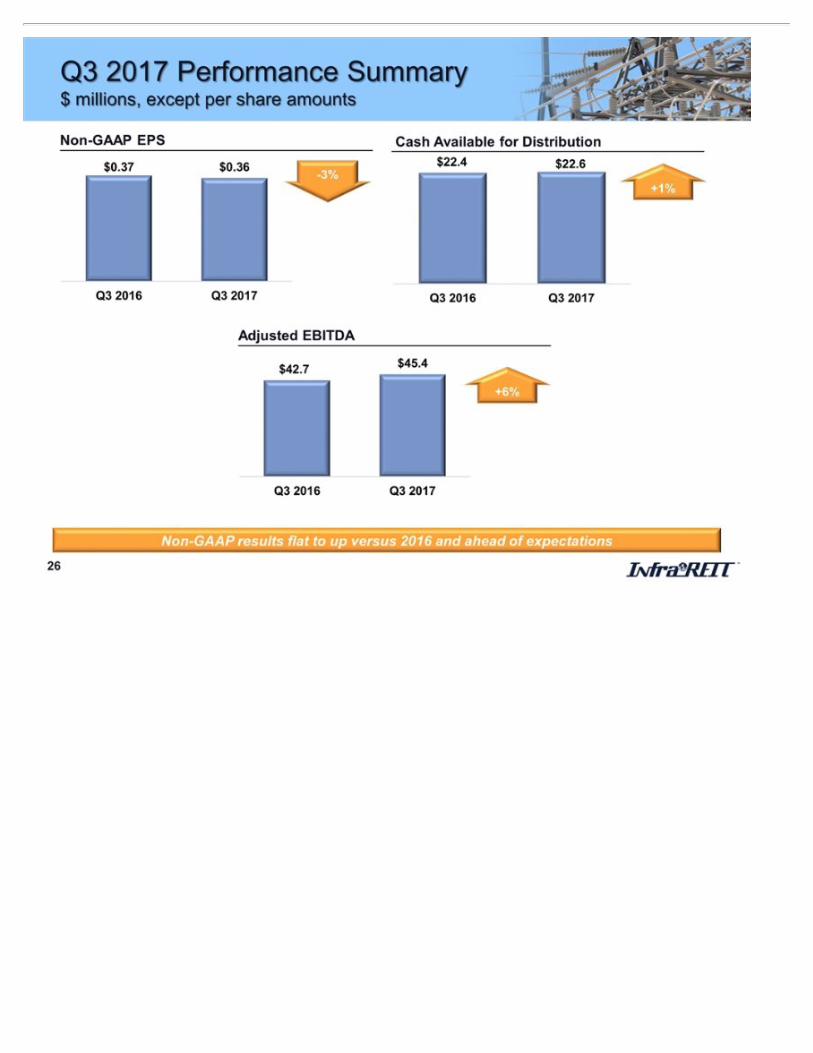
Q3 2017 Performance Summary $ millions, except per share amounts Non-GAAP results flat to up versus 2016 and ahead of expectations Cash Available for Distribution Non-GAAP EPS Adjusted EBITDA +6% +1% -3%

September YTD 2017 Performance Summary $ millions, except per share amounts Growth in lease revenue slightly ahead of expectations; Net income growth dampened by lower lease pricing, expenses related to the asset exchange transaction and reduced AFUDC Net Income Attributable to InfraREIT, Inc. Common Stockholders Per Share (EPS) Lease Revenue +13% Net Income +2% +1%

September YTD 2017 Performance Summary $ millions, except per share amounts Non-GAAP results flat to up versus 2016 and ahead of expectations Cash Available for Distribution Non-GAAP EPS Adjusted EBITDA +10% +5%

Drivers of Non-GAAP EPS Metric $ millions Q3 2017 vs. Q3 2016 - - - - -

Drivers of Non-GAAP EPS Metric $ millions - - - - - 2017 YTD vs. 2016 YTD

Non-GAAP EPS Calculation Change As of June 30, 2017 As reported during the Q2 2017 earnings call, InfraREIT’s calculation of Non-GAAP EPS no longer includes an adjustment for percentage rent Does not impact total year Non-GAAP EPS Changes the quarterly profile of Non-GAAP EPS Percentage rent revenue is only recognized once Sharyland’s revenue has exceeded an annual specified breakpoint in the leases – generally occurs in the third quarter of each year Expect Q3 and Q4 EPS and Non-GAAP EPS to be higher than Q1 and Q2 EPS and Non-GAAP EPS each year Little to no percentage rent recognized in Q1 and Q2 of each year and largest amounts recognized in Q3 and Q4

Updated Non-GAAP EPS Metric 2016 Quarterly Results EPS and Non-GAAP EPS have similar quarterly earnings profiles when Non-GAAP EPS does not include a percentage rent adjustment As currently calculated, >65% of Non-GAAP EPS occurred in the second half of 2016

Updated Non-GAAP EPS Metric 2017 vs. 2016 Non-GAAP EPS Quarterly Comparison 2017 Non-GAAP EPS performance in line with expectations

Asset Exchange Transaction and Rate Case Dismissal SDTS exchanged $401 million of assets for ~$383 million of Transmission assets and ~$18 million of cash from Oncor SDTS and Sharyland’s rate case was dismissed as of November 9, 2017 PUCT granted SDTS a certificate of convenience and necessity Key regulatory parameters in place until the next rate case, which SDTS and Sharyland have committed to file in 2020, based on a test year ending December 31, 2019 Strategic focus on the long-term growth of InfraREIT’s transmission business

Interconnections Agreements for Panhandle Generation Source: ERCOT – Fall 2017 Final Seasonal Assessment of Resource Adequacy and Generation Interconnection Status Report (September 2017)

Hunt Projects (1) As of November 2, 2017 Project State Net Plant Golden Spread TX ~ $90 mm Cross Valley TX ~ $168 mm Project State Status Generation Interconnections TX Development South Plains / LP&L Integration TX Development Nogales – DC Tie AZ Development Southline AZ – NM Development Construction or Development Projects Assets in Operation (1) InfraREIT holds a right of first offer applicable to many, but not all, of Hunt’s development projects. However, Hunt has informed InfraREIT that it intends for InfraREIT to be the primary owner of its development projects as they are completed and placed in service.

Debt Obligations and Liquidity $ millions Long-Term Debt (rate / maturity) Outstanding As of September 30, 2017 TDC – Senior Secured Notes (8.50% / December 30, 2020) $ 16.6 SDTS – Senior Secured Notes (5.04% / June 20, 2018) 60.0 SDTS – Senior Secured Term Loan (2.33% / June 5, 2020) 200.0 SDTS – Senior Secured Notes, Series A (3.86% / December 3, 2025) 400.0 SDTS – Senior Secured Notes, Series B (3.86% / January 14, 2026) 100.0 SDTS – Senior Secured Notes (7.25% / December 30, 2029) 41.1 SDTS – Senior Secured Notes (6.47% / September 30, 2030) 94.0 Total (1) $ 911.6 Liquidity Facilities Amount Outstanding As of September 30, 2017 Available InfraREIT Partners Revolver $ 75.0 $ — $ 75.0 SDTS Revolver 250.0 35.0 215.0 Total $ 325.0 $ 35.0 $ 290.0 Cash (as of September 30, 2017) 4.2 Total Available Liquidity $ 294.2 (1) The sum of the Long-Term Debt Total may not equal due to rounding.
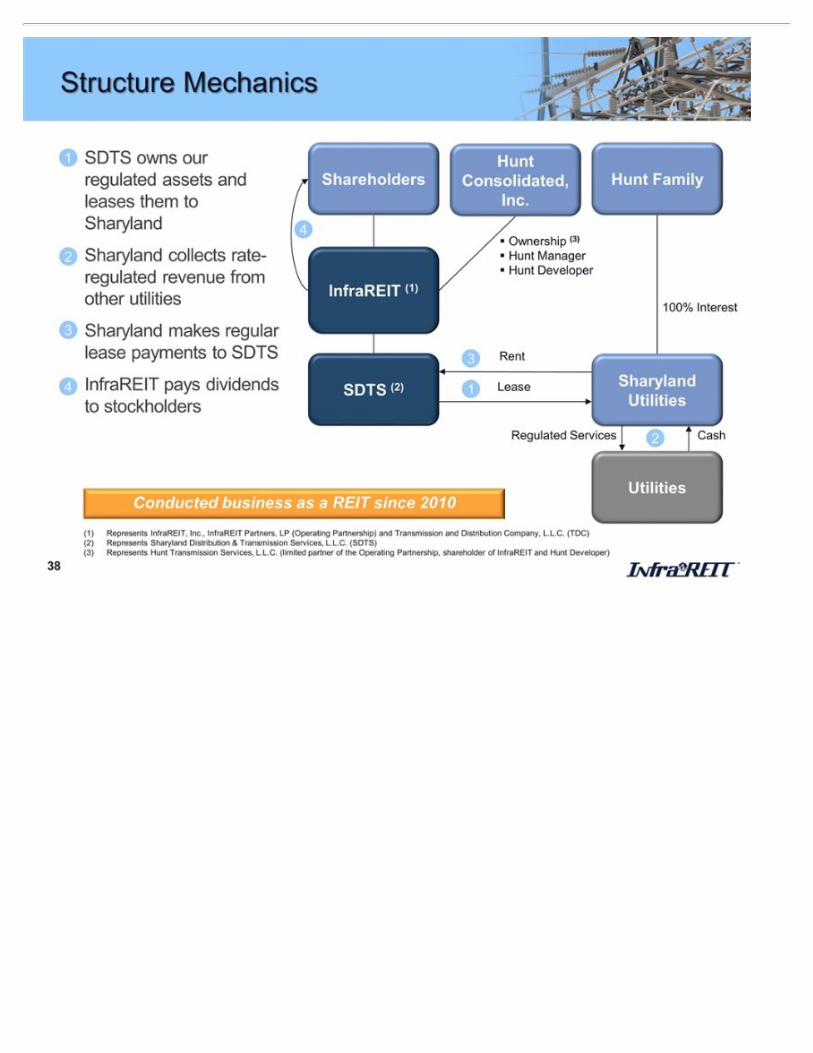
Structure Mechanics SDTS (2) SDTS owns our regulated assets and leases them to Sharyland Sharyland collects rate-regulated revenue from other utilities Sharyland makes regular lease payments to SDTS InfraREIT pays dividends to stockholders 1 2 3 4 Shareholders InfraREIT (1) Hunt Family Sharyland Utilities Utilities Regulated Services Cash Lease Rent 1 2 3 4 Ownership (3) Hunt Manager Hunt Developer 100% Interest Represents InfraREIT, Inc., InfraREIT Partners, LP (Operating Partnership) and Transmission and Distribution Company, L.L.C. (TDC) Represents Sharyland Distribution & Transmission Services, L.L.C. (SDTS) (3)Represents Hunt Transmission Services, L.L.C. (limited partner of the Operating Partnership, shareholder of InfraREIT and Hunt Developer) Conducted business as a REIT since 2010 Hunt Consolidated, Inc.

Governance and Management Board Structure Management Related Party Transactions Management Agreement 9 total members, 6 independent CEO, CFO and General Counsel are officers of InfraREIT and Hunt Manager; InfraREIT’s CEO is also CEO of Sharyland Require majority approval by the independent board members (i.e. Hunt project acquisitions) Responsible for the day-to-day business and legal activities of InfraREIT Annual base fee equal to $14.2 million for April 1, 2017 through March 31, 2018 representing 1.50% of total book equity as of year-end 2016 Capped at $30 million per year Incentive fee equal to 20% of quarterly dividends per share in excess of the threshold distribution amount payable quarterly 2017 dividend per share:$0.25 Threshold dividend:$0.27