united states -...
TRANSCRIPT
UNITED STATESSECURITIES AND EXCHANGE COMMISSION
WASHINGTON, D.C. 20549
Form 6-K
REPORT OF FOREIGN PRIVATE ISSUERPURSUANT TO RULE 13a-16 OR 15d-16 UNDER THE
SECURITIES EXCHANGE ACT OF 1934
For the month of October 2016
Commission File Number: 1-9059
Barrick Gold Corporation(Registrant’s name)
Brookfield Place, TD Canada Trust Tower, Suite 3700161 Bay Street, P.O. Box 212
Toronto, Ontario M5J 2S1 Canada(Address of principal executive offices)
Indicate by check mark whether the registrant files or will file annual reports under cover of Form 20-F or Form 40-F.
Form 20-F ☐ Form 40-F ☒
Indicate by check mark if the registrant is submitting the Form 6-K in paper as permitted by Regulation S-T Rule 101(b)(1): ☐
Indicate by check mark if the registrant is submitting the Form 6-K in paper as permitted by Regulation S-T Rule 101(b)(7): ☐

INCORPORATION BY REFERENCE
This report on Form 6-K is hereby incorporated by reference into the Registration Statement on Form F-3 (File No. 333-206417) filed with the SEC on August 14,2015.

SIGNATURES
Pursuant to the requirements of the Securities Exchange Act of 1934, the registrant has duly caused this report to be signed on its behalf by the undersigned,thereunto duly authorized.
BARRICK GOLD CORPORATION
Date: October 27, 2016 By: /s/ Richie Haddock Name: Richie Haddock Title: Senior Vice President and General Counsel

EXHIBIT Exhibit Description of Exhibit
99.1
Barrick Gold Corporation Third Quarter Report for 2016, including the Comparative Unaudited Financial Statements prepared in accordance withInternational Financial Reporting Standards (“IFRS”) and the notes thereto for the three months ended September 30, 2016 and Management’sDiscussion and Analysis (“MD&A”) for the same period.
Exhibit 99.1
THIRD QUARTER REPORT 2016All amounts expressed in US dollars
Barrick Reports Third Quarter 2016 Results • Barrick reported net earnings attributable to equity holders of Barrick (“net earnings”) of $175 million ($0.15 per share),
and adjusted net earnings 1 of $278 million ($0.24 per share), for the third quarter.
• The Company reported revenues of $2.30 billion in the third quarter, and net cash provided by operatingactivities (“operating cash flow”) was $951 million. Barrick generated $674 million in free cash flow 2 in the third quarter.
• Gold production in the third quarter was 1.38 million ounces, at a cost of sales applicable to gold of $766 per ounce, andall-in sustaining costs 3 of $704 per ounce.
• We have increased our gold production guidance for 2016 to 5.25-5.55 million ounces, up from our original range of5.00-5.50 million ounces.
• Cost of sales applicable to gold is expected to be $800-$850 per ounce for the full year. We have reduced our 2016 all-
in sustaining cost 3 guidance to $740-$775 per ounce, marking three consecutive quarters of improved full-year costguidance.
• Total debt has been reduced by $1.4 billion year-to-date, and we remain on track to achieve our $2 billion debtreduction target for the year.
• We are partnering with Cisco for the digital reinvention of our business, beginning with the development of a flagshipdigital operation at Cortez.
• During the quarter, we appointed Mark Hill as Barrick’s first Chief Investment Officer, bringing added consistency andrigor to all capital allocation decisions at the Company.
• We also appointed George Bee to evaluate a Lama starter project, with the potential to become the first stage of aphased development plan for Pascua-Lama.
TORONTO, October 26, 2016 — Barrick Gold Corporation (NYSE:ABX)(TSX:ABX) (“Barrick” or the “Company”) today reportednet earnings of $175 million ($0.15 per share) for the third quarter, and adjusted net earnings1 of $278 million ($0.24 per share).
Robust cash flow generation and low all-in sustaining costs 3 in the third quarter reflect our focus on productivity, efficiency,cost management, and capital discipline. Through our collaboration with Cisco,we will leverage digital technologies and innovation to unlock even more value, while improving decision-making andperformance across the entire organization.
We remain on track to reduce our debt by $2 billion this year. With a stronger balance sheet, we will be better able to withstandgold price volatility, with greater flexibility to invest in our business to grow free cash flow per share over the long term. In supportof this objective, we are growing margins at our existing operations through innovation and productivity improvements, and weare

advancing a deep pipeline of internal growth projects, many of which are located at or near existing operations andinfrastructure. At the same time, we are continuously evaluating external opportunities. The appointment of Mark Hill as theCompany’s first-ever Chief Investment Officer will bring added consistency and rigor to all capital allocation decisions. Ultimately,our objective is to grow free cash flow per share by allocating capital to opportunities that align with our strategic focus, and meetour 15 percent hurdle rate at a gold price of $1,200 per ounce. By doing so, we intend to deliver superior long-term value to ourowners through metal price cycles.
FINANCIAL HIGHLIGHTS
Third quarter net earnings were $175 million ($0.15 per share), compared to a net loss of $264 million ($0.23 per share) in theprior-year period. Adjusted net earnings 1 for the third quarter were $278 million ($0.24 per share), compared to $131 million($0.11 per share) in the prior-year period. Higher earnings compared to the prior-year period reflect higher gold prices, and adecrease in operating costs, driven by lower fuel and energy prices, favorable foreign exchange movements, as well as thedivestment of higher-cost mines. In addition, earnings benefited from lower exploration, evaluation, and project expenses,primarily driven by lower spending at Goldrush and Pascua-Lama, partially offset by the loss of earnings from divested sites, andhigher income tax expense.
Significant adjusting items (pre-tax and non-controlling interest effects) in the third quarter of 2016 include:
• $49 million in impairment charges, and $37 million in disposition on sale losses, primarily related to the write-down ofour equity investment in Zaldívar based on final purchase price adjustments;
• $34 million in insurance proceeds relating to the 2015 oxygen plant motor failure at Pueblo Viejo;
• $30 million in losses on debt extinguishment; and
• $19 million in unrealized foreign currency translation losses, primarily related to the Argentine peso.
Third quarter revenues were $2.30 billion, compared to $2.32 billion in the prior-year period. Operating cash flow in the thirdquarter was $951 million, compared to $1.26 billion in the third quarter of 2015. Higher operating cash flow in the prior-yearperiod reflects the accounting treatment of $610 million in proceeds from our gold and silver streaming arrangement with RoyalGold. Excluding the proceeds from that transaction, operating cash flow for the third quarter of 2016 was $306 million higher thanthe prior-year period, despite lower production due to non-core asset sales.
Free cash flow 2 for the third quarter was $674 million, marking six consecutive quarters of positive free cash flow. In the firstnine months of 2016, we have generated approximately $1.13 billion in free cash flow 2 , despite lower production due to non-core asset sales. This demonstrates the impact of our driving focus on capital discipline, improved operational efficiency andproductivity, and stronger cost management, underpinned by our Best-in-Class approach.
In connection with a continuous disclosure review by the Ontario Securities Commission, the Company has included additionaldisclosure with respect to its first and second quarter 2016 results in its third quarter Management Discussion & Analysis(“MD&A”) to provide greater prominence to BARRICK THIRD QUARTER 2016 2 PRESS RELEASE
the Company’s GAAP measures for those periods, including segment by segment GAAP reconciliations, and GAAP costguidance on a segment by segment basis for those periods. The additional disclosure can be found on pages 63 and 73 of ourMD&A.
RESTORING A STRONG BALANCE SHEET
Strengthening our balance sheet is a top priority, and we remain on track to achieve our $2 billion debt reduction target for 2016.During the third quarter, we reduced our total debt by $461 million, and have completed more than $1.4 billion in debtrepayments year to date, representing over 70 percent of our debt reduction target for the year. We expect to achieve our 2016debt reduction target using existing cash balances and fourth quarter operating cash flow.
The Company’s liquidity position is strong and continues to improve, underpinned by robust free cash flow generation across thebusiness, and modest near-term debt repayment obligations. In the first nine months of 2016, the Company generated $1.93billion in operating cash flow, and $1.13 billion in free cash flow. 2
At the end of the third quarter, Barrick had a consolidated cash balance of approximately $2.6 billion. 4 The Company now hasless than $200 million 5 in debt due before 2019, and about $5 billion of our outstanding debt of $8.5 billion does not mature untilafter 2032. Over the medium term, we aim to reduce our total debt to below $5 billion.
OPERATING HIGHLIGHTS AND OUTLOOK
Our over-arching objective as a business is to grow our free cash flow per share. In support of this objective, our Best-in-Classapproach is focused on driving industry-leading margins across three pillars. The first is business improvement, a continuouseffort to make existing processes and systems as efficient as possible. The second is step changes, making fundamentalchanges to existing processes and systems, in ways that push performance beyond current limits. The third is innovation, whichinvolves redesigning and reimagining systems and processes to achieve levels of performance not possible using existingmethods and technology. We are now advancing a pipeline of initiatives across each of these pillars, reflected in falling costs,greater productivity, and improved capital discipline with each passing quarter. Our aspiration is to achieve and maintain all-insustaining costs of $700 per ounce or lower by 2019.
Barrick produced 1.38 million ounces of gold in the third quarter at a cost of sales of $766 per ounce, compared to 1.66 millionounces at a cost of sales of $829 per ounce in the prior-year period. All-in sustaining costs 3 in the third quarter were $704 perounce, compared to $771 per ounce in the third quarter of 2015.
Compared to the first nine months of 2015, cost of sales applicable to gold declined by seven percent. Over the same period, all-in sustaining costs 3 have fallen by 16 percent.
Please see page 36 of Barrick’s third quarter MD&A for individual operating segment performance details.
We now expect full-year gold production of 5.25-5.55 million ounces, up from our original estimate of 5.00-5.50 million ounces.Cost of sales applicable to gold is anticipated to be in the range of $800- BARRICK THIRD QUARTER 2016 3 PRESS RELEASE

$850 per ounce. We have reduced our all-in sustaining cost 3 guidance for 2016 to $740-$775 per ounce, down from $750-$790per ounce at the end of the second quarter, and below our original 2016 guidance of $775-$825 per ounce. Please see Appendix1 of this press release for individual mine site guidance updates.
Capital expenditures for 2016 are now expected to be $1.20-$1.30 billion, down from $1.25-$1.40 billion at the end of the secondquarter, and below our original 2016 guidance range of $1.35-$1.65 billion.
Gold Third Quarter
2016 Current
2016 Guidance Original
2016 Guidance Production 6 (000s of ounces)
1,381
5,250-5,550
5,000-5,500
Cost of sales applicable to gold ($ per ounce)
766
800-850
N/A
All-in sustaining costs 3 ($ per ounce)
704
740-775
775-825
Cash costs 3 ($ per ounce)
518
540-565
550-590
Copper Production 6 (millions of pounds)
100
380-430
370-410
Cost of sales applicable to copper ($ per pound)
1.47
1.35-1.55
N/A
All-in sustaining costs 7 ($ per pound)
2.02
2.00-2.20
2.05-2.35
C1 cash costs 7 ($ per pound)
1.50
1.40-1.60
1.45-1.75
Total Capital Expenditures 8 ($ millions)
271
1,200-1,300
1,350-1,650
Veladero Update
Operations at the Veladero mine in Argentina were suspended from September 15 until October 4 after falling ice damaged apipe carrying process solution in the leach pad area, causing some material to leave the leach pad. This material, primarilycrushed ore saturated with process solution, was contained in the area of the mine where the incident occurred, and returned tothe leach pad. Extensive water monitoring in the area confirmed the incident did not result in any environmental impacts. TheCompany immediately completed a series of remedial works required by provincial authorities, including increasing the height ofthe perimeter berms that surround the leach pad, to prevent such an incident from occurring again.
In addition to these works, and in keeping with our vision for a digital Barrick, we are making Veladero a trial site for digitaltechnology that will enhance our environmental and water monitoring activities, while also providing greater transparency toauthorities and communities.
Reflecting the impact of this temporary suspension, along with adverse weather conditions, we now expect 2016 production fromVeladero to be in the range of 530,000-580,000 ounces of gold, down from our previous guidance of 580,000-640,000 ounces.Cost of sales applicable to gold at Veladero is now expected to be in the range of $820-$900 per ounce for 2016. All-insustaining cost 3 guidance has been increased slightly to $800-$870 per ounce, from the previous range of $790-$860 perounce. BARRICK THIRD QUARTER 2016 4 PRESS RELEASE
Copper
Copper production in the third quarter was 100 million pounds at a cost of sales attributable to copper of $1.47 per pound, andall-in sustaining costs 7 of $2.02 per pound.
We continue to expect copper production for 2016 in the range of 380-430 million pounds, at a cost of sales applicable to copperbetween $1.35-1.55 per pound. Copper all-in sustaining cost 7 guidance for 2016 has been narrowed to $2.00-$2.20 per pound.
DIGITAL BARRICK UPDATE
During the quarter, we announced that we are partnering with Cisco to drive the digital reinvention of our business. Through thiscollaboration, we will harness digital technology to unlock value across our business, helping us grow our cash flow per share byenhancing productivity and efficiency at our mines, and improving decision-making and performance across our business. Justas importantly, digital technology will allow us to reduce our environmental impact, and be even more transparent with our localpartners, including communities, local governments, and NGOs.
Our collaboration with Cisco is strategic: we are working together to define opportunities and—by combining our knowledge,networks, and resources—to develop new technology solutions.
We have already begun working together to develop a flagship digital operation at the Cortez mine in Nevada—embeddingdigital technology throughout the mine to deliver better, faster, and safer mining. Ultimately, the goal at Cortez is to redefine best-in-class mining.
With the Cortez test case proven, Cisco will support us as we transform our entire business over time—bringing digitaltechnology to all of our mines, as well as to our head office. New digital tools will permit Barrick’s leaders to make decisions withgreater speed, precision, and productivity, and will better equip the Company to assess and mitigate risk.
Overall, our approach to digital reinvention is similar to that used in agile software development. Work is phased, a proof-of-concept is demonstrated, and if it succeeds, it receives more funding so it can be swiftly implemented and accelerated. If aproject is not delivering benefits within six weeks, we will make adjustments, or stop. This approach minimizes upfront capitaland execution risk.
We will apply the same rigor and scrutiny to digital projects as we would for any other capital allocation decision. All significantinvestments will need to be approved by our Investment Committee.
We have earmarked approximately $100 million for digital projects in 2016 and 2017. This is money we will invest directly in ourbusiness. Our Investment Committee has approved the first wave of digital projects at the Cortez mine with a budget of up to $50million in 2016 and 2017. These include:
• The implementation of a short-interval control system underground . The system, commonly employed inmanufacturing, will use sensors to ensure that both people and equipment are performing according to plan, and at thehighest level, driving improvements in daily tonnage rates and labor productivity. Any deviations from plans can beimmediately identified, addressed, and resolved.
BARRICK THIRD QUARTER 2016 5 PRESS RELEASE

• The implementation of a tele-remote system . Equipment operators will no longer spend significant time travelingbetween the surface and the operating face—time during which equipment sits idle. Instead, they will operateunderground equipment (including drills, road-headers, loaders, and haul trucks) from a comfortable, centralized controlroom on the surface, using reliable and continuous data feeds to inform their decisions. These changes are expected toimprove overall productivity, and decrease operating costs, while reducing the number of people underground.
• The digitization of maintenance management . The mine will implement a tablet-based digital workflow and task-management system that will replace the existing paper-based system. These changes are expected to increaseequipment availability, and reduce unplanned maintenance work, leading to lower parts inventory, improved continuityof production, and lower operating costs.
• The automation of the processing plant . The mine will implement an advanced operating control system at the
processing plant, building on recent system upgrades to optimize crushing, grinding, and carbon leaching and handlingcircuits for improved gold recovery.
• The consolidation of data . The mine will connect up to 150 distinct systems and data sources to one datamanagement platform, which will enable better analysis, planning, and decision-making.
In parallel with these projects, we have also begun to explore how to leverage digital technologies to streamline the permittingprocess, with better transparency.
Planning for the next wave of projects will continue in parallel with the implementation of the current, first wave.
PROJECT UPDATE
The Pascua-Lama project, located on the border between Chile and Argentina, is one of the world’s most attractive undevelopedgold and silver deposits, with the potential to generate significant free cash flow over a long mine life. During the third quarter, weannounced the appointment of George Bee as Senior Vice President for Lama and Frontera District Development. Mr. Bee andhis team are now advancing a scoping study on the use of underground mining methods for a Lama starter project on theArgentinean side of the Pascua-Lama project. Such a project could represent the first stage of a phased development plan forPascua-Lama. Concurrently, the team in Chile remains focused on optimizing the Chilean components of the project, whileaddressing outstanding legal, regulatory, and permitting matters.
Our Investment Committee will continue to scrutinize the project as it advances, applying a high degree of consistency and rigor—as we do for all capital allocation decisions at the Company—before further review by the Executive Committee and the Boardat each stage of advancement.
TECHNICAL INFORMATION
The scientific and technical information contained in this press release has been reviewed and approved by Steven Haggarty, P.Eng., Senior Director, Metallurgy of Barrick, who is a “Qualified Person” as defined in National Instrument 43-101 Standards ofDisclosure for Mineral Projects. BARRICK THIRD QUARTER 2016 6 PRESS RELEASE
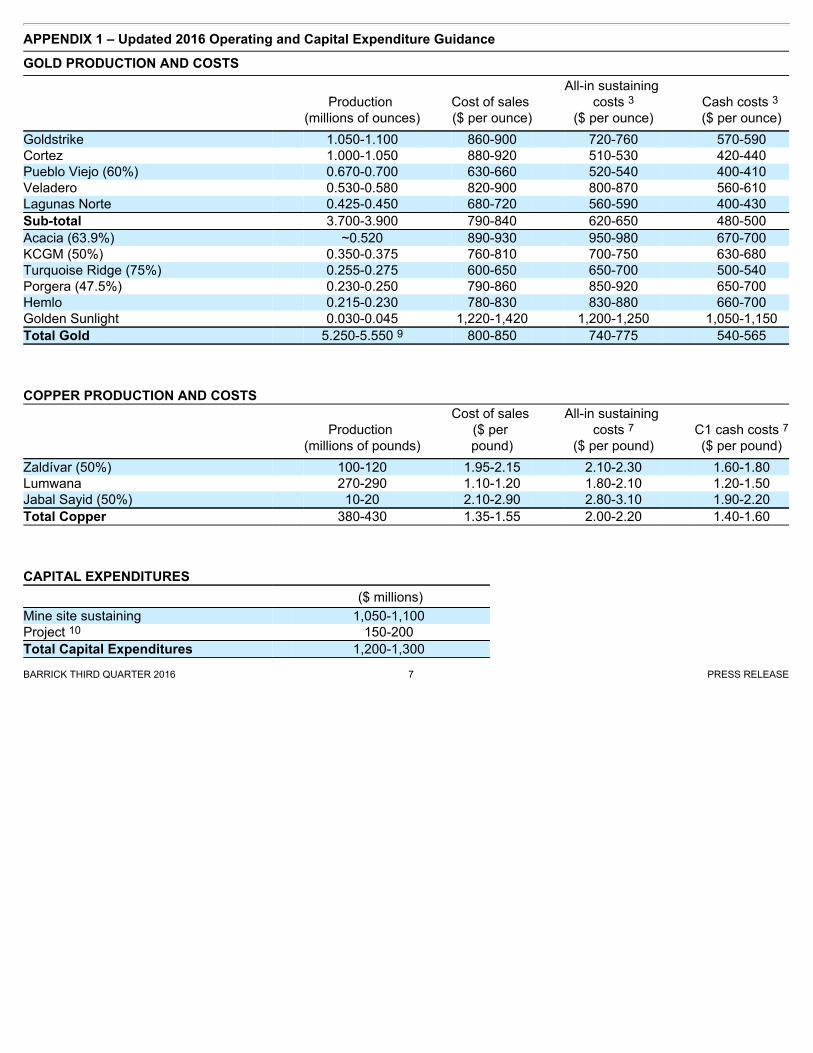
APPENDIX 1 – Updated 2016 Operating and Capital Expenditure Guidance GOLD PRODUCTION AND COSTS
Production
(millions of ounces)
Cost of sales ($ per ounce)
All-in sustaining costs 3
($ per ounce)
Cash costs 3
($ per ounce)
Goldstrike 1.050-1.100 860-900 720-760 570-590Cortez 1.000-1.050 880-920 510-530 420-440Pueblo Viejo (60%) 0.670-0.700 630-660 520-540 400-410Veladero 0.530-0.580 820-900 800-870 560-610Lagunas Norte 0.425-0.450 680-720 560-590 400-430Sub-total 3.700-3.900 790-840 620-650 480-500Acacia (63.9%) ~0.520 890-930 950-980 670-700KCGM (50%) 0.350-0.375 760-810 700-750 630-680Turquoise Ridge (75%) 0.255-0.275 600-650 650-700 500-540Porgera (47.5%) 0.230-0.250 790-860 850-920 650-700Hemlo 0.215-0.230 780-830 830-880 660-700Golden Sunlight 0.030-0.045 1,220-1,420 1,200-1,250 1,050-1,150Total Gold 5.250-5.550 9 800-850 740-775 540-565
COPPER PRODUCTION AND COSTS
Production
(millions of pounds)
Cost of sales ($ per pound)
All-in sustaining costs 7
($ per pound)
C1 cash costs 7($ per pound)
Zaldívar (50%) 100-120 1.95-2.15 2.10-2.30 1.60-1.80Lumwana 270-290 1.10-1.20 1.80-2.10 1.20-1.50Jabal Sayid (50%) 10-20 2.10-2.90 2.80-3.10 1.90-2.20Total Copper 380-430 1.35-1.55 2.00-2.20 1.40-1.60
CAPITAL EXPENDITURES
($ millions)
Mine site sustaining 1,050-1,100 Project 10 150-200 Total Capital Expenditures 1,200-1,300 BARRICK THIRD QUARTER 2016 7 PRESS RELEASE
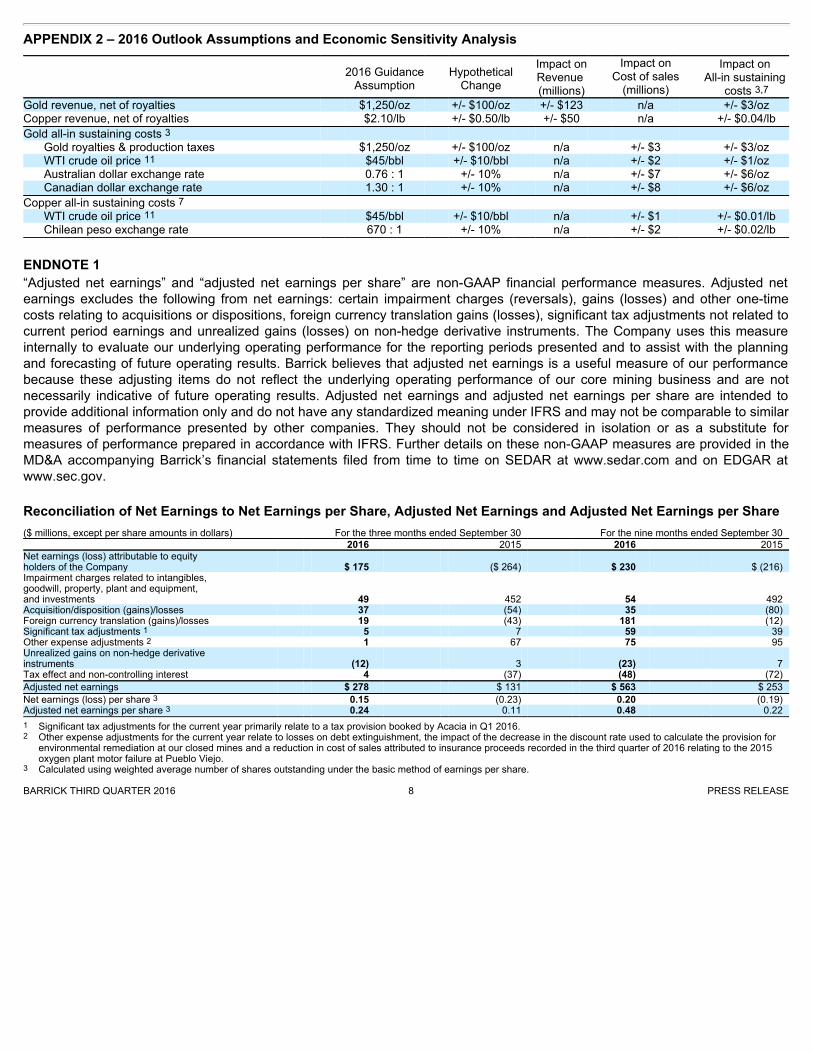
APPENDIX 2 – 2016 Outlook Assumptions and Economic Sensitivity Analysis
2016 Guidance
Assumption
HypotheticalChange
Impact onRevenue (millions)
Impact onCost of sales
(millions)
Impact on All-in sustaining
costs 3,7Gold revenue, net of royalties $1,250/oz +/- $100/oz +/- $123 n/a +/- $3/ozCopper revenue, net of royalties $2.10/lb +/- $0.50/lb +/- $50 n/a +/- $0.04/lb
Gold all-in sustaining costs 3 Gold royalties & production taxes $1,250/oz +/- $100/oz n/a +/- $3 +/- $3/ozWTI crude oil price 11 $45/bbl +/- $10/bbl n/a +/- $2 +/- $1/ozAustralian dollar exchange rate 0.76 : 1 +/- 10% n/a +/- $7 +/- $6/ozCanadian dollar exchange rate 1.30 : 1 +/- 10% n/a +/- $8 +/- $6/oz
Copper all-in sustaining costs 7 WTI crude oil price 11 $45/bbl +/- $10/bbl n/a +/- $1 +/- $0.01/lbChilean peso exchange rate 670 : 1 +/- 10% n/a +/- $2 +/- $0.02/lb
ENDNOTE 1“Adjusted net earnings” and “adjusted net earnings per share” are non-GAAP financial performance measures. Adjusted netearnings excludes the following from net earnings: certain impairment charges (reversals), gains (losses) and other one-timecosts relating to acquisitions or dispositions, foreign currency translation gains (losses), significant tax adjustments not related tocurrent period earnings and unrealized gains (losses) on non-hedge derivative instruments. The Company uses this measureinternally to evaluate our underlying operating performance for the reporting periods presented and to assist with the planningand forecasting of future operating results. Barrick believes that adjusted net earnings is a useful measure of our performancebecause these adjusting items do not reflect the underlying operating performance of our core mining business and are notnecessarily indicative of future operating results. Adjusted net earnings and adjusted net earnings per share are intended toprovide additional information only and do not have any standardized meaning under IFRS and may not be comparable to similarmeasures of performance presented by other companies. They should not be considered in isolation or as a substitute formeasures of performance prepared in accordance with IFRS. Further details on these non-GAAP measures are provided in theMD&A accompanying Barrick’s financial statements filed from time to time on SEDAR at www.sedar.com and on EDGAR atwww.sec.gov.
Reconciliation of Net Earnings to Net Earnings per Share, Adjusted Net Earnings and Adjusted Net Earnings per Share ($ millions, except per share amounts in dollars) For the three months ended September 30 For the nine months ended September 30 2016 2015 2016 2015 Net earnings (loss) attributable to equity holders of the Company $ 175 ($ 264) $ 230 $ (216) Impairment charges related to intangibles, goodwill, property, plant and equipment, and investments 49 452 54 492 Acquisition/disposition (gains)/losses 37 (54) 35 (80) Foreign currency translation (gains)/losses 19 (43) 181 (12) Significant tax adjustments 1 5 7 59 39 Other expense adjustments 2 1 67 75 95 Unrealized gains on non-hedge derivative instruments (12) 3 (23) 7 Tax effect and non-controlling interest 4 (37) (48) (72)
Adjusted net earnings $ 278 $ 131 $ 563 $ 253
Net earnings (loss) per share 3 0.15 (0.23) 0.20 (0.19) Adjusted net earnings per share 3 0.24 0.11 0.48 0.22
1 Significant tax adjustments for the current year primarily relate to a tax provision booked by Acacia in Q1 2016.2 Other expense adjustments for the current year relate to losses on debt extinguishment, the impact of the decrease in the discount rate used to calculate the provision for
environmental remediation at our closed mines and a reduction in cost of sales attributed to insurance proceeds recorded in the third quarter of 2016 relating to the 2015oxygen plant motor failure at Pueblo Viejo.
3 Calculated using weighted average number of shares outstanding under the basic method of earnings per share. BARRICK THIRD QUARTER 2016 8 PRESS RELEASE

ENDNOTE 2“Free cash flow” is a non-GAAP financial performance measure which excludes capital expenditures from Net cash provided byoperating activities. Barrick believes this to be a useful indicator of our ability to operate without reliance on additional borrowingor usage of existing cash. Free cash flow is intended to provide additional information only and does not have anystandardized meaning under IFRS and may not be comparable to similar measures of performance presented by othercompanies. Free cash flow should not be considered in isolation or as a substitute for measures of performance prepared inaccordance with IFRS. Further details on these non-GAAP measures are provided in the MD&A accompanying Barrick’sfinancial statements filed from time to time on SEDAR at www.sedar.com and on EDGAR at www.sec.gov.
Reconciliation of Net Cash Provided by Operating Activities to Free Cash Flow ($ millions)
For the three months ended September 30 For the nine months ended September 30
2016 2015 2016 2015 Net cash provided by operating activities $ 951 $ 1,255 $ 1,929 $ 2,096 Capital expenditures (277) (389) (800) (1,402)
Free cash flow $ 674 $ 866 $ 1,129 $ 694
ENDNOTE 3“Cash costs” per ounce and “All-in sustaining costs” per ounce are non-GAAP financial performance measures. “Cash costs” perounce is based on cost of sales but excludes, among other items, the impact of depreciation. “All-in sustaining costs” per ouncebegins with “Cash costs” per ounce and adds further costs which reflect the additional costs of operating a mine, primarilysustaining capital expenditures, general & administrative costs and minesite exploration and evaluation costs. Barrick believesthat the use of “cash costs” per ounce and “all-in sustaining costs” per ounce will assist investors, analysts and otherstakeholders in understanding the costs associated with producing gold, understanding the economics of gold mining, assessingour operating performance and also our ability to generate free cash flow from current operations and to generate free cash flowon an overall Company basis. “Cash costs” per ounce and “All-in sustaining costs” per ounce are intended to provide additionalinformation only and do not have any standardized meaning under IFRS. Although a standardized definition of all-in sustainingcosts was published in 2013 by the World Gold Council (a market development organization for the gold industry comprised ofand funded by 18 gold mining companies from around the world, including Barrick), it is not a regulatory organization, and othercompanies may calculate this measure differently. These measures should not be considered in isolation or as a substitute formeasures prepared in accordance with IFRS. Further details on these non-GAAP measures are provided in the MD&Aaccompanying Barrick’s financial statements filed from time to time on SEDAR at www.sedar.com and on EDGAR atwww.sec.gov.
Reconciliation of Gold Cost of Sales to Cash costs, All-in sustaining costs and All-in costs, including on a per ouncebasis
($ millions, except per ounce information in dollars) For the three months ended
September 30, For the nine months ended
September 30, Footnote 2016 2015 2016 2015 Cost of sales related to gold production $ 1,202 $ 1,491 $ 3,632 $ 4,329
Depreciation (373) (399) (1,107) (1,151) By-product credits 1 (59) (54) (143) (166) Realized (gains)/losses on hedge and non-hedge derivatives 2 15 30 71 78 Non-recurring items 3 34 (61) 24 (61) Other 4 (9) 7 (24) 18 Non-controlling interests (Pueblo Viejo and Acacia) 5 (92) (104) (267) (316)
Cash costs $ 718 $ 910 $ 2,186 $ 2,731
General & administrative costs 71 44 217 181 Minesite exploration and evaluation costs 6 10 11 26 36 Minesite sustaining capital expenditures 7 236 342 646 1,056 Rehabilitation - accretion and amortization (operating sites) 8 16 43 41 119 Non-controlling interest, copper operations and other 9 (75) (119) (209) (276)
BARRICK THIRD QUARTER 2016 9 PRESS RELEASE
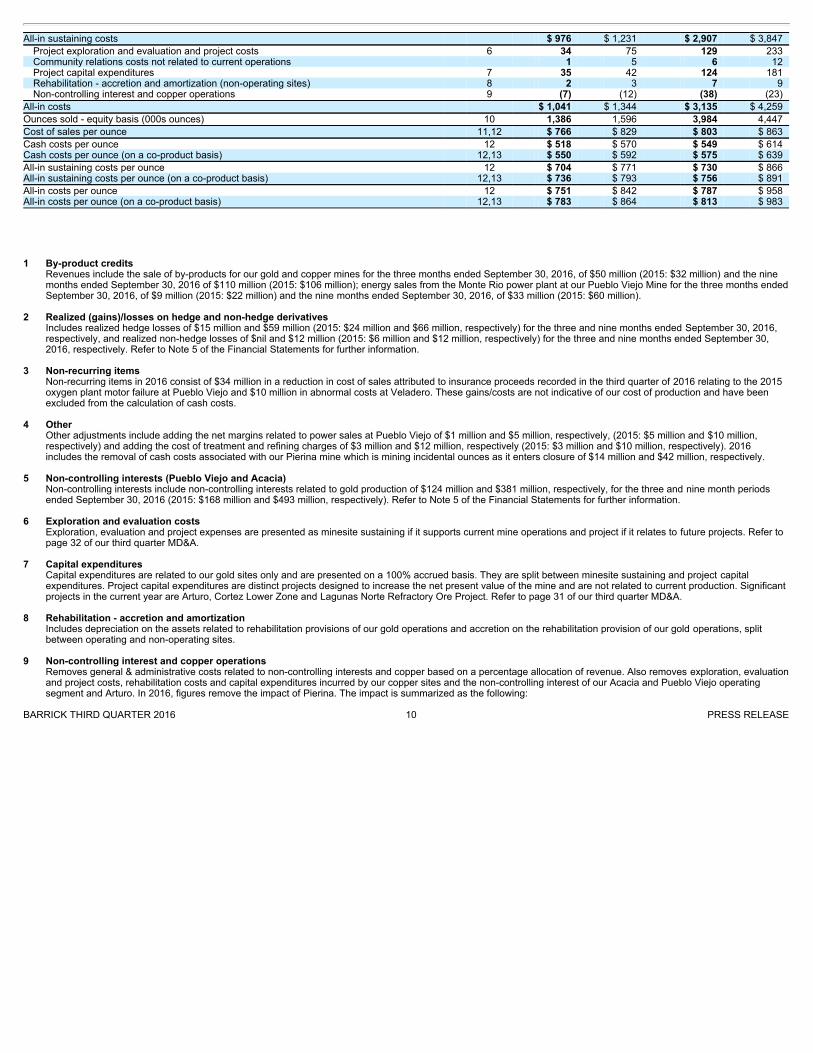
All-in sustaining costs $ 976 $ 1,231 $ 2,907 $ 3,847
Project exploration and evaluation and project costs 6 34 75 129 233 Community relations costs not related to current operations 1 5 6 12 Project capital expenditures 7 35 42 124 181 Rehabilitation - accretion and amortization (non-operating sites) 8 2 3 7 9 Non-controlling interest and copper operations 9 (7) (12) (38) (23)
All-in costs $ 1,041 $ 1,344 $ 3,135 $ 4,259
Ounces sold - equity basis (000s ounces) 10 1,386 1,596 3,984 4,447
Cost of sales per ounce 11,12 $ 766 $ 829 $ 803 $ 863
Cash costs per ounce 12 $ 518 $ 570 $ 549 $ 614 Cash costs per ounce (on a co-product basis) 12,13 $ 550 $ 592 $ 575 $ 639
All-in sustaining costs per ounce 12 $ 704 $ 771 $ 730 $ 866 All-in sustaining costs per ounce (on a co-product basis) 12,13 $ 736 $ 793 $ 756 $ 891
All-in costs per ounce 12 $ 751 $ 842 $ 787 $ 958 All-in costs per ounce (on a co-product basis) 12,13 $ 783 $ 864 $ 813 $ 983
1 By-product credits
Revenues include the sale of by-products for our gold and copper mines for the three months ended September 30, 2016, of $50 million (2015: $32 million) and the ninemonths ended September 30, 2016 of $110 million (2015: $106 million); energy sales from the Monte Rio power plant at our Pueblo Viejo Mine for the three months endedSeptember 30, 2016, of $9 million (2015: $22 million) and the nine months ended September 30, 2016, of $33 million (2015: $60 million).
2 Realized (gains)/losses on hedge and non-hedge derivatives
Includes realized hedge losses of $15 million and $59 million (2015: $24 million and $66 million, respectively) for the three and nine months ended September 30, 2016,respectively, and realized non-hedge losses of $nil and $12 million (2015: $6 million and $12 million, respectively) for the three and nine months ended September 30,2016, respectively. Refer to Note 5 of the Financial Statements for further information.
3 Non-recurring items
Non-recurring items in 2016 consist of $34 million in a reduction in cost of sales attributed to insurance proceeds recorded in the third quarter of 2016 relating to the 2015oxygen plant motor failure at Pueblo Viejo and $10 million in abnormal costs at Veladero. These gains/costs are not indicative of our cost of production and have beenexcluded from the calculation of cash costs.
4 Other
Other adjustments include adding the net margins related to power sales at Pueblo Viejo of $1 million and $5 million, respectively, (2015: $5 million and $10 million,respectively) and adding the cost of treatment and refining charges of $3 million and $12 million, respectively (2015: $3 million and $10 million, respectively). 2016includes the removal of cash costs associated with our Pierina mine which is mining incidental ounces as it enters closure of $14 million and $42 million, respectively.
5 Non-controlling interests (Pueblo Viejo and Acacia)
Non-controlling interests include non-controlling interests related to gold production of $124 million and $381 million, respectively, for the three and nine month periodsended September 30, 2016 (2015: $168 million and $493 million, respectively). Refer to Note 5 of the Financial Statements for further information.
6 Exploration and evaluation costs
Exploration, evaluation and project expenses are presented as minesite sustaining if it supports current mine operations and project if it relates to future projects. Refer topage 32 of our third quarter MD&A.
7 Capital expenditures
Capital expenditures are related to our gold sites only and are presented on a 100% accrued basis. They are split between minesite sustaining and project capitalexpenditures. Project capital expenditures are distinct projects designed to increase the net present value of the mine and are not related to current production. Significantprojects in the current year are Arturo, Cortez Lower Zone and Lagunas Norte Refractory Ore Project. Refer to page 31 of our third quarter MD&A.
8 Rehabilitation - accretion and amortization
Includes depreciation on the assets related to rehabilitation provisions of our gold operations and accretion on the rehabilitation provision of our gold operations, splitbetween operating and non-operating sites.
9 Non-controlling interest and copper operations
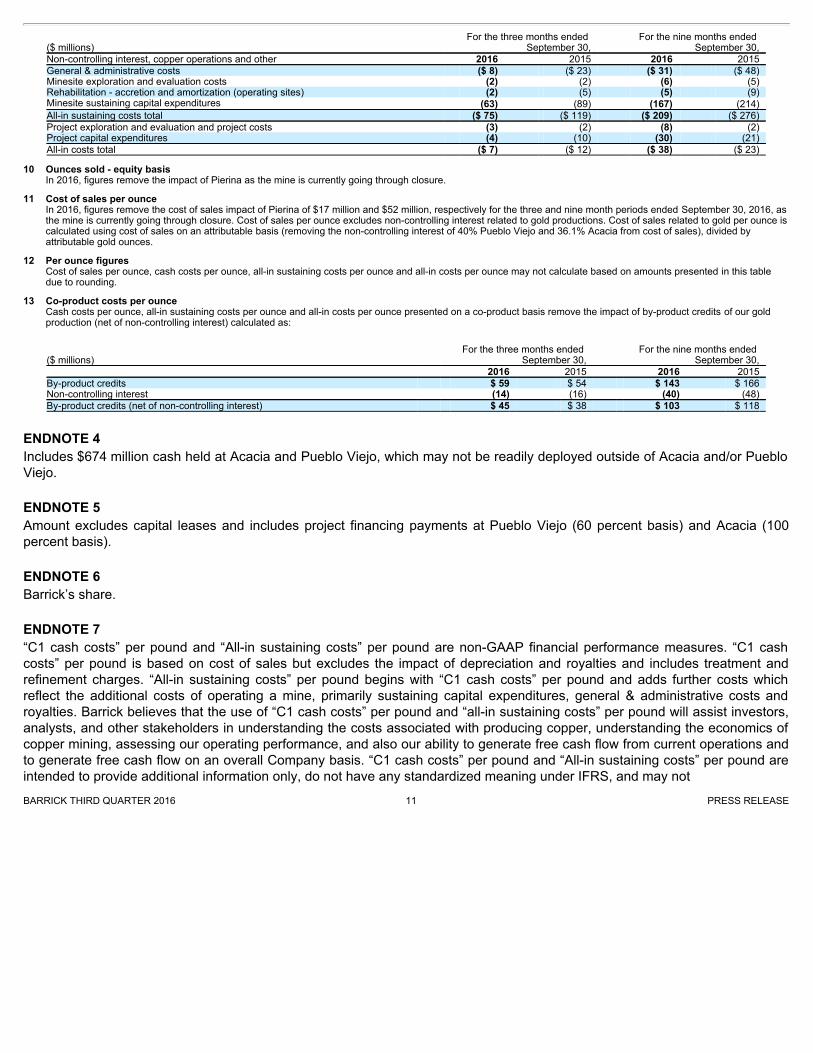
Removes general & administrative costs related to non-controlling interests and copper based on a percentage allocation of revenue. Also removes exploration, evaluationand project costs, rehabilitation costs and capital expenditures incurred by our copper sites and the non-controlling interest of our Acacia and Pueblo Viejo operatingsegment and Arturo. In 2016, figures remove the impact of Pierina. The impact is summarized as the following:
BARRICK THIRD QUARTER 2016 10 PRESS RELEASE
($ millions) For the three months ended
September 30, For the nine months ended
September 30, Non-controlling interest, copper operations and other 2016 2015 2016 2015 General & administrative costs ($ 8) ($ 23) ($ 31) ($ 48) Minesite exploration and evaluation costs (2) (2) (6) (5) Rehabilitation - accretion and amortization (operating sites) (2) (5) (5) (9) Minesite sustaining capital expenditures (63) (89) (167) (214) All-in sustaining costs total ($ 75) ($ 119) ($ 209) ($ 276) Project exploration and evaluation and project costs (3) (2) (8) (2) Project capital expenditures (4) (10) (30) (21) All-in costs total ($ 7) ($ 12) ($ 38) ($ 23)
10 Ounces sold - equity basis
In 2016, figures remove the impact of Pierina as the mine is currently going through closure. 11 Cost of sales per ounce
In 2016, figures remove the cost of sales impact of Pierina of $17 million and $52 million, respectively for the three and nine month periods ended September 30, 2016, asthe mine is currently going through closure. Cost of sales per ounce excludes non-controlling interest related to gold productions. Cost of sales related to gold per ounce iscalculated using cost of sales on an attributable basis (removing the non-controlling interest of 40% Pueblo Viejo and 36.1% Acacia from cost of sales), divided byattributable gold ounces.
12 Per ounce figures
Cost of sales per ounce, cash costs per ounce, all-in sustaining costs per ounce and all-in costs per ounce may not calculate based on amounts presented in this tabledue to rounding.
13 Co-product costs per ounce
Cash costs per ounce, all-in sustaining costs per ounce and all-in costs per ounce presented on a co-product basis remove the impact of by-product credits of our goldproduction (net of non-controlling interest) calculated as:
($ millions)
For the three months ended September 30,
For the nine months ended September 30,
2016 2015 2016 2015 By-product credits $ 59 $ 54 $ 143 $ 166 Non-controlling interest (14) (16) (40) (48) By-product credits (net of non-controlling interest) $ 45 $ 38 $ 103 $ 118
ENDNOTE 4Includes $674 million cash held at Acacia and Pueblo Viejo, which may not be readily deployed outside of Acacia and/or PuebloViejo.
ENDNOTE 5Amount excludes capital leases and includes project financing payments at Pueblo Viejo (60 percent basis) and Acacia (100percent basis).
ENDNOTE 6Barrick’s share.
ENDNOTE 7“C1 cash costs” per pound and “All-in sustaining costs” per pound are non-GAAP financial performance measures. “C1 cashcosts” per pound is based on cost of sales but excludes the impact of depreciation and royalties and includes treatment andrefinement charges. “All-in sustaining costs” per pound begins with “C1 cash costs” per pound and adds further costs whichreflect the additional costs of operating a mine, primarily sustaining capital expenditures, general & administrative costs androyalties. Barrick believes that the use of “C1 cash costs” per pound and “all-in sustaining costs” per pound will assist investors,analysts, and other stakeholders in understanding the costs associated with producing copper, understanding the economics ofcopper mining, assessing our operating performance, and also our ability to generate free cash flow from current operations andto generate free cash flow on an overall Company basis. “C1 cash costs” per pound and “All-in sustaining costs” per pound areintended to provide additional information only, do not have any standardized meaning under IFRS, and may not BARRICK THIRD QUARTER 2016 11 PRESS RELEASE

be comparable to similar measures of performance presented by other companies. These measures should not be considered inisolation or as a substitute for measures of performance prepared in accordance with IFRS. Further details on these non-GAAPmeasures are provided in the MD&A accompanying Barrick’s financial statements filed from time to time on SEDAR atwww.sedar.com and on EDGAR at www.sec.gov.
Reconciliation of Copper Cost of Sales to C1 cash costs and All-in sustaining costs, including on a per pound basis($ millions, except per pound information in dollars) For the three months ended September 30 For the nine months ended September 30 2016 2015 2016 2015 Cost of sales $ 66 $ 209 $ 235 $ 698
Depreciation/amortization 1 (10) (18) (30) (80) Treatment and refinement charges 36 46 120 129 Cash cost of sales applicable to equity method
investments 2 68 - 154 - Less: royalties (7) (15) (32) (85)
C1 cash cost of sales $ 153 $ 222 $ 447 $ 662
General & administrative costs - 6 11 17 Rehabilitation - accretion and amortization 1 2 5 6 Royalties 7 15 32 85 Minesite sustaining capital expenditures 44 61 121 132
All - in sustaining costs $ 205 $ 306 $ 616 $ 902
Pounds sold - consolidated basis (millions pounds) 102 145 298 378
Cost of sales per pound 3,4 $1.47 $ 1.44 $1.42 $ 1.85
C1 cash cost per pound 3 $1.50 $ 1.53 $1.50 $ 1.75
All-in sustaining costs per pound 3 $2.02 $2.11 $2.08 $ 2.39
1 For the three and nine month periods ended September 30, 2016, depreciation excludes $15 million and $34 million, respectively, of depreciation applicable to equitymethod investments.
2 For the three and nine month periods ended September 30, 2016, figures include $46 million and $131 million, respectively, of cash costs related to our 50% share ofZaldívar due to the divestment of 50% of our interest in the mine on December 1, 2015, as well as $23 million and $23 million, respectively of cash costs related to our 50%share of Jabal Sayid due to the divestment of 50% of our interest in the mine on December 4, 2014 and subsequent accounting as an equity method investments.
3 Cost of sales per pound, C1 cash costs per pound and all-in sustaining costs per pound may not calculate based on amounts presented in this table due to rounding.4 Cost of sales related to copper per pound is calculated using cost of sales including our proportionate share of cost of sales attributable to equity method investments
(Zaldívar and Jabal Sayid), divided by consolidated copper pounds (including our proportionate share of copper pounds from our equity method investments).
ENDNOTE 8Barrick’s share on an accrued basis.
ENDNOTE 9Operating unit guidance ranges for production reflect expectations at each individual operating unit, but do not add up tocorporate-wide guidance range total.
ENDNOTE 10We have combined our previous capital expenditure categories of Minesite expansion and Projects into one category calledProject.
ENDNOTE 11Due to our fuel hedging activities, which are reflected in these sensitivities, we are partially protected against changes in thisfactor. BARRICK THIRD QUARTER 2016 12 PRESS RELEASE
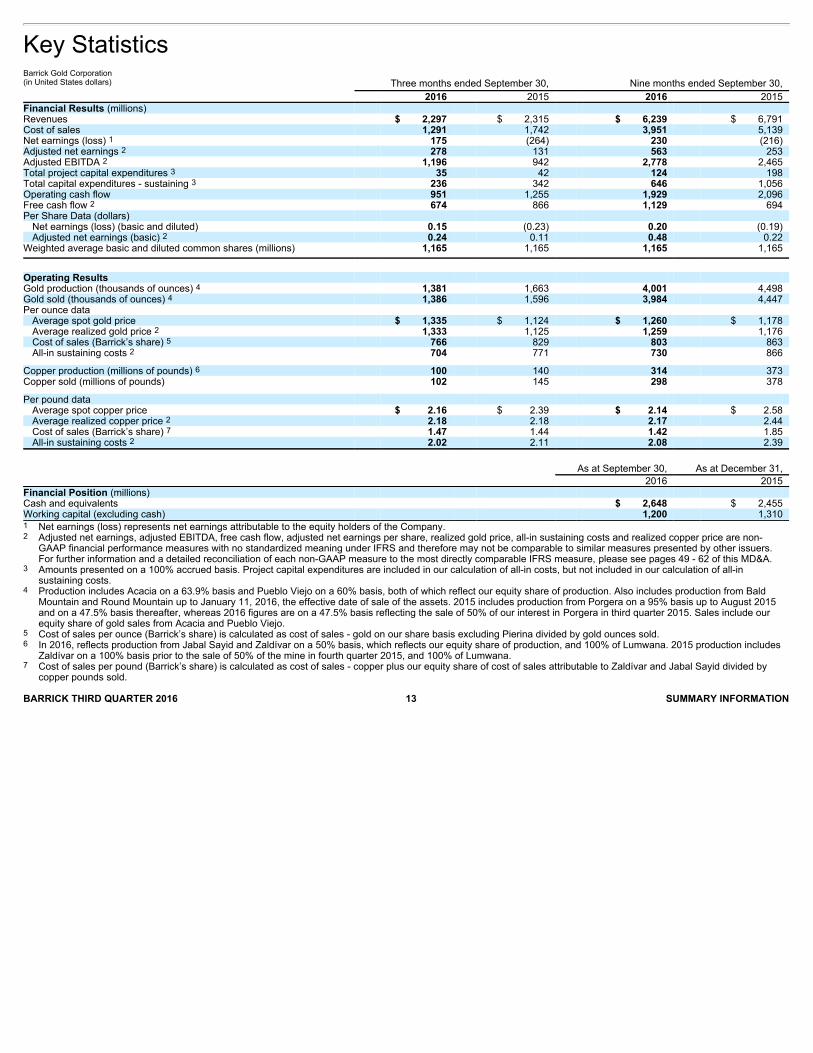
Key Statistics Barrick Gold Corporation (in United States dollars) Three months ended September 30,
Nine months ended September 30,
2016 2015 2016 2015 Financial Results (millions) Revenues $ 2,297 $ 2,315 $ 6,239 $ 6,791 Cost of sales 1,291 1,742 3,951 5,139 Net earnings (loss) 1 175 (264) 230 (216) Adjusted net earnings 2 278 131 563 253 Adjusted EBITDA 2 1,196 942 2,778 2,465 Total project capital expenditures 3 35 42 124 198 Total capital expenditures - sustaining 3 236 342 646 1,056 Operating cash flow 951 1,255 1,929 2,096 Free cash flow 2 674 866 1,129 694 Per Share Data (dollars)
Net earnings (loss) (basic and diluted) 0.15 (0.23) 0.20 (0.19) Adjusted net earnings (basic) 2 0.24 0.11 0.48 0.22
Weighted average basic and diluted common shares (millions)
1,165
1,165
1,165
1,165
Operating Results Gold production (thousands of ounces) 4 1,381 1,663 4,001 4,498 Gold sold (thousands of ounces) 4 1,386 1,596 3,984 4,447 Per ounce data
Average spot gold price $ 1,335 $ 1,124 $ 1,260 $ 1,178 Average realized gold price 2 1,333 1,125 1,259 1,176 Cost of sales (Barrick’s share) 5 766 829 803 863 All-in sustaining costs 2 704 771 730 866
Copper production (millions of pounds) 6 100 140 314 373 Copper sold (millions of pounds) 102 145 298 378
Per pound data Average spot copper price $ 2.16 $ 2.39 $ 2.14 $ 2.58 Average realized copper price 2 2.18 2.18 2.17 2.44 Cost of sales (Barrick’s share) 7 1.47 1.44 1.42 1.85 All-in sustaining costs 2 2.02 2.11 2.08 2.39
As at September 30, As at December 31, 2016 2015 Financial Position (millions) Cash and equivalents $ 2,648 $ 2,455 Working capital (excluding cash) 1,200 1,310
1 Net earnings (loss) represents net earnings attributable to the equity holders of the Company.2 Adjusted net earnings, adjusted EBITDA, free cash flow, adjusted net earnings per share, realized gold price, all-in sustaining costs and realized copper price are non-
GAAP financial performance measures with no standardized meaning under IFRS and therefore may not be comparable to similar measures presented by other issuers.For further information and a detailed reconciliation of each non-GAAP measure to the most directly comparable IFRS measure, please see pages 49 - 62 of this MD&A.
3 Amounts presented on a 100% accrued basis. Project capital expenditures are included in our calculation of all-in costs, but not included in our calculation of all-insustaining costs.
4 Production includes Acacia on a 63.9% basis and Pueblo Viejo on a 60% basis, both of which reflect our equity share of production. Also includes production from BaldMountain and Round Mountain up to January 11, 2016, the effective date of sale of the assets. 2015 includes production from Porgera on a 95% basis up to August 2015and on a 47.5% basis thereafter, whereas 2016 figures are on a 47.5% basis reflecting the sale of 50% of our interest in Porgera in third quarter 2015. Sales include ourequity share of gold sales from Acacia and Pueblo Viejo.
5 Cost of sales per ounce (Barrick’s share) is calculated as cost of sales - gold on our share basis excluding Pierina divided by gold ounces sold.6 In 2016, reflects production from Jabal Sayid and Zaldívar on a 50% basis, which reflects our equity share of production, and 100% of Lumwana. 2015 production includes
Zaldívar on a 100% basis prior to the sale of 50% of the mine in fourth quarter 2015, and 100% of Lumwana.7 Cost of sales per pound (Barrick’s share) is calculated as cost of sales - copper plus our equity share of cost of sales attributable to Zaldívar and Jabal Sayid divided by
copper pounds sold. BARRICK THIRD QUARTER 2016 13 SUMMARY INFORMATION
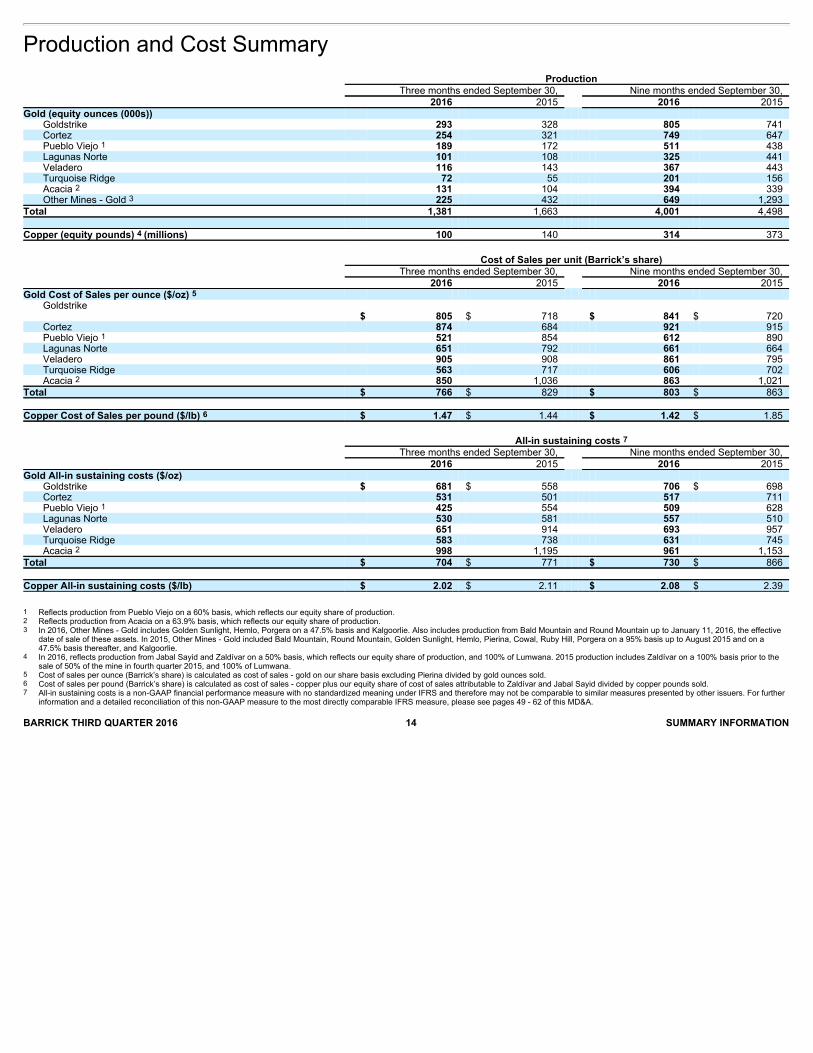
Production and Cost Summary Production Three months ended September 30, Nine months ended September 30, 2016 2015 2016 2015 Gold (equity ounces (000s))
Goldstrike 293 328 805 741 Cortez 254 321 749 647 Pueblo Viejo 1 189 172 511 438 Lagunas Norte 101 108 325 441 Veladero 116 143 367 443 Turquoise Ridge 72 55 201 156 Acacia 2 131 104 394 339 Other Mines - Gold 3 225 432 649 1,293
Total 1,381 1,663 4,001 4,498 Copper (equity pounds) 4 (millions) 100 140 314 373
Cost of Sales per unit (Barrick’s share) Three months ended September 30, Nine months ended September 30, 2016 2015 2016 2015 Gold Cost of Sales per ounce ($/oz) 5
Goldstrike $
805 $
718 $
841 $
720
Cortez 874 684 921 915 Pueblo Viejo 1 521 854 612 890 Lagunas Norte 651 792 661 664 Veladero 905 908 861 795 Turquoise Ridge 563 717 606 702 Acacia 2 850 1,036 863 1,021
Total $ 766 $ 829 $ 803 $ 863 Copper Cost of Sales per pound ($/lb) 6 $ 1.47 $ 1.44 $ 1.42 $ 1.85
All-in sustaining costs 7 Three months ended September 30, Nine months ended September 30, 2016 2015 2016 2015 Gold All-in sustaining costs ($/oz)
Goldstrike $ 681 $ 558 706 $ 698 Cortez 531 501 517 711 Pueblo Viejo 1 425 554 509 628 Lagunas Norte 530 581 557 510 Veladero 651 914 693 957 Turquoise Ridge 583 738 631 745 Acacia 2 998 1,195 961 1,153
Total $ 704 $ 771 $ 730 $ 866 Copper All-in sustaining costs ($/lb) $ 2.02 $ 2.11 $ 2.08 $ 2.39 1 Reflects production from Pueblo Viejo on a 60% basis, which reflects our equity share of production.2 Reflects production from Acacia on a 63.9% basis, which reflects our equity share of production.3 In 2016, Other Mines - Gold includes Golden Sunlight, Hemlo, Porgera on a 47.5% basis and Kalgoorlie. Also includes production from Bald Mountain and Round Mountain up to January 11, 2016, the effective
date of sale of these assets. In 2015, Other Mines - Gold included Bald Mountain, Round Mountain, Golden Sunlight, Hemlo, Pierina, Cowal, Ruby Hill, Porgera on a 95% basis up to August 2015 and on a47.5% basis thereafter, and Kalgoorlie.
4 In 2016, reflects production from Jabal Sayid and Zaldívar on a 50% basis, which reflects our equity share of production, and 100% of Lumwana. 2015 production includes Zaldívar on a 100% basis prior to thesale of 50% of the mine in fourth quarter 2015, and 100% of Lumwana.
5 Cost of sales per ounce (Barrick’s share) is calculated as cost of sales - gold on our share basis excluding Pierina divided by gold ounces sold.6 Cost of sales per pound (Barrick’s share) is calculated as cost of sales - copper plus our equity share of cost of sales attributable to Zaldívar and Jabal Sayid divided by copper pounds sold.7 All-in sustaining costs is a non-GAAP financial performance measure with no standardized meaning under IFRS and therefore may not be comparable to similar measures presented by other issuers. For further
information and a detailed reconciliation of this non-GAAP measure to the most directly comparable IFRS measure, please see pages 49 - 62 of this MD&A. BARRICK THIRD QUARTER 2016 14 SUMMARY INFORMATION
MANAGEMENT’S DISCUSSION AND ANALYSIS (“MD&A”)
CAUTIONARY STATEMENT ON FORWARD-LOOKING INFORMATION
BARRICK THIRD QUARTER 2016 15 MANAGEMENT’S DISCUSSION AND ANALYSIS
This portion of the Quarterly Report provides management’s discussion andanalysis (“MD&A”) of the financial condition and results of operations, toenable a reader to assess material changes in financial condition and resultsof operations as at, and for the three and nine month periods ended,September 30, 2016, in comparison to the corresponding prior–year periods.The MD&A is intended to help the reader understand Barrick GoldCorporation (“Barrick”, “we”, “our” or the “Company”), our operations,financial performance and present and future business environment. ThisMD&A, which has been prepared as of October 26, 2016, is intended tosupplement and complement the condensed unaudited interim consolidatedfinancial statements and notes thereto, prepared in accordance withInternational Accounting Standard 34 Interim Financial Reporting (“IAS 34”)as issued by the International Accounting Standards Board (“IASB”), for thethree and nine month periods ended September 30, 2016 (collectively, the“Financial Statements”), which are included in this Quarterly Report onpages 81 to 99. You are encouraged to review the Financial Statements inconjunction with your review of this MD&A. This MD&A should be read inconjunction with both the annual audited consolidated financial statementsfor the two years ended December 31, 2015,
the related annual MD&A included in the 2015 Annual Report, and the mostrecent Form 40–F/Annual Information Form on file with the U.S. Securitiesand Exchange Commission (“SEC”) and Canadian provincial securitiesregulatory authorities. These documents and additional information relatingto the Company are available on SEDAR at www.sedar.com and EDGAR atwww.sec.gov. Certain notes to the Financial Statements are specificallyreferred to in this MD&A and such notes are incorporated by referenceherein. All dollar amounts in this MD&A are in millions of United Statesdollars (“$” or “US$”), unless otherwise specified.
For the purposes of preparing our MD&A, we consider the materiality ofinformation. Information is considered material if: (i) such information resultsin, or would reasonably be expected to result in, a significant change in themarket price or value of our shares; or (ii) there is a substantial likelihoodthat a reasonable investor would consider it important in making aninvestment decision; or (iii) it would significantly alter the total mix ofinformation available to investors. We evaluate materiality with reference toall relevant circumstances, including potential market sensitivity.
Certain information contained or incorporated by reference in this MD&A,including any information as to our strategy, projects, plans or future financialor operating performance constitutes “forward-looking statements”. Allstatements, other than statements of historical fact, are forward-lookingstatements. The words “believe”, “expect”, “anticipate”, “contemplate”,“target”, “plan”, “objective”, “aim”, “intend”, “project”, “goal”, “continue”,“budget”, “estimate”, “potential”, “may”, “will”, “can”, “could” and similarexpressions identify forward-looking statements. In particular, this MD&Acontains forward-looking statements including, without limitation, with respectto: (i) Barrick’s forward-looking production guidance; (ii) estimates of futurecost of sales per ounce for gold and per pound for copper, all-in-sustainingcosts per ounce/pound, cash costs per ounce and C1 cash costs per pound;(iii) cash flow forecasts; (iv) projected capital, operating and explorationexpenditures; (v) targeted debt and cost reductions; (vi) targeted investmentsby Barrick’s Growth Group; (vii) mine life and production rates; (viii) potentialmineralization and metal or mineral recoveries; (ix) Barrick’s
Best-in-Class program (including potential improvements to financial andoperating performance that may result from certain Best-in-Class initiatives);(x) the Lama starter project and the potential for phased in development ofthe Pascua Lama project; (xi) timing and completion of acquisitions; (xii)asset sales or joint ventures; and (xiii) expectations regarding future priceassumptions, financial performance and other outlook or guidance.
Forward-looking statements are necessarily based upon a number ofestimates and assumptions including material estimates and assumptionsrelated to the factors set forth below that, while considered reasonable by theCompany as at the date of this MD&A in light of Management’s experienceand perception of current conditions and expected developments, areinherently subject to significant business, economic and competitiveuncertainties and contingencies. Known and unknown factors could causeactual results to differ materially from those
BARRICK THIRD QUARTER 2016 16 MANAGEMENT’S DISCUSSION AND ANALYSIS
projected in the forward-looking statements and undue reliance should notbe placed on such statements and information. Such factors include, but arenot limited to: fluctuations in the spot and forward price of gold, copper orcertain other commodities (such as silver, diesel fuel, natural gas andelectricity); the speculative nature of mineral exploration and development;changes in mineral production performance, exploitation and explorationsuccesses; risks associated with the fact that certain Best-in-Class initiativesare still in the early stages of evaluation and additional engineering and otheranalysis is required to fully assess their impact; diminishing quantities orgrades of reserves; increased costs, delays, suspensions and technicalchallenges associated with the construction of capital projects; operating ortechnical difficulties in connection with mining or development activities,including geotechnical challenges and disruptions in the maintenance orprovision of required infrastructure and information technology systems;failure to comply with environmental and health and safety laws andregulations; timing of receipt of, or failure to comply with, necessary permitsand approvals; uncertainty whether some or all of the Best-in-Classinitiatives and investments targeted by the Growth Group will meet thecompany’s capital allocation objectives; the impact of global liquidity andcredit availability on the timing of cash flows and the values of assets andliabilities based on projected future cash flows; adverse changes in our creditratings; the impact of inflation; fluctuations in the currency markets; changesin U.S. dollar interest rates; risks arising from holding derivative instruments;changes in national and local government legislation, taxation, controls orregulations and/or changes in the administration of laws, policies andpractices, expropriation or nationalization of property and political oreconomic developments in Canada, the United States and other jurisdictionsin which the Company does or may carry on business in the future; lack ofcertainty with respect to foreign legal systems, corruption and other factorsthat are inconsistent with the rule of law; damage to the Company’sreputation due to the actual or perceived occurrence of any number ofevents, including negative publicity with respect to the Company’s handlingof environmental matters or dealings with community groups, whether true ornot; risk of loss due to acts of war,
terrorism, sabotage and civil disturbances; litigation; contests over title toproperties, particularly title to undeveloped properties, or over access towater, power and other required infrastructure; business opportunities thatmay be presented to, or pursued by, the Company; our ability to successfullyintegrate acquisitions or complete divestitures; risks associated with workingwith partners in jointly controlled assets; employee relations including loss ofkey employees; increased costs and physical risks, including extremeweather events and resource shortages, related to climate change;availability and increased costs associated with mining inputs and labor; andthe organization of our previously held African gold operations and propertiesunder a separate listed company. In addition, there are risks and hazardsassociated with the business of mineral exploration, development andmining, including environmental hazards, industrial accidents, unusual orunexpected formations, pressures, cave-ins, flooding and gold bullion,copper cathode or gold or copper concentrate losses (and the risk ofinadequate insurance, or inability to obtain insurance, to cover these risks).
Many of these uncertainties and contingencies can affect our actual resultsand could cause actual results to differ materially from those expressed orimplied in any forward-looking statements made by, or on behalf of, us.Readers are cautioned that forward-looking statements are not guaranteesof future performance. All of the forward-looking statements made in thisMD&A are qualified by these cautionary statements. Specific reference ismade to the most recent Form 40-F/Annual Information Form on file with theSEC and Canadian provincial securities regulatory authorities for a moredetailed discussion of some of the factors underlying forward-lookingstatements and the risks that may affect Barrick’s ability to achieve theexpectations set forth in the forward-looking statements contained in thisMD&A.
We disclaim any intention or obligation to update or revise any forward-looking statements whether as a result of new information, future events orotherwise, except as required by applicable law.
CHANGES IN PRESENTATION OF NON-GAAP FINANCIAL PERFORMANCE MEASURES
BARRICK THIRD QUARTER 2016 17 MANAGEMENT’S DISCUSSION AND ANALYSIS
We use the following non-GAAP financial performance measures in ourMD&A:• “adjusted net earnings”• “free cash flow”• “EBITDA”• “adjusted EBITDA”• “cash costs per ounce”• “C1 cash costs per pound”• “all-in sustaining costs per ounce/pound”• “all-in costs per ounce” and• “realized price”For a detailed description of each of the non-GAAP measures used in thisMD&A and a detailed reconciliation, please refer to the Non-GAAP FinancialPerformance Measures section of this MD&A on pages 49 to 62. Each non-GAAP financial performance measure has been annotated with a referenceto an endnote on page 80. The non-GAAP financial performance measuresset out in this MD&A are intended to provide additional information toinvestors and do not have any standardized meaning under InternationalFinancial Reporting Standards (“IFRS”), and therefore may not becomparable to other issuers, and should not be considered in isolation or asa substitute for measures of performance prepared in accordance with IFRS.In 2016, we made changes to the following non-GAAP performancemeasures:
EBITDAStarting with this third quarter 2016 MD&A, we have presented thisreconciliation for each of our reportable operating segments. We believe thisadditional information will assist analysts, investors and other stakeholders ofBarrick in understanding the details of this non-GAAP metric on a segment-by-segment basis.
Adjusted net earningsWe amended the reconciliation from net earnings to adjusted net earnings topresent the adjusting items on a pre-tax and fully consolidated basis, andincluding the tax effect and non-controlling interest as a separate line. Webelieve that this change will assist analysts, investors and other stakeholdersof Barrick to better understand how we calculate this non-GAAPperformance measure and simplify how it reconciles to our financialstatements. This change to the presentation of our reconciliation does notresult in any change to the final calculation of adjusted net earnings.
Cash costs per ounce, all-in sustaining cash costs per ounce and all-in costsper ounceStarting with the third quarter 2016 MD&A, we have presented thisreconciliation for each of our reportable operating segments. We believe thisadditional information will assist analysts, investors and other stakeholders ofBarrick in understanding the details of these non-GAAP metrics on asegment-by-segment basis.
Starting with the second quarter 2016 MD&A, we condensed and simplifiedthe reconciliation from cost of sales to “cash costs”, “all-in sustaining costs”and “all-in costs”, including on a per ounce basis for gold and per poundbasis for copper, to present items on a fully consolidated basis and includenon-controlling interest as a separate line. As part of this simplification, wehave grouped several minor items into one line labeled “Other”, with furtherdetail in the footnote to the reconciliation. We believe that these changes willassist analysts, investors and other stakeholders of Barrick to betterunderstand how we calculate these non-GAAP performance measures andsimplify how they reconcile to our financial statements. This change to thepresentation of our reconciliation does not result in any change to the figurescalculated, except as noted below for “all-in costs”.
Also starting with the second quarter 2016 MD&A, we adjusted the amountincluded as “project exploration and evaluation costs and project costs” aspart of our “all-in costs” measure to include all exploration and evaluationcosts related to our advanced mining and business improvement projectsand corporate development activities, where previously it did not. The impactof this adjustment for the three and nine month periods ended September30, 2016 was $11/oz and $23/oz, respectively (2015: $36/oz and $48/oz,respectively). We believe this change will assist analysts, investors and otherstakeholders of Barrick in understanding all of the expenditures related togrowing our business.
The tables on pages 49 to 62 reconcile these non-GAAP measures to themost directly comparable IFRS measures and previous period reconciliationshave been modified to be presented in a manner consistent with our currentformat.
BARRICK THIRD QUARTER 2016 18 MANAGEMENT’S DISCUSSION AND ANALYSIS
INDEX page
Results Overview
Review of 2016 Third Quarter Results and Full YearOutlook 19Key Business Developments 23Full Year 2016 Outlook 25
Review of Second Quarter and First Quarter Results
Review of 2016 Second Quarter Financial and OperatingHighlights 26Review of 2016 First Quarter Financial and OperatingHighlights 27
Review of Third Quarter Financial Results
Revenue 29Production Costs 30Capital Expenditures 31General and Administrative Expenses 31Exploration, Evaluation and Project Costs 32Finance Costs, Net 32Additional Significant Statement of Income Items 32Income Tax Expense 33
Financial Condition Review
Balance Sheet Review 34Shareholders’ Equity 34Financial Position and Liquidity 34Summary of Cash Inflow (Outflow) 35
Operating Segments Performance 36
Cortez 37Goldstrike 38Pueblo Viejo 40Lagunas Norte 41Veladero 42Turquoise Ridge 44Acacia Mining plc 45Pascua-Lama 46
Commitments and Contingencies 47
Review of Quarterly Results 48
Internal Control over Financial Reporting andDisclosure Controls and Procedures 48
IFRS Critical Accounting Policies and AccountingEstimates 49
Non-GAAP Financial Performance Measures 49
Third Quarter 2016 49Second Quarter 2016 63First Quarter 2016 73
Technical Information 80
Endnotes 80
RESULTS OVERVIEW
Review of 2016 Third Quarter Results and Full Year Outlook
FINANCIAL AND OPERATING HIGHLIGHTSBalance Sheet and LiquidityOur liquidity position is strong and continues to improve, with robust cash flow generation, modest near-term debt repayment obligations, a $4 billion undrawncredit facility and a consolidated cash balance of $2.6 billion 1 . Net cash provided by operating activities (“operating cash flow”) was $951 million and $1,929million, respectively, for the three and nine month periods ended September 30, 2016. Free cash flow 2 was $674 million and $1,129 million, respectively,continuing the trend of positive free cash flow in six consecutive quarters.We announced in our fourth quarter 2015 MD&A our intention to reduce our total debt by at least $2 billion in 2016. We have already made debt reductions ofmore than $1.4 billion this year, including $0.5 billion in the three months ended September 30, 2016, using a combination of proceeds from our sale of BaldMountain and 50% interest in Round Mountain and free cash flow from operations. We expect to be able to meet our $2 billion target from existing cashbalances and fourth quarter operating cash flow, assuming current market prices for gold.
Cost PerformanceIn the third quarter of 2016, we continued our focus on capital discipline, identifying productivity and efficiency savings opportunities through our Best-in-Classprogram and maintaining reductions in corporate overhead. Cost of sales per ounce related to gold 3 for the three and nine month periods ended September 30,2016 were $766 and $803 per ounce, a decrease of 8% and 7% respectively, and minesite sustaining capital expenditures decreased 31% and 39% comparedto the same prior year periods. Combined with a positive change in our sales mix as a result of the divestment of our high cost mine sites, this helped us reduceour all-in sustaining costs 2 for the three and nine month periods ended September 30, 2016 by 9% and 16% to $704 and $730 per ounce, respectively,compared to the prior year periods. We are now providing cost of sales per ounce 3 guidance of $800 to $850 per ounce and we are once again lowering our2016 all-in sustaining cost guidance to $740 to $775 per ounce from $750 to $790 per ounce as we continue to focus on cost controls, capital discipline andidentify and implement Best-in-Class productivity and efficiency initiatives.
Net Earnings (Loss), Adjusted Net Earnings, Operating Cash Flow and Free Cash FlowNet earnings attributable to equity holders of Barrick (“net earnings”) for the third quarter of 2016 was $175 million compared with a net loss of $264 million in thethird quarter of 2015. This significant improvement in earnings was largely due to a $476 million goodwill impairment charge recorded in the third quarter of2015. We also benefited from higher gold prices and a decrease in operating costs owing to lower fuel and energy prices, despite a significant proportion of ouroil exposure being hedged, favorable foreign exchange movements as well as the divestment of higher cost mines. In addition, net earnings benefited from lowerexploration, evaluation and project expenses, primarily driven by lower spending at Goldrush and Pascua-Lama, partially offset by the loss of earnings from ourdivested sites and higher income tax expense. After adjusting for items that are not indicative of future operating results, adjusted net earnings 2 of $278 millionfor the third quarter of 2016 was 112% higher than the third quarter of 2015, primarily as a result of the same factors affecting net earnings, excluding the impactof the goodwill impairment charge. Significant adjusting items (pre-tax and non-controlling interest effects) in the third quarter of 2016 include:• $49 million in impairment charges primarily relating to the write down of our equity method investment in Zaldívar due to the final purchase price
adjustments recorded;• $37 million in disposition on sale losses mainly relating to the final purchase price adjustments relating to our equity method investment in Zaldívar;• $34 million in insurance proceeds relating to the 2015 oxygen plant motor failure at Pueblo Viejo;• $30 million in losses on debt extinguishment; and• $19 million in unrealized foreign currency translation losses primarily related to the Argentine peso.Refer to page 50 for a full list of reconciling items between net earnings and adjusted net earnings for the current and prior year periods. BARRICK THIRD QUARTER 2016 19 MANAGEMENT’S DISCUSSION AND ANALYSIS

Net earnings for the nine month period ended September 30, 2016 was $230 million compared to a net loss of $216 million in the same prior year period. Theimprovement in net earnings was caused by higher sales volumes (excluding the impact of divested sites) combined with higher gold prices, and decreasedoperating costs and exploration, evaluation and project expenses. These were partially offset by the realization of deferred currency translation losses inAustralia of $91 million during the first quarter 2016, combined with increased income tax expense and depreciation expense. Earnings were also impacted byimpairment charges of $492 million in 2015 compared to $54 million in 2016. After adjusting for items that are not indicative of future operating results, adjustednet earnings 2 of $563 million for the nine month period ended September 30, 2016 was 123% higher than the same prior year period primarily as a result of thesame factors affecting net earnings, excluding the impact of the impairment charges. Significant adjusting items (pre-tax and non-controlling interest effects) inthe first nine months of 2016 include:• $181 million in foreign currency translation losses, including the deferred currency translation losses released as a result of the disposal and
reorganization of certain Australian entities in the first quarter 2016 and unrealized foreign currency translation losses related to the devaluation of theArgentine Peso on VAT receivables;
• $75 million in other expense adjustments primarily relating to losses on debt extinguishment and the impact of the decrease in the discount rate for theprovision for environmental remediation at our closed mines; and
• $59 million in significant tax adjustments primarily relating to a tax provision in Acacia in the first quarter 2016.Refer to page 50 for a full list of reconciling items between net earnings and adjusted net earnings for the current and prior year periods.
BARRICK THIRD QUARTER 2016 20 MANAGEMENT’S DISCUSSION AND ANALYSIS
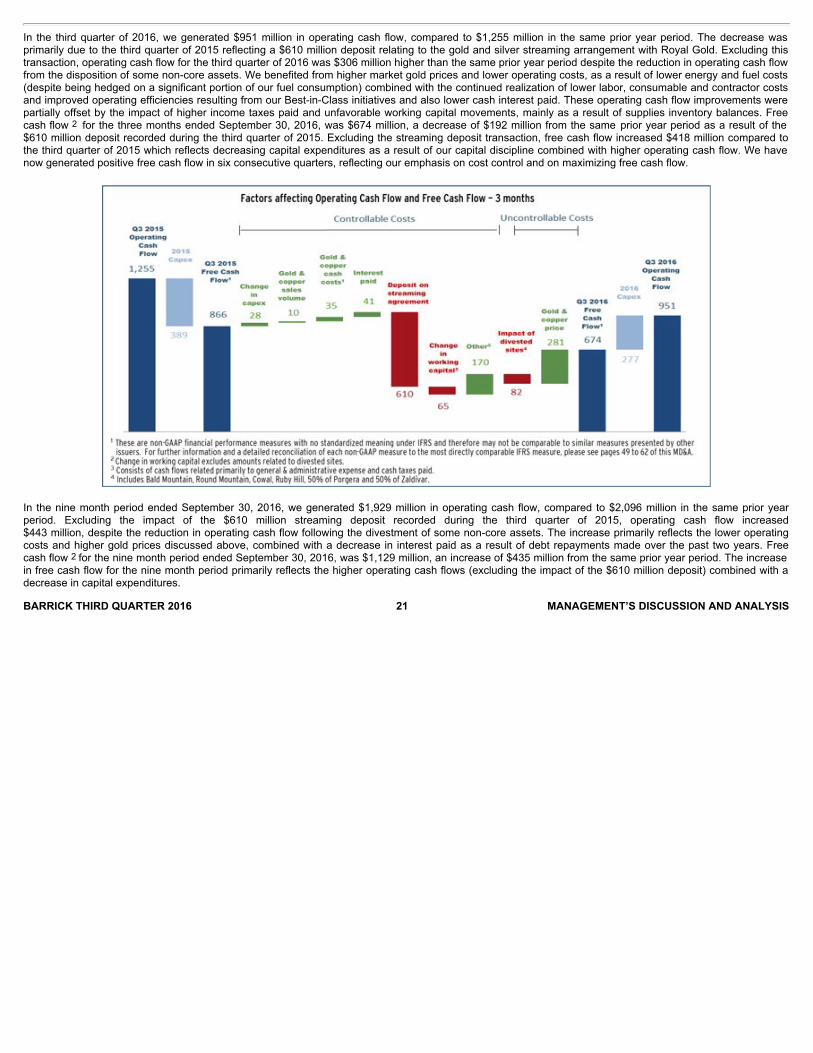
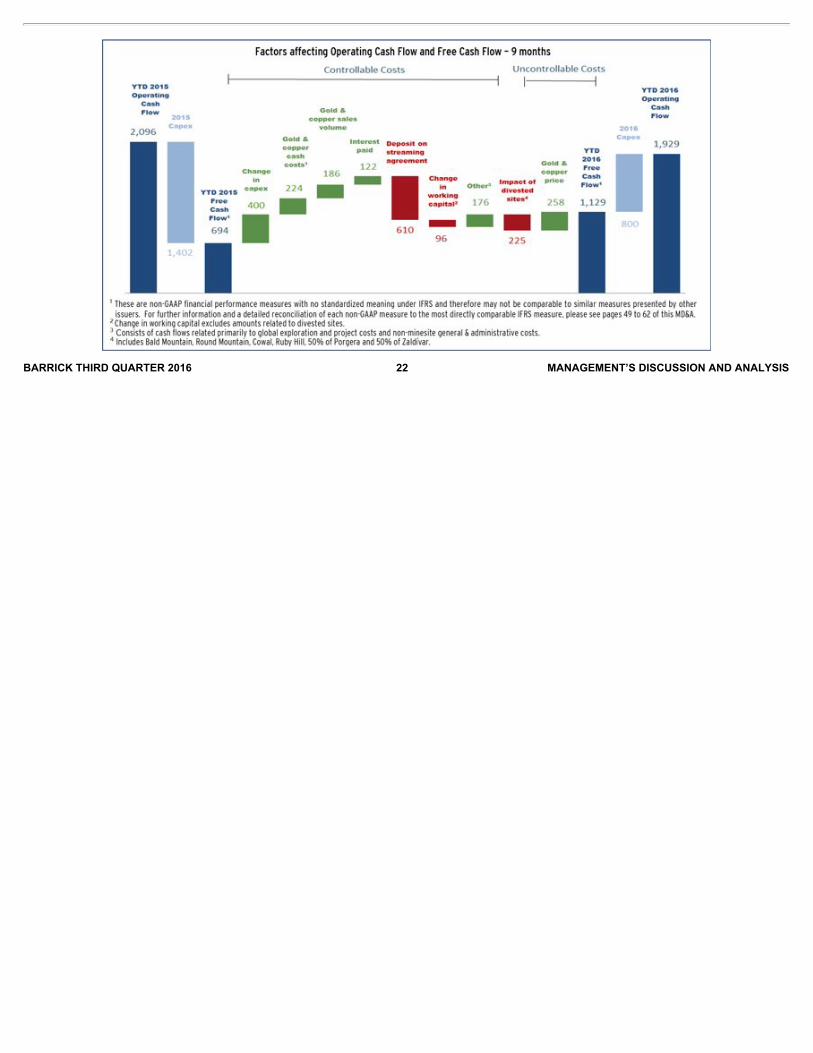
In the third quarter of 2016, we generated $951 million in operating cash flow, compared to $1,255 million in the same prior year period. The decrease wasprimarily due to the third quarter of 2015 reflecting a $610 million deposit relating to the gold and silver streaming arrangement with Royal Gold. Excluding thistransaction, operating cash flow for the third quarter of 2016 was $306 million higher than the same prior year period despite the reduction in operating cash flowfrom the disposition of some non-core assets. We benefited from higher market gold prices and lower operating costs, as a result of lower energy and fuel costs(despite being hedged on a significant portion of our fuel consumption) combined with the continued realization of lower labor, consumable and contractor costsand improved operating efficiencies resulting from our Best-in-Class initiatives and also lower cash interest paid. These operating cash flow improvements werepartially offset by the impact of higher income taxes paid and unfavorable working capital movements, mainly as a result of supplies inventory balances. Freecash flow 2 for the three months ended September 30, 2016, was $674 million, a decrease of $192 million from the same prior year period as a result of the$610 million deposit recorded during the third quarter of 2015. Excluding the streaming deposit transaction, free cash flow increased $418 million compared tothe third quarter of 2015 which reflects decreasing capital expenditures as a result of our capital discipline combined with higher operating cash flow. We havenow generated positive free cash flow in six consecutive quarters, reflecting our emphasis on cost control and on maximizing free cash flow.
In the nine month period ended September 30, 2016, we generated $1,929 million in operating cash flow, compared to $2,096 million in the same prior yearperiod. Excluding the impact of the $610 million streaming deposit recorded during the third quarter of 2015, operating cash flow increased$443 million, despite the reduction in operating cash flow following the divestment of some non-core assets. The increase primarily reflects the lower operatingcosts and higher gold prices discussed above, combined with a decrease in interest paid as a result of debt repayments made over the past two years. Freecash flow 2 for the nine month period ended September 30, 2016, was $1,129 million, an increase of $435 million from the same prior year period. The increasein free cash flow for the nine month period primarily reflects the higher operating cash flows (excluding the impact of the $610 million deposit) combined with adecrease in capital expenditures. BARRICK THIRD QUARTER 2016 21 MANAGEMENT’S DISCUSSION AND ANALYSIS
BARRICK THIRD QUARTER 2016 22 MANAGEMENT’S DISCUSSION AND ANALYSIS
Key Business Developments
BARRICK THIRD QUARTER 2016 23 MANAGEMENT’S DISCUSSION AND ANALYSIS
AcquisitionsOn June 21, 2016, we entered into an agreement to purchase the RobertsonProperty in Nevada from Coral Gold Resources (“Coral”). The transactionconsists of a payment of $16 million of cash along with the return of 4.15million shares (approximate value of $1 million) of Coral currently held byBarrick and a royalty on production. The transaction has been approved byCoral shareholders and, subject to satisfaction of the remaining closingconditions, is now expected to close in 2017.
DivestituresOn January 11, 2016, we closed the sale of our Bald Mountain mine and50% interest in the Round Mountain mine. We received net cashconsideration of $588 million, which reflected working capital adjustments of$22 million in the second quarter of 2016. The transactions resulted in a lossof $17 million for the nine month period ended September 30, 2016.
On December 1, 2015, we completed the sale of 50% of our Zaldívar coppermine in Chile to Antofagasta Plc, finalizing consideration in August 2016 at$950 million cash previously received. The finalization of considerationresulted in an additional loss on disposition of $39 million and changed thefair value of the 50% of Zaldívar we retained, resulting in a write down of ourequity method investment of $49 million.
Debt ManagementWe are committed to reducing our total debt by at least $2 billion in 2016 andhave made significant strides toward this target so far this year.Total debt was reduced by $1.4 billion in the first nine months of 2016,improving Barrick’s near-term liquidity. In particular, on March 21, 2016,Barrick completed a cash tender offer resulting in an approximately $718million reduction in the principal amount of Barrick’s outstanding notes withmaturities from 2018 to 2021; executed the make-whole provision on June24, 2016, for the full redemption of approximately $105 million ofoutstanding May 2018 notes; and also executed the make-whole provisionon September 26, 2016, for the full redemption of approximately $273 millionof outstanding September 2018 notes.
The 2016 debt reductions have resulted in losses on debt extinguishment of$30 million and $70 million, respectively, for the three and nine monthperiods ended September 30, 2016, and are expected to result in anannualized interest savings of approximately $75 million.
Jabal SayidOn July 1, 2016, Jabal Sayid, our 50% owned copper mine in Saudi Arabia,entered commercial production. Our consolidated copper guidance rangeson page 25 reflect the contribution from this new operation.
Royalty Changes in ZambiaIn July 2015, the Zambian government passed amendments to the country’smining tax regime that replaced an adopted 20% gross royalty on open pitmines with a 9% royalty, along with the reintroduction of a 30% corporateincome tax, a 50% of taxable income limitation on the utilization of tax losscarryforwards, and a 15% variable profits tax.
In June 2016, the Zambian government passed legislation to amend theroyalty tax for mining operations to a variable rate based on the prevailingcopper price effective June 1, 2016. These rates are 4% at copper pricesbelow $2.04 per pound; 5% at copper prices between $2.04 per pound and$2.72 per pound; and 6% at copper prices of $2.72 per pound and above.Legislation was also passed to remove the 15% variable profit tax on incomefrom mining companies. We determined this was an indicator of potentialreversal of impairments recorded on our Lumwana mine in the fourth quarter2014. In the second of quarter 2016, we evaluated the fair value less cost todispose (“FVLCD”); the recoverable amount was not in excess of thecarrying value and therefore no reversal was recorded. Our 2016 coppercost guidance takes into consideration the revised royalty rates commencingJune 1.
Management Structure RefinementsIn August 2016, we announced the appointment of Mark Hill as ChiefInvestment Officer and a member of Barrick’s Executive Committee, a groupof the Company’s most senior partners. In this newly-created position, Mr.Hill will chair Barrick’s Investment Committee and apply a high degree ofconsistency and rigor to all capital allocation decisions at the company–whether at existing operations, development projects, exploration (both near-mine and greenfields), or potential acquisitions and divestments.
In March 2016, Shaun Usmar, then Barrick’s Senior Executive VicePresident and Chief Financial Officer, announced his resignation fromBarrick. Catherine Raw, formerly Executive Vice President, BusinessPerformance, succeeded Mr. Usmar as Chief Financial Officer on April 27,2016, subsequent to the Company’s Annual Meeting of Shareholders. InMarch 2016, we also announced that Rob Krcmarov, formerly Senior VicePresident, Global Exploration, had been elevated to the
BARRICK THIRD QUARTER 2016 24 MANAGEMENT’S DISCUSSION AND ANALYSIS
position of Executive Vice President, Exploration and Growth, and hadbecome a member of Barrick’s Executive Committee.
Board RenewalIn 2016, the Board of Directors appointed Kelvin Dushnisky, President ofBarrick, as a director. Graham G. Clow, Chairman of Roscoe PostleAssociates Inc., and Gary Doer, former Canadian Ambassador to the UnitedStates, were elected as new directors at Barrick’s Annual General Meetingon April 26, 2016. William Birchall retired from the Board at the conclusion ofthe Company’s Annual General Meeting. Barrick continues to renew thetalent on its Board, with eight of the 13 directors elected on April 26, 2016(excluding the Executive Chairman), being new to the Company since April2014.
Hedge Summary Tables Australian Dollar (AUD) Currency Contracts
Contracts (AUD
millions)
Effective average
hedgerate
(AUDUSD)
% of total expected
AUD exposure
hedged
% of expectedoperating
cost exposure
hedged
Crystalized gain/(loss) in OCI 1 (USD
millions) 2016 - - 0% 0% (5) 1 To be reclassified from Other Comprehensive Income (“OCI”) to earnings.
Financial Fuel Hedge Summary
Barrels
(thousands) Average
price
% of total expected exposure
Impact of $10 change on pre-tax
earnings (USD millions) 1
2016 733 84 71%
3
2017 2,110 81 51% 20 2018 1,188 78 27% 33 1 Includes the impact of hedges currently in place.

BARRICK THIRD QUARTER 2016 25 MANAGEMENT’S DISCUSSION AND ANALYSIS
Full Year 2016 OutlookWe have increased our 2016 gold production guidance to 5.25 to 5.55 millionounces from our previous range of 5.0 to 5.5 million ounces.
We are now providing cost of sales per ounce 3 and per pound guidance onour share of production. For gold, our cost of sales per ounce 3 is expectedto be $800 to $850 per ounce. We expect cash costs 2 to be within a slightlynarrowed range of $540 to $565 per ounce, compared to our previousguidance range of $540 to $570 per ounce, reflecting the impact of higherby-product credits as well as continuing reductions in the costs of power,diesel and maintenance parts and supplies. We expect gold all-in sustainingcosts 2 to be in the range of $740 to $775 per ounce, compared to ourprevious guidance range of $750 to $790 per ounce, reflecting a reduction incash operating costs and in minesite sustaining capital expenditures - seedetails below.
We expect depreciation to be in the range of $240 to $260 per ounce, lowerthan our previous guidance range of $250 to $270 per ounce.
We continue to expect our 2016 copper production to be in the range of 380to 430 million pounds. We are now providing cost of sales per pound 3guidance. For copper, our cost of sales per pound 3 is expected to be $1.35to $1.55 per pound. We expect C1 cash costs 2 to be within a narrowedrange of $1.40 to $1.60 per pound, compared to our previous guidancerange of $1.35 to $1.65 per pound. We expect copper all-in sustaining costs2 to be within a narrowed range of $2.00 to $2.20 per pound, compared toour previous guidance range of $1.95 to $2.25 per pound.
We expect project expenses to be in the range of $80 to $100 millioncompared to our previous guidance range of $100 to $120 million. As aresult, we expect total exploration and project expenses to be in the range of$195 to $245 million compared to our previous guidance range of $215 to$265 million.
We expect Acacia general and administrative expenses to be approximately$60 million compared to our previous guidance range of $35 million. Theincrease in Acacia administrative expenses relates to an increase in stockbased compensation due to their higher share price.
We expect finance costs to be in the range of $710 to $750 million comparedto our previous range of $690 to $730 million. This is due to debtextinguishment fees associated with our 2016 debt reductions.
We expect minesite sustaining capital expenditures to be in the range of$1,050 to $1,100 million, slightly lower than our previous guidance range of$1,100 to $1,200 million. As a result, we
expect total capital expenditures to be in the range of $1,200 million to$1,300 million compared to our previous range of $1,250 to $1,400 million.This reflects continued plan optimization and deferral of capital expenditure,improved assumptions and realized cost savings. Full Year 2016 Outlook Summary 2016 ($ millions, except per ounce/pound data) Estimate Gold production and costs
Production (millions of ounces) 5.25 - 5.55 Gold unit production costs
Cost of sales - gold ($ per oz) 800 - 850 All-in sustaining costs ($ per oz) 1 740 - 775 Cash costs ($ per oz) 1 540 - 565 Depreciation ($ per oz) 240 - 260
Copper production and costs Production (millions of pounds) 380 - 430
Copper unit production costs Cost of sales - copper ($ per lb) 1.35 - 1.55 C1 cash costs ($ per lb) 1 1.40 - 1.60 Depreciation ($ per lb) 0.20 - 0.30 Copper all-in sustaining costs ($ per lb) 1 2.00 - 2.20
Exploration and project expenses 195 - 245 Exploration and evaluation 115 - 145 Project expenses 80 - 100
General and administrative expenses ~260 Corporate administration ~160 Stock-based compensation 2 ~40 Acacia 5 ~60
Other expense 3 20 - 40 Finance costs 710 - 750 Capital expenditures:
Minesite sustaining 1,050 - 1,100 Project 4 150 - 200
Total capital expenditures 1,200 - 1,300 Effective income tax rate ~50% Key Assumptions Gold Price ($/ounce) $ 1,250 Copper Price ($/pound) $ 2.10 Oil Price ($/barrel) $45 AUD Exchange Rate $ 0.76 ARS Exchange Rate $15 CAD Exchange Rate $ 1.30 CLP Exchange Rate 670 1 Cash costs, all-in sustaining costs and C1 cash costs are non-GAAP financial
performance measures with no standardized meaning under IFRS and thereforemay not be comparable to similar measures of performance presented by otherissuers. For further information and a detailed reconciliation of the non-GAAPmeasures used in this section of the MD&A to the most directly comparable IFRSmeasure, please see pages 49 - 62 of this MD&A.
2 Based on US$17.72 share price and excludes Acacia.3 Other expense excludes adjusting items which we cannot forecast.4 We have combined our previous capital expenditure categories of Minesite
Expansion and Projects into one category called Project.5 Includes an increase of ~$25 million in stock-based compensation.
REVIEW OF 2016 SECOND QUARTER AND FIRST QUARTER RESULTSIn connection with a continuous disclosure review by the Ontario Securities Commission, the Company has includedadditional disclosure with respect to its first and second quarter 2016 results in this MD&A to provide greater prominence to the Company’s GAAP measuresfor those periods. We have also provided GAAP reconciliations for those periods and that additional disclosure can be found on pages 63 to 79.
Review of 2016 Second Quarter Financial and Operating HighlightsBalance Sheet and LiquidityAs at June 30, 2016, our liquidity position was strong and continuing to improve, with robust cash flow generation, modest near-term debt repayment obligations,a $4 billion undrawn credit facility and a consolidated cash balance of $2.4 billion. Operating cash flow was $527 million and $978 million, respectively, for thethree and six month periods ended June 30, 2016. Free cash flow 2 was $274 million and $455 million, respectively, continuing the trend of positive free cashflow in five consecutive quarters.
We announced in our fourth quarter 2015 MD&A our intention to reduce our total debt by at least $2 billion in 2016 through the following levers: drawing on ourcash balance; delivering free cash flow from operations; selling additional non-core assets; and creating new joint ventures and partnerships. We had made debtreductions of $968 million through June 30, 2016, using a combination of proceeds of our sale of Bald Mountain and 50% interest in Round Mountain and freecash flow from operations.
Cost PerformanceIn the second quarter of 2016, we continued our focus on capital discipline, identifying productivity and efficiency savings opportunities through our Best-in-Classprogram and maintaining reductions in corporate overhead. Cost of sales per ounce related to gold 3 for the three and six month periods ended June 30, 2016were $836 and $823 per ounce and decreased 3% and 7%, respectively, as a result of lower inventory impairments and the impact of 2015 year-endimpairments on minesite depreciation. Minesite sustaining capital expenditures decreased 35% and 43% compared to the same prior year periods, combinedwith positive sales mix as a result of the divestment of our high cost mine sites helped us reduce our all-in sustaining costs 2 for the three and six month periodsended June 30, 2016 by 13% and 19% to $782 and $744 per ounce, respectively, compared to the prior year periods.
Net Earnings (Loss), Adjusted Net Earnings, Operating Cash Flow and Free Cash FlowNet earnings for the second quarter of 2016 was $138 million compared with a net loss of $9 million in the second quarter of 2015. This was largely due to adecrease in operating costs owing to lower fuel and energy prices, even despite a significant proportion of our oil exposure being hedged, as well as favorableforeign exchange movements and the impact of Best-in-Class initiatives. These initiatives include lower labor, contractor and consumable costs and improvedoperating efficiencies. In addition earnings benefited from lower exploration, evaluation and project expenses. This was further impacted by higher sales volumes(excluding the impact of divested sites) and higher gold prices, partially offset by higher income tax expense and non-controlling interests. After adjusting foritems that are not indicative of future operating results, adjusted net earnings 2 of $158 million for the second quarter of 2016 was 163% higher than the secondquarter of 2015, primarily as a result of the same factors affecting net earnings as there were no significant adjusting items in the second quarter of 2016. Referto pages 63 to 72 for a full list of reconciling items between net earnings and adjusted net earnings for the current and prior year periods.
Net earnings for the first half of 2016 was $55 million compared to net earnings of $48 million in the same prior year period, largely impacted by higher salesvolumes (excluding the impact of divested sites) combined with higher gold prices. This was further impacted by the decrease in operating costs discussedabove and decreased exploration, evaluation and project expenses. These were partially offset by the realization of deferred currency translation losses,primarily related to losses released upon the disposal and reorganization of certain Australian entities during the first quarter 2016, combined with increasedincome tax expense. After adjusting for items that are not indicative BARRICK THIRD QUARTER 2016 26 MANAGEMENT’S DISCUSSION AND ANALYSIS
of future operating results, adjusted net earnings 2 of $285 million for the first half of 2016 was 134% higher than the same prior year period primarily as a resultof the same factors affecting net earnings. Significant adjusting items (pre-tax and non-controlling interest effects) in the first half of 2016 include:• $162 million in foreign currency translation losses, including the deferred currency translation losses released as a result of the disposal and reorganization
of certain Australian entities in the first quarter 2016 and unrealized foreign currency translation losses related to the devaluation of the Argentine Peso onVAT receivables;
• $74 million in other expense adjustments primarily relating to losses on debt extinguishment and the impact of the decrease in the discount rate for theprovision for environmental remediation at our closed mines; and
• $54 million in significant tax adjustments primarily relating to a tax provision in Acacia in the first quarter 2016.Refer to page 63 for a full list of reconciling items between net earnings and adjusted net earnings for the current and prior year periods.
In the second quarter of 2016, we generated $527 million in operating cash flow, in line with the same prior year period of $525 million, despite the reduction inoperating cash flow following the divestment of certain non-core assets. The benefit of higher gold prices and lower operating costs, as a result of lower energyand fuel costs (despite being hedged on a significant portion of our fuel consumption) combined with the continued realization of lower labor, consumable andcontractor costs and improved operating efficiencies resulting from our Best-in-Class initiatives, was partially offset by unfavorable working capital movements,primarily related to an increase in accounts receivable, as a result of the sale of equipment at Pascua-Lama, and in inventory balances, combined with theimpact of higher income taxes paid compared to the same prior year period. Free cash flow 2 for the three months ended June 30, 2016, was $274 million, anincrease of $248 million from the same prior year period. The increase in free cash flow for the second quarter of 2016 primarily reflects decreasing capitalexpenditures as a result of our capital discipline combined with operating cash flow that was in line with the same prior year period. We have now generatedpositive free cash flow in five consecutive quarters, reflecting our emphasis on cost control and on maximizing free cash flow.
In the first half of 2016, we generated $978 million in operating cash flow, compared to $841 million in the same prior year period, despite the reduction inoperating cash flow following the divestment of some non-core assets. The increase in operating cash flow primarily reflects the lower operating costs and highergold prices discussed above, combined with a decrease in interest paid as a result of debt repayments made over the past 18 months. Free cash flow 2 for thesix month period ended June 30, 2016, was $455 million, an increase of $627 million from the same prior year period. The increase in free cash flow for the sixmonth period primarily reflects the higher operating cash flows combined with the impact of a decrease in capital expenditures.
Refer to pages 63 to 72 for detailed second quarter reconciliations of each non-GAAP measure to the most directly comparable IFRS measure.
Review of 2016 First Quarter Results Financial and Operating HighlightsBalance Sheet and LiquidityAs at March 31, 2016, our liquidity position was strong and continuing to improve, with robust cash flow generation, modest near-term debt repaymentobligations, a $4 billion undrawn credit facility and a consolidated cash balance of $2.3 billion. Operating cash flow was $451 million in the first quarter of 2016and free cash flow 2 was $181 million, continuing the trend of positive free cash flow in four consecutive quarters.
We announced in our fourth quarter 2015 MD&A our intention to reduce our total debt by at least $2 billion in 2016through the following levers: drawing on our cash balance; delivering free cash flow from operations; selling additional non-core assets; and creating new jointventures and partnerships. We had made debt reductions of $842 million in the first quarter of 2016, using a combination of proceeds of our sale of BaldMountain and 50% interest in Round Mountain and free cash flow from operations. BARRICK THIRD QUARTER 2016 27 MANAGEMENT’S DISCUSSION AND ANALYSIS
Cost PerformanceIn the first quarter of 2016, we continued our focus on disciplined capital allocation and lower capital spending. Efforts to reduce corporate overhead and otheroperating cost savings, including the impact of lower fuel costs and favorable foreign exchange rates led to lower cost of sales. Cost of sales per ounce relatedto gold 3 for the three month period ended March 31, 2016 was $810 per ounce, a decrease of 10%, and minesite sustaining capital expenditures decreased50% compared to the same prior year period. Together these helped us to achieve a 24% reduction in our all-in sustaining costs 2 over the same prior yearperiod to $706 per ounce in the first quarter of 2016.
Net Loss, Adjusted Net Earnings, Operating Cash Flow and Free Cash FlowThe net loss for the first quarter of 2016 was $83 million compared to net earnings of $57 million in the same prior year period, largely impacted by lower salesvolumes primarily due to the impact of the asset sales that occurred in the second half of 2015 and the first quarter of 2016 combined with lower realized prices.This was further impacted by the realization of $54 million of deferred currency translation losses released upon the disposal and reorganization of certainAustralian entities during the first quarter of 2016. These were partially offset by a decrease in direct operating costs as a result of lower energy and fuel pricesand as some of our Best-in-Class initiatives started to be realized resulting in lower labor and contractor costs along with improved operating efficiencies.Adjusted net earnings 2 of $127 million were 105% higher than the same prior year period despite lower realized prices, primarily due to the reduction inoperating costs as discussed above, higher sales volumes (excluding the impact of divested sites) as well as lower exploration and evaluation costs as a resultof lower spending on Pascua-Lama and global exploration costs. This was partly offset by higher income tax expense and the earnings impact associated withthe divested sites. Significant adjusting items (pre-tax and non-controlling interest effects) in the first quarter of 2016 include:• $139 million in foreign currency translation losses, including deferred currency translation losses released as a result of the disposal and reorganization of
certain Australian entities and unrealized foreign currency translation losses primarily related to the impact of the devaluation of the Argentine Peso on VATreceivables;
• $37 million in losses on the extinguishment of debt; and• $25 million in losses reflecting the impact of the decrease in the discount rate used to calculate the provision for environment remediation at our closed
mines.Refer to page 73 for a full reconciliation of first quarter 2016 adjusted net income. Please note that these items were presented on a post-tax and non-controlling interest basis in our first quarter 2016 MD&A and have been restated to conform with the change to adjusted net earnings presentation identified onpage 17.
Operating cash flow of $451 million was 43% higher compared to the same prior year period despite lower realized prices, reflecting lower operating costs as aresult of lower energy and fuel prices and as some of our Best-in-Class initiatives started to be realized resulting in lower labor and contractor costs along withimproved operating efficiencies. Other factors impacting operating cash flow in the first quarter of 2016 included a decrease in income taxes paid, higher salesvolumes (excluding the impact of divested sites), partially offset by the impact of divested sites. Free cash flow 2 for the first quarter of 2016 was $181 million,reflecting an increase of $379 million from the same prior year period despite lower realized prices. The inflow primarily reflects higher operating cash flows as aresult of lower operating costs and higher sales volumes (excluding the impact of divested sites), combined with decreased capital expenditures as a result ofour disciplined capital allocation approach. These factors were partly offset by operating cash flows associated with divested sites. We have now generatedpositive free cash flow in four consecutive quarters, reflecting our emphasis on cost control and maximizing free cash flow.
Refer to pages 73 to 79 for detailed first quarter reconciliations of each non-GAAP measure to the most directly comparable IFRS measure. BARRICK THIRD QUARTER 2016 28 MANAGEMENT’S DISCUSSION AND ANALYSIS
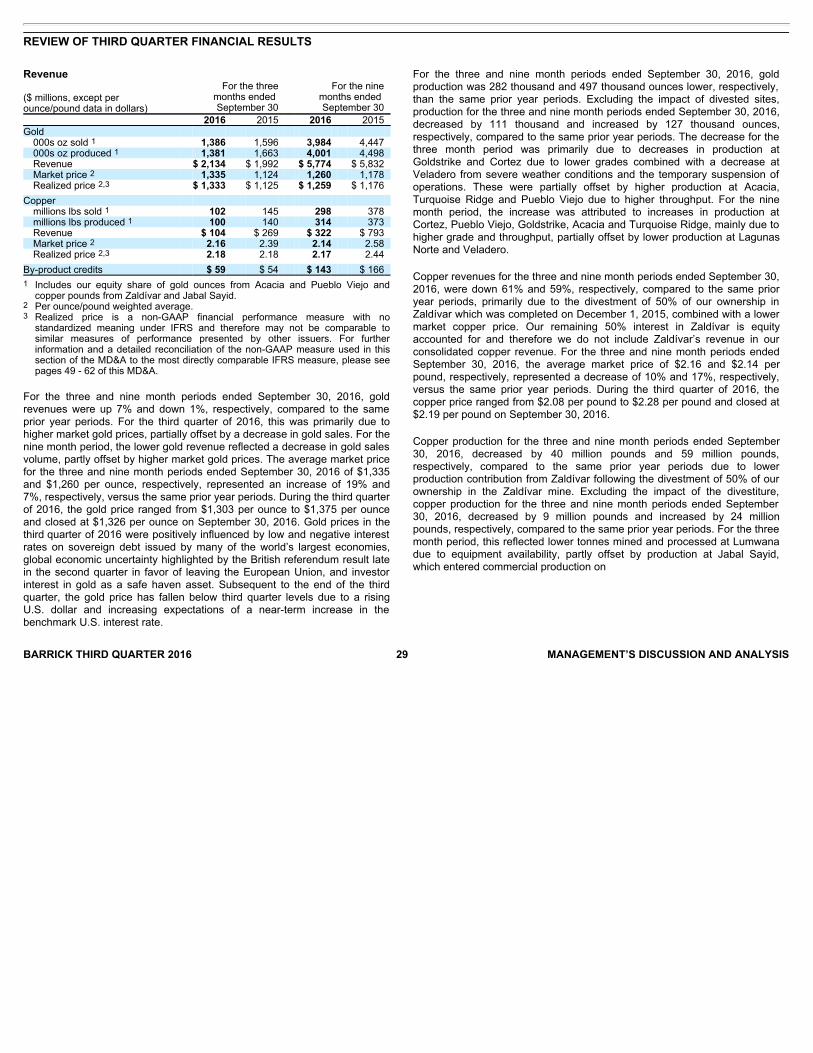
REVIEW OF THIRD QUARTER FINANCIAL RESULTS
BARRICK THIRD QUARTER 2016 29 MANAGEMENT’S DISCUSSION AND ANALYSIS
Revenue
($ millions, except per ounce/pound data in dollars)
For the threemonths ended September 30
For the ninemonths ended September 30
2016 2015 2016 2015 Gold
000s oz sold 1 1,386 1,596 3,984 4,447 000s oz produced 1 1,381 1,663 4,001 4,498 Revenue $ 2,134 $ 1,992 $ 5,774 $ 5,832 Market price 2 1,335 1,124 1,260 1,178 Realized price 2,3 $ 1,333 $ 1,125 $ 1,259 $ 1,176
Copper millions lbs sold 1 102 145 298 378 millions lbs produced 1 100 140 314 373 Revenue $ 104 $ 269 $ 322 $ 793 Market price 2 2.16 2.39 2.14 2.58 Realized price 2,3 2.18 2.18 2.17 2.44
By-product credits $ 59 $ 54 $ 143 $ 166 1 Includes our equity share of gold ounces from Acacia and Pueblo Viejo and
copper pounds from Zaldívar and Jabal Sayid.2 Per ounce/pound weighted average.3 Realized price is a non-GAAP financial performance measure with no
standardized meaning under IFRS and therefore may not be comparable tosimilar measures of performance presented by other issuers. For furtherinformation and a detailed reconciliation of the non-GAAP measure used in thissection of the MD&A to the most directly comparable IFRS measure, please seepages 49 - 62 of this MD&A.
For the three and nine month periods ended September 30, 2016, goldrevenues were up 7% and down 1%, respectively, compared to the sameprior year periods. For the third quarter of 2016, this was primarily due tohigher market gold prices, partially offset by a decrease in gold sales. For thenine month period, the lower gold revenue reflected a decrease in gold salesvolume, partly offset by higher market gold prices. The average market pricefor the three and nine month periods ended September 30, 2016 of $1,335and $1,260 per ounce, respectively, represented an increase of 19% and7%, respectively, versus the same prior year periods. During the third quarterof 2016, the gold price ranged from $1,303 per ounce to $1,375 per ounceand closed at $1,326 per ounce on September 30, 2016. Gold prices in thethird quarter of 2016 were positively influenced by low and negative interestrates on sovereign debt issued by many of the world’s largest economies,global economic uncertainty highlighted by the British referendum result latein the second quarter in favor of leaving the European Union, and investorinterest in gold as a safe haven asset. Subsequent to the end of the thirdquarter, the gold price has fallen below third quarter levels due to a risingU.S. dollar and increasing expectations of a near-term increase in thebenchmark U.S. interest rate.
For the three and nine month periods ended September 30, 2016, goldproduction was 282 thousand and 497 thousand ounces lower, respectively,than the same prior year periods. Excluding the impact of divested sites,production for the three and nine month periods ended September 30, 2016,decreased by 111 thousand and increased by 127 thousand ounces,respectively, compared to the same prior year periods. The decrease for thethree month period was primarily due to decreases in production atGoldstrike and Cortez due to lower grades combined with a decrease atVeladero from severe weather conditions and the temporary suspension ofoperations. These were partially offset by higher production at Acacia,Turquoise Ridge and Pueblo Viejo due to higher throughput. For the ninemonth period, the increase was attributed to increases in production atCortez, Pueblo Viejo, Goldstrike, Acacia and Turquoise Ridge, mainly due tohigher grade and throughput, partially offset by lower production at LagunasNorte and Veladero.
Copper revenues for the three and nine month periods ended September 30,2016, were down 61% and 59%, respectively, compared to the same prioryear periods, primarily due to the divestment of 50% of our ownership inZaldívar which was completed on December 1, 2015, combined with a lowermarket copper price. Our remaining 50% interest in Zaldívar is equityaccounted for and therefore we do not include Zaldívar’s revenue in ourconsolidated copper revenue. For the three and nine month periods endedSeptember 30, 2016, the average market price of $2.16 and $2.14 perpound, respectively, represented a decrease of 10% and 17%, respectively,versus the same prior year periods. During the third quarter of 2016, thecopper price ranged from $2.08 per pound to $2.28 per pound and closed at$2.19 per pound on September 30, 2016.
Copper production for the three and nine month periods ended September30, 2016, decreased by 40 million pounds and 59 million pounds,respectively, compared to the same prior year periods due to lowerproduction contribution from Zaldívar following the divestment of 50% of ourownership in the Zaldívar mine. Excluding the impact of the divestiture,copper production for the three and nine month periods ended September30, 2016, decreased by 9 million pounds and increased by 24 millionpounds, respectively, compared to the same prior year periods. For the threemonth period, this reflected lower tonnes mined and processed at Lumwanadue to equipment availability, partly offset by production at Jabal Sayid,which entered commercial production on
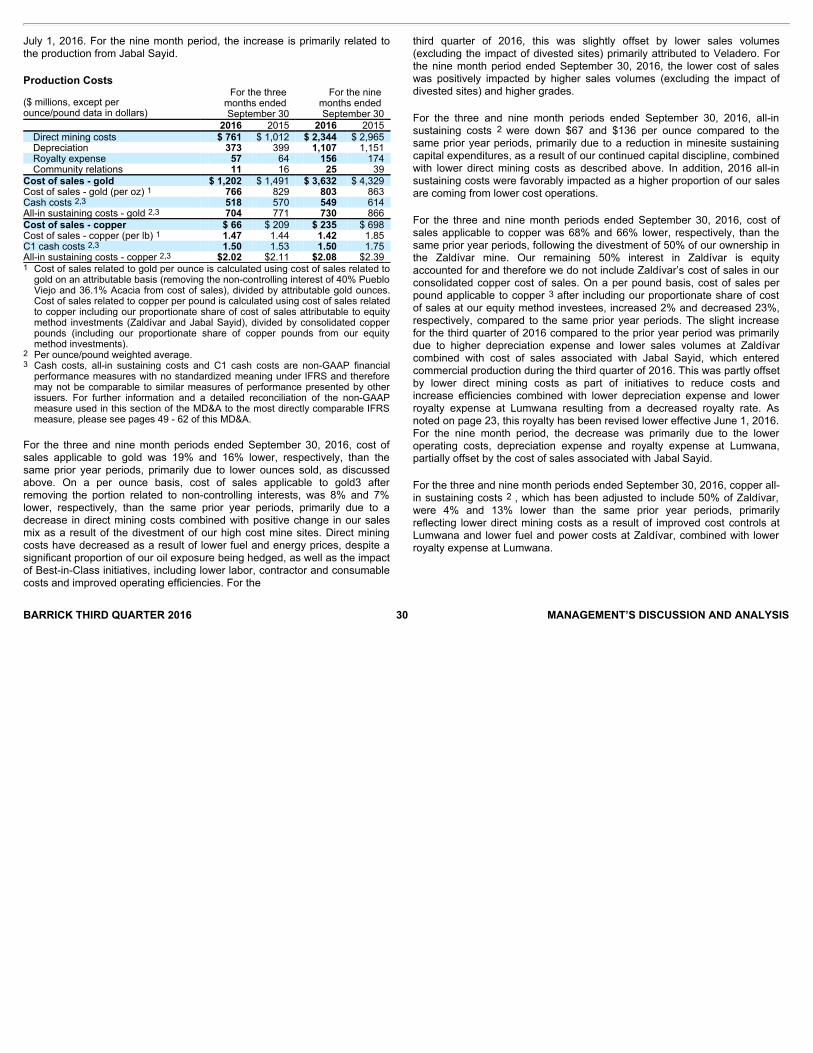
BARRICK THIRD QUARTER 2016 30 MANAGEMENT’S DISCUSSION AND ANALYSIS
July 1, 2016. For the nine month period, the increase is primarily related tothe production from Jabal Sayid.
Production Costs
($ millions, except perounce/pound data in dollars)
For the three months ended September 30
For the nine months ended September 30
2016 2015 2016 2015 Direct mining costs $ 761 $ 1,012 $ 2,344 $ 2,965 Depreciation 373 399 1,107 1,151 Royalty expense 57 64 156 174 Community relations 11 16 25 39
Cost of sales - gold $ 1,202 $ 1,491 $ 3,632 $ 4,329 Cost of sales - gold (per oz) 1 766 829 803 863 Cash costs 2,3 518 570 549 614 All-in sustaining costs - gold 2,3 704 771 730 866 Cost of sales - copper $ 66 $ 209 $ 235 $ 698 Cost of sales - copper (per lb) 1 1.47 1.44 1.42 1.85 C1 cash costs 2,3 1.50 1.53 1.50 1.75 All-in sustaining costs - copper 2,3 $2.02 $2.11 $2.08 $2.39 1 Cost of sales related to gold per ounce is calculated using cost of sales related to
gold on an attributable basis (removing the non-controlling interest of 40% PuebloViejo and 36.1% Acacia from cost of sales), divided by attributable gold ounces.Cost of sales related to copper per pound is calculated using cost of sales relatedto copper including our proportionate share of cost of sales attributable to equitymethod investments (Zaldívar and Jabal Sayid), divided by consolidated copperpounds (including our proportionate share of copper pounds from our equitymethod investments).
2 Per ounce/pound weighted average.3 Cash costs, all-in sustaining costs and C1 cash costs are non-GAAP financial
performance measures with no standardized meaning under IFRS and thereforemay not be comparable to similar measures of performance presented by otherissuers. For further information and a detailed reconciliation of the non-GAAPmeasure used in this section of the MD&A to the most directly comparable IFRSmeasure, please see pages 49 - 62 of this MD&A.
For the three and nine month periods ended September 30, 2016, cost ofsales applicable to gold was 19% and 16% lower, respectively, than thesame prior year periods, primarily due to lower ounces sold, as discussedabove. On a per ounce basis, cost of sales applicable to gold3 afterremoving the portion related to non-controlling interests, was 8% and 7%lower, respectively, than the same prior year periods, primarily due to adecrease in direct mining costs combined with positive change in our salesmix as a result of the divestment of our high cost mine sites. Direct miningcosts have decreased as a result of lower fuel and energy prices, despite asignificant proportion of our oil exposure being hedged, as well as the impactof Best-in-Class initiatives, including lower labor, contractor and consumablecosts and improved operating efficiencies. For the
third quarter of 2016, this was slightly offset by lower sales volumes(excluding the impact of divested sites) primarily attributed to Veladero. Forthe nine month period ended September 30, 2016, the lower cost of saleswas positively impacted by higher sales volumes (excluding the impact ofdivested sites) and higher grades.
For the three and nine month periods ended September 30, 2016, all-insustaining costs 2 were down $67 and $136 per ounce compared to thesame prior year periods, primarily due to a reduction in minesite sustainingcapital expenditures, as a result of our continued capital discipline, combinedwith lower direct mining costs as described above. In addition, 2016 all-insustaining costs were favorably impacted as a higher proportion of our salesare coming from lower cost operations.
For the three and nine month periods ended September 30, 2016, cost ofsales applicable to copper was 68% and 66% lower, respectively, than thesame prior year periods, following the divestment of 50% of our ownership inthe Zaldívar mine. Our remaining 50% interest in Zaldívar is equityaccounted for and therefore we do not include Zaldívar’s cost of sales in ourconsolidated copper cost of sales. On a per pound basis, cost of sales perpound applicable to copper 3 after including our proportionate share of costof sales at our equity method investees, increased 2% and decreased 23%,respectively, compared to the same prior year periods. The slight increasefor the third quarter of 2016 compared to the prior year period was primarilydue to higher depreciation expense and lower sales volumes at Zaldívarcombined with cost of sales associated with Jabal Sayid, which enteredcommercial production during the third quarter of 2016. This was partly offsetby lower direct mining costs as part of initiatives to reduce costs andincrease efficiencies combined with lower depreciation expense and lowerroyalty expense at Lumwana resulting from a decreased royalty rate. Asnoted on page 23, this royalty has been revised lower effective June 1, 2016.For the nine month period, the decrease was primarily due to the loweroperating costs, depreciation expense and royalty expense at Lumwana,partially offset by the cost of sales associated with Jabal Sayid.
For the three and nine month periods ended September 30, 2016, copper all-in sustaining costs 2 , which has been adjusted to include 50% of Zaldívar,were 4% and 13% lower than the same prior year periods, primarilyreflecting lower direct mining costs as a result of improved cost controls atLumwana and lower fuel and power costs at Zaldívar, combined with lowerroyalty expense at Lumwana.
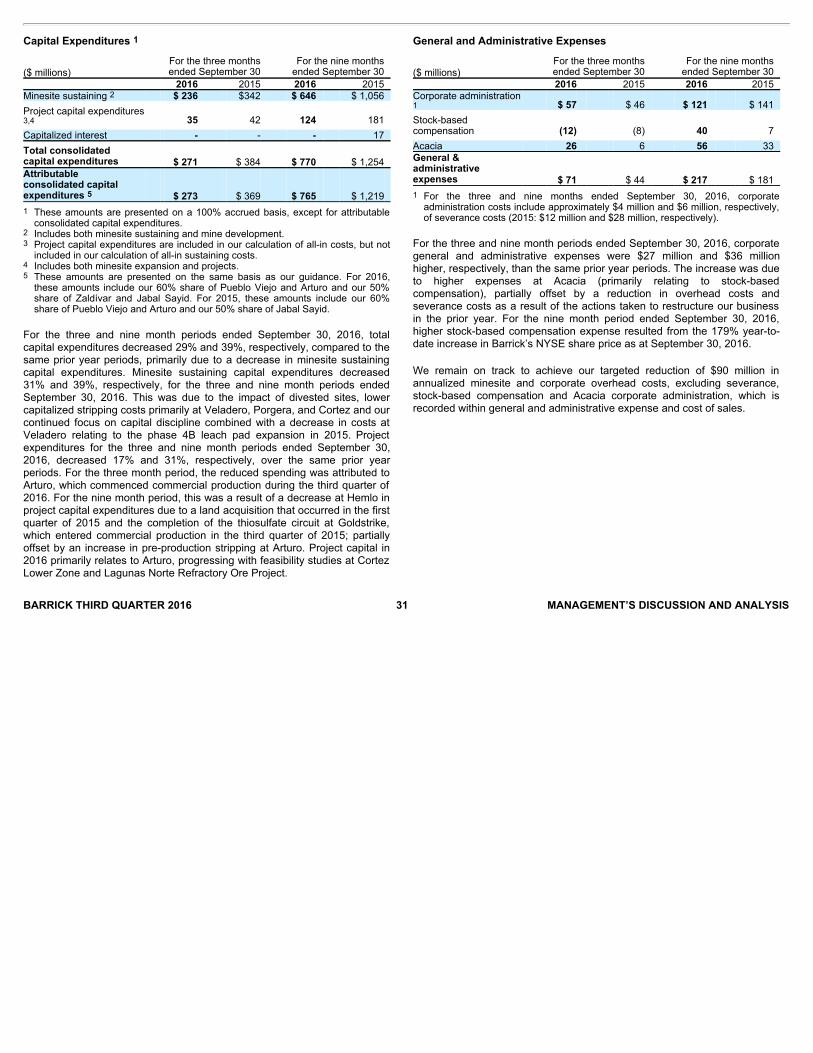
BARRICK THIRD QUARTER 2016 31 MANAGEMENT’S DISCUSSION AND ANALYSIS
Capital Expenditures 1
($ millions) For the three monthsended September 30
For the nine monthsended September 30
2016 2015 2016 2015 Minesite sustaining 2 $ 236 $342 $ 646 $ 1,056 Project capital expenditures3,4 35 42 124 181 Capitalized interest - - - 17 Total consolidatedcapital expenditures $ 271 $ 384 $ 770 $ 1,254 Attributableconsolidated capitalexpenditures 5 $ 273 $ 369 $ 765 $ 1,219
1 These amounts are presented on a 100% accrued basis, except for attributableconsolidated capital expenditures.
2 Includes both minesite sustaining and mine development.3 Project capital expenditures are included in our calculation of all-in costs, but not
included in our calculation of all-in sustaining costs.4 Includes both minesite expansion and projects.5 These amounts are presented on the same basis as our guidance. For 2016,
these amounts include our 60% share of Pueblo Viejo and Arturo and our 50%share of Zaldívar and Jabal Sayid. For 2015, these amounts include our 60%share of Pueblo Viejo and Arturo and our 50% share of Jabal Sayid.
For the three and nine month periods ended September 30, 2016, totalcapital expenditures decreased 29% and 39%, respectively, compared to thesame prior year periods, primarily due to a decrease in minesite sustainingcapital expenditures. Minesite sustaining capital expenditures decreased31% and 39%, respectively, for the three and nine month periods endedSeptember 30, 2016. This was due to the impact of divested sites, lowercapitalized stripping costs primarily at Veladero, Porgera, and Cortez and ourcontinued focus on capital discipline combined with a decrease in costs atVeladero relating to the phase 4B leach pad expansion in 2015. Projectexpenditures for the three and nine month periods ended September 30,2016, decreased 17% and 31%, respectively, over the same prior yearperiods. For the three month period, the reduced spending was attributed toArturo, which commenced commercial production during the third quarter of2016. For the nine month period, this was a result of a decrease at Hemlo inproject capital expenditures due to a land acquisition that occurred in the firstquarter of 2015 and the completion of the thiosulfate circuit at Goldstrike,which entered commercial production in the third quarter of 2015; partiallyoffset by an increase in pre-production stripping at Arturo. Project capital in2016 primarily relates to Arturo, progressing with feasibility studies at CortezLower Zone and Lagunas Norte Refractory Ore Project.
General and Administrative Expenses
($ millions) For the three monthsended September 30
For the nine monthsended September 30
2016 2015 2016 2015 Corporate administration1 $ 57 $ 46 $ 121 $ 141 Stock-basedcompensation (12) (8) 40 7 Acacia 26 6 56 33 General &administrativeexpenses $ 71 $ 44 $ 217 $ 181
1 For the three and nine months ended September 30, 2016, corporateadministration costs include approximately $4 million and $6 million, respectively,of severance costs (2015: $12 million and $28 million, respectively).
For the three and nine month periods ended September 30, 2016, corporategeneral and administrative expenses were $27 million and $36 millionhigher, respectively, than the same prior year periods. The increase was dueto higher expenses at Acacia (primarily relating to stock-basedcompensation), partially offset by a reduction in overhead costs andseverance costs as a result of the actions taken to restructure our businessin the prior year. For the nine month period ended September 30, 2016,higher stock-based compensation expense resulted from the 179% year-to-date increase in Barrick’s NYSE share price as at September 30, 2016.
We remain on track to achieve our targeted reduction of $90 million inannualized minesite and corporate overhead costs, excluding severance,stock-based compensation and Acacia corporate administration, which isrecorded within general and administrative expense and cost of sales.

BARRICK THIRD QUARTER 2016 32 MANAGEMENT’S DISCUSSION AND ANALYSIS
Exploration, Evaluation and Project Costs
($ millions) For the three monthsended September 30
For the nine monthsended September 30
2016 2015 2016 2015 Minesite explorationand evaluation $ 10 $ 11 $ 26 $ 36 Global exploration andevaluation 17 20 62 92 Advanced projectcosts:
Pascua-Lama 10 30 40 86 Cerro Casale 1 1 4 5 Other 2 2 7 2
Corporatedevelopment 1 17 3 34 Business improvement 3 5 13 14 Global exploration andevaluation and projectexpense $ 34 $ 75 $ 129 $ 233 Total exploration,evaluation andproject expenses $ 44 $ 86 $ 155 $ 269
Exploration, evaluation and project costs for the three and nine monthperiods ended September 30, 2016, decreased $42 million and $114 million,respectively, compared to the same prior year periods. The decrease isprimarily due to a decrease in project costs at Pascua-Lama ($20 million and$46 million, respectively) combined with a decrease in corporatedevelopment costs ($16 million and $31 million, respectively). In addition, thenine month period had a $30 million decrease in global exploration costsprimarily relating to Goldrush as the project has progressed to the studyphase.
Finance Costs, Net
($ millions) For the three monthsended September 30
For the nine monthsended September 30
2016 2015 2016 2015 Interest expense 1 $ 146 $ 184 $ 451 $ 549 Accretion 11 17 37 48 Loss on debtextinguishment 30 - 70 - Other finance costs 5 6 14 - Finance income (3) (2) (10) (6) Finance costs, net $ 189 $ 205 $ 562 $ 591
1 For the three and nine months ended September 30, 2016, interest expenseincludes approximately $25 million and $75 million, respectively, of interestexpense relating to the gold and silver streaming agreements with SilverWheaton Corp. and Royal Gold, Inc. (2015: $15 million and $46 million,respectively).
For the three and nine month periods ended September 30, 2016, netfinance costs were $16 million and $29 million lower, respectively, than thesame prior year periods, primarily due to lower interest expense as a resultof debt reductions made over
the past two years, partially offset by an increase of $10 million and $29million, respectively, of interest expense on our gold and silver streamingagreements. The interest savings was further offset by the recognition of a$30 million and a $70 million loss in the three and nine month periods endedSeptember 30, 2016 respectively, on extinguishment costs arising from thedebt repurchases made throughout the year.
Additional Significant Statement of Income Items
($ millions) For the three monthsended September 30
For the nine monthsended September 30
2016 2015 2016 2015 Impairment charges $ 49 $ 452 $ 54 $ 492 Loss (income) on currency translation $ 19 ($ 43) $ 181 ($ 12) Other expense/(income) $ 39 ($ 45) $ 42 ($ 31)
Impairment ChargesFor the three and nine month periods ended September 30, 2016,impairment charges of $49 million and $54 million were incurred,respectively, compared to $452 million and $492 million, respectively, in thesame prior year periods. Impairment charges in the third quarter of 2016 andthe nine month period ended September 30, 2016 primarily relate to the $49million write down of our equity method investment in Zaldívar due to thefinal purchase price adjustments. Impairment charges in the same prior yearperiods mainly reflect a $476 million goodwill impairment charge recorded forZaldívar upon reclassification of the mine’s net assets as held-for-sale in thethird quarter of 2015.
Loss (income) on currency translationLoss on currency translation for the three and nine month periods endedSeptember 30, 2016, increased $62 million and $193 million, respectively,compared to the same prior year periods. The increased loss for the threemonth period is mainly due to the impact of the devaluation of the Zambiankwacha on payables in the prior year period combined with the devaluationof the Argentine peso in the current year period mainly on VAT receivables.The increased loss for the nine month period is primarily due to the releaseof $91 million of currency translation losses as a result of the disposal andreorganization of certain Australian entities during the first quarter 2016. Thiswas combined with unrealized foreign currency

BARRICK THIRD QUARTER 2016 33 MANAGEMENT’S DISCUSSION AND ANALYSIS
translation losses primarily related to the devaluation of the Argentine pesoon VAT receivables.
Other Expense (Income)Other expense of $39 million and $42 million for the three and nine monthperiods ended September 30, 2016, respectively, decreased from income of$45 million and $31 million, respectively, in the same prior year periods. Theexpense in the current year was primarily due to a $39 million additional losson disposition relating to Zaldivar as a result of the final purchase priceadjustments recorded in the third quarter of 2016. The income for the prioryear periods were primarily a result of the realization of gains on the sale ofour Cowal mine and 50% of our interest in the Porgera mine, which closed inthe third quarter of 2015; partly offset by $31 million in office closure costsprimarily relating to the exiting of leases at our Toronto and Salt Lake Cityoffices. For a further breakdown of other expense (income), refer to note 9 tothe Financial Statements.
Income Tax ExpenseIncome tax expense was $335 million in the third quarter of 2016. Theunderlying effective tax rate for ordinary income in the third quarter of 2016was 49.5% after adjusting for the net impact of currency translation losses ondeferred tax balances; the impact of impairment charges; the impact of assetsales and non-hedge derivatives; and the impact of non-deductible foreignexchange losses. The unadjusted tax rate for income in the third quarter of2016 was 58% of the income before income taxes.
We record deferred tax charges or credits if changes in facts orcircumstances affect the estimated tax basis of assets and therefore theamount of deferred tax assets or liabilities to reflect changing expectations inour ability to realize deferred tax assets. The interpretation of tax regulationsand legislation and their application to our business is complex and subjectto change. We have significant amounts of deferred tax assets, including taxloss carry forwards, and also deferred tax liabilities. Potential changes of anyof these amounts, as well as our ability to realize deferred tax assets, couldsignificantly affect net income or cash flow in future periods.

FINANCIAL CONDITION REVIEW
Summary Balance Sheet and Key Financial Ratios ($ millions, except ratios and share amounts)
As at September 30, 2016
As at December 31, 2015 Total cash and equivalents $ 2,648 $ 2,455 Current assets 2,576 3,013 Non-current assets 20,404 20,840 Total Assets $ 25,628 $ 26,308 Current liabilities excluding short-term debt $ 1,806 $ 1,644 Non-current liabilities excluding long-term debt 5,441 5,241 Debt (current and long-term) 8,539 9,968 Total Liabilities $ 15,786 $ 16,853 Total shareholders’ equity 7,518 7,178 Non-controlling interests 2,324 2,277 Total Equity $ 9,842 $ 9,455 Total common shares outstanding (millions of shares) 1 1,165 1,165 Key Financial Ratios:
Current ratio 2 2.67:1 2.77:1 Debt-to-equity 3 0.87:1 1.05:1
1 Total common shares outstanding do not include 2.4 million stock options.2 Represents current assets (excluding assets held-for-sale) divided by current liabilities (including short-term debt and excluding liabilities held-for-sale) as at September 30,
2016 and December 31, 2015.3 Represents debt divided by total shareholders’ equity (including minority interest) as at September 30, 2016 and December 31, 2015.
BARRICK THIRD QUARTER 2016 34 MANAGEMENT’S DISCUSSION AND ANALYSIS
Balance Sheet ReviewTotal assets were $25.6 billion at September 30, 2016,approximately $0.7 billion lower than at December 31, 2015,primarily reflecting the sale of Bald Mountain and our 50% interest in RoundMountain, which were presented as held for sale and included incurrent assets at December 31, 2015. Our asset base is primarily comprisedof non-current assets such as property, plant and equipment and goodwill,reflecting the capital intensive nature of the mining business and our historyof growing through acquisitions. Other significant assets include productioninventories, indirect taxes recoverable and receivable, concentrate salesreceivable and other government transaction and joint venture relatedreceivables, and cash and equivalents. Total liabilities at September 30,2016, totaled $15.8 billion, approximately $1.1 billion lower than atDecember 31, 2015, primarily reflecting $1.4billion of debt repayments made during 2016.
Shareholders’ EquityAs at October 18, 2016 Number of shares Common shares 1,165,430,940 Stock options 2,448,502
Financial Position and LiquidityTotal cash and cash equivalents as at September 30, 2016, was $2.6billion1. Our capital structure comprises a mix of debt and shareholders’equity. As at September 30, 2016, our total debt was $8.5 billion (debt net ofcash and equivalents was $5.9 billion) and our debt-to-equity ratio was0.87:1. This compares to total debt as at December 31, 2015 of $10.0 billion(debt net of cash and equivalents was $7.5 billion) and a debt-to-equity ratioof 1.05:1.
At the beginning of 2016, we set a debt reduction target of $2 billion. Wehave reduced debt by $1.4 billion so far in 2016 in furtherance of this goal.We currently have less than $200 million4 in debt due by the end of 2018,and approximately $5 billion of our outstanding debt matures after 2032.
In addition to this debt reduction goal, we have capital commitments of $44million and expect to incur sustaining and project capital expenditures ofapproximately $435 to $535 million in the fourth quarter of 2016 based onour guidance range on page 25. For the remainder of 2016 we havecontractual obligations and commitments of $283 million in purchaseobligations for supplies and
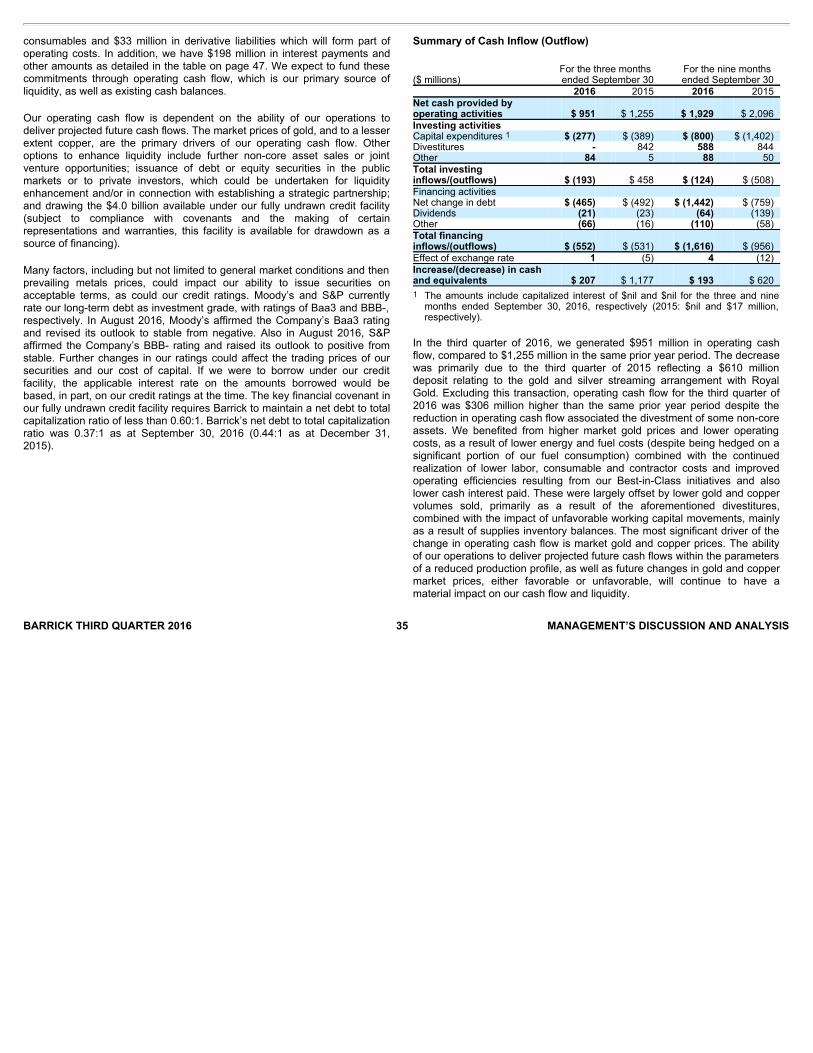
BARRICK THIRD QUARTER 2016 35 MANAGEMENT’S DISCUSSION AND ANALYSIS
consumables and $33 million in derivative liabilities which will form part ofoperating costs. In addition, we have $198 million in interest payments andother amounts as detailed in the table on page 47. We expect to fund thesecommitments through operating cash flow, which is our primary source ofliquidity, as well as existing cash balances.
Our operating cash flow is dependent on the ability of our operations todeliver projected future cash flows. The market prices of gold, and to a lesserextent copper, are the primary drivers of our operating cash flow. Otheroptions to enhance liquidity include further non-core asset sales or jointventure opportunities; issuance of debt or equity securities in the publicmarkets or to private investors, which could be undertaken for liquidityenhancement and/or in connection with establishing a strategic partnership;and drawing the $4.0 billion available under our fully undrawn credit facility(subject to compliance with covenants and the making of certainrepresentations and warranties, this facility is available for drawdown as asource of financing).
Many factors, including but not limited to general market conditions and thenprevailing metals prices, could impact our ability to issue securities onacceptable terms, as could our credit ratings. Moody’s and S&P currentlyrate our long-term debt as investment grade, with ratings of Baa3 and BBB-,respectively. In August 2016, Moody’s affirmed the Company’s Baa3 ratingand revised its outlook to stable from negative. Also in August 2016, S&Paffirmed the Company’s BBB- rating and raised its outlook to positive fromstable. Further changes in our ratings could affect the trading prices of oursecurities and our cost of capital. If we were to borrow under our creditfacility, the applicable interest rate on the amounts borrowed would bebased, in part, on our credit ratings at the time. The key financial covenant inour fully undrawn credit facility requires Barrick to maintain a net debt to totalcapitalization ratio of less than 0.60:1. Barrick’s net debt to total capitalizationratio was 0.37:1 as at September 30, 2016 (0.44:1 as at December 31,2015).
Summary of Cash Inflow (Outflow) ($ millions)
For the three months ended September 30
For the nine months ended September 30
2016 2015 2016 2015 Net cash provided byoperating activities $ 951 $ 1,255 $ 1,929 $ 2,096 Investing activities Capital expenditures 1 $ (277) $ (389) $ (800) $ (1,402) Divestitures - 842 588 844 Other 84 5 88 50 Total investinginflows/(outflows) $ (193) $ 458 $ (124) $ (508) Financing activities Net change in debt $ (465) $ (492) $ (1,442) $ (759) Dividends (21) (23) (64) (139) Other (66) (16) (110) (58) Total financinginflows/(outflows) $ (552) $ (531) $ (1,616) $ (956) Effect of exchange rate 1 (5) 4 (12) Increase/(decrease) in cashand equivalents $ 207 $ 1,177 $ 193 $ 620 1 The amounts include capitalized interest of $nil and $nil for the three and nine
months ended September 30, 2016, respectively (2015: $nil and $17 million,respectively).
In the third quarter of 2016, we generated $951 million in operating cashflow, compared to $1,255 million in the same prior year period. The decreasewas primarily due to the third quarter of 2015 reflecting a $610 milliondeposit relating to the gold and silver streaming arrangement with RoyalGold. Excluding this transaction, operating cash flow for the third quarter of2016 was $306 million higher than the same prior year period despite thereduction in operating cash flow associated the divestment of some non-coreassets. We benefited from higher market gold prices and lower operatingcosts, as a result of lower energy and fuel costs (despite being hedged on asignificant portion of our fuel consumption) combined with the continuedrealization of lower labor, consumable and contractor costs and improvedoperating efficiencies resulting from our Best-in-Class initiatives and alsolower cash interest paid. These were largely offset by lower gold and coppervolumes sold, primarily as a result of the aforementioned divestitures,combined with the impact of unfavorable working capital movements, mainlyas a result of supplies inventory balances. The most significant driver of thechange in operating cash flow is market gold and copper prices. The abilityof our operations to deliver projected future cash flows within the parametersof a reduced production profile, as well as future changes in gold and coppermarket prices, either favorable or unfavorable, will continue to have amaterial impact on our cash flow and liquidity.
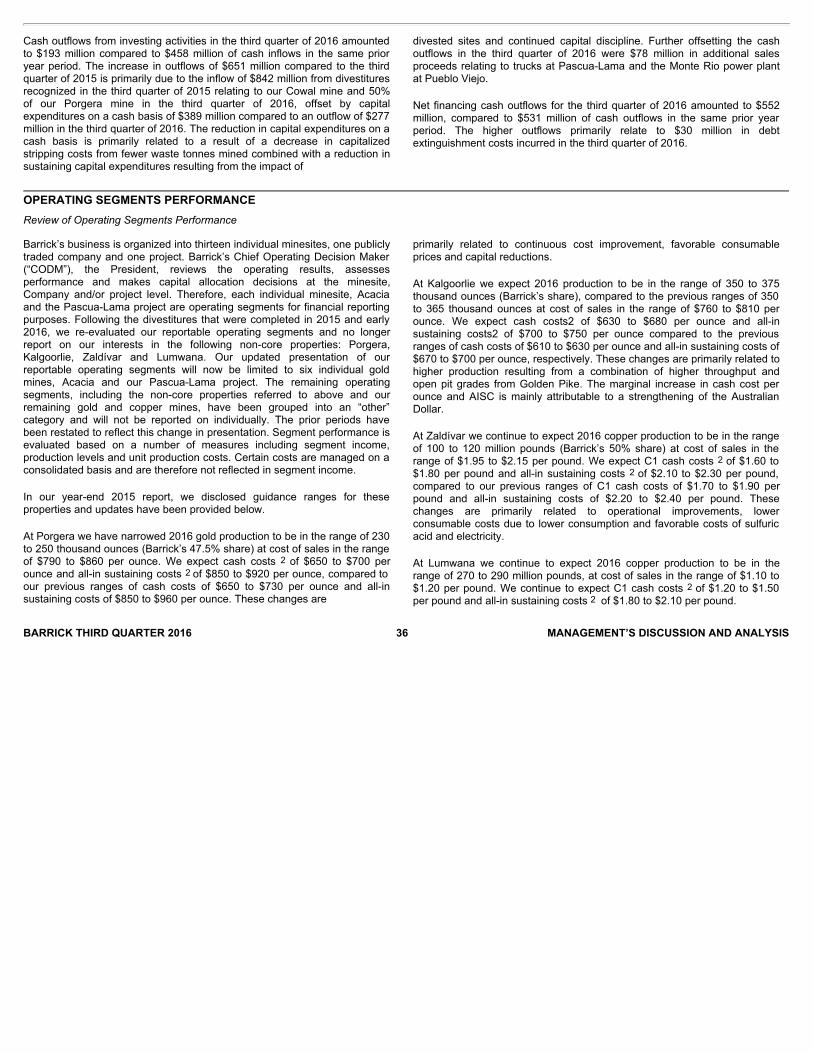
OPERATING SEGMENTS PERFORMANCEReview of Operating Segments Performance
BARRICK THIRD QUARTER 2016 36 MANAGEMENT’S DISCUSSION AND ANALYSIS
Cash outflows from investing activities in the third quarter of 2016 amountedto $193 million compared to $458 million of cash inflows in the same prioryear period. The increase in outflows of $651 million compared to the thirdquarter of 2015 is primarily due to the inflow of $842 million from divestituresrecognized in the third quarter of 2015 relating to our Cowal mine and 50%of our Porgera mine in the third quarter of 2016, offset by capitalexpenditures on a cash basis of $389 million compared to an outflow of $277million in the third quarter of 2016. The reduction in capital expenditures on acash basis is primarily related to a result of a decrease in capitalizedstripping costs from fewer waste tonnes mined combined with a reduction insustaining capital expenditures resulting from the impact of
divested sites and continued capital discipline. Further offsetting the cashoutflows in the third quarter of 2016 were $78 million in additional salesproceeds relating to trucks at Pascua-Lama and the Monte Rio power plantat Pueblo Viejo.
Net financing cash outflows for the third quarter of 2016 amounted to $552million, compared to $531 million of cash outflows in the same prior yearperiod. The higher outflows primarily relate to $30 million in debtextinguishment costs incurred in the third quarter of 2016.
Barrick’s business is organized into thirteen individual minesites, one publiclytraded company and one project. Barrick’s Chief Operating Decision Maker(“CODM”), the President, reviews the operating results, assessesperformance and makes capital allocation decisions at the minesite,Company and/or project level. Therefore, each individual minesite, Acaciaand the Pascua-Lama project are operating segments for financial reportingpurposes. Following the divestitures that were completed in 2015 and early2016, we re-evaluated our reportable operating segments and no longerreport on our interests in the following non-core properties: Porgera,Kalgoorlie, Zaldívar and Lumwana. Our updated presentation of ourreportable operating segments will now be limited to six individual goldmines, Acacia and our Pascua-Lama project. The remaining operatingsegments, including the non-core properties referred to above and ourremaining gold and copper mines, have been grouped into an “other”category and will not be reported on individually. The prior periods havebeen restated to reflect this change in presentation. Segment performance isevaluated based on a number of measures including segment income,production levels and unit production costs. Certain costs are managed on aconsolidated basis and are therefore not reflected in segment income.
In our year-end 2015 report, we disclosed guidance ranges for theseproperties and updates have been provided below.
At Porgera we have narrowed 2016 gold production to be in the range of 230to 250 thousand ounces (Barrick’s 47.5% share) at cost of sales in the rangeof $790 to $860 per ounce. We expect cash costs 2 of $650 to $700 perounce and all-in sustaining costs 2 of $850 to $920 per ounce, compared toour previous ranges of cash costs of $650 to $730 per ounce and all-insustaining costs of $850 to $960 per ounce. These changes are
primarily related to continuous cost improvement, favorable consumableprices and capital reductions.
At Kalgoorlie we expect 2016 production to be in the range of 350 to 375thousand ounces (Barrick’s share), compared to the previous ranges of 350to 365 thousand ounces at cost of sales in the range of $760 to $810 perounce. We expect cash costs2 of $630 to $680 per ounce and all-insustaining costs2 of $700 to $750 per ounce compared to the previousranges of cash costs of $610 to $630 per ounce and all-in sustaining costs of$670 to $700 per ounce, respectively. These changes are primarily related tohigher production resulting from a combination of higher throughput andopen pit grades from Golden Pike. The marginal increase in cash cost perounce and AISC is mainly attributable to a strengthening of the AustralianDollar.
At Zaldívar we continue to expect 2016 copper production to be in the rangeof 100 to 120 million pounds (Barrick’s 50% share) at cost of sales in therange of $1.95 to $2.15 per pound. We expect C1 cash costs 2 of $1.60 to$1.80 per pound and all-in sustaining costs 2 of $2.10 to $2.30 per pound,compared to our previous ranges of C1 cash costs of $1.70 to $1.90 perpound and all-in sustaining costs of $2.20 to $2.40 per pound. Thesechanges are primarily related to operational improvements, lowerconsumable costs due to lower consumption and favorable costs of sulfuricacid and electricity.
At Lumwana we continue to expect 2016 copper production to be in therange of 270 to 290 million pounds, at cost of sales in the range of $1.10 to$1.20 per pound. We continue to expect C1 cash costs 2 of $1.20 to $1.50per pound and all-in sustaining costs 2 of $1.80 to $2.10 per pound.
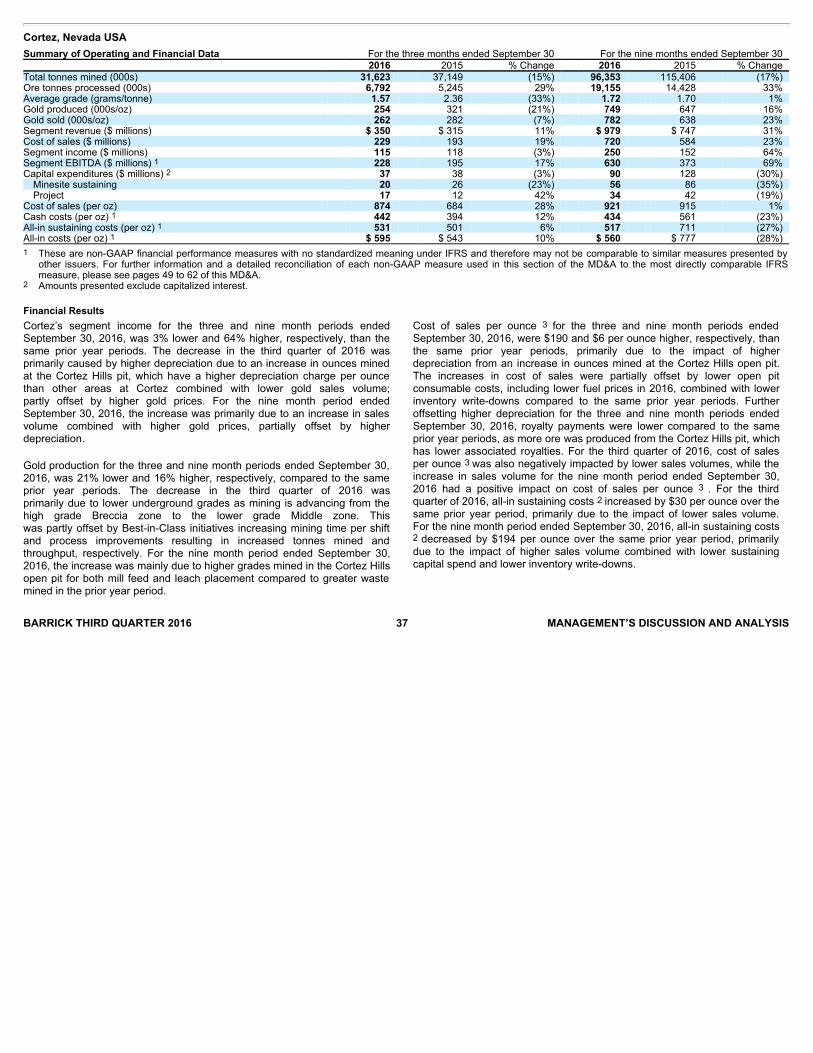
Cortez, Nevada USA
Summary of Operating and Financial Data For the three months ended September 30 For the nine months ended September 30 2016 2015 % Change 2016 2015 % Change Total tonnes mined (000s) 31,623 37,149 (15%) 96,353 115,406 (17%) Ore tonnes processed (000s) 6,792 5,245 29% 19,155 14,428 33% Average grade (grams/tonne) 1.57 2.36 (33%) 1.72 1.70 1% Gold produced (000s/oz) 254 321 (21%) 749 647 16% Gold sold (000s/oz) 262 282 (7%) 782 638 23% Segment revenue ($ millions) $ 350 $ 315 11% $ 979 $ 747 31% Cost of sales ($ millions) 229 193 19% 720 584 23% Segment income ($ millions) 115 118 (3%) 250 152 64% Segment EBITDA ($ millions) 1 228 195 17% 630 373 69% Capital expenditures ($ millions) 2 37 38 (3%) 90 128 (30%)
Minesite sustaining 20 26 (23%) 56 86 (35%) Project 17 12 42% 34 42 (19%)
Cost of sales (per oz) 874 684 28% 921 915 1% Cash costs (per oz) 1 442 394 12% 434 561 (23%) All-in sustaining costs (per oz) 1 531 501 6% 517 711 (27%) All-in costs (per oz) 1 $ 595 $ 543 10% $ 560 $ 777 (28%) 1 These are non-GAAP financial performance measures with no standardized meaning under IFRS and therefore may not be comparable to similar measures presented by
other issuers. For further information and a detailed reconciliation of each non-GAAP measure used in this section of the MD&A to the most directly comparable IFRSmeasure, please see pages 49 to 62 of this MD&A.
2 Amounts presented exclude capitalized interest.
Financial Results
BARRICK THIRD QUARTER 2016 37 MANAGEMENT’S DISCUSSION AND ANALYSIS
Cortez’s segment income for the three and nine month periods endedSeptember 30, 2016, was 3% lower and 64% higher, respectively, than thesame prior year periods. The decrease in the third quarter of 2016 wasprimarily caused by higher depreciation due to an increase in ounces minedat the Cortez Hills pit, which have a higher depreciation charge per ouncethan other areas at Cortez combined with lower gold sales volume;partly offset by higher gold prices. For the nine month period endedSeptember 30, 2016, the increase was primarily due to an increase in salesvolume combined with higher gold prices, partially offset by higherdepreciation.
Gold production for the three and nine month periods ended September 30,2016, was 21% lower and 16% higher, respectively, compared to the sameprior year periods. The decrease in the third quarter of 2016 wasprimarily due to lower underground grades as mining is advancing from thehigh grade Breccia zone to the lower grade Middle zone. Thiswas partly offset by Best-in-Class initiatives increasing mining time per shiftand process improvements resulting in increased tonnes mined andthroughput, respectively. For the nine month period ended September 30,2016, the increase was mainly due to higher grades mined in the Cortez Hillsopen pit for both mill feed and leach placement compared to greater wastemined in the prior year period.
Cost of sales per ounce 3 for the three and nine month periods endedSeptember 30, 2016, were $190 and $6 per ounce higher, respectively, thanthe same prior year periods, primarily due to the impact of higherdepreciation from an increase in ounces mined at the Cortez Hills open pit.The increases in cost of sales were partially offset by lower open pitconsumable costs, including lower fuel prices in 2016, combined with lowerinventory write-downs compared to the same prior year periods. Furtheroffsetting higher depreciation for the three and nine month periods endedSeptember 30, 2016, royalty payments were lower compared to the sameprior year periods, as more ore was produced from the Cortez Hills pit, whichhas lower associated royalties. For the third quarter of 2016, cost of salesper ounce 3 was also negatively impacted by lower sales volumes, while theincrease in sales volume for the nine month period ended September 30,2016 had a positive impact on cost of sales per ounce 3 . For the thirdquarter of 2016, all-in sustaining costs 2 increased by $30 per ounce over thesame prior year period, primarily due to the impact of lower sales volume.For the nine month period ended September 30, 2016, all-in sustaining costs2 decreased by $194 per ounce over the same prior year period, primarilydue to the impact of higher sales volume combined with lower sustainingcapital spend and lower inventory write-downs.

Goldstrike, Nevada USASummary of Operating and Financial Data For the three months ended September 30 For the nine months ended September 30
2016 2015 % Change 2016 2015 % Change
Total tonnes mined (000s) 1 16,791 17,632 (5%) 51,718 55,495 (7%) Ore tonnes processed (000s) 1,885 1,799 5% 5,365 4,730 13% Average grade (grams/tonne) 5.77 7.03 (18%) 5.69 5.99 (5%) Gold produced (000s/oz) 293 328 (11%) 805 741 9% Gold sold (000s/oz) 298 291 2% 798 654 22% Segment revenue ($ millions) $ 399 $ 329 21% $ 1,010 $ 759 33% Cost of sales ($ millions) 240 209 15% 671 471 42% Segment income ($ millions) 157 118 33% 332 276 20% Segment EBITDA ($ millions) 2 240 177 36% 534 395 35% Capital expenditures ($ millions) 3 47 31 52% 131 160 (18%)
Minesite sustaining 42 15 180% 87 94 (7%) Project 5 16 (69%) 44 66 (33%)
Cost of sales (per oz) 805 718 12% 841 720 17% Cash costs (per oz) 2 526 490 7% 586 527 11% All-in sustaining costs (per oz) 2 681 558 22% 706 698 1% All-in costs (per oz) 2 $ 700 $ 612 14% $761 $ 799 (5%) 1 Includes tonnes mined relating to Arturo.2 These are non-GAAP financial performance measures with no standardized meaning under IFRS and therefore may not be comparable to similar measures presented by
other issuers. For further information and a detailed reconciliation of each non-GAAP measure used in this section of the MD&A to the most directly comparable IFRSmeasure, please see pages 49 to 62 of this MD&A.
3 Includes our share of capital expenditures related to Arturo.
Financial Results
BARRICK THIRD QUARTER 2016 38 MANAGEMENT’S DISCUSSION AND ANALYSIS
Capital expenditures for the three and nine month periods ended September30, 2016, decreased by 3% and 30%,respectively, compared to the same prior year periods. Lowersustaining capital is attributed to efforts to reduce costs and optimize capitalallocation in 2016, as well as the completion of leach and tailings expansionsin 2015. This was combined with higher capitalized stripping at the CortezHills pit in the prior year periods compared to the current year periods.Project capital expenditures for the three month period are higher as a resultof increased expenditures for the underground development at Lower Zoneand lower for the nine month period due to higher pre-stripping costs at theCrossroads pit incurred in the prior year period.
We expect 2016 gold production to be in the range of 1,000 to 1,050thousand ounces, compared to the previous range of 980 to 1,050 thousandounces due to additional ore and grade delivered from the Cortez open pit.We expect cost of sales per ounce 3 in the range of $880 to $920 per ounce,cash costs 2 to be in the range of $420 to $440 per ounce and all-insustaining costs 2 to be $510 to $530 per ounce, compared to our previousranges of $430 to $450 per ounce and $520 to $550 per ounce, respectively.These changes are driven by marginally higher production and slightly lowersustaining capital spend due to an optimized capital spend schedule.
Segment income for the three and nine month periods ended September 30,2016, was 33% and 20% higher, respectively, than the same prior yearperiods. The increases were primarily due to an increase in sales volumeand higher gold prices, partially offset by increased processing anddepreciation expense associated with full year operation of the autoclave.
Gold production for the three and nine month periods ended September 30,2016, was 11% lower and 9% higher, respectively, compared to the sameprior year periods. The decrease in the third quarter of 2016 was primarilydue to lower grades processed through the roaster compared to the sameprior year period as a result of higher grade ore mined at North
Betze combined with processing ore from 60% owned Arturo pit, whichcommenced commercial production August 1, 2016, compared to fullownership production in the prior year period. For the nine month periodended September 30, 2016, the increase was a result of higher autoclaveproduction and higher grade ore mined from the North Betze layback, slightlyoffset by third quarter production from Arturo, compared to full ownershipproduction in the prior year period.
Cost of sales per ounce 3 for the three and nine month periods endedSeptember 30, 2016, were $87 and $121 per

BARRICK THIRD QUARTER 2016 39 MANAGEMENT’S DISCUSSION AND ANALYSIS
ounce higher, respectively, than the same prior year periods, primarily due tohigher operating costs and depreciation expense from the operation of theautoclave. The thiosulfate circuit was commissioned in the third quarter of2015 and operates at a higher cost than the Roaster. The higher operatingcosts are due to stock-based compensation as a result of movements inBarrick’s share price and consulting costs to aid in optimizing production atlowest costs. These increases are partially offset by favorable fuel prices,energy prices, and Best-in-Class initiatives aimed at better utilizing open pitequipment, improved underground mining efficiency, and lowering contractorcosts, which are reflected in lower direct mining costs. For the nine monthperiod, this was partially offset by the impact of an increase in sales volume.For the three and nine month periods ended September 30, 2016, all-insustaining costs 2 increased by $123 and $8 per ounce, respectively,compared to the same prior year periods. The increase for the three monthperiod was due to the impact of higher operating costs combined with highersustaining capital, partly offset by the increase in sales volume. For the ninemonth period, the increase was primarily due to higher operating costs,partly offset by lower sustaining capital combined with an increase in salesvolume.
Capital expenditures for the three and nine month periods ended September30, 2016, increased by 52% and decreased by 18%, respectively, comparedto the same prior year periods. The increase for the three month period wasprimarily due to greater minesite sustaining capital primarily for the roasterCIL tank expansion, capitalized stripping and underground capitaldevelopment. These were partly offset by lower project expenditures frominitial pre-stripping at Arturo, as it entered
commercial production August 1, 2016. The decrease for the nine monthperiod was due to lower project expenditures associated with the autoclavethiosulfate circuit, which entered commercial production in the third quarter of2015, partially offset by higher capital stripping at Arturo, which started in lateMarch 2015. This was combined with higher sustaining capital spend in thesame prior year period, primarily on process equipment replacements andphase 2 construction of the tailings storage facility which was completed inthe fourth quarter of 2015. Lower sustaining capital in the current year is alsoattributed to efforts to reduce costs and optimize capital allocation.
We expect 2016 production to be in the range of 1,050 to 1,100 thousandounces, which is higher than our previous range of 975 to 1,075 thousandounces. Additional open pit production is driven by a better understanding ofore mined and optimizing the blend strategy around these ores, resulting inhigher grade and recovery at the roaster facility. In addition, furtherimprovements at the autoclave facility have driven additional throughput atsimilar grades and recoveries. At the underground, continued Best-in-Classmining improvements are expected to increase production. We expect costof sales to be in the range of $860 to $900 per ounce. We expect cash costs2 to be in the range of $570 to $590 per ounce and all-in sustaining costs 2 tobe $720 to $760 per ounce, driven by higher production and slightly lowersustaining capital spend due to an optimized capital spend schedule. Thiscompares to our previous guidance ranges of $560 to $610 per ounce and$780 to $850 per ounce, respectively.
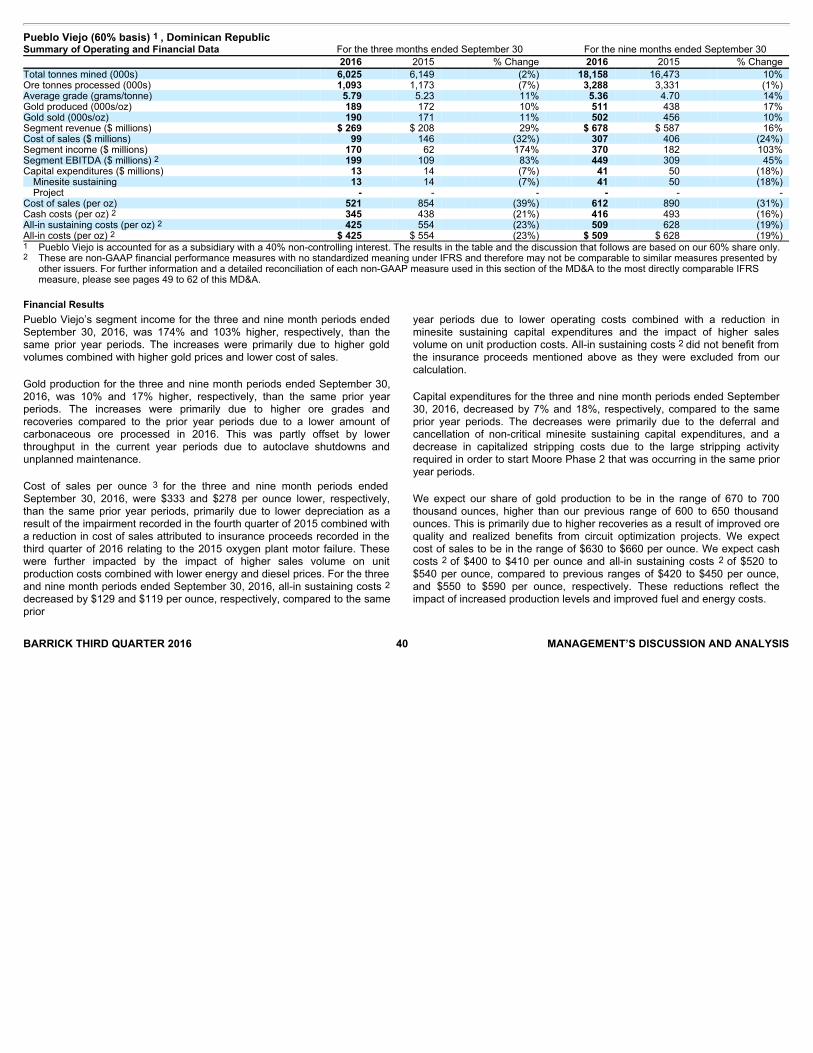
Pueblo Viejo (60% basis) 1 , Dominican RepublicSummary of Operating and Financial Data For the three months ended September 30 For the nine months ended September 30
2016 2015 % Change 2016 2015 % Change
Total tonnes mined (000s) 6,025 6,149 (2%) 18,158 16,473 10% Ore tonnes processed (000s) 1,093 1,173 (7%) 3,288 3,331 (1%) Average grade (grams/tonne) 5.79 5.23 11% 5.36 4.70 14% Gold produced (000s/oz) 189 172 10% 511 438 17% Gold sold (000s/oz) 190 171 11% 502 456 10% Segment revenue ($ millions) $ 269 $ 208 29% $ 678 $ 587 16% Cost of sales ($ millions) 99 146 (32%) 307 406 (24%) Segment income ($ millions) 170 62 174% 370 182 103% Segment EBITDA ($ millions) 2 199 109 83% 449 309 45% Capital expenditures ($ millions) 13 14 (7%) 41 50 (18%)
Minesite sustaining 13 14 (7%) 41 50 (18%) Project - - - - - -
Cost of sales (per oz) 521 854 (39%) 612 890 (31%) Cash costs (per oz) 2 345 438 (21%) 416 493 (16%) All-in sustaining costs (per oz) 2 425 554 (23%) 509 628 (19%) All-in costs (per oz) 2 $ 425 $ 554 (23%) $ 509 $ 628 (19%) 1 Pueblo Viejo is accounted for as a subsidiary with a 40% non-controlling interest. The results in the table and the discussion that follows are based on our 60% share only.2 These are non-GAAP financial performance measures with no standardized meaning under IFRS and therefore may not be comparable to similar measures presented by
other issuers. For further information and a detailed reconciliation of each non-GAAP measure used in this section of the MD&A to the most directly comparable IFRSmeasure, please see pages 49 to 62 of this MD&A.
Financial Results
BARRICK THIRD QUARTER 2016 40 MANAGEMENT’S DISCUSSION AND ANALYSIS
Pueblo Viejo’s segment income for the three and nine month periods endedSeptember 30, 2016, was 174% and 103% higher, respectively, than thesame prior year periods. The increases were primarily due to higher goldvolumes combined with higher gold prices and lower cost of sales.
Gold production for the three and nine month periods ended September 30,2016, was 10% and 17% higher, respectively, than the same prior yearperiods. The increases were primarily due to higher ore grades andrecoveries compared to the prior year periods due to a lower amount ofcarbonaceous ore processed in 2016. This was partly offset by lowerthroughput in the current year periods due to autoclave shutdowns andunplanned maintenance.
Cost of sales per ounce 3 for the three and nine month periods endedSeptember 30, 2016, were $333 and $278 per ounce lower, respectively,than the same prior year periods, primarily due to lower depreciation as aresult of the impairment recorded in the fourth quarter of 2015 combined witha reduction in cost of sales attributed to insurance proceeds recorded in thethird quarter of 2016 relating to the 2015 oxygen plant motor failure. Thesewere further impacted by the impact of higher sales volume on unitproduction costs combined with lower energy and diesel prices. For the threeand nine month periods ended September 30, 2016, all-in sustaining costs 2decreased by $129 and $119 per ounce, respectively, compared to the sameprior
year periods due to lower operating costs combined with a reduction inminesite sustaining capital expenditures and the impact of higher salesvolume on unit production costs. All-in sustaining costs 2 did not benefit fromthe insurance proceeds mentioned above as they were excluded from ourcalculation.
Capital expenditures for the three and nine month periods ended September30, 2016, decreased by 7% and 18%, respectively, compared to the sameprior year periods. The decreases were primarily due to the deferral andcancellation of non-critical minesite sustaining capital expenditures, and adecrease in capitalized stripping costs due to the large stripping activityrequired in order to start Moore Phase 2 that was occurring in the same prioryear periods.
We expect our share of gold production to be in the range of 670 to 700thousand ounces, higher than our previous range of 600 to 650 thousandounces. This is primarily due to higher recoveries as a result of improved orequality and realized benefits from circuit optimization projects. We expectcost of sales to be in the range of $630 to $660 per ounce. We expect cashcosts 2 of $400 to $410 per ounce and all-in sustaining costs 2 of $520 to$540 per ounce, compared to previous ranges of $420 to $450 per ounce,and $550 to $590 per ounce, respectively. These reductions reflect theimpact of increased production levels and improved fuel and energy costs.
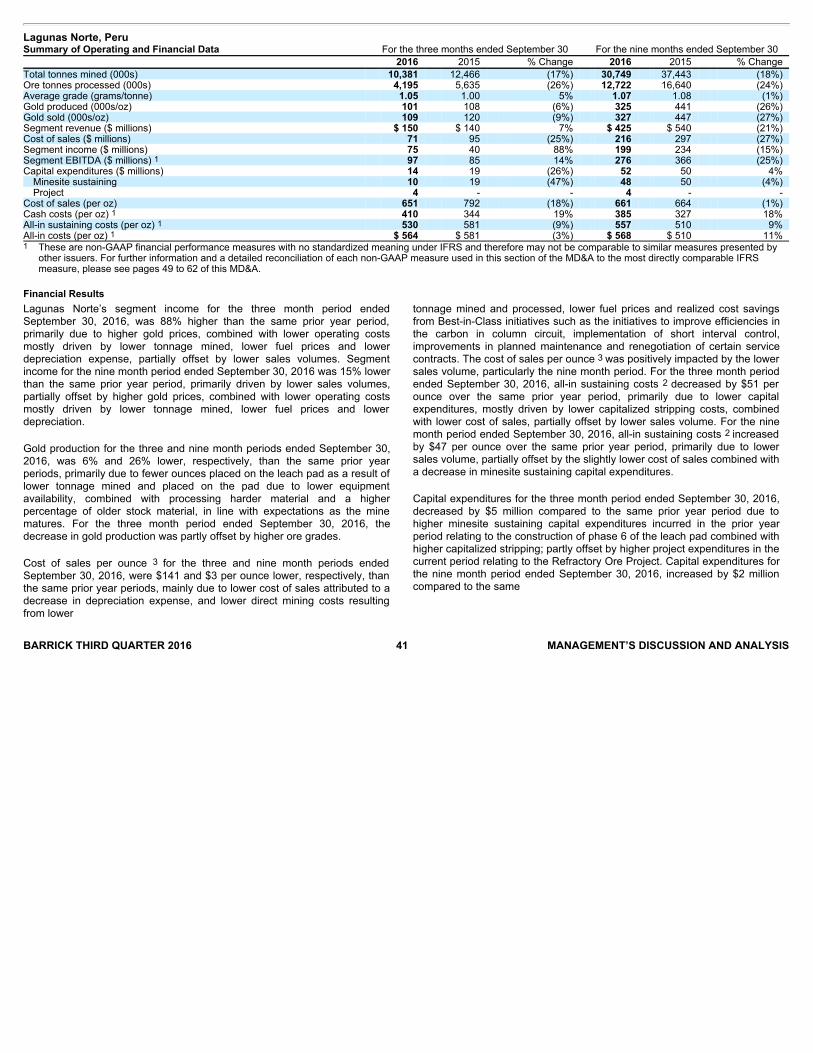
Lagunas Norte, PeruSummary of Operating and Financial Data For the three months ended September 30 For the nine months ended September 30
2016 2015 % Change 2016 2015 % Change
Total tonnes mined (000s) 10,381 12,466 (17%) 30,749 37,443 (18%) Ore tonnes processed (000s) 4,195 5,635 (26%) 12,722 16,640 (24%) Average grade (grams/tonne) 1.05 1.00 5% 1.07 1.08 (1%) Gold produced (000s/oz) 101 108 (6%) 325 441 (26%) Gold sold (000s/oz) 109 120 (9%) 327 447 (27%) Segment revenue ($ millions) $ 150 $ 140 7% $ 425 $ 540 (21%) Cost of sales ($ millions) 71 95 (25%) 216 297 (27%) Segment income ($ millions) 75 40 88% 199 234 (15%) Segment EBITDA ($ millions) 1 97 85 14% 276 366 (25%) Capital expenditures ($ millions) 14 19 (26%) 52 50 4%
Minesite sustaining 10 19 (47%) 48 50 (4%) Project 4 - - 4 - -
Cost of sales (per oz) 651 792 (18%) 661 664 (1%) Cash costs (per oz) 1 410 344 19% 385 327 18% All-in sustaining costs (per oz) 1 530 581 (9%) 557 510 9% All-in costs (per oz) 1 $ 564 $ 581 (3%) $ 568 $ 510 11% 1 These are non-GAAP financial performance measures with no standardized meaning under IFRS and therefore may not be comparable to similar measures presented by
other issuers. For further information and a detailed reconciliation of each non-GAAP measure used in this section of the MD&A to the most directly comparable IFRSmeasure, please see pages 49 to 62 of this MD&A.
Financial Results
BARRICK THIRD QUARTER 2016 41 MANAGEMENT’S DISCUSSION AND ANALYSIS
Lagunas Norte’s segment income for the three month period endedSeptember 30, 2016, was 88% higher than the same prior year period,primarily due to higher gold prices, combined with lower operating costsmostly driven by lower tonnage mined, lower fuel prices and lowerdepreciation expense, partially offset by lower sales volumes. Segmentincome for the nine month period ended September 30, 2016 was 15% lowerthan the same prior year period, primarily driven by lower sales volumes,partially offset by higher gold prices, combined with lower operating costsmostly driven by lower tonnage mined, lower fuel prices and lowerdepreciation.
Gold production for the three and nine month periods ended September 30,2016, was 6% and 26% lower, respectively, than the same prior yearperiods, primarily due to fewer ounces placed on the leach pad as a result oflower tonnage mined and placed on the pad due to lower equipmentavailability, combined with processing harder material and a higherpercentage of older stock material, in line with expectations as the minematures. For the three month period ended September 30, 2016, thedecrease in gold production was partly offset by higher ore grades.
Cost of sales per ounce 3 for the three and nine month periods endedSeptember 30, 2016, were $141 and $3 per ounce lower, respectively, thanthe same prior year periods, mainly due to lower cost of sales attributed to adecrease in depreciation expense, and lower direct mining costs resultingfrom lower
tonnage mined and processed, lower fuel prices and realized cost savingsfrom Best-in-Class initiatives such as the initiatives to improve efficiencies inthe carbon in column circuit, implementation of short interval control,improvements in planned maintenance and renegotiation of certain servicecontracts. The cost of sales per ounce 3 was positively impacted by the lowersales volume, particularly the nine month period. For the three month periodended September 30, 2016, all-in sustaining costs 2 decreased by $51 perounce over the same prior year period, primarily due to lower capitalexpenditures, mostly driven by lower capitalized stripping costs, combinedwith lower cost of sales, partially offset by lower sales volume. For the ninemonth period ended September 30, 2016, all-in sustaining costs 2 increasedby $47 per ounce over the same prior year period, primarily due to lowersales volume, partially offset by the slightly lower cost of sales combined witha decrease in minesite sustaining capital expenditures.
Capital expenditures for the three month period ended September 30, 2016,decreased by $5 million compared to the same prior year period due tohigher minesite sustaining capital expenditures incurred in the prior yearperiod relating to the construction of phase 6 of the leach pad combined withhigher capitalized stripping; partly offset by higher project expenditures in thecurrent period relating to the Refractory Ore Project. Capital expenditures forthe nine month period ended September 30, 2016, increased by $2 millioncompared to the same

Veladero, Argentina Summary of Operating and Financial Data For the three months ended September 30 For the nine months ended September 30 2016 2015 % Change 2016 2015 % Change Total tonnes mined (000s) 7,087 19,096 (63%) 43,402 61,346 (29%) Ore tonnes processed (000s) 7,856 5,943 32% 20,672 20,752 - Average grade (grams/tonne) 0.65 0.76 (14%) 0.73 0.78 (6%) Gold produced (000s/oz) 116 143 (19%) 367 443 (17%) Gold sold (000s/oz) 95 152 (38%) 338 473 (29%) Segment revenue ($ millions) $ 134 $ 168 (20%) $ 445 $ 547 (19%) Cost of sales ($ millions) 86 138 (38%) 291 376 (23%) Segment income ($ millions) 48 28 71% 155 168 (8%) Segment EBITDA ($ millions) 1 72 55 31% 231 247 (6%) Capital expenditures ($ millions) 5 51 (90%) 46 187 (75%)
Minesite sustaining 5 51 (90%) 46 187 (75%) Project - - - - - -
Cost of sales (per oz) 905 908 - 861 795 8% Cash costs (per oz) 1 586 570 3% 547 551 (1%) All-in sustaining costs (per oz) 1 651 914 (29%) 693 957 (28%) All-in costs (per oz) 1 $ 651 $ 914 (29%) $ 693 $ 957 (28%) 1 These are non-GAAP financial performance measures with no standardized meaning under IFRS and therefore may not be comparable to similar measures presented by
other issuers. For further information and a detailed reconciliation of each non-GAAP measure used in this section of the MD&A to the most directly comparable IFRSmeasure, please see pages 49 to 62 of this MD&A.
BARRICK THIRD QUARTER 2016 42 MANAGEMENT’S DISCUSSION AND ANALYSIS
prior year period primarily due to an increase in project expenditures,partially offset by lower minesite sustaining expenditures relating to theconstruction of phase 6 of the leach pad.
We expect 2016 gold production to be in the narrowed range of 425 to 450thousand ounces compared to our previous range of 410 to 450 thousandounces. This change is related to higher realized ore grade and ounceproduction from improved stacking and secondary leaching. We expect costof sales to be in the
range of $680 to $720 per ounce. We expect cash costs 2 of $400 to $430per ounce and all-in sustaining costs 2 of $560 to $590 per ounce comparedto our previous ranges of cash costs of $410 to $450 per ounce and all-insustaining costs of $580 to $630 per ounce. These changes are primarilyrelated to lower operating and capital costs, mostly driven by operationalimprovements and savings.
Financial ResultsVeladero’s segment income for the three month period ended September 30,2016 was 71% higher than the same prior year period, primarily due to loweroperating costs combined with higher gold prices, partially offset by adecrease in sales volume. For the nine month period, segment income was8% lower due to a decrease in sale volume, partially offset by loweroperating costs combined with higher gold prices.
Gold production for the three and nine month periods ended September 30,2016, was 19% and 17% lower, respectively, than the same prior yearperiod, mainly reflecting lower grade tonnes placed on the leach padcombined with the temporary suspension of operations late in the thirdquarter of 2016; for the nine month period, this was further impacted byunexpected severe winter weather conditions in the second quarter of 2016.
Cost of sales per ounce 3 for the three and nine month periods endedSeptember 30, 2016, were $3 per ounce lower and $66 per ounce higher,respectively, than the same prior year periods, primarily due to lower cost ofsales associated with lower operating costs as a result of lower tonnesmined and processed due to lower grades, combined with savings initiativesand the impact of local currency devaluation on labor costs. This waspartially offset by lower capitalized stripping costs and impact of lower salesvolume on unit production costs relating to the temporary suspension ofoperations in the third quarter of 2016. For the nine month period endedSeptember 30, 2016, this was further impacted by severe weatherconditions. The impact of sales volume on unit production costs was greaterfor the nine month period resulting in an increase in cost of sales per ounce 3. For the three and nine month periods ended September 30, 2016, all-insustaining costs 2 decreased by $263 and $264 per ounce, respectively, overthe same prior year periods, primarily due to a decrease in minesitesustaining capital

BARRICK THIRD QUARTER 2016 43 MANAGEMENT’S DISCUSSION AND ANALYSIS
expenditures combined with lower operating costs, partly offset by the impactof lower sales volume on unit production costs.
Capital expenditures for the three and nine month periods ended September30, 2016, decreased by 90% and 75%, respectively, compared to the sameprior year periods. The decreases were primarily due to a decrease inminesite sustaining expenditures mainly related to the construction of thephase 4B leach pad and equipment purchases combined with a decrease incapitalized stripping costs.
On October 9, 2015, the San Juan mining authority initiated anadministrative sanction process against Minera Argentina Gold SRL(“MAGSRL”) (formerly Minera Argentina Gold S.A. or MAGSA), Barrick’sArgentine subsidiary that operates the Veladero mine, for alleged violationsof the mining code relating to a valve failure and release of cyanide-bearingprocess solution in September 2015. On March 11, 2016, the San JuanProvincial mining authority announced its intention to impose anadministrative fine against MAGSRL in connection with the solution release.MAGSRL was formally notified of this decision on March 15, 2016. On April6, 2016, MAGSRL sought reconsideration of certain aspects of the decisionbut did not challenge the amount of the administrative fine. On April 14,2016, in accordance with local requirements, MAGSRL paid theadministrative fine of approximately $10 million (at the then-applicableArgentine peso/$ exchange rate) while the request for reconsideration ispending. MAGSRL is implementing a remedial action plan at Veladero inresponse to the incident as required by the San Juan mining authority.Certain construction related activities are still pending to be completed.
On September 8, 2016, ice rolling down the slope of the leach pad at theVeladero mine damaged a pipe carrying process solution, causing somematerial to leave the leach pad. This material, primarily crushed oresaturated with process solution, was contained on the mine site and returnedto the leach pad. Extensive water monitoring in the area conducted byMAGSRL has confirmed that the incident did not result in any environmentalimpacts. A temporary suspension of operations at the Veladero mine wasordered by the San Juan Provincial
mining authority and a San Juan Provincial court on September 15, 2016and September 22, 2016, respectively, as a result of this incident. OnOctober 4, 2016, following, among other matters, the completion of certainurgent works required by the San Juan Provincial mining authority and ajudicial inspection of the mine, the San Juan Provincial court lifted thesuspension of operations and ordered that mining activities be resumed.
On September 14, 2016, the San Juan Provincial mining authoritycommenced an administrative proceeding in connection with this incidentthat included, in addition to the issue of the suspension order, aninfringement proceeding against MAGSRL. The San Juan Provincial miningauthority has not yet served notice on MAGSRL of any charges that may belaid under the infringement proceeding. A new criminal judicial investigationhas also been commenced by the Provincial prosecutor’s office in the sameSan Juan Provincial court that is hearing the Provincial Action. The court inthis proceeding issued the orders suspending and resuming the operationsat the Veladero mine described above.
We expect 2016 gold production to be in the range of 530 to 580 thousandounces, compared to our previous guidance range of 580 to 640 thousandounces. We expect cost of sales to be in the range of $820 to $900 perounce. We expect cash costs 2 of $560 to $610 per ounce and all-insustaining costs 2 of $800 to $870 per ounce compared to our previousguidance range of $520 to $570 per ounce and all-in sustaining costs of$790 to $860 per ounce. These changes reflect the impact of adverseweather conditions, the effect of water management within the leach pad andthe temporary suspension of operations in September.
We had previously indicated that production at Veladero may be impacted inthe event that snowmelt causes water levels in the leach solution storagearea to exceed trigger limits prescribed in the 2014 update to the mine’senvironmental permit. In the third quarter of 2016, measures were taken tomitigate this risk and it is no longer expected to impact production levels.
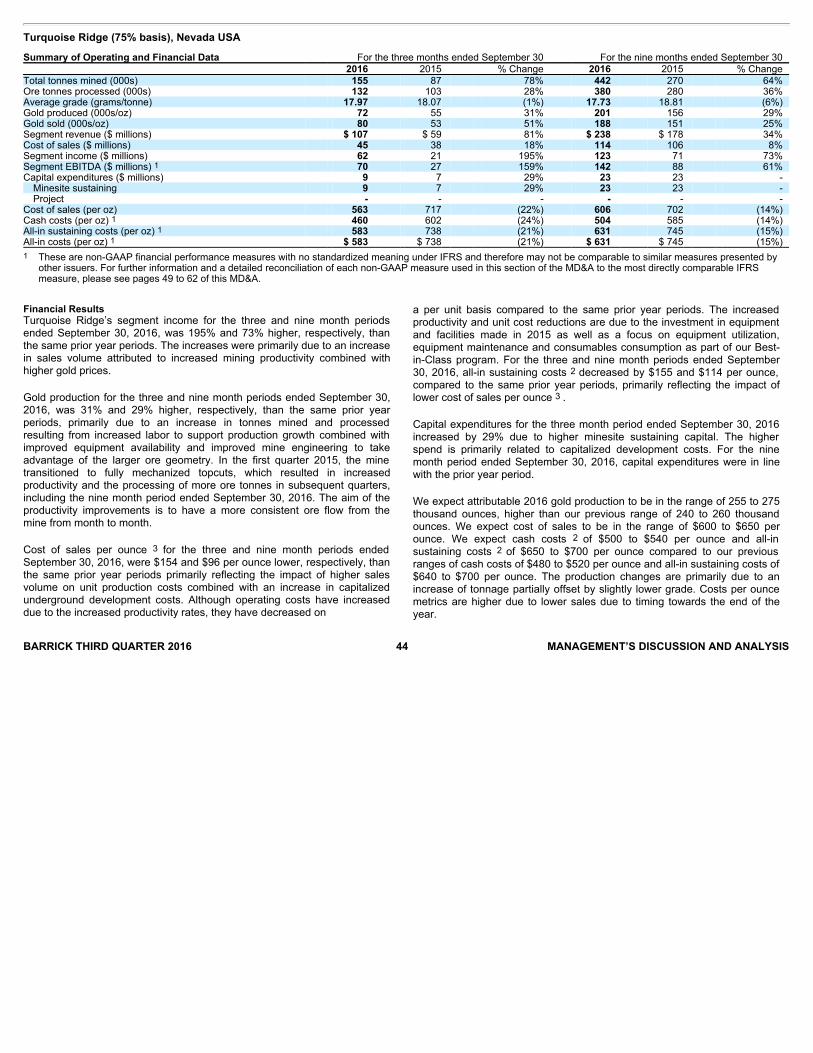
Turquoise Ridge (75% basis), Nevada USA Summary of Operating and Financial Data For the three months ended September 30 For the nine months ended September 30 2016 2015 % Change 2016 2015 % Change Total tonnes mined (000s) 155 87 78% 442 270 64% Ore tonnes processed (000s) 132 103 28% 380 280 36% Average grade (grams/tonne) 17.97 18.07 (1%) 17.73 18.81 (6%) Gold produced (000s/oz) 72 55 31% 201 156 29% Gold sold (000s/oz) 80 53 51% 188 151 25% Segment revenue ($ millions) $ 107 $ 59 81% $ 238 $ 178 34% Cost of sales ($ millions) 45 38 18% 114 106 8% Segment income ($ millions) 62 21 195% 123 71 73% Segment EBITDA ($ millions) 1 70 27 159% 142 88 61% Capital expenditures ($ millions) 9 7 29% 23 23 -
Minesite sustaining 9 7 29% 23 23 - Project - - - - - -
Cost of sales (per oz) 563 717 (22%) 606 702 (14%) Cash costs (per oz) 1 460 602 (24%) 504 585 (14%) All-in sustaining costs (per oz) 1 583 738 (21%) 631 745 (15%) All-in costs (per oz) 1 $ 583 $ 738 (21%) $ 631 $ 745 (15%) 1 These are non-GAAP financial performance measures with no standardized meaning under IFRS and therefore may not be comparable to similar measures presented by
other issuers. For further information and a detailed reconciliation of each non-GAAP measure used in this section of the MD&A to the most directly comparable IFRSmeasure, please see pages 49 to 62 of this MD&A.
BARRICK THIRD QUARTER 2016 44 MANAGEMENT’S DISCUSSION AND ANALYSIS
Financial ResultsTurquoise Ridge’s segment income for the three and nine month periodsended September 30, 2016, was 195% and 73% higher, respectively, thanthe same prior year periods. The increases were primarily due to an increasein sales volume attributed to increased mining productivity combined withhigher gold prices.
Gold production for the three and nine month periods ended September 30,2016, was 31% and 29% higher, respectively, than the same prior yearperiods, primarily due to an increase in tonnes mined and processedresulting from increased labor to support production growth combined withimproved equipment availability and improved mine engineering to takeadvantage of the larger ore geometry. In the first quarter 2015, the minetransitioned to fully mechanized topcuts, which resulted in increasedproductivity and the processing of more ore tonnes in subsequent quarters,including the nine month period ended September 30, 2016. The aim of theproductivity improvements is to have a more consistent ore flow from themine from month to month.
Cost of sales per ounce 3 for the three and nine month periods endedSeptember 30, 2016, were $154 and $96 per ounce lower, respectively, thanthe same prior year periods primarily reflecting the impact of higher salesvolume on unit production costs combined with an increase in capitalizedunderground development costs. Although operating costs have increaseddue to the increased productivity rates, they have decreased on
a per unit basis compared to the same prior year periods. The increasedproductivity and unit cost reductions are due to the investment in equipmentand facilities made in 2015 as well as a focus on equipment utilization,equipment maintenance and consumables consumption as part of our Best-in-Class program. For the three and nine month periods ended September30, 2016, all-in sustaining costs 2 decreased by $155 and $114 per ounce,compared to the same prior year periods, primarily reflecting the impact oflower cost of sales per ounce 3 .
Capital expenditures for the three month period ended September 30, 2016increased by 29% due to higher minesite sustaining capital. The higherspend is primarily related to capitalized development costs. For the ninemonth period ended September 30, 2016, capital expenditures were in linewith the prior year period.
We expect attributable 2016 gold production to be in the range of 255 to 275thousand ounces, higher than our previous range of 240 to 260 thousandounces. We expect cost of sales to be in the range of $600 to $650 perounce. We expect cash costs 2 of $500 to $540 per ounce and all-insustaining costs 2 of $650 to $700 per ounce compared to our previousranges of cash costs of $480 to $520 per ounce and all-in sustaining costs of$640 to $700 per ounce. The production changes are primarily due to anincrease of tonnage partially offset by slightly lower grade. Costs per ouncemetrics are higher due to lower sales due to timing towards the end of theyear.
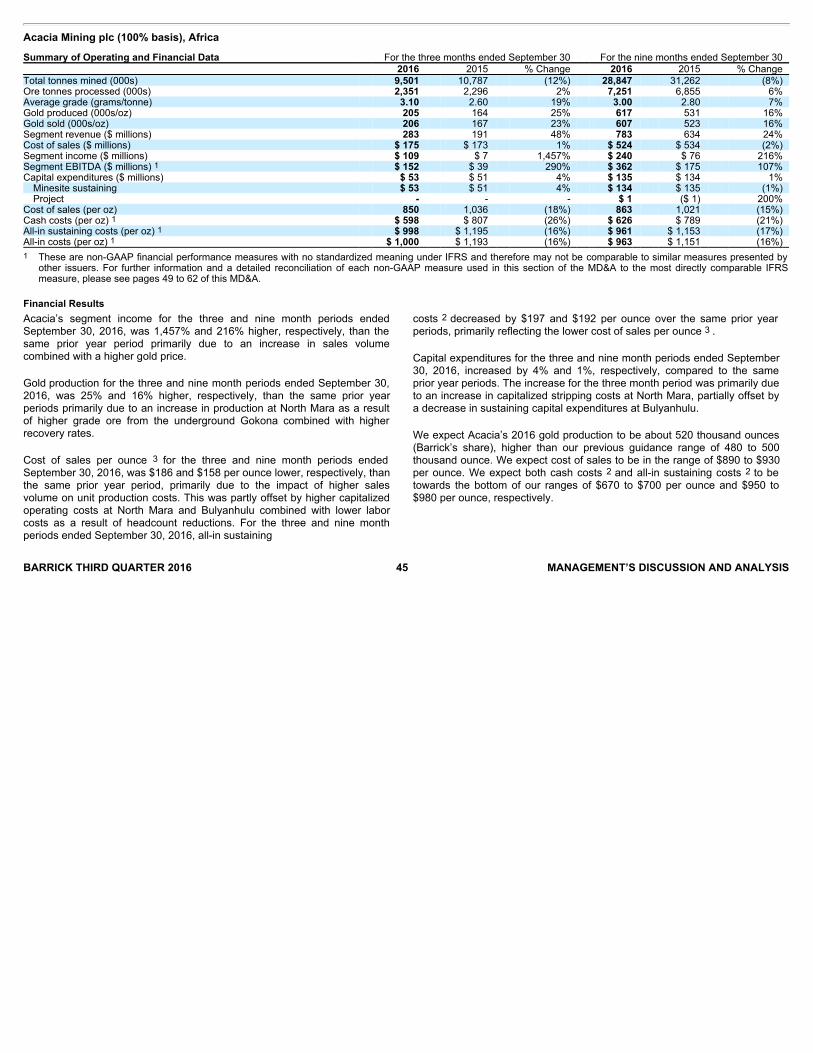
Acacia Mining plc (100% basis), Africa Summary of Operating and Financial Data For the three months ended September 30 For the nine months ended September 30 2016 2015 % Change 2016 2015 % Change Total tonnes mined (000s) 9,501 10,787 (12%) 28,847 31,262 (8%) Ore tonnes processed (000s) 2,351 2,296 2% 7,251 6,855 6% Average grade (grams/tonne) 3.10 2.60 19% 3.00 2.80 7% Gold produced (000s/oz) 205 164 25% 617 531 16% Gold sold (000s/oz) 206 167 23% 607 523 16% Segment revenue ($ millions) 283 191 48% 783 634 24% Cost of sales ($ millions) $ 175 $ 173 1% $ 524 $ 534 (2%) Segment income ($ millions) $ 109 $ 7 1,457% $ 240 $ 76 216% Segment EBITDA ($ millions) 1 $ 152 $ 39 290% $ 362 $ 175 107% Capital expenditures ($ millions) $ 53 $ 51 4% $ 135 $ 134 1%
Minesite sustaining $ 53 $ 51 4% $ 134 $ 135 (1%) Project - - - $ 1 ($ 1) 200%
Cost of sales (per oz) 850 1,036 (18%) 863 1,021 (15%) Cash costs (per oz) 1 $ 598 $ 807 (26%) $ 626 $ 789 (21%) All-in sustaining costs (per oz) 1 $ 998 $ 1,195 (16%) $ 961 $ 1,153 (17%) All-in costs (per oz) 1 $ 1,000 $ 1,193 (16%) $ 963 $ 1,151 (16%) 1 These are non-GAAP financial performance measures with no standardized meaning under IFRS and therefore may not be comparable to similar measures presented by
other issuers. For further information and a detailed reconciliation of each non-GAAP measure used in this section of the MD&A to the most directly comparable IFRSmeasure, please see pages 49 to 62 of this MD&A.
Financial Results
BARRICK THIRD QUARTER 2016 45 MANAGEMENT’S DISCUSSION AND ANALYSIS
Acacia’s segment income for the three and nine month periods endedSeptember 30, 2016, was 1,457% and 216% higher, respectively, than thesame prior year period primarily due to an increase in sales volumecombined with a higher gold price.
Gold production for the three and nine month periods ended September 30,2016, was 25% and 16% higher, respectively, than the same prior yearperiods primarily due to an increase in production at North Mara as a resultof higher grade ore from the underground Gokona combined with higherrecovery rates.
Cost of sales per ounce 3 for the three and nine month periods endedSeptember 30, 2016, was $186 and $158 per ounce lower, respectively, thanthe same prior year period, primarily due to the impact of higher salesvolume on unit production costs. This was partly offset by higher capitalizedoperating costs at North Mara and Bulyanhulu combined with lower laborcosts as a result of headcount reductions. For the three and nine monthperiods ended September 30, 2016, all-in sustaining
costs 2 decreased by $197 and $192 per ounce over the same prior yearperiods, primarily reflecting the lower cost of sales per ounce 3 .
Capital expenditures for the three and nine month periods ended September30, 2016, increased by 4% and 1%, respectively, compared to the sameprior year periods. The increase for the three month period was primarily dueto an increase in capitalized stripping costs at North Mara, partially offset bya decrease in sustaining capital expenditures at Bulyanhulu.
We expect Acacia’s 2016 gold production to be about 520 thousand ounces(Barrick’s share), higher than our previous guidance range of 480 to 500thousand ounce. We expect cost of sales to be in the range of $890 to $930per ounce. We expect both cash costs 2 and all-in sustaining costs 2 to betowards the bottom of our ranges of $670 to $700 per ounce and $950 to$980 per ounce, respectively.
Pascua-Lama, Argentina/Chile
BARRICK THIRD QUARTER 2016 46 MANAGEMENT’S DISCUSSION AND ANALYSIS
The Pascua-Lama project, located on the border between Chile andArgentina, is one of the world’s most attractive undeveloped gold and silverdeposits, with the potential to generate significant free cash flow over a longmine life. During the third quarter, we announced the appointment of GeorgeBee as Senior Vice President for Lama and Frontera District Development.Mr. Bee and his team are now advancing a scoping study on the use ofunderground mining methods for a Lama starter project on the Argentineanside of the Pascua-Lama project. Such a project could represent the firststage of a phased development plan for Pascua-Lama. Concurrently, theteam in Chile remains focused on optimizing the Chilean components of theproject, while addressing outstanding legal, regulatory, and permittingmatters.
Our Investment Committee will continue to scrutinize the project as itadvances, applying a high degree of consistency and rigor–as we do for allcapital allocation decisions at the company–before further review by theExecutive Committee and the Board at each stage of advancement.
U.S. Shareholder Class ActionOn May 31, 2016, the Company confirmed that it had reached a $140 millionsettlement in this matter. The amount of the settlement is insured. TheCompany continues to believe that the allegations by the lead plaintiffs in thismatter are unfounded, and under the terms of the settlement agreement, theCompany has not accepted any allegations of wrongdoing or liability.
SMA Regulatory Sanctions – Consolidated Administrative ProceedingOn April 4, 2016, the SMA issued two reports assessing water quality datapreviously provided by Compañía Minera Nevada (“CMN”). The SMArejected CMN’s challenge to certain aspects of these reports on April 25,2016. The SMA will consider these reports when issuing a newadministrative decision in this matter, as required by the March 3, 2014decision of the Environmental Court.
On June 8, 2016, the SMA consolidated the two administrative proceedingsagainst CMN into a single proceeding encompassing both thereconsideration of the 2013 Resolution in accordance with the decision of theEnvironmental Court and the alleged deviations from the Project’senvironmental approval notified by the SMA in April 2015. A final resolutionfrom the SMA with respect to these matters is pending.
Constitutional Protection ActionOn August 12, 2016, the court ruled in favor of CMN and the Chilean miningauthority (Sernageomin), rejecting the plaintiffs’ challenges to the Temporaryand Partial Closure Plan for the Pascua-Lama project. On August 19, 2016,the plaintiffs appealed the court’s decision to the Chilean Supreme Court. Ahearing has been requested and a decision from the Supreme Court on thismatter is pending.
Water Quality ReviewCMN initiated a review of the baseline water quality of the Rio Estrecho inAugust 2013 as required by a July 15, 2013 decision of the Court of Appealsof Copiapo, Chile. The purpose of the review was to establish whether thewater quality baseline has changed since the Pascua-Lama project receivedits environmental approval in February 2006 and, if so, to require CMN toadopt the appropriate corrective measures. As a result of that study, CMNrequested certain modifications to its environmental permit water qualityrequirements. On June 6, 2016, the responsible agency approved a partialamendment of the environmental permit to better reflect the water qualitybaseline from 2009. That approval was appealed by certain water users andindigenous residents of the Huasco Valley. On October 19, 2016, theChilean cabinet, which has jurisdiction over claims of this nature, voted touphold the permit amendments.
Water Treatment PlantThe water treatment plant on the Chilean side of the Pascua-Lama projectwas damaged during the second quarter of 2016 as a result of heavysnowfall. The water treatment plant consists of two main components, thehigh density sludge unit followed by the reverse osmosis unit. The damageto the facility is still under repair. On August 10, operation of the high densitysludge unit and discharges were reestablished. Exceptional snow fall duringthe winter and an early melt has increased inflows to the plant to an extentthat it is difficult to keep discharges within permit limits. CMN has reviewedits contingency plan with Chilean regulatory authorities.
COMMITMENTS AND CONTINGENCIES
Litigation and ClaimsWe are currently subject to various litigation proceedings as disclosed in note 18 to the Financial Statements, and we may be involved in disputes with otherparties in the future that may result in litigation. If we are unable to resolve these disputes favorably, it may have a material adverse impact on our financialcondition, cash flow and results of operations.
Contractual Obligations and Commitments
($ millions) Payments due
As at September 30, 2016
2016
1 2017 2018 2019 2020
2021 andthereafter Total
Debt 2 Repayment of principal $ 12 $ 105 $ 105 $ 381 $ 304 $ 7,576 $ 8,483 Capital leases 9 37 30 16 9 20 121 Interest 198 463 458 442 424 5,794 7,779
Provisions for environmental rehabilitation 3 56 80 106 117 109 1,797 2,265 Operating leases 7 19 18 11 7 15 77 Restricted share units - 60 29 - - - 89 Pension benefits and other post-retirement benefits 5 20 20 20 20 371 456 Derivative liabilities 4 33 60 29 2 - - 124 Purchase obligations for supplies and consumables 5 283 245 161 70 65 96 920 Capital commitments 6 44 15 5 4 4 27 99 Social development costs 7 14 5 3 2 2 150 176 Total $ 661 $ 1,109 $ 964 $ 1,065 $ 944 $ 15,846 $ 20,589 1 Represents the obligations and commitments for the remainder of the year.2 Debt and Interest - Our debt obligations do not include any subjective acceleration clauses or other clauses that enable the holder of the debt to call for early repayment,
except in the event that we breach any of the terms and conditions of the debt or for other customary events of default. The debt and interest amounts include 100% of thePueblo Viejo financing, even though our attributable share is 60 percent of this total, consistent with our ownership interest in the mine. We are not required to post anycollateral under any debt obligations. Projected interest payments on variable rate debt were based on interest rates in effect at September 30, 2016. Interest is calculatedon our long-term debt obligations using both fixed and variable rates.
3 Provisions for Environmental Rehabilitation - Amounts presented in the table represent the undiscounted uninflated future payments for the expected cost of provisions forenvironmental rehabilitation.
4 Derivative Liabilities - Amounts presented in the table relate to derivative contracts disclosed in note 24 to the 2015 Annual Report. Payments related to derivative contractsmay be subject to change given variable market conditions.
5 Purchase Obligations for Supplies and Consumables - Includes commitments related to new purchase obligations to secure a supply of acid, tires and cyanide for ourproduction process.
6 Capital Commitments - Purchase obligations for capital expenditures include only those items where binding commitments have been entered into.7 Social Development Costs - Includes Pascua-Lama’s commitment related to the potential funding of a power transmission line in Argentina of $107 million, which is not
expected to be paid prior to 2021. BARRICK THIRD QUARTER 2016 47 MANAGEMENT’S DISCUSSION AND ANALYSIS
REVIEW OF QUARTERLY RESULTS
Quarterly Information 1 2016 2015 2014 ($ millions, except where indicated) Q3 Q2 Q1 Q4 Q3 Q2 Q1 Q4 Revenues $ 2,297 $ 2,012 $ 1,930 $ 2,238 $ 2,315 $ 2,231 $ 2,245 $ 2,510 Realized price per ounce – gold 2 1,333 1,259 1,181 1,105 1,125 1,190 1,219 1,204 Realized price per pound – copper 2 2.18 2.14 2.18 2.16 2.18 2.66 2.55 2.91 Cost of sales 1,291 1,336 1,324 1,768 1,742 1,689 1,708 1,799 Net earnings (loss) 175 138 (83) (2,622) (264) (9) 57 (2,851)
Per share (dollars) 3 0.15 0.12 (0.07) (2.25) (0.23) (0.01) 0.05 (2.45) Adjusted net earnings 2 278 158 127 91 131 60 62 174
Per share (dollars) 2,3 0.24 0.14 0.11 0.08 0.11 0.05 0.05 0.15 Operating cash flow 4 951 527 451 698 1,255 525 316 371 Free cash flow 2,4 $ 674 $ 274 $ 181 $ 387 $ 866 $ 26 ($ 198) ($ 176) 1 Sum of all the quarters may not add up to the annual total due to rounding.2 Realized price, adjusted net earnings, adjusted net earnings per share and free cash flow are non-GAAP financial performance measures with no standardized meaning
under IFRS and therefore may not be comparable to similar measures of performance presented by other issuers. For further information and a detailed reconciliation ofeach non-GAAP measure used in this section of the MD&A to the most directly comparable IFRS measure, please see pages 49 to 62 of this MD&A.
3 Calculated using weighted average number of shares outstanding under the basic method of earnings per share.4 Q3 2015 includes $610 million of proceeds from the gold and silver streaming transaction with Royal Gold, Inc.
INTERNAL CONTROL OVER FINANCIAL REPORTING AND DISCLOSURE CONTROLS AND PROCEDURES
BARRICK THIRD QUARTER 2016 48 MANAGEMENT’S DISCUSSION AND ANALYSIS
Our recent financial results reflect our emphasis on cost control and growingoperating cash flow and free cash flow 2 . While gold prices have fluctuatedaround $1,200 per ounce, we have been able to record positive free cashflow 2 in six consecutive quarters as a result of our actions. In the fourthquarter 2015, we recorded asset and goodwill impairments of $2.6 billion(net of tax effects and non-controlling interests), primarily related to ourPueblo Viejo and Goldstrike mines and Pascua-Lama
project. In the third quarter of 2015, we recorded a goodwill impairmentcharge of $476 million relating to our Zaldívar mine upon reclassification ofthe mine’s net assets as held-for-sale, as the agreed selling price was lowerthan previously recognized carrying values. In the fourth quarter 2014, werecorded asset and goodwill impairments of $2.8 billion (net of tax effectsand non-controlling interests), primarily at Lumwana, Zaldívar and CerroCasale.
Management is responsible for establishing and maintaining adequateinternal control over financial reporting and disclosure controls andprocedures as defined in our 2015 annual MD&A.
Together, the internal control frameworks provide internal control overfinancial reporting and disclosure. Due to its inherent limitations, internalcontrol over financial reporting and disclosure may not prevent or detect allmisstatements. Further, the effectiveness of internal control is subject to therisk that
controls may become inadequate because of changes in conditions, or thatthe degree of compliance with policies or procedures may change.
Management will continue to monitor the effectiveness of its internal controlover financial reporting and disclosure controls and procedures, includingthose related to our management structure refinements, and may makemodifications from time to time as considered necessary.
IFRS CRITICAL ACCOUNTING POLICIES AND ACCOUNTING ESTIMATES
NON-GAAP FINANCIAL PERFORMANCE MEASURES THIRD QUARTER 2016
Adjusted Net Earnings and Adjusted Net Earnings per Share
BARRICK THIRD QUARTER 2016 49 MANAGEMENT’S DISCUSSION AND ANALYSIS
Management has discussed the development and selection of our criticalaccounting estimates with the Audit Committee of the Board of Directors,and the Audit Committee has reviewed the disclosure relating to suchestimates in conjunction with its review of this MD&A. The accountingpolicies and methods we utilize determine how we report our financialcondition and results of operations, and they may require Management tomake estimates or rely on assumptions about matters that are inherentlyuncertain. The consolidated financial statements have been prepared inaccordance with International Financial Reporting Standards (“IFRS”) asissued by the International Accounting Standards Board (“IASB”) under thehistorical cost convention, as modified by revaluation of certain financialassets, derivative contracts and post-retirement assets. Our
significant accounting policies are disclosed in note 2 of the financialstatements, including a summary of current and future changes inaccounting policies.
Critical Accounting Estimates and JudgmentsCertain accounting estimates have been identified as being “critical” to thepresentation of our financial condition and results of operations because theyrequire us to make subjective and/or complex judgments about matters thatare inherently uncertain; or there is a reasonable likelihood that materiallydifferent amounts could be reported under different conditions or usingdifferent assumptions and estimates. Our significant accounting judgments,estimates and assumptions are disclosed in note 3 of the accompanyingfinancial statements.
Adjusted net earnings is a non-GAAP financial measure which excludes thefollowing from net earnings:• Impairment charges (reversals) related to intangibles, goodwill, property,
plant and equipment, and investments;• Acquisition/disposition gains/losses;• Foreign currency translation gains/losses;• Significant tax adjustments;• Unrealized gains/losses on non-hedge derivative instruments; and• Tax effect and non-controlling interest of the above items.
Management uses this measure internally to evaluate our underlyingoperating performance for the reporting periods presented and to assist withthe planning and forecasting of future operating results. Managementbelieves that adjusted net earnings is a useful measure of our performancebecause impairment charges, acquisition/disposition gains/losses andsignificant tax adjustments do not reflect the underlying operatingperformance of our core mining business and are not necessarily indicativeof future operating results. Furthermore, foreign currency translationgains/losses and unrealized gains/losses from non-hedge derivatives are notnecessarily reflective of the underlying operating results for the reportingperiods presented. The tax effect and non-controlling interest of the adjustingitems are also excluded to reconcile the amounts to Barrick’s share on apost-tax basis, consistent with net earnings.
As noted, we use this measure for internal purposes. Management’s internalbudgets and forecasts and public guidance do not reflect the types of itemswe adjust for. Consequently, the presentation of adjusted net earningsenables investors and analysts to better understand the underlying operatingperformance of our core mining business through the eyes of Management.Management periodically evaluates the components of adjusted net earningsbased on an internal assessment of performance measures that are usefulfor evaluating the operating performance of our business segments and areview of the non-GAAP measures used by mining industry analysts andother mining companies.
Adjusted net earnings is intended to provide additional information only anddoes not have any standardized definition under IFRS and should not beconsidered in isolation or as a substitute for measures of performanceprepared in accordance with IFRS. The measures are not necessarilyindicative of operating profit or cash flow from operations as determinedunder IFRS. Other companies may calculate these measures differently. Thefollowing table reconciles these non-GAAP measures to the most directlycomparable IFRS measure.
Starting with the second quarter 2016 MD&A, we have amended thereconciliation from net earnings to adjusted net earnings to present theadjusting items on a pre-tax and fully consolidated basis and including thetax effect and non-controlling interest as a separate line. We

Reconciliation of Net Earnings to Net Earnings per Share, Adjusted Net Earnings and Adjusted Net Earnings per Share ($ millions, except per share amounts in dollars) For the three months ended September 30 For the nine months ended September 30
2016 2015 2016 2015 Net earnings (loss) attributable to equity holders of the Company $175 ($ 264) $ 230 $ (216) Impairment charges related to intangibles, goodwill, property, plant andequipment, and investments 49 452 54 492 Acquisition/disposition (gains)/losses 37 (54) 35 (80) Foreign currency translation (gains)/losses 19 (43) 181 (12) Significant tax adjustments 1 5 7 59 39 Other expense adjustments 2 1 67 75 95 Unrealized gains on non-hedge derivative instruments (12) 3 (23) 7 Tax effect and non-controlling interest 4 (37) (48) (72) Adjusted net earnings $278 $ 131 $ 563 $ 253 Net earnings (loss) per share 3 0.15 (0.23) 0.20 (0.19) Adjusted net earnings per share 3 0.24 0.11 0.48 0.22 1 Significant tax adjustments for the current year primarily relate to a tax provision booked by Acacia in Q1 2016.2 Other expense adjustments for the current year relate to losses on debt extinguishment, the impact of the decrease in the discount rate used to calculate the provision for
environmental remediation at our closed mines and a reduction in cost of sales attributed to insurance proceeds recorded in the third quarter of 2016 relating to the 2015oxygen plant motor failure at Pueblo Viejo.
3 Calculated using weighted average number of shares outstanding under the basic method of earnings per share.
Free Cash Flow
Reconciliation of Net Cash Provided by Operating Activities to Free Cash Flow ($ millions) For the three months ended September 30 For the nine months ended September 30
2016 2015 2016 2015 Net cash provided by operating activities $ 951 $ 1,255 $ 1,929 $ 2,096 Capital expenditures (277) (389) (800) (1,402) Free cash flow $ 674 $ 866 $ 1,129 $ 694 BARRICK THIRD QUARTER 2016 50 MANAGEMENT’S DISCUSSION AND ANALYSIS
believe that this change will assist analysts, investors and other stakeholdersof Barrick to better understand how we calculate this non-GAAPperformance measure and simplify how it
reconciles to our financial statements. This change to the presentation of ourreconciliation does not result in any change to the final calculation ofadjusted net earnings.
Free cash flow is a measure that excludes capital expenditures from netcash provided by operating activities. Management believes this to be auseful indicator of our ability to operate without reliance on additionalborrowing or usage of existing cash.
Free cash flow is intended to provide additional information only and doesnot have any standardized definition under IFRS, and
should not be considered in isolation or as a substitute for measures ofperformance prepared in accordance with IFRS. The measure is notnecessarily indicative of operating profit or cash flow from operations asdetermined under IFRS. Other companies may calculate this measuredifferently. The following table reconciles this non-GAAP measure to themost directly comparable IFRS measure.

Cash costs per ounce, All-in sustaining costs per ounce, All-in costs per ounce, C1 cash costs per pound and All-in sustaining costs per pound
BARRICK THIRD QUARTER 2016 51 MANAGEMENT’S DISCUSSION AND ANALYSIS
Beginning with our 2012 Annual Report, we adopted a non-GAAP “all-insustaining costs per ounce” measure based on the expectation that theWorld Gold Council (“WGC”) (a market development organization for thegold industry comprised of and funded by 18 gold mining companies fromaround the world, including Barrick) was developing a similar metric. TheWGC is not a regulatory organization. In June 2013, the WGC published itsdefinition of “adjusted operating costs”, “all-in sustaining costs” and also adefinition of “all-in costs”, and in the second quarter of 2013, Barrickvoluntarily adopted the WGC definition of these metrics. The “all-insustaining costs” measure is similar to our presentation in reports prior to thesecond quarter of 2013, with the exception of the classification of sustainingcapital. In our previous calculation, certain capital expenditures werepresented as mine expansion projects, whereas they meet the definition ofsustaining capital expenditures under the WGC definition, and thereforethese expenditures have been reclassified as sustaining capitalexpenditures. Starting in the fourth quarter 2014, the non-GAAP “adjustedoperating costs” was renamed “cash costs”. The manner in which thismeasure is calculated was not changed. Management uses “Cash costs”,“all-in sustaining costs”, “all-in costs” and “C1 cash costs” to monitor theperformance of the Company’s mining operations and its ability to generatepositive cash flow, both on an individual site basis and an overall companybasis.
Our “all-in costs” measure starts with “all-in sustaining costs” and addsadditional costs that reflect the varying costs of producing gold over the life-cycle of a mine, including: non-sustaining capital expenditures (capitalexpenditures at new projects and at existing operations related to projectsthat significantly increase the net present value of the mine and are notrelated to current production) and other non-sustaining costs (primarilyexploration and evaluation (“E&E”) costs, community relations costs andgeneral and administrative costs that are not associated with currentoperations). This definition recognizes that there are different costsassociated with the life-cycle of a mine, and that it is therefore appropriate todistinguish between sustaining and non-sustaining costs. We believe that ouruse of “all-in sustaining costs” and “all-in costs” will assist analysts, investorsand other stakeholders of Barrick in understanding the costs associated withproducing gold, understanding the economics of gold mining, assessing ouroperating performance and also our ability to generate free cash flow fromcurrent operations and to generate free cash flow on an overall companybasis.
Due to the capital-intensive nature of the industry and the long useful livesover which these items are depreciated, there can be a significant timingdifference between net earnings calculated in accordance with IFRS and theamount of free cash flow that is being generated by a mine. In the currentmarket environment for gold mining equities, many investors and analystsare more focused on the ability of gold mining companies to generate freecash flow from current operations, and consequently we believe thesemeasures are useful non- GAAP operating metrics and supplement our IFRSdisclosures. These measures are not representative of all of our cashexpenditures as they do not include income tax payments, interest costs ordividend payments. These measures do not include depreciation oramortization.
“Cash costs”, “all-in sustaining costs” and “all-in costs” are intended toprovide additional information only and do not have standardized definitionsunder IFRS, and should not be considered in isolation or as a substitute formeasures of performance prepared in accordance with IFRS. Thesemeasures are not equivalent to net income or cash flow from operations asdetermined under IFRS. Although the WGC has published a standardizeddefinition, other companies may calculate these measures differently.
In addition to presenting these metrics on a by-product basis, we havecalculated these metrics on a co-product basis. Our co-product metricsremove the impact of other metal sales that are produced as a by-product ofour gold production from cost per ounce calculations, but does not reflect areduction in costs for costs associated with other metal sales.
We believe that C1 cash costs per pound enables investors to betterunderstand the performance of our copper operations in comparison to othercopper producers who present results on a similar basis. C1 cash costs perpound excludes royalties and non-routine charges as they are not directproduction costs. Starting in the fourth quarter 2015 MD&A, we replaced thenon- GAAP measure “C3 fully allocated costs per pound” for our coppermines with “all-in sustaining costs per pound”. Similar to the gold all-insustaining costs metric, Management uses this to better evaluate the costsof copper production. We believe this change will enable investors to betterunderstand the operating performance of our copper mines as this measurereflects all of the sustaining expenditures incurred in order to producecopper. All-in sustaining costs per

BARRICK THIRD QUARTER 2016 52 MANAGEMENT’S DISCUSSION AND ANALYSIS
pound includes C1 cash costs, corporate general and administrative costs,minesite exploration and evaluation costs, royalties, environmentalrehabilitation costs and write-downs taken on inventory to net realizablevalue.
Starting with the third quarter of 2016 MD&A, we have presented thisreconciliation for each of our reportable operating segments. We believe thisadditional information will assist analysts, investors and other stakeholders ofBarrick in understanding the details of these non-GAAP metrics on asegment-by-segment basis.
Starting with the second quarter 2016 MD&A, we have condensed andsimplified the reconciliation from cost of sales to “cash costs”, “all-insustaining costs” and “all-in costs”, including on a per ounce basis for goldand per pound basis for copper, to present items on a fully consolidatedbasis and include non-controlling interest as a separate line. . As part of thissimplification, we have grouped several minor items into one line labeled“Other”, with further detail in the footnote to the
reconciliation. We believe that these changes will assist analysts, investorsand other stakeholders of Barrick to better understand how we calculatethese non-GAAP performance measures and simplifying how they reconcileto our financial statements. This change to the presentation of ourreconciliation does not result in any change to the figures calculated, exceptas noted below for “all-in costs”.
Also starting with the second quarter 2016 MD&A, we have adjusted theamount included as “project exploration and evaluation costs and projectcosts” as part of our “all-in costs” measure to include all exploration andevaluation costs related to our advanced mining and business improvementprojects and corporate development activities, where previously it did not.The impact of this adjustment for the three and nine months endedSeptember 30, 2016, was $11/oz and $23/oz, respectively (2015: $36/oz and$48/oz, respectively). We believe this change will assist analysts, investorsand other stakeholders of Barrick in understanding all of the expendituresrelated to growing our business.

Reconciliation of Gold Cost of Sales to Cash costs, All-in sustaining costs and All-in costs, including on a per ounce basis
($ millions, except per ounce information in dollars) For the three months ended
September 30, For the nine months ended
September 30, Footnote 2016 2015 2016 2015 Cost of sales related to gold production $ 1,202 $ 1,491 $ 3,632 $ 4,329
Depreciation (373) (399) (1,107) (1,151) By-product credits 1 (59) (54) (143) (166) Realized (gains)/losses on hedge and non-hedge derivatives 2 15 30 71 78 Non-recurring items 3 34 (61) 24 (61) Other 4 (9) 7 (24) 18 Non-controlling interests (Pueblo Viejo and Acacia) 5 (92) (104) (267) (316)
Cash costs $ 718 $ 910 $ 2,186 $ 2,731 General & administrative costs 71 44 217 181 Minesite exploration and evaluation costs 6 10 11 26 36 Minesite sustaining capital expenditures 7 236 342 646 1,056 Rehabilitation - accretion and amortization (operating sites) 8 16 43 41 119 Non-controlling interest, copper operations and other 9 (75) (119) (209) (276)
All-in sustaining costs $ 976 $ 1,231 $ 2,907 $ 3,847 Project exploration and evaluation and project costs 6 34 75 129 233 Community relations costs not related to current operations 1 5 6 12 Project capital expenditures 7 35 42 124 181 Rehabilitation - accretion and amortization (non-operating sites) 8 2 3 7 9 Non-controlling interest and copper operations 9 (7) (12) (38) (23)
All-in costs $ 1,041 $ 1,344 $ 3,135 $ 4,259 Ounces sold - equity basis (000s ounces) 10 1,386 1,596 3,984 4,447 Cost of sales per ounce 11,12 $ 766 $ 829 $ 803 $ 863 Cash costs per ounce 12 $ 518 $ 570 $ 549 $ 614 Cash costs per ounce (on a co-product basis) 12,13 $ 550 $ 592 $ 575 $ 639 All-in sustaining costs per ounce 12 $ 704 $ 771 $ 730 $ 866 All-in sustaining costs per ounce (on a co-product basis) 12,13 $ 736 $ 793 $ 756 $ 891 All-in costs per ounce 12 $ 751 $ 842 $ 787 $ 958 All-in costs per ounce (on a co-product basis) 12,13 $ 783 $ 864 $ 813 $ 983
1 By-product credits
Revenues include the sale of by-products for our gold and copper mines for the three months ended September 30, 2016, of $50 million (2015: $32 million) and the ninemonths ended September 30, 2016 of $110 million (2015: $106 million); energy sales from the Monte Rio power plant at our Pueblo Viejo Mine for the three months endedSeptember 30, 2016, of $9 million (2015: $22 million) and the nine months ended September 30, 2016, of $33 million (2015: $60 million).
2 Realized (gains)/losses on hedge and non-hedge derivatives
Includes realized hedge losses of $15 million and $59 million (2015: $24 million and $66 million, respectively) for the three and nine months ended September 30, 2016,respectively, and realized non-hedge losses of $nil and $12 million (2015: $6 million and $12 million, respectively) for the three and nine months ended September 30,2016, respectively. Refer to Note 5 of the Financial Statements for further information.
3 Non-recurring items
Non-recurring items in 2016 consist of $34 million in a reduction in cost of sales attributed to insurance proceeds recorded in the third quarter of 2016 relating to the 2015oxygen plant motor failure at Pueblo Viejo and $10 million in abnormal costs at Veladero. These gains/costs are not indicative of our cost of production and have beenexcluded from the calculation of cash costs.
4 Other
Other adjustments include adding the net margins related to power sales at Pueblo Viejo of $1 million and $5 million, respectively, (2015: $5 million and $10 million,respectively) and adding the cost of treatment and refining charges of $3 million and $12 million, respectively (2015: $3 million and $10 million, respectively). 2016includes the removal of cash costs associated with our Pierina mine which is mining incidental ounces as it enters closure of $14 million and $42 million, respectively.
BARRICK THIRD QUARTER 2016 53 MANAGEMENT’S DISCUSSION AND ANALYSIS

5 Non-controlling interests (Pueblo Viejo and Acacia)Non-controlling interests include non-controlling interests related to gold production of $124 million and $381 million, respectively, for the three and nine month periodsended September 30, 2016 (2015: $168 million and $493 million, respectively). Refer to Note 5 of the Financial Statements for further information.
6 Exploration and evaluation costs
Exploration, evaluation and project expenses are presented as minesite sustaining if it supports current mine operations and project if it relates to future projects. Refer topage 32 of this MD&A.
7 Capital expenditures
Capital expenditures are related to our gold sites only and are presented on a 100% accrued basis. They are split between minesite sustaining and project capitalexpenditures. Project capital expenditures are distinct projects designed to increase the net present value of the mine and are not related to current production. Significantprojects in the current year are Arturo, Cortez Lower Zone and Lagunas Norte Refractory Ore Project. Refer to page 31 of this MD&A.
8 Rehabilitation - accretion and amortization
Includes depreciation on the assets related to rehabilitation provisions of our gold operations and accretion on the rehabilitation provision of our gold operations, splitbetween operating and non-operating sites.
9 Non-controlling interest and copper operations
Removes general & administrative costs related to non-controlling interests and copper based on a percentage allocation of revenue. Also removes exploration, evaluationand project costs, rehabilitation costs and capital expenditures incurred by our copper sites and the non-controlling interest of our Acacia and Pueblo Viejo operatingsegment and Arturo. In 2016, figures remove the impact of Pierina. The impact is summarized as the following:
($ millions) For the three months ended
September 30, For the nine months ended
September 30, Non-controlling interest, copper operations and other 2016 2015 2016 2015
General & administrative costs ($ 8) ($ 23) ($ 31) ($ 48)
Minesite exploration and evaluation costs (2) (2) (6) (5)
Rehabilitation - accretion and amortization (operating sites) (2) (5) (5) (9)
Minesite sustaining capital expenditures (63) (89) (167) (214)
All-in sustaining costs total ($ 75) ($ 119) ($ 209) ($ 276)
Project exploration and evaluation and project costs (3) (2) (8) (2)
Project capital expenditures (4) (10) (30) (21)
All-in costs total ($ 7) ($ 12) ($ 38) ($ 23) 10 Ounces sold - equity basis
In 2016, figures remove the impact of Pierina as the mine is currently going through closure. 11 Cost of sales per ounce
In 2016, figures remove the cost of sales impact of Pierina of $17 million and $52 million, respectively for the three and nine month periods ended September 30, 2016, asthe mine is currently going through closure. Cost of sales per ounce excludes non-controlling interest related to gold productions. Cost of sales related to gold per ounce iscalculated using cost of sales on an attributable basis (removing the non-controlling interest of 40% Pueblo Viejo and 36.1% Acacia from cost of sales), divided byattributable gold ounces.
12 Per ounce figures
Cost of sales per ounce, cash costs per ounce, all-in sustaining costs per ounce and all-in costs per ounce may not calculate based on amounts presented in this tabledue to rounding.
13 Co-product costs per ounce
Cash costs per ounce, all-in sustaining costs per ounce and all-in costs per ounce presented on a co-product basis remove the impact of by-product credits of our goldproduction (net of non-controlling interest) calculated as:
($ millions) For the three months ended
September 30, For the nine months ended
September 30, 2016 2015 2016 2015
By-product credits $ 59 $ 54 $ 143 $ 166
Non-controlling interest (14) (16) (40) (48)
By-product credits (net of non-controlling interest) $ 45 $ 38 $ 103 $ 118 BARRICK THIRD QUARTER 2016 54 MANAGEMENT’S DISCUSSION AND ANALYSIS

Reconciliation of Gold Cost of Sales to Cash costs, All-in sustaining costs and All-in costs, including on a per ounce basis, by operatingsegment ($ millions, except per ounce information in dollars) For the three months ended September 30, 2016
Footnote Cortez Goldstrike Pueblo
Viejo Lagunas
Norte Veladero Turquoise
Ridge Acacia Cost of sales related to gold production $ 229 $ 240 $ 160 $ 71 $ 86 $ 45 $ 175
Depreciation (113) (83) (46) (22) (24) (8) (43) By-product credits 1 - (1) (36) (4) (6) - (9) Non-recurring items 2 - - 34 - - - - Other 3 - - - - - - 2 Non-controlling interests - - (47) - - - (45)
Cash costs $ 116 $ 156 $ 65 $ 45 $ 56 $ 37 80 General & administrative costs - - - - - - 26 Minesite exploration and evaluation costs 4 - 2 - 1 - - - Minesite sustaining capital expenditures 5 20 42 22 10 5 9 53 Rehabilitation - accretion and amortization (operating sites) 6 4 4 3 2 1 1 1 Non-controlling interests - - (10) - - - (28)
All-in sustaining costs $ 140 $ 204 $ 80 $ 58 $ 62 $ 47 132 Project capital expenditures 5 17 9 - 4 - Non-controlling interests - (4) - - - - -
All-in costs $ 157 $ 209 $ 80 $ 62 $ 62 $ 47 $ 132 Ounces sold - equity basis (000s ounces) 262 298 190 109 95 80 132 Cost of sales per ounce 7,8 $ 874 $ 805 $ 521 $ 651 $ 905 $ 563 $ 850 Cash costs per ounce 8 $ 442 $ 526 $ 345 $ 410 $ 586 $ 460 $ 598 Cash costs per ounce (on a co-product basis) 8,9 $ 442 $ 528 $ 481 $ 449 $ 660 $ 460 $ 632 All-in sustaining costs per ounce 8 $ 531 $ 681 $ 425 $ 530 $ 651 $ 583 $ 998 All-in sustaining costs per ounce (on a co-product basis) 8,9 $ 531 $ 683 $ 561 $ 569 $ 725 $ 583 $ 1,032 All-in costs per ounce 8 $ 595 $ 700 $ 425 $ 564 $ 651 $ 583 $ 1,000 All-in costs per ounce (on a co-product basis) 8,9 $ 595 $ 702 $ 561 $ 603 $ 725 $ 583 $ 1,034 BARRICK THIRD QUARTER 2016 55 MANAGEMENT’S DISCUSSION AND ANALYSIS
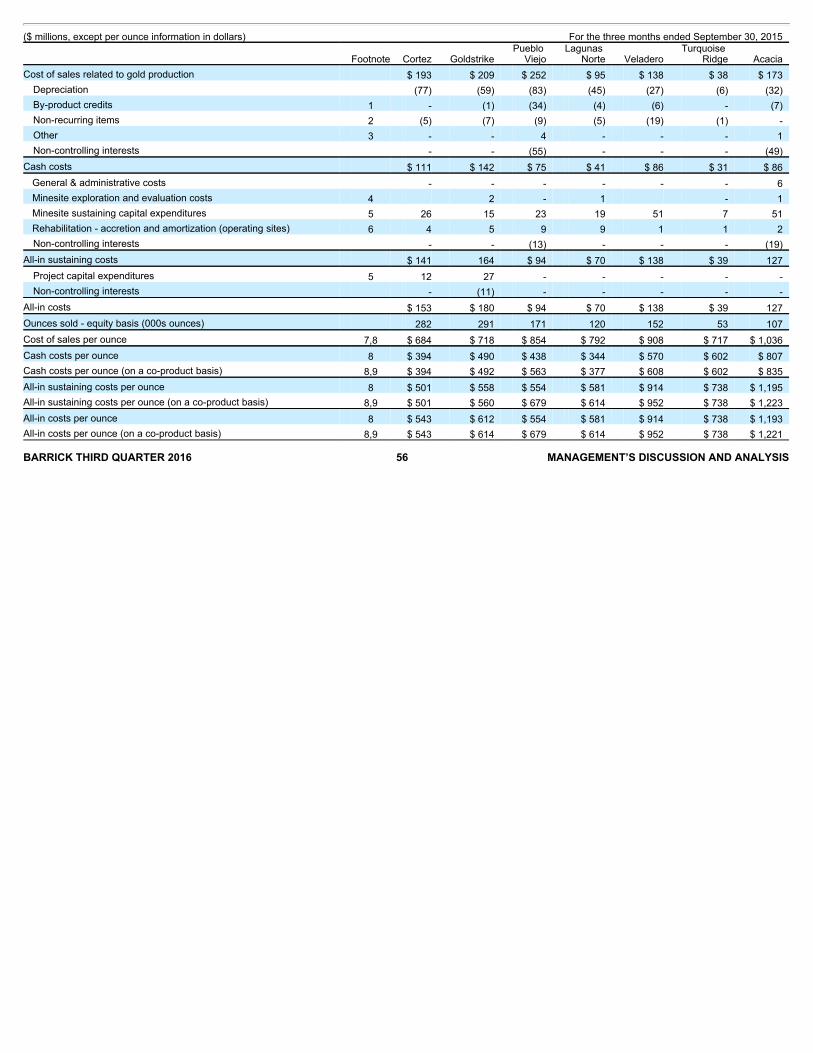
($ millions, except per ounce information in dollars) For the three months ended September 30, 2015
Footnote Cortez Goldstrike Pueblo
Viejo Lagunas
Norte Veladero Turquoise
Ridge Acacia Cost of sales related to gold production $ 193 $ 209 $ 252 $ 95 $ 138 $ 38 $ 173
Depreciation (77) (59) (83) (45) (27) (6) (32) By-product credits 1 - (1) (34) (4) (6) - (7) Non-recurring items 2 (5) (7) (9) (5) (19) (1) - Other 3 - - 4 - - - 1 Non-controlling interests - - (55) - - - (49)
Cash costs $ 111 $ 142 $ 75 $ 41 $ 86 $ 31 $ 86 General & administrative costs - - - - - - 6 Minesite exploration and evaluation costs 4 2 - 1 - 1 Minesite sustaining capital expenditures 5 26 15 23 19 51 7 51 Rehabilitation - accretion and amortization (operating sites) 6 4 5 9 9 1 1 2 Non-controlling interests - - (13) - - - (19)
All-in sustaining costs $ 141 164 $ 94 $ 70 $ 138 $ 39 127 Project capital expenditures 5 12 27 - - - - - Non-controlling interests - (11) - - - - -
All-in costs $ 153 $ 180 $ 94 $ 70 $ 138 $ 39 127 Ounces sold - equity basis (000s ounces) 282 291 171 120 152 53 107 Cost of sales per ounce 7,8 $ 684 $ 718 $ 854 $ 792 $ 908 $ 717 $ 1,036 Cash costs per ounce 8 $ 394 $ 490 $ 438 $ 344 $ 570 $ 602 $ 807 Cash costs per ounce (on a co-product basis) 8,9 $ 394 $ 492 $ 563 $ 377 $ 608 $ 602 $ 835 All-in sustaining costs per ounce 8 $ 501 $ 558 $ 554 $ 581 $ 914 $ 738 $ 1,195 All-in sustaining costs per ounce (on a co-product basis) 8,9 $ 501 $ 560 $ 679 $ 614 $ 952 $ 738 $ 1,223 All-in costs per ounce 8 $ 543 $ 612 $ 554 $ 581 $ 914 $ 738 $ 1,193 All-in costs per ounce (on a co-product basis) 8,9 $ 543 $ 614 $ 679 $ 614 $ 952 $ 738 $ 1,221 BARRICK THIRD QUARTER 2016 56 MANAGEMENT’S DISCUSSION AND ANALYSIS
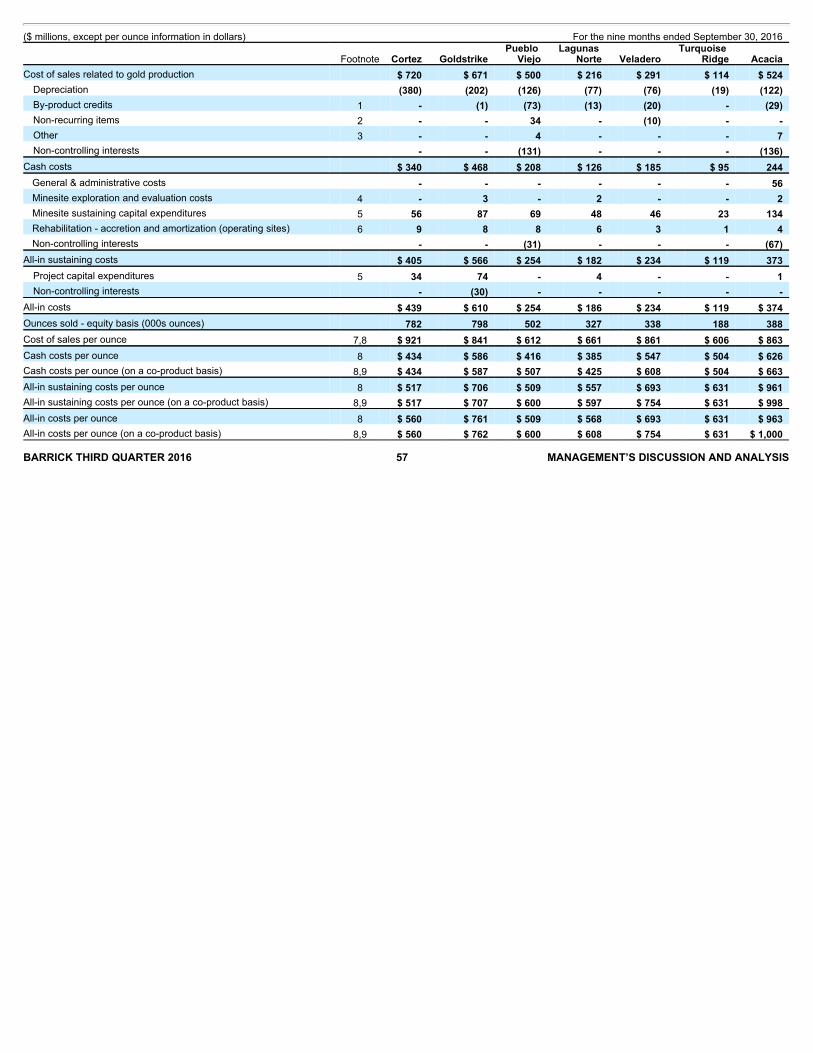
($ millions, except per ounce information in dollars) For the nine months ended September 30, 2016
Footnote Cortez Goldstrike Pueblo
Viejo Lagunas
Norte Veladero Turquoise
Ridge Acacia Cost of sales related to gold production $ 720 $ 671 $ 500 $ 216 $ 291 $ 114 $ 524
Depreciation (380) (202) (126) (77) (76) (19) (122) By-product credits 1 - (1) (73) (13) (20) - (29) Non-recurring items 2 - - 34 - (10) - - Other 3 - - 4 - - - 7 Non-controlling interests - - (131) - - - (136)
Cash costs $ 340 $ 468 $ 208 $ 126 $ 185 $ 95 244 General & administrative costs - - - - - - 56 Minesite exploration and evaluation costs 4 - 3 - 2 - - 2 Minesite sustaining capital expenditures 5 56 87 69 48 46 23 134 Rehabilitation - accretion and amortization (operating sites) 6 9 8 8 6 3 1 4 Non-controlling interests - - (31) - - - (67)
All-in sustaining costs $ 405 $ 566 $ 254 $ 182 $ 234 $ 119 373 Project capital expenditures 5 34 74 - 4 - - 1 Non-controlling interests - (30) - - - - -
All-in costs $ 439 $ 610 $ 254 $ 186 $ 234 $ 119 $ 374 Ounces sold - equity basis (000s ounces) 782 798 502 327 338 188 388 Cost of sales per ounce 7,8 $ 921 $ 841 $ 612 $ 661 $ 861 $ 606 $ 863 Cash costs per ounce 8 $ 434 $ 586 $ 416 $ 385 $ 547 $ 504 $ 626 Cash costs per ounce (on a co-product basis) 8,9 $ 434 $ 587 $ 507 $ 425 $ 608 $ 504 $ 663 All-in sustaining costs per ounce 8 $ 517 $ 706 $ 509 $ 557 $ 693 $ 631 $ 961 All-in sustaining costs per ounce (on a co-product basis) 8,9 $ 517 $ 707 $ 600 $ 597 $ 754 $ 631 $ 998 All-in costs per ounce 8 $ 560 $ 761 $ 509 $ 568 $ 693 $ 631 $ 963 All-in costs per ounce (on a co-product basis) 8,9 $ 560 $ 762 $ 600 $ 608 $ 754 $ 631 $ 1,000 BARRICK THIRD QUARTER 2016 57 MANAGEMENT’S DISCUSSION AND ANALYSIS
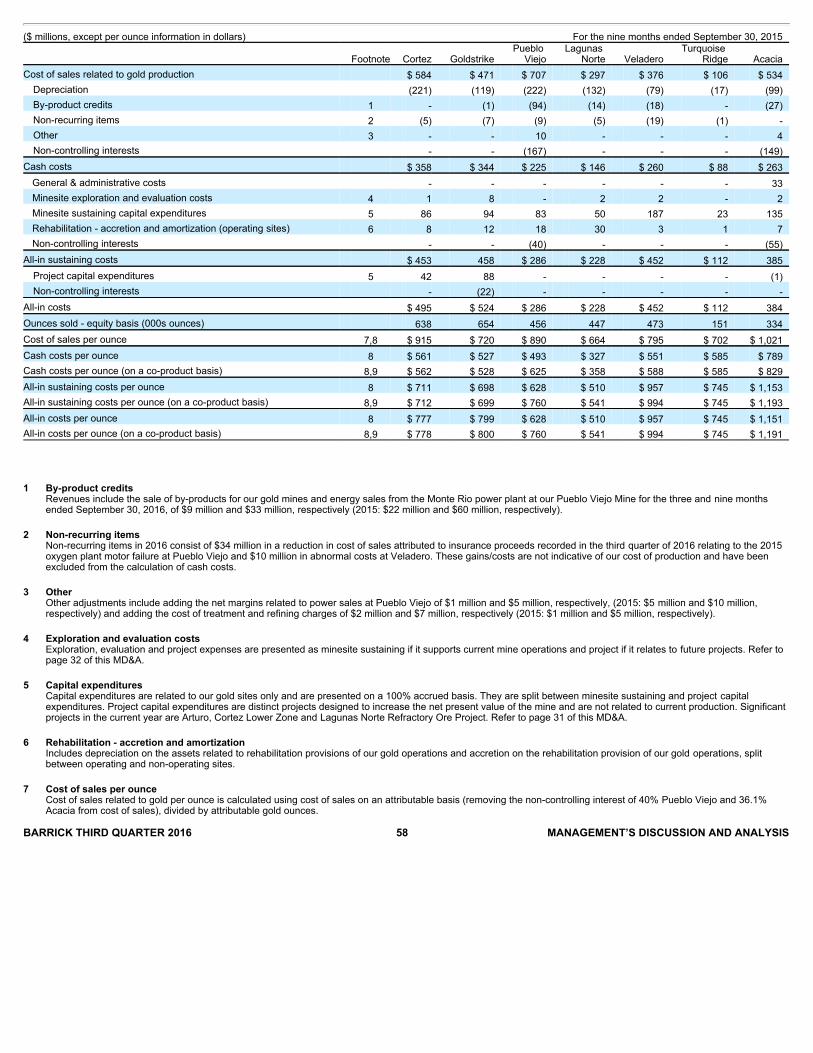
($ millions, except per ounce information in dollars) For the nine months ended September 30, 2015
Footnote Cortez Goldstrike Pueblo
Viejo Lagunas
Norte Veladero Turquoise
Ridge Acacia Cost of sales related to gold production $ 584 $ 471 $ 707 $ 297 $ 376 $ 106 $ 534
Depreciation (221) (119) (222) (132) (79) (17) (99) By-product credits 1 - (1) (94) (14) (18) - (27) Non-recurring items 2 (5) (7) (9) (5) (19) (1) - Other 3 - - 10 - - - 4 Non-controlling interests - - (167) - - - (149)
Cash costs $ 358 $ 344 $ 225 $ 146 $ 260 $ 88 $ 263 General & administrative costs - - - - - - 33 Minesite exploration and evaluation costs 4 1 8 - 2 2 - 2 Minesite sustaining capital expenditures 5 86 94 83 50 187 23 135 Rehabilitation - accretion and amortization (operating sites) 6 8 12 18 30 3 1 7 Non-controlling interests - - (40) - - - (55)
All-in sustaining costs $ 453 458 $ 286 $ 228 $ 452 $ 112 385 Project capital expenditures 5 42 88 - - - - (1) Non-controlling interests - (22) - - - - -
All-in costs $ 495 $ 524 $ 286 $ 228 $ 452 $ 112 384 Ounces sold - equity basis (000s ounces) 638 654 456 447 473 151 334 Cost of sales per ounce 7,8 $ 915 $ 720 $ 890 $ 664 $ 795 $ 702 $ 1,021 Cash costs per ounce 8 $ 561 $ 527 $ 493 $ 327 $ 551 $ 585 $ 789 Cash costs per ounce (on a co-product basis) 8,9 $ 562 $ 528 $ 625 $ 358 $ 588 $ 585 $ 829 All-in sustaining costs per ounce 8 $ 711 $ 698 $ 628 $ 510 $ 957 $ 745 $ 1,153 All-in sustaining costs per ounce (on a co-product basis) 8,9 $ 712 $ 699 $ 760 $ 541 $ 994 $ 745 $ 1,193 All-in costs per ounce 8 $ 777 $ 799 $ 628 $ 510 $ 957 $ 745 $ 1,151 All-in costs per ounce (on a co-product basis) 8,9 $ 778 $ 800 $ 760 $ 541 $ 994 $ 745 $ 1,191
1 By-product credits
Revenues include the sale of by-products for our gold mines and energy sales from the Monte Rio power plant at our Pueblo Viejo Mine for the three and nine monthsended September 30, 2016, of $9 million and $33 million, respectively (2015: $22 million and $60 million, respectively).
2 Non-recurring items
Non-recurring items in 2016 consist of $34 million in a reduction in cost of sales attributed to insurance proceeds recorded in the third quarter of 2016 relating to the 2015oxygen plant motor failure at Pueblo Viejo and $10 million in abnormal costs at Veladero. These gains/costs are not indicative of our cost of production and have beenexcluded from the calculation of cash costs.
3 Other
Other adjustments include adding the net margins related to power sales at Pueblo Viejo of $1 million and $5 million, respectively, (2015: $5 million and $10 million,respectively) and adding the cost of treatment and refining charges of $2 million and $7 million, respectively (2015: $1 million and $5 million, respectively).
4 Exploration and evaluation costs
Exploration, evaluation and project expenses are presented as minesite sustaining if it supports current mine operations and project if it relates to future projects. Refer topage 32 of this MD&A.
5 Capital expenditures
Capital expenditures are related to our gold sites only and are presented on a 100% accrued basis. They are split between minesite sustaining and project capitalexpenditures. Project capital expenditures are distinct projects designed to increase the net present value of the mine and are not related to current production. Significantprojects in the current year are Arturo, Cortez Lower Zone and Lagunas Norte Refractory Ore Project. Refer to page 31 of this MD&A.
6 Rehabilitation - accretion and amortization
Includes depreciation on the assets related to rehabilitation provisions of our gold operations and accretion on the rehabilitation provision of our gold operations, splitbetween operating and non-operating sites.
7 Cost of sales per ounce
Cost of sales related to gold per ounce is calculated using cost of sales on an attributable basis (removing the non-controlling interest of 40% Pueblo Viejo and 36.1%Acacia from cost of sales), divided by attributable gold ounces.
BARRICK THIRD QUARTER 2016 58 MANAGEMENT’S DISCUSSION AND ANALYSIS

8 Per ounce figuresCost of sales per ounce, cash costs per ounce, all-in sustaining costs per ounce and all-in costs per ounce may not calculate based on amounts presented in this tabledue to rounding.
9 Co-product costs per ounce
Cash costs per ounce, all-in sustaining costs per ounce and all-in costs per ounce presented on a co-product basis remove the impact of by-product credits of our goldproduction (net of non-controlling interest) calculated as:
($ millions) For the three months ended September 30, 2016 Cortez Goldstrike Pueblo Viejo Lagunas Norte Veladero Turquoise Ridge Acacia By-product credits
$-
$ 1
$ 36
$ 4
$ 6
$-
$ 9
Non-controlling interest
-
-
(11)
-
-
-
(3)
By-product credits (net of non-controllinginterest)
$-
$ 1
$ 25
$ 4
$ 6
$-
$ 6
For the three months ended September 30, 2015 Cortez Goldstrike Pueblo Viejo Lagunas Norte Veladero Turquoise Ridge Acacia By-product credits
$-
$ 1
$ 34
$ 4
$ 6
$-
$ 7
Non-controlling interest
-
-
(13)
-
-
-
(2)
By-product credits (net of non-controllinginterest)
$-
$ 1
$ 21
$ 4
$ 6
$-
$ 5
For the nine months ended September 30, 2016 Cortez Goldstrike Pueblo Viejo Lagunas Norte Veladero Turquoise Ridge Acacia By-product credits
$-
$ 1
$ 73
$ 13
$ 20
$-
$ 29
Non-controlling interest
-
-
(29)
-
-
-
(11)
By-product credits (net of non-controllinginterest)
$-
$ 1
$ 44
$ 13
$ 20
$-
$ 18
For the nine months ended September 30, 2015 Cortez Goldstrike Pueblo Viejo Lagunas Norte Veladero Turquoise Ridge Acacia By-product credits
$-
$ 1
$ 94
$ 14
$ 18
$-
$ 27
Non-controlling interest
-
-
(38)
-
-
-
(10)
By-product credits (net of non-controllinginterest)
$-
$ 1
$ 56
$ 14
$ 18
$-
$ 17
BARRICK THIRD QUARTER 2016 59 MANAGEMENT’S DISCUSSION AND ANALYSIS

Reconciliation of Copper Cost of Sales to C1 cash costs and All-in sustaining costs, including on a per pound basis ($ millions, except per pound information in dollars) For the three months ended September 30 For the nine months ended September 30 2016 2015 2016 2015 Cost of sales
$ 66
$ 209
$ 235
$ 698
Depreciation/amortization 1
(10)
(18)
(30)
(80)
Treatment and refinement charges
36
46
120
129
Cash cost of sales applicable to equity method investments 2
68
-
154
-
Less: royalties
(7)
(15)
(32)
(85)
C1 cash cost of sales
$ 153
$ 222
$ 447
$ 662
General & administrative costs
-
6
11
17
Rehabilitation - accretion and amortization
1
2
5
6
Royalties
7
15
32
85
Minesite sustaining capital expenditures
44
61
121
132
All-in sustaining costs
$ 205
$ 306
$ 616
$ 902
Pounds sold - consolidated basis (millions pounds)
102
145
298
378
Cost of sales per pound 3,4
$1.47
$1.44
$1.42
$1.85
C1 cash cost per pound 3
$1.50
$1.53
$1.50
$1.75
All-in sustaining costs per pound 3
$2.02
$2.11
$2.08
$2.39
1 For the three and nine month periods ended September 30, 2016, depreciation excludes $15 million and $34 million, respectively, of depreciation applicable to equitymethod investments.
2 For the three and nine month periods ended September 30, 2016, figures include $46 million and $131 million, respectively, of cash costs related to our 50% share ofZaldívar due to the divestment of 50% of our interest in the mine on December 1, 2015, as well as $23 million and $23 million, respectively of cash costs related to our 50%share of Jabal Sayid due to the divestment of 50% of our interest in the mine on December 4, 2014 and subsequent accounting as an equity method investments.
3 Cost of sales per pound, C1 cash costs per pound and all-in sustaining costs per pound may not calculate based on amounts presented in this table due to rounding.4 Cost of sales related to copper per pound is calculated using cost of sales including our proportionate share of cost of sales attributable to equity method investments
(Zaldívar and Jabal Sayid), divided by consolidated copper pounds (including our proportionate share of copper pounds from our equity method investments).
EBITDA and Adjusted EBITDA
BARRICK THIRD QUARTER 2016 60 MANAGEMENT’S DISCUSSION AND ANALYSIS
EBITDA is a non-GAAP financial measure, which excludes the following fromnet earnings:• Income tax expense;• Finance costs;• Finance income; and• Depreciation.
Management believes that EBITDA is a valuable indicator of our ability togenerate liquidity by producing operating cash flow to: fund working capitalneeds, service debt obligations, and fund capital expenditures. Managementuses EBITDA for this purpose. EBITDA is also frequently used by investorsand analysts for valuation purposes whereby EBITDA is multiplied by afactor or “EBITDA multiple” that is based on an observed or inferredrelationship between EBITDA and market values to determine theapproximate total enterprise value of a company.
Adjusted EBITDA removes the effect of “impairment charges”. Thesecharges are not reflective of our ability to generate liquidity by producingoperating cash flow, and therefore this adjustment will result in a moremeaningful valuation measure
for investors and analysts to evaluate our performance in the period andassess our future ability to generate liquidity.
EBITDA and adjusted EBITDA are intended to provide additional informationto investors and analysts and do not have any standardized definition underIFRS, and should not be considered in isolation or as a substitute formeasures of performance prepared in accordance with IFRS. EBITDA andadjusted EBITDA exclude the impact of cash costs of financing activities andtaxes, and the effects of changes in operating working capital balances, andtherefore are not necessarily indicative of operating profit or cash flow fromoperations as determined under IFRS. Other companies may calculateEBITDA and adjusted EBITDA differently.
Starting with the third quarter of 2016 MD&A, we have presented thisreconciliation for each of our reportable operating segments. We believe thisadditional information will assist analysts, investors and other stakeholders ofBarrick in understanding the details of this non-GAAP metrics on a segment-by-segment basis.
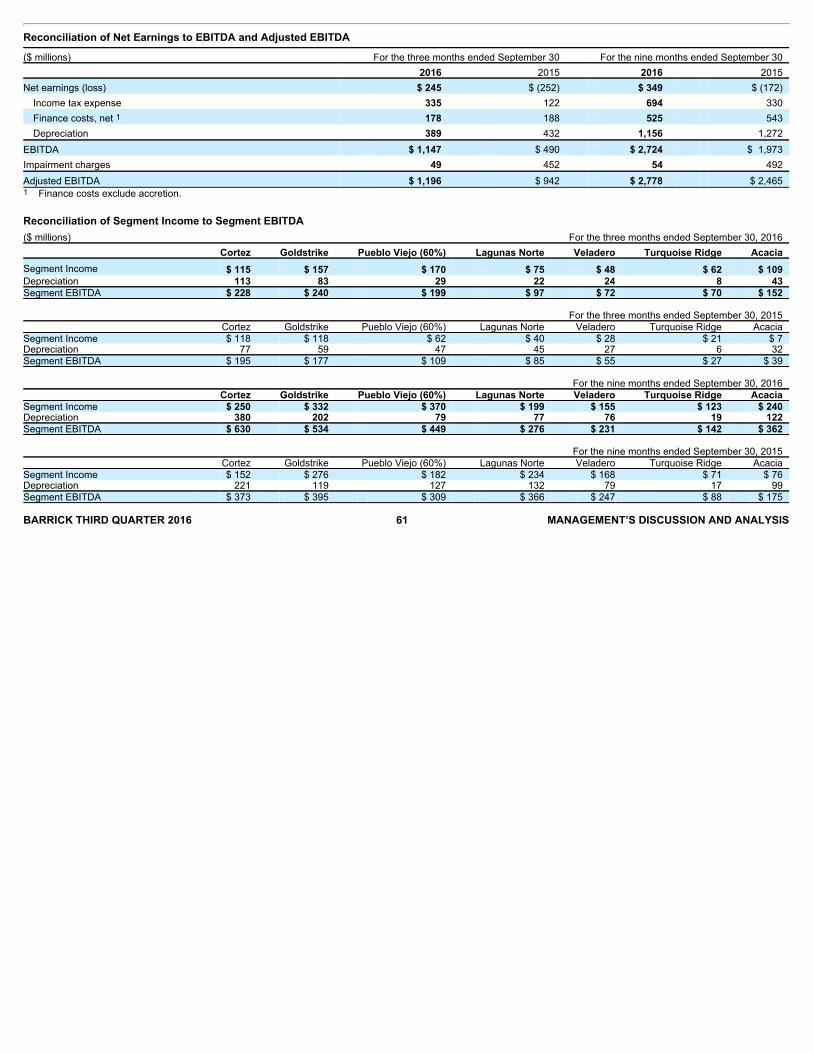
Reconciliation of Net Earnings to EBITDA and Adjusted EBITDA
($ millions) For the three months ended September 30 For the nine months ended September 30 2016 2015 2016 2015 Net earnings (loss)
$ 245
$ (252)
$ 349
$ (172)
Income tax expense
335
122
694
330
Finance costs, net 1
178
188
525
543
Depreciation
389
432
1,156
1,272
EBITDA
$ 1,147
$ 490
$ 2,724
$ 1,973
Impairment charges
49
452
54
492
Adjusted EBITDA
$ 1,196
$ 942
$ 2,778
$ 2,465
1 Finance costs exclude accretion.
Reconciliation of Segment Income to Segment EBITDA($ millions) For the three months ended September 30, 2016 Cortez Goldstrike Pueblo Viejo (60%) Lagunas Norte Veladero Turquoise Ridge Acacia
Segment Income
$ 115
$ 157
$ 170
$ 75
$ 48
$ 62
$ 109
Depreciation 113 83 29 22 24 8 43 Segment EBITDA $ 228 $ 240 $ 199 $ 97 $ 72 $ 70 $ 152
For the three months ended September 30, 2015 Cortez Goldstrike Pueblo Viejo (60%) Lagunas Norte Veladero Turquoise Ridge Acacia Segment Income $ 118 $ 118 $ 62 $ 40 $ 28 $ 21 $ 7 Depreciation 77 59 47 45 27 6 32 Segment EBITDA $ 195 $ 177 $ 109 $ 85 $ 55 $ 27 $ 39
For the nine months ended September 30, 2016 Cortez Goldstrike Pueblo Viejo (60%) Lagunas Norte Veladero Turquoise Ridge Acacia Segment Income $ 250 $ 332 $ 370 $ 199 $ 155 $ 123 $ 240 Depreciation 380 202 79 77 76 19 122 Segment EBITDA $ 630 $ 534 $ 449 $ 276 $ 231 $ 142 $ 362
For the nine months ended September 30, 2015 Cortez Goldstrike Pueblo Viejo (60%) Lagunas Norte Veladero Turquoise Ridge Acacia Segment Income $ 152 $ 276 $ 182 $ 234 $ 168 $ 71 $ 76 Depreciation 221 119 127 132 79 17 99 Segment EBITDA $ 373 $ 395 $ 309 $ 366 $ 247 $ 88 $ 175 BARRICK THIRD QUARTER 2016 61 MANAGEMENT’S DISCUSSION AND ANALYSIS
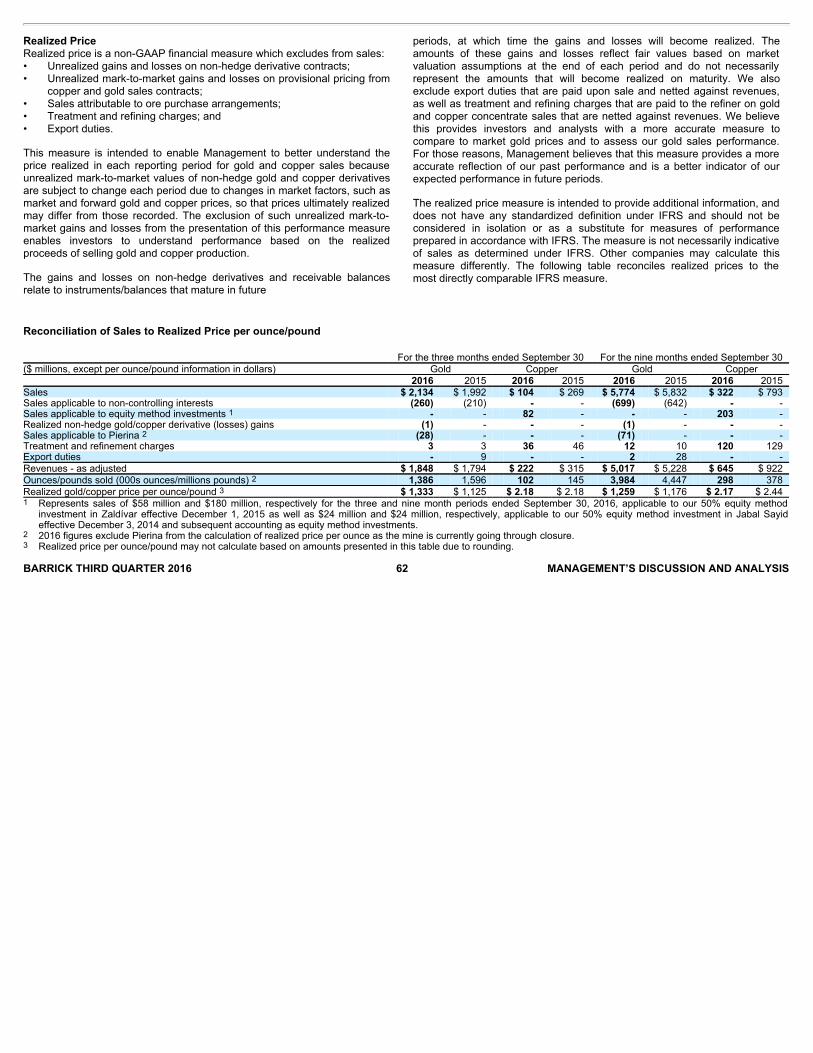
Reconciliation of Sales to Realized Price per ounce/pound For the three months ended September 30 For the nine months ended September 30 ($ millions, except per ounce/pound information in dollars) Gold Copper Gold Copper 2016 2015 2016 2015 2016 2015 2016 2015 Sales $ 2,134 $ 1,992 $ 104 $ 269 $ 5,774 $ 5,832 $ 322 $ 793 Sales applicable to non-controlling interests (260) (210) - - (699) (642) - - Sales applicable to equity method investments 1 - - 82 - - - 203 - Realized non-hedge gold/copper derivative (losses) gains (1) - - - (1) - - - Sales applicable to Pierina 2 (28) - - - (71) - - - Treatment and refinement charges 3 3 36 46 12 10 120 129 Export duties - 9 - - 2 28 - - Revenues - as adjusted $ 1,848 $ 1,794 $ 222 $ 315 $ 5,017 $ 5,228 $ 645 $ 922 Ounces/pounds sold (000s ounces/millions pounds) 2 1,386 1,596 102 145 3,984 4,447 298 378 Realized gold/copper price per ounce/pound 3 $ 1,333 $ 1,125 $ 2.18 $ 2.18 $ 1,259 $ 1,176 $ 2.17 $ 2.44 1 Represents sales of $58 million and $180 million, respectively for the three and nine month periods ended September 30, 2016, applicable to our 50% equity method
investment in Zaldívar effective December 1, 2015 as well as $24 million and $24 million, respectively, applicable to our 50% equity method investment in Jabal Sayideffective December 3, 2014 and subsequent accounting as equity method investments.
2 2016 figures exclude Pierina from the calculation of realized price per ounce as the mine is currently going through closure.3 Realized price per ounce/pound may not calculate based on amounts presented in this table due to rounding. BARRICK THIRD QUARTER 2016 62 MANAGEMENT’S DISCUSSION AND ANALYSIS
Realized PriceRealized price is a non-GAAP financial measure which excludes from sales:• Unrealized gains and losses on non-hedge derivative contracts;• Unrealized mark-to-market gains and losses on provisional pricing from
copper and gold sales contracts;• Sales attributable to ore purchase arrangements;• Treatment and refining charges; and• Export duties.
This measure is intended to enable Management to better understand theprice realized in each reporting period for gold and copper sales becauseunrealized mark-to-market values of non-hedge gold and copper derivativesare subject to change each period due to changes in market factors, such asmarket and forward gold and copper prices, so that prices ultimately realizedmay differ from those recorded. The exclusion of such unrealized mark-to-market gains and losses from the presentation of this performance measureenables investors to understand performance based on the realizedproceeds of selling gold and copper production.
The gains and losses on non-hedge derivatives and receivable balancesrelate to instruments/balances that mature in future
periods, at which time the gains and losses will become realized. Theamounts of these gains and losses reflect fair values based on marketvaluation assumptions at the end of each period and do not necessarilyrepresent the amounts that will become realized on maturity. We alsoexclude export duties that are paid upon sale and netted against revenues,as well as treatment and refining charges that are paid to the refiner on goldand copper concentrate sales that are netted against revenues. We believethis provides investors and analysts with a more accurate measure tocompare to market gold prices and to assess our gold sales performance.For those reasons, Management believes that this measure provides a moreaccurate reflection of our past performance and is a better indicator of ourexpected performance in future periods.
The realized price measure is intended to provide additional information, anddoes not have any standardized definition under IFRS and should not beconsidered in isolation or as a substitute for measures of performanceprepared in accordance with IFRS. The measure is not necessarily indicativeof sales as determined under IFRS. Other companies may calculate thismeasure differently. The following table reconciles realized prices to themost directly comparable IFRS measure.

NON-GAAP FINANCIAL PERFORMANCE MEASURES SECOND QUARTER 2016
These reconciliations have been included in this third quarter of 2016 MD&A for continuity and are unchanged from the reconciliations originally included in oursecond quarter 2016 MD&A, other than the inclusion of additional information.
Adjusted Net Earnings and Adjusted Net Earnings per Share
Reconciliation of Net Earnings to Net Earnings per Share, Adjusted Net Earnings and Adjusted Net Earnings per Share ($ millions, except per share amounts in dollars) For the three months ended June 30 For the six months ended June 30 2016 2015 2016 2015 Net earnings (loss) attributable to equity holders of the Company $ 138 ($ 9) $ 55 $ 48 Impairment charges related to intangibles, goodwill, property, plant and equipment, andinvestments 4 35 5 40 Acquisition/disposition (gains)/losses (11) (2) (2) (26) Foreign currency translation losses 23 33 162 31 Significant tax adjustments 1 3 26 54 32 Other expense adjustments 2 6 2 74 28 Unrealized gains on non-hedge derivative instruments (5) 3 (11) 4 Tax effect and non-controlling interest - (28) (52) (35) Adjusted net earnings $ 158 $ 60 $ 285 $ 122 Net earnings (loss) per share 3 0.12 (0.01) 0.05 0.04 Adjusted net earnings per share 3 0.14 0.05 0.24 0.10 1 Significant tax adjustments for the current year primarily relate to a tax provision booked by Acacia in Q1 2016.2 Other expense adjustments for the current year relate to losses on debt extinguishment and the impact of the decrease in the discount rate used to calculate the provision
for environmental remediation at our closed mines.3 Calculated using weighted average number of shares outstanding under the basic method of earnings per share.
Free Cash Flow
Reconciliation of Net Cash Provided by Operating Activities to Free Cash Flow ($ millions) For the three months ended June 30 For the six months ended June 30 2016 2015 2016 2015 Net cash provided by operating activities $ 527 $ 525 $ 978 $ 841 Capital expenditures (253) (499) (523) (1,013) Free cash flow $ 274 $ 26 $ 455 ($ 172) BARRICK THIRD QUARTER 2016 63 MANAGEMENT’S DISCUSSION AND ANALYSIS
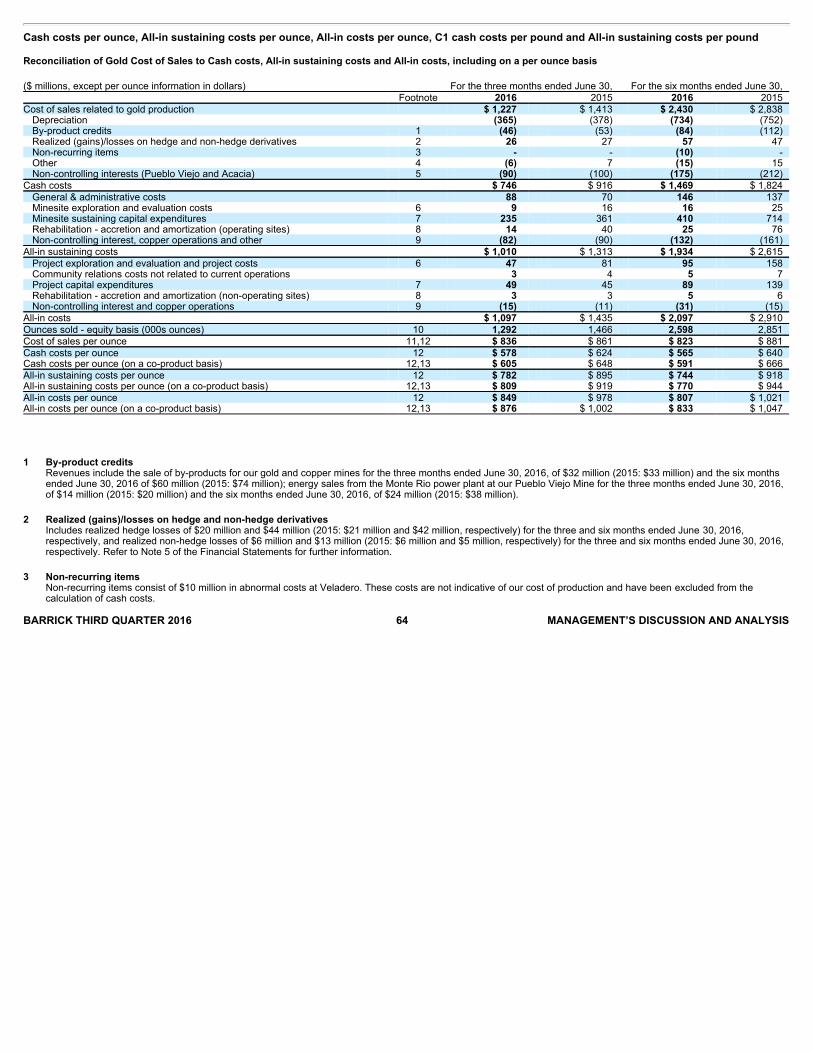
Cash costs per ounce, All-in sustaining costs per ounce, All-in costs per ounce, C1 cash costs per pound and All-in sustaining costs per pound
Reconciliation of Gold Cost of Sales to Cash costs, All-in sustaining costs and All-in costs, including on a per ounce basis ($ millions, except per ounce information in dollars) For the three months ended June 30, For the six months ended June 30, Footnote 2016 2015 2016 2015 Cost of sales related to gold production $ 1,227 $ 1,413 $ 2,430 $ 2,838
Depreciation (365) (378) (734) (752) By-product credits 1 (46) (53) (84) (112) Realized (gains)/losses on hedge and non-hedge derivatives 2 26 27 57 47 Non-recurring items 3 - - (10) - Other 4 (6) 7 (15) 15 Non-controlling interests (Pueblo Viejo and Acacia) 5 (90) (100) (175) (212)
Cash costs $ 746 $ 916 $ 1,469 $ 1,824 General & administrative costs 88 70 146 137 Minesite exploration and evaluation costs 6 9 16 16 25 Minesite sustaining capital expenditures 7 235 361 410 714 Rehabilitation - accretion and amortization (operating sites) 8 14 40 25 76 Non-controlling interest, copper operations and other 9 (82) (90) (132) (161)
All-in sustaining costs $ 1,010 $ 1,313 $ 1,934 $ 2,615 Project exploration and evaluation and project costs 6 47 81 95 158 Community relations costs not related to current operations 3 4 5 7 Project capital expenditures 7 49 45 89 139 Rehabilitation - accretion and amortization (non-operating sites) 8 3 3 5 6 Non-controlling interest and copper operations 9 (15) (11) (31) (15)
All-in costs $ 1,097 $ 1,435 $ 2,097 $ 2,910 Ounces sold - equity basis (000s ounces) 10 1,292 1,466 2,598 2,851 Cost of sales per ounce 11,12 $ 836 $ 861 $ 823 $ 881 Cash costs per ounce 12 $ 578 $ 624 $ 565 $ 640 Cash costs per ounce (on a co-product basis) 12,13 $ 605 $ 648 $ 591 $ 666 All-in sustaining costs per ounce 12 $ 782 $ 895 $ 744 $ 918 All-in sustaining costs per ounce (on a co-product basis) 12,13 $ 809 $ 919 $ 770 $ 944 All-in costs per ounce 12 $ 849 $ 978 $ 807 $ 1,021 All-in costs per ounce (on a co-product basis) 12,13 $ 876 $ 1,002 $ 833 $ 1,047
1 By-product credits
Revenues include the sale of by-products for our gold and copper mines for the three months ended June 30, 2016, of $32 million (2015: $33 million) and the six monthsended June 30, 2016 of $60 million (2015: $74 million); energy sales from the Monte Rio power plant at our Pueblo Viejo Mine for the three months ended June 30, 2016,of $14 million (2015: $20 million) and the six months ended June 30, 2016, of $24 million (2015: $38 million).
2 Realized (gains)/losses on hedge and non-hedge derivatives
Includes realized hedge losses of $20 million and $44 million (2015: $21 million and $42 million, respectively) for the three and six months ended June 30, 2016,respectively, and realized non-hedge losses of $6 million and $13 million (2015: $6 million and $5 million, respectively) for the three and six months ended June 30, 2016,respectively. Refer to Note 5 of the Financial Statements for further information.
3 Non-recurring items
Non-recurring items consist of $10 million in abnormal costs at Veladero. These costs are not indicative of our cost of production and have been excluded from thecalculation of cash costs.
BARRICK THIRD QUARTER 2016 64 MANAGEMENT’S DISCUSSION AND ANALYSIS

4 OtherOther adjustments include adding the net margins related to power sales at Pueblo Viejo of $2 million and $4 million, respectively, (2015: $5 million and $10 million,respectively) and adding the cost of treatment and refining charges of $4 million and $9 million, respectively (2015: $3 million and $6 million, respectively). 2016 includesthe removal of costs associated with our Pierina mine which is mining incidental ounces as it enters closure of $12 million and $28 million, respectively.
5 Non-controlling interests (Pueblo Viejo and Acacia)
Non-controlling interests include non-controlling interests related to gold production of $131 million and $257 million, respectively, for the three and six monthperiods ended June 30, 2016 (2015: $151 million and $325 million, respectively). Refer to Note 5 of the Financial Statements for further information.
6 Exploration and evaluation costs
Exploration, evaluation and project expenses are presented as minesite sustaining if it supports current mine operations and project if it relates to future projects. Refer topage 32 of this MD&A.
7 Capital expenditures
Capital expenditures are related to our gold sites only and are presented on a 100% accrued basis. They are split between minesite sustaining and project capitalexpenditures. Project capital expenditures are distinct projects designed to increase the net present value of the mine and are not related to current production. Significantprojects in the current year are Arturo and Cortez Lower Zone. Refer to page 31 of this MD&A.
8 Rehabilitation - accretion and amortization
Includes depreciation on the assets related to rehabilitation provisions of our gold operations and accretion on the rehabilitation provision of our gold operations, splitbetween operating and non-operating sites.
9 Non-controlling interest and copper operations
Removes general & administrative costs related to non-controlling interests and copper based on a percentage allocation of revenue. Also removes exploration, evaluationand project costs, rehabilitation costs and capital expenditures incurred by our copper sites and the non-controlling interest of our Acacia and Pueblo Viejo operatingsegment and Arturo. In 2016, figures remove the impact of Pierina. The impact is summarized as the following:
($ millions) For the three months ended
June 30, For the six months ended
June 30,
Non-controlling interest, copper operations and other 2016 2015 2016 2015
General & administrative costs ($ 12) ($ 14) ($ 22) ($ 26)
Minesite exploration and evaluation costs (2) (1) (4) (4)
Rehabilitation - accretion and amortization (operating sites) (2) (3) (3) (5)
Minesite sustaining capital expenditures (66) (72) (103) (126)
All-in sustaining costs total ($ 82) ($ 90) ($ 132) ($ 161)
Project exploration and evaluation and project costs (2) (2) (5) (4)
Project capital expenditures (13) (9) (26) (11)
All-in costs total ($ 15) ($ 11) ($ 31) ($ 15) 10 Ounces sold - equity basis
In 2016, figures remove the impact of Pierina as the mine is currently going through closure. 11 Cost of sales per ounce
In 2016, figures remove the cost of sales impact of Pierina of $16 million and $35 million, respectively, for the three and six month periods ended June 30, 2016, as themine is currently going through closure. Cost of sales related to gold per ounce is calculated using cost of sales on an attributable basis (removing the non-controllinginterest of 40% Pueblo Viejo and 36.1% Acacia from cost of sales), divided by attributable gold ounces.
12 Per ounce figures
Cost of sales per ounce, cash costs per ounce, all-in sustaining costs per ounce and all-in costs per ounce may not calculate based on amounts presented in this tabledue to rounding.
13 Co-product costs per ounce
Cash costs per ounce, all-in sustaining costs per ounce and all-in costs per ounce presented on a co-product basis remove the impact of by-product credits of our goldproduction (net of non-controlling interest) calculated as:
($ millions) For the three months ended
June 30, For the six months ended
June 30,
2016
2015 2016 2015
By-product credits $ 46 $ 53 $ 84 $ 112
Non-controlling interest (13) (14) (26) (32)
By-product credits (net of non-controlling interest) $ 33 $ 39 $ 58 $ 80 BARRICK THIRD QUARTER 2016 65 MANAGEMENT’S DISCUSSION AND ANALYSIS

Reconciliation of Gold Cost of Sales to Cash costs, All-in sustaining costs and All-in costs, including on a per ounce basis, by operating segment ($ millions, except per ounce information in dollars) For the three months ended June 30, 2016
Footnote Cortez Goldstrike
PuebloViejo
LagunasNorte Veladero
TurquoiseRidge Acacia
Cost of sales related to gold production $ 239 $ 219 $ 173 $ 77 $ 100 $ 34 $ 180 Depreciation (128) (60) (37) (27) (27) (5) (43) By-product credits 1 - - (19) (4) (8) - (11) Non-recurring items 2 - - - - - - - Other 3 - - 1 - - - 3 Non-controlling interests - - (44) - - - (46)
Cash costs $ 111 $ 159 $ 74 $ 46 $ 65 $ 29 83 General & administrative costs - - - - - - 21 Minesite exploration and evaluation costs 4 - 1 - 1 - - 1 Minesite sustaining capital expenditures 5 21 25 25 19 22 8 47 Rehabilitation - accretion and amortization (operating sites) 6 2 2 3 2 1 - 2 Non-controlling interests - - (12) - - - (26)
All-in sustaining costs $ 134 $ 187 $ 90 $ 68 $ 88 $ 37 128 Project capital expenditures 5 12 33 - - - - 1 Non-controlling interests - (13) - - - - -
All-in costs $ 146 $ 207 $ 90 $ 68 $ 88 $ 37 $ 129 Ounces sold - equity basis (000s ounces) 242 254 144 116 119 60 139 Cost of sales per ounce 7,8 $ 988 $ 862 $ 741 $ 663 $ 838 $ 572 $ 841 Cash costs per ounce 8 $ 457 $ 624 $ 515 $ 398 $ 551 $ 486 $ 595 Cash costs per ounce (on a co-product basis) 8,9 $ 458 $ 626 $ 579 $ 431 $ 615 $ 486 $ 635 All-in sustaining costs per ounce 8 $ 558 $ 737 $ 634 $ 585 $ 744 $ 621 $ 926 All-in sustaining costs per ounce (on a co-product basis) 8,9 $ 559 $ 739 $ 698 $ 618 $ 808 $ 621 $ 966 All-in costs per ounce 8 $ 603 $ 814 $ 634 $ 585 $ 744 $ 621 $ 929 All-in costs per ounce (on a co-product basis) 8,9 $ 604 $ 816 $ 698 $ 618 $ 808 $ 621 $ 969 BARRICK THIRD QUARTER 2016 66 MANAGEMENT’S DISCUSSION AND ANALYSIS
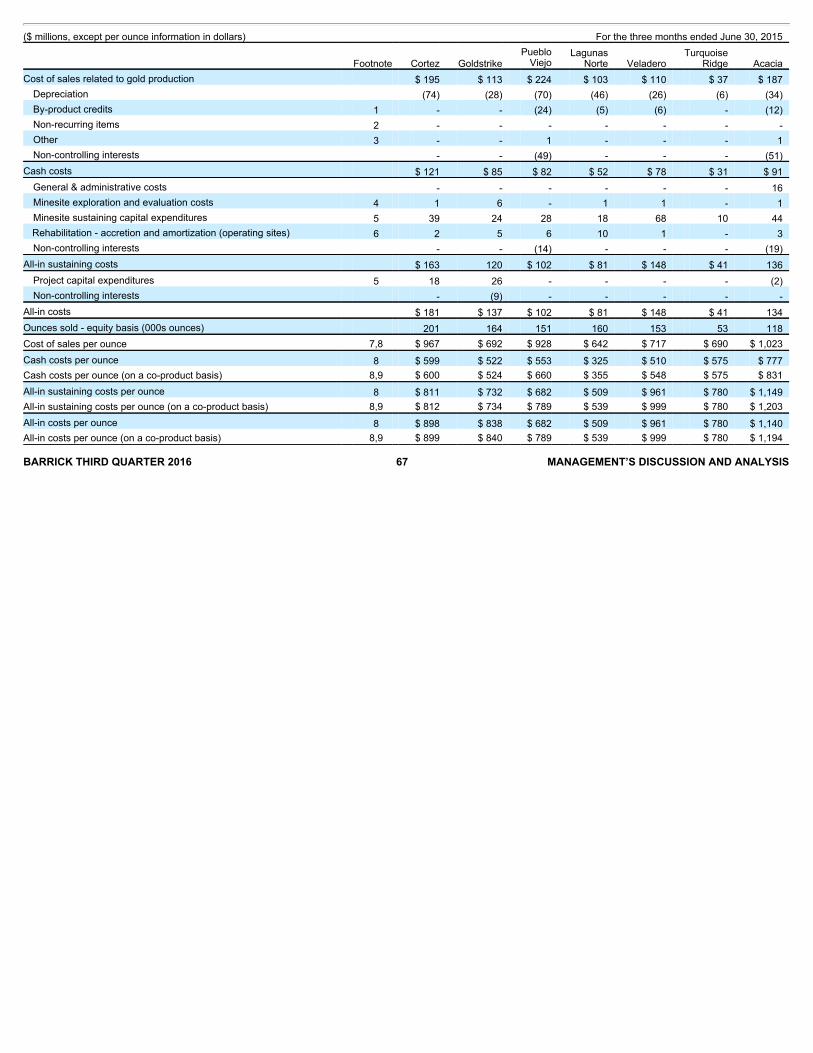
($ millions, except per ounce information in dollars) For the three months ended June 30, 2015
Footnote Cortez Goldstrike
PuebloViejo
LagunasNorte Veladero
TurquoiseRidge Acacia
Cost of sales related to gold production $ 195 $ 113 $ 224 $ 103 $ 110 $ 37 $ 187 Depreciation (74) (28) (70) (46) (26) (6) (34) By-product credits 1 - - (24) (5) (6) - (12) Non-recurring items 2 - - - - - - - Other 3 - - 1 - - - 1 Non-controlling interests - - (49) - - - (51)
Cash costs $ 121 $ 85 $ 82 $ 52 $ 78 $ 31 $ 91 General & administrative costs - - - - - - 16 Minesite exploration and evaluation costs 4 1 6 - 1 1 - 1 Minesite sustaining capital expenditures 5 39 24 28 18 68 10 44 Rehabilitation - accretion and amortization (operating sites) 6 2 5 6 10 1 - 3 Non-controlling interests - - (14) - - - (19)
All-in sustaining costs $ 163 120 $ 102 $ 81 $ 148 $ 41 136 Project capital expenditures 5 18 26 - - - - (2) Non-controlling interests - (9) - - - - -
All-in costs $ 181 $ 137 $ 102 $ 81 $ 148 $ 41 134 Ounces sold - equity basis (000s ounces) 201 164 151 160 153 53 118 Cost of sales per ounce 7,8 $ 967 $ 692 $ 928 $ 642 $ 717 $ 690 $ 1,023 Cash costs per ounce 8 $ 599 $ 522 $ 553 $ 325 $ 510 $ 575 $ 777 Cash costs per ounce (on a co-product basis) 8,9 $ 600 $ 524 $ 660 $ 355 $ 548 $ 575 $ 831 All-in sustaining costs per ounce 8 $ 811 $ 732 $ 682 $ 509 $ 961 $ 780 $ 1,149 All-in sustaining costs per ounce (on a co-product basis) 8,9 $ 812 $ 734 $ 789 $ 539 $ 999 $ 780 $ 1,203 All-in costs per ounce 8 $ 898 $ 838 $ 682 $ 509 $ 961 $ 780 $ 1,140 All-in costs per ounce (on a co-product basis) 8,9 $ 899 $ 840 $ 789 $ 539 $ 999 $ 780 $ 1,194 BARRICK THIRD QUARTER 2016 67 MANAGEMENT’S DISCUSSION AND ANALYSIS

($ millions, except per ounce information in dollars) For the six months ended June 30, 2016
Footnote Cortez Goldstrike
PuebloViejo
LagunasNorte Veladero
TurquoiseRidge Acacia
Cost of sales related to gold production $ 491 $ 431 $ 340 $ 145 $ 205 $ 69 $ 349 Depreciation (267) (119) (80) (55) (52) (11) (79) By-product credits 1 - - (37) (9) (14) - (20) Non-recurring items 2 - - - - (10) - - Other 3 - - 4 - - - 5 Non-controlling interests - - (84) - - - (91)
Cash costs $ 224 $ 312 $ 143 $ 81 $ 129 $ 58 164 General & administrative costs - - - - - - 30 Minesite exploration and evaluation costs 4 - 1 - 1 - - 2 Minesite sustaining capital expenditures 5 36 45 47 38 41 14 81 Rehabilitation - accretion and amortization (operating sites) 6 5 4 5 4 2 - 3 Non-controlling interests - - (21) - - - (39)
All-in sustaining costs $ 265 $ 362 $ 174 $ 124 $ 172 $ 72 241 Project capital expenditures 5 17 65 - - - - 1 Non-controlling interests - (26) - - - - -
All-in costs $ 282 $ 401 $ 174 $ 124 $ 172 $ 72 $ 242 Ounces sold - equity basis (000s ounces) 520 501 312 217 243 108 256 Cost of sales per ounce 7,8 $ 944 $ 862 $ 668 $ 665 $ 842 $ 641 $ 876 Cash costs per ounce 8 $ 430 $ 623 $ 459 $ 372 $ 531 $ 536 $ 640 Cash costs per ounce (on a co-product basis) 8,9 $ 430 $ 624 $ 525 $ 413 $ 586 $ 536 $ 678 All-in sustaining costs per ounce 8 $ 511 $ 722 $ 559 $ 571 $ 709 $ 668 $ 941 All-in sustaining costs per ounce (on a co-product basis) 8,9 $ 511 $ 723 $ 625 $ 612 $ 764 $ 668 $ 979 All-in costs per ounce 8 $ 543 $ 799 $ 559 $ 571 $ 709 $ 668 $ 943 All-in costs per ounce (on a co-product basis) 8,9 $ 543 $ 800 $ 625 $ 612 $ 764 $ 668 $ 981 BARRICK THIRD QUARTER 2016 68 MANAGEMENT’S DISCUSSION AND ANALYSIS
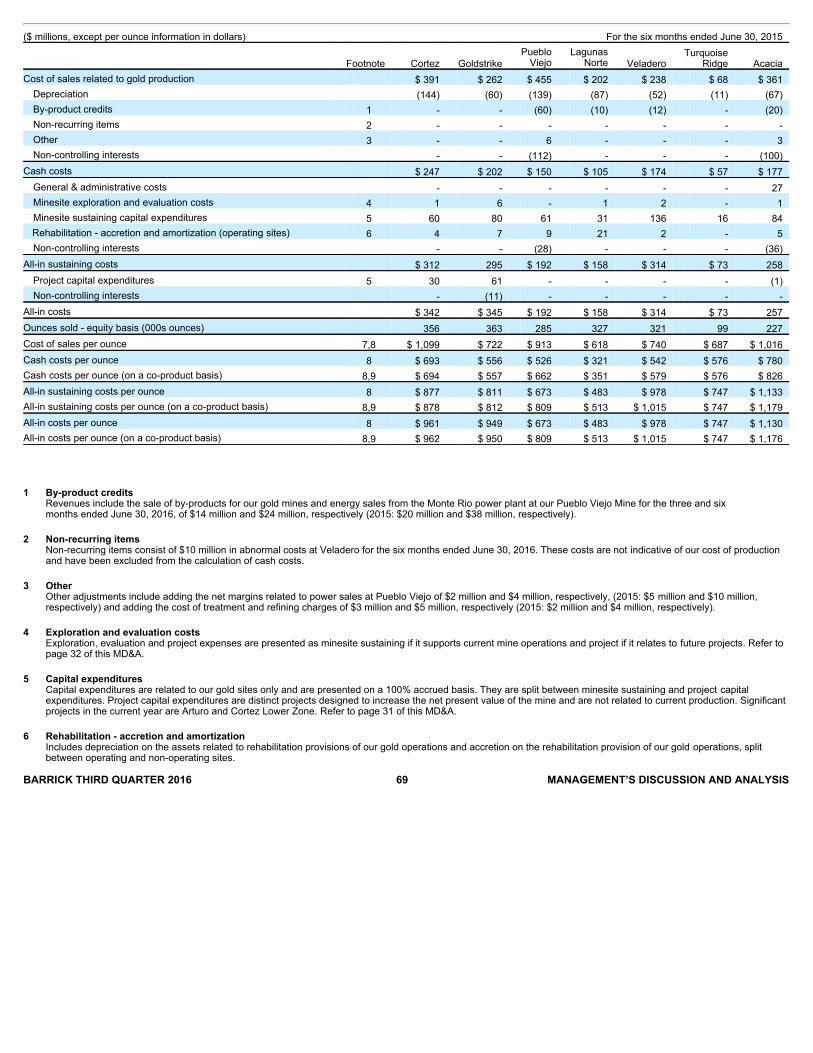
($ millions, except per ounce information in dollars) For the six months ended June 30, 2015
Footnote Cortez Goldstrike
PuebloViejo
LagunasNorte Veladero
TurquoiseRidge Acacia
Cost of sales related to gold production $ 391 $ 262 $ 455 $ 202 $ 238 $ 68 $ 361 Depreciation (144) (60) (139) (87) (52) (11) (67) By-product credits 1 - - (60) (10) (12) - (20) Non-recurring items 2 - - - - - - - Other 3 - - 6 - - - 3 Non-controlling interests - - (112) - - - (100)
Cash costs $ 247 $ 202 $ 150 $ 105 $ 174 $ 57 $ 177 General & administrative costs - - - - - - 27 Minesite exploration and evaluation costs 4 1 6 - 1 2 - 1 Minesite sustaining capital expenditures 5 60 80 61 31 136 16 84 Rehabilitation - accretion and amortization (operating sites) 6 4 7 9 21 2 - 5 Non-controlling interests - - (28) - - - (36)
All-in sustaining costs $ 312 295 $ 192 $ 158 $ 314 $ 73 258 Project capital expenditures 5 30 61 - - - - (1) Non-controlling interests - (11) - - - - -
All-in costs $ 342 $ 345 $ 192 $ 158 $ 314 $ 73 257 Ounces sold - equity basis (000s ounces) 356 363 285 327 321 99 227 Cost of sales per ounce 7,8 $ 1,099 $ 722 $ 913 $ 618 $ 740 $ 687 $ 1,016 Cash costs per ounce 8 $ 693 $ 556 $ 526 $ 321 $ 542 $ 576 $ 780 Cash costs per ounce (on a co-product basis) 8,9 $ 694 $ 557 $ 662 $ 351 $ 579 $ 576 $ 826 All-in sustaining costs per ounce 8 $ 877 $ 811 $ 673 $ 483 $ 978 $ 747 $ 1,133 All-in sustaining costs per ounce (on a co-product basis) 8,9 $ 878 $ 812 $ 809 $ 513 $ 1,015 $ 747 $ 1,179 All-in costs per ounce 8 $ 961 $ 949 $ 673 $ 483 $ 978 $ 747 $ 1,130 All-in costs per ounce (on a co-product basis) 8,9 $ 962 $ 950 $ 809 $ 513 $ 1,015 $ 747 $ 1,176
1 By-product credits
Revenues include the sale of by-products for our gold mines and energy sales from the Monte Rio power plant at our Pueblo Viejo Mine for the three and sixmonths ended June 30, 2016, of $14 million and $24 million, respectively (2015: $20 million and $38 million, respectively).
2 Non-recurring items
Non-recurring items consist of $10 million in abnormal costs at Veladero for the six months ended June 30, 2016. These costs are not indicative of our cost of productionand have been excluded from the calculation of cash costs.
3 Other
Other adjustments include adding the net margins related to power sales at Pueblo Viejo of $2 million and $4 million, respectively, (2015: $5 million and $10 million,respectively) and adding the cost of treatment and refining charges of $3 million and $5 million, respectively (2015: $2 million and $4 million, respectively).
4 Exploration and evaluation costs
Exploration, evaluation and project expenses are presented as minesite sustaining if it supports current mine operations and project if it relates to future projects. Refer topage 32 of this MD&A.
5 Capital expenditures
Capital expenditures are related to our gold sites only and are presented on a 100% accrued basis. They are split between minesite sustaining and project capitalexpenditures. Project capital expenditures are distinct projects designed to increase the net present value of the mine and are not related to current production. Significantprojects in the current year are Arturo and Cortez Lower Zone. Refer to page 31 of this MD&A.
6 Rehabilitation - accretion and amortization
Includes depreciation on the assets related to rehabilitation provisions of our gold operations and accretion on the rehabilitation provision of our gold operations, splitbetween operating and non-operating sites.
BARRICK THIRD QUARTER 2016 69 MANAGEMENT’S DISCUSSION AND ANALYSIS
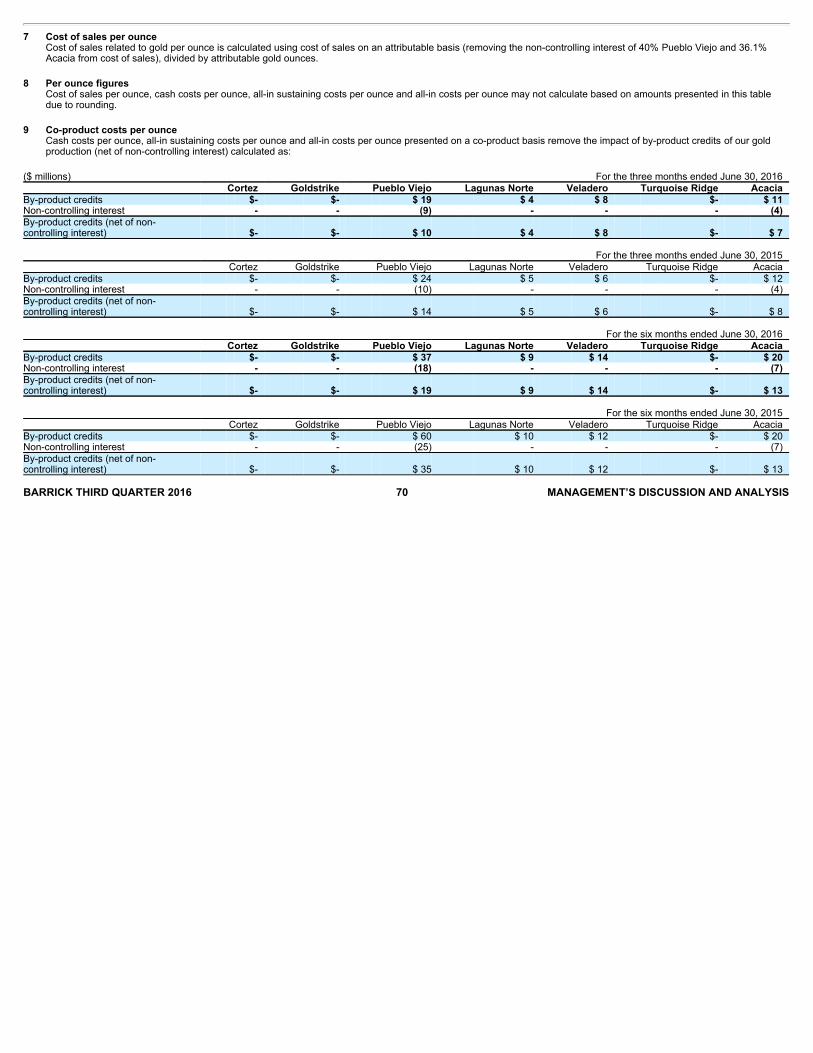
7 Cost of sales per ounceCost of sales related to gold per ounce is calculated using cost of sales on an attributable basis (removing the non-controlling interest of 40% Pueblo Viejo and 36.1%Acacia from cost of sales), divided by attributable gold ounces.
8 Per ounce figures
Cost of sales per ounce, cash costs per ounce, all-in sustaining costs per ounce and all-in costs per ounce may not calculate based on amounts presented in this tabledue to rounding.
9 Co-product costs per ounce
Cash costs per ounce, all-in sustaining costs per ounce and all-in costs per ounce presented on a co-product basis remove the impact of by-product credits of our goldproduction (net of non-controlling interest) calculated as:
($ millions) For the three months ended June 30, 2016 Cortez Goldstrike Pueblo Viejo Lagunas Norte Veladero Turquoise Ridge Acacia By-product credits $- $- $ 19 $ 4 $ 8 $- $ 11 Non-controlling interest - - (9) - - - (4) By-product credits (net of non-controlling interest) $- $- $ 10 $ 4 $ 8 $- $ 7
For the three months ended June 30, 2015 Cortez Goldstrike Pueblo Viejo Lagunas Norte Veladero Turquoise Ridge Acacia By-product credits $- $- $ 24 $ 5 $ 6 $- $ 12 Non-controlling interest - - (10) - - - (4) By-product credits (net of non-controlling interest) $- $- $ 14 $ 5 $ 6 $- $ 8
For the six months ended June 30, 2016 Cortez Goldstrike Pueblo Viejo Lagunas Norte Veladero Turquoise Ridge Acacia By-product credits $- $- $ 37 $ 9 $ 14 $- $ 20 Non-controlling interest - - (18) - - - (7) By-product credits (net of non-controlling interest) $- $- $ 19 $ 9 $ 14 $- $ 13
For the six months ended June 30, 2015 Cortez Goldstrike Pueblo Viejo Lagunas Norte Veladero Turquoise Ridge Acacia By-product credits $- $- $ 60 $ 10 $ 12 $- $ 20 Non-controlling interest - - (25) - - - (7) By-product credits (net of non-controlling interest) $- $- $ 35 $ 10 $ 12 $- $ 13 BARRICK THIRD QUARTER 2016 70 MANAGEMENT’S DISCUSSION AND ANALYSIS

Reconciliation of Copper Cost of Sales to C1 cash costs and All-in sustaining costs, including on a per pound basis ($ millions, except per pound information in dollars) For the three months ended June 30 For the six months ended June 30 2016 2015 2016 2015 Cost of sales $ 79 $ 238 $ 169 $ 489
Depreciation/amortization 1 (9) (26) (20) (63) Treatment and refinement charges 38 41 84 83 Cash costs applicable to equity method investments 2 43 - 84 - Less: royalties (10) (35) (25) (69)
C1 cash cost of sales $ 141 $ 218 $ 292 $ 440 General & administrative costs 5 5 12 12 Rehabilitation - accretion and amortization 2 2 3 4 Royalties 10 35 25 69 Minesite sustaining capital expenditures 41 44 70 71
All-in sustaining costs $ 199 $ 304 $402 $ 596 Pounds sold - consolidated basis (millions pounds) 93 112 196 233 Cost of sales per pound 3,4 $1.43 $2.13 $1.39 $2.10 C1 cash cost per pound 3 $1.52 $ 1.94 $1.49 $ 1.89 All-in sustaining costs per pound 3 $2.14 $2.72 $2.05 $2.56 1 For the three and six month periods ended June 30, 2016, depreciation excludes $11 million and $19 million, respectively, of depreciation applicable to equity method
investments.2 For the three and six month periods ended June 30, 2016, figures include $43 million and $84 million, respectively, of cash costs related to our 50% share of Zaldívar due to
the divestment of 50% of our interest in the mine on December 1 , 2015, and subsequent accounting as an equity method investment.3 Cost of sales per pound, C1 cash costs per pound and all-in sustaining costs per pound may not calculate based on amounts presented in this table due to rounding.4 Cost of sales related to copper per pound is calculated using cost of sales including our proportionate share of cost of sales attributable to equity method investments
(Zaldívar and Jabal Sayid), divided by consolidated copper pounds (including our proportionate share of copper pounds from our equity method investments).
EBITDA and Adjusted EBITDA
Reconciliation of Net Earnings to EBITDA and Adjusted EBITDA ($ millions) For the three months ended June 30 For the six months ended June 30 2016 2015 2016 2015 Net earnings (loss) $ 176 $ (9) $ 104 $ 80
Income tax expense 173 103 359 208 Finance costs, net 1 150 177 347 355 Depreciation 382 419 767 840
EBITDA $ 881 $ 690 $ 1,577 $ 1,483 Impairment charges 4 35 5 40 Adjusted EBITDA $ 885 $ 725 $ 1,582 $ 1,523 1 Finance costs exclude accretion. BARRICK THIRD QUARTER 2016 71 MANAGEMENT’S DISCUSSION AND ANALYSIS
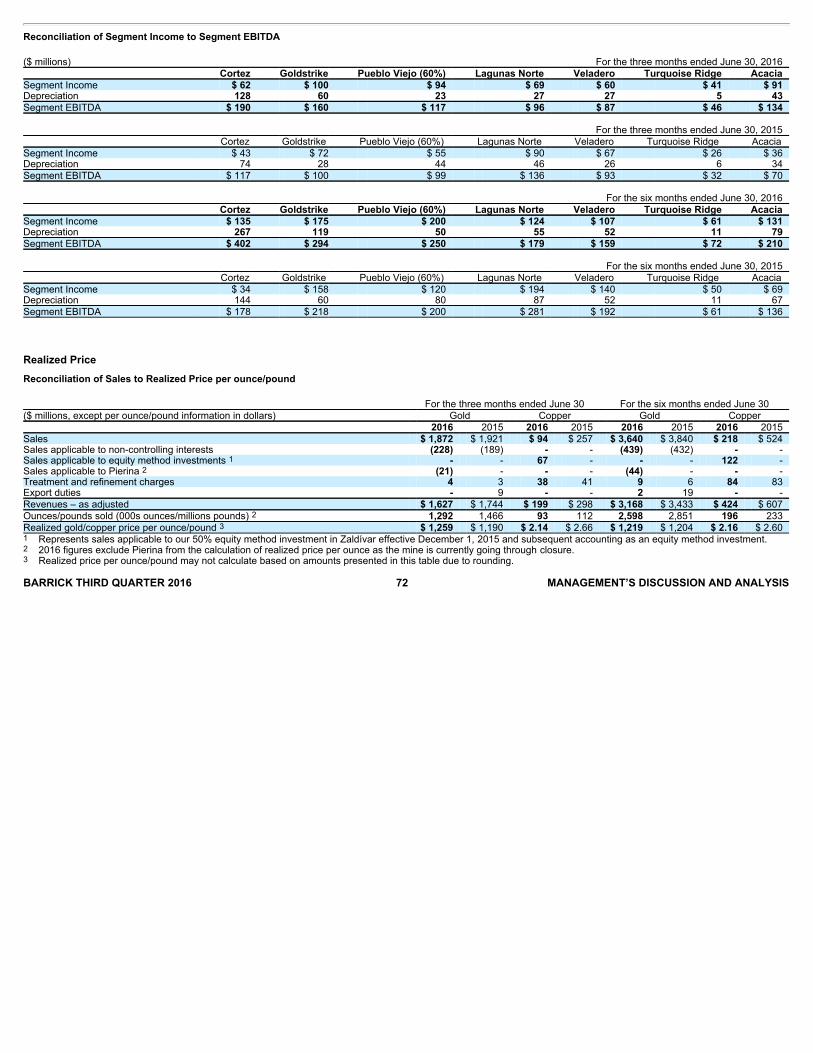
Reconciliation of Segment Income to Segment EBITDA ($ millions) For the three months ended June 30, 2016 Cortez Goldstrike Pueblo Viejo (60%) Lagunas Norte Veladero Turquoise Ridge Acacia Segment Income $ 62 $ 100 $ 94 $ 69 $ 60 $ 41 $ 91 Depreciation 128 60 23 27 27 5 43 Segment EBITDA $ 190 $ 160 $ 117 $ 96 $ 87 $ 46 $ 134
For the three months ended June 30, 2015 Cortez Goldstrike Pueblo Viejo (60%) Lagunas Norte Veladero Turquoise Ridge Acacia Segment Income $ 43 $ 72 $ 55 $ 90 $ 67 $ 26 $ 36 Depreciation 74 28 44 46 26 6 34 Segment EBITDA $ 117 $ 100 $ 99 $ 136 $ 93 $ 32 $ 70
For the six months ended June 30, 2016 Cortez Goldstrike Pueblo Viejo (60%) Lagunas Norte Veladero Turquoise Ridge Acacia Segment Income $ 135 $ 175 $ 200 $ 124 $ 107 $ 61 $ 131 Depreciation 267 119 50 55 52 11 79 Segment EBITDA $ 402 $ 294 $ 250 $ 179 $ 159 $ 72 $ 210
For the six months ended June 30, 2015 Cortez Goldstrike Pueblo Viejo (60%) Lagunas Norte Veladero Turquoise Ridge Acacia Segment Income $ 34 $ 158 $ 120 $ 194 $ 140 $ 50 $ 69 Depreciation 144 60 80 87 52 11 67 Segment EBITDA $ 178 $ 218 $ 200 $ 281 $ 192 $ 61 $ 136
Realized PriceReconciliation of Sales to Realized Price per ounce/pound For the three months ended June 30 For the six months ended June 30 ($ millions, except per ounce/pound information in dollars) Gold Copper Gold Copper 2016 2015 2016 2015 2016 2015 2016 2015 Sales $ 1,872 $ 1,921 $ 94 $ 257 $ 3,640 $ 3,840 $ 218 $ 524 Sales applicable to non-controlling interests (228) (189) - - (439) (432) - - Sales applicable to equity method investments 1 - - 67 - - - 122 - Sales applicable to Pierina 2 (21) - - - (44) - - - Treatment and refinement charges 4 3 38 41 9 6 84 83 Export duties - 9 - - 2 19 - - Revenues – as adjusted $ 1,627 $ 1,744 $ 199 $ 298 $ 3,168 $ 3,433 $ 424 $ 607 Ounces/pounds sold (000s ounces/millions pounds) 2 1,292 1,466 93 112 2,598 2,851 196 233 Realized gold/copper price per ounce/pound 3 $ 1,259 $ 1,190 $ 2.14 $ 2.66 $ 1,219 $ 1,204 $ 2.16 $ 2.60 1 Represents sales applicable to our 50% equity method investment in Zaldívar effective December 1, 2015 and subsequent accounting as an equity method investment.2 2016 figures exclude Pierina from the calculation of realized price per ounce as the mine is currently going through closure.3 Realized price per ounce/pound may not calculate based on amounts presented in this table due to rounding. BARRICK THIRD QUARTER 2016 72 MANAGEMENT’S DISCUSSION AND ANALYSIS
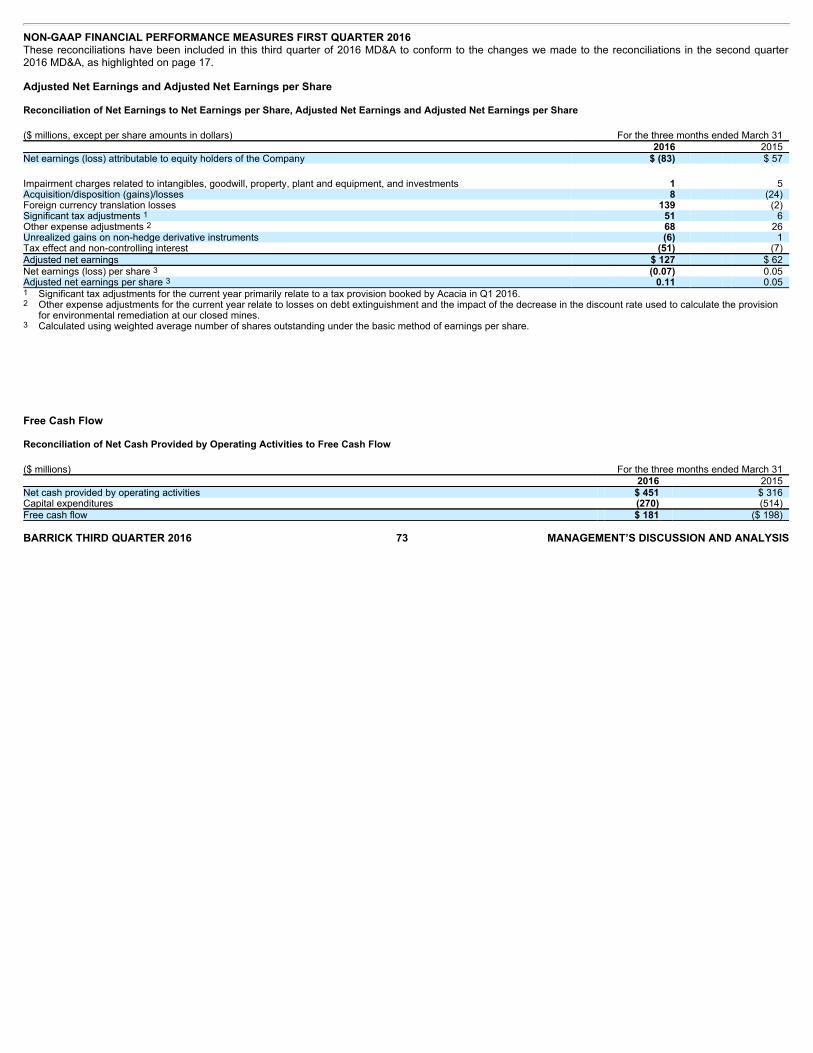
NON-GAAP FINANCIAL PERFORMANCE MEASURES FIRST QUARTER 2016These reconciliations have been included in this third quarter of 2016 MD&A to conform to the changes we made to the reconciliations in the second quarter2016 MD&A, as highlighted on page 17.
Adjusted Net Earnings and Adjusted Net Earnings per Share
Reconciliation of Net Earnings to Net Earnings per Share, Adjusted Net Earnings and Adjusted Net Earnings per Share ($ millions, except per share amounts in dollars) For the three months ended March 31 2016 2015 Net earnings (loss) attributable to equity holders of the Company $ (83) $ 57
Impairment charges related to intangibles, goodwill, property, plant and equipment, and investments 1 5 Acquisition/disposition (gains)/losses 8 (24) Foreign currency translation losses 139 (2) Significant tax adjustments 1 51 6 Other expense adjustments 2 68 26 Unrealized gains on non-hedge derivative instruments (6) 1 Tax effect and non-controlling interest (51) (7) Adjusted net earnings $ 127 $ 62 Net earnings (loss) per share 3 (0.07) 0.05 Adjusted net earnings per share 3 0.11 0.05 1 Significant tax adjustments for the current year primarily relate to a tax provision booked by Acacia in Q1 2016.2 Other expense adjustments for the current year relate to losses on debt extinguishment and the impact of the decrease in the discount rate used to calculate the provision
for environmental remediation at our closed mines.3 Calculated using weighted average number of shares outstanding under the basic method of earnings per share.
Free Cash Flow
Reconciliation of Net Cash Provided by Operating Activities to Free Cash Flow ($ millions) For the three months ended March 31 2016 2015 Net cash provided by operating activities $ 451 $ 316 Capital expenditures (270) (514) Free cash flow $ 181 ($ 198) BARRICK THIRD QUARTER 2016 73 MANAGEMENT’S DISCUSSION AND ANALYSIS
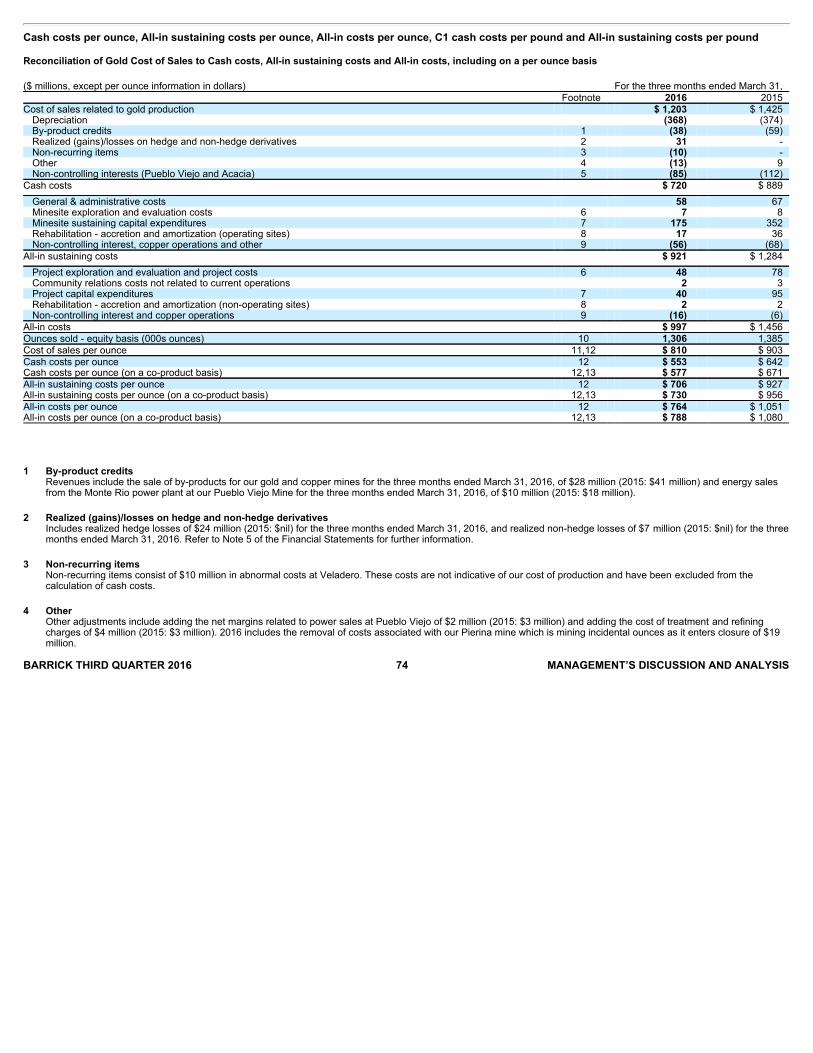
Cash costs per ounce, All-in sustaining costs per ounce, All-in costs per ounce, C1 cash costs per pound and All-in sustaining costs per pound
Reconciliation of Gold Cost of Sales to Cash costs, All-in sustaining costs and All-in costs, including on a per ounce basis ($ millions, except per ounce information in dollars) For the three months ended March 31, Footnote 2016 2015 Cost of sales related to gold production $ 1,203 $ 1,425
Depreciation (368) (374) By-product credits 1 (38) (59) Realized (gains)/losses on hedge and non-hedge derivatives 2 31 - Non-recurring items 3 (10) - Other 4 (13) 9 Non-controlling interests (Pueblo Viejo and Acacia) 5 (85) (112)
Cash costs
$ 720
$ 889
General & administrative costs 58 67 Minesite exploration and evaluation costs 6 7 8 Minesite sustaining capital expenditures 7 175 352 Rehabilitation - accretion and amortization (operating sites) 8 17 36 Non-controlling interest, copper operations and other 9 (56) (68)
All-in sustaining costs
$ 921
$ 1,284
Project exploration and evaluation and project costs 6 48 78 Community relations costs not related to current operations 2 3 Project capital expenditures 7 40 95 Rehabilitation - accretion and amortization (non-operating sites) 8 2 2 Non-controlling interest and copper operations 9 (16) (6)
All-in costs $ 997 $ 1,456 Ounces sold - equity basis (000s ounces) 10 1,306 1,385 Cost of sales per ounce 11,12 $ 810 $ 903 Cash costs per ounce 12 $ 553 $ 642 Cash costs per ounce (on a co-product basis) 12,13 $ 577 $ 671 All-in sustaining costs per ounce 12 $ 706 $ 927 All-in sustaining costs per ounce (on a co-product basis) 12,13 $ 730 $ 956 All-in costs per ounce 12 $ 764 $ 1,051 All-in costs per ounce (on a co-product basis) 12,13 $ 788 $ 1,080
1 By-product credits
Revenues include the sale of by-products for our gold and copper mines for the three months ended March 31, 2016, of $28 million (2015: $41 million) and energy salesfrom the Monte Rio power plant at our Pueblo Viejo Mine for the three months ended March 31, 2016, of $10 million (2015: $18 million).
2 Realized (gains)/losses on hedge and non-hedge derivatives
Includes realized hedge losses of $24 million (2015: $nil) for the three months ended March 31, 2016, and realized non-hedge losses of $7 million (2015: $nil) for the threemonths ended March 31, 2016. Refer to Note 5 of the Financial Statements for further information.
3 Non-recurring items
Non-recurring items consist of $10 million in abnormal costs at Veladero. These costs are not indicative of our cost of production and have been excluded from thecalculation of cash costs.
4 Other
Other adjustments include adding the net margins related to power sales at Pueblo Viejo of $2 million (2015: $3 million) and adding the cost of treatment and refiningcharges of $4 million (2015: $3 million). 2016 includes the removal of costs associated with our Pierina mine which is mining incidental ounces as it enters closure of $19million.
BARRICK THIRD QUARTER 2016 74 MANAGEMENT’S DISCUSSION AND ANALYSIS
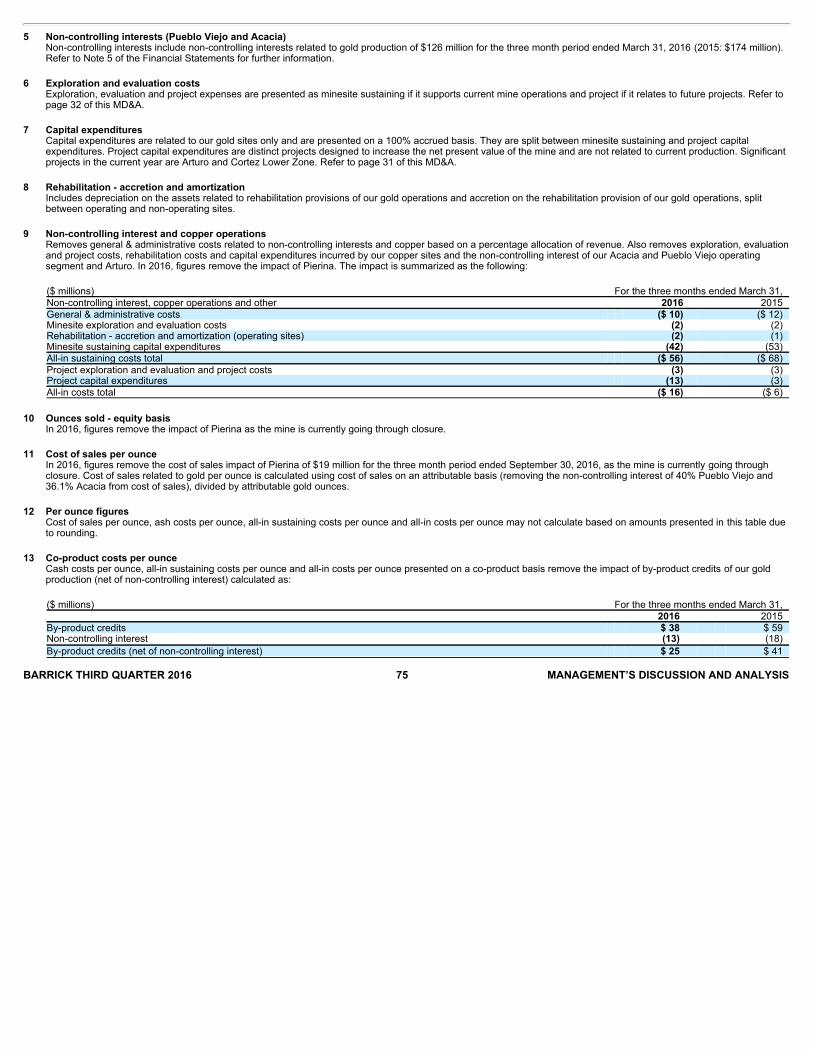
5 Non-controlling interests (Pueblo Viejo and Acacia)Non-controlling interests include non-controlling interests related to gold production of $126 million for the three month period ended March 31, 2016 (2015: $174 million).Refer to Note 5 of the Financial Statements for further information.
6 Exploration and evaluation costs
Exploration, evaluation and project expenses are presented as minesite sustaining if it supports current mine operations and project if it relates to future projects. Refer topage 32 of this MD&A.
7 Capital expenditures
Capital expenditures are related to our gold sites only and are presented on a 100% accrued basis. They are split between minesite sustaining and project capitalexpenditures. Project capital expenditures are distinct projects designed to increase the net present value of the mine and are not related to current production. Significantprojects in the current year are Arturo and Cortez Lower Zone. Refer to page 31 of this MD&A.
8 Rehabilitation - accretion and amortization
Includes depreciation on the assets related to rehabilitation provisions of our gold operations and accretion on the rehabilitation provision of our gold operations, splitbetween operating and non-operating sites.
9 Non-controlling interest and copper operations
Removes general & administrative costs related to non-controlling interests and copper based on a percentage allocation of revenue. Also removes exploration, evaluationand project costs, rehabilitation costs and capital expenditures incurred by our copper sites and the non-controlling interest of our Acacia and Pueblo Viejo operatingsegment and Arturo. In 2016, figures remove the impact of Pierina. The impact is summarized as the following:
($ millions) For the three months ended March 31, Non-controlling interest, copper operations and other 2016 2015 General & administrative costs ($ 10) ($ 12) Minesite exploration and evaluation costs (2) (2) Rehabilitation - accretion and amortization (operating sites) (2) (1) Minesite sustaining capital expenditures (42) (53) All-in sustaining costs total ($ 56) ($ 68) Project exploration and evaluation and project costs (3) (3) Project capital expenditures (13) (3) All-in costs total ($ 16) ($ 6)
10 Ounces sold - equity basis
In 2016, figures remove the impact of Pierina as the mine is currently going through closure. 11 Cost of sales per ounce
In 2016, figures remove the cost of sales impact of Pierina of $19 million for the three month period ended September 30, 2016, as the mine is currently going throughclosure. Cost of sales related to gold per ounce is calculated using cost of sales on an attributable basis (removing the non-controlling interest of 40% Pueblo Viejo and36.1% Acacia from cost of sales), divided by attributable gold ounces.
12 Per ounce figures
Cost of sales per ounce, ash costs per ounce, all-in sustaining costs per ounce and all-in costs per ounce may not calculate based on amounts presented in this table dueto rounding.
13 Co-product costs per ounce
Cash costs per ounce, all-in sustaining costs per ounce and all-in costs per ounce presented on a co-product basis remove the impact of by-product credits of our goldproduction (net of non-controlling interest) calculated as:
($ millions) For the three months ended March 31, 2016 2015 By-product credits $ 38 $ 59 Non-controlling interest (13) (18)
By-product credits (net of non-controlling interest) $ 25 $ 41
BARRICK THIRD QUARTER 2016 75 MANAGEMENT’S DISCUSSION AND ANALYSIS
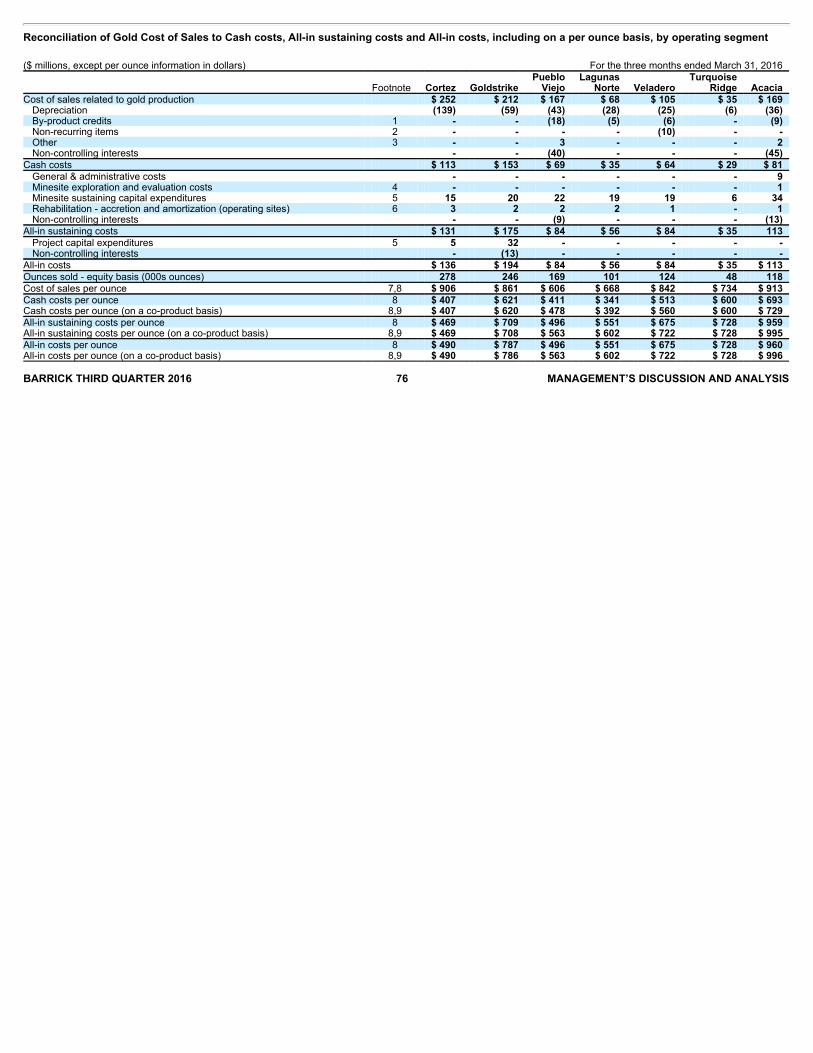
Reconciliation of Gold Cost of Sales to Cash costs, All-in sustaining costs and All-in costs, including on a per ounce basis, by operating segment ($ millions, except per ounce information in dollars) For the three months ended March 31, 2016
Footnote Cortez Goldstrike Pueblo
Viejo Lagunas
Norte Veladero Turquoise
Ridge Acacia Cost of sales related to gold production $ 252 $ 212 $ 167 $ 68 $ 105 $ 35 $ 169
Depreciation (139) (59) (43) (28) (25) (6) (36) By-product credits 1 - - (18) (5) (6) - (9) Non-recurring items 2 - - - - (10) - - Other 3 - - 3 - - - 2 Non-controlling interests - - (40) - - - (45)
Cash costs $ 113 $ 153 $ 69 $ 35 $ 64 $ 29 $ 81 General & administrative costs - - - - - - 9 Minesite exploration and evaluation costs 4 - - - - - - 1 Minesite sustaining capital expenditures 5 15 20 22 19 19 6 34 Rehabilitation - accretion and amortization (operating sites) 6 3 2 2 2 1 - 1 Non-controlling interests - - (9) - - - (13)
All-in sustaining costs $ 131 $ 175 $ 84 $ 56 $ 84 $ 35 113 Project capital expenditures 5 5 32 - - - - - Non-controlling interests - (13) - - - - -
All-in costs $ 136 $ 194 $ 84 $ 56 $ 84 $ 35 $ 113 Ounces sold - equity basis (000s ounces) 278 246 169 101 124 48 118 Cost of sales per ounce 7,8 $ 906 $ 861 $ 606 $ 668 $ 842 $ 734 $ 913 Cash costs per ounce 8 $ 407 $ 621 $ 411 $ 341 $ 513 $ 600 $ 693 Cash costs per ounce (on a co-product basis) 8,9 $ 407 $ 620 $ 478 $ 392 $ 560 $ 600 $ 729 All-in sustaining costs per ounce 8 $ 469 $ 709 $ 496 $ 551 $ 675 $ 728 $ 959 All-in sustaining costs per ounce (on a co-product basis) 8,9 $ 469 $ 708 $ 563 $ 602 $ 722 $ 728 $ 995 All-in costs per ounce 8 $ 490 $ 787 $ 496 $ 551 $ 675 $ 728 $ 960 All-in costs per ounce (on a co-product basis) 8,9 $ 490 $ 786 $ 563 $ 602 $ 722 $ 728 $ 996 BARRICK THIRD QUARTER 2016 76 MANAGEMENT’S DISCUSSION AND ANALYSIS
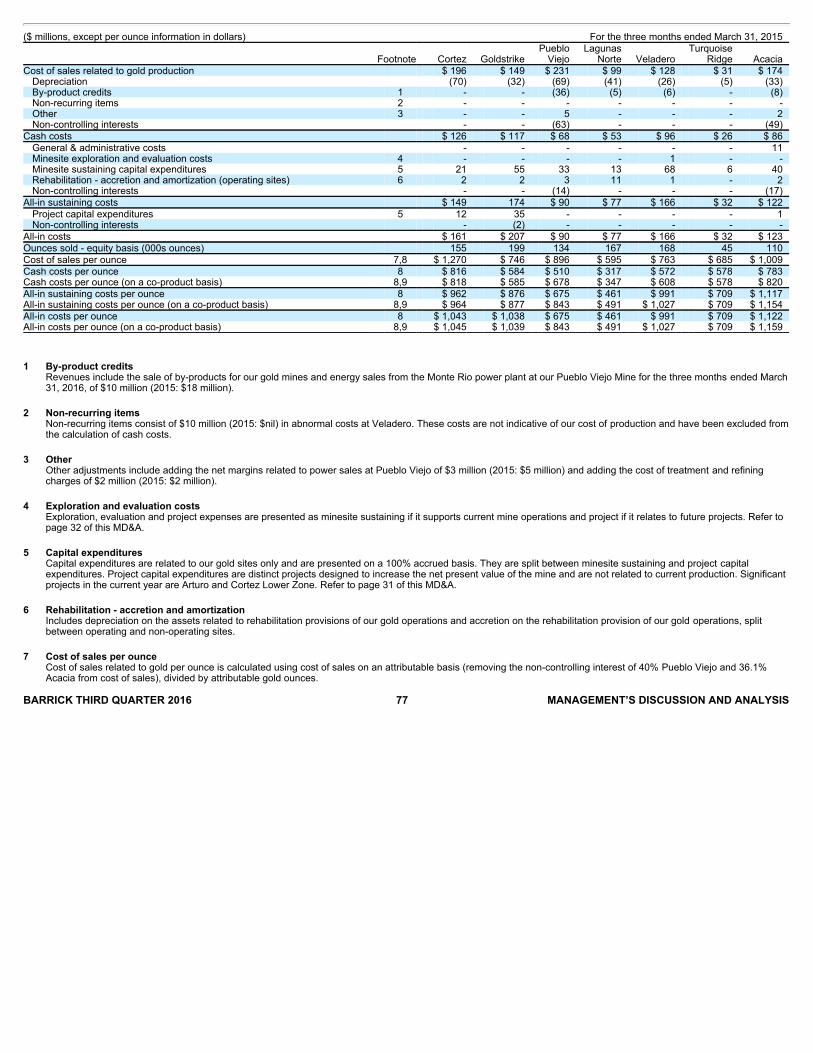
($ millions, except per ounce information in dollars) For the three months ended March 31, 2015
Footnote Cortez Goldstrike Pueblo
Viejo Lagunas
Norte Veladero Turquoise
Ridge Acacia Cost of sales related to gold production $ 196 $ 149 $ 231 $ 99 $ 128 $ 31 $ 174
Depreciation (70) (32) (69) (41) (26) (5) (33) By-product credits 1 - - (36) (5) (6) - (8) Non-recurring items 2 - - - - - - - Other 3 - - 5 - - - 2 Non-controlling interests - - (63) - - - (49)
Cash costs $ 126 $ 117 $ 68 $ 53 $ 96 $ 26 $ 86 General & administrative costs - - - - - - 11 Minesite exploration and evaluation costs 4 - - - - 1 - - Minesite sustaining capital expenditures 5 21 55 33 13 68 6 40 Rehabilitation - accretion and amortization (operating sites) 6 2 2 3 11 1 - 2 Non-controlling interests - - (14) - - - (17)
All-in sustaining costs $ 149 174 $ 90 $ 77 $ 166 $ 32 $ 122 Project capital expenditures 5 12 35 - - - - 1 Non-controlling interests - (2) - - - - -
All-in costs $ 161 $ 207 $ 90 $ 77 $ 166 $ 32 $ 123 Ounces sold - equity basis (000s ounces) 155 199 134 167 168 45 110 Cost of sales per ounce 7,8 $ 1,270 $ 746 $ 896 $ 595 $ 763 $ 685 $ 1,009 Cash costs per ounce 8 $ 816 $ 584 $ 510 $ 317 $ 572 $ 578 $ 783 Cash costs per ounce (on a co-product basis) 8,9 $ 818 $ 585 $ 678 $ 347 $ 608 $ 578 $ 820 All-in sustaining costs per ounce 8 $ 962 $ 876 $ 675 $ 461 $ 991 $ 709 $ 1,117 All-in sustaining costs per ounce (on a co-product basis) 8,9 $ 964 $ 877 $ 843 $ 491 $ 1,027 $ 709 $ 1,154 All-in costs per ounce 8 $ 1,043 $ 1,038 $ 675 $ 461 $ 991 $ 709 $ 1,122 All-in costs per ounce (on a co-product basis) 8,9 $ 1,045 $ 1,039 $ 843 $ 491 $ 1,027 $ 709 $ 1,159
1 By-product credits
Revenues include the sale of by-products for our gold mines and energy sales from the Monte Rio power plant at our Pueblo Viejo Mine for the three months ended March31, 2016, of $10 million (2015: $18 million).
2 Non-recurring items
Non-recurring items consist of $10 million (2015: $nil) in abnormal costs at Veladero. These costs are not indicative of our cost of production and have been excluded fromthe calculation of cash costs.
3 Other
Other adjustments include adding the net margins related to power sales at Pueblo Viejo of $3 million (2015: $5 million) and adding the cost of treatment and refiningcharges of $2 million (2015: $2 million).
4 Exploration and evaluation costs
Exploration, evaluation and project expenses are presented as minesite sustaining if it supports current mine operations and project if it relates to future projects. Refer topage 32 of this MD&A.
5 Capital expenditures
Capital expenditures are related to our gold sites only and are presented on a 100% accrued basis. They are split between minesite sustaining and project capitalexpenditures. Project capital expenditures are distinct projects designed to increase the net present value of the mine and are not related to current production. Significantprojects in the current year are Arturo and Cortez Lower Zone. Refer to page 31 of this MD&A.
6 Rehabilitation - accretion and amortization
Includes depreciation on the assets related to rehabilitation provisions of our gold operations and accretion on the rehabilitation provision of our gold operations, splitbetween operating and non-operating sites.
7 Cost of sales per ounce
Cost of sales related to gold per ounce is calculated using cost of sales on an attributable basis (removing the non-controlling interest of 40% Pueblo Viejo and 36.1%Acacia from cost of sales), divided by attributable gold ounces.
BARRICK THIRD QUARTER 2016 77 MANAGEMENT’S DISCUSSION AND ANALYSIS

8 Per ounce figuresCost of sales per ounce, cash costs per ounce, all-in sustaining costs per ounce and all-in costs per ounce may not calculate based on amounts presented in this tabledue to rounding.
9 Co-product costs per ounce
Cash costs per ounce, all-in sustaining costs per ounce and all-in costs per ounce presented on a co-product basis remove the impact of by-product credits of our goldproduction (net of non-controlling interest) calculated as:
($ millions) For the three months ended March 31, 2016 Cortez Goldstrike Pueblo Viejo Lagunas Norte Veladero Turquoise Ridge Acacia By-product credits $- $- $ 18 $ 5 $ 6 $- $ 9 Non-controlling interest - - (9) - - - (3)
By-product credits (net of non-controllinginterest) $- $- $ 8 $ 5 $ 6 $- $ 6 For the three months ended March 31, 2015 Cortez Goldstrike Pueblo Viejo Lagunas Norte Veladero Turquoise Ridge Acacia By-product credits $- $- $ 36 $ 5 $ 6 $- $ 8 Non-controlling interest - - (15) - - - (3)
By-product credits (net of non- controllinginterest) $- $- $ 21 $ 5 $ 6 $- $ 5
Reconciliation of Copper Cost of Sales to C1 cash costs and All-in sustaining costs, including on a per pound basis ($ millions, except per pound information in dollars) For the three months ended March 31 2016 2015 Cost of sales $ 89 $ 251
Depreciation/amortization 1 (11) (37) Treatment and refinement charges 46 42 Cash costs applicable to equity method investments 2 41 - Less: royalties (14) (34) Other - 1
C1 cash cost of sales $ 151 $ 223 General & administrative costs 7 6 Rehabilitation - accretion and amortization 1 2 Royalties 14 34 Mine development expenditures 25 19 Sustaining capital expenditures 5 7
All-in sustaining costs $ 203 $ 291 Pounds sold - consolidated basis (millions pounds) 103 121 Cost of sales per pound 3,4 $ 1.34 $ 2.07 C1 cash cost per pound 3 $ 1.47 $ 1.84 All-in sustaining costs per pound 3 $ 1.97 $ 2.40 1 For the three month period ended March 31, 2016, depreciation excludes $8 million of depreciation applicable to equity method investments.2 2016 figures include $41 million of cash costs related to our 50% share of Zaldívar due to the divestment of 50% of our interest in the mine on December 1 , 2015 and
subsequent accounting as an equity method investment.3 Cost of sales per pound, C1 cash costs per pound and all-in sustaining costs per pound may not calculate based on amounts presented in this table due to rounding.4 Cost of sales related to copper per pound is calculated using cost of sales including our proportionate share of cost of sales attributable to equity method investments
(Zaldívar and Jabal Sayid), divided by consolidated copper pounds (including our proportionate share of copper pounds from our equity method investments). BARRICK THIRD QUARTER 2016 78 MANAGEMENT’S DISCUSSION AND ANALYSIS
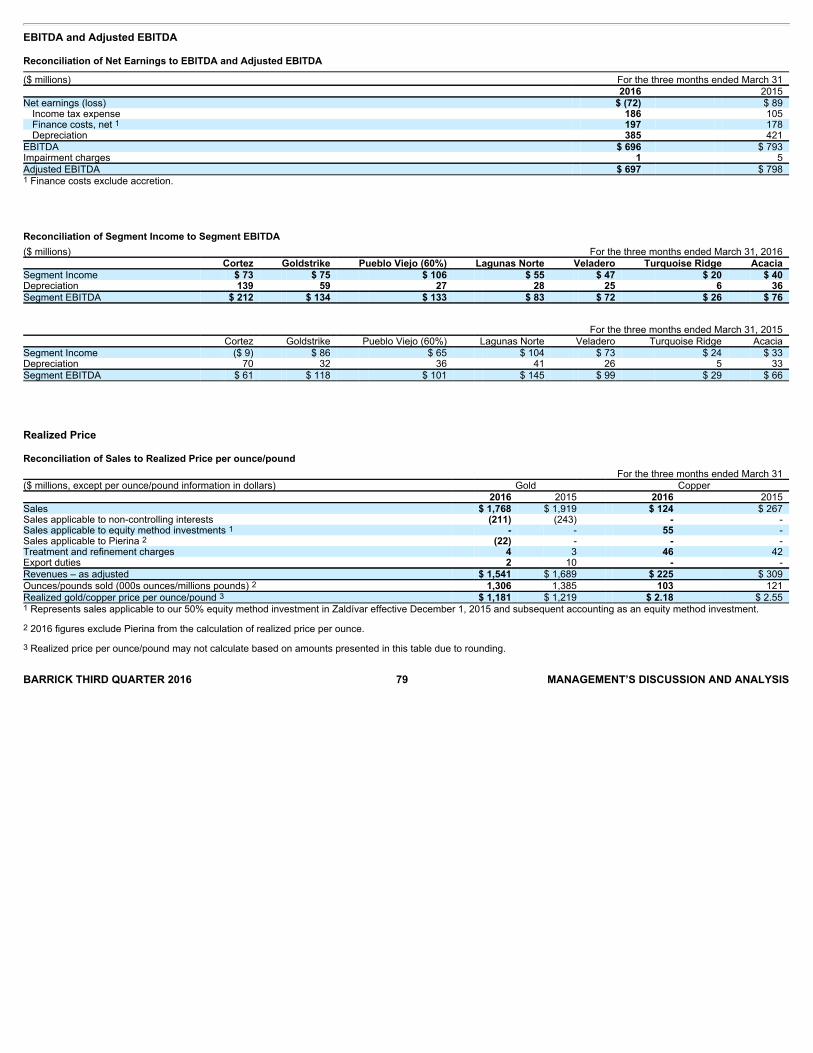
EBITDA and Adjusted EBITDA
Reconciliation of Net Earnings to EBITDA and Adjusted EBITDA ($ millions) For the three months ended March 31 2016 2015 Net earnings (loss) $ (72) $ 89
Income tax expense 186 105 Finance costs, net 1 197 178 Depreciation 385 421
EBITDA $ 696 $ 793 Impairment charges 1 5 Adjusted EBITDA $ 697 $ 798 1
Finance costs exclude accretion.
Reconciliation of Segment Income to Segment EBITDA
($ millions) For the three months ended March 31, 2016 Cortez Goldstrike Pueblo Viejo (60%) Lagunas Norte Veladero Turquoise Ridge Acacia Segment Income $ 73 $ 75 $ 106 $ 55 $ 47 $ 20 $ 40 Depreciation 139 59 27 28 25 6 36 Segment EBITDA $ 212 $ 134 $ 133 $ 83 $ 72 $ 26 $ 76
For the three months ended March 31, 2015 Cortez Goldstrike Pueblo Viejo (60%) Lagunas Norte Veladero Turquoise Ridge Acacia Segment Income ($ 9) $ 86 $ 65 $ 104 $ 73 $ 24 $ 33 Depreciation 70 32 36 41 26 5 33 Segment EBITDA $ 61 $ 118 $ 101 $ 145 $ 99 $ 29 $ 66
Realized Price
Reconciliation of Sales to Realized Price per ounce/pound
For the three months ended March 31 ($ millions, except per ounce/pound information in dollars) Gold Copper 2016 2015 2016 2015 Sales $ 1,768 $ 1,919 $ 124 $ 267 Sales applicable to non-controlling interests (211) (243) - - Sales applicable to equity method investments 1 - - 55 - Sales applicable to Pierina 2 (22) - - - Treatment and refinement charges 4 3 46 42 Export duties 2 10 - - Revenues – as adjusted $ 1,541 $ 1,689 $ 225 $ 309 Ounces/pounds sold (000s ounces/millions pounds) 2 1,306 1,385 103 121 Realized gold/copper price per ounce/pound 3 $ 1,181 $ 1,219 $ 2.18 $ 2.55 1
Represents sales applicable to our 50% equity method investment in Zaldívar effective December 1, 2015 and subsequent accounting as an equity method investment.
2
2016 figures exclude Pierina from the calculation of realized price per ounce.
3
Realized price per ounce/pound may not calculate based on amounts presented in this table due to rounding.
BARRICK THIRD QUARTER 2016 79 MANAGEMENT’S DISCUSSION AND ANALYSIS
TECHNICAL INFORMATION
The scientific and technical information contained in this MD&A has been reviewed and approved by Steven Haggarty, P. Eng., Senior Director, Metallurgy ofBarrick who is a “Qualified Person” as defined in National Instrument 43-101 – Standards of Disclosure for Mineral Projects.
ENDNOTES 1
Includes $674 million cash primarily held at Acacia and Pueblo Viejo, which may not be readily deployed outside of Acacia and/or Pueblo Viejo
2
These are non-GAAP financial performance measures with no standardized meaning under IFRS and therefore may not be comparable to similar measurespresented by other issuers. For further information and a detailed reconciliation of each non-GAAP measure to the most directly comparable IFRS measure,please see pages 49 to 79 of this MD&A.
3
Cost of sales related to gold per ounce is calculated using cost of sales related to gold on an attributable basis (removing the non-controlling interest of40% Pueblo Viejo and 36.1% Acacia from cost of sales), divided by attributable gold ounces. Cost of sales related to copper per pound is calculated using costof sales related to copper including our proportionate share of cost of sales attributable to equity method investments (Zaldívar and Jabal Sayid), divided byconsolidated copper pounds (including our proportionate share of copper pounds from our equity method investments).
4
Amount excludes capital leases and includes project financing payments at Pueblo Viejo (60% basis) and Acacia (100% basis).
BARRICK THIRD QUARTER 2016 80 MANAGEMENT’S DISCUSSION AND ANALYSIS
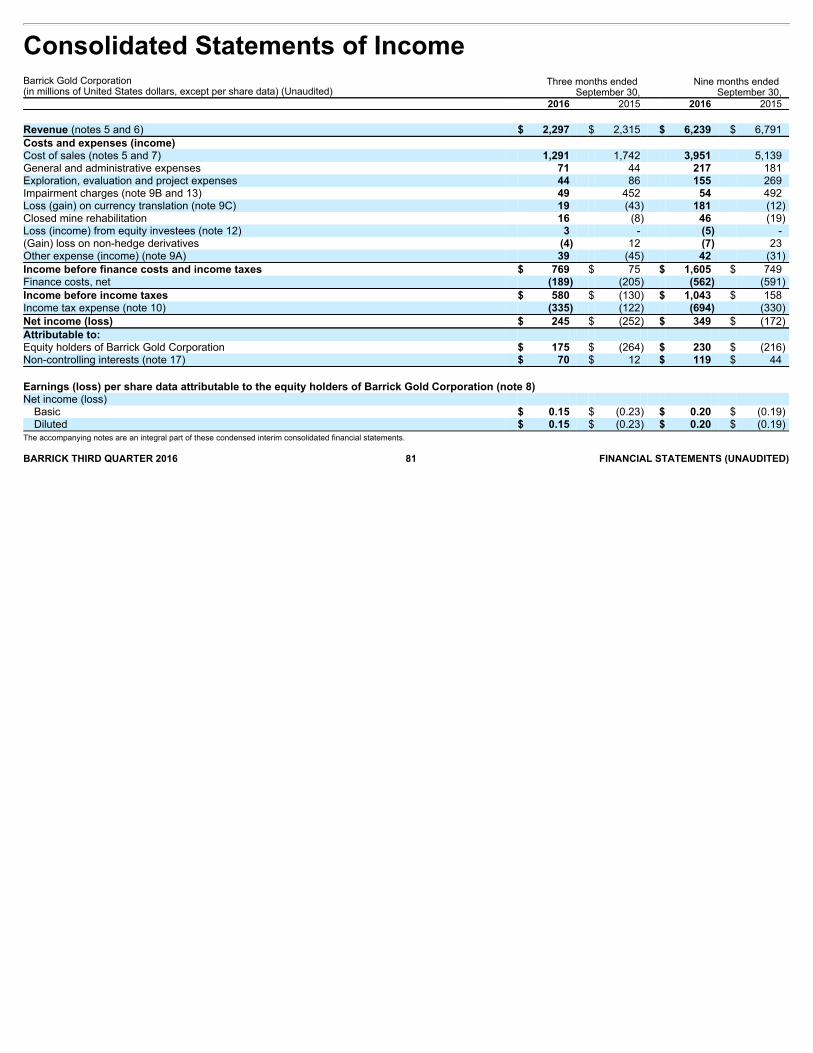
Consolidated Statements of Income Barrick Gold Corporation(in millions of United States dollars, except per share data) (Unaudited)
Three months ended September 30,
Nine months ended September 30,
2016 2015 2016 2015
Revenue (notes 5 and 6) $ 2,297 $ 2,315 $ 6,239 $ 6,791 Costs and expenses (income) Cost of sales (notes 5 and 7) 1,291 1,742 3,951 5,139 General and administrative expenses 71 44 217 181 Exploration, evaluation and project expenses 44 86 155 269 Impairment charges (note 9B and 13) 49 452 54 492 Loss (gain) on currency translation (note 9C) 19 (43) 181 (12) Closed mine rehabilitation 16 (8) 46 (19) Loss (income) from equity investees (note 12) 3 - (5) - (Gain) loss on non-hedge derivatives (4) 12 (7) 23 Other expense (income) (note 9A) 39 (45) 42 (31) Income before finance costs and income taxes $ 769 $ 75 $ 1,605 $ 749 Finance costs, net (189) (205) (562) (591) Income before income taxes $ 580 $ (130) $ 1,043 $ 158 Income tax expense (note 10) (335) (122) (694) (330) Net income (loss) $ 245 $ (252) $ 349 $ (172) Attributable to: Equity holders of Barrick Gold Corporation $ 175 $ (264) $ 230 $ (216) Non-controlling interests (note 17) $ 70 $ 12 $ 119 $ 44
Earnings (loss) per share data attributable to the equity holders of Barrick Gold Corporation (note 8) Net income (loss)
Basic $ 0.15 $ (0.23) $ 0.20 $ (0.19) Diluted $ 0.15 $ (0.23) $ 0.20 $ (0.19)
The accompanying notes are an integral part of these condensed interim consolidated financial statements. BARRICK THIRD QUARTER 2016 81 FINANCIAL STATEMENTS (UNAUDITED)
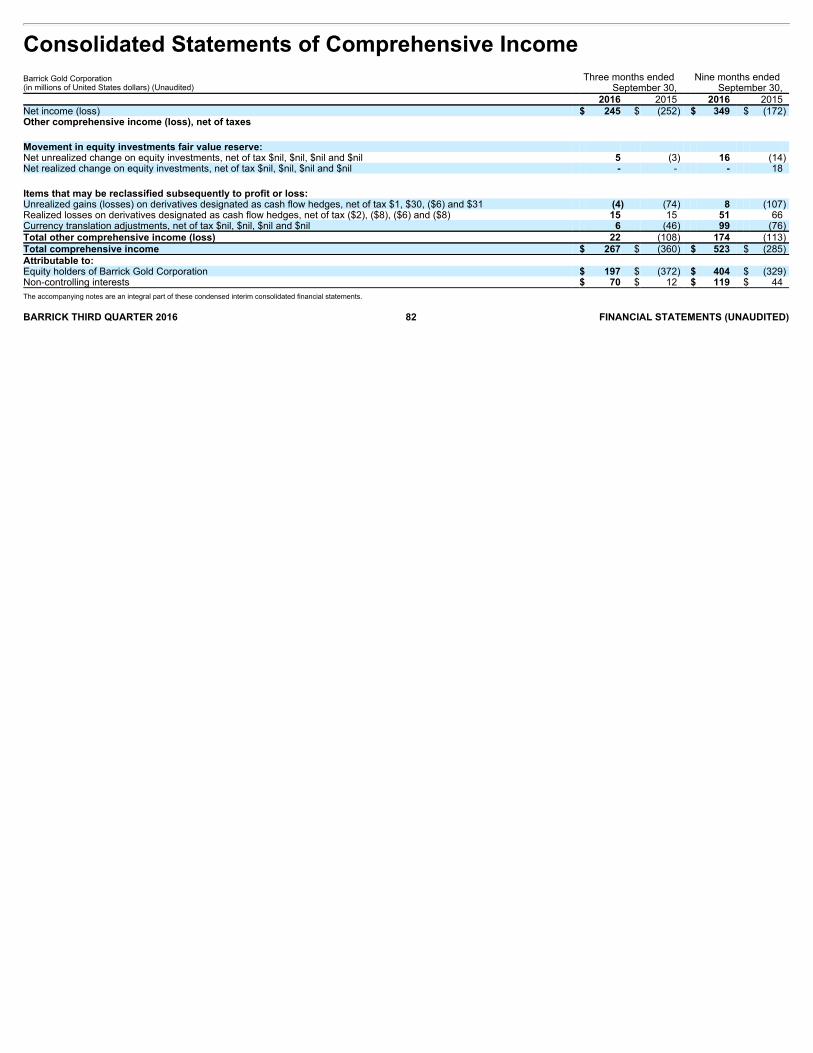
Consolidated Statements of Comprehensive Income Barrick Gold Corporation(in millions of United States dollars) (Unaudited)
Three months ended September 30,
Nine months ended September 30,
2016 2015 2016 2015 Net income (loss) $ 245 $ (252) $ 349 $ (172) Other comprehensive income (loss), net of taxes
Movement in equity investments fair value reserve: Net unrealized change on equity investments, net of tax $nil, $nil, $nil and $nil 5 (3) 16 (14) Net realized change on equity investments, net of tax $nil, $nil, $nil and $nil - - - 18
Items that may be reclassified subsequently to profit or loss: Unrealized gains (losses) on derivatives designated as cash flow hedges, net of tax $1, $30, ($6) and $31 (4) (74) 8 (107) Realized losses on derivatives designated as cash flow hedges, net of tax ($2), ($8), ($6) and ($8) 15 15 51 66 Currency translation adjustments, net of tax $nil, $nil, $nil and $nil 6 (46) 99 (76) Total other comprehensive income (loss) 22 (108) 174 (113) Total comprehensive income $ 267 $ (360) $ 523 $ (285) Attributable to: Equity holders of Barrick Gold Corporation $ 197 $ (372) $ 404 $ (329) Non-controlling interests $ 70 $ 12 $ 119 $ 44 The accompanying notes are an integral part of these condensed interim consolidated financial statements. BARRICK THIRD QUARTER 2016 82 FINANCIAL STATEMENTS (UNAUDITED)
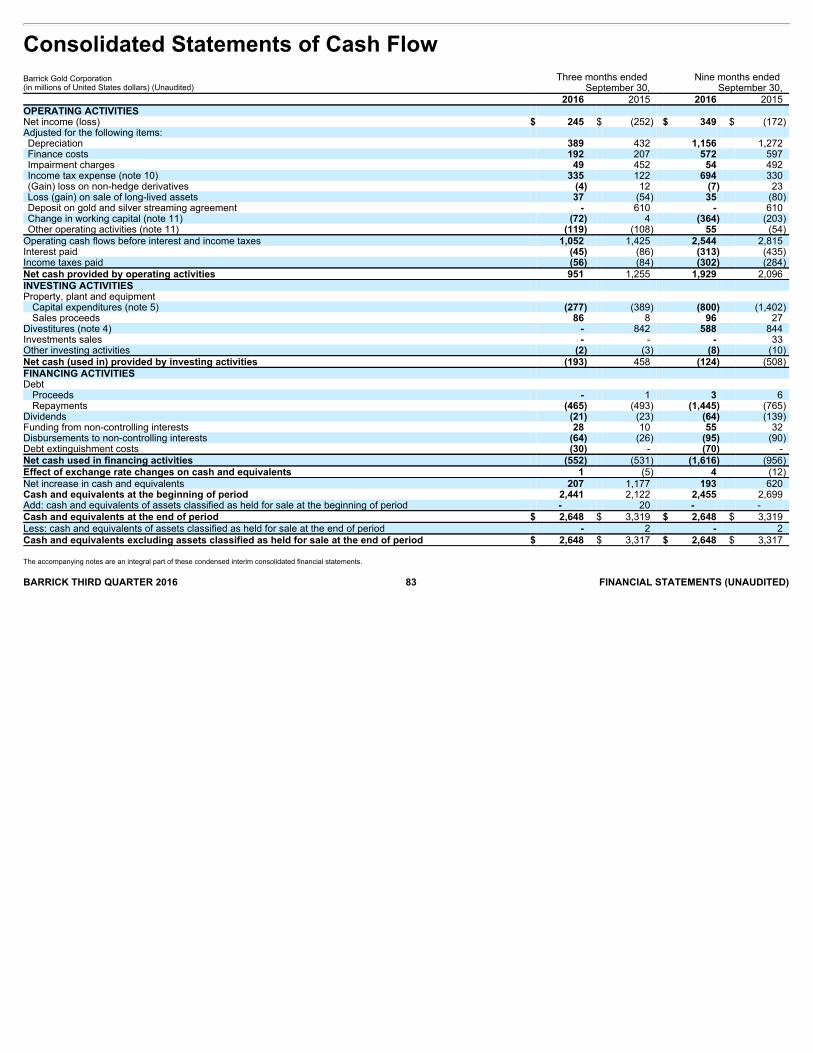
Consolidated Statements of Cash Flow Barrick Gold Corporation(in millions of United States dollars) (Unaudited)
Three months ended September 30,
Nine months ended September 30,
2016 2015 2016 2015 OPERATING ACTIVITIES Net income (loss) $ 245 $ (252) $ 349 $ (172) Adjusted for the following items: Depreciation 389 432 1,156 1,272 Finance costs 192 207 572 597 Impairment charges 49 452 54 492 Income tax expense (note 10) 335 122 694 330 (Gain) loss on non-hedge derivatives (4) 12 (7) 23 Loss (gain) on sale of long-lived assets 37 (54) 35 (80) Deposit on gold and silver streaming agreement - 610 - 610 Change in working capital (note 11) (72) 4 (364) (203) Other operating activities (note 11) (119) (108) 55 (54)
Operating cash flows before interest and income taxes 1,052 1,425 2,544 2,815 Interest paid (45) (86) (313) (435) Income taxes paid (56) (84) (302) (284) Net cash provided by operating activities 951 1,255 1,929 2,096 INVESTING ACTIVITIES Property, plant and equipment
Capital expenditures (note 5) (277) (389) (800) (1,402) Sales proceeds 86 8 96 27
Divestitures (note 4) - 842 588 844 Investments sales - - - 33 Other investing activities (2) (3) (8) (10) Net cash (used in) provided by investing activities (193) 458 (124) (508) FINANCING ACTIVITIES Debt
Proceeds - 1 3 6 Repayments (465) (493) (1,445) (765)
Dividends (21) (23) (64) (139) Funding from non-controlling interests 28 10 55 32 Disbursements to non-controlling interests (64) (26) (95) (90) Debt extinguishment costs (30) - (70) - Net cash used in financing activities (552) (531) (1,616) (956) Effect of exchange rate changes on cash and equivalents 1 (5) 4 (12) Net increase in cash and equivalents 207 1,177 193 620 Cash and equivalents at the beginning of period 2,441 2,122 2,455 2,699 Add: cash and equivalents of assets classified as held for sale at the beginning of period - 20 - - Cash and equivalents at the end of period $ 2,648 $ 3,319 $ 2,648 $ 3,319 Less: cash and equivalents of assets classified as held for sale at the end of period - 2 - 2 Cash and equivalents excluding assets classified as held for sale at the end of period $ 2,648 $ 3,317 $ 2,648 $ 3,317
The accompanying notes are an integral part of these condensed interim consolidated financial statements. BARRICK THIRD QUARTER 2016 83 FINANCIAL STATEMENTS (UNAUDITED)

Consolidated Balance Sheets Barrick Gold Corporation(in millions of United States dollars) (Unaudited) As at September 30, As at December 31, 2016 2015 ASSETS Current assets
Cash and equivalents (note 14A) $ 2,648 $ 2,455 Accounts receivable 465 275 Inventories 1,862 1,717 Other current assets 249 263
Total current assets (excluding assets classified as held for sale) $ 5,224 $ 4,710 Assets classified as held for sale - 758
Total current assets $ 5,224 $ 5,468
Non-current assets Equity in investees (note 12) 1,169 1,199 Property, plant and equipment 14,043 14,434 Goodwill 1,371 1,371 Intangible assets 273 271 Deferred income tax assets 1,014 1,040 Non-current portion of inventory 1,553 1,502 Other assets 981 1,023
Total assets $ 25,628 $ 26,308 LIABILITIES AND EQUITY Current liabilities
Accounts payable $ 1,238 $ 1,158 Debt (note 14B) 153 203 Current income tax liabilities 281 - Other current liabilities 287 337
Total current liabilities (excluding liabilities classified as held for sale) $ 1,959 $ 1,698 Liabilities classified as held for sale - 149
Total current liabilities $ 1,959 $ 1,847
Non-current liabilities Debt (note 14B) 8,386 9,765 Provisions 2,385 2,102 Deferred income tax liabilities 1,555 1,553 Other liabilities 1,501 1,586
Total liabilities $ 15,786 $ 16,853 Equity
Capital stock (note 16) $ 20,875 $ 20,869 Deficit (13,482) (13,642) Accumulated other comprehensive loss (196) (370) Other 321 321
Total equity attributable to Barrick Gold Corporation shareholders $ 7,518 $ 7,178 Non-controlling interests (note 17) 2,324 2,277
Total equity $ 9,842 $ 9,455 Contingencies and commitments (notes 5 and 18) Total liabilities and equity $ 25,628 $ 26,308 The accompanying notes are an integral part of these condensed interim consolidated financial statements. BARRICK THIRD QUARTER 2016 84 FINANCIAL STATEMENTS (UNAUDITED)

Consolidated Statements of Changes in Equity Barrick Gold Corporation Attributable to equity holders of the company
(in millions of United States dollars) (Unaudited)
Common Shares (in thousands) Capital stock
Retained deficit
Accumulated other
comprehensive income (loss) 1 Other 2
Total equity attributable to
shareholders Non-controlling
interests Total equity At January 1, 2016 1,165,081 $ 20,869 $ (13,642) $ (370) $ 321 $ 7,178 $ 2,277 $ 9,455
Net income - - 230 - - 230 119 349 Total other comprehensive income - - - 174 - 174 - 174 Total comprehensive income - - 230 174 - 404 119 523 Transactions with owners
Dividends - - (64) - - (64) - (64) Funding from non-controlling interests - - - - - - 55 55 Other decrease in non-controlling interest - - - - - - (127) (127) Dividend reinvestment plan (note 16) 350 6 (6) - - - - -
Total transactions with owners 350 6 (70) - - (64) (72) (136) At September 30, 2016 1,165,431 $ 20,875 $ (13,482) $ (196) $ 321 $ 7,518 $ 2,324 $ 9,842 At January 1, 2015 1,164,670 $ 20,864 $ (10,640) $ (298) $ 321 $ 10,247 $ 2,615 $ 12,862
Net income - - (216) - - (216) 44 (172) Total other comprehensive loss - - - (113) - (113) - (113) Total comprehensive income (loss) - - (216) (113) - (329) 44 (285) Transactions with owners
Dividends - - (139) - - (139) - (139) Recognition of stock option expense - 2 - - - 2 - 2 Funding from non-controlling interests - - - - - - 33 33 Other decrease in non-controlling interests - - - - - - (95) (95) Dividend reinvestment plan 127 - - - - - - - Other decreases - - (6) - - (6) - (6)
Total transactions with owners 127 2 (145) - - (143) (62) (205) At September 30, 2015 1,164,797 $ 20,866 $ (11,001) $ (411) $ 321 $ 9,775 $ 2,597 $ 12,372 1 Includes cumulative translation losses at September 30, 2016: $78 million (September 30, 2015: $198 million).2 Includes additional paid-in capital as at September 30, 2016: $283 million (December 31, 2015: $283 million; September 30, 2015: $283 million) and convertible borrowings - equity component as at September 30, 2016: $38 million(December 31, 2015: $38 million; September 30, 2015: $38 million).
The accompanying notes are an integral part of these condensed interim consolidated financial statements. BARRICK THIRD QUARTER 2016 85 FINANCIAL STATEMENTS (UNAUDITED)
NOTES TO CONSOLIDATEDFINANCIAL STATEMENTS
BARRICK THIRD QUARTER 2016 86 NOTES TO FINANCIAL STATEMENTS (UNAUDITED)
Barrick Gold Corporation. Tabular dollar amounts in millions of UnitedStates dollars, unless otherwise shown.
1 > CORPORATE INFORMATIONBarrick Gold Corporation (“Barrick”, “we” or the “Company”) is a corporationgoverned by the Business Corporations Act (Ontario). The Company’s headand registered office is located at Brookfield Place, TD Canada Trust Tower,161 Bay Street, Suite 3700, Toronto, Ontario, M5J 2S1. We are principallyengaged in the production and sale of gold and copper, as well as relatedactivities such as exploration and mine development. Our producing goldmines are located in Canada, the United States, Peru, Argentina and theDominican Republic and our producing copper mine is in Zambia. We hold a50% interest in KCGM, a gold mine located in Australia and hold a 50%equity interest in Barrick Niugini Limited (“BNL”), which owns a 95% interestin Porgera, a gold mine located in Papua New Guinea. We also hold a63.9% equity interest in Acacia Mining plc (“Acacia”), a company listed onthe London Stock Exchange that owns gold mines and exploration propertiesin Africa. We have a 50% interest in Zaldívar, a copper mine located in Chileand a 50% interest in Jabal Sayid, a copper mine located in Saudi Arabia.We also have various gold projects located in South America and NorthAmerica. We sell our gold and copper production into the world market.
2 > SIGNIFICANT ACCOUNTING POLICIESA) Statement of ComplianceThese condensed interim consolidated financial statements have beenprepared in accordance with International Accounting Standard 34 InterimFinancial Reporting (“IAS 34”) as issued by the International AccountingStandards Board (“IASB”). These interim financial statements should be readin conjunction with Barrick’s most recently issued Annual Report whichincludes information necessary or useful to understanding the Company’sbusiness and financial statement presentation. In particular, the Company’ssignificant accounting policies were presented in Note 2 of the consolidatedfinancial statements for the year ended December 31, 2015, and have beenconsistently applied in the preparation of these interim financial statements.These condensed interim consolidated financial statements were authorizedfor issuance by the Board of Directors on October 26, 2016.
B) New Accounting Standards Issued But Not Yet EffectiveIFRS 15 Revenue from Contracts with CustomersIn May 2014, the IASB issued IFRS 15 Revenue from Contracts withCustomers, which covers principles that an entity shall apply to report usefulinformation to users of financial statements about the nature, amount, timing,and uncertainty of revenue and cash flows arising from a contract with acustomer. In September 2015, the IASB deferred the effective date of thestandard to annual reporting periods beginning on or after January 1, 2018,with earlier application permitted. We are currently assessing the impact onour consolidated financial statements along with the planned timing of ouradoption of IFRS 15.
IFRS 16 LeasesIn January 2016, the IASB issued IFRS 16 Leases, which requires lessees torecognize assets and liabilities for most leases. Application of the standard ismandatory for annual reporting periods beginning on or after January 1,2019, with earlier application permitted, provided the new revenue standard,IFRS 15 Revenue from Contracts with Customers, has been applied or isapplied at the same date as IFRS 16. We are currently assessing the impacton our consolidated financial statements along with the planned timing of ouradoption of IFRS 16.
3 > SIGNIFICANT JUDGMENTS, ESTIMATES, ASSUMPTIONS ANDRISKSThe judgments, estimates, assumptions and risks discussed here reflectupdates from the most recently filed Annual Consolidated FinancialStatements for the year ended December 31, 2015. For judgments,estimates, assumptions and risks related to other areas not discussed inthese interim consolidated financial statements, please refer to Notes 3 and27 of the 2015 Annual Consolidated Financial Statements. A) Provision for Environmental Rehabilitation (“PER”)Provisions are updated each reporting period for changes to expected cashflows and for the effect of changes in the discount rate and foreign exchangerate, and the change in estimate is added or deducted from the related assetand depreciated over the expected economic life of the operation to which itrelates. We recorded an increase of $40 million (2015: $54 million decrease)to the PER at our minesites for the three months ended September 30, 2016
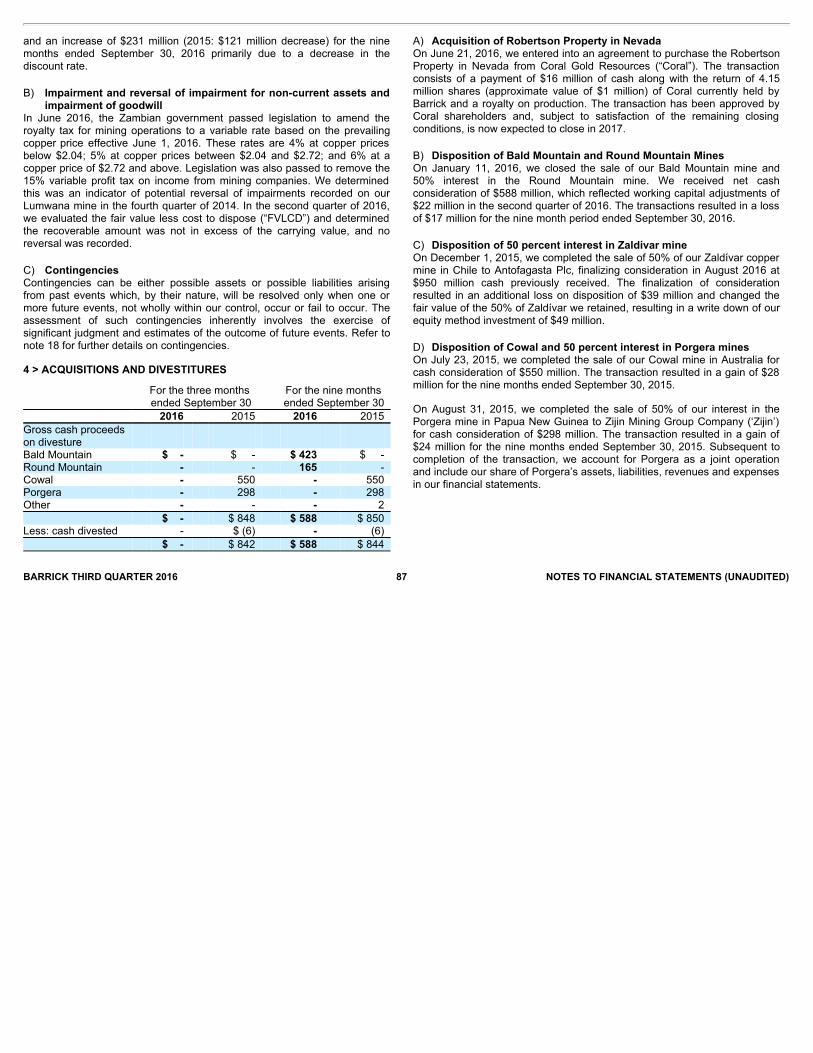
BARRICK THIRD QUARTER 2016 87 NOTES TO FINANCIAL STATEMENTS (UNAUDITED)
and an increase of $231 million (2015: $121 million decrease) for the ninemonths ended September 30, 2016 primarily due to a decrease in thediscount rate. B) Impairment and reversal of impairment for non-current assets and
impairment of goodwillIn June 2016, the Zambian government passed legislation to amend theroyalty tax for mining operations to a variable rate based on the prevailingcopper price effective June 1, 2016. These rates are 4% at copper pricesbelow $2.04; 5% at copper prices between $2.04 and $2.72; and 6% at acopper price of $2.72 and above. Legislation was also passed to remove the15% variable profit tax on income from mining companies. We determinedthis was an indicator of potential reversal of impairments recorded on ourLumwana mine in the fourth quarter of 2014. In the second quarter of 2016,we evaluated the fair value less cost to dispose (“FVLCD”) and determinedthe recoverable amount was not in excess of the carrying value, and noreversal was recorded. C) ContingenciesContingencies can be either possible assets or possible liabilities arisingfrom past events which, by their nature, will be resolved only when one ormore future events, not wholly within our control, occur or fail to occur. Theassessment of such contingencies inherently involves the exercise ofsignificant judgment and estimates of the outcome of future events. Refer tonote 18 for further details on contingencies.
4 > ACQUISITIONS AND DIVESTITURES
For the three months ended September 30
For the nine months ended September 30
2016 2015 2016 2015 Gross cash proceedson divesture Bald Mountain $ - $ - $ 423 $ - Round Mountain - - 165 - Cowal - 550 - 550 Porgera - 298 - 298 Other - - - 2
$ - $ 848 $ 588 $ 850 Less: cash divested - $ (6) - (6) $ - $ 842 $ 588 $ 844
A) Acquisition of Robertson Property in NevadaOn June 21, 2016, we entered into an agreement to purchase the RobertsonProperty in Nevada from Coral Gold Resources (“Coral”). The transactionconsists of a payment of $16 million of cash along with the return of 4.15million shares (approximate value of $1 million) of Coral currently held byBarrick and a royalty on production. The transaction has been approved byCoral shareholders and, subject to satisfaction of the remaining closingconditions, is now expected to close in 2017. B) Disposition of Bald Mountain and Round Mountain MinesOn January 11, 2016, we closed the sale of our Bald Mountain mine and50% interest in the Round Mountain mine. We received net cashconsideration of $588 million, which reflected working capital adjustments of$22 million in the second quarter of 2016. The transactions resulted in a lossof $17 million for the nine month period ended September 30, 2016. C) Disposition of 50 percent interest in Zaldívar mineOn December 1, 2015, we completed the sale of 50% of our Zaldívar coppermine in Chile to Antofagasta Plc, finalizing consideration in August 2016 at$950 million cash previously received. The finalization of considerationresulted in an additional loss on disposition of $39 million and changed thefair value of the 50% of Zaldívar we retained, resulting in a write down of ourequity method investment of $49 million. D) Disposition of Cowal and 50 percent interest in Porgera minesOn July 23, 2015, we completed the sale of our Cowal mine in Australia forcash consideration of $550 million. The transaction resulted in a gain of $28million for the nine months ended September 30, 2015.
On August 31, 2015, we completed the sale of 50% of our interest in thePorgera mine in Papua New Guinea to Zijin Mining Group Company (‘Zijin’)for cash consideration of $298 million. The transaction resulted in a gain of$24 million for the nine months ended September 30, 2015. Subsequent tocompletion of the transaction, we account for Porgera as a joint operationand include our share of Porgera’s assets, liabilities, revenues and expensesin our financial statements.
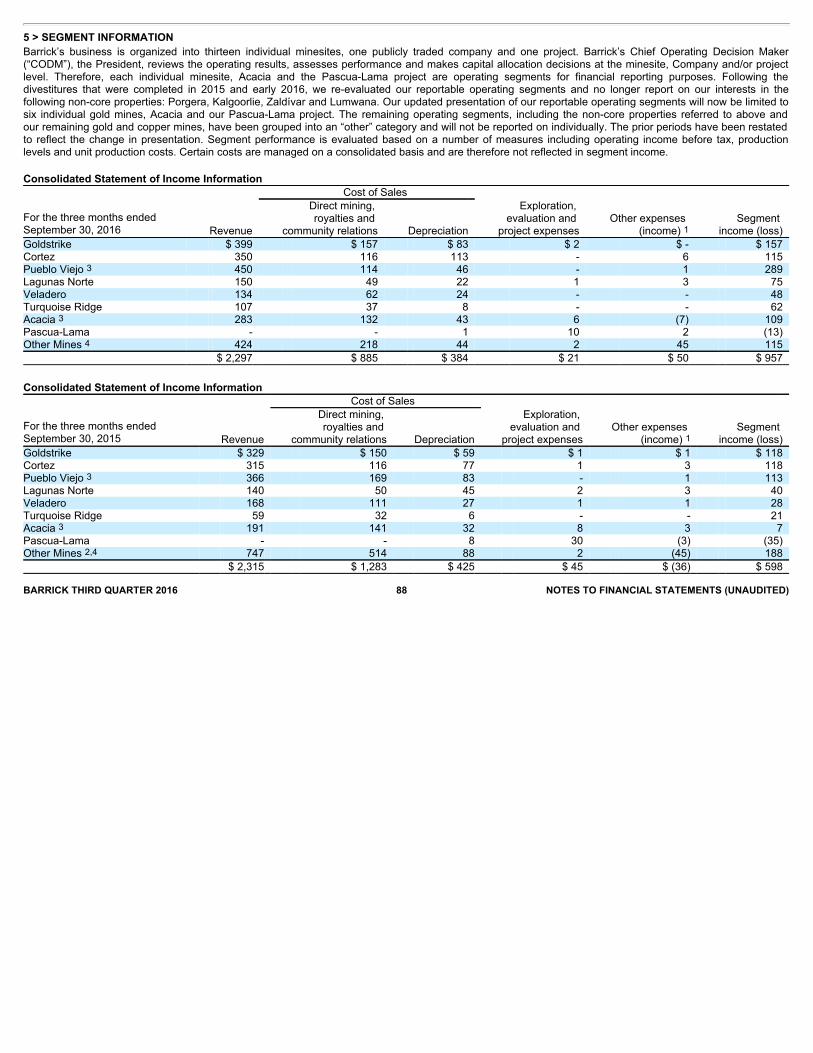
5 > SEGMENT INFORMATIONBarrick’s business is organized into thirteen individual minesites, one publicly traded company and one project. Barrick’s Chief Operating Decision Maker(“CODM”), the President, reviews the operating results, assesses performance and makes capital allocation decisions at the minesite, Company and/or projectlevel. Therefore, each individual minesite, Acacia and the Pascua-Lama project are operating segments for financial reporting purposes. Following thedivestitures that were completed in 2015 and early 2016, we re-evaluated our reportable operating segments and no longer report on our interests in thefollowing non-core properties: Porgera, Kalgoorlie, Zaldívar and Lumwana. Our updated presentation of our reportable operating segments will now be limited tosix individual gold mines, Acacia and our Pascua-Lama project. The remaining operating segments, including the non-core properties referred to above andour remaining gold and copper mines, have been grouped into an “other” category and will not be reported on individually. The prior periods have been restatedto reflect the change in presentation. Segment performance is evaluated based on a number of measures including operating income before tax, productionlevels and unit production costs. Certain costs are managed on a consolidated basis and are therefore not reflected in segment income. Consolidated Statement of Income Information Cost of Sales
For the three months endedSeptember 30, 2016 Revenue
Direct mining, royalties and
community relations Depreciation
Exploration, evaluation and
project expenses Other expenses
(income) 1 Segment
income (loss) Goldstrike $ 399 $ 157 $ 83 $ 2 $ - $ 157 Cortez 350 116 113 - 6 115 Pueblo Viejo 3 450 114 46 - 1 289 Lagunas Norte 150 49 22 1 3 75 Veladero 134 62 24 - - 48 Turquoise Ridge 107 37 8 - - 62 Acacia 3 283 132 43 6 (7) 109 Pascua-Lama - - 1 10 2 (13) Other Mines 4 424 218 44 2 45 115 $ 2,297 $ 885 $ 384 $ 21 $ 50 $ 957 Consolidated Statement of Income Information Cost of Sales
For the three months endedSeptember 30, 2015 Revenue
Direct mining, royalties and
community relations Depreciation
Exploration, evaluation and
project expenses Other expenses
(income) 1 Segment
income (loss) Goldstrike $ 329 $ 150 $ 59 $ 1 $ 1 $ 118 Cortez 315 116 77 1 3 118 Pueblo Viejo 3 366 169 83 - 1 113 Lagunas Norte 140 50 45 2 3 40 Veladero 168 111 27 1 1 28 Turquoise Ridge 59 32 6 - - 21 Acacia 3 191 141 32 8 3 7 Pascua-Lama - - 8 30 (3) (35) Other Mines 2,4 747 514 88 2 (45) 188 $ 2,315 $ 1,283 $ 425 $ 45 $ (36) $ 598 BARRICK THIRD QUARTER 2016 88 NOTES TO FINANCIAL STATEMENTS (UNAUDITED)
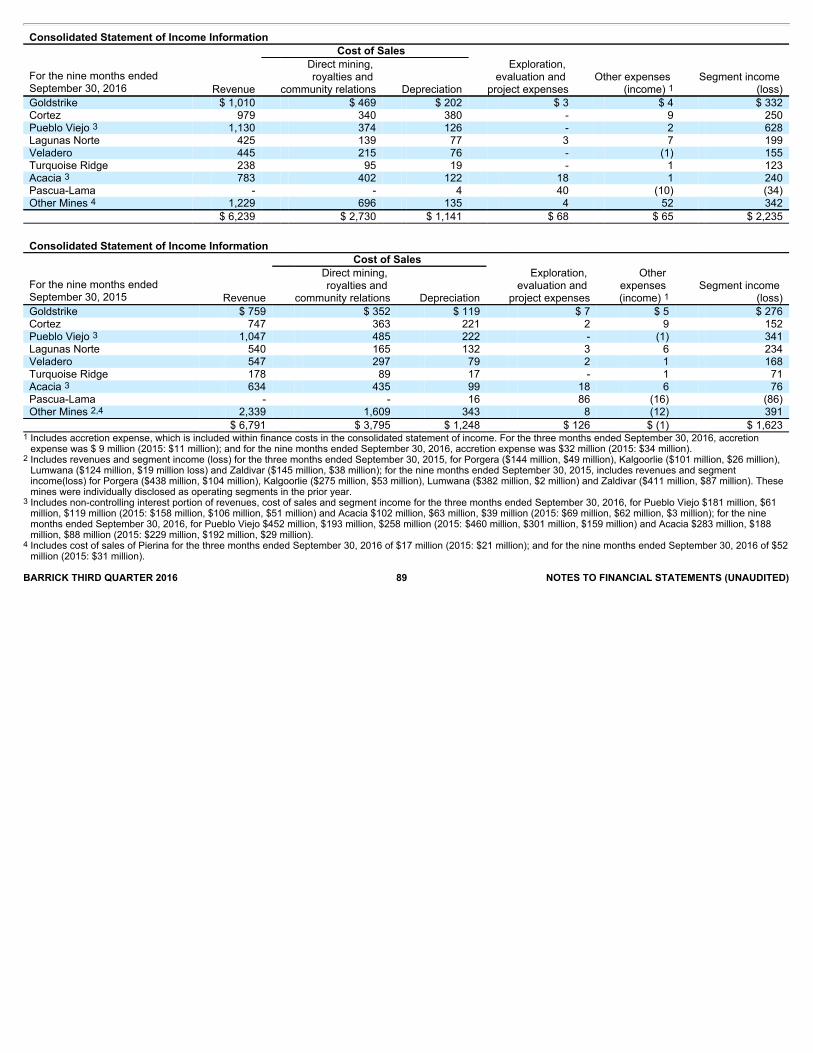
Consolidated Statement of Income Information Cost of Sales
For the nine months ended September 30, 2016 Revenue
Direct mining, royalties and
community relations Depreciation
Exploration, evaluation and
project expenses Other expenses
(income) 1 Segment income
(loss) Goldstrike $ 1,010 $ 469 $ 202 $ 3 $ 4 $ 332 Cortez 979 340 380 - 9 250 Pueblo Viejo 3 1,130 374 126 - 2 628 Lagunas Norte 425 139 77 3 7 199 Veladero 445 215 76 - (1) 155 Turquoise Ridge 238 95 19 - 1 123 Acacia 3 783 402 122 18 1 240 Pascua-Lama - - 4 40 (10) (34) Other Mines 4 1,229 696 135 4 52 342 $ 6,239 $ 2,730 $ 1,141 $ 68 $ 65 $ 2,235 Consolidated Statement of Income Information Cost of Sales
For the nine months ended September 30, 2015 Revenue
Direct mining, royalties and
community relations Depreciation
Exploration, evaluation and
project expenses
Other expenses (income) 1
Segment income (loss)
Goldstrike $ 759 $ 352 $ 119 $ 7 $ 5 $ 276 Cortez 747 363 221 2 9 152 Pueblo Viejo 3 1,047 485 222 - (1) 341 Lagunas Norte 540 165 132 3 6 234 Veladero 547 297 79 2 1 168 Turquoise Ridge 178 89 17 - 1 71 Acacia 3 634 435 99 18 6 76 Pascua-Lama - - 16 86 (16) (86) Other Mines 2,4 2,339 1,609 343 8 (12) 391 $ 6,791 $ 3,795 $ 1,248 $ 126 $ (1) $ 1,623 1
Includes accretion expense, which is included within finance costs in the consolidated statement of income. For the three months ended September 30, 2016, accretionexpense was $ 9 million (2015: $11 million); and for the nine months ended September 30, 2016, accretion expense was $32 million (2015: $34 million).
2
Includes revenues and segment income (loss) for the three months ended September 30, 2015, for Porgera ($144 million, $49 million), Kalgoorlie ($101 million, $26 million),Lumwana ($124 million, $19 million loss) and Zaldivar ($145 million, $38 million); for the nine months ended September 30, 2015, includes revenues and segmentincome(loss) for Porgera ($438 million, $104 million), Kalgoorlie ($275 million, $53 million), Lumwana ($382 million, $2 million) and Zaldivar ($411 million, $87 million). Thesemines were individually disclosed as operating segments in the prior year.
3
Includes non-controlling interest portion of revenues, cost of sales and segment income for the three months ended September 30, 2016, for Pueblo Viejo $181 million, $61million, $119 million (2015: $158 million, $106 million, $51 million) and Acacia $102 million, $63 million, $39 million (2015: $69 million, $62 million, $3 million); for the ninemonths ended September 30, 2016, for Pueblo Viejo $452 million, $193 million, $258 million (2015: $460 million, $301 million, $159 million) and Acacia $283 million, $188million, $88 million (2015: $229 million, $192 million, $29 million).
4
Includes cost of sales of Pierina for the three months ended September 30, 2016 of $17 million (2015: $21 million); and for the nine months ended September 30, 2016 of $52million (2015: $31 million).
BARRICK THIRD QUARTER 2016 89 NOTES TO FINANCIAL STATEMENTS (UNAUDITED)
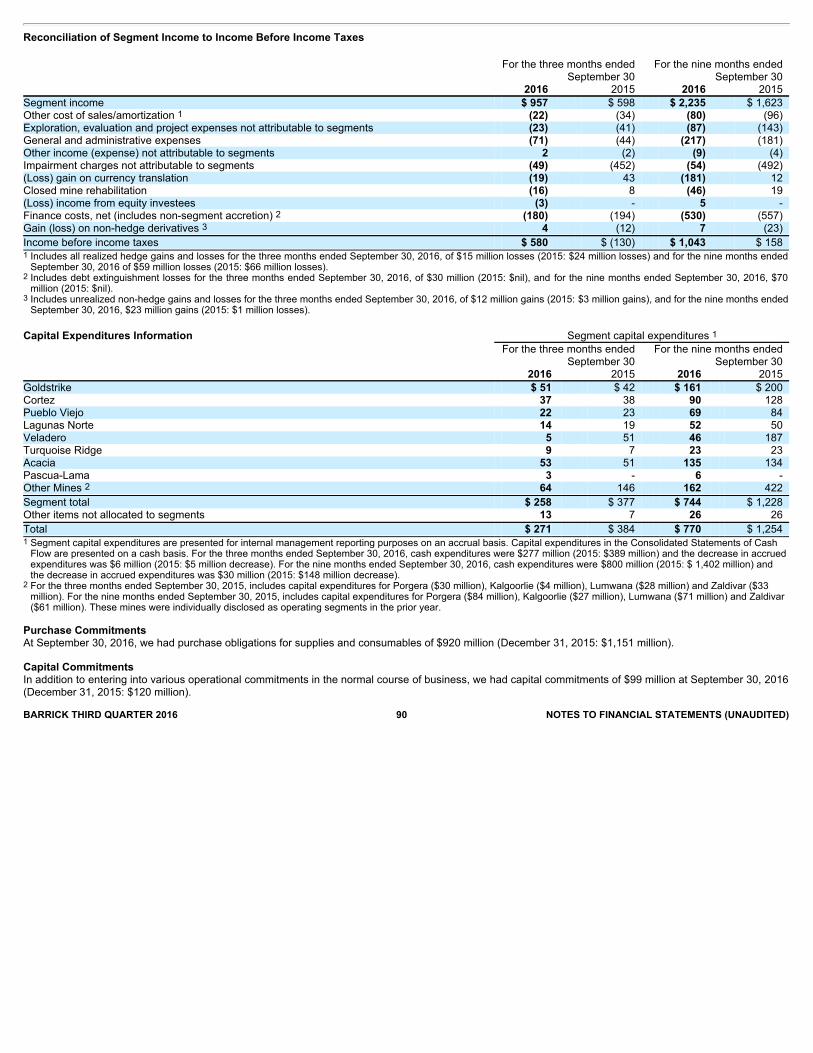
Reconciliation of Segment Income to Income Before Income Taxes
For the three months ended
September 30 For the nine months ended
September 30 2016 2015 2016 2015 Segment income $ 957 $ 598 $ 2,235 $ 1,623 Other cost of sales/amortization 1 (22) (34) (80) (96) Exploration, evaluation and project expenses not attributable to segments (23) (41) (87) (143) General and administrative expenses (71) (44) (217) (181) Other income (expense) not attributable to segments 2 (2) (9) (4) Impairment charges not attributable to segments (49) (452) (54) (492) (Loss) gain on currency translation (19) 43 (181) 12 Closed mine rehabilitation (16) 8 (46) 19 (Loss) income from equity investees (3) - 5 - Finance costs, net (includes non-segment accretion) 2 (180) (194) (530) (557) Gain (loss) on non-hedge derivatives 3 4 (12) 7 (23)
Income before income taxes $ 580 $ (130) $ 1,043 $ 158
1
Includes all realized hedge gains and losses for the three months ended September 30, 2016, of $15 million losses (2015: $24 million losses) and for the nine months endedSeptember 30, 2016 of $59 million losses (2015: $66 million losses).
2
Includes debt extinguishment losses for the three months ended September 30, 2016, of $30 million (2015: $nil), and for the nine months ended September 30, 2016, $70million (2015: $nil).
3
Includes unrealized non-hedge gains and losses for the three months ended September 30, 2016, of $12 million gains (2015: $3 million gains), and for the nine months endedSeptember 30, 2016, $23 million gains (2015: $1 million losses).
Capital Expenditures Information Segment capital expenditures 1
For the three months ended
September 30 For the nine months ended
September 30 2016 2015 2016 2015 Goldstrike $ 51 $ 42 $ 161 $ 200 Cortez 37 38 90 128 Pueblo Viejo 22 23 69 84 Lagunas Norte 14 19 52 50 Veladero 5 51 46 187 Turquoise Ridge 9 7 23 23 Acacia 53 51 135 134 Pascua-Lama 3 - 6 - Other Mines 2 64 146 162 422
Segment total $ 258 $ 377 $ 744 $ 1,228 Other items not allocated to segments 13 7 26 26
Total $ 271 $ 384 $ 770 $ 1,254
1
Segment capital expenditures are presented for internal management reporting purposes on an accrual basis. Capital expenditures in the Consolidated Statements of CashFlow are presented on a cash basis. For the three months ended September 30, 2016, cash expenditures were $277 million (2015: $389 million) and the decrease in accruedexpenditures was $6 million (2015: $5 million decrease). For the nine months ended September 30, 2016, cash expenditures were $800 million (2015: $ 1,402 million) andthe decrease in accrued expenditures was $30 million (2015: $148 million decrease).
2
For the three months ended September 30, 2015, includes capital expenditures for Porgera ($30 million), Kalgoorlie ($4 million), Lumwana ($28 million) and Zaldivar ($33million). For the nine months ended September 30, 2015, includes capital expenditures for Porgera ($84 million), Kalgoorlie ($27 million), Lumwana ($71 million) and Zaldivar($61 million). These mines were individually disclosed as operating segments in the prior year.
Purchase CommitmentsAt September 30, 2016, we had purchase obligations for supplies and consumables of $920 million (December 31, 2015: $1,151 million).
Capital CommitmentsIn addition to entering into various operational commitments in the normal course of business, we had capital commitments of $99 million at September 30, 2016(December 31, 2015: $120 million). BARRICK THIRD QUARTER 2016 90 NOTES TO FINANCIAL STATEMENTS (UNAUDITED)

6 > REVENUE
For the three months ended
September 30 For the nine months ended
September 30 2016 2015 2016 2015 Gold bullion sales Spot market sales $ 2,077 $ 1,937 $ 5,580 $ 5,639 Concentrate sales 57 55 194 193
$ 2,134 $ 1,992 $ 5,774 $ 5,832 Copper sales Copper cathode sales 1 $ - $ 145 $ - $ 411 Concentrate sales 104 124 322 382 $ 104 $ 269 $ 322 $ 793 By-product credits 2 $ 59 $ 54 $ 143 $ 166 Total $ 2,297 $ 2,315 $ 6,239 $ 6,791
1
Copper cathode sales for the three months and nine months ended September 30, 2015, relate to Zaldivar which is now accounted for as an equity method investment. Referto note 4C.
2
Revenues include the sale of by-products for our gold and copper mines for the three months ended September 30, 2016, of $50 million (2015: $32 million) and the ninemonths ended September 30, 2016, of $110 million (2015: $106 million), and energy sales from the Monte Rio power plant at our Pueblo Viejo Mine for the three monthsended September 30, 2016, of $9 million (2015: $22 million) and the nine months ended September 30, 2016, of $33 million (2015: $60 million).
7 > COST OF SALES
Gold Copper Pascua-Lama/Other
3 Total For the three months ended September 30 2016 2015 2016 2015 2016 2015 2016 2015 Direct mining cost 1,2 $ 761 $ 1,012 $ 48 $ 175 $ 16 $ 22 $ 825 $ 1,209 Depreciation 373 399 10 17 6 16 389 432 Royalty expense 57 64 7 16 - - 64 80 Community relations 11 16 1 1 1 4 13 21
$ 1,202 $ 1,491 $ 66 $ 209 $ 23 $ 42 $ 1,291 $ 1,742
Gold Copper Pascua-Lama/Other
3 Total For the nine months ended September 30 2016 2015 2016 2015 2016 2015 2016 2015 Direct mining cost 1,2 $ 2,344 $ 2,965 $ 169 $ 529 $ 61 $ 65 $ 2,574 $ 3,559 Depreciation 1,107 1,151 30 80 19 41 1,156 1,272 Royalty expense 156 174 32 85 - - 188 259 Community relations 25 39 4 4 4 6 33 49
$ 3,632 $ 4,329 $ 235 $ 698 $ 84 $ 112 $ 3,951 $ 5,139
1
Direct mining cost includes charges to reduce the cost of inventory to net realizable value as follows: $4 million for the three months ended September 30, 2016 (2015: $63million), and $64 million for the nine months ended September 30, 2016 (2015: $151 million).
2
Direct mining cost includes the costs of extracting by-products.
3
Other includes all realized hedge gains and losses and corporate amortization.
8 > EARNINGS (LOSS) PER SHARE
For the three months ended September 30
For the nine months ended September 30
2016 2015 2016 2015 ($ millions, except shares in millions and per share amounts in dollars) Basic Diluted Basic Diluted Basic Diluted Basic Diluted Net income (loss) $ 245 $ 245 $ (252) $ (252) $ 349 $ 349 $ (172) $ (172) Net income attributable to non-controlling interests (70) (70) (12) (12) (119) (119) (44) (44) Net income (loss) attributable to equity holders of Barrick GoldCorporation $ 175 $ 175 $ (264) $ (264) $ 230 $ 230 $ (216) $ (216) Weighted average shares outstanding 1,165 1,165 1,165 1,165 1,165 1,165 1,165 1,165 Earnings per share data attributable to the equity holders of BarrickGold Corporation Net income (loss) $ 0.15 $ 0.15 $ (0.23) $ (0.23) $ 0.20 $ 0.20 $ (0.19) $ (0.19) BARRICK THIRD QUARTER 2016 91 NOTES TO FINANCIAL STATEMENTS (UNAUDITED)
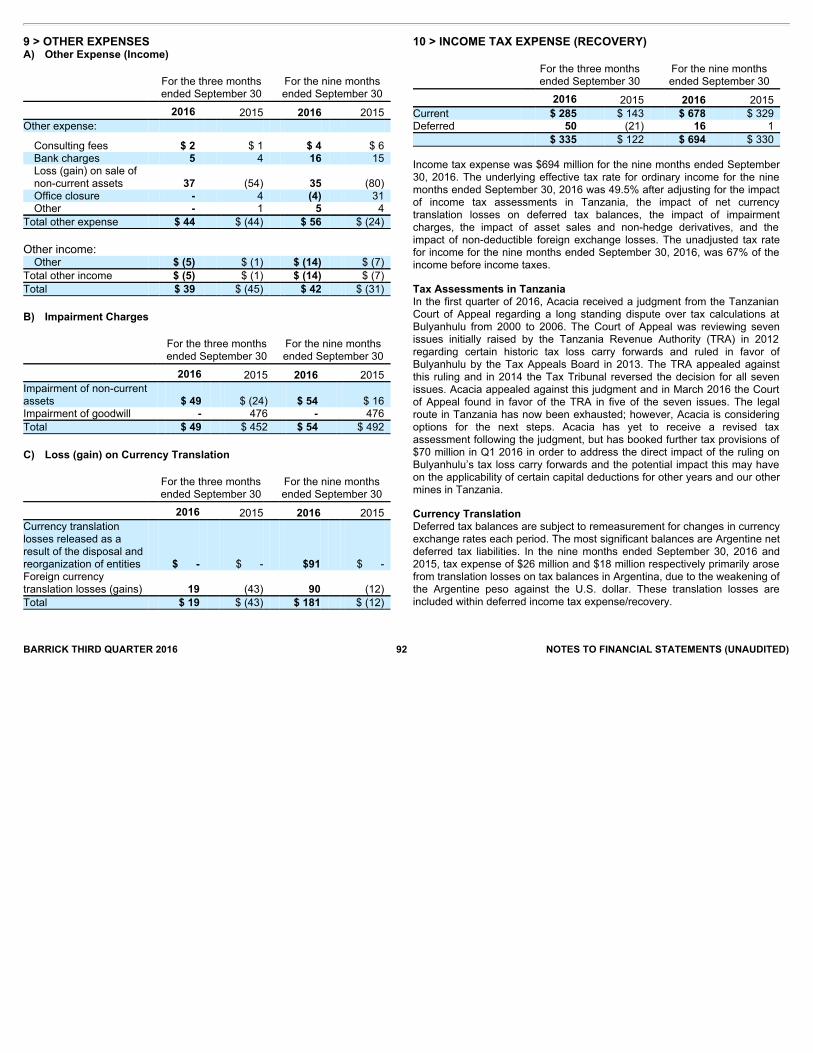
BARRICK THIRD QUARTER 2016 92 NOTES TO FINANCIAL STATEMENTS (UNAUDITED)
9 > OTHER EXPENSESA) Other Expense (Income)
For the three monthsended September 30
For the nine monthsended September 30
2016 2015 2016 2015 Other expense:
Consulting fees $ 2 $ 1 $ 4 $ 6 Bank charges 5 4 16 15 Loss (gain) on sale ofnon-current assets 37 (54) 35 (80) Office closure - 4 (4) 31 Other - 1 5 4
Total other expense $ 44 $ (44) $ 56 $ (24)
Other income: Other $ (5) $ (1) $ (14) $ (7)
Total other income $ (5) $ (1) $ (14) $ (7) Total $ 39 $ (45) $ 42 $ (31) B) Impairment Charges
For the three monthsended September 30
For the nine monthsended September 30
2016 2015 2016 2015 Impairment of non-currentassets $ 49 $ (24) $ 54 $ 16 Impairment of goodwill - 476 - 476 Total $ 49 $ 452 $ 54 $ 492 C) Loss (gain) on Currency Translation
For the three monthsended September 30
For the nine monthsended September 30
2016 2015 2016 2015 Currency translationlosses released as aresult of the disposal andreorganization of entities $ - $ - $91 $ - Foreign currencytranslation losses (gains) 19 (43) 90 (12) Total $ 19 $ (43) $ 181 $ (12)
10 > INCOME TAX EXPENSE (RECOVERY)
For the three monthsended September 30
For the nine monthsended September 30
2016 2015 2016 2015 Current $ 285 $ 143 $ 678 $ 329 Deferred 50 (21) 16 1 $ 335 $ 122 $ 694 $ 330
Income tax expense was $694 million for the nine months ended September30, 2016. The underlying effective tax rate for ordinary income for the ninemonths ended September 30, 2016 was 49.5% after adjusting for the impactof income tax assessments in Tanzania, the impact of net currencytranslation losses on deferred tax balances, the impact of impairmentcharges, the impact of asset sales and non-hedge derivatives, and theimpact of non-deductible foreign exchange losses. The unadjusted tax ratefor income for the nine months ended September 30, 2016, was 67% of theincome before income taxes.
Tax Assessments in TanzaniaIn the first quarter of 2016, Acacia received a judgment from the TanzanianCourt of Appeal regarding a long standing dispute over tax calculations atBulyanhulu from 2000 to 2006. The Court of Appeal was reviewing sevenissues initially raised by the Tanzania Revenue Authority (TRA) in 2012regarding certain historic tax loss carry forwards and ruled in favor ofBulyanhulu by the Tax Appeals Board in 2013. The TRA appealed againstthis ruling and in 2014 the Tax Tribunal reversed the decision for all sevenissues. Acacia appealed against this judgment and in March 2016 the Courtof Appeal found in favor of the TRA in five of the seven issues. The legalroute in Tanzania has now been exhausted; however, Acacia is consideringoptions for the next steps. Acacia has yet to receive a revised taxassessment following the judgment, but has booked further tax provisions of$70 million in Q1 2016 in order to address the direct impact of the ruling onBulyanhulu’s tax loss carry forwards and the potential impact this may haveon the applicability of certain capital deductions for other years and our othermines in Tanzania.
Currency TranslationDeferred tax balances are subject to remeasurement for changes in currencyexchange rates each period. The most significant balances are Argentine netdeferred tax liabilities. In the nine months ended September 30, 2016 and2015, tax expense of $26 million and $18 million respectively primarily arosefrom translation losses on tax balances in Argentina, due to the weakening ofthe Argentine peso against the U.S. dollar. These translation losses areincluded within deferred income tax expense/recovery.

11 > CASH FLOW – OTHER ITEMS Operating Cash Flows – Other Items For the three months ended September 30 For the nine months ended September 30
2016 2015 2016 2015 Adjustments for non-cash income statement items:
Net currency translation losses $ 19 $ (43) $ 181 $ (12) RSU expense (recovery) (10) (8) 53 8 Stock option expense - 1 - 2 Loss (gain) from investment in equity investees 3 - (5) - Change in estimate of rehabilitation costs at closed mines 16 (8) 46 (19) Net inventory impairment charges 1 4 63 64 151 Other assets and liabilities (137) (94) (233) (115) Settlement of rehabilitation obligations (14) (19) (51) (69)
Other operating activities $ (119) $ (108) $55 $ (54) Cash flow arising from changes in:
Accounts receivable $ (53) $ (26) $ (221) $ 28 Inventory (67) 48 (178) (17) Other current assets 45 27 71 (26) Accounts payable 11 27 (55) (53) Other current liabilities (8) (72) 19 (135)
Change in working capital $ (72) $ 4 $ (364) $ (203) 1 Net inventory impairment charges include impairment charges for the three months ended September 30, 2016 of $4 million (2015: $63 million) and impairment reversals of$nil (2015: $nil), and for the nine months ended September 30, 2016 of $64 million (2015: $152 million) and impairment reversals of $nil (2015: $1 million).
12 > EQUITY ACCOUNTING METHOD INVESTMENT CONTINUITY
Kabanga Jabal Sayid Zaldívar GNX Total At January 1, 2015 $ 28 $ 178 $ - $ - $ 206 Funds invested 2 - - 5 7 Transfer to equity accounting method investment - - 993 - 993 Equity pick-up (loss) from equity investees - - (3) (4) (7) At December 31, 2015 $ 30 $ 178 $ 990 $ 1 $ 1,199 Funds invested 1 - - 7 8 Transfer to equity accounting method investment - - 6 - 6 Equity pick-up (loss) from equity investees (1) (2) 13 (5) 5 Impairment charges - - (49) - (49) At September 30, 2016 $ 30 $ 176 $ 960 $ 3 $ 1,169 Publicly traded No No No No BARRICK THIRD QUARTER 2016 93 NOTES TO FINANCIAL STATEMENTS (UNAUDITED)
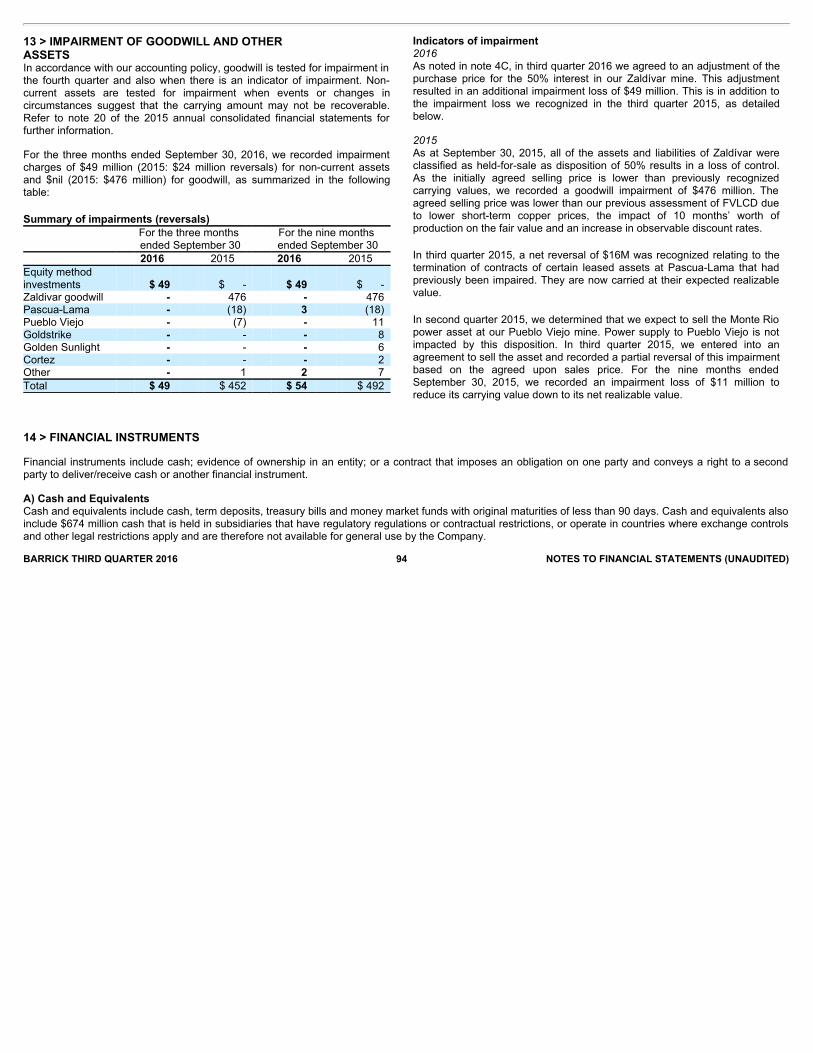
14 > FINANCIAL INSTRUMENTS
Financial instruments include cash; evidence of ownership in an entity; or a contract that imposes an obligation on one party and conveys a right to a secondparty to deliver/receive cash or another financial instrument.
A) Cash and EquivalentsCash and equivalents include cash, term deposits, treasury bills and money market funds with original maturities of less than 90 days. Cash and equivalents alsoinclude $674 million cash that is held in subsidiaries that have regulatory regulations or contractual restrictions, or operate in countries where exchange controlsand other legal restrictions apply and are therefore not available for general use by the Company. BARRICK THIRD QUARTER 2016 94 NOTES TO FINANCIAL STATEMENTS (UNAUDITED)
13 > IMPAIRMENT OF GOODWILL AND OTHERASSETSIn accordance with our accounting policy, goodwill is tested for impairment inthe fourth quarter and also when there is an indicator of impairment. Non-current assets are tested for impairment when events or changes incircumstances suggest that the carrying amount may not be recoverable.Refer to note 20 of the 2015 annual consolidated financial statements forfurther information.
For the three months ended September 30, 2016, we recorded impairmentcharges of $49 million (2015: $24 million reversals) for non-current assetsand $nil (2015: $476 million) for goodwill, as summarized in the followingtable: Summary of impairments (reversals)
For the three months ended September 30
For the nine months ended September 30
2016 2015 2016 2015 Equity methodinvestments $ 49 $ - $ 49 $ - Zaldivar goodwill - 476 - 476 Pascua-Lama - (18) 3 (18) Pueblo Viejo - (7) - 11 Goldstrike - - - 8 Golden Sunlight - - - 6 Cortez - - - 2 Other - 1 2 7 Total $ 49 $ 452 $ 54 $ 492
Indicators of impairment2016As noted in note 4C, in third quarter 2016 we agreed to an adjustment of thepurchase price for the 50% interest in our Zaldívar mine. This adjustmentresulted in an additional impairment loss of $49 million. This is in addition tothe impairment loss we recognized in the third quarter 2015, as detailedbelow.
2015As at September 30, 2015, all of the assets and liabilities of Zaldívar wereclassified as held-for-sale as disposition of 50% results in a loss of control.As the initially agreed selling price is lower than previously recognizedcarrying values, we recorded a goodwill impairment of $476 million. Theagreed selling price was lower than our previous assessment of FVLCD dueto lower short-term copper prices, the impact of 10 months’ worth ofproduction on the fair value and an increase in observable discount rates.
In third quarter 2015, a net reversal of $16M was recognized relating to thetermination of contracts of certain leased assets at Pascua-Lama that hadpreviously been impaired. They are now carried at their expected realizablevalue.
In second quarter 2015, we determined that we expect to sell the Monte Riopower asset at our Pueblo Viejo mine. Power supply to Pueblo Viejo is notimpacted by this disposition. In third quarter 2015, we entered into anagreement to sell the asset and recorded a partial reversal of this impairmentbased on the agreed upon sales price. For the nine months endedSeptember 30, 2015, we recorded an impairment loss of $11 million toreduce its carrying value down to its net realizable value.

B) Debt 1 As at September 30, 2016 As at December 31, 2015 4.4%/5.7% notes 2,9 $ 2,061 $ 2,182 3.85%/5.25% notes 1,078 1,077 5.80% notes 3,9 395 395 6.35% notes 4,9 592 592 Other fixed-rate notes 5,9 1,605 2,451 Project financing 398 646 Capital leases 6 121 153 Other debt obligations 622 654 2.5%/4.10%/5.75% notes 7,9 1,567 1,690 Acacia credit facility 8 100 128
$ 8,539 $ 9,968 Less: current portion 10 (153) (203) $ 8,386 $ 9,765 1 The agreements that govern our long-term debt each contain various provisions which are not summarized herein. These provisions allow Barrick to, at its option, redeem
indebtedness prior to maturity at specified prices and also may permit redemption of debt by Barrick upon the occurrence of certain specified changes in tax legislation.2 Consists of $2.1 billion (2015: $2.2 billion) in conjunction with our wholly owned subsidiary Barrick North America Finance LLC (“BNAF”). This consists of $1.225
billion (2015: $1.35 billion) of BNAF notes due 2021 and $850 million of BNAF notes due 2041.3 Consists of $400 million of 5.80% notes which mature in 2034.4 Consists of $600 million of 6.35% notes which mature in 2036.5 Consists of $1.6 billion (2015: $2.5 billion) in conjunction with our wholly owned subsidiary Barrick North America Finance LLC (“BNAF”) and our wholly-owned subsidiary
Barrick (PD) Australia Finance Pty Ltd. (“BPDAF”). This consists of $279 million (2015: $475 million) of BGC notes due 2019, $248 million (2015: $400 million) of BPDAFnotes due 2020, $250 million of BNAF notes due 2038 and $850 million of BPDAF notes due 2039. The BNAF notes due 2018 were repurchased in full in the third quarterof 2016.
6 Consists primarily of capital leases at Pascua-Lama, $52 million, and Lagunas Norte, $63 million (2015: $57 million and $88 million, respectively).7 Consists of $1.6 billion (2015: $1.7 billion) in conjunction with our wholly owned subsidiary Barrick North America Finance LLC (“BNAF”). This consists of $731 million of
BGC notes due 2023 and $850 million of BNAF notes due 2043. The BGC notes due 2018 were repurchased in full in the second quarter of 2016.8 Consists of an export credit backed term loan facility.9 We provide an unconditional and irrevocable guarantee on all Barrick North America Finance LLC (“BNAF”), Barrick (PD) Australia Finance Pty Ltd. (“BPDAF”), Barrick Gold
Finance Company (“BGFC”) and Barrick (HMC) Mining (“BHMC”) notes and generally provide such guarantees on all BNAF, BPDAF, BGFC and BHMC notes issued, whichwill rank equally with our other unsecured and unsubordinated obligations.
10 The current portion of long-term debt consists of project financing ($72 million; 2015: $89 million), other debt obligations ($15 million; 2015: $45 million), capital leases ($38million; 2015: $41 million) and Acacia credit facility ($28 million; 2015: $28 million).
Jabal Sayid Financing FacilityOn April 2, 2015, Ma’aden Barrick Copper Company signed a financing agreement with the Saudi British Bank to finance the Jabal Sayid copper project (anequity method investment for Barrick) for Saudi Riyal (“SAR”) 750 million ($200 million USD). Barrick has provided a guarantee equal to our proportionateownership interest (50%).
Debt ManagementOn March 21, 2016, we settled a cash tender offer up to $750 million for specified series of outstanding notes. The settlement resulted in a debt extinguishmentloss of $37 million. On June 24, 2016, we executed the make-whole redemption on $105 million of BGC notes due 2018. The settlement resulted in a debtextinguishment loss of $3 million. On September 26, 2016, we executed the make-whole redemption on $273 million of BNAF notes due 2018. The settlementresulted in a debt extinguishment loss of $30 million. BARRICK THIRD QUARTER 2016 95 NOTES TO FINANCIAL STATEMENTS (UNAUDITED)
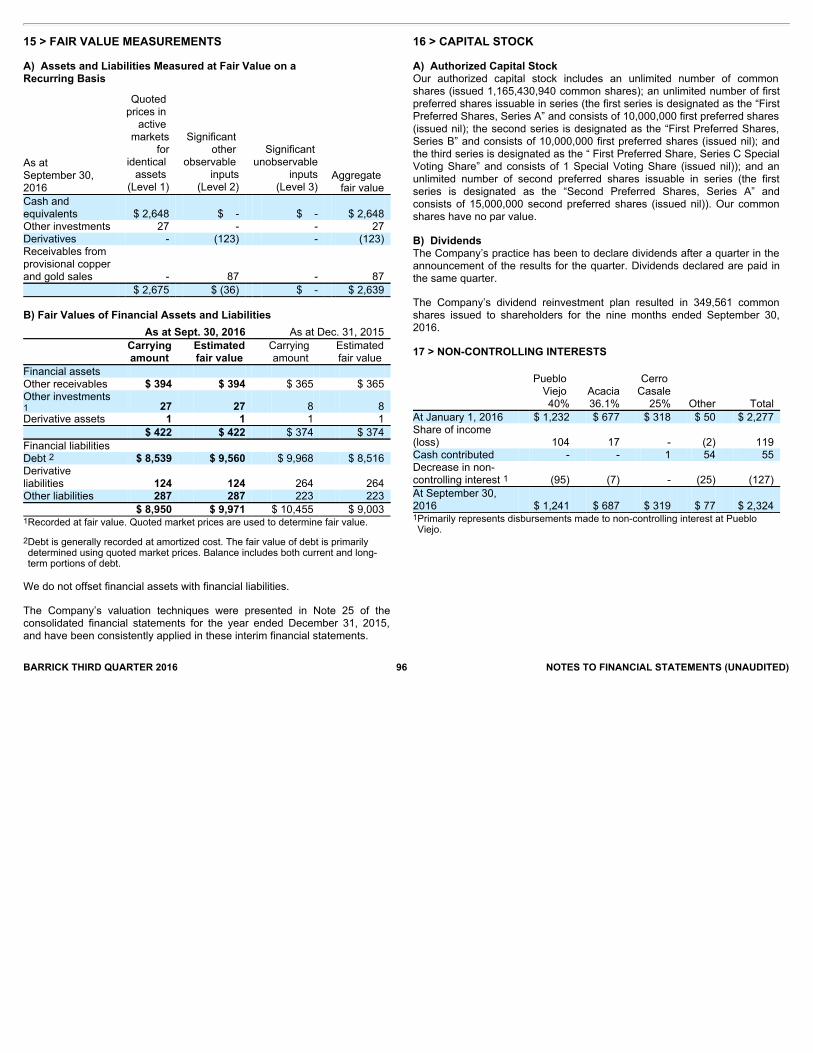
BARRICK THIRD QUARTER 2016 96 NOTES TO FINANCIAL STATEMENTS (UNAUDITED)
15 > FAIR VALUE MEASUREMENTS
A) Assets and Liabilities Measured at Fair Value on aRecurring Basis
As at September 30, 2016
Quoted prices in
active markets
foridentical
assets (Level 1)
Significant other
observable inputs
(Level 2)
Significant unobservable
inputs(Level 3)
Aggregate fair value
Cash andequivalents $ 2,648 $ - $ - $ 2,648 Other investments 27 - - 27 Derivatives - (123) - (123) Receivables fromprovisional copperand gold sales - 87 - 87 $ 2,675 $ (36) $ - $ 2,639
B) Fair Values of Financial Assets and Liabilities
As at Sept. 30, 2016 As at Dec. 31, 2015
Carryingamount
Estimatedfair value
Carrying amount
Estimatedfair value
Financial assets Other receivables $ 394 $ 394 $ 365 $ 365 Other investments1 27 27 8 8 Derivative assets 1 1 1 1 $ 422 $ 422 $ 374 $ 374 Financial liabilities Debt 2 $ 8,539 $ 9,560 $ 9,968 $ 8,516 Derivativeliabilities 124 124 264 264 Other liabilities 287 287 223 223 $ 8,950 $ 9,971 $ 10,455 $ 9,003 1 Recorded at fair value. Quoted market prices are used to determine fair value.
2 Debt is generally recorded at amortized cost. The fair value of debt is primarilydetermined using quoted market prices. Balance includes both current and long-term portions of debt.
We do not offset financial assets with financial liabilities.
The Company’s valuation techniques were presented in Note 25 of theconsolidated financial statements for the year ended December 31, 2015,and have been consistently applied in these interim financial statements.
16 > CAPITAL STOCK
A) Authorized Capital StockOur authorized capital stock includes an unlimited number of commonshares (issued 1,165,430,940 common shares); an unlimited number of firstpreferred shares issuable in series (the first series is designated as the “FirstPreferred Shares, Series A” and consists of 10,000,000 first preferred shares(issued nil); the second series is designated as the “First Preferred Shares,Series B” and consists of 10,000,000 first preferred shares (issued nil); andthe third series is designated as the “ First Preferred Share, Series C SpecialVoting Share” and consists of 1 Special Voting Share (issued nil)); and anunlimited number of second preferred shares issuable in series (the firstseries is designated as the “Second Preferred Shares, Series A” andconsists of 15,000,000 second preferred shares (issued nil)). Our commonshares have no par value.
B) DividendsThe Company’s practice has been to declare dividends after a quarter in theannouncement of the results for the quarter. Dividends declared are paid inthe same quarter.
The Company’s dividend reinvestment plan resulted in 349,561 commonshares issued to shareholders for the nine months ended September 30,2016.
17 > NON-CONTROLLING INTERESTS
Pueblo Viejo 40%
Acacia36.1%
Cerro Casale
25% Other Total At January 1, 2016 $ 1,232 $ 677 $ 318 $ 50 $ 2,277 Share of income(loss) 104 17 - (2) 119 Cash contributed - - 1 54 55 Decrease in non-controlling interest 1 (95) (7) - (25) (127) At September 30,2016 $ 1,241 $ 687 $ 319 $ 77 $ 2,324 1 Primarily represents disbursements made to non-controlling interest at PuebloViejo.
BARRICK THIRD QUARTER 2016 97 NOTES TO FINANCIAL STATEMENTS (UNAUDITED)
18 > CONTINGENCIES
Certain conditions may exist as of the date the financial statements areissued that may result in a loss to the Company, but which will be resolvedonly when one or more future events occur or fail to occur. The impact of anyresulting loss from such matters affecting these financial statements andnoted below may be material.
Except as noted below, no material changes have occurred with respect tothe matters disclosed in Note 35 “Contingencies” to the Company’s AnnualConsolidated Financial Statements for the year ended December 31, 2015,and no new contingencies have occurred that are material to the Companysince the issuance of the Annual Consolidated Financial Statements.
The description set out below should be read in conjunction with Note 35“Contingencies” to the Annual Consolidated Financial Statements.
Litigation and Claims Update
U.S. Shareholder Class Action
On May 31, 2016, the Company confirmed that it had reached a $140 millionsettlement in this matter. The amount of the settlement is insured. TheCompany continues to believe that the allegations by the lead plaintiffs in thismatter are unfounded, and under the terms of the settlement agreement, theCompany has not accepted any allegations of wrongdoing or liability.
Proposed Canadian Securities Class Actions
On July 18, 2016, the Court of Appeal for Ontario dismissed the appeal ofthe losing counsel group in the dispute over which of the competing counselgroups will take the lead in the Ontario litigation, thereby affirming the lowercourt’s decision in favor of the counsel group that commenced the first andfourth Ontario actions. The losing counsel group is seeking leave to appealto the Supreme Court of Canada.
Pascua-Lama – SMA Regulatory Sanctions
Consolidated Administrative Proceeding
On April 4, 2016, the SMA issued two reports assessing water quality datapreviously provided by CMN. The SMA rejected CMN’s challenge to certainaspects of these reports on April 25, 2016. The SMA will consider
these reports when issuing a new administrative decision in this matter, asrequired by the March 3, 2014 decision of the Environmental Court.
On June 8, 2016, the SMA consolidated the two administrative proceedingsagainst CMN into a single proceeding encompassing both thereconsideration of the 2013 Resolution in accordance with the decision of theEnvironmental Court and the alleged deviations from the Project’senvironmental approval notified by the SMA in April 2015. A final resolutionfrom the SMA with respect to these matters is pending.
Pascua-Lama – Constitutional Protection Action
On August 12, 2016, the court ruled in favor of CMN and the Chilean miningauthority (Sernageomin), rejecting the plaintiffs’ challenges to the Temporaryand Partial Closure Plan for the Pascua-Lama project. On August 19, 2016,the plaintiffs appealed the court’s decision to the Chilean Supreme Court. Ahearing has been requested and a decision from the Supreme Court on thismatter is pending.
Pascua-Lama – Water Quality Review
CMN initiated a review of the baseline water quality of the Rio Estrecho inAugust 2013 as required by a July 15, 2013 decision of the Court of Appealsof Copiapo, Chile. The purpose of the review was to establish whether thewater quality baseline has changed since the Pascua-Lama project receivedits environmental approval in February 2006 and, if so, to require CMN toadopt the appropriate corrective measures. As a result of that study, CMNrequested certain modifications to its environmental permit water qualityrequirements. On June 6, 2016, the responsible agency approved a partialamendment of the environmental permit to better reflect the water qualitybaseline from 2009. That approval was appealed by certain water users andindigenous residents of the Huasco Valley. On October 19, 2016, theChilean cabinet, which has jurisdiction over claims of this nature, voted touphold the permit amendments. No amounts have been recorded for anypotential liability arising from this matter, as the Company cannot reasonablypredict any potential losses.
BARRICK THIRD QUARTER 2016 98 NOTES TO FINANCIAL STATEMENTS (UNAUDITED)
Veladero – Release of Cyanide-Bearing Process Solution
San Juan Provincial Regulatory Sanction Proceeding
On March 11, 2016, the San Juan Provincial mining authority announced itsintention to impose an administrative fine against Minera Argentina GoldSRL (“MAGSRL”) (formerly, Minera Argentina Gold S.A. or MAGSA),Barrick’s Argentine subsidiary that operates the Veladero mine, inconnection with the solution release. MAGSRL was formally notified of thisdecision on March 15, 2016. On April 6, 2016, MAGSRL soughtreconsideration of certain aspects of the decision but did not challenge theamount of the administrative fine. On April 14, 2016, in accordance with localrequirements, MAGSRL paid the administrative fine of approximately $10million (at the then-applicable Argentine peso/$ exchange rate) while therequest for reconsideration is pending. MAGSRL is implementing a remedialaction plan at Veladero in response to the incident as required by the SanJuan mining authority. Certain construction related activities are still pendingcompletion.
Criminal Matters
On March 11, 2016, a San Juan Provincial court laid criminal charges basedon alleged negligence against nine current and former MAGSRL employeesin connection with the solution release (the “Provincial Action”). Theindividual defendants have appealed the indictment.
In addition, a federal criminal investigation was initiated by a Buenos Airesfederal court based on the alleged failure of certain current and formerfederal and provincial government officials and individual directors ofMAGSRL to prevent the solution release (the “Federal Investigation”). Thefederal judge overseeing the Federal Investigation admitted a local group inSan Juan Province as a party. In March 2016, this group requested aninjunction against the operations of the Veladero mine. The federal judgeordered technical studies to assess the solution release and its impact andappointed a committee to conduct a site visit, which occurred in late April2016.
On May 5, 2016, in response to a jurisdictional challenge from the San Juanprovincial judge and a former MAGSRL director, the National Supreme Courtof Argentina limited the scope of the Federal Investigation to the potentialcriminal liability of the federal government officials, ruling that the BuenosAires
federal court does not have jurisdiction to investigate the solution releaseitself. As a result of this decision, the investigation into the incident willcontinue to be conducted by the San Juan Provincial judge in the ProvincialAction, who will have exclusive jurisdiction to assess the request for aninjunction as well as the technical studies and committee appointmentspreviously ordered by the federal judge. To date, no charges have been laidagainst any specific individuals in connection with the Federal Investigation,consistent with its more limited scope.
MAGSRL is not a party to either the Provincial Action or the FederalInvestigation. No amounts have been recorded for any potential liabilityarising from these matters, as the Company cannot reasonably predict anypotential losses.
Veladero – Release of Crushed Ore Saturated with Process Solution
Temporary Suspension of Operations and Regulatory InfringementProceeding
On September 8, 2016, ice rolling down the slope of the leach pad at theVeladero mine damaged a pipe carrying process solution, causing somematerial to leave the leach pad. This material, primarily crushed oresaturated with process solution, was contained on the mine site and returnedto the leach pad. Extensive water monitoring in the area conducted byMAGSRL has confirmed that the incident did not result in any environmentalimpacts. A temporary suspension of operations at the Veladero mine wasordered by the San Juan Provincial mining authority and a San JuanProvincial court on September 15, 2016 and September 22, 2016,respectively, as a result of this incident. On October 4, 2016, following,among other matters, the completion of certain urgent works required by theSan Juan Provincial mining authority and a judicial inspection of the mine,the San Juan Provincial court lifted the suspension of operations andordered that mining activities be resumed.
On September 14, 2016, the San Juan Provincial mining authoritycommenced an administrative proceeding in connection with this incidentthat included, in addition to the issue of the suspension order, aninfringement proceeding against MAGSRL. The San Juan Provincial miningauthority has not yet served notice on MAGSRL of any charges that may belaid under the infringement proceeding. A new criminal judicial investigationhas also been commenced by the Provincial prosecutor’s
BARRICK THIRD QUARTER 2016 99 NOTES TO FINANCIAL STATEMENTS (UNAUDITED)
office in the same San Juan Provincial court that is hearing the ProvincialAction. The court in this proceeding issued the orders suspending andresuming the operations at the Veladero mine described above. No amountshave been recorded for any potential liability arising from these matters, asthe Company cannot reasonably predict the outcome.
Argentine Glacier Legislation and Constitutional Litigation
On October 3, 2016, federal authorities published a partial national inventoryof glaciers, which includes the area where the Veladero mine and PascuaLama Project are located. The Company is analyzing the partial nationalinventory to determine whether it is consistent with the provincial inventorythat the Province of San Juan used in connection with its January 2013environmental audit, which concluded that Veladero and Pascua Lama donot impact glaciers or peri-glaciers.
HEAD OFFICE TRANSFER AGENTS AND REGISTRARSBarrick Gold CorporationBrookfield PlaceTD Canada Trust Tower161 Bay Street, Suite 3700Toronto, Ontario M5J 2S1
Telephone: +1 416 861-9911Toll-free: 1-800-720-7415Fax: +1 416 861-2492Email: [email protected]: www.barrick.com SHARES LISTED
ABX – The New York Stock ExchangeThe Toronto Stock Exchange
CST Trust CompanyP.O. Box 700, Postal Station BMontreal, Quebec H3B 3K3orAmerican Stock Transfer & Trust Company, LLC6201 – 15 AvenueBrooklyn, New York 11219
Telephone: 1-800-387-0825Fax: 1-888-249-6189Email: [email protected]: www.canstockta.com
INVESTOR CONTACT MEDIA CONTACTDaniel Oh Andy LloydSenior Vice President Senior Vice PresidentInvestor Engagement and Governance CommunicationsTelephone: +1 416 307-7474 Telephone: +1 416 307-7414Email: [email protected] Email: [email protected]

CAUTIONARY STATEMENT ON FORWARD-LOOKING INFORMATION
Certain information contained or incorporated by reference in this Third Quarter Report 2016, including any information as to ourstrategy, projects, plans or future financial or operating performance, constitutes “forward-looking statements”. All statements,other than statements of historical fact, are forward-looking statements. The words “believe”, “expect”, “anticipate”,“contemplate”, “target”, “plan”, “objective” “aspiration”, “aim”, “intend”, “project”, “goal”, “continue”, “budget”, “estimate”,“potential”, “may”, “will”, “can”, “should”, “could”, “would”, and similar expressions identify forward-looking statements. Inparticular, this Third Quarter Report 2016 contains forward-looking statements including, without limitation, with respect to: (i)Barrick’s forward-looking production guidance; (ii) estimates of future cost of sales per ounce for gold and per pound for copper,all-in-sustaining costs per ounce/pound, cash costs per ounce, and C1 cash costs per pound; (iii) cash flow forecasts; (iv)projected capital, operating, and exploration expenditures; (v) targeted debt and cost reductions; (vi) targeted investments byBarrick’s Growth Group; (vii) mine life and production rates; (viii) potential mineralization and metal or mineral recoveries; (ix)Barrick’s Best-in-Class program (including potential improvements to financial and operating performance that may result fromcertain Best-in-Class initiatives); (x) the Lama starter project and the potential for phased in development of the Pascua-Lamaproject; (xi) the potential impact and benefits of Barrick’s digital reinvention initiative; (xii) timing and completion of acquisitions;(xiii) asset sales or joint ventures; and (xiv) expectations regarding future price assumptions, financial performance, and otheroutlook or guidance.
Forward-looking statements are necessarily based upon a number of estimates and assumptions including material estimatesand assumptions related to the factors set forth below that, while considered reasonable by the Company as at the date of thispress release in light of management’s experience and perception of current conditions and expected developments, areinherently subject to significant business, economic, and competitive uncertainties and contingencies. Known and unknownfactors could cause actual results to differ materially from those projected in the forward-looking statements and undue relianceshould not be placed on such statements and information. Such factors include, but are not limited to: fluctuations in the spot andforward price of gold, copper, or certain other commodities (such as silver, diesel fuel, natural gas, and electricity); thespeculative nature of mineral exploration and development; changes in mineral production performance, exploitation andexploration successes; risks associated with the fact that certain Best-in-Class initiatives are still in the early stages of evaluationand additional engineering and other analysis is required to fully assess their impact; risks associated with the implementation ofBarrick’s digital reinvention initiative and the ability of the projects under this initiative to meet the Company’s capital allocationobjectives; diminishing quantities or grades of reserves; increased costs, delays, suspensions, and technical challengesassociated with the construction of capital projects; operating or technical difficulties in connection with mining or developmentactivities, including geotechnical challenges and disruptions in the maintenance or provision of required infrastructure andinformation technology systems; failure to comply with environmental and health and safety laws and regulations; timing ofreceipt of, or failure to comply with, necessary permits and approvals; uncertainty whether some or all of the Best-in-Classinitiatives and investments targeted by the Growth Group will meet the Company’s capital allocation objectives; the impact ofglobal liquidity and credit availability on the timing of cash flows and the values of assets and liabilities based on projected futurecash flows;
adverse changes in our credit ratings; the impact of inflation; fluctuations in the currency markets; changes in U.S. dollar interestrates; risks arising from holding derivative instruments; changes in national and local government legislation, taxation, controls,or regulations and/or changes in the administration of laws, policies and practices, expropriation or nationalization of property,and political or economic developments in Canada, the United States, and other jurisdictions in which the Company does or maycarry on business in the future; lack of certainty with respect to foreign legal systems, corruption, and other factors that areinconsistent with the rule of law; damage to the Company’s reputation due to the actual or perceived occurrence of any numberof events, including negative publicity with respect to the Company’s handling of environmental matters or dealings withcommunity groups, whether true or not; risk of loss due to acts of war, terrorism, sabotage, and civil disturbances; litigation;contests over title to properties, particularly title to undeveloped properties, or over access to water, power, and other requiredinfrastructure; business opportunities that may be presented to, or pursued by, the Company; our ability to successfully integrateacquisitions or complete divestitures; risks associated with working with partners in jointly controlled assets; employee relationsincluding loss of key employees; increased costs and physical risks, including extreme weather events and resource shortage,related to climate change; availability and increased costs associated with mining inputs and labor; and the organization of ourpreviously held African gold operations and properties under a separate listed Company. In addition, there are risks and hazardsassociated with the business of mineral exploration, development and mining, including environmental hazards, industrialaccidents, unusual or unexpected formations, pressures, cave-ins, flooding, and gold bullion, copper cathode, or gold or copperconcentrate losses (and the risk of inadequate insurance, or inability to obtain insurance, to cover these risks).
Many of these uncertainties and contingencies can affect our actual results and could cause actual results to differ materiallyfrom those expressed or implied in any forward-looking statements made by, or on behalf of, us. Readers are cautioned thatforward-looking statements are not guarantees of future performance. All of the forward-looking statements made in this ThirdQuarter Report 2016 are qualified by these cautionary statements. Specific reference is made to the most recent Form 40-F/Annual Information Form on file with the SEC and Canadian provincial securities regulatory authorities for a more detaileddiscussion of some of the factors underlying forward-looking statements and the risks that may affect Barrick’s ability to achievethe expectations set forth in the forward-looking statements contained in this press release.
The Company disclaims any intention or obligation to update or revise any forward-looking statements whether as a result ofnew information, future events or otherwise, except as required by applicable law.