barrickgoldcorporationd18rn0p25nwr6d.cloudfront.net/cik-0000756894/196eac0b-e021-42e6-b..., in the...
TRANSCRIPT
SECURITIESANDEXCHANGECOMMISSIONWashington,D.C.20549
FORM40-F
☐ RegistrationstatementpursuanttoSection12oftheSecuritiesExchangeActof1934
or☒ AnnualreportpursuanttoSection13(a)or15(d)oftheSecuritiesExchangeActof1934
ForFiscalyearended:December31,2017 CommissionFilenumber:No.1-9059
BARRICKGOLDCORPORATION(Exactnameofregistrantasspecifiedinitscharter)
Ontario 1041 NotApplicable(Provinceorotherjurisdictionofincorporationororganization)
(Primarystandardindustrialclassificationcodenumber,
ifapplicable)
(I.R.S.employeridentificationnumber,ifapplicable)
BrookfieldPlace,TDCanadaTrustTowerSuite3700
161BayStreet,P.O.Box212Toronto,CanadaM5J2S1
(800)720-7415(Addressandtelephonenumberofregistrant’sprincipalexecutiveoffice)
BarrickGoldstrikeMinesInc.P.O.Box29,Elko,Nevada89803
(702)738-8043(Name,addressandtelephonenumberofagentforserviceintheUnitedStates)
SecuritiesregisteredpursuanttoSection12(b)oftheAct:
Titleofeachclass: Nameofeachexchangeonwhichregistered:
CommonShares NewYorkStockExchange
SecuritiesregisteredortoberegisteredpursuanttoSection12(g)oftheAct:None
SecuritiesforwhichthereisareportingobligationpursuanttoSection15(d)oftheAct:None
Forannualreports,indicatebycheckmarktheinformationfiledwiththisform:
☒AnnualInformationForm☒AuditedAnnualFinancialStatements
Indicatethenumberofoutstandingsharesofeachoftheissuer’sclassesofcapitalorcommonstockasofthecloseoftheperiodcoveredbytheannualreport:
CommonShares1,166,577,478
Indicatebycheckmarkwhethertheregistrant:(1)hasfiledallreportsrequiredtobefiledbySection13or15(d)oftheExchangeActduringthepreceding12months(orforsuchshorterperiodthattheregistrantwasrequiredtofilesuchreports);and(2)hasbeensubjecttosuchfilingrequirementsforthepast90days.
Yes☒No☐
IndicatebycheckmarkwhethertheregistranthassubmittedelectronicallyandpostedonitscorporateWebsite,ifany,everyInteractiveDataFilerequiredtobesubmittedandpostedpursuanttoRule405ofRegulationS-T(§232.405ofthischapter)duringthepreceding12months(orforsuchshorterperiodthattheregistrantwasrequiredtosubmitandpostsuchfiles).
Yes☒No☐
IndicatebycheckmarkwhethertheregistrantisanemerginggrowthcompanyasdefinedinRule12b-2oftheExchangeAct.

Emerginggrowthcompany☐
IfanemerginggrowthcompanythatpreparesitsfinancialstatementsinaccordancewithU.S.GAAP,indicatebycheckmarkiftheregistranthaselectednottousetheextendedtransitionperiodforcomplyingwithanyneworrevisedfinancialaccountingstandardsprovidedpursuanttoSection13(a)oftheExchangeAct.☐

INTERNALCONTROLOVERFINANCIALREPORTINGANDDISCLOSURECONTROLSANDPROCEDURES
Thedisclosureprovidedunder“InternalControlOverFinancialReportingandDisclosureControlsandProcedures”onpages150and151ofExhibit99.1,Barrick’sAnnualInformationForm,isincorporatedbyreferenceherein.
MANAGEMENT’SREPORTONINTERNALCONTROLOVERFINANCIALREPORTING
Barrick’s“Management’sReportonInternalControlOverFinancialReporting”containedinExhibit99.2isincorporatedbyreferenceherein.
ATTESTATIONREPORTOFTHEREGISTEREDPUBLICACCOUNTINGFIRM
Thedisclosureprovidedunder“ReportofIndependentRegisteredPublicAccountingFirm”onpages95through96ofExhibit99.3,Barrick’sAuditedConsolidatedFinancialStatements,isincorporatedbyreferenceherein.
AUDITCOMMITTEE
Thedisclosureprovidedunder“CompositionoftheAuditCommittee”onpage148ofExhibit99.1,Barrick’sAnnualInformationForm,isincorporatedbyreferenceherein.Barrickhasaseparately-designatedstandingauditcommitteeestablishedinaccordancewithSection3(a)(58)(A)oftheSecuritiesExchangeActof1934,asamended.
CODEOFETHICS
Barrickhasadoptedacodeofethicsentitled,“BarrickGoldCorporationCodeofBusinessConductandEthics.”TheCodeofBusinessConductandEthicsappliestoalldirectors,officersandemployeesofBarrick,includingBarrick’sprincipalexecutiveofficer,principalfinancialofficerandprincipalaccountingofficer.TheCodeofBusinessConductandEthicsisavailableatBarrick’sInternetwebsite,www.barrick.com,intheCompany—GovernancesectionandisavailableinprinttoanyshareholderuponwrittenrequesttotheCorporateSecretaryofBarrick.
PRINCIPALACCOUNTANTFEESANDSERVICES
Thedisclosureprovidedunder“ExternalAuditorServiceFees”onpages149and150ofExhibit99.1,Barrick’sAnnualInformationForm,isincorporatedbyreferenceherein.
AUDITCOMMITTEEPRE-APPROVALPOLICIESANDPROCEDURES
Thedisclosureprovidedunder“AuditCommitteePre-ApprovalPoliciesandProcedures”onpage149ofExhibit99.1,Barrick’sAnnualInformationForm,isincorporatedbyreferenceherein.Noaudit-relatedfees,taxfeesorothernon-auditfeeswereapprovedbytheAuditCommitteepursuanttoparagraph(c)(7)(i)(C)ofRule2-01ofRegulationS-X.

OFF-BALANCESHEETARRANGEMENTS
Barrickhasnooff-balancesheetarrangementsthathave,orarereasonablylikelytohave,amaterialeffectonBarrick’sfinancialcondition,changesinfinancialcondition,revenuesorexpenses,resultsofoperations,liquidity,capitalexpendituresorcapitalresources.
CONTRACTUALOBLIGATIONS
Thedisclosureprovidedunder“ContractualObligationsandCommitments”onpage66ofExhibit99.4,Management’sDiscussionandAnalysisofFinancialandOperatingResults,isincorporatedbyreferenceherein.
MINESAFETYDISCLOSURE
BarrickisrequiredtoreportcertainminesafetyviolationsorotherregulatorymattersrequiredbySection1503(a)oftheDodd-FrankWallStreetReformandConsumerProtectionAct,andthatrequiredinformationisincludedinExhibit99.14.

UNDERTAKINGANDCONSENTTOSERVICEOFPROCESS
A.Undertaking
Registrantundertakestomakeavailable,inpersonorbytelephone,representativestorespondtoinquiriesmadebytheCommissionstaff,andtofurnishpromptly,whenrequestedtodosobytheCommissionstaff,informationrelatingto:thesecuritiesregisteredpursuanttoForm40-F;thesecuritiesinrelationtowhichtheobligationtofileanannualreportonForm40-Farises;ortransactionsinsaidsecurities.
B.ConsenttoServiceofProcess
RegistranthaspreviouslyfiledwiththeCommissionaFormF-XinconnectionwiththeCommonShares.

INCORPORATIONBYREFERENCE
Barrick’sannualreportonForm40-F(otherthanthesectionentitled“Ratings”inExhibit99.1)isincorporatedbyreferenceintoBarrick’sRegistrationStatementsonFormS-8(FileNos.333-121500,333-131715,333-135769),FormF-3(FileNo.333-206417)andFormF-10(FileNo.333-216099).

SIGNATURES
PursuanttotherequirementsoftheExchangeAct,theregistrantcertifiesthatitmeetsalloftherequirementsforfilingonForm40-Fandhasdulycausedthisannualreporttobesignedonitsbehalfbytheundersigned,theretodulyauthorized.
BARRICKGOLDCORPORATION
Dated:March23,2018 By: /s/RichieHaddock Name: RichieHaddock Title: SeniorVicePresidentandGeneralCounsel
EXHIBITINDEXExhibits Description
99.1 AnnualInformationFormdatedasofMarch23,2018
99.2 Management’sReportonInternalControlOverFinancialReporting
99.3
BarrickGoldCorporation’sAuditedConsolidatedFinancialStatementspreparedinaccordancewithInternationalFinancialReportingStandardsasissuedbytheInternationalAccountingStandardsBoard,includingtheNotesthereto,asatandfortheyearsendedDecember31,2017and2016,togetherwiththeIndependentAuditor’sreportthereon.
99.4 BarrickGoldCorporation’sManagement’sDiscussionandAnalysisfortheyearendedDecember31,2017
99.5 ConsentofPricewaterhouseCoopersLLP
99.6 ConsentofRickSims
99.7 ConsentofStevenHaggarty
99.8 ConsentofPatrickGarretson
99.9 ConsentofRobertKrcmarov
99.10 CertificationofKelvinP.M.DushniskyrequiredbyRule13a-14(a)orRule15d-14(a),pursuanttoSection302ofSarbanes-OxleyActof2002
99.11 CertificationofCatherineP.RawrequiredbyRule13a-14(a)orRule15d-14(a),pursuanttoSection302ofSarbanes-OxleyActof2002
99.12 CertificationofKelvinP.M.Dushniskypursuantto18U.S.C.Section1350,asenactedpursuanttoSection906ofSarbanes-OxleyActof2002
99.13 CertificationofCatherineP.Rawpursuantto18U.S.C.Section1350,asenactedpursuanttoSection906ofSarbanes-OxleyActof2002
99.14 Dodd-FrankActDisclosureofMineSafetyandHealthAdministrationSafetyData
101.INS XBRLInstanceDocument(1)
101.SCH XBRLTaxonomyExtensionSchemaDocument(1)
101.CAL XBRLTaxonomyExtensionCalculationLinkbaseDocument(1)
101.DEF XBRLTaxonomyExtensionDefinitionLinkbaseDocument(1)
101.LAB XBRLTaxonomyExtensionLabelsLinkbaseDocument(1)
101.PRE XBRLTaxonomyExtensionPresentationLinkbaseDocument(1)
(1) Filedherewith.

Exhibit99.1
BarrickGoldCorporationBrookfieldPlace,TDCanadaTrustTowerSuite3700,161BayStreet,P.O.Box212Toronto,ONM5J2S1AnnualInformationFormFortheyearendedDecember31,2017DatedasofMarch23,2018
BARRICKGOLDCORPORATIONANNUALINFORMATIONFORM
TABLEOFCONTENTSGLOSSARYOFTECHNICALTERMS 4
REPORTINGCURRENCY,FINANCIALANDRESERVEINFORMATION 10
FORWARD-LOOKINGINFORMATION 10
SCIENTIFICANDTECHNICALINFORMATION 13
GENERALINFORMATION 13
OrganizationalStructure 13Subsidiaries 14AreasofInterest 16GeneralDevelopmentoftheBusiness 16
History 16Strategy 16ResultsofOperationsin2017 18
NARRATIVEDESCRIPTIONOFTHEBUSINESS 22
Production 22ReportableOperatingSegments 22
BarrickNevada 23PuebloViejo(60%basis) 24LagunasNorte 24Veladero 25TurquoiseRidge(75%basis) 26AcaciaMiningplc(63.9%basis) 27Pascua-LamaProject 28
MineralReservesandMineralResources 29MarketingandDistribution 39EmployeesandLaborRelations 41Competition 41CorporateSocialResponsibility 41OperationsinEmergingMarkets:CorporateGovernanceandInternalControls 42
BoardandManagementExperienceandOversight 43Communications 44InternalControlsandCashManagementPractices 44ManagingCulturalDifferences 45BooksandRecords 45
MATERIALPROPERTIES 45
CortezProperty 45GoldstrikeProperty 52PuebloViejoMine 58
-i-

LagunasNorteMine 65VeladeroMine 71TurquoiseRidgeMine 80
EXPLORATIONANDEVALUATIONS 86
ENVIRONMENT 91
LEGALMATTERS 94
GovernmentControlsandRegulations 94LegalProceedings 97
RISKFACTORS 110
MANAGEMENT’SDISCUSSIONANDANALYSISOFFINANCIALCONDITIONANDRESULTSOFOPERATIONS 129
CONSOLIDATEDFINANCIALSTATEMENTS 129
CAPITALSTRUCTURE 129
RATINGS 132
MARKETFORSECURITIES 133
MATERIALCONTRACTS 135
TRANSFERAGENTSANDREGISTRARS 137
DIVIDENDPOLICY 137
DIRECTORSANDOFFICERSOFTHECOMPANY 137
AUDITCOMMITTEE 147
AuditCommitteeMandate 147CompositionoftheAuditCommittee 147RelevantEducationandExperience 147ParticipationonOtherAuditCommittees 148AuditCommitteePre-ApprovalPoliciesandProcedures 148ExternalAuditorServiceFees 148
INTERNALCONTROLOVERFINANCIALREPORTINGANDDISCLOSURECONTROLSANDPROCEDURES 149
NON-GAAPFINANCIALMEASURES 150
INTERESTSOFEXPERTS 167
ADDITIONALINFORMATION 168
-ii-

SCHEDULE“A”AUDITCOMMITTEEMANDATE A-1
-iii-
GLOSSARYOFTECHNICALTERMS
Assay
Achemicalanalysistodeterminetheamountorproportionoftheelementofinterestcontainedwithinasample,typicallybasemetalsorpreciousmetals.
Autoclave
Oxidationprocessinwhichhightemperaturesandpressuresareappliedwithinapressurizedclosedvesseltoconvertrefractorysulfidemineralizationintoamenableoxideore.
BlockCaving
Anon-selectivebulkminingmethodwherematerialiscausedtocavetowardsundergroundextractionpointsfollowingtheengineereddrillingandremovalofmaterialfromanundercutthatcreatesapatternofbreakageandcollapsewithintherockmass.
By-product
Apayablesecondarymetalormineralproductthatisrecoveredalongwiththeprimarymetalormineralproductduringtheconcentrationprocess.
Carbonaceous
Naturallyoccurringcarbonpresentintheorefromthedecayoforganicmaterialwhichcanresultinaninadvertentlossofpreciousmetalsduringthecyanidationprocess.
Carbon-in-leach(CIL)
Arecoveryprocessinwhichpreciousmetalsaredissolvedfromfinelygroundoreduringcyanidationandsimultaneouslyadsorbedonrelativelycoarseactivatedcarbon(burntcoconutshell)granules.Theloadedcarbonparticlesareseparatedfromtheslurryandrecycledintheprocessfollowingpreciousmetalremovalandreactivationthroughchemicalandthermalmeans.
Carbon-in-column(CIC)
Amethodofrecoveringgoldandsilverfromsolutionfollowingcyanidationintheprocessbyadsorptionofthepreciousmetalsontopreparedcarbon(burntcoconutshell).
Concentrate
Aproductfromamineralprocessingfacilitysuchasgravityseparationorflotationinwhichthevaluableconstituentshavebeenupgradedandunwantedganguematerialsrejectedaswaste.
Containedounces
Ameasureofin-situorcontainedmetalbasedonanestimateoftonnageandgrade.
Crushing
AunitoperationthatreducesthesizeofmaterialdeliveredasRunofMineOreforfurtherprocessing.
Cut-and-fill
Amethodofstopinginwhichoreisremovedinslices,orlifts,andthentheexcavationisfilledwithrockorotherwastematerial(backfill),beforethesubsequentsliceisextracted.
Cut-offgrade
Acalculatedminimummetalgradeatwhichmaterialcanbeminedandprocessedatbreak-evencost.
-4-
Development
Workcarriedoutforthepurposeofpreparingamineraldepositforproduction.Inanundergroundmine,developmentincludesshaftsinking,crosscutting,driftingandraising.Inanopenpitmine,developmentincludestheremovalofoverburdenand/orwasterock.
Dilution
Theeffectofwasteorlow-gradeorewhichisunavoidablyincludedintheminedore,loweringtherecoveredgrade.
Doré
Compositegoldandsilverbullionusuallyconsistingofapproximately90%preciousmetalsthatwillbefurtherrefinedtoseparatepuremetals.
Drift
Ahorizontaltunnelgenerallydrivenwithinoralongsideanorebodyandalignedparalleltothelongdimensionoftheore.
Drift-and-fill
Amethodofundergroundminingusedforflat-lyingmineralizationorwheregroundconditionsarelesscompetent.
Drilling
Core:adrillingmethodthatusesarotatingbarrelandanannular-shaped,diamond-impregnatedrock-cuttingbittoproducecylindricalrockcoresandliftsuchcorestothesurface,wheretheymaybecollected,examinedandassayed.
Reversecirculation:adrillingmethodthatusesarotatingcuttingbitwithinadouble-walleddrillpipeandproducesrockchipsratherthancore.Airorwateriscirculateddowntothebitbetweentheinnerandouterwallofthedrillpipe.Thechipsareforcedtothesurfacethroughthecenterofthedrillpipeandarecollected,examinedandassayed.
Conventionalrotary:adrillingmethodthatproducesrockchipssimilartoreversecirculationexceptthatthesampleiscollectedusingasingle-walleddrillpipe.Airorwatercirculatesdownthroughthecenterofthedrillpipeandreturnschipstothesurfacearoundtheoutsideofthepipe.
In-fill:thecollectionofadditionalsamplesbetweenexistingsamples,usedtoprovidegreatergeologicaldetailandtoprovidemoreclosely-spacedassaydata.
Exploration
Prospecting,sampling,mapping,diamond-drillingandotherworkinvolvedinlocatingthepresenceofeconomicdepositsandestablishingtheirnature,shapeandgrade.
Flotation
Aprocesswhichconcentratesmineralsbytakingadvantageofspecificsurfacepropertiesandapplyingchemicalssuchascollectors,depressants,modifiersandfrothersinthepresenceofwaterandfinelydispersedairbubbles.
Grade
Theconcentrationofanelementofinterestexpressedasrelativemassunits(percentage,partspermillion,ouncesperton,gramspertonne,etc.).
-5-
Grinding(Milling)
Involvesthesizereductionofmaterialfedtoaprocessplantthoughabrasionorattritiontoliberatevaluablemineralsforfurthermetallurgicalprocessing.
Heapleaching
Aprocesswherebypreciousorbasemetalsareextractedfromstackedmaterialplacedontopofanimpermeableplasticlinerandafterapplyingleachsolutionswhichdissolveandtransportvaluesforrecoveryintheprocessplant.
Lode
Amineraldeposit,consistingofazoneofveins,veinletsordisseminations,inconsolidatedrockasopposedtoaplacerdeposit.
Long-holeopenstoping
Amethodofundergroundmininginvolvingthedrillingofholesupto30metersorlongerintoanorebearingzoneandthenblastingasliceofrockwhichfallsintoanopenspace.Thebrokenrockisextractedandtheresultingopenchambermayormaynotbebackfilledwithsupportingmaterial.
MetricconversionTroyounces × 31.10348 = GramsTroyouncespershortton × 34.28600 = GramspertonnePounds × 0.00045 = TonnesTons × 0.90718 = TonnesFeet × 0.30480 = MetersMiles × 1.60930 = KilometersAcres × 0.40468 = HectaresFahrenheit (°F-32)×5÷9 = Celsius
Mill
Afacilitywhereoreisfinelygroundandthereafterundergoesphysicalorchemicaltreatmenttoextractthevaluablemetals.
Mineralreserve
Theeconomicallymineableportionofameasuredorindicatedmineralresourcedemonstratedbyatleastapreliminaryfeasibilitystudy.Thisstudymustincludeadequateinformationonmining,processing,metallurgical,economicandotherrelevantfactorsthatdemonstrate,atthetimeofreporting,thateconomicextractioncanbejustified.Amineralreserveincludesdilutingmaterialsandallowancesforlossesthatmayoccurwhenthematerialismined.Mineralreservesaresub-dividedinorderofincreasingconfidenceintoprobablemineralreservesandprovenmineralreserves.
Probablemineralreserve:theeconomicallymineableportionofanindicatedand,insomecircumstances,ameasuredmineralresourcedemonstratedbyatleastapreliminaryfeasibilitystudy.Thisstudymustincludeadequateinformationonmining,processing,metallurgical,economicandotherrelevantfactorsthatdemonstrate,atthetimeofreporting,thateconomicextractioncanbejustified.
Provenmineralreserve:theeconomicallymineablepartofameasuredmineralresourcedemonstratedbyatleastapreliminaryfeasibilitystudy.Thisstudymustincludeadequateinformationonmining,processing,metallurgical,economicandotherrelevantfactorsthatdemonstrate,atthetimeofreporting,thateconomicextractionisjustified.
-6-
Mineralresource
Aconcentrationoroccurrenceofdiamonds,naturalsolidinorganicmaterial,ornaturalsolidfossilizedorganicmaterialincludingbaseandpreciousmetals,coal,andindustrialmineralsinorontheEarth’scrustinsuchformandquantityandofsuchagradeorqualitythatithasreasonableprospectsforeconomicextraction.Thelocation,quantity,grade,geologicalcharacteristicsandcontinuityofamineralresourceareknown,estimatedorinterpretedfromspecificgeologicalevidenceandknowledge.Mineralresourcesaresub-divided,inorderofincreasinggeologicalconfidence,intoinferred,indicatedandmeasuredcategories.
Inferredmineralresource:thatpartofamineralresourceforwhichquantityandgradeorqualitycanbeestimatedonthebasisofgeologicalevidenceandlimitedsamplingandreasonablyassumed,butnotverified,geologicalandgradecontinuity.Theestimateisbasedonlimitedinformationandsamplinggatheredthroughappropriatetechniquesfromlocationssuchasoutcrops,trenches,pits,workingsanddrillholes.
Indicatedmineralresource:thatpartofamineralresourceforwhichquantity,gradeorquality,densities,shapeandphysicalcharacteristicscanbeestimatedwithalevelofconfidencesufficienttoallowtheappropriateapplicationoftechnicalandeconomicparameters,tosupportmineplanningandevaluationoftheeconomicviabilityofthedeposit.Theestimateisbasedondetailedandreliableexplorationandtestinginformationgatheredthroughappropriatetechniquesfromlocationssuchasoutcrops,trenches,pits,workingsanddrillholesthatarespacedcloselyenoughforgeologicalandgradecontinuitytobereasonablyassumed.
Measuredmineralresource:thatpartofamineralresourceforwhichquantity,gradeorquality,densities,shapeandphysicalcharacteristicsaresowellestablishedthattheycanbeestimatedwithconfidencesufficienttoallowtheappropriateapplicationoftechnicalandeconomicparameters,tosupportproductionplanningandevaluationoftheeconomicviabilityofthedeposit.Theestimateisbasedondetailedandreliableexploration,samplingandtestinginformationgatheredthroughappropriatetechniquesfromlocationssuchasoutcrops,trenches,pits,workingsanddrillholesthatarespacedcloselyenoughtoconfirmbothgeologicalandgradecontinuity.
Miningclaim
Afootprintoflandthatapartyhasstakedormarkedoutinaccordancewithapplicablemininglawstoacquiretherighttoexploreforand,inmostinstances,exploitthemineralsunderthesurface.
Netprofitsinterestroyalty
Aroyaltybasedontheprofitremainingafterrecaptureofcertainoperating,capitalandothercosts.
Netsmelterreturnroyalty
Aroyaltybasedonapercentageofvaluablemineralsproducedwithsettlementmadeeitherinkindorincurrencybasedonthesaleproceedsreceivedlessalloftheoffsitesmelting,refiningandtransportationcostsassociatedwiththepurificationoftheeconomicmetals.
Openpitmine
Aminewherematerialsareremovedinanexcavationfromsurface.
Ore
Materialcontainingmetallicornon-metallicmineralswhichcanbeminedandprocessedataprofit.
Orebody
Asufficientlylargeamountoforethatiscontiguousandcanbeminedeconomically.
-7-
Oxideore
Mineralizedrockinwhichsomeofthehostrockororiginalmineralizationhasbeenoxidized.
QualifiedPerson
See“ScientificandTechnicalInformation”.
Reclamation
Theprocessbywhichlandsdisturbedasaresultofminingactivityaremodifiedtosupportbeneficiallanduse.Reclamationactivitymayincludetheremovalofbuildings,equipment,machineryandotherphysicalremnantsofmining,closureoftailingsstoragefacilities,leachpadsandotherminefeatures,andcontouring,coveringandre-vegetationofwasterockandotherdisturbedareas.
Reclamationandclosurecosts
Thecostofreclamationplusothercosts,includingwithoutlimitationcertainpersonnelcosts,insurance,propertyholdingcostssuchastaxes,rentalandclaimfees,andcommunityprogramsassociatedwithclosinganoperatingmine.
Recoveryrate
Atermusedinprocessmetallurgytoindicatetheproportionofvaluablematerialphysicallyrecoveredintheprocessingofore.Itisgenerallystatedasapercentageofthematerialrecoveredcomparedtothetotalmaterialoriginallypresent.
Refining
Thefinalstageofmetalproductioninwhichimpuritiesareremovedfromamoltenmetal.
Refractorymaterial
Mineralizedmaterialfromwhichmetalisnotamenabletorecoverybyconventionalcyanidemethodswithoutanypre-treatment.Therefractorynaturecanbeduetoeithersilicaorsulfideencapsulationofthemetalorthepresenceofnaturallyoccurringcarbonorotherconstituentsthatreducegoldrecovery.
Roasting
Thetreatmentofsulfideorebyheatandair,oroxygenenrichedair,inordertooxidizesulfidesandremoveotherelements(carbon,antimonyorarsenic).
Shaft
Averticalpassagewaytoanundergroundmineforventilation,movingpersonnel,equipment,suppliesandmaterialincludingoreandwasterock.
Tailings
Thematerialthatremainsafterprocessing.
Tailingsstoragefacility
Anareaconstructedforlongtermstorageofmaterialthatremainsafterprocessing.
Tons
Shorttons(2,000poundsorapproximately907kilograms).
Tonnes
Metrictonnes(1,000kilogramsorapproximately2,205pounds).
-8-

Underhandcut-and-fill
Acut-and-fillmethodofundergroundminingthatworksdownward,withcementedfillplacedabovetheworkingarea;bestsuitedwheregroundconditionsarelesscompetent.
-9-
REPORTINGCURRENCY,FINANCIALANDRESERVEINFORMATION
AllcurrencyamountsinthisAnnualInformationFormareexpressedinUnitedStatesdollars,unlessotherwiseindicated.Referencesto“C$”aretoCanadiandollars.Referencesto“A$”aretoAustraliandollars.Referencesto“CLP”aretoChileanpesos.Referencesto“ARS”aretoArgentineanpesos.ForCanadiandollarstoU.S.dollars,theaverageexchangeratefor2017andtheexchangerateasatDecember31,2017wereoneCanadiandollarper0.77and0.80U.S.dollars,respectively.ForAustraliandollarstoU.S.dollars,theaverageexchangeratefor2017andtheexchangerateasatDecember31,2017wereoneAustraliandollarper0.77and0.78U.S.dollars,respectively.ForChileanpesostoU.S.dollars,theaverageexchangeratefor2017andtheexchangerateasatDecember31,2017wereoneU.S.dollarper649and615Chileanpesos,respectively.ForArgentineanpesostoU.S.dollars,theaverageexchangeratefor2017andtheexchangerateasatDecember31,2017wereoneU.S.dollarper16.56and18.61Argentineanpesos,respectively.
FortheyearendedDecember31,2017andforthecomparativepriorperiodsidentifiedinthisAnnualInformationForm,BarrickGoldCorporation(“Barrick”orthe“Company”)prepareditsfinancialstatementsinaccordancewithInternationalFinancialReportingStandardsasissuedbytheInternationalAccountingStandardsBoard(“IFRS”).TheauditedconsolidatedfinancialstatementsoftheCompanyfortheyearendedDecember31,2017(the“ConsolidatedFinancialStatements”)areavailableelectronicallyfromtheCanadianSystemforElectronicDocumentAnalysisandRetrieval(“SEDAR”)atwww.sedar.comandfromtheU.S.SecuritiesandExchangeCommission’s(the“SEC”)ElectronicDocumentGatheringandRetrievalSystem(“EDGAR”)atwww.sec.gov.
Mineralreserves(“reserves”)andmineralresources(“resources”)havebeenestimatedasatDecember31,2017inaccordancewithNationalInstrument43-101–StandardsofDisclosureforMineralProjects(“NationalInstrument43-101”),asrequiredbyCanadiansecuritiesregulatoryauthorities.ForUnitedStatesreportingpurposes,IndustryGuide7(undertheSecuritiesandExchangeActof1934),asinterpretedbytheStaffoftheSEC,appliesdifferentstandardsinordertoclassifymineralizationasareserve(seeNote8of“–NotestotheMineralReservesandResourcesTables”in“NarrativeDescriptionoftheBusiness–MineralReservesandMineralResources”).Inaddition,whiletheterms“measured”,“indicated”and“inferred”mineralresourcesarerequiredpursuanttoNationalInstrument43-101,theSECdoesnotrecognizesuchterms.CanadianstandardsdiffersignificantlyfromtherequirementsoftheSEC,andmineralresourceinformationcontainedhereinisnotcomparabletosimilarinformationregardingmineralreservesdisclosedinaccordancewiththerequirementsoftheSEC.Readersshouldunderstandthat“inferred”mineralresourceshaveagreatamountofuncertaintyastotheirexistenceandastotheireconomicandlegalfeasibility.Inaddition,readersarecautionednottoassumethatalloranypartofBarrick’smineralresourcesconstituteorwillbeconvertedintoreserves.
Barrickusescertainnon-GAAPfinancialperformancemeasuresinitsfinancialreports,includingcashcostsperounce,all-insustainingcostsperounce,all-incostsperounce,C1cashcostsperpoundandall-insustainingcostsperpound.Foradescriptionandreconciliationofeachofthesemeasures,pleaseseepages69to84ofBarrick’sManagement’sDiscussionandAnalysisofFinancialandOperatingResultsfortheyearendedDecember31,2017containedinBarrick’s2017AnnualReport(the“MD&A”).Seealso“Non-GAAPFinancialMeasures”atpages150to167foradetaileddiscussionofeachofthenon-GAAPmeasuresusedinthisAnnualInformationForm.
FORWARD-LOOKINGINFORMATION
CertaininformationcontainedinthisAnnualInformationForm,includinganyinformationastoBarrick’sstrategy,projects,plansorfuturefinancialoroperatingperformance,constitutes“forward-lookingstatements”.Allstatements,otherthanstatementsofhistoricalfact,areforward-looking
-10-
statements.Thewords“believe”,“expect”,“anticipate”,“contemplate”,“target”,“plan”,“goal”,“aim”,“intends”,“continue”,“budget”,“estimate”,“may”,“will”,“can”,“could”,“should”,“schedule”andsimilarexpressionsidentifyforward-lookingstatements.Forward-lookingstatementsarenecessarilybaseduponanumberofestimatesandassumptionsrelatedtothefactorssetforthbelowthat,whileconsideredreasonablebyBarrickasatthedateofthisAnnualInformationForminlightofmanagement’sexperienceandperceptionofcurrentconditionsandexpecteddevelopments,areinherentlysubjecttosignificantbusiness,economicandcompetitiveuncertaintiesandcontingencies.Knownandunknownfactorscouldcauseactualresultstodiffermateriallyfromthoseprojectedintheforward-lookingstatementsandunduerelianceshouldnotbeplacedonsuchstatementsandinformation.Suchfactorsinclude,butarenotlimitedto:
• fluctuationsinthespotandforwardpriceofgold,copperorcertainothercommodities(suchassilver,dieselfuel,naturalgasandelectricity);
• changesinnationalandlocalgovernmentlegislation,taxation,controlsorregulationsand/orchangesintheadministrationoflaws,policies,andpractices,expropriationornationalizationofpropertyandpoliticaloreconomicdevelopmentsinCanada,theUnitedStates,DominicanRepublic,Australia,PapuaNewGuinea,Chile,Peru,Argentina,Tanzania,Zambia,SaudiArabia,UnitedKingdomorBarbadosorothercountriesinwhichBarrickdoesormaycarryonbusinessinthefuture;
• failuretocomplywithenvironmentalandhealthandsafetylawsandregulations;
• timingofreceiptof,orfailuretocomplywith,necessarypermitsandapprovals;
• increasedcostsandphysicalrisks,includingextremeweathereventsandresourceshortage,relatedtoclimatechange;
• diminishingquantitiesorgradesofreserves;
• increasedcosts,delays,suspensionsandtechnicalchallengesassociatedwiththeconstructionofcapitalprojects;
• risksassociatedwiththeimplementationofBarrick’sdigitaltransformationinitiative,andtheabilityoftheprojectsunderthisinitiativetomeetBarrick’scapitalallocationobjectives;
• risksassociatedwiththefactthatcertainBest-in-Classinitiativesarestillintheearlystagesofevaluation,andadditionalengineeringandotheranalysisisrequiredtofullyassesstheirimpact;
• theultimateresolutionofadisputerelatingto(i)theimpositionbytheTanzaniangovernmentofabanonmineralconcentrateexportscurrentlyimpacting
theoperationsofAcaciaMiningplc(“Acacia”),(ii)allegationsbytheGovernmentofTanzaniathatAcaciaunder-declaredthemetalcontentofconcentrateexportsfromTanzania,and(iii)certaintaxre-assessmentsofAcaciabytheTanzaniangovernment;
• thebenefitsexpectedfromrecenttransactionsbeingrealized;
• uncertaintywhethersomeoralloftheBest-in-ClassinitiativesandtargetedinvestmentswillmeettheCompany’scapitalallocationobjectives;
• lackofcertaintywithrespecttoforeignlegalsystems,corruptionandotherfactorsthatareinconsistentwiththeruleoflaw;
• theimpactofgloballiquidityandcreditavailabilityonthetimingofcashflowsandthevaluesofassetsandliabilitiesbasedonprojectedfuturecashflows;
• adversechangesintheCompany’screditratings;
• theimpactofinflation;
• risksassociatedwithworkingwithpartnersinjointlycontrolledassets;
-11-
• operatingortechnicaldifficultiesinconnectionwithminingordevelopmentactivities,includinggeotechnicalchallenges,anddisruptionsinthemaintenanceorprovisionofrequiredinfrastructureandinformationtechnologysystems;
• damagetoBarrick’sreputationduetotheactualorperceivedoccurrenceofanynumberofevents,includingnegativepublicitywithrespecttoBarrick’shandlingofenvironmentalmattersordealingswithcommunitygroups,whethertrueornot;
• thespeculativenatureofmineralexplorationanddevelopment;
• changesinmineralproductionperformance,exploitationandexplorationsuccesses;
• riskoflossduetoactsofwar,terrorism,sabotageandcivildisturbances;
• fluctuationsinthecurrencymarkets(suchasCanadianandAustraliandollars,Chilean,ArgentineanandDominicanpesos,Britishpound,Peruviansol,Zambiankwacha,SouthAfricanrand,TanzanianshillingandPapuaNewGuineankinaversustheU.S.dollar);
• changesinU.S.dollarinterestratesthatcouldimpactthemark-to-marketvalueofoutstandingderivativeinstrumentsandongoingpayments/receiptsunderinterestrateswapsandvariableratedebtobligations;
• risksarisingfromholdingderivativeinstruments(suchascreditrisk,marketliquidityriskandmark-to-marketrisk);
• litigationandlegalandadministrativeproceedings;
• contestsovertitletoproperties,particularlytitletoundevelopedproperties,oroveraccesstowater,powerandotherrequiredinfrastructure;
• businessopportunitiesthatmaybepresentedto,orpursuedby,theCompany;
• theCompany’sabilitytosuccessfullyintegrateacquisitionsorcompletedivestitures;
• employeerelations,includinglossofkeyemployees;
• availabilityandincreasedcostsassociatedwithmininginputsandlabor;and
• theorganizationofBarrick’spreviouslyheldAfricangoldoperationsandpropertiesunderaseparatelistedcompany.
Inaddition,therearerisksandhazardsassociatedwiththebusinessofmineralexploration,developmentandmining,includingenvironmentalhazards,industrialaccidents,unusualorunexpectedformations,pressures,cave-ins,floodingandgoldbullion,coppercathodeorgoldorcopperconcentratelosses(andtheriskofinadequateinsurance,orinabilitytoobtaininsurance,tocovertheserisks).ManyoftheseuncertaintiesandcontingenciescanaffecttheCompany’sactualresultsandcouldcauseactualresultstodiffermateriallyfromthoseexpressedorimpliedinanyforward-lookingstatementsmadeby,oronbehalfof,theCompany.Readersarecautionedthatforward-lookingstatementsarenotguaranteesoffutureperformance.Alloftheforward-lookingstatementsmadeinthisAnnualInformationFormarequalifiedbythesecautionarystatements.Specificreferenceismadeto“NarrativeDescriptionoftheBusiness–MineralReservesandMineralResources”and“RiskFactors”andtotheMD&A(whichisavailableonSEDARatwww.sedar.comandonEDGARatwww.sec.govasanexhibittoBarrick’sForm40-F)foradiscussionofsomeofthefactorsunderlyingforward-lookingstatementsandtherisksthatmayaffectBarrick’sabilitytoachievetheexpectationssetforthintheforward-lookingstatementscontainedinthisAnnualInformationForm.
TheCompanymay,fromtimetotime,makeoralforward-lookingstatements.TheCompanyadvisesthattheaboveparagraphandtheriskfactorsdescribedinthisAnnualInformationFormandintheCompany’sotherdocumentsfiledwiththeCanadiansecuritiesregulatoryauthoritiesandtheSECshouldbereadforadescriptionofcertainfactorsthatcouldcausetheactualresultsoftheCompanytomateriallydifferfromthoseintheoralforward-lookingstatements.TheCompanydisclaimsanyintentionor
-12-
obligationtoupdateorreviseanyoralorwrittenforward-lookingstatementswhetherasaresultofnewinformation,futureeventsorotherwise,exceptasrequiredbyapplicablelaw.
SCIENTIFICANDTECHNICALINFORMATION
Unlessotherwiseindicated,scientificortechnicalinformationinthisAnnualInformationFormrelatingtomineralreservesormineralresourcesisbasedoninformationpreparedbyemployeesofBarrick,itsjointventurepartnersoritsjointventureoperatingcompanies,asapplicable,ineachcaseunderthesupervisionof,orfollowingreviewby,RickSims,VicePresident,ReservesandResources,StevenHaggarty,SeniorDirector,MetallurgyorPatrickGarretson,SeniorDirector,LifeofMinePlanning.
ScientificortechnicalinformationinthisAnnualInformationFormrelatingtothegeologyofparticularpropertiesandexplorationprogramsisbasedoninformationpreparedbyemployeesofBarrick,itsjointventurepartnersoritsjointventureoperatingcompanies,asapplicable,ineachcaseunderthesupervisionofRobertKrcmarov,ExecutiveVicePresident,ExplorationandGrowth.
EachofMessrs.Sims,Haggarty,GarretsonandKrcmarovisa“QualifiedPerson”asdefinedinNationalInstrument43-101.A“QualifiedPerson”meansanindividualwhoisanengineerorgeoscientistwithatleastfiveyearsofexperienceinmineralexploration,minedevelopmentoroperationormineralprojectassessment,oranycombinationofthese,hasexperiencerelevanttothesubjectmatterofthemineralproject,andisamemberingoodstandingofaprofessionalassociation.
EachofMessrs.Sims,Haggarty,GarretsonandKrcmarovisanofficeroremployeeofBarrickand/oranofficer,directororemployeeofoneormoreofitsassociatesoraffiliates.NosuchpersonreceivedorwillreceiveadirectorindirectinterestinanypropertyofBarrickoranyofitsassociatesoraffiliates.Asofthedatehereof,eachsuchpersonownsbeneficially,directlyorindirectly,lessthan1%ofanyoutstandingclassofsecuritiesofBarrickandlessthan1%ofanyoutstandingclassofsecuritiesofBarrick’sassociatesoraffiliates.
GENERALINFORMATION
OrganizationalStructure
BarrickisacorporationgovernedbytheBusinessCorporationsAct(Ontario)resultingfromtheamalgamation,effectiveJuly14,1984,ofCamfloMinesLimited,Bob-ClareInvestmentsLimitedandtheformerBarrickResourcesCorporation.ByarticlesofamendmenteffectiveDecember9,1985,theCompanychangeditsnametoAmericanBarrickResourcesCorporation.EffectiveJanuary1,1995,asaresultofanamalgamationwithawholly-ownedsubsidiary,theCompanychangeditsnamefromAmericanBarrickResourcesCorporationtoBarrickGoldCorporation.OnDecember7,2001,inconnectionwithitsacquisitionofHomestakeMiningCompany(“Homestake”),theCompanyamendeditsarticlestocreateaspecialvotingshare,whichhasspecialvotingrightsdesignedtopermitholdersofBarrickGoldInc.(formerlyHomestakeCanadaInc.)(“BGI”)exchangeablesharestovoteasasingleclasswiththeholdersofBarrickcommonshares.InMarch2009,inconnectionwithBarrick’sredemptionofalloftheoutstandingBGIexchangeableshares,thesingleoutstandingspecialvotingsharewasredeemedandcancelled.InconnectionwithitsacquisitionofPlacerDomeInc.(“PlacerDome”),BarrickamalgamatedwithPlacerDomepursuanttoarticlesofamalgamationdatedMay9,2006.InconnectionwiththeacquisitionofArizonaStarResourceCorp.(“ArizonaStar”),BarrickamalgamatedwithArizonaStarpursuanttoarticlesofamalgamationdatedJanuary1,2009.Barrick’sheadandregisteredofficeislocatedatBrookfieldPlace,TDCanadaTrustTower,161BayStreet,Suite3700,Toronto,Ontario,M5J2S1.
-13-

Barrick’sbusinessisorganizedintooperatingsegmentsforfinancialreportingpurposes,comprisingelevenindividualminesites,BarrickNevada(composedoftheCortezandGoldstrikepropertiesasdescribedinfurtherdetailbelow),onepubliclytradedcompany(Acacia)andoneproject(Pascua-Lama).Barrick’sreportableoperatingsegmentsareBarrickNevada,PuebloViejo,LagunasNorte,Veladero,TurquoiseRidge,AcaciaandPascua-Lama.Inthefirstquarterof2017,BarrickunifiedthemanagementandoperationofitsCortezandGoldstrikeproperties,nowreferredtoasBarrickNevada.Forfinancialreportingpurposes,theCompany’sremainingoperatingsegmentsthatarenotreportableoperatingsegmentsaregroupedintoan“other”categoryandarenotreportedonindividually.ThematerialpropertiespresentedinthisAnnualInformationFormare:Cortez,Goldstrike,PuebloViejo,LagunasNorte,VeladeroandTurquoiseRidge.See“NarrativeDescriptionoftheBusiness–ReportableOperatingSegments”.
Subsidiaries
AsignificantportionofBarrick’sbusinessiscarriedonthroughitssubsidiaries.AchartshowingBarrick’smines,projects,relatedoperatingsubsidiaries,othersignificantsubsidiariesandcertainassociatedsubsidiariesasatMarch19,2018andtheirrespectivelocationsorjurisdictionsofincorporation,asapplicable,issetoutbelow.Allsubsidiaries,minesandprojectsreferredtointhechartare100%owned,unlessotherwisenoted.
-14-

-15-

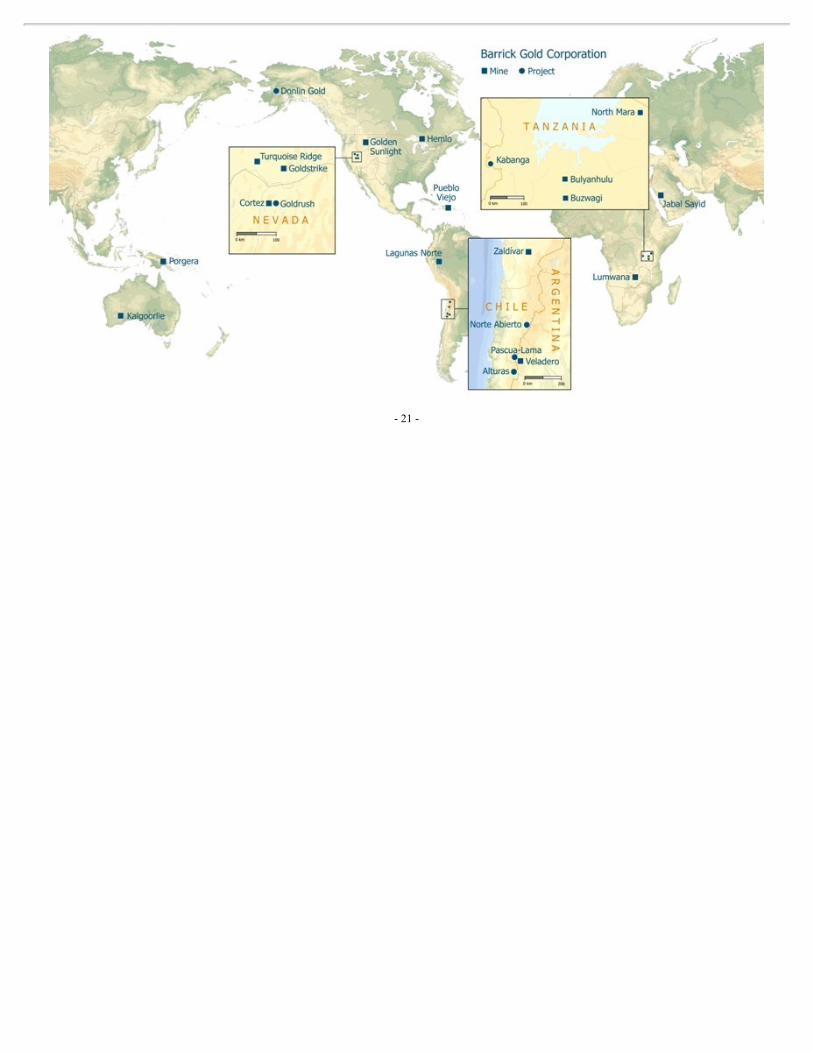
AreasofInterest
AmapshowingBarrick’sminingoperationsandprojectsasatMarch19,2018,includingthoseminesheldthroughBarrick’sequityinterestinAcacia,issetoutattheendofthis“GeneralInformation”section.
GeneralDevelopmentoftheBusiness
History
Barrickenteredthegoldminingbusinessin1983andisaleadinginternationalgoldcompany.TheCompanyhasinterestsinoperatingminesorprojectsinCanada,theUnitedStates,theDominicanRepublic,Peru,Chile,Argentina,Tanzania,Zambia,Australia,PapuaNewGuineaandSaudiArabia.TheCompany’sprincipalproductsandsourcesofearningsaregoldandcopper.
Duringitsfirsttenyears,BarrickfocusedonacquiringanddevelopingpropertiesinNorthAmerica,notablytheCompany’sGoldstrikepropertyontheCarlinTrendinNevada.Since1994,BarrickhasstrategicallyexpandedbeyonditsNorthAmericanbaseandnowoperatesonfivecontinents.
Strategy
Barrick’sstrategyisfocusedongrowingfreecashflowpershareoverthelongterm.TheCompanyaimstoachievethisby:(i)maintainingindustryleadingmargins,drivenbyoperationalexcellence,technologicalinnovationandsuperiorexecution;(ii)maintainingasuperiorportfolioofassetsandallocatingcapitalwithdisciplineandrigor;(iii)maintainingarobustbalancesheetthatcanwithstandgoldpricevolatilityandsupportinvestmentthroughmetalpricecycles;and(iv)leveragingtheCompany’stalentanddistinctivepartnershipcultureascompetitiveadvantages.
BarrickisfocusedoncontinuouslyimprovingtheproductivityandefficiencyoftheCompany’sexistingoperations,whilepursuingstepchangesinperformanceoverthelong-termthroughinvestmentsindigitalsystemsandinnovation.Startinginlate2016andthroughout2017,BarricklaidthefoundationforitsdigitaltransformationthroughaseriesofpilotprojectsprimarilyfocusedattheCortezpropertyinNevada.ThisallowedBarricktoevaluatedigitalsolutionsandtheirpotentialeconomicreturnsinacontrolledenvironmentwithrigorousoversight.In2018,Barrick’sdigitalstrategywillfocusoncompletingthefirstiterationofanenterprise-grade,dataanalyticsplatform,referredtoasthe“BarrickDataFabric”.Barrickwillalsoacceleratetheimplementationofdigitalprojectsacrossitsotheroperations,withaninitialfocusinNevada.
TheCompanyisalsoadvancingfourfeasibility-levelprojectsthathavethepotentialtocontributemorethanonemillionouncesofannualproductiontoBarrick,withinitialcontributionsbeginningin2021.ProjectsinNevadaatCortezDeepSouth,Goldrush,andTurquoiseRidgehavebeenapprovedandareinexecution(finalBoardapprovalforthestartofmajorconstructionatGoldrushremainspending).OptimizationworkonasequencedprojecttopotentiallyextendthelifeoftheLagunasNortemineinPeruremainsunderway.Barrick’sportfolioalsocontainsanumberofundevelopedgreenfieldgolddeposits,providingfurtheroptionalityandleveragetogoldprices.TheseincludeAlturas,DonlinGold,NorteAbiertoandPascua-Lama.Foradditionalinformation,see“MaterialProperties–CortezProperty”,“MaterialProperties–LagunasNorteMine”,“MaterialProperties–TurquoiseRidgeMine”,and“ExplorationandEvaluations”.
AllprojectsundergorigorousscrutinybytheCompany’sInvestmentCommitteeateverystageofevaluationanddevelopment,prioritizingfreecashflowgeneration,risk-adjustedreturns,andcapital
-16-
efficiency.Eachprojectisbenchmarkedagainsta15%hurdlerateusingalong-termgoldpriceassumptionof$1,200perounceandrankedaccordingly.
Barrick’sexplorationprogramsstrikeabalancebetweenhigh-qualitybrownfieldprojects,greenfieldexploration,andemergingdiscoveriesthathavethepotentialtobecomeprofitablemines.InlinewithBarrick’sfocusongrowingitsexplorationportfolio,theCompanyhasalsocultivatedactivepartnershipswithanumberofjuniorexplorationanddevelopmentcompaniesastheCompanyseekstoidentifypotentialnewcoremineraldistrictsfortheCompany.ThesepartnershipsincludeATACattheOrionprojectintheYukon,OsiskoattheKanpropertyinnorthernQuébec,andPremierGoldatCoveMcCoyinNevada.
ForadditionalinformationregardingBarrick’sexplorationprogramsandnewdiscoveries,see“ExplorationandEvaluations”.
Insupportofmaintainingarobustbalancesheet,BarrickistargetingareductionoftheCompany’stotaldebtfrom$6.4billionasofyear-end2017toaround$5billionbytheendof2018.TheCompanyexpectstoachievethisprimarilybyusingcashflowfromoperationsandcashonhand,andpotentiallythroughfurtherportfoliooptimization.Barrickintendstocontinuetopursuedebtreductionwithdiscipline,takingonlythoseactionsthataresensiblefortheCompany,ontermsfavourabletoshareholders.
DrivinganownershipcultureacrosstheCompanyisanotherkeyelementofBarrick’sstrategy.In2016,theCompanycreatedtheGlobalEmployeeSharePlan,whichawardsBarrickcommonsharestoemployeesbasedonoverallCompanyperformance.ThesesharesarepurchasedbyBarrickontheopenmarketandmustbeheldforaslongasanemployeeremainswiththeCompany.AsofMarch19,2018,Barrickemployeesnowownmorethan1.5millionsharesoftheCompanyasaresultoftheGlobalEmployeeSharePlan,fosteringacultureofownershipacrosstheorganization.
Barrickalsocarriedoutthefollowinginitiativesin2015,2016,and2017tooptimizeitsportfolioandstrengthenitsbalancesheet:
• In2015,Barrickreduceditstotaldebtby$3.1billion,exceedinganoriginaldebtreductiontargetof$3billionfortheyear,throughacombinationofnormalcourserepaymentsandearlydebtretirements.Barrickcompletedthefollowingtransactionsin2015aspartofthisdebtreductionstrategy.OnJuly23,2015,BarrickcompletedthesaleoftheCowalmineinAustraliaforcashconsiderationof$550million.OnAugust31,2015,Barrickcompletedthesaleof50%ofitsinterestinthePorgeramineinPapuaNewGuineatoZijinMiningGroupCompanyforcashconsiderationof$298million.OnSeptember29,2015,BarrickclosedagoldandsilverstreamingtransactionwithRoyalGold,Inc.(“RoyalGold”)forproductionlinkedtoBarrick’s60%interestinthePuebloViejomineintheDominicanRepublic.RoyalGoldmadeanupfrontcashpaymentof$610millionandwillcontinuetomakecashpaymentsforgoldandsilverdeliveredundertheagreement(formoreinformationaboutthePuebloViejostreamingtransaction,see“MaterialProperties–PuebloViejoMine”).OnDecember1,2015,Barrickcompletedthesaleof50%ofitsZaldívarcoppermineinChiletoAntofagastaplc.InAugust2016,Barrickfinalizedtheworkingcapitaladjustmentsresultinginfinalconsiderationof$950million.OnDecember17,2015,BarrickcompletedthesaleoftheRubyHillmineandBarrick’s70%interestintheSpringValleyproject,bothinNevada,toWatertonPreciousMetalsFundIICayman,LPforcashconsiderationof$110million.
• In2016,Barrickreduceditstotaldebtby$2.04billion,or20%,from$9.97billionto$7.93billion,exceedingitsoriginaltargetof$2billion,throughacombinationofnormalcourserepaymentsandearlydebtretirements,includingcompletionoftwocashtenderoffers.On
-17-
January11,2016,BarrickcompletedthesaleoftheBaldMountainmineandits50%interestintheRoundMountainmine,bothinNevada,toKinrossGoldCorporation(“Kinross”)forcashconsiderationof$610million,subjecttocertainclosingadjustments.
• OnJune9,2017,BarrickcompletedatransactionwithGoldcorpInc.(“Goldcorp”)toformanewjointventureattheCerroCasaleprojectinChile.Pursuanttothetransaction,Goldcorpacquireda25%interestinCerroCasalefromBarrick.Thetransaction,coupledwiththeconcurrentpurchasebyGoldcorpofKinross’s25%interestinCerroCasale,resultedinBarrickandGoldcorpeachholdinga50%interestinthejointoperations.GoldcorpenteredintoaseparateagreementfortheacquisitionofExeterResourceCorporation,whosesoleassetwastheCaspicheproject,locatedapproximately10kilometersnorthofCerroCasale.TheCaspicheprojectwascontributedtothejointventurebyGoldcorp.ThejointventureisnowreferredtoasNorteAbiertoandincludestheCerroCasale,CaspicheandLucianodeposits.
• OnJune30,2017,Barrickcompletedthesaleof50%ofitsinterestintheVeladeromineinArgentinatoShandongGoldMiningCo.,Ltd.(“Shandong”)forcashconsiderationof$960million,pluspost-closingworkingcapitaladjustmentsofapproximately$30millionreceivedinthefourthquarterof2017(fortotalproceedsofapproximately$990million).ThetwocompaniesalsoformedaworkinggrouptoexplorethejointdevelopmentofthePascua-Lamadeposit,andwillevaluateadditionalinvestmentopportunitiesonthehighlyprospectiveElIndiogoldbeltontheborderofArgentinaandChile.
• In2017,theCompanyreduceditstotaldebtby$1.51billion,or19%,exceedingtheoriginal2017debtreductiontargetof$1.45billion.
Results of Operations in 2017
Totalrevenuesin2017were$8.4billion,adecreaseof$0.2billion,or2%,comparedto2016,primarilyduetolowergoldsalesvolume,partiallyoffsetbyhigherrealizedgoldandcopperprices.In2017,goldandcopperrevenuestotaled$7.6billionand$0.6billion,respectively,withgolddown4%,comparedtotheprioryearduetoadecreaseingoldsalesvolume,partiallyoffsetbyhigherrealizedprices,andcopperup30%comparedtotheprioryearduetohigherrealizedprices.Realizedgoldpricesof$1,258perouncein2017wereup1%comparedtotheprioryear,principallyduetohighermarketprices.Realizedcopperpricesfor2017were$2.95perpound,up29%comparedtotheprioryearduetohighermarketprices.Foranexplanationofrealizedprice,see“Non-GAAPFinancialMeasures–RealizedPrices”.In2017,Barrickreportednetearningsof$1.438billion,includingafter-taxnet$1.425billioninimpairmentreversalsandgainsonsalein2017relatedtoitssuccessfulformationofnewjointoperationsattheVeladeromineandCerroCasaleproject.Thiswaspartiallyoffsetbynetimpairmentchargesof$511millionnetoftaxandnon-controllinginterestmainlyrelatingtoimpairmentchargesatAcacia’sBulyanhulumineandthePascua-Lamaproject,coupledwithanimpairmentreversalatLumwana,comparedtonetearningsof$655millionin2016.Adjustednetearningswere$876million,comparedtoadjustednetearningsof$818millionin2016(foranexplanationofadjustednetearnings,see“Non-GAAPFinancialMeasures–AdjustedNetEarningsandAdjustedNetEarningsperShare”).Thesignificantadjustingitems(pre-taxandnon-controllinginteresteffects)in2017include:$718milliongainrelatingtothesaleofa50%interestintheVeladeromine;$193milliongainrelatedtothesaleofa25%interestintheCerroCasaleproject;$212millionnetimpairmentcharges,primarilyonAcacia’sBulyanhulumineof$740millionandonthePascua-Lamaprojectof$407million,partiallyoffsetbyimpairmentreversalsasaresultoftheindicativefairvalueoftheCerroCasaleprojectrelatedtoBarrick’sdivestmentof25%of$1.12billionandonLumwanaof$259million;partiallyoffsetby$244millionsignificanttaxadjustmentsprimarilyrelatingtodividendwithholdingtaxexpenseandataxprovisionrelatingtotheimpactoftheproposedframeworkforAcaciaoperationsinTanzania,partiallyoffsetbytheanticipatedimpactoftheU.Staxreform;$178millionotherexpenseadjustments,mainlyrelatingtolossesondebtextinguishmentandreducedoperationsprogramcostsatAcacia’sBulyanhulu
-18-
mine;and$72millionforeigncurrencytranslationlosses,primarilyrelatedtothedevaluationoftheArgentineanpesoonVATreceivables.
In2017,Barrick’sgoldproductionwas5.3millionounces,4%lowerthan2016goldproduction,withcostsofsalesapplicabletogoldof$794perounce,all-insustainingcostsof$750perounceandcashcostsof$526perounce.Barrick’scopperproductionin2017was413millionpoundsofcopper,inlinewith2016copperproduction,withcostofsalesapplicabletocopperof$1.77perpound,all-insustainingcostsof$2.34perpoundandC1cashcostsof$1.66perpound.In2016,Barrickproduced5.52millionouncesofgold,withcostsofsalesapplicabletogoldof$798perounce,all-insustainingcostsof$730perounceandcashcostsof$546perounce,and415millionpoundsofcopper,withcostofsalesapplicabletocopperof$1.41perpound,all-insustainingcostsof$2.05perpoundandC1cashcostsof$1.49perpound.“All-insustainingcosts”and“Cashcosts”perounceand“All-insustainingcosts”and“C1cashcosts”perpoundarenon-GAAPfinancialperformancemeasures.Foranexplanationofall-insustainingcostsperounce,cashcostsperounce,all-insustainingcostsperpoundandC1cashcostsperpound,referto“Non-GAAPFinancialMeasures–All-insustainingcostsperounce,All-incostsperounce,Cashcostsperounce,All-insustainingcostsperpoundandC1cashcostsperpound”atpages150to164ofthisAnnualInformationForm.
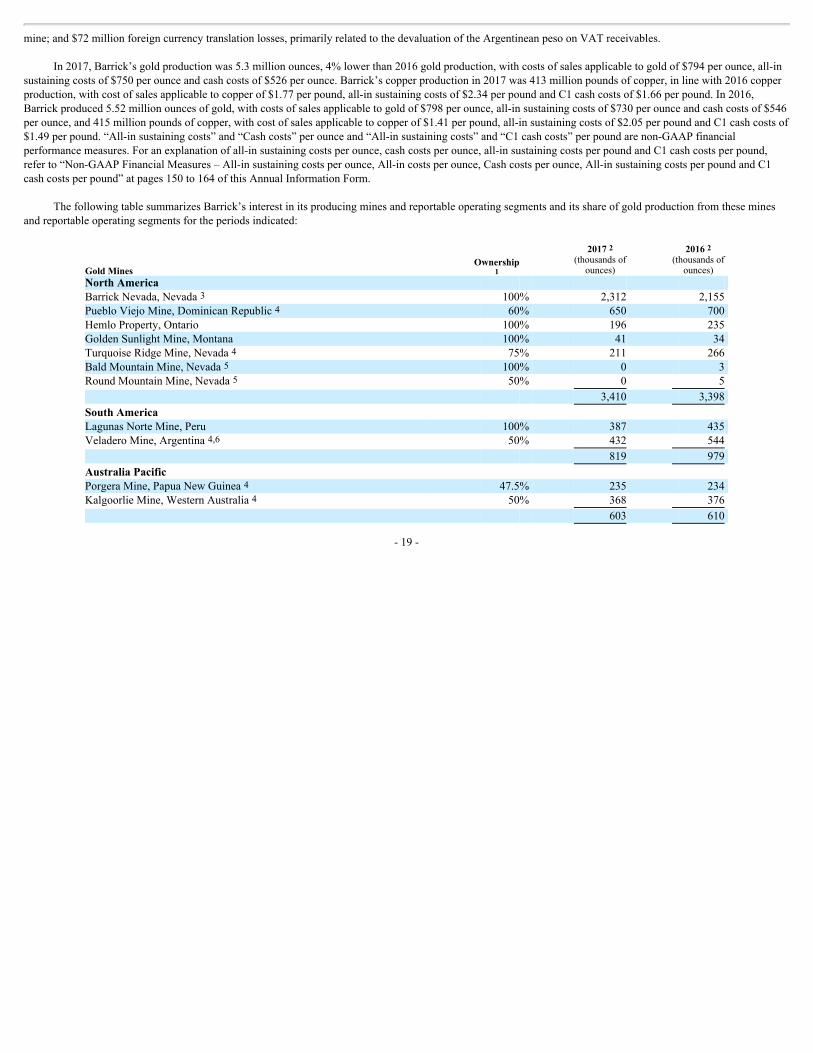
ThefollowingtablesummarizesBarrick’sinterestinitsproducingminesandreportableoperatingsegmentsanditsshareofgoldproductionfromtheseminesandreportableoperatingsegmentsfortheperiodsindicated:
GoldMines Ownership
1
20172(thousandsof
ounces)
20162(thousandsof
ounces) NorthAmerica BarrickNevada,Nevada3 100% 2,312 2,155PuebloViejoMine,DominicanRepublic4 60% 650 700HemloProperty,Ontario 100% 196 235GoldenSunlightMine,Montana 100% 41 34TurquoiseRidgeMine,Nevada4 75% 211 266BaldMountainMine,Nevada5 100% 0 3RoundMountainMine,Nevada5 50% 0 5
3,410 3,398
SouthAmerica LagunasNorteMine,Peru 100% 387 435VeladeroMine,Argentina4,6 50% 432 544
819 979
AustraliaPacific PorgeraMine,PapuaNewGuinea4 47.5% 235 234KalgoorlieMine,WesternAustralia4 50% 368 376
603 610
-19-
GoldMines Ownership
1
20172(thousandsof
ounces)
20162(thousandsof
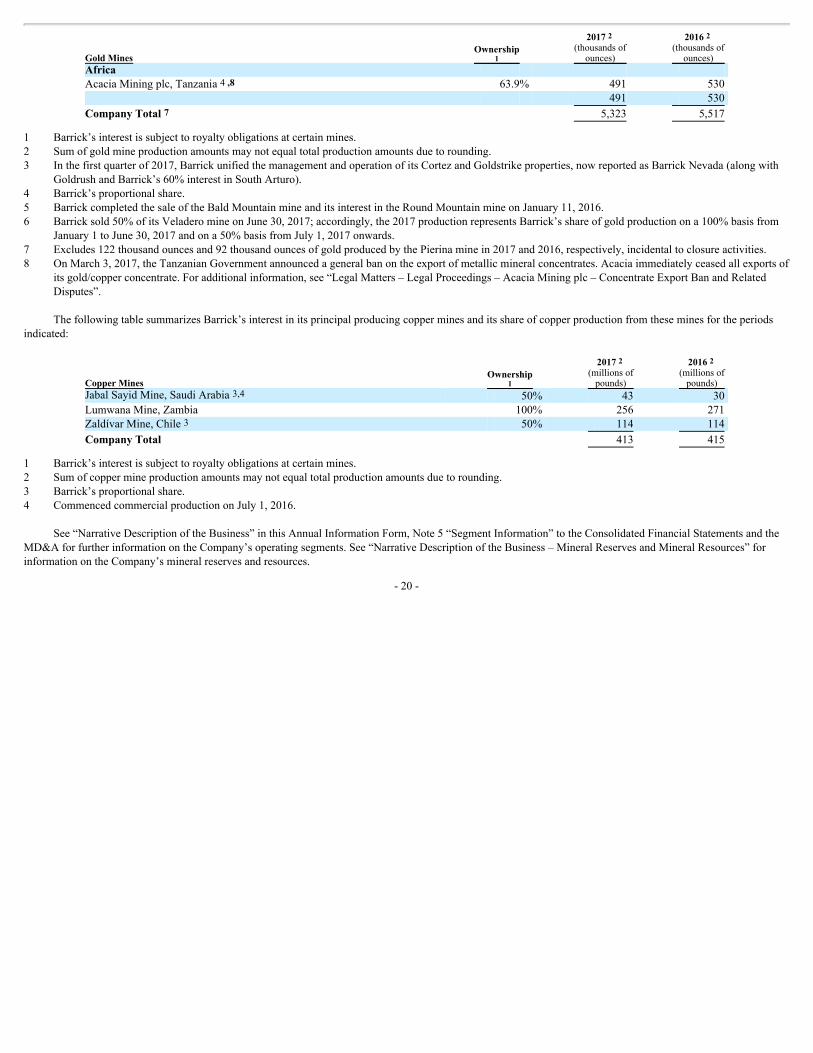
ounces) Africa AcaciaMiningplc,Tanzania4,8 63.9% 491 530
491 530
CompanyTotal7 5,323 5,517
1 Barrick’sinterestissubjecttoroyaltyobligationsatcertainmines.2 Sumofgoldmineproductionamountsmaynotequaltotalproductionamountsduetorounding.3 Inthefirstquarterof2017,BarrickunifiedthemanagementandoperationofitsCortezandGoldstrikeproperties,nowreportedasBarrickNevada(alongwith
GoldrushandBarrick’s60%interestinSouthArturo).4 Barrick’sproportionalshare.5 BarrickcompletedthesaleoftheBaldMountainmineanditsinterestintheRoundMountainmineonJanuary11,2016.6 Barricksold50%ofitsVeladeromineonJune30,2017;accordingly,the2017productionrepresentsBarrick’sshareofgoldproductionona100%basisfrom
January1toJune30,2017andona50%basisfromJuly1,2017onwards.7 Excludes122thousandouncesand92thousandouncesofgoldproducedbythePierinaminein2017and2016,respectively,incidentaltoclosureactivities.8 OnMarch3,2017,theTanzanianGovernmentannouncedageneralbanontheexportofmetallicmineralconcentrates.Acaciaimmediatelyceasedallexportsof
itsgold/copperconcentrate.Foradditionalinformation,see“LegalMatters–LegalProceedings–AcaciaMiningplc–ConcentrateExportBanandRelatedDisputes”.
ThefollowingtablesummarizesBarrick’sinterestinitsprincipalproducingcopperminesanditsshareofcopperproductionfromtheseminesfortheperiodsindicated:
CopperMines Ownership
1
20172(millionsofpounds)
20162(millionsofpounds)
JabalSayidMine,SaudiArabia3,4 50% 43 30LumwanaMine,Zambia 100% 256 271ZaldívarMine,Chile3 50% 114 114
CompanyTotal 413 415
1 Barrick’sinterestissubjecttoroyaltyobligationsatcertainmines.2 Sumofcoppermineproductionamountsmaynotequaltotalproductionamountsduetorounding.3 Barrick’sproportionalshare.4 CommencedcommercialproductiononJuly1,2016.
See“NarrativeDescriptionoftheBusiness”inthisAnnualInformationForm,Note5“SegmentInformation”totheConsolidatedFinancialStatementsandtheMD&AforfurtherinformationontheCompany’soperatingsegments.See“NarrativeDescriptionoftheBusiness–MineralReservesandMineralResources”forinformationontheCompany’smineralreservesandresources.
-20-
-21-
NARRATIVEDESCRIPTIONOFTHEBUSINESS
Barrickisengagedintheproductionandsaleofgold,aswellasrelatedactivitiessuchasexplorationandminedevelopment.Barrickalsoproducessignificantamountsofcopper,principallyfromitsZaldívarjointventure,JabalSayidjointventureanditsLumwanamineandholdsotherinterests.Unlessotherwisespecified,thedescriptionofBarrick’sbusiness,includingproducts,principalmarkets,distributionmethods,employeesandlaborrelationscontainedinthisAnnualInformationForm,appliestoeachofitsoperatingsegmentsandBarrickasawhole.
Production
FortheyearendedDecember31,2017,Barrickproduced5.3millionouncesofgoldatcostofsalesapplicabletogoldof$794perounce,all-insustainingcostsof$750perounceandcashcostsof$526perounce.Barrick’s2018goldproductionistargetedat4.5to5.0millionounces.Barrickexpectsaveragecostofsalesapplicabletogoldof$810to$850perouncein2018,all-insustainingcostsof$765to$815perounceandcashcostsof$540to$575perounce,assumingamarketgoldpriceof$1,200perounce,amarketoilpriceof$55perbarrelandanAustraliandollarexchangerateof$1:A$0.75.See“Forward-LookingInformation”.TheCompany’s2018goldproductionisexpectedtobelowerthan2017asaresultofproductiondecreasesatBarrickNevada,PuebloViejoandVeladero.“All-insustainingcosts”and“cashcosts”perouncearenon-GAAPfinancialperformancemeasures.Foranexplanationofall-insustainingcostsandcashcostsperounce,referto“Non-GAAPFinancialMeasures–All-insustainingcostsperounce,All-incostsperounce,Cashcostsperounce,All-insustainingcostsperpoundandC1cashcostsperpound”atpages150to164ofthisAnnualInformationForm.
FortheyearendedDecember31,2017,Barrickproduced413millionpoundsofcopperatcostofsalesapplicabletocopperof$1.77perpound,all-insustainingcostsof$2.34perpoundandC1cashcostsof$1.66perpound.Barrick’s2018copperproductionistargetedatapproximately385to450millionpoundsatexpectedcostofsalesapplicabletocopperof$1.80to$2.10perpound,all-insustainingcostsofapproximately$2.30to$2.60perpoundandC1cashcostsofapproximately$1.55to$1.75perpound,assumingamarketoilpriceof$55perbarrelandaChileanpesoexchangerateof650:$1.See“Forward-LookingInformation”.“All-insustainingcosts”and“C1cashcosts”perpoundarenon-GAAPfinancialperformancemeasures.Foranexplanationofall-insustainingcostsandC1cashcostsperpound,referto“Non-GAAPFinancialMeasures–All-insustainingcostsperounce,All-incostsperounce,Cashcostsperounce,All-insustainingcostsperpoundandC1cashcostsperpound”atpages150to164ofthisAnnualInformationForm.
ReportableOperatingSegments
Barrick’sbusinessisorganizedintoelevenindividualminesites,BarrickNevada,onepubliclytradedcompany(Acacia)andoneproject(Pascua-Lama).Barrick’sChiefOperatingDecisionMaker,thePresident,reviewstheoperatingresults,assessesperformanceandmakescapitalallocationdecisionsattheminesite,grouping,Companyand/orprojectlevel,withtheexceptionofBarrick’s63.9%equityinterestinAcacia,whichisreviewedandassessedasaseparatebusiness.Therefore,eachindividualminesite,withtheexceptionofBarrickNevada,AcaciaandthePascua-Lamaproject,isanoperatingsegmentforfinancialreportingpurposes.
BarrickhasbeenpursuingstepchangesinperformanceinNevadabyfullyintegratingtheCortezandGoldstrikeoperations.Overthepastthreeyears,thesemineshavebenefitedfromincreasedcollaborationandadditionalsynergies,includingjointproductionplanningtooptimizeoreprocessing.Byfullyintegratingthemanagementoftheirassets,infrastructure,andexpertise,Barrickexpectstofurtheraccelerateimprovementsinefficiencyandproductivity.Asaresultofthesechanges,inthefirstquarter
-22-
of2017,BarrickunifiedthemanagementandoperationofitsCortezandGoldstrikeproperties,nowreferredtoasBarrickNevada.
SetoutbelowisabriefdescriptionofBarrick’supdatedreportableoperatingsegments,consistingoffourindividualgoldmines,BarrickNevada,Acaciaandoneproject.EachmineandprojectreceivesdirectionfromBarrick’sheadoffice,buthasresponsibilityforcertainaspectsofitsbusiness,suchassustainabilityofminingoperations,includingexploration,productionandclosure.AcaciahasagreateramountofindependenceincomparisontoBarrick’sotheroperatingsegments,asfurtherdescribedbelow.
Fordetailsregarding2017productionforalloperatingsegments,see“GeneralInformation–GeneralDevelopmentoftheBusiness”.Foradditionaldetailsregardingthereservesandresourcesheldineachoperatingsegment,see“–MineralReservesandMineralResources”.SeealsoNote5“SegmentInformation”totheConsolidatedFinancialStatementsandtheMD&AforfurtherfinancialandotherinformationontheCompany’soperatingsegments.Barrick’sabilitytodeliveronitsvision,strategicobjectivesandoperatingguidancedependsontheCompany’sabilitytounderstandandappropriatelyrespondtouncertaintiesandrisks.Foradescriptionofcertainofthosesourcesofuncertainty,relevantriskmodificationactivitiesandoversightbytheCompany’sBoardofDirectorsandexecutiveofficers,seepages35to38oftheMD&A.Foradiscussionofmaterialrisksrelevanttoinvestors,see“RiskFactors”.
Barrick Nevada
Inthefirstquarterof2017,BarrickunifiedthemanagementandtheoperationofitsCortezandGoldstrikeproperties,which,togetherwiththeGoldrushpropertyandtheCompany’s60%interestintheSouthArturoproperty,arenowreferredtoasBarrickNevada.However,eachofCortezandGoldstrikecontinuetobematerialpropertiesforthepurposesofthisAnnualInformationForm.
BarrickNevadaproducedapproximately2.3millionouncesofgoldatcostofsalesattributabletogoldof$792perounce,all-insustainingcostsof$624perounceandcashcostsof$455perouncein2017,comparedtoapproximately2.2millionouncesofgoldatcostofsalesattributabletogoldof$876perounce,all-insustainingcostsof$618perounceandcashcostsof$502perouncein2016.In2017,productionwaspositivelyimpactedbyhighergradesminedandprocessedfromCortezHillsopenpit(“CHOP”),coupledwithhigherthroughputattheoxidemillasaresultofBest-in-Classprocessimprovementsandanincreasedpermitlimit.Theseimprovementsresultedinthehighestannualthroughputleveleverachievedattheoxidemill.ThiswaspartiallyoffsetbylowerGoldstrikeopenpitstockpilegradesavailableforprocessingattheroastercomparedtohigherstockpilegradesintheprioryear,fewerGoldstrikeundergroundouncesprocessedduetoadecreaseinlong-holestopingandavailablestopestomine,andfewerleachtonnesminedandplacedinthecurrentyearatCortez.LowergradesatCortezHillsunderground(“CHUG”)asitadvancesdeeperintotheminewerepartiallyoffsetbyhigherminingratesasaresultofdigitizationinitiativessuchasshortintervalcontrolandautomation.AtBarrickNevada,theCompanyexpects2018goldproductiontobeintherangeof2.0to2.255millionounces.LowerproductionisexpectedatCHOPandCHUG.AtCHOP,miningwilltransitionfrompurelyoxideoretoamixofoxide,refractoryandtransitionalores.GrademinedfromCHUGisexpectedtobelowerasprogressionismadedeeperintothemine.Thisispartiallyoffsetbyincreasedthroughputattheoxidemill,increasedgradesatGoldstrikeopenpitfromprocessingthethirdnorthwestlaybackcomparedtostockpileprocessingintheprioryearandhighergradesatGoldstrikeunderground.Throughputinitiativesattheautoclaveareexpectedtomorethanoffsetlowerautoclaverecoveryasthetransitionprimarilyfromanallacidblendtoanalkaline/acidblendoccurs.In2018,theCompanyexpectscostofsalesattributabletogoldtobeintherangeof$760to$810perounce,whichisconsistentwith2017.All-insustainingcostsareexpectedtobeintherangeof$610to$660perounce,consistentwith2017,aslowerproductionisoffsetbylowersustainingcapitalexpendituresfortailingsexpansions,processimprovementsand
-23-
Goldstrikeundergroundprojectstoenableminingdeeperinthemine.Cashcostsareexpectedtobeintherangeof$470to$530perounce,anincreasefrom2017.“All-insustainingcosts”and“cashcosts”perouncearenon-GAAPfinancialperformancemeasures.Foranexplanationofall-insustainingcostsandcashcostsperounce,referto“Non-GAAPFinancialMeasures–All-insustainingcostsperounce,All-incostsperounce,Cashcostsperounce,All-insustainingcostsperpoundandC1cashcostsperpound”atpages150to164ofthisAnnualInformationForm.
Pueblo Viejo (60% basis)
Barrick’s60%interestinthePuebloViejomine(amaterialpropertyforthepurposesofthisAnnualInformationForm,see“MaterialProperties–PuebloViejoMine”)producedapproximately650thousandouncesofgoldatcostofsalesattributabletogoldof$699perounce,all-insustainingcostsof$525perounceandcashcostsof$405perouncein2017,comparedtoapproximately700thousandouncesofgoldatcostofsalesattributabletogoldof$564perounce,all-insustainingcostsof$490perounceandcashcostsof$395perouncein2016.Barrickistheoperatorofthejointventure.In2017,costofsalesattributabletogoldwasnegativelyimpactedbytheeffectoflowersalesvolumeonunitproductioncosts,combinedwithhigherdepreciationexpenserelatingtoatailingsstoragefacilitydepreciationadjustmentandhigherfuelprices.AtPuebloViejo,theCompanyexpectsitsequityshareof2018goldproductiontobeintherangeof585to615thousandounces,below2017productionlevels,drivenbyreducedgoldheadgrade,partiallyoffsetbyincreasedautoclavethroughputresultingfromimprovedmaintenancestrategiesandsmall-scalepre-oxidationandflotationconcentratepre-processingexpansions.In2018,Barrickexpectscostofsalesattributabletogoldtobeintherangeof$720to$750perounce.All-insustainingcostsareexpectedtobe$590to$620perounceandcashcostsareexpectedtobeintherangeof$425to$450perounce.Costofsalesattributabletogold,all-insustainingcostsandcashcostsareexpectedtobehigherthanin2017primarilyduetoareductionintotalouncesproducedandsold,higherfuelpricesandhighersustainingcapitalexpendituresrelatedmainlytoincreasedcapitalizedwastestripping,tailingsdamconstruction,QuisqueyapowerstationgasconversionandBonaosub-stationconstructioncapitalprojects.Byproductcreditsareexpectedtobehigherthanin2017,reflectingincreasedmetalprices,oregradesandrecoveriesforbothsilverandcopper.“All-insustainingcosts”and“cashcosts”perouncearenon-GAAPfinancialperformancemeasures.Foranexplanationofall-insustainingcostsandcashcostsperounce,referto“Non-GAAPFinancialMeasures–All-insustainingcostsperounce,All-incostsperounce,Cashcostsperounce,All-insustainingcostsperpoundandC1cashcostsperpound”atpages150to164ofthisAnnualInformationForm.
Lagunas Norte
Barrick’sLagunasNortemine(amaterialpropertyforpurposesofthisAnnualInformationForm,see“MaterialProperties–LagunasNorteMine”)producedapproximately387thousandouncesofgoldatcostofsalesattributabletogoldof$617perounce,all-insustainingcostsof$483perounceandcashcostsof$405perouncein2017,comparedtoapproximately435thousandouncesofgoldatcostofsalesattributabletogoldof$651perounce,all-insustainingcostsof$529perounceandcashcostsof$383perouncein2016.Thelowercostofsalesattributabletogoldin2017wasmainlyduetolowerdepreciationexpenseandrealizedcostsavingsfromtheBest-in-Classprogram,suchasinitiativestoimproveefficienciesinthecarbon-in-columncircuit,implementationofshortintervalcontrolandimprovementsinplannedmaintenance.Thesewerepartiallyoffsetbytheimpactoflowersalesvolumeandhigherdirectminingcosts,resultingfromlowercapitalizedwastestrippingandhigherprocessingcostsdrivenbyhighertonnageprocessedandincreasedsuppliesconsumptiongiventhetreatmentofdifferentoretypesinthemineplan.AtLagunasNorte,theCompanyexpects2018productiontobeintherangeof230to270thousandounces,lowerthan2017productionlevels,asaresultoftheprogressivedepletionofoxideores,whicharebeingreplacedwithharderorematerialwithlowerkineticsandrecoveries.In2018,theCompanyexpectscostofsalesattributabletogoldtobeintherangeof$780to
-24-

$910perounce,mainlydrivenbytheimpactoflowergoldsalescombinedwithanincreaseindepreciationexpenseandhighercorporatesocialresponsibilityexpenses.All-insustainingcostsareexpectedtobe$670to$780perounceandcashcostsareexpectedtobeintherangeof$420to$490perounce.Theincreaseinall-insustainingcostsisdrivenmainlybythedecreaseinproductionandincreaseinsustainingcapitalexpendituresin2018.Operationalcostsareexpectedtodecrease,alignedtothereducedmineproductionplan,comparedto2017.Best-in-Classoperationalinitiativesfor2018willbefocusedongettinggoldouncesfrominjectionwellsandslagprocessing.“All-insustainingcosts”and“cashcosts”perouncearenon-GAAPfinancialperformancemeasures.Foranexplanationofall-insustainingcostsandcashcostsperounce,referto“Non-GAAPFinancialMeasures–All-insustainingcostsperounce,All-incostsperounce,Cashcostsperounce,All-insustainingcostsperpoundandC1cashcostsperpound”atpages150to164ofthisAnnualInformationForm.
Veladero
Barrick’s100%interestintheVeladeromine(amaterialpropertyforpurposesofthisAnnualInformationForm,see“MaterialProperties–VeladeroMine”)fromJanuary1toJune30,2017and50%interestintheVeladerominefromJuly1,2017onwards(reflectingBarrick’sdivestmentof50%ofitsinterestintheVeladeromineonJune30,2017)producedapproximately432thousandouncesofgoldatcostofsalesattributabletogoldof$897perounce,all-insustainingcostsof$987perounceandcashcostsof$598perouncein2017,comparedtoapproximately544thousandouncesofgoldatcostofsalesattributabletogoldof$872perounce,all-insustainingcostsof$769perounceandcashcostsof$582perouncein2016whenBarrickhelda100%interestintheminethroughouttheyear.See“GeneralInformation–GeneralDevelopmentoftheBusiness”.Thehighercostofsalesattributabletogoldin2017wasprimarilyduetotheimpactofhigherdirectminingcostscombinedwithhigherdepreciationexpenseasaresultoftheimpactofthefairvalueincrementsrelatingtotherevaluationofBarrick’sremaining50%interestintheVeladeromine,partiallyoffsetbyalackofdepreciationinthesecondquarterof2017asVeladerowasclassifiedasheld-for-salependingthecloseofthesaleonJune30,2017.Theincreaseindirectminingcostsprimarilyrelatedtoconsultingservices,campcosts,miningcostsduetoadditionalfleet,maintenance,laborandcontractorsandduetotheimpactofinflationinArgentina.Theseincreaseswerepartiallyoffsetbyhighercapitalizedwastestrippingcostsinthecurrentyearastherewasnocapitalizedwastestrippinginthethirdquarterof2016asaresultofsevereweatherconditions.
OnSeptember13,2015,avalveonaleachpadpipelineattheVeladerominefailed,resultinginareleaseofcyanide-bearingprocesssolutionintoanearbywaterwaythroughadiversionchannelgatethatwasopenatthetimeoftheincident.InMarch2016,theProvincialminingauthorityimposedanadministrativefineagainstMineraArgentinaGoldSRL(“MAG”),theArgentinesubsidiarythatoperatestheVeladeromine,inconnectionwiththeincident.OnApril14,2016,inaccordancewithlocalrequirements,MAGpaidtheadministrativefineofapproximately$10million.Formoreinformationaboutthismatter,see“MaterialProperties–VeladeroMine”.
OnSeptember8,2016,icerollingdowntheslopeoftheleachpadattheVeladerominedamagedapipecarryingprocesssolution,causingsomematerialtoleavetheleachpad.Thismaterial,primarilycrushedoresaturatedwithprocesssolution,wascontainedontheminesiteandreturnedtotheleachpad.Formoreinformationaboutthismatter,see“MaterialProperties–VeladeroMine”.
OnMarch28,2017,themonitoringsystematVeladerodetectedaruptureofapipecarryinggold-bearingsolutionontheleachpad.Allsolutionwascontainedwithintheoperatingsiteandnosolutionreachedanydiversionchannelsorwatercourses.Asaresultofthisrupture,theGovernmentofSanJuantemporarilyrestrictedtheadditionofcyanidetotheVeladeromine’sheapleachfacilitypendingcompletionofcertainremedialworks.ThesuspensionwasliftedonJune15,2017.
-25-

OnDecember27,2017,theSanJuanminingauthorityassessedacombinedfineforthe2016and2017incidentsatVeladeroofapproximately$5.6million(calculatedattheprevailingexchangerateonDecember31,2017).OnJanuary23,2018,inaccordancewithlocalrequirements,MAGpaidtheadministrativefineandfiledarequestforreconsiderationwiththeSanJuanProvincialminingauthority,whichremainspending.
AtVeladero,theCompanyexpectsattributable2018productiontobeintherangeof275to330thousandounces,lowerthan2017productionlevels.Thedecreaseismainlytheresultofthedivestmentof50%oftheVeladeromineasatJune30,2017,combinedwithslightlyloweroregradetotheleachpadin2018,offsetbyongoingsolubleinventorydrawdownwithimprovedsolutionmanagement(see“MaterialProperties–VeladeroMine”).Barrickexpectscostofsalesattributabletogoldtobeintherangeof$970to$1,110perounce,mainlyduetohigherdepreciationexpensereflectingtheeffectofthefairvalueincrementsappliedtoBarrick’sremaining50%interestintheVeladeromine.All-insustainingcostsareexpectedtobe$960to$1,100perounce,alignedwith2017aslowercashcostsareoffsetbyhighercapitalizedwastestripping.Cashcostsin2018areexpectedtobeintherangeof$560to$620perounce,lowerthan2017levelsmainlyduetolowerdirectoperatingcosts,partlyoffsetbytheimpactofhigherchargesfromtheproductioninventorymovements.OperatingcostsatVeladeroarealsohighlysensitivetolocalinflationandfluctuationsinforeignexchangerates.TheCompanyhasassumedanaverageARSexchangerateofARS18.3:$1andalocalinflationrateof15%forpurposesofpreparingitscashcostandall-insustainingcostguidancefor2018.“All-insustainingcosts”and“cashcosts”perouncearenon-GAAPfinancialperformancemeasures.Foranexplanationofall-insustainingcostsandcashcostsperounce,referto“Non-GAAPFinancialMeasures–All-insustainingcostsperounce,All-incostsperounce,Cashcostsperounce,All-insustainingcostsperpoundandC1cashcostsperpound”atpages150to164ofthisAnnualInformationForm.
Thegovernance,ownershipandjointoperationoftheVeladerojointventureisgovernedbythetermsofashareholders’agreementbetweenBarrickandShandong(the“VeladeroShareholders’Agreement”).Forfurtherdetails,referto“MaterialProperties–VeladeroMine–GeneralInformation–History”.
Turquoise Ridge (75% basis)
TurquoiseRidge(amaterialpropertyforpurposesofthisAnnualInformationForm,see“MaterialProperties–TurquoiseRidgeMine”)isanundergroundminethatusesunderhanddrift-and-fillminingmethods.Barrickistheoperatorofthejointventure.Barrick’s75%interestintheTurquoiseRidgemineproducedapproximately211thousandouncesofgoldatcostofsalesattributabletogoldof$715perounce,all-insustainingcostsof$733perounceandcashcostsof$589perouncein2017,comparedtoapproximately266thousandouncesofgoldatcostofsalesattributabletogoldof$603perounce,all-insustainingcostsof$625perounceandcashcostsof$498perouncein2016.Thehighercostofsalesattributabletogoldin2017mainlyreflectedtheimpactoflowersalesvolumeonunitproductioncostscombinedwithhigherprocessingcostsassociatedwithprocessinglowergradeoreandhigherorganiccarboncontentore.AtTurquoiseRidge,theCompanyexpectsattributable2018productiontobeintherangeof240to270thousandounces,whichishigherthan2017productionlevels.TurquoiseRidgehascompletelytransitionedtostandardizedequipmentallowingforgreaterminingflexibilitywithhigherreliabilityandlessequipment.Capitalandwastedevelopmentrequirementsareinlinewith2017miningrates.Costofsalesattributabletogoldareexpectedtobeintherangeof$670to$720perouncewhichisin-linewith2017.All-insustainingcostsin2018areexpectedtobeintherangeof$650to$730perounce.All-insustainingcostsin2018areexpectedtobelowerthan2017duetoareductioninsustainingcapitalastheconstructionofthethirdshaftisincludedinprojectcapital.Cashcostsin2018areexpectedtobeintherangeof$580to$620perounce,consistentwith2017.“All-insustainingcosts”and“cashcosts”perouncearenon-GAAPfinancialperformancemeasures.Foranexplanationofall-insustainingcostsandcashcostsperounce,referto“Non-GAAPFinancialMeasures–All-insustainingcostsper
-26-
ounce,All-incostsperounce,Cashcostsperounce,All-insustainingcostsperpoundandC1cashcostsperpound”atpages150to164ofthisAnnualInformationForm.
BarrickcontinuestoadvanceaphasedapproachtoexpansionatTurquoiseRidgethatmaximizesfreecashflowfromtheoperation,whileoptimizingthetimingofcapitalspendingforexpansion.
InJanuary2018,BarrickandNewmontMiningCorporation(“Newmont”)reachedanagreementonanew,seven-yeartollmillingagreement(the“TMA”)fortheprocessingofTurquoiseRidgeoreatNewmont’sTwinCreeksfacility.TheTMAsupportsplanstoexpandproductionatTurquoiseRidgebyincreasingcontractualprocessingcapacity.Itprovidesforthroughputof850,000tonsperyearin2018and2019,risingto1.2milliontonsperyearbetween2020and2024.
Acacia Mining plc (63.9% basis)
Acacia’soperationsconsistofitsBulyanhuluundergroundmine,itsNorthMaraopenpitandundergroundmineanditsBuzwagiopenpitmine,alllocatedinTanzania.Barrick’sequityinterestinAcaciais63.9%.Theassets,liabilities,operatingresultsandcashflowsofAcaciaareconsolidatedbyBarrick.Acacia’ssharesarelistedfortradingontheLondonStockExchange(“LSE”).In2017,Barrick’sequityinterestinAcacia’sgoldproductionwasapproximately491thousandouncesofgoldatcostofsalesattributabletogoldof$791perounce,all-insustainingcostsof$875perounceandcashcostsof$587perounce,comparedtoapproximately530thousandouncesofgoldatcostofsalesattributabletogoldof$880perounce,all-insustainingcostsof$958perounceandcashcostsof$640perouncein2016.Thisyear-over-yeardeclineinproductionwasdueinlargeparttotheconcentrateexportbanimplementedbytheTanzaniangovernmentonMarch3,2017,affectingsalesfromBulyanhuluandBuzwagiandleadingtoadecisiontotransitiontoreducedoperationsinthethirdquarterof2017,aswellasduetodroughtsexperiencedintheKahamadistrict,combinedwithlowerproductionfromNorthMaraasaresultoflowergradesattheGokonaundergroundmineandNyabiramapit.ThesewerepartiallyoffsetbyaproductionincreaseatBuzwagiasaresultofhighergradeorefromthemainorezoneatthebottomoftheopenpitandhigheroretonnesmined.TheCompanyexpectsAcacia’s2018goldproductiontobeintherangeof275to305thousandounces(Barrick’sshare),whichislowerthan2017productionlevels.Acacia’sproductionisexpectedtobelowerthan2017mainlyduetoBulyanhulu’stransitiontoreducedoperationsandtheplannedtransitionofBuzwagitoastockpileprocessingoperationin2018.In2018,Barrickexpectscostofsalesattributabletogoldtobeintherangeof$970to$1,020perounce.All-insustainingcostsareexpectedtobeintherangeof$935to$985perounceandcashcostsareexpectedtobeintherangeof$690to$720perounce.Theincreaseinallthreemeasuresfrom2017ismainlyduetothenegativeimpactofapproximately$50perounceduetoincreasedinventorycostsatBuzwagiasAcaciaprocessesorestockpilespreviouslyclassifiedasoreinventory.Formoreinformationaboutthismatter,see“LegalMatters–LegalProceedings–AcaciaMiningplc–ConcentrateExportBanandRelatedDisputes”.“All-insustainingcosts”and“cashcosts”perouncearenon-GAAPfinancialperformancemeasures.Foranexplanationofall-insustainingcostsandcashcostsperounce,referto“Non-GAAPFinancialMeasures–All-insustainingcostsperounce,All-incostsperounce,Cashcostsperounce,All-insustainingcostsperpoundandC1cashcostsperpound”atpages150to164ofthisAnnualInformationForm.
OnMarch3,2017,theTanzanianGovernmentannouncedageneralbanontheexportofmetallicmineralconcentrates(the“Ban”).FollowingitsimpositionoftheBan,Acaciaimmediatelyceasedallexportsofitsgold/copperconcentrate.WhileAcaciahasbeenlookingtoaddressallissuesinrespectoftheBanalongwithotherongoingdisputesthroughdialoguewiththeTanzanianGovernment,ithascommencedinternationalarbitrationinaccordancewithitsMineralDevelopmentAgreementswiththeGovernmentofTanzaniatoresolvethesematters.OnOctober19,2017,BarrickannouncedthatithadagreedwiththeGovernmentofTanzaniaonaproposedframeworkforanewpartnershipbetweenAcacia
-27-
andtheGovernmentofTanzania.SuchtermswouldbesubjecttoreviewandapprovalbyAcacia.Discussionsconcerningtheimplementationoftheproposedframework,resolutionofoutstandingtaxmattersrelatingtoAcacia,andtheliftingoftheBanremainongoing.Barrickistargetingthefirsthalfof2018forthecompletionofadetailedproposalforreviewbyAcacia.Foradditionalinformation,see“LegalMatters–LegalProceedings–AcaciaMiningplc–ConcentrateExportBanandRelatedDisputes”.
BarrickanditsaffiliatesprovidecertainservicestoAcaciaanditssubsidiariesfortheongoingoperationofAcacia’sbusinesspursuanttoaservicesagreemententeredintobytheparties.Inaddition,BarrickandAcaciaarealsopartiestoarelationshipagreementthatregulatesvariousaspectsoftheongoingrelationshipbetweenthetwocompanies.TheprincipalpurposeoftherelationshipagreementistoensurethatAcaciaiscapableofcarryingonitsbusinessindependentlyofBarrickandthatanytransactionsandrelationshipswithBarrickoccuratarm’slengthandundernormalcommercialterms.Underthatagreement,solongasBarrickmaintainsa40%equityinterestinAcacia,Barrickisentitledtoappointthegreaterof(i)threenon-executivedirectorstoAcacia’sboardofdirectors;and(ii)themaximumnumberofnon-executivedirectorsthatmaybeappointedtoAcacia’sboardofdirectors,whileensuringAcaciaiscompliantwiththeUKCombinedCodeofCorporateGovernance.IfBarrick’sshareholdinginAcaciafallsbelow40%,thereisaslidingscaleastothenumberofdirectorsitmayappoint.AsofMarch19,2018,Acaciahadsevendirectors,twoofwhichwereappointedbyBarrick.TherelationshipagreementwillremaininforceaslongasAcacia’ssharesarelistedontheLSEandBarrickmaintainsatleasta15%equityinterest.Therelationshipagreementcontainsanumberofothercommitmentsandrestrictions,includinganon-competitionclausepursuanttowhich(i)BarrickagreesitwillnotpursueanygoldorsilverminingprojectinAfrica,assuchtermsaredefinedintherelationshipagreement,and(ii)AcaciaagreesitwillnotpursueanygoldorsilverminingprojectoutsideofAfrica,assuchtermsaredefinedintherelationshipagreement.Thenon-competitionclauseissubjecttovariousexceptionsandonlyappliesforsolongasBarrickholdsatleasta30%equityinterestinAcacia.IfeitherBarrickorAcaciawantstopursueaprojectwhichissubjecttothenon-competitionrestriction(the“NotifyingParty”),theyarerequiredtonotifytheotherpartyand,iftheotherpartywaivestheopportunityorfailstorespondinatimelyfashion,theNotifyingPartywillbeentitledtopursuetheprojectdescribedinthenotice.
Barrick’sKabanganickelprojectandLumwanacopperminearenotincludedintheassetsheldbyAcacia.Barrickcontinuestodirectlyholdits50%interestintheKabangaproject,whichislocatedinTanzania.Barrickalsodirectlyholdsits100%interestintheLumwanamine,whichislocatedinZambia.
Pascua-Lama Project
ThePascua-Lamaproject,locatedontheborderbetweenChileandArgentina,contains21.3millionouncesofmeasuredandindicatedgoldresources(formoreinformationaboutthePascua-Lamaproject,see“ExplorationandEvaluations–Pascua-Lama”and“LegalMatters–LegalProceedings–Pascua-Lama–ConstitutionalProtectionAction”).
OnJanuary17,2018,Chile’sSuperintendenciadelMedioAmbiente(“SMA”)orderedtheclosureofexistinginfrastructureontheChileansideofthePascua-Lamaproject.Thesanctionispartofare-evaluationprocessorderbythecountry’sEnvironmentalCourtin2014andrelatestohistoricalcompliancematters.Barrickisappealingtheresolutiononanumberofgrounds,includingonthebasisthatthesanctionisdisproportionatetoactualenvironmentalimpacts.See“LegalMatters–LegalProceedings–Pascua-Lama–SMARegulatorySanctions”formoredetailregardingtheSMAregulatorysanctions.
-28-
TheSMAorderdoesnotaffecttheCompany’songoingevaluationofanundergroundmineatPascua-Lama,whichwouldrequireadditionalpermittingandregulatoryapprovalsinbothArgentinaandChile,irrespectiveoftherecentSMAdecision.Inanyundergroundscenario,BarrickwouldalsoclosesitefacilitiesandsurfacedisturbancesinChilenotnecessaryforanundergroundmine.Ashifttoanundergroundoperationwouldaddressanumberofcommunityconcernsbysignificantlyreducingtheoverallenvironmentalimpactsoftheproject,ascomparedtoanopenpitoperation.Inaddition,anundergroundoperationwouldbelesssusceptibletoweather-relatedproductionimpactsduringthewinterseason.
InlightoftheSMAordertoclosesurfacefacilitiesinChile,andcurrentplanstoevaluateanundergroundmine,BarrickreclassifiedPascua-Lama’sprovenandprobablegoldreservesofapproximately14millionouncesasmeasuredandindicatedresourcesasofyear-end2017.
ForadditionalinformationregardingBarrick’sprojects,see“ExplorationandEvaluations”.
MineralReservesandMineralResources
AsatDecember31,2017,Barrick’stotalprovenandprobablegoldreserveswere64.4millionounces,comparedto86.0millionouncesattheendof2016.Approximately9.2millionouncesweredivestedduring2017,approximately14.0millionouncesatPascua-Lamawerereclassifiedasmeasuredandindicatedresourcesand6.2millionouncesweredepletedthroughminingandprocessing.Barrickreplacedapproximately8.0millionoftheouncesdepletedthroughdrillingatitsoperatingmines(aswellastheGoldrushproject).Significantadditionsin2017included2.1millionouncesatTurquoiseRidge,1.4millionouncesatCortez,1.3millionouncesatGoldstrike,397,000ouncesatHemlo,and392,000ouncesatLagunasNorte.Wealsodeclaredaninitialreserveof1.5millionouncesattheGoldrushproject.Inaddition,Barrick’s63.9percentshareofreservesatAcacia’sNorthMaramineincreasedby504,000ounces.TheaveragegradeofBarrick’sreservesalsoincreasedby17percent,from1.33gramspertonne,to1.55gramspertonne.
Barrickestimateditsreservesfor2017usingagoldpriceassumptionof$1,200perounce(see“–NotestotheMineralReservesandResourcesTables”below).Thepriceassumptionsusedtocalculatereservesin2017areconsistentwiththoseusedbyBarrickformineplanning,impairmenttestingandfortheassessmentofprojecteconomics.
AsatDecember31,2017,Barrick’stotalprovenandprobablecopperreservesincreasedto11.2billionpoundscomparedto11.1billionpoundsattheendof2016.Barrickestimateditscopperreservesfor2017usingacopperpriceassumptionof$2.75perpound,consistentwiththelong-termpriceassumptionusedin2016.
Exceptasnotedbelow,2017reserveshavebeenestimatedbasedonanassumedgoldpriceof$1,200perounce,anassumedsilverpriceof$16.50andanassumedcopperpriceof$2.75perpoundandlong-termaverageexchangeratesofC$1.25:$1andA$:$0.75.ReservesatKalgoorliehavebeenestimatedbasedonanassumedgoldpriceofA$1,600andreservesatBulyanhulu,NorthMaraandBuzwagihavebeenestimatedbasedonanassumedgoldpriceof$1,100.Reserveestimatesincorporatecurrentand/orexpectedmineplansandcostlevelsateachproperty.
Inconfirmingitsannualreservesforeachofitsmineralproperties,projects,andoperations,BarrickconductsareservetestonDecember31ofeachyeartoverifythatthefutureundiscountedcashflowfromreservesispositive.Thecashflowexcludesallsunkcostsandonlyconsidersfutureoperatingandclosureexpensesaswellasanyfuturecapitalcosts.
-29-

Unlessotherwisenoted,Barrick’sreservesandresourceshavebeenestimatedasatDecember31,2017,inaccordancewithdefinitionsadoptedbytheCanadianInstituteofMining,MetallurgyandPetroleumandincorporatedintoNationalInstrument43-101(see“GlossaryofTechnicalTerms”).Varyingcut-offgradeshavebeenuseddependingonthemine,methodsofextractionandtypeoforecontainedinthereserves.Mineralresourcemetalgradesandmaterialdensitieshavebeenestimatedusingindustry-standardmethodsappropriateforeachmineralprojectwithsupportofvariouscommerciallyavailableminingsoftwarepackages.Forthecut-offgradesusedintheestimationofreserves,see“–NotestotheMineralReservesandResourcesTables”below.Barrick’snormaldataverificationprocedureshavebeenemployedinconnectionwiththeestimations.Sampling,analyticalandtestdataunderlyingthestatedmineralresourcesandreserveshavebeenverifiedbyemployeesofBarrick,itsjointventurepartnersoritsjointventureoperatingcompanies,asapplicable,underthesupervisionofQualifiedPersons,and/orindependentQualifiedPersons(see“ScientificandTechnicalInformation”).Verificationproceduresincludeindustry-standardqualitycontrolpractices.DrillsamplescollectedforuseingeologicmodelingandmineralresourceestimationareunderthedirectsupervisionofthegeologydepartmentateachoftheCompany’spropertiesandprojects.Alldrillholecollar,surveyandassayinformationusedinmodelingandresourceestimationaremanuallyverifiedandapprovedbythestaffgeologistspriortoentryintothemine-widedatabase.Samplepreparationandanalysesareconductedbyeitherindependentlaboratoriesorthelaboratoryonsite,inwhichcaseindependentlaboratoriesareusedtoverifyresults.Proceduresareemployedtoensuresecurityofsamplesduringtheirdeliveryfromthedrillrigtothelaboratory.Thequalityassuranceprocedures,dataverificationandassayprotocolsusedinconnectionwithdrillingandsamplingateachpropertyandprojectconformtoindustryacceptedqualitycontrolmethods.Regularinternalauditingofthemineralreserveandmineralresourceestimationprocessesandproceduresareconducted.
BarrickreportsitsreservesinaccordancewithNationalInstrument43-101,asrequiredbyCanadiansecuritiesregulatoryauthorities.ForUnitedStatesreportingpurposes,IndustryGuide7(undertheSecuritiesExchangeActof1934),asinterpretedbytheStaffoftheSEC,appliesdifferentstandardsinordertoclassifymineralizationasareserve(seeNote8of“–NotestotheMineralReservesandResourcesTables”below).Inaddition,whiletheterms“measured”,“indicated”and“inferred”mineralresourcesarerequiredpursuanttoNationalInstrument43-101,theSECdoesnotrecognizesuchterms.CanadianstandardsdiffersignificantlyfromtherequirementsoftheSEC,andmineralresourceinformationcontainedhereinisnotcomparabletosimilarinformationregardingmineralreservesdisclosedinaccordancewiththerequirementsoftheSEC.Readersarecautionedthat“inferred”mineralresourceshaveagreatamountofuncertaintyastotheirexistenceandastotheireconomicandlegalfeasibility.Inaddition,readersarecautionednottoassumethatalloranypartofBarrick’smineralresourcesconstituteorwillbeconvertedintoreserves.Mineralresourcesthatarenotmineralreservesdonothavedemonstratedeconomicviability.
AlthoughtheCompanyhascarefullypreparedandverifiedthemineralreservefigurespresentedbelowandelsewhereinthisAnnualInformationForm,suchfiguresareestimates,whichare,inpart,basedonforward-lookinginformationandcertainassumptions,andnoassurancecanbegiventhattheindicatedlevelofmineralwillbeproduced.Barrick’sestimatesofprovenandprobablereservesmayhavetoberecalculatedbasedonactualproductionexperience.Marketpricefluctuationsofgold,copperandsilver,aswellasincreasedproductioncostsorreducedrecoveryratesandotherfactors,mayrenderthepresentprovenandprobablereservesunprofitabletodevelopataparticularsiteorsites.See“RiskFactors”and“Forward-LookingInformation”foradditionaldetailsconcerningfactorsandrisksthatcouldcauseactualresultstodifferfromthosesetoutbelow.
See“GlossaryofTechnicalTerms”fordefinitionsoftheterms“mineralresource”,“inferredmineralresource”,“indicatedmineralresource”,“measuredmineralresource”,“mineralreserve”,“probablemineralreserve”and“provenmineralreserve”.
-30-

GOLDMINERALRESERVES1,3,4,5,8,12,13,14,15AsatDecember31,2017 PROVEN PROBABLE TOTAL
Basedonattributableounces Tonnes(000s)
Grade(gm/t)
Containedozs(000s)
Tonnes(000s)
Grade(gm/t)
Containedozs(000s)
Tonnes(000s)
Grade(gm/t)
Containedozs(000s)
NORTHAMERICA GoldstrikeOpenPit 50,013 2.82 4,537 9,198 3.78 1,117 59,211 2.97 5,654GoldstrikeUnderground 3,982 11.49 1,471 4,599 8.75 1,294 8,581 10.02 2,765
GoldstrikePropertyTotal 53,995 3.46 6,008 13,797 5.44 2,411 67,792 3.86 8,419PuebloViejo(60.00%) 62,137 2.67 5,335 19,222 3.06 1,889 81,359 2.76 7,224Cortez 19,145 1.46 898 148,775 1.92 9,188 167,920 1.87 10,086Goldrush — — — 5,671 8.12 1,481 5,671 8.12 1,481TurquoiseRidge(75.00%) 7,082 15.56 3,544 4,689 15.48 2,334 11,771 15.53 5,878SouthArturo(60.00%) 2,267 3.28 239 1,557 2.52 126 3,824 2.97 365Hemlo 935 3.66 110 23,993 2.16 1,664 24,928 2.21 1,774GoldenSunlight 270 1.15 10 182 3.42 20 452 2.06 30
SOUTHAMERICA CerroCasale(50.00%)10 114,851 0.65 2,391 483,950 0.59 9,232 598,801 0.60 11,623Veladero(50.00%)9 14,198 0.72 330 99,716 0.78 2,486 113,914 0.77 2,816LagunasNorte 25,719 2.23 1,840 29,711 2.27 2,165 55,430 2.25 4,005
AUSTRALIAPACIFIC Porgera(47.50%) 635 9.21 188 12,620 4.56 1,850 13,255 4.78 2,038Kalgoorlie(50.00%) 75,145 0.89 2,161 23,915 2.21 1,697 99,060 1.21 3,858
AFRICA Bulyanhulu(63.90%) 1,864 10.66 639 10,716 6.86 2,362 12,580 7.42 3,001NorthMara(63.90%) 5,298 2.40 408 11,628 2.89 1,080 16,926 2.73 1,488Buzwagi(63.90%) 9,108 0.92 269 — — — 9,108 0.92 269
OTHER 5,556 0.21 38 6,282 0.25 51 11,838 0.23 89
TOTAL 398,205 1.91 24,408 896,424 1.39 40,036 1,294,629 1.55 64,444
COPPERMINERALRESERVES1,3,4,5,8,12,13,15AsatDecember31,2017 PROVEN PROBABLE TOTAL
Basedonattributablepounds Tonnes(000s)
Grade(%)
Containedlbs(millions)
Tonnes(000s)
Grade(%)
Containedlbs(millions)
Tonnes(000s)
Grade(%)
Containedlbs(millions)
Zaldívar(50.00%) 132,477 0.493 1,440.3 81,757 0.538 970.4 214,234 0.510 2,410.7Lumwana 32,711 0.503 362.9 368,685 0.572 4,651.1 401,396 0.567 5,014.0JabalSayid(50.00%) 5,556 2.380 291.5 6,282 2.418 334.9 11,838 2.400 626.4
TOTAL 170,744 0.556 2,094.7 456,724 0.592 5,956.4 627,468 0.582 8,051.1
See“-NotestotheMineralReservesandResourcesTables”
-31-

GOLDMINERALRESOURCES1,2,3,7,8,12,13AsatDecember31,2017 MEASURED(M) INDICATED(I) (M)+(I) INFERRED
Basedonattributableounces Tonnes(000s)
Grade(gm/t)
Containedozs(000s)
Tonnes(000s)
Grade(gm/t)
Containedozs(000s)
Containedozs(000s)
Tonnes(000s)
Grade(gm/t)
Containedozs(000s)
NORTHAMERICA GoldstrikeOpenPit 1,764 2.61 148 3,840 2.89 357 505 267 2.80 24GoldstrikeUnderground 1,519 9.91 484 2,379 7.75 593 1,077 1,192 9.37 359
GoldstrikePropertyTotal 3,283 5.99 632 6,219 4.75 950 1,582 1,459 8.16 383PuebloViejo(60.00%) 7,773 2.39 598 93,913 2.47 7,456 8,054 27,637 2.43 2,155Cortez 2,586 1.88 156 28,837 1.85 1,712 1,868 9,874 2.01 638Goldrush 140 10.44 47 31,379 9.27 9,351 9,398 8,817 8.24 2,335TurquoiseRidge(75.00%) 2,944 9.03 855 2,162 9.37 651 1,506 1,697 13.03 711SouthArturo(60.00%) 2,927 1.19 111.6 8,365 1.12 301 412.6 749 0.46 11Hemlo 1,107 2.67 95 40,232 1.36 1,763 1,858 4,949 2.78 442GoldenSunlight 121 1.54 6 3,013 1.79 173 179 2,442 2.17 170DonlinGold(50.00%) 3,865 2.52 313 266,803 2.24 19,190 19,503 46,108 2.02 2,997
SOUTHAMERICA CerroCasale(50.00%)10 11,478 0.30 112 136,846 0.36 1,574 1,686 247,720 0.38 2,995Caspiche(50.00%)10 310,050 0.57 5,655 391,750 0.47 5,965 11,620 99,050 0.29 921Pascua-Lama11 42,809 1.86 2,564 391,734 1.49 18,783 21,347 15,400 1.74 863Veladero(50.00%)9 3,324 0.48 51 66,771 0.57 1,225 1,276 33,486 0.43 464LagunasNorte 1,925 0.87 54 29,017 0.96 896 950 1,857 0.92 55Alturas — — — — — — — 210,965 1.00 6,793
AUSTRALIAPACIFIC Porgera(47.50%) 149 5.22 25 12,316 4.62 1,828 1,853 11,879 4.15 1,584Kalgoorlie(50.00%) 3,166 0.96 98 12,120 1.21 473 571 1,252 2.48 100
AFRICA Bulyanhulu(63.90%) 874 11.53 324 8,334 8.78 2,352 2,676 15,469 9.75 4,848NorthMara(63.90%) 1,291 2.63 109 6,522 2.77 581 690 4,112 4.15 548Buzwagi(63.90%) 13 2.39 1 2,878 1.04 96 97 31,898 0.77 790Nyanzaga(57.51%) — — — 12,520 3.45 1,389 1,389 2,933 3.49 329Tankoro(31.95%) — — — — — — — 13,739 1.52 671
OTHER 216 0.29 2 2,404 0.61 47 49 1,860 0.25 15
TOTAL 400,041 0.92 11,809 1,554,135 1.54 76,756 88,565 795,352 1.21 30,818
See“-NotestotheMineralReservesandResourcesTables”
-32-

COPPERMINERALRESOURCES1,2,3,7,8,12,13AsatDecember31,2017 MEASURED(M) INDICATED(I) (M)+(I) INFERRED
Basedonattributablepounds Tonnes(000s)
Grade(%)
Containedlbs(millions)
Tonnes(000s)
Grade(%)
Containedlbs(millions)
Containedlbs(millions)
Tonnes(000s)
Grade(%)
Containedlbs(millions)
Zaldívar(50.00%) 62,629 0.402 555.5 25,248 0.389 216.4 771.9 4,408 0.511 49.7Lumwana 28,041 0.388 239.9 553,524 0.505 6,161.3 6,401.2 119,094 0.452 1,187.4JabalSayid(50.00%) 216 1.617 7.7 2,404 2.004 106.2 113.9 1,860 2.300 94.3
TOTAL 90,886 0.401 803.1 581,176 0.506 6,483.9 7,287.0 125,362 0.482 1,331.4
See“-NotestotheMineralReservesandResourcesTables”
-33-
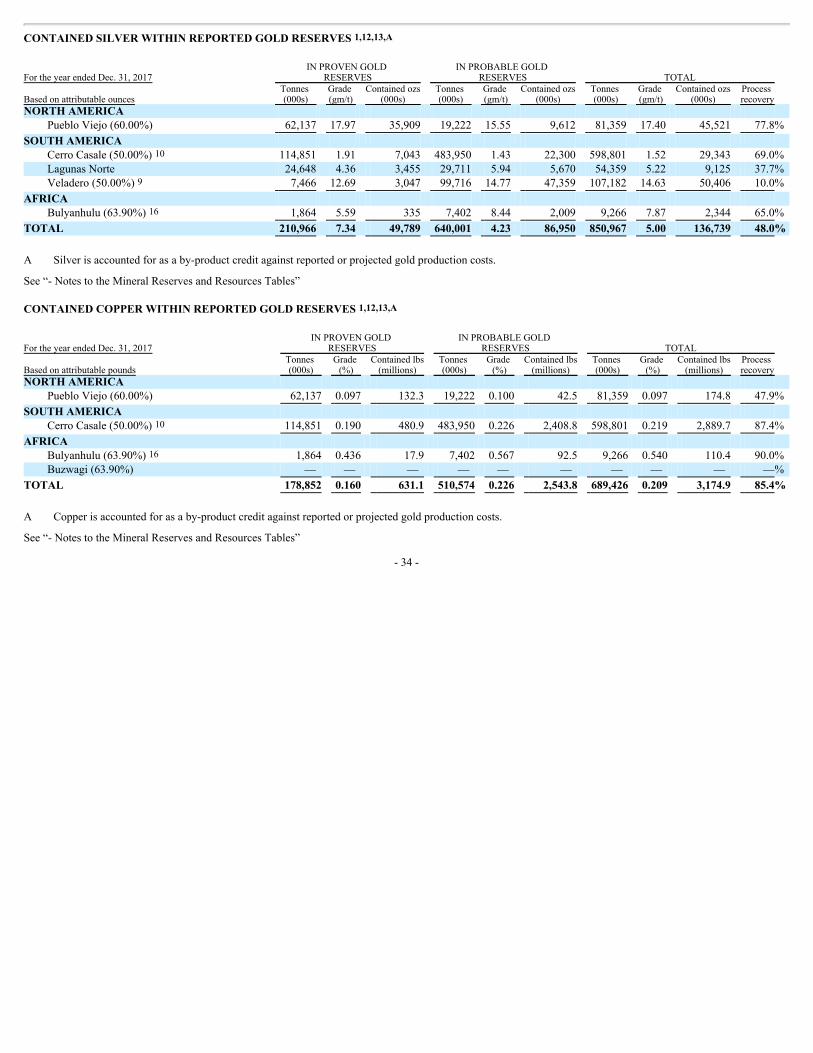
CONTAINEDSILVERWITHINREPORTEDGOLDRESERVES1,12,13,AFortheyearendedDec.31,2017
INPROVENGOLDRESERVES
INPROBABLEGOLDRESERVES TOTAL
Basedonattributableounces Tonnes(000s)
Grade(gm/t)
Containedozs(000s)
Tonnes(000s)
Grade(gm/t)
Containedozs(000s)
Tonnes(000s)
Grade(gm/t)
Containedozs(000s)
Processrecovery
NORTHAMERICA PuebloViejo(60.00%) 62,137 17.97 35,909 19,222 15.55 9,612 81,359 17.40 45,521 77.8%
SOUTHAMERICA CerroCasale(50.00%)10 114,851 1.91 7,043 483,950 1.43 22,300 598,801 1.52 29,343 69.0%LagunasNorte 24,648 4.36 3,455 29,711 5.94 5,670 54,359 5.22 9,125 37.7%Veladero(50.00%)9 7,466 12.69 3,047 99,716 14.77 47,359 107,182 14.63 50,406 10.0%
AFRICA Bulyanhulu(63.90%)16 1,864 5.59 335 7,402 8.44 2,009 9,266 7.87 2,344 65.0%
TOTAL 210,966 7.34 49,789 640,001 4.23 86,950 850,967 5.00 136,739 48.0%
A Silverisaccountedforasaby-productcreditagainstreportedorprojectedgoldproductioncosts.
See“-NotestotheMineralReservesandResourcesTables”
CONTAINEDCOPPERWITHINREPORTEDGOLDRESERVES1,12,13,AFortheyearendedDec.31,2017
INPROVENGOLDRESERVES
INPROBABLEGOLDRESERVES TOTAL
Basedonattributablepounds Tonnes(000s)
Grade(%)
Containedlbs(millions)
Tonnes(000s)
Grade(%)
Containedlbs(millions)
Tonnes(000s)
Grade(%)
Containedlbs(millions)
Processrecovery
NORTHAMERICA PuebloViejo(60.00%) 62,137 0.097 132.3 19,222 0.100 42.5 81,359 0.097 174.8 47.9%
SOUTHAMERICA CerroCasale(50.00%)10 114,851 0.190 480.9 483,950 0.226 2,408.8 598,801 0.219 2,889.7 87.4%
AFRICA Bulyanhulu(63.90%)16 1,864 0.436 17.9 7,402 0.567 92.5 9,266 0.540 110.4 90.0%Buzwagi(63.90%) — — — — — — — — — —%
TOTAL 178,852 0.160 631.1 510,574 0.226 2,543.8 689,426 0.209 3,174.9 85.4%
A Copperisaccountedforasaby-productcreditagainstreportedorprojectedgoldproductioncosts.
See“-NotestotheMineralReservesandResourcesTables”
-34-
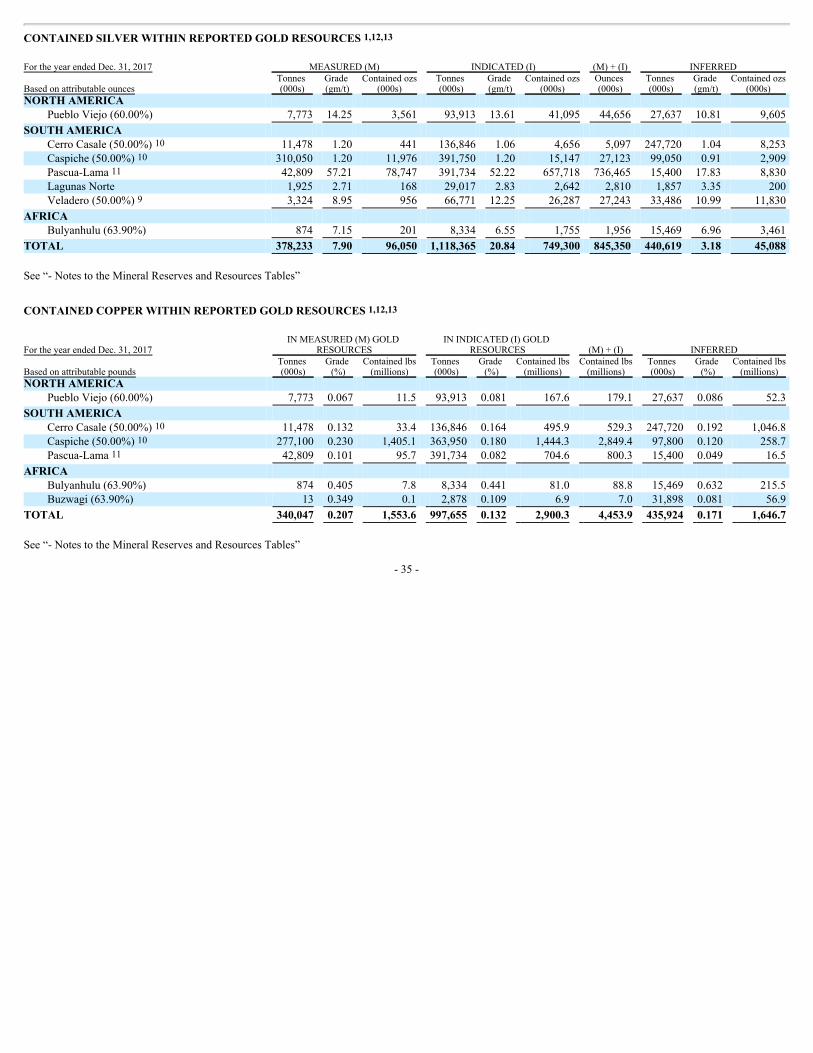
CONTAINEDSILVERWITHINREPORTEDGOLDRESOURCES1,12,13FortheyearendedDec.31,2017 MEASURED(M) INDICATED(I) (M)+(I) INFERRED
Basedonattributableounces Tonnes(000s)
Grade(gm/t)
Containedozs(000s)
Tonnes(000s)
Grade(gm/t)
Containedozs(000s)
Ounces(000s)
Tonnes(000s)
Grade(gm/t)
Containedozs(000s)
NORTHAMERICA PuebloViejo(60.00%) 7,773 14.25 3,561 93,913 13.61 41,095 44,656 27,637 10.81 9,605
SOUTHAMERICA CerroCasale(50.00%)10 11,478 1.20 441 136,846 1.06 4,656 5,097 247,720 1.04 8,253Caspiche(50.00%)10 310,050 1.20 11,976 391,750 1.20 15,147 27,123 99,050 0.91 2,909Pascua-Lama11 42,809 57.21 78,747 391,734 52.22 657,718 736,465 15,400 17.83 8,830LagunasNorte 1,925 2.71 168 29,017 2.83 2,642 2,810 1,857 3.35 200Veladero(50.00%)9 3,324 8.95 956 66,771 12.25 26,287 27,243 33,486 10.99 11,830
AFRICA Bulyanhulu(63.90%) 874 7.15 201 8,334 6.55 1,755 1,956 15,469 6.96 3,461
TOTAL 378,233 7.90 96,050 1,118,365 20.84 749,300 845,350 440,619 3.18 45,088
See“-NotestotheMineralReservesandResourcesTables”
CONTAINEDCOPPERWITHINREPORTEDGOLDRESOURCES1,12,13FortheyearendedDec.31,2017
INMEASURED(M)GOLDRESOURCES
ININDICATED(I)GOLDRESOURCES (M)+(I) INFERRED
Basedonattributablepounds Tonnes(000s)
Grade(%)
Containedlbs(millions)
Tonnes(000s)
Grade(%)
Containedlbs(millions)
Containedlbs(millions)
Tonnes(000s)
Grade(%)
Containedlbs(millions)
NORTHAMERICA PuebloViejo(60.00%) 7,773 0.067 11.5 93,913 0.081 167.6 179.1 27,637 0.086 52.3
SOUTHAMERICA CerroCasale(50.00%)10 11,478 0.132 33.4 136,846 0.164 495.9 529.3 247,720 0.192 1,046.8Caspiche(50.00%)10 277,100 0.230 1,405.1 363,950 0.180 1,444.3 2,849.4 97,800 0.120 258.7Pascua-Lama11 42,809 0.101 95.7 391,734 0.082 704.6 800.3 15,400 0.049 16.5
AFRICA Bulyanhulu(63.90%) 874 0.405 7.8 8,334 0.441 81.0 88.8 15,469 0.632 215.5Buzwagi(63.90%) 13 0.349 0.1 2,878 0.109 6.9 7.0 31,898 0.081 56.9
TOTAL 340,047 0.207 1,553.6 997,655 0.132 2,900.3 4,453.9 435,924 0.171 1,646.7
See“-NotestotheMineralReservesandResourcesTables”
-35-

NICKELMINERALRESOURCES1,2,3,8,12,13FortheyearendedDec.31,2017 MEASURED(M) INDICATED(I) (M)+(I) INFERRED
Basedonattributablepounds Tonnes(000s)
Grade(%)
Containedlbs(millions)
Tonnes(000s)
Grade(%)
Containedlbs(millions)
Containedlbs(millions)
Tonnes(000s)
Grade(%)
Containedlbs(millions)
AFRICA Kabanga(50.00%) 6,905 2.490 379.0 11,705 2.720 701.9 1,080.9 10,400 2.600 596.1
See“-NotestotheMineralReservesandResourcesTables”
RECONCILIATIONOFMINERALRESERVES1,3,4,5,6,8,13,14,15
Basedonattributableounces GoldProperty(000’sofounces)
MineralReserves12/31/2016 Processedin2017 Increase(decrease)
MineralReserves12/31/2017
NORTHAMERICA GoldstrikeOpenPit 6,271 586 -31 5,654GoldstrikeUnderground 1,806 364 1,323 2,765
GoldstrikePropertyTotal 8,077 950 1,292 8,419PuebloViejo(60.00%) 8,087 704 -159 7,224Cortez 10,220 1,581 1,447 10,086Goldrush 0 0 1,481 1,481TurquoiseRidge(75.00%) 4,029 228 2,077 5,878SouthArturo(10.00%) 122 98 341 365Hemlo 1,588 211 397 1,774GoldenSunlight 71 49 8 30
SOUTHAMERICA CerroCasale(50.00%)10 17,434 0 -5,811 11,623Pascua-Lama 14,050 0 -14,050 0Veladero(50.00%)17 6,749 466 -3,467 2,816LagunasNorte 4,218 605 392 4,005
AUSTRALIAPACIFIC Porgera(47.50%) 2,207 271 102 2,038Kalgoorlie(50.00%) 4,140 482 200 3,858
AFRICA Bulyanhulu(63.90%) 3,271 138 -132 3,001NorthMara(63.90%) 1,209 225 504 1,488Buzwagi(63.90%) 392 182 59 269
OTHER(3) 86 0 3 89
TOTAL 85,950 6,190 -15,316 64,444
CopperProperty(millionpounds)
MineralReserves12/31/2016 Processedin2017 Increase(decrease)
MineralReserves12/31/2017
Zaldívar(50.00%) 2,610 214 14 2,411Lumwana 2,684 274 2,604 5,014JabalSayid(50.00%) 627 46 46 626
TOTAL 5,921 534 2,664 8,051
See“-NotestotheMineralReservesandResourcesTables”.
-36-

Notes to the Mineral Reserves and Resources Tables
1 ReflectsBarrick’sownershipsharewhereownershipinterestislessthan100%.2 Thesemineralresourcesareinadditiontomineralreserves.Mineralresourcesthatarenotmineralreservesdonothavedemonstratedeconomicviabilitywhen
calculatedusingmineralreserveassumptions.3 MineralreservesandresourceshavebeencalculatedasatDecember31,2017,unlessotherwiseindicated.4 InconfirmingBarrick’sannualreservesforeachofitsmineralproperties,projects,andoperationsitconductsareservetestonDecember31ofeachyearto
verifythatthefutureundiscountedcashflowfromreservesispositive.Thecashflowexcludesallsunkcostsandonlyconsidersfutureoperatingandclosureexpensesaswellasanyfuturecapitalcosts.
5 MineralreservesasatDecember31,2017havebeencalculatedusinganassumedgoldpriceof$1,200perounce,anassumedsilverpriceof$16.50perounceandanassumedcopperpriceof$2.75perpoundandlong-termaverageexchangeratesofC$1.25:$1and$0.75:A$1.Reservecalculationsincorporatecurrentand/orexpectedmineplansandcostlevelsateachproperty.ReservesatKalgoorlieassumedagoldpriceofA$1,600andBulyanhulu,NorthMaraandBuzwagiassumedagoldpriceof$1,100.
6 MineralreservesasatDecember31,2016havebeencalculatedusinganassumedgoldpriceof$1,000perounceperouncefor2017through2020and$1,200perouncefrom2021onwards,anassumedsilverpriceof$13.75perouncefor2017through2020and$16.50perouncefrom2021onwards,anassumedcopperpriceof$2.25perpoundfor2017through2020and$2.75perpoundfrom2021onwards,andaverageexchangeratesofC$1.30:$1and$0.75:A$1.Reservecalculationsincorporatecurrentand/orexpectedmineplansandcostlevelsateachproperty.ReservesatKalgoorlieassumedagoldpriceofA$1,600andBulyanhulu,NorthMaraandBuzwagiassumedagoldpriceof$1,100.
7 MineralresourcesasatDecember31,2017havebeencalculatedusingvaryingcut-offgrades,dependingonboththetypeofmine,itsmaturityandoretypeateachproperty.Anassumedgoldpriceof$1,500perounce,anassumedsilverpriceof$20.50,anassumedcopperpriceof$3.50perpoundandexchangeratesofC$1.25:$1andA$1:$0.70havebeenusedinestimatingresources.
8 MineralreservesandmineralresourceshavebeenestimatedinaccordancewithNationalInstrument43-101,asrequiredbyCanadiansecuritiesregulatoryauthorities.ForUnitedStatesreportingpurposes,IndustryGuide7(undertheSecuritiesExchangeActof1934),asinterpretedbytheStaffoftheSEC,appliesdifferentstandardsinordertoclassifymineralizationasareserve.Inaddition,whiletheterms“measured”,“indicated”and“inferred”mineralresourcesarerequiredpursuanttoNationalInstrument43-101,theSECdoesnotrecognizesuchterms.CanadianstandardsdiffersignificantlyfromtherequirementsoftheSEC,andmineralresourceinformationcontainedhereinisnotcomparabletosimilarinformationregardingmineralreservesdisclosedinaccordancewiththerequirementsoftheSEC.Readersshouldunderstandthat“inferred”mineralresourceshaveagreatamountofuncertaintyastotheirexistenceandastotheireconomicandlegalfeasibility.Inaddition,readersarecautionednottoassumethatalloranypartofBarrick’smineralresourcesconstituteorwillbeconvertedintoreserves.Mineralresourcesthatarenotmineralreservesdonothavedemonstratedeconomicviability.
9 OnJune30,2017,theCompanydivested50%ofitsinterestintheVeladeromine.Foradditionalinformationregardingthismatter,see“GeneralInformation–GeneralDevelopmentoftheBusiness”.Accordingly,2017mineralreservesandresourcesrepresentBarrick’s50%ownershipofVeladeroasatDecember31,2017.
10 OnJune9,2017,BarrickcompletedatransactionwithGoldcorptoformanewpartnershipattheCerroCasaleprojectinChile.Pursuanttothetransaction,Goldcorpacquireda25%interestinCerroCasalefromBarrick.Thetransaction,coupledwiththeconcurrentpurchasebyGoldcorpofKinross’s25%interestinCerroCasale,resultedinBarrickandGoldcorpeachholdinga50%interest
-37-
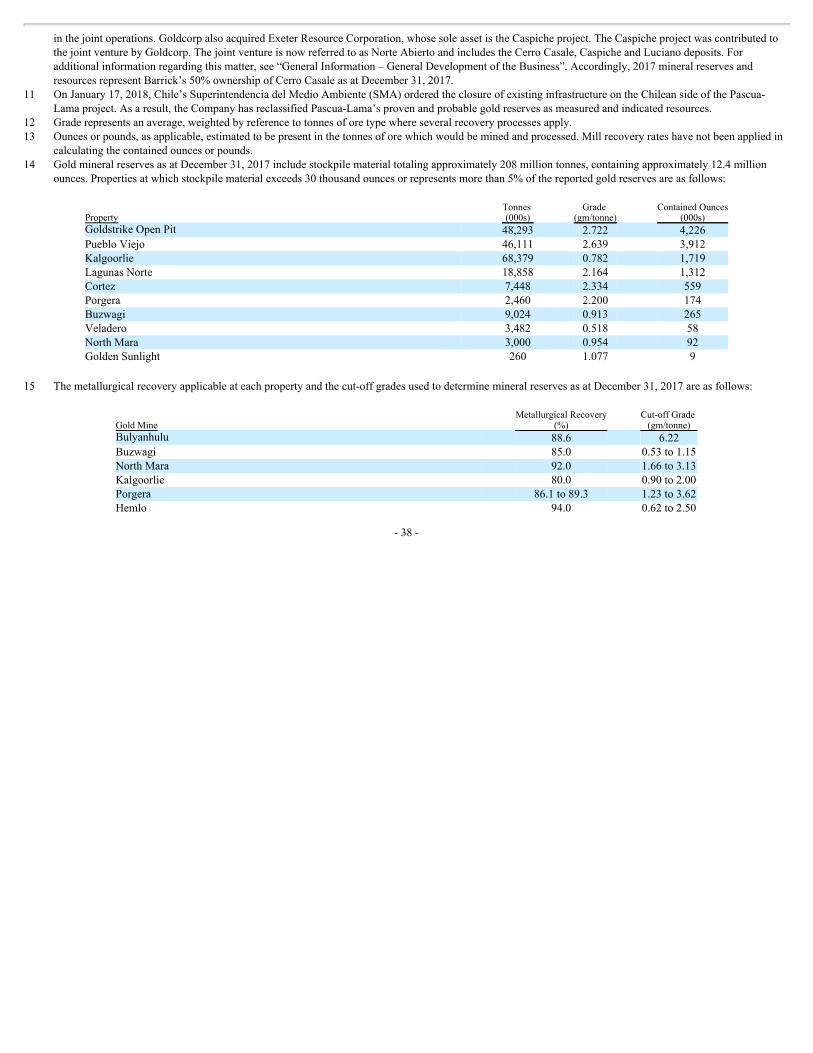
inthejointoperations.GoldcorpalsoacquiredExeterResourceCorporation,whosesoleassetistheCaspicheproject.TheCaspicheprojectwascontributedtothejointventurebyGoldcorp.ThejointventureisnowreferredtoasNorteAbiertoandincludestheCerroCasale,CaspicheandLucianodeposits.Foradditionalinformationregardingthismatter,see“GeneralInformation–GeneralDevelopmentoftheBusiness”.Accordingly,2017mineralreservesandresourcesrepresentBarrick’s50%ownershipofCerroCasaleasatDecember31,2017.
11 OnJanuary17,2018,Chile’sSuperintendenciadelMedioAmbiente(SMA)orderedtheclosureofexistinginfrastructureontheChileansideofthePascua-Lamaproject.Asaresult,theCompanyhasreclassifiedPascua-Lama’sprovenandprobablegoldreservesasmeasuredandindicatedresources.
12 Graderepresentsanaverage,weightedbyreferencetotonnesoforetypewhereseveralrecoveryprocessesapply.13 Ouncesorpounds,asapplicable,estimatedtobepresentinthetonnesoforewhichwouldbeminedandprocessed.Millrecoveryrateshavenotbeenappliedin
calculatingthecontainedouncesorpounds.14 GoldmineralreservesasatDecember31,2017includestockpilematerialtotalingapproximately208milliontonnes,containingapproximately12.4million
ounces.Propertiesatwhichstockpilematerialexceeds30thousandouncesorrepresentsmorethan5%ofthereportedgoldreservesareasfollows:
Property Tonnes(000s)
Grade(gm/tonne)
ContainedOunces(000s)
GoldstrikeOpenPit 48,293 2.722 4,226PuebloViejo 46,111 2.639 3,912Kalgoorlie 68,379 0.782 1,719LagunasNorte 18,858 2.164 1,312Cortez 7,448 2.334 559Porgera 2,460 2.200 174Buzwagi 9,024 0.913 265Veladero 3,482 0.518 58NorthMara 3,000 0.954 92GoldenSunlight 260 1.077 9
15 Themetallurgicalrecoveryapplicableateachpropertyandthecut-offgradesusedtodeterminemineralreservesasatDecember31,2017areasfollows:
GoldMine MetallurgicalRecovery
(%) Cut-offGrade(gm/tonne)
Bulyanhulu 88.6 6.22Buzwagi 85.0 0.53to1.15NorthMara 92.0 1.66to3.13Kalgoorlie 80.0 0.90to2.00Porgera 86.1to89.3 1.23to3.62Hemlo 94.0 0.62to2.50
-38-
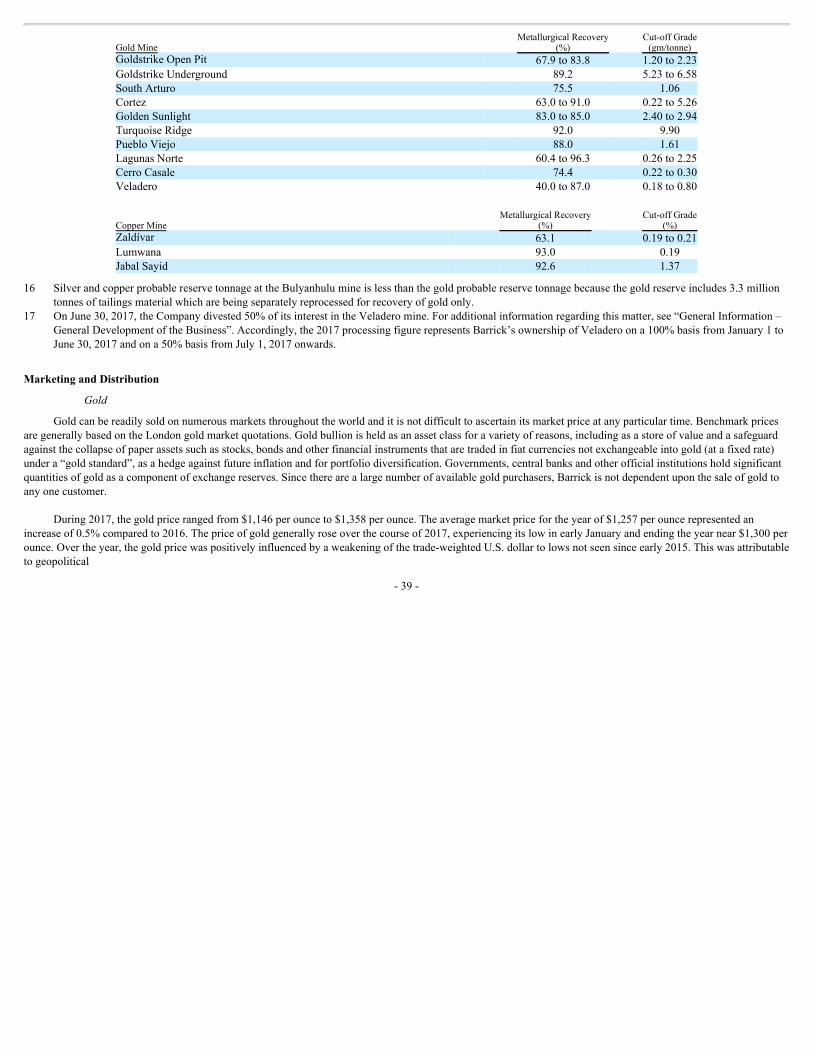
GoldMine MetallurgicalRecovery
(%) Cut-offGrade(gm/tonne)
GoldstrikeOpenPit 67.9to83.8 1.20to2.23GoldstrikeUnderground 89.2 5.23to6.58SouthArturo 75.5 1.06Cortez 63.0to91.0 0.22to5.26GoldenSunlight 83.0to85.0 2.40to2.94TurquoiseRidge 92.0 9.90PuebloViejo 88.0 1.61LagunasNorte 60.4to96.3 0.26to2.25CerroCasale 74.4 0.22to0.30Veladero 40.0to87.0 0.18to0.80
CopperMine
MetallurgicalRecovery(%)
Cut-offGrade(%)
Zaldívar 63.1 0.19to0.21Lumwana 93.0 0.19JabalSayid 92.6 1.37
16 SilverandcopperprobablereservetonnageattheBulyanhulumineislessthanthegoldprobablereservetonnagebecausethegoldreserveincludes3.3milliontonnesoftailingsmaterialwhicharebeingseparatelyreprocessedforrecoveryofgoldonly.
17 OnJune30,2017,theCompanydivested50%ofitsinterestintheVeladeromine.Foradditionalinformationregardingthismatter,see“GeneralInformation–GeneralDevelopmentoftheBusiness”.Accordingly,the2017processingfigurerepresentsBarrick’sownershipofVeladeroona100%basisfromJanuary1toJune30,2017andona50%basisfromJuly1,2017onwards.
MarketingandDistribution
Gold
Goldcanbereadilysoldonnumerousmarketsthroughouttheworldanditisnotdifficulttoascertainitsmarketpriceatanyparticulartime.BenchmarkpricesaregenerallybasedontheLondongoldmarketquotations.Goldbullionisheldasanassetclassforavarietyofreasons,includingasastoreofvalueandasafeguardagainstthecollapseofpaperassetssuchasstocks,bondsandotherfinancialinstrumentsthataretradedinfiatcurrenciesnotexchangeableintogold(atafixedrate)undera“goldstandard”,asahedgeagainstfutureinflationandforportfoliodiversification.Governments,centralbanksandotherofficialinstitutionsholdsignificantquantitiesofgoldasacomponentofexchangereserves.Sincetherearealargenumberofavailablegoldpurchasers,Barrickisnotdependentuponthesaleofgoldtoanyonecustomer.
During2017,thegoldpricerangedfrom$1,146perounceto$1,358perounce.Theaveragemarketpricefortheyearof$1,257perouncerepresentedanincreaseof0.5%comparedto2016.Thepriceofgoldgenerallyroseoverthecourseof2017,experiencingitslowinearlyJanuaryandendingtheyearnear$1,300perounce.Overtheyear,thegoldpricewaspositivelyinfluencedbyaweakeningofthetrade-weightedU.S.dollartolowsnotseensinceearly2015.Thiswasattributabletogeopolitical
-39-
tensions,highlightedbyconcernsregardingNorthKorea,fluctuationsinlong-termU.S.interestratesandinvestorinterestingoldasasafehavenassetandhedgeagainstrecordhighlevelsinU.S.equityindices.
Barrick’sgoldisrefinedtomarketdeliverystandardsbyseveralrefinersthroughouttheworld.Thegoldissoldtovariousgoldbulliondealersatmarketprices.CertainofBarrick’soperationsalsoproducegoldconcentrate,whichissoldtovarioussmelters.TheCompanybelievesthat,becauseoftheavailabilityofalternativesmeltersorrefiners,nomaterialadverseeffectwouldresultiftheCompanylosttheservicesofanyofitscurrentsmeltersorrefiners.
Productfabricationandbullioninvestmentaretwoprincipalsourcesofgolddemand.Theintroductionofmorereadilyaccessibleandliquidgoldinvestmentvehicleshasfurtherfacilitatedinvestmentingold.Withinthefabricationcategory,thereareawidevarietyofenduses,thelargestofwhichisthemanufactureofjewelry.Otherfabricationpurposesincludeofficialcoins,electronics,miscellaneousindustrialanddecorativeuses,dentistry,medalsandmedallions.
Copper
Copperisametalwithinherentcharacteristicsofexcellentelectricalconductivity,heattransferandresistancetocorrosion.Copperisusedprincipallyintelecommunications,powerinfrastructure,automobiles,constructionandconsumerdurables.CopperisprimarilytradedontheLondonMetalExchange(“LME”),theNewYorkCommodityExchangeandtheShanghaiFuturesExchange.Thepriceofcopperasreportedontheseexchangesisinfluencedbynumerousfactors,including(i)theworldwidebalanceofcopperdemandandsupply,(ii)ratesofglobaleconomicgrowth,includinginChina,whichhasbecomethelargestconsumerofrefinedcopperintheworld,(iii)speculativeinvestmentpositionsincopperandcopperfutures,(iv)theavailabilityandcostofsubstitutematerials,and(v)currencyexchangefluctuations,includingtherelativestrengthoftheU.S.dollar.
Thecoppermarketisvolatileandcyclical.Overthelast15years,LMEpricesperpoundhaverangedfromalowof$0.71toahighof$4.62,reachedinFebruary2011.In2017,LMEcopperpricestradedinarangeof$2.47perpoundto$3.32perpound,averaged$2.80perpound,andclosedtheyearat$3.25perpound.Copperpricesaresignificantlyinfluencedbyphysicaldemandfromemergingmarkets,especiallyChina.Thepriceofcoppertradedhigheroverthecourseof2017,reachingathree-yearhighneartheendoftheyearandaveraging27%higherthanthepreviousyear.Copperpricesbenefitedfromaweakeningofthetrade-weightedU.S.dollar,positiveeconomicandcopperusagedatafromChina,anincreaseinthepriceofothernon-preciousmetalminedcommoditiesandanincreaseininvestorsentiment.Adearthofnewprojectsscheduledtoenterproductionlaterinthedecadecouldpositivelyimpactpricesinthecomingyearsshouldphysicaldemandcontinuetogrow.
AsatDecember31,2017,utilizingoptioncollarstrategies,theCompanyhasprotectedthedownsideonapproximately60millionpoundsofexpected2018copperproductionatanaveragefloorpriceof$2.83perpoundandcanparticipateuptoanaverageceilingpriceof$3.25perpound.Thesepositionsexpireevenlyoverthefirstsixmonthsof2018.Barrick’sremainingcopperproductionissubjecttomarketprices.
AttheZaldívarmine,coppercathodeissoldtocopperproductmanufacturersandcoppertraders,whileconcentrateissoldtoalocalsmelterinChile.AttheLumwanamine,copperconcentrateissoldtoZambiansmelters.AttheJabalSayidmine,copperconcentrateissoldtothirdpartysmeltersandcoppertraders.Sincetherearealargenumberofavailablecoppercathodeandcopperconcentratepurchasers,Barrickisnotdependentuponthesaleofcoppertoanyonecustomer.
-40-
EmployeesandLaborRelations
AsatDecember31,2017,excludingcontractors,Barrickemployedapproximately18,421employeesworldwide,includingemployeesatAcaciaandatoperationsjointlyownedbyBarrick,substantiallyallofwhomareemployedintheUnitedStates,Canada,Australia,Chile,Peru,Argentina,theDominicanRepublic,PapuaNewGuinea,Tanzania,ZambiaandSaudiArabia.ThenumberofemployeesrepresentedbyalaborunionorcoveredbycollectivebargainingagreementsattheCompany’soperationsisapproximately6,030.
Specializedknowledgeandexperiencearerequiredofemployeesintheminingindustry.Barrickhasthenecessaryskilledemployeestoconductitsoperations.CertainBarrickminesmaybeadverselyimpactedifincreaseddemandsfromitsemployeesleadtoworkstoppagesortheCompanyisunabletoretainasufficientnumberofqualifiedemployeesforsuchoperations(see“–Employeerelations”and“–Competition”in“RiskFactors”).
Competition
TheCompanycompeteswithotherminingandexplorationcompaniesinconnectionwiththeacquisitionofminingclaimsandleasesandinconnectionwiththerecruitmentandretentionofhighlyskilledandexperiencedemployees(see“–EmployeesandLaborRelations”above).
Thereissignificantcompetitionforminingclaimsandleasesand,asaresult,theCompanymaybeunabletoacquireattractiveassetsontermsitconsidersacceptable.
CorporateSocialResponsibility
Barrick’ssustainabilityvisionistopartnerwithhostgovernmentsandcommunitiestotransformtheirnaturalresourcesintosustainablebenefitsandmutualprosperity.TheCompanydoesthisbymanagingitsimpactsonpeopleandtheenvironment,ensuringpartnersshareinthebenefitsofminingandengagingrespectfullywithothers.Thisvisionissupportedbyarangeofmanagementsystemsandpractices,whichultimatelyareaimedatenablingtheCompanytobeawelcomeandtrustedpartnerofhostgovernmentsandcommunities,themostsought-afteremployerandthenaturalchoiceforlong-terminvestors.SustainabilitycontinuestobeafundamentalpartofBarrick’sstrategyandiscriticaltoensuringbroadstakeholdersupportforBarrick’soperations.
In2017,Barrickcontinuedtoimplementitsglobalhumanrightscomplianceprogram,whichisalignedwiththeUNGuidingPrinciplesonBusinessandHumanRights.Since2012,humanrightsassessmentshavebeenconductedatallhighandmediumriskBarrickoperationsandprojects.Higherrisksitesorsiteswhereparticularconcernsareidentifiedareassessedmorefrequently.Asaresultoftheseassessments,BarrickalsocontinuedtoinvestinitsglobalhumanrightstrainingprogramatallminesandprojectsoperatedbytheCompanyonarisk-tieredbasis.Forexample,in2017,approximately2,215employeesandsecuritypersonnelattheCompany’ssitesreceivedin-persontrainingonhumanrightsissuesaspartofBarrick’sCodeofConduct,HumanRightsandAnti-Corruptiontrainingprogram.Inaddition,approximately3,650employeesreceivedinteractiveonlinetrainingrelatingtohumanrightsaspartofthisprogram.BarrickcontinuestoengagebroadlyonhumanrightsandhaspartnershipswithleadingorganizationssuchasWhiteRibbon.BarrickhasbeenamemberoftheUNGlobalCompact’s(“UNGC”)HumanRightsandLabourWorkingGroupsince2013,theSteeringCommitteeoftheVoluntaryPrinciplesonSecurityandHumanRightsbetween2012and2014andfrom2016topresent,andtheUNGC’sSteeringCommitteeforitsBusinessforPeaceinitiativeandtheSupplyChainandSustainabilityWorkingGroupsince2014.In2017,Barrickissueditsfirststand-aloneHumanRightsreport,whichprovidesinterestedstakeholderswithinformationontheCompany’shumanrightsglobal
-41-

complianceprogramandsalientrisks,whichBarrickintendstoupdateonanannualbasis.In2018,theCompanyisalsoplanningtoconveneaspeakerseriesinseveralNorthAmericancitiesonmaterialbusinessandhumanrightsissues.Theseandothereffortswhichemphasizetransparency,dialogueandrelationshipbuildingreinforceBarrick’scommitmenttorespectinghumanrightswherevertheCompanyoperates.
BarrickcontinuedtoinvestinpartnershipsthatmattertohostgovernmentsandcommunitieswhichtheCompanybelievesisanimportantwaytosharethebenefitsofminingandhelpbuildbroadstakeholdersupportforitsoperations.In2017,thisincludedanewpartnershipwithNetworkingAcademy(NetAcad),Cisco’sinformationtechnology(IT)skillsandcareerbuildingprogram.InApril2017,Barrick,CiscoandGreatBasinCollegeannouncedapartnershipthatwillbringdigitalandITskillsdevelopmentcourses,freeofcharge,togroupsinthegreaterElko,Nevadacommunity.ThisprogramisavailabletoBarrickemployeesandtheirfamilies,veterans,membersoftheWesternShoshonetribe,andmanyothersinBarrick’sruralhostcommunitiesinNorthernNevada.SimilarNetAcadsareplannedinothercommunitieswheretheCompanyoperates,whichcanultimatelyhelpbuildamoreskilledworkforceandcancontributetothediversificationoflocaleconomies.
Barrickcontinuestoengageexternalexpertstoimproveitsunderstandingofemergingsustainabilityissuesandimproveitsperformance.Tothisend,theCompanyconvenedtwomeetingsofitsindependentCorporateSocialResponsibilityAdvisoryBoardin2017.SinceestablishingtheAdvisoryBoardin2012,theCompanyhasconvenedtwelvemeetings,whichhavebeenhostedbyBarrick’sCEOand,subsequently,bythePresident.ThesemeetingsareaforumforAdvisoryBoardmemberstointeractwithmembersofBarrick’sexecutivecommittee,provideinsightonemergingsustainabilitytrendsandissuesthatcouldaffecttheCompany’sbusiness,andprovidecriticalfeedbackontheCompany’scorporatesocialresponsibilityperformance.SummariesofallmeetingsarepostedonBarrick’swebsite.PlansareunderwaytohosttwomeetingsoftheAdvisoryBoardin2018.
Barrick’ssustainabilityeffortscontinuetoreceiveinternationalrecognition,includingbytheDowJonesSustainabilityWorldIndex,inwhichtheCompanywaslistedin2017forthetenthconsecutiveyear.ConsistentwithBarrick’scommitmenttotransparency,Barrickcontinuestoparticipateinanumberofvoluntarydisclosureinitiatives,includingtheExtractiveIndustriesTransparencyInitiative,theCarbonPricingLeadershipCoalition,andtheCarbonandWaterDisclosureProjects.See“Environment”foradditionalinformationonBarrick’senvironmentalstandardsandpractices.
In2017,theCompanydevelopedaclimatechangestrategyalignedwithitsoverallbusinessstrategytogrowfreecashflowpersharethroughsafeandresponsiblemining.See“Environment”formoredetailregardingBarrick’sclimatechangestrategyandinitiatives.
OperationsinEmergingMarkets:CorporateGovernanceandInternalControls
Barrickconductsorparticipatesinmining,developmentandexplorationandotheractivitiesthroughsubsidiariesand/orjointventuresinmanycountries,includingtheUnitedStates,CanadaandAustraliaandinemergingmarketssuchasArgentina,Chile,Peru,theDominicanRepublic,PapuaNewGuinea,SaudiArabia,TanzaniaandZambia.Barrickhasalonghistoryofsuccessfullydevelopingandoperatingminesinemergingmarketsandhasorganizationalandgovernancestructuresandprotocolsinplacetomanagetheregulatory,legal,linguisticandculturalchallengesandrisksassociatedwithhavingoperationsinthesejurisdictions.Foradetaileddiscussionoftherisksassociatedwithoperatinginemergingmarketssee“RiskFactors–Foreigninvestmentsandoperations”startingonpage112ofthisAnnualInformationForm.
-42-
Barrickholdsitspropertiesandprojectsinemergingmarketsindirectlythroughsubsidiariesand/orjointventureentitieswhicharelocallyincorporatedorestablishedforthepurposesofcompliancewithlocallaw.Theseoperatingsubsidiariesorjointventureentitiesareinturnheldthroughholdingcompaniesincorporatedinjurisdictionswithwell-developedandreliablelegalandtaxationsystems.Suchholdingcompanies:(i)facilitateinternalcompanyreorganizationsofgroupcompanies;(ii)mayfacilitateprojectfinancingandcommercialtransactionssuchasthecreationofjointventures;and(iii)provideforpredictabilityandlegitimatedisputeresolutionprocesses.Barrickhasdesignedasystemofcorporategovernance,internalcontrolsoverfinancialreportinganddisclosurecontrolsandproceduresthatapplytoBarrickanditsconsolidatedsubsidiariesandjointventures.Thesesystems,whicharecoordinatedbytheCompany’sseniormanagementandoverseenbyitsBoardofDirectors,aredesignedtomonitortheactivitiesat,andreceivetimelyreportsfromBarrick’soperatingsubsidiariesandjointventures.BarrickhasimplementedseparatereportingsystemsforAcacia.
TheCompanyhasextensiveoperatingexperienceineachemergingmarketinwhichamaterialpropertyislocated–theDominicanRepublic,PeruandArgentina.OperatinginemergingmarketsexposestheCompanytorisksanduncertaintiesthatdonotexistoraresignificantlylesslikelytooccurinotherjurisdictionssuchastheUnitedStates,CanadaorAustralia.TheCompanymanagesandmitigatestheserisksthroughavarietyofcorporategovernancemechanisms.
Board and Management Experience and Oversight
Barrick’sBoardofDirectorsincludesdirectorswithexperienceworkingorrunningbusinessesinemergingmarkets.GustavoA.Cisneros,anindependentdirector,ChairofBarrick’sCorporateGovernance&NominatingCommitteeandmemberofBarrick’sCompensationCommittee,isanestablishedbusinessmanwithsignificantexperiencerunningbusinessesintheDominicanRepublicandLatinAmerica.Mr.Cisnerosiswell-versedinmanyofthecultural,legalandregulatoryconsiderationsthatarerelevanttooperatinginLatinAmericaandtheDominicanRepublic,inparticular.PabloMarcet,anArgentine-residentindependentdirectorwhowasappointedinDecember2016,isaseasonedminingprofessionalwithnearly30yearsofexperienceintheexploration,development,andoperationofminesacrossLatinAmerica,includingArgentina.Mr.Marcet’sdeepoperationalandgeopoliticalexperienceinLatinAmericaisavitalassettotheCompany,asitmanagesitsinvestmentsandevaluatesnewonesintheregion.GrahamG.ClowisanindependentdirectorwhowaselectedtotheCompany’sBoardofDirectorsin2016andisamemberoftheCompany’sRiskCommittee.Mr.ClowistheChairmanandPrincipalMiningEngineerofRoscoePostleAssociatesInc.,aconsultingfirmprovidingreservesandresourcesservicestotheminingindustryatallstagesofprojectdevelopment.Mr.Clowhasmorethan40yearsofexperienceinallaspectsofmining,includingacquisitions,exploration,feasibility,finance,development,construction,operations,andclosure.DambisaF.Moyohasbeenanindependentdirectorsince2011andisamemberoftheCompany’sAudit,CorporateGovernance&NominatingandRiskCommittees.Dr.Moyoisaninternationaleconomistandauthorontheglobaleconomywithuniqueknowledgeontheinherentrisksandissuesfacingemergingmarkets.KelvinP.M.Dushnisky,theCompany’sPresidentsince2015andamemberoftheBoardofDirectorssince2016,hasmorethan30yearsofinternationalminingindustryexperience,withafocusonprojectdevelopment,governmentrelations,andpublicaffairs.SincejoiningtheCompanyin2002,Mr.DushniskyhasdevelopedextensiveexperiencedealingwithcriticalissuesandrisksfacedbytheCompanyinemergingmarkets.Inaddition,Mr.DushniskyisChairmanofAcacia,whichhasoperationsinTanzaniaandinwhichtheCompanyholdsa63.9%equityinterest.Dr.MoyoandMessrs.Cisneros,Clow,DushniskyandMarcetprovidetheBoardofDirectorsandmanagementwithinsightinto,andanunderstandingof,manyofthekeyissuesthataregermanetoBarrick’soperationsinemergingmarkets.
Inaddition,membersofBarrick’sBoardofDirectorsandseniorofficersregularlyvisittheCompany’soperationsinbothdevelopedandemergingmarkets.Duringthesevisits,theyinteractwith
-43-
localemployees,governmentofficialsandbusinesspersons;suchinteractionsenhancethevisitingofficers’knowledgeoflocalcultureandbusinesspractices.In2017,variousoftheCompany’sindependentdirectorsvisitedtheCortez,JabalSayid,LagunasNorte,Lumwana,TurquoiseRidgeandVeladerositestomonitoroperationalprogressandrisks.Barrick’sExecutiveChairman,togetherwithBrianL.Greenspun,Barrick’sindependentdirectorfromNevada,alsovisitedtheCompany’sCodeMinefacilityinNevadatoassessprogressonBarrick’sdigitaltransformation.
TheBoardofDirectors,throughitscorporategovernancepractices,regularlyreceivesmanagementandtechnicalupdates,riskassessmentsandprogressreportsinconnectionwithitsoperationsinemergingmarkets,andinsodoing,maintainseffectiveoversightofitsbusinessandoperations.Throughtheseupdates,assessmentsandreports,theBoardofDirectorsgainsfamiliaritywiththeoperations,lawsandrisksassociatedwithoperationsinthosejurisdictions.Further,theBoardofDirectorshasaccesstoheadofficemanagementinCanadawhoworkdirectlywithlocalmanagementandarefamiliarwiththelocallaws,businesscultureandstandardpractices,havelocallanguageproficiency,areexperiencedinworkingintheapplicableemergingjurisdictionandindealingwiththerespectivegovernmentauthoritiesandhaveexperienceandknowledgeofthelocalbankingsystemsandtreasuryrequirements.
Communications
WhilethereportinglanguagewiththeheadofficeisEnglish,theprimaryoperatinglanguageintheDominicanRepublic,PeruandArgentinaisSpanish.AllBarrickpolicies,procedures,standardsandtrainingareavailableinbothEnglishandSpanish.Messrs.CisnerosandMarcetarenativeSpanishspeakers.ManymembersofheadofficemanagementareproficientinSpanish,andthemajorityofoperationalmanagementinemergingmarketsarefluentinSpanishandEnglish.
TheCompanymaintainsopencommunicationwithitsoperationsintheDominicanRepublic,PeruandArgentinathroughmanagementteammemberswhoarefluentinSpanishandareproficientinEnglish,removinglanguagebarriersbetweentheCompany’sheadofficeinTorontoandthelocalmanagementteams.TheprimarylanguageusedinmeetingswithheadofficemanagementandBoardmeetingsisEnglishandmaterialdocumentsrelatingtotheCompany’soperationsthatareprovidedtotheBoardareinEnglish.MaterialdocumentsrelatingtotheCompany’smaterialoperationsintheDominicanRepublic,PeruandArgentinaareeitherinEnglishor,whereinSpanish,aretranslatedintoorsummarizedinEnglish.
Further,thePuebloViejo,LagunasNorteandVeladerominesitesparticipateinaweeklybusinessplanreviewmeetingwithBarrick’sotherminesitesandheadoffice.ThisweeklymeetingisfacilitatedonarotatingbasisbyamemberoftheCompany’sExecutiveCommitteeandservestofacilitatethetimelyflowofinformationandheadofficeoversightofoperations.Asidefromtheweeklymeetingandfrequentinformalcontact,Barrickdoesnothaveaformalcommunicationplanthatsetsoutmeasuresthatwillbetakentomitigateanypotentialcommunication-relatedissues.
Internal Controls and Cash Management Practices
TheCompanymaintainsinternalcontrolsoverfinancialreportingwithrespecttoitsoperationsinemergingmarketsbytakingvariousmeasuresandconsistentlyapplyingthemacrossitsoperations.PursuanttotherequirementsofNationalInstrument52-109andtheU.S.Sarbanes-OxleyActof2002,theCompanyassessesthedesignandoperationofkeyinternalcontrolsoverfinancialreportingonanannualbasisataminimum,followingarisk-basedapproach.TheworkingpapersofthetestsperformedatalloftheCompany’slocationsarereviewedattheheadofficelevel.ThecontrolstandardsutilizedinemergingmarketsdonotmateriallydifferfromthoseemployedattheCompany’sotheroperations.
-44-
DifferencesinbankingsystemsandcontrolsbetweenCanadaandeachemergingmarketinwhichBarrickoperatesareaddressedbyhavingstringentcontrolsovercashkeptinthejurisdiction,especiallywithrespecttoaccesstocash,cashdisbursements,appropriateauthorizationlevels,performingandreviewingbankreconciliationsonatleastamonthlybasisandthesegregationofduties.
TheCompanyalsohasestablished(or,wheretheCompanyisnottheoperator,hasrequireditspartnertoestablish)practices,protocolsandroutinesforthemanagementandeventualdistributionofitsexcesscashtoitsforeignowners.Thedistributionmechanismsdependuponlocalcircumstancesandfinancingarrangementsinplace,andarecompliantwithapplicablelaw.Allmaterialpractices,protocolsandroutinesarecontrolledandoverseenbytheCompany’sChiefFinancialOfficerandaresubjecttocustomaryinternalreviews.Candidatesforsignificantrolesintheoperations,includingkeypositionsoftrust,arereviewedbytheCompany’sheadofficebeforeappointmentattheoperatinglevel.Foradditionaldetails,see“InternalControlOverFinancialReportingandDisclosureControlsandProcedures”.
Further,pursuanttoitsmandate,theAuditCommitteehastheauthoritytoretain,atitssolediscretion,outsidelegal,accountingorotheradvisorsinanyjurisdictioninwhichtheCompanyoperates,attheexpenseoftheCompany.TheAuditCommitteehasunrestrictedaccesstotheseadvisorsandmaycommunicatedirectlywiththem.Foradditionaldetails,see“AuditCommittee”.
Managing Cultural Differences
DifferencesinculturesandpracticesbetweenCanadaandeachemergingmarketinwhichBarrickoperatesareaddressedbyemployingcompetentstaffinCanadaandtheapplicableemergingmarketjurisdictionwhoarefamiliarwiththelocallaws,businesscultureandstandardpractices,havelocallanguageproficiency,areexperiencedinworkinginthatjurisdictionandindealingwiththerelevantgovernmentauthoritiesandhaveexperienceandknowledgeofthelocalbankingsystemsandtreasuryrequirements.
Books and Records
Whererequiredbyapplicablelaw,Barrickmaintainsandstoresoriginalcopiesofallcompanyrecordsintheapplicablelanguage.CompanymanagementandtheBoardofDirectorshavecompleteaccesstotheserecords.TheCompanyhasalsoimplementedaweb-basedglobalentitymanagementsystemforrecordingandfacilitatingaccesstosuchinformationanddocuments.
MATERIALPROPERTIES
ForthepurposesofthisAnnualInformationForm,BarrickhasidentifieditsCortez,Goldstrike,PuebloViejo,LagunasNorte,VeladeroandTurquoiseRidgeminesasmaterialproperties.ThefollowingisadescriptionofBarrick’smaterialproperties.
CortezProperty
GeneralInformation
ProjectDescription
TheCortezpropertyislocated100kilometerssouthwestofthetownofElko,NevadainLanderandEurekacountiesatelevationsrangingfrom1,370metersto1,675meters.Cortezemploysapproximately1,250employeesand345contractors.
-45-
AsofDecember31,2017,theCortezpropertyencompassedanareaofinterestofapproximately307,022hectares.TheCortezpropertyiscomprisedoftheCortezHills,Pipeline,CortezandGoldAcresComplexes.CurrentminingactivityisprimarilyfocusedontheCortezHillsandPipelineComplexes,locatedapproximately26kilometerssouthand18kilometerssouthwestofthetownofCrescentValley,Nevada,respectively.ThepropertyrightscontrolledbyCortez,eitherfromoutrightownershiporbylease,consistof90,055hectaresofunpatentedminingclaimsheldsubjecttotheparamounttitleoftheUnitedStatesofAmericaand17,226hectaresofpatentedminingclaimsandfeemineralandsurfaceland,ownedorcontrolledthroughvariouspatentsissuedbytheUnitedStatesofAmerica.AllminingclaimsarerenewedonanannualbasisandallnecessaryfeesarepaidpriortoAugust31ofeachyear.Allminingleasesandsubleasesarereviewedonamonthlybasisandallpaymentsandcommitmentsarepaidasrequiredbythespecificagreements.ThepropertyisaccessibleyearroundbypavedroadfromElko,Nevada.
Sufficientsurfacerightshavebeenobtainedforcurrentoperationsattheproperty.
Startingwiththefirstquarterof2017,CortezandtheGoldstrikepropertydescribedbelow(alongwithGoldrushandBarrick’s60%interestinSouthArturo)werecombinedintooneoperatingsegment,BarrickNevada.
History
In1964,ajointventurewasformedtoexploretheCortezarea.In1969,theoriginalCortezminewentintoproduction.From1969to1997,goldorewassourcedfromopenpitsatCortez,GoldAcres,HorseCanyonandCrescent.In1991,thePipelineandSouthPipelinedepositswerediscovered,withdevelopmentapprovalreceivedin1996.In1998,theCortezPedimentwasdiscovered,withtheCortezHillsdiscoveryannouncedinApril2003.TheCortezHillsdevelopmentwasapprovedbyPlacerDomeandKennecott,thenjointventurers,inSeptember2005andconfirmedbyBarrickin2006.BarrickobtainedaninterestintheCortezpropertythroughitsacquisitionofPlacerDomein2006.Barrickconsolidatedits100%interestinthepropertyfollowingitspurchaseoftheKennecottinterestin2008.
Geology
GeologicalSetting
TheCortezpropertyissituatedalongtheCortez/BattleMountaintrend.TheprincipalgolddepositsandminingoperationsarelocatedinthesouthernportionofCrescentValley,whichwasformedbybasinandrangeextensionaltectonism.Mineralizationissedimentaryrock-hostedandconsistsofsubmicrontomicrometer-sizedparticles,veryfinesulfidegrains,andgoldinsolidsolutioninpyrite.Mineralizationisdisseminatedthroughoutthehostrockmatrixinzonesofsilicified,decarbonatized,argillized,siltycalcareousrocksandassociatedjasperoids.
Mineralization
Mineralizationissedimentaryrock-hostedandconsistsofsubmicrontomicrometer-sizedgoldparticlesandgoldinsolidsolutioninpyrite.Mineralizationisdisseminatedthroughoutthehostrockmatrixinzonesofsilicified,decarbonatized,argillized,siltycalcareousrocks.
TheCortezHillsdepositconsistsoftheBrecciaZone,MiddleZone,LowerZone,RenegadeZoneandthePedimentdeposit.ThemaximumstrikelengthofmineralizationintheCortezHillsdepositisapproximately1,300meters,andthemaximumwidthisapproximately420meters.Themineralizedzonestartsatapproximately120metersbelowsurfaceandcontinuestomorethan600metersbelowsurface.ItisopenatdepthintheRenegadeZone.ExplorationtofullydelineatetheextentoftheCortezHillsdepositisongoing.
-46-
OreatthePipelinedepositishostedwithinsiltycarbonatesassociatedwiththeRobertsMountainandWenbanFormations.ThemaximumstrikelengthofmineralizationinthePipelinedepositisapproximately1,600metersandthemaximumwidthisapproximately1,200meters.Themineralizedzonestartsapproximately60metersbelowsurfaceandcontinuesto600metersbelowsurface.
MiningOperations
ProductionandMineLife
DepositswithinthePipelineComplexarebeingminedbyconventionalopenpitmethods.MiningattheCortezHillsComplexisbeingconductedattheopenpitoperationsusingconventionalmethods.Attheundergroundoperations,twodifferentundergroundminingmethodsareused:long-holeopenstopinganddrift-and-fill.
Miningproductionrates(openpitandundergroundcombined)forallminingactivityatCortezareexpectedtoaverageabout134milliontonnesperyear.ConventionalopenpitminingatCortezHillsiscurrentlyscheduledthrough2019andundergroundminingthrough2029.OpenpitminingatthePipelineComplexisscheduledtocontinuethrough2027.Basedonexistingreservesandproductioncapacity,includingtheCortezUndergroundExpansionProjectdiscussedinfurtherdetailbelow,theexpectedremainingminelifeatCortezis10yearsforopenpitmining,12yearsforundergroundmining,and17yearsforprocessingoperations.
CortezUndergroundExpansionProject
In2015,BarrickcompletedaprefeasibilitystudyforexpandedundergroundminingintheDeepSouthZone,belowcurrentlypermittedareasoftheLowerZoneattheCHUGmine.TheDeepSouthprojectremainsontracktocontributeaverageundergroundproductionofmorethan300,000ouncesperyearbetween2022and2026.
Developmentoftherangefronttwindeclinesthatwillprovideaccesstothelowerzoneoftheminebeganinthefourthquarterof2016.Forthefirsttime,themineisusingaroadheader(apieceofmachinerythatemploysmechanicalcuttingtofacilitatecontinuoustunnelboring),ratherthantraditionaldrillingandblasting.
Theprefeasibilitystudyanticipatedacostofsalesof$840perounce,andaverageall-insustainingcostsof$580perounce,forminingintheDeepSouthZone.Optimizationworkcompletedaspartofafeasibilitystudyhasidentifiedanumberofopportunitiestoreducethesecosts,includingthroughtheuseofautonomousloadingwithasmartconveyancesystem,comparedtoatraditionalconveyorsystemcontemplatedintheprefeasibilitystudy.Asresultofthisoptimizationwork,theCompanynowanticipatescostofsalesofapproximately$649perouncewithsubstantiallythesameall-insustainingcosts.
TheexpansionwillenableBarricktoaccessapproximately1.9millionouncesofprovenandprobablereservesintheDeepSouthZone,ofwhichabout60%isoxide(seeNote8of“–NotestotheMineralReservesandResourcesTable”in“NarrativeDescriptionoftheBusiness–MineralReservesandMineralResources”forinformationregardingtheclassificationofthesereservesforU.S.reportingpurposes).“All-insustainingcosts”isanon-GAAPfinancialperformancemeasure.Foranexplanationofall-insustainingcostsperouncereferto“Non-GAAPFinancialMeasures–All-insustainingcostsperounce,All-incostsperounce,Cashcostsperounce,All-insustainingcostsperpoundandC1cashcostsperpound”atpages150to164ofthisAnnualInformationForm.
-47-

Permittingwasinitiatedin2016withthesubmissiontotheBureauofLandManagement(“BLM”)ofanamendmenttothecurrentMinePlanofOperations.Thepermittingprocessisexpectedtotakeapproximatelythreetofouryears,includingthepreparationofanEnvironmentalImpactStatement.Arecordofdecisionisexpectedin2019or2020.Onthisbasis,dewateringanddevelopmentworkcouldbeginasearlyas2019or2020,withinitialproductionfromtheDeepSouthZonecommencingin2022or2023.
Processing
Thegold-recoveryprocessusedatCortezisdeterminedbyconsideringthegradeandmetallurgicalcharacteroftheparticularore:lowergraderun-of-mineoxideoreisheapleachedatexistingfacilities;higher-gradenon-refractoryoreistreatedinaconventionalmillusingcyanidationandtheCILprocess;andrefractoryoreisstockpiledonsiteindesignatedareasandtrucked160kilometerstoGoldstrikeforprocessing(see“–GoldstrikeProperty”).Goldrecoveredfromtheoreisprocessedintodoréon-siteandshippedtooutsiderefineriesforprocessingintogoldbullion.
TheactiveheapleachfacilitiesarelocatedatthePipelineandCortezHillsComplexes.MillingactivitiesatCortezareconductedatthePipelineComplex,whichincludescrushingandgrindingfacilities,CILcircuits,reagentstorageareasandarecovery/refiningcircuit.Millthroughputvariesfrom9,500to13,500tonnesperday(10,430to15,000tonsperday)dependingonthehardnessoftheorebeingprocessed.
WaterforprocessuseatthePipelineComplexissuppliedfromopenpitdewateringsystems,whichincludewells,pipelinesandinfiltrationbasins.
Infrastructure,PermittingandCompliance
ElectricpowerforthePipelineandCortezHillsComplexesispurchasedintheopenmarketandsuppliedthroughan80kilometerdistributionline.
OnDecember28,2015,aCortezemployeewaskilledinacollisionwhileoperatingahaultruck.TheU.S.MineSafetyandHealthAdministration(“MSHA”)commencedafatalaccidentinvestigationfollowingtheincidentandissuedthreecitationstoCortezonJanuary26,2016:(i)Citation877927,issuedunder§104(a)oftheMineAct,forwhichCortezpaidafineof$8,627;(ii)Citation8779298,under§104(a)oftheMineAct,forwhichCortezpaidafineof$42,000;and(iii)Citation8779299,under§104(d)(1)oftheMineAct,forwhichCortezpaidafineof$56,000.
AllmaterialpermitsandrightstoconductexistingoperationsattheCortezpropertyhavebeenobtainedandareingoodstanding.
Cortezinitiatedadigitaltransformationeffortinlate2016whichisfocusedonautomatingsomeaspectsofthemobileequipmentfleet,automatingtheprocessingplant,usinglocatingtechnologytoincreasetheeffectivedurationofworkduringminingshifts,andautomatingthemaintenanceworkorderprocesstoimprovemechanicandwarehouseefficiency(see“GeneralInformation–GeneralDevelopmentoftheBusiness–Strategy”).
Environment
Vegetationisdominatedbygrassandshrubs.Theclimateisrelativelyaridandhaslittleimpactonmineoperations.Operationsareconductedthroughouttheyear.
-48-
Themine’sdewateringoperationshavebeenenhancedwiththeadditionofseveralnewrapidinfiltrationsites.Currentdewateringoperationsfocusonbedrockwaterproduction.Aportionofthedewateringwaterisutilizedforminingandmilling,andaportionisutilizedatalocalranchonaseasonalbasisforirrigationpurposes.Thebalanceisreturnedtothebasinthroughtherapidinfiltrationbasinsorconsumedinprocessingactivities(i.e.,dustsuppressionandprocessmakeupwater).
In2017,allactivitiesattheCortezpropertywere,andcontinuetobe,incomplianceinallmaterialrespectswithapplicablecorporatestandardsandenvironmentalregulations.
EstimatedfuturereclamationandclosurecostsatCortezarereportedinBarrick’sfinancialstatementsaspartoftheamountsthatwererecordedunderIFRSasdefinedbyIAS37atBarrickNevada.AsatDecember31,2017,therecordedamountofestimatedfuturereclamationandclosurecostsforBarrickNevadathatwererecordedunderIFRSasdefinedbyIAS37,andthathavebeenupdatedeachreportingperiod,was$289million(asdescribedinNote2UtotheConsolidatedFinancialStatements).TheportionofthisamountattributabletoCortezfor2017was$147million.Barrickhasprovidedthefinancialsecurityasrequiredbygovernmentalauthoritiesinconnectionwiththereclamationoftheminearea.
ForadditionalinformationregardingBarrick’senvironmentalinitiatives,see“Environment”.
ExplorationandDrilling
In2017,approximately43,019metersin155explorationholesweredrilledaroundCortez,includingCortezHills,Pipeline,GoldAcresandRobertson.Spacingrangedfromnominal100to300metersforearlierstageprojectsto15to45meterspacingforresourceandreservedelineationprograms.DrillingintheCortezHillsareaisconductedfromsurfaceandundergroundplatforms.Mineralizationremainsopenatdepth.IntheRenegadeZone,explorationcontinuedtofurtherdefinethelimitsofmineralizationtothenorthwestandsoutheast.
Atotalof14,648metersofdrillingisplannedfortheCortezoperationsarea(CortezHills,PipelineandRobertson).
Approximately17,000drillholeshavebeendrilledtodate.Reversecirculationdrillingiscurrentlyusedduringtheinitialphasesofexploration.Wherereversecirculationholesencountermineralization,theyarere-drilledwithcoreholestoproducehigh-qualitysamplingofthemineralization.ThePipelineComplexisdrilledon43metercentersandtheCortezHillsComplexon30metercentersforopenpitoredefinition.CHUGoreisdelineatedbynominal15meterspacedcoreholeswithadditionalin-fillreversecirculationdrillingasrequiredtodefineoreboundaries.
RoyaltiesandTaxes
AllproductionfromPipelineissubjecttoagrosssmelterreturnroyaltyofapproximately1.3%.Inaddition,productionfromcertainportionsofthePipelineComplexissubjecttoagrosssmelterreturnroyalty(graduatingfrom0.4%to5.0%basedonthepriceofgold)andanetvalueroyaltyof5%.Thereisalsoanetvalueroyaltyof3.75%ongoldsalesfromtheSouthPipelinedeposit.
AllotherproductionbyCortez,includingCortezHills,issubjecttoagrosssmelterreturnroyaltyofapproximately1.3%.
Inaddition,oncethetotalamountofgoldproducedbyCortezafterJanuary1,2008exceeds15millionounces,whichhasnotyetoccurred,40%ofproductionatCortezwillbesubjecttoaroyalty
-49-
graduatingfrom0%to3%,dependingonthegoldprice,onthegrossvalueofgolddelivered,minuscertaindeductionsforpre-existingroyalties.
TheStateofNevadaimposesa5%netproceedstaxonthevalueofallmineralsseveredintheState.Thistaxiscalculatedandpaidbasedonaprescribednetincomeformulawhichisdifferentfrombookincome.
MiningandProcessingInformation
ThefollowingtablesummarizescertainminingandprocessinginformationfortheCortezpropertyfortheperiodsindicated.
Yearended
December31,2017Yearended
December31,2016Tonnesmined(000s) 134,503 124,919Tonnesoforeprocessed(000s) 15,853 25,112Averagegradeprocessed(gramspertonne) 3.10 1.73Ouncesofgoldproduced(000s) 1,447 1,059
Forcertainadditionalfinancialinformation,see“NarrativeDescriptionoftheBusiness–ReportableOperatingSegments–BarrickNevada”.
ThemostrecenttechnicalreportontheCortezpropertyisthetechnicalreportentitled“TechnicalReportontheCortezOperations,StateofNevada,U.S.A.”datedMarch21,2016andauthoredbyRoscoePostleAssociatesInc.(“RPA”).ThistechnicalreporthasbeenfiledonSEDARinaccordancewithNationalInstrument43-101.
ThediagramonthefollowingpageshowsthedesignandlayoutoftheCortezproperty.
-50-
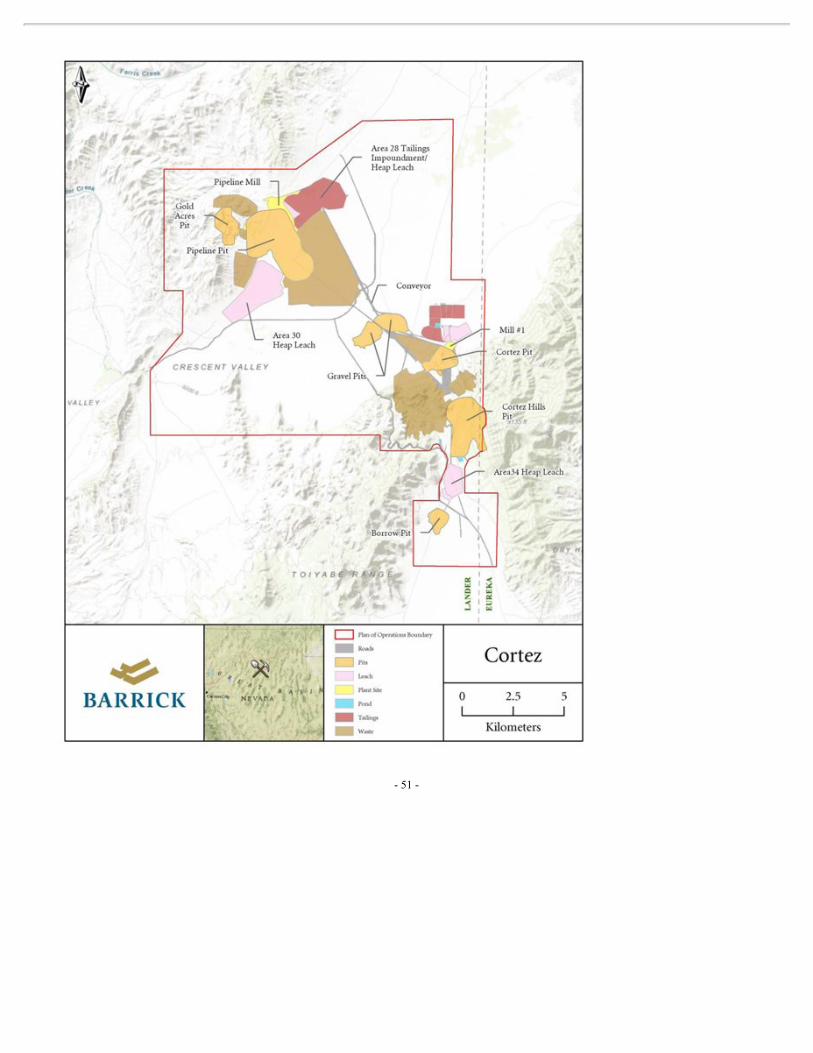
-51-
GoldstrikeProperty
GeneralInformation
ProjectDescription
TheGoldstrikepropertyislocatedinElkoandEurekaCountiesinnorthcentralNevada,approximately40kilometersnorthofthetownofCarlinand160kilometersnortheastoftheCortezproperty,atanelevationof1,700metersinthehillyterrainoftheTuscaroraMountains.Goldstrikeemploysapproximately1,700employeesand400contractors.
CurrentminingactivityatGoldstrikeisprimarilyfocusedontheBetzepit,RodeoandMeikleundergroundandSouthArturopit.AsofDecember31,2017,theGoldstrikepropertycomprised4,198hectaresofsurfacerightsownership/control(3,420hectaresprivateand778hectarespublic),and3,535hectaresofmineralrightsownership/control(2,741hectaresprivateand794hectarespublic).TheserightsareownedorcontrolledthroughvariousformsofpatentsissuedbytheUnitedStatesofAmericaandbyownershipofunpatentedminingandmill-siteclaimsthatareheldsubjecttotheparamounttitleoftheUnitedStatesofAmerica.TheGoldstrikepropertyincludesatotalof298unpatentedminingandmill-siteclaimstocontrolthepublicacreage.Unpatentedminingclaimsaremaintainedonanannualbasis.Allminingleasesandsubleasesarereviewedonamonthlybasisandallpaymentsandcommitmentsarepaidasrequiredbythespecificagreements.TheBetzeopenpit,theundergroundminesandthebeneficiationandprocessingfacilitiesattheGoldstrikepropertyarepredominantlysituatedonlandownedbyBarrick.AccesstothepropertyisviapavedroadfromElko,Nevada,certainaccessagreementswithNewmontandaright-of-wayissuedbytheBureauofLandManagement.
Sufficientsurfacerightshavebeenobtainedforcurrentoperationsattheproperty.
Startingwiththefirstquarterof2017,GoldstrikeandtheCortezpropertydescribedabove(alongwithGoldrushandSouthArturo)werecombinedintooneoperatingsegment,BarrickNevada.
History
PanCanaMineralsLtd.(“PanCana”)firstminedthepropertyforgoldin1976.In1978,WesternStatesMineralsCorporation(“WSMC”)becametheoperatorina50/50jointventurewithPanCana.Barrickacquireda50%interestandassumedmanagementoftheGoldstrikepropertyonDecember31,1986withtheacquisitionofWSMC’s50%interestintheproperty.Itcompletedtheacquisitionof100%ownershipofthepropertypursuanttoaplanofarrangemententeredintowithPanCanainJanuary1987.
Geology
GeologicalSetting
ThepropertyislocatedontheCarlinTrend,oneofNorthAmerica’smostprolificgoldproducingareas.TheareaoftheGoldstrikepropertyconsistsoffoldedandfaultedPaleozoicsedimentaryrocks,whichwereintrudedbythedioritetogranodioriteGoldstrikestockoftheJurassicAge.MesozoicfoldingandthrustfaultsformimportantstructuraltrapsforthemineralizationintheBetze-Postpit.Tertiaryfaultingdevelopedrangesandbasins,whichweresubsequentlyfilledwithvolcanicandsedimentaryrocksduringtheTertiarytime.
-52-
Mineralization
Themajorgolddeposits–PostOxide,Betze,RodeoandMeikle–areallhostedinsedimentaryrocksoftheSiluriantoDevonianages.ThegoldmineralizationattheBetzeopenpit(PostOxideandBetzedeposits)iscontrolledbyfavourablestratigraphy,structuralcomplexitiesintheformoffaultsandfolds,andthecontactoftheGoldstrikeintrusive.Overall,theBetze-Postorezonesextendfor1,829metersinanorthwestdirectionandaverage183to244metersinwidthand122to183metersinthickness.
CarbonatebrecciasandlimestonesoftheDevonianPopovichFormationandvariousintrusiverockshosttheorebodiesthatcomprisetheGoldstrikeundergroundmine(RodeoandMeikledeposits).IncontrasttotheGoldstrikeopenpitarea,theoverlyingmudstonesandargillitesoftheDevonianRodeoCreekMemberaregenerallyunmineralized.ThemaximumstrikelengthofmineralizationintheRodeo-Meikleorezonesisapproximately3,660meters,andthemaximumwidthisapproximately595meters.Themineralizedzonestartsatapproximately180metersbelowsurfaceandcontinuestomorethan586metersbelowsurface.
MiningOperations
ProductionandMineLife
Goldstrike’sopenpitmineisanopenpittruck-and-shoveloperation,usingstandard,provenequipment.Twodifferentundergroundminingmethodsareusedattheundergroundmine:long-holeopenstopinganddrift-and-fill(usedforflat-lyingmineralizationorwheregroundconditionsarelesscompetent).Theundergroundmineisatracklessoperation.
Basedonexistingreservesandproductioncapacity,theexpectedremainingminelifeatGoldstrikeextendsto2032forundergroundmining,to2030foropenpitminingandto2037forprocessingoperations.Thereispotentialforfurtherextensionstotheminelifefromopenpit,undergroundandadditionalprocessingoftollorespurchasedfromthird-partyvendors.
Barrick’s60%ownedSouthArturoprojectislocatedapproximatelyeightkilometersnorthwestofGoldstrike.WastestrippingatSouthArturocommencedshortlyafterreceiptofthefinalwaterpollutioncontrolpermitonMarch26,2015.Primaryoreminingcommencedinthesecondhalfof2016.Phase2ofSouthArturowascompletedinthefirsthalfof2017.BarrickexpectsthatthebulkoftheorefromtheSouthArturopitwillbeprocessedthroughGoldstrike’srefractoryprocessingfacilities,whicharedescribedinfurtherdetailbelow.
Processing
TheGoldstrikepropertyhastwoprocessingfacilities:anautoclaveinstallation,whichwasoriginallydesignedtotreattheproperty’snon-carbonaceoussulfide(refractory)ore,andtheroaster,whichiscurrentlyusedtotreattheproperty’scarbonaceousore,whichisalsorefractoryandrespondspoorlytocyanidation.Theoriginalcombinedinstalledcapacityofthesetwofacilitieswasapproximately27,000to30,000tonnesperday.Withtheimplementationofcalciumthiosulfateleachingasdescribedbelow,thecombinedinstalledcapacityofthetwofacilitiesisapproximately26,000to27,000tonnesperday.TheseprocessingfacilitiestreattheorefromGoldstrike’sopenpitandundergroundmines,aswellasrefractoryorefromBarrick’sCortezproperty.Goldrecoveredfromtheoreisprocessedintodoréon-siteandshippedtooutsiderefineriesforprocessingintogoldbullion.
In2014,GoldstrikecompletedthefirstphaseofconstructionofitsTotalCarbonaceousMaterial(“TCM”)project,whichutilizesathiosulfate-basedresininleachtechnologytoallowdouble-refractory
-53-
carbonaceousorestobeprocessedthroughtheautoclavesratherthantheroaster.TheTCMtechnologyusescalciumthiosulfatetoleachthegoldafterpressureoxidationratherthancyanide.Resinisusedtocollectthedissolvedgoldratherthanactivatedcarbon.FirstgoldfromtheTCMprocesswasproducedinNovember2014,followingcompletionofconstructionofthefirstphaseoftheTCMfacility.Afterastagedstart-up,theautoclavesreached85%offullproductioncapacityof12,000tonnesperdayin2015.Tonnesprocessedincreasedby22%in2017versus2016performance.ThenewTCMcircuitwillallowtheautoclavestocontinuetoprocesstheremainingautoclaveamenablestockpilesthrough2023.Asaresult,GoldstrikeexpectstobeabletoprocessstockpiledcarbonaceousmaterialearlierthananticipatedandincreaseitscapacitytoprocessoretransportedtoGoldstrikefromotherproperties.Theexpectedaverageannualcontributionisapproximately310thousandouncesofproductionoverthenextfouryears.
Infrastructure,PermittingandCompliance
MostofGoldstrike’spowerrequirementsareprovidedbya115megawattnaturalgas-firedpowerplant.Theremainingpowerrequirementsaresatisfiedbyopenmarketpurchasesofelectricity.Anaturalgaspipelinewascompletedinthesecondquarterof2013toprovidenaturalgastothemajorproductionequipmentattheautoclaveandroasterfacilities,whicharefullyoperational.
DewateringoftheBetzePitisaccomplishedthroughtheuseofperimeterwellslocatedperipheraltothepitarea,in-pitwells,horizontaldrainsinstalledforpassivedewateringofpitwalls,andwatercollectionsumpsinstalledinthebottomofthepit.
GroundwaterpumpingfordewateringattheGoldstrikepropertyisprimarilyfromthecarbonaterockaquifer,withverysmallamountsofpumpingfromshallowersiltstonesandunconsolidatedbasinfilldeposits.
Waterisconveyedbypipelinestosupportmining,millingandrelatedusesattheGoldstrikeproperty.Waterthatisnotusedforminingormillingpurposesisdeliveredtothe72-inch-diametergravityflowpipelinetotheTSRanchReservoir.BarrickisauthorizedbyadischargepermitissuedbytheNevadaDivisionofEnvironmentalProtectiontodischargewaterproducedbyitsgroundwaterpumpingoperationstogroundwaterviapercolation,infiltrationandirrigation.
AllmaterialpermitsandrightstoconductexistingoperationsattheGoldstrikepropertyhavebeenobtainedandareingoodstanding.
Environment
TheNorthernNevadaclimateisfairlyaridandhaslittleimpactonmineoperations.Vegetationisdominatedbygrassandshrubs.
In2017,allactivitiesattheGoldstrikepropertywere,andcontinuetobe,incomplianceinallmaterialrespectswithapplicablecorporatestandardsandenvironmentalregulations.
EstimatedfuturereclamationandclosurecostsatGoldstrikearereportedinBarrick’sfinancialstatementsaspartoftheamountsthatwererecordedunderIFRSasdefinedbyIAS37atBarrickNevada.AsatDecember31,2017,therecordedamountofestimatedfuturereclamationandclosurecostsforBarrickNevadathatwererecordedunderIFRSasdefinedbyIAS37,andthathavebeenupdatedeachreportingperiod,was$289million(asdescribedinNote2UtotheConsolidatedFinancialStatements).TheportionofthisamountattributabletoGoldstrikefor2017was$142million.Barrickhasprovidedthefinancialsecurityasrequiredbygovernmentalauthoritiesinconnectionwiththereclamationoftheminearea.
-54-
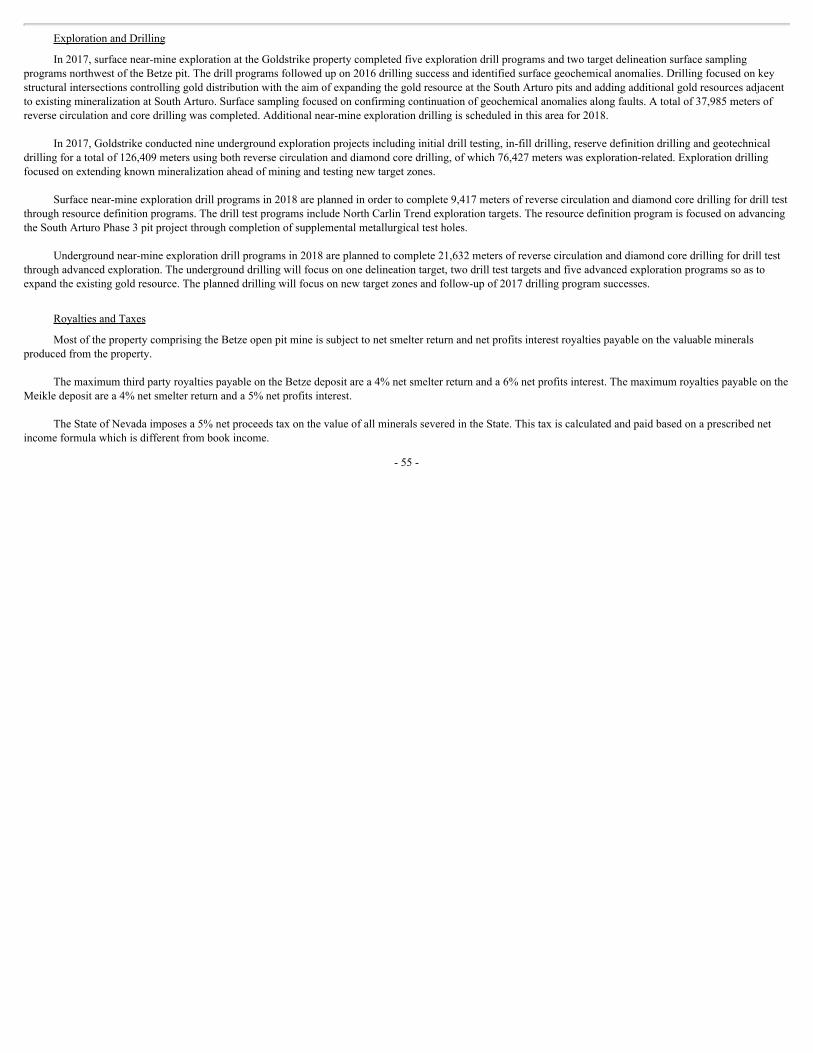
ExplorationandDrilling
In2017,surfacenear-mineexplorationattheGoldstrikepropertycompletedfiveexplorationdrillprogramsandtwotargetdelineationsurfacesamplingprogramsnorthwestoftheBetzepit.Thedrillprogramsfollowedupon2016drillingsuccessandidentifiedsurfacegeochemicalanomalies.DrillingfocusedonkeystructuralintersectionscontrollinggolddistributionwiththeaimofexpandingthegoldresourceattheSouthArturopitsandaddingadditionalgoldresourcesadjacenttoexistingmineralizationatSouthArturo.Surfacesamplingfocusedonconfirmingcontinuationofgeochemicalanomaliesalongfaults.Atotalof37,985metersofreversecirculationandcoredrillingwascompleted.Additionalnear-mineexplorationdrillingisscheduledinthisareafor2018.
In2017,Goldstrikeconductednineundergroundexplorationprojectsincludinginitialdrilltesting,in-filldrilling,reservedefinitiondrillingandgeotechnicaldrillingforatotalof126,409metersusingbothreversecirculationanddiamondcoredrilling,ofwhich76,427meterswasexploration-related.Explorationdrillingfocusedonextendingknownmineralizationaheadofminingandtestingnewtargetzones.
Surfacenear-mineexplorationdrillprogramsin2018areplannedinordertocomplete9,417metersofreversecirculationanddiamondcoredrillingfordrilltestthroughresourcedefinitionprograms.ThedrilltestprogramsincludeNorthCarlinTrendexplorationtargets.TheresourcedefinitionprogramisfocusedonadvancingtheSouthArturoPhase3pitprojectthroughcompletionofsupplementalmetallurgicaltestholes.
Undergroundnear-mineexplorationdrillprogramsin2018areplannedtocomplete21,632metersofreversecirculationanddiamondcoredrillingfordrilltestthroughadvancedexploration.Theundergrounddrillingwillfocusononedelineationtarget,twodrilltesttargetsandfiveadvancedexplorationprogramssoastoexpandtheexistinggoldresource.Theplanneddrillingwillfocusonnewtargetzonesandfollow-upof2017drillingprogramsuccesses.
RoyaltiesandTaxes
MostofthepropertycomprisingtheBetzeopenpitmineissubjecttonetsmelterreturnandnetprofitsinterestroyaltiespayableonthevaluablemineralsproducedfromtheproperty.
ThemaximumthirdpartyroyaltiespayableontheBetzedepositarea4%netsmelterreturnanda6%netprofitsinterest.ThemaximumroyaltiespayableontheMeikledepositarea4%netsmelterreturnanda5%netprofitsinterest.
TheStateofNevadaimposesa5%netproceedstaxonthevalueofallmineralsseveredintheState.Thistaxiscalculatedandpaidbasedonaprescribednetincomeformulawhichisdifferentfrombookincome.
-55-
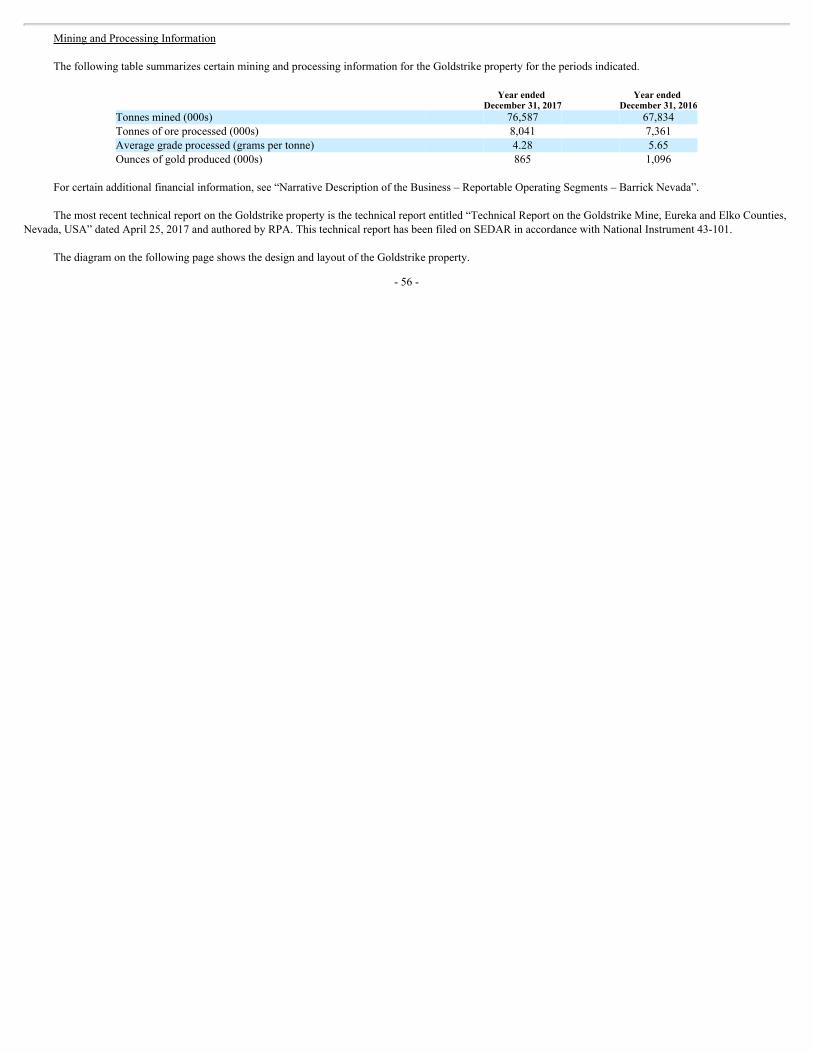
MiningandProcessingInformation
ThefollowingtablesummarizescertainminingandprocessinginformationfortheGoldstrikepropertyfortheperiodsindicated.
Yearended
December31,2017Yearended
December31,2016Tonnesmined(000s) 76,587 67,834Tonnesoforeprocessed(000s) 8,041 7,361Averagegradeprocessed(gramspertonne) 4.28 5.65Ouncesofgoldproduced(000s) 865 1,096
Forcertainadditionalfinancialinformation,see“NarrativeDescriptionoftheBusiness–ReportableOperatingSegments–BarrickNevada”.
ThemostrecenttechnicalreportontheGoldstrikepropertyisthetechnicalreportentitled“TechnicalReportontheGoldstrikeMine,EurekaandElkoCounties,Nevada,USA”datedApril25,2017andauthoredbyRPA.ThistechnicalreporthasbeenfiledonSEDARinaccordancewithNationalInstrument43-101.
ThediagramonthefollowingpageshowsthedesignandlayoutoftheGoldstrikeproperty.
-56-
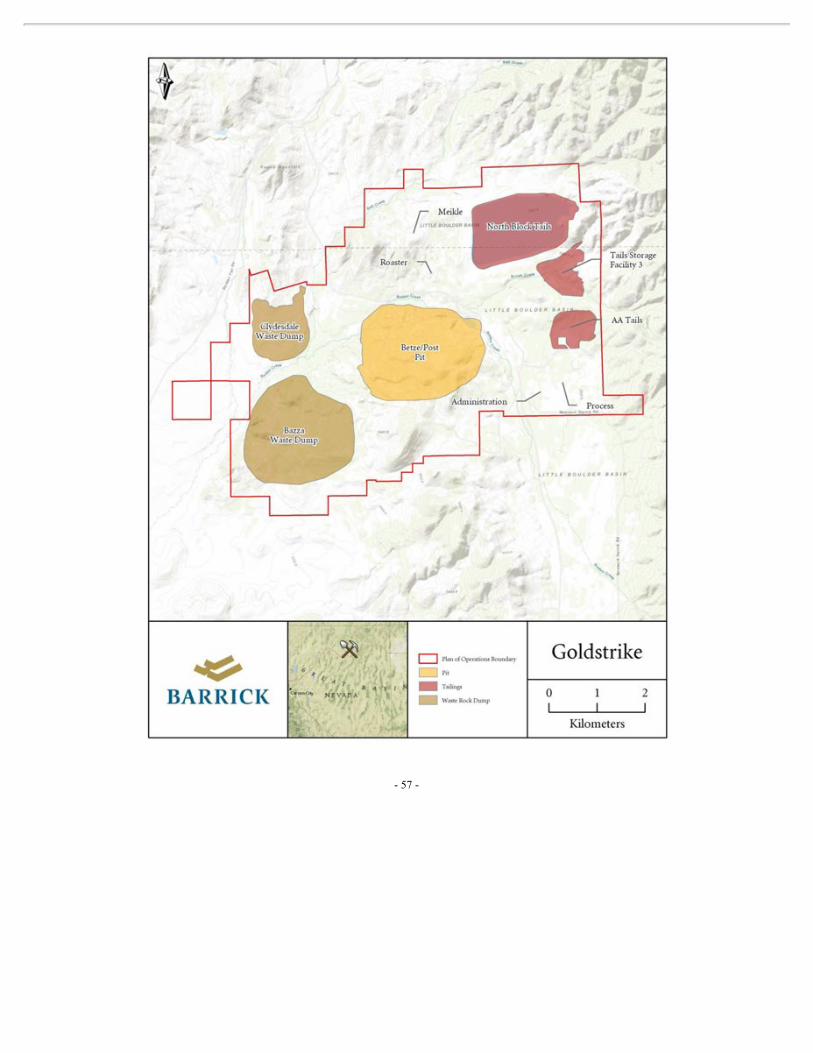
-57-
PuebloViejoMine
GeneralInformation
ProjectDescription
ThePuebloViejomineisanopenpitminingoperationlocatedintheprovinceofSánchezRamírezinthecentralpartoftheDominicanRepublicontheCaribbeanislandofHispaniola.Themineisapproximately100kilometersnorthwestofthenationalcapitalofSantoDomingo.PuebloViejoemploysapproximately2,300employeesand2,200contractors.
ThePuebloViejomineissituatedontheMontenegroFiscalReserve,anareaspeciallydesignatedbyPresidentialDecreefortheleasingofmineralsandminedevelopment,whichcoversanareaof4,880hectaresattheheadoftheArroyoMargajitaValleyintheeasternportionoftheCordilleraCentral.Aspecialleaseagreement(“SLA”)betweentheDominicanStateandPuebloViejoDominicanaCorporation(“PVDC”)governsthedevelopmentandoperationofthePuebloViejomine.TheSLAprovidesPVDCwiththerighttooperatethePuebloViejominefora25-yearperiodcommencingfromthedateonwhichPVDCdeliveredtheProjectNoticeundertheSLA,withoneextensionbyrightfor25yearsandasecond25-yearextensionbymutualagreementoftheparties,allowingapossibletotaltermof75years.ThePuebloViejodepositsarelocatedintwomajorareas,theMonteNegropitandtheMoorepit.Thepropertyisaccessibleyear-roundbypavedroadfromSantoDomingo.
Sufficientsurfacerightshavebeenobtainedforcurrentoperationsattheproperty.
History
Earlyminingactivityatthesitedatesbacktothe1500s.Subsequenttothatearlyminingactivity,RosarioResourcescommencedminingoperationsonthepropertyin1975.In1979,theCentralBankoftheDominicanRepublicpurchasedallforeign-heldsharesinRosarioResourcesandtheDominicanGovernmentcontinuedoperationsasRosarioDominicanaS.A.Goldandsilverproductionfromoxide,transitional,andsulfideoresoccurredfrom1975to1999.Themineceasedoperationsin1999.In2000,theDominicanRepublicinvitedinternationalbidsfortheleasingandmineralexploitationofthePuebloViejominesite.InJuly2001,PVDC(thenknownasPlacerDomeDominicanaCorporation),anaffiliateofPlacerDome,wasawardedthebid.PVDCandtheDominicanRepublicsubsequentlynegotiatedtheSLAfortheMontenegroFiscalReserve,whichwasratifiedbytheDominicanNationalCongressandbecameeffectiveonJuly29,2003.InMarch2006,BarrickacquiredPlacerDomeandinMay2006amalgamatedthecompanies.Atthesametime,Barricksolda40%stakeinthePuebloViejoprojecttoGoldcorp.OnFebruary26,2008,PVDCdeliveredtheProjectNoticetotheGovernmentoftheDominicanRepublicpursuanttotheSLAanddeliveredthePuebloViejoFeasibilityStudytotheGovernment.In2009,theDominicanRepublicandPVDCagreedtoamendthetermsoftheSLA.TheamendmentbecameeffectiveonNovember13,2009followingitsratificationbytheDominicanNationalCongress.ThePuebloViejomineachievedcommercialproductioninJanuary2013.AsecondamendmenttotheSLAbecameeffectiveonOctober5,2013,andhasresultedinadditionalandacceleratedtaxrevenuestothegovernmentoftheDominicanRepublic(see“–RoyaltiesandTaxes”below).
-58-
Geology
GeologicalSetting
ThePuebloViejodepositconsistsofhighsulfidationoracidsulfateepithermalgold,silver,copper,andzincmineralizationthatwasformedduringtheCretaceousAgeislandarcvolcanism.ThetwomainareasofalterationandmineralizationaretheMonteNegroandMooredeposits.Explorationdrillinghasidentifiedtwosatellitedeposits,underthehistoricCumbaandUpperMejitamineworkings.PuebloViejoissituatedintheLosRanchosFormation,aseriesofvolcanicandvolcaniclasticrocksthatextendacrosstheeasternhalfoftheDominicanRepublic,generallystrikingnorthwestanddippingsouthwest.
Mineralization
TheMooredepositislocatedattheeasternmarginofthePuebloViejomembersedimentarybasin.Stratigraphyconsistsoffinelybeddedcarbonaceoussiltstoneandmudstone(PVsediments)overlyinghorizonsofspilite(basaltic-andesiteflows),volcanicsandstone,andfragmentalvolcaniclastics.TheMonteNegrodepositislocatedatthenorthwesternmarginofthesedimentarybasin.Stratigraphyconsistsofinterbeddedcarbonaceoussedimentsrangingfromsiltstonetoconglomeratethatareinterlayeredwithvolcaniclasticflows.Metallicmineralizationinthedepositareasisprimarilypyritewithlesseramountsofsphaleriteandenargite.Pyritemineralizationoccursasdisseminations,layers,replacements,andveins.Sphaleriteandenargitemineralizationisprimarilyinveins,butdisseminatedsphaleritehasbeennotedincore.Themineralizationextendsfor2,800metersnorth-southand2,500meterseast-westandextendsfromthesurfaceto500metersindepth.
MiningOperations
ProductionandMineLife
ThePuebloViejomineachievedcommercialproductioninJanuary2013andcompleteditsramp-uptofulldesigncapacityin2014.MiningoperationsareplannedfortheMonteNegropitinphases4and5aswellastheMoorepitinphase3andphases5to7.
Basedonexistingtailingscapacity,theexpectedminelifeisjustoverfouryearsforminingandjustover16yearsofprocessingandquarryingoperations.PuebloViejoproduced650thousandouncesofgoldin2017(Barrick’s60%share).
Processing
GoldandsilverarerecoveredthroughpressureoxidationofthewholeorefollowedbyhotcureandhotlimeboilpriortocyanidationofgoldandsilverinaCILcircuit.
Theautoclavecircuitisdesignedtooxidizeapproximately1,750tonnesperdayofsulfide,toaveragejustover24,000tonnesperdayrun-of-mineoreannually.Therestoftheprocessplantisdesignedtohandlethemaximumprocessthroughput,andthemineisprogressingtowarddesigncapacityforsilverandcopperconcentrateproduction.PuebloViejoisevaluatingopportunitiestofurtherincreaseaverageplantthroughputbyoptimizingautoclavecontrolsandsulfidecontentinthemill.
Infrastructure,PermittingandCompliance
ThetailingsstorageareaislocatedintheElLlagalvalleylocatedapproximatelyfourkilometerssouthoftheplantsite.Thetailingsstorageareawillcontainalloftheprocesstailings,wasterockand
-59-
highdensitysludgeprecipitatetobegeneratedoverthelifeofthePuebloViejomine,andrunoffwaterfromthedesignfloodevent.Additionaltailingsimpoundmentcapacitywillbestudiedandimplementedasrequiredbytheresourcebase,asdescribedinfurtherdetailbelow.Inadditiontosolidsstorage,eachcellinthetailingsfacilityissizedtoprovidestorageforanoperatingpondandforextremeprecipitationevents.Themineissituatedinaseismicallyactivearea.Thedesignofthedamsatsitewasbasedonthemaximumcredibleearthquake.
Inadditiontoexistingreserves,PuebloViejohadapproximately8.054millionouncesofgoldand44.656millionouncesofsilverinthemeasuredandindicatedresourcecategory(Barrick’s60%share)asofDecember31,2017.In2017Barrickcompletedaninitialscoping-levelstudyforaplantexpansionatthePuebloViejominethatwouldincreasethroughputby50percentto12milliontonnesperyear,allowingtheminetomaintainaverageannualproductionof800,000ouncesafter2022(100percentbasis).Theprojectinvolvestheadditionofapre-oxidationheapleachpadwithacapacityofeightmilliontonnesperyear,anewmillandflotationconcentratorwithacapacityoffourmilliontonnesperyear,andadditionaltailingscapacity.Highergradeorewouldbeprocessedthroughthemillbeforemovingthroughtheflotationandautoclavecircuits.Lower-gradeorewouldbetreatedonthepre-oxidationpadbeforemovingthroughthemillandautoclavecircuits.Thisprojecthasthepotentialtoconvertapproximatelysevenmillionouncesofmeasuredandindicatedresourcestoprovenandprobablereserves(100percentbasis).Prefeasibilitylevelstudieshavenowbeeninitiated,alongwiththeconstructionofon-siteproofofconceptfacilitiesforpre-oxidationandflotation.
TheHatilloandHondoReservoirssupplyfreshwaterfortheprocessplant.ReclaimedwaterfromtheElLlagaltailingscontainmentpondisusedasasupplementarywatersupply.
Operationalpowerrequirementsvarybutaregenerallylessthan130MWataprocessrateof18,000tonnesperdayto150MWat24,000tonnesperday.In2013,PVDCcommissioneda218MWWartsilacombinedcyclereciprocatingenginepowerplanttogetherwithanapproximately140kilometertransmissionlineconnectingtheplanttotheminesite.ThepowerplantislocatedneartheportcityofSanPedrodeMacorisonthesouthcoastandwillprovidethelong-termpowersupplyforthePuebloViejomine.Theplantisdualfuelandiscurrentlyoperatedonheavyfueloil(“HFO”)withthecapabilitytoconverttonaturalgasinthefutureifasupplybecomesfeasible.TheHFOisdeliveredatanexistingHFOoff-loadingfacilityintheharboratSanPedroandtransportedtotheplantbyan8kilometerfuelpipeline.
AllmaterialpermitsandrightstoconductexistingoperationsatthePuebloViejominehavebeenobtainedandareingoodstanding.
Environment
Elevationattheminesiterangesfrom565metersatLomaCuabatoapproximately65metersattheHatilloReservoir.Thesiteischaracterizedbyruggedandhillyterraincoveredwithsubtropicalwetforestandscrubcover.Theregionhasatropicalclimatewithlittlefluctuationinseasonaltemperatures.TheheaviestrainfalloccursbetweenMayandOctober.
ThePuebloViejominesiteisaffectedbyanumberofsignificantlegacyenvironmentalissuesresultingfromtheconductofoperationsatsitepriortoBarrick’sinvolvementinthemine.UnderthetermsoftheSLA,theDominicanStateisobligated,atitssolecostandexpense,toremediateandrehabilitate,orotherwisemitigateallhistoricenvironmentalmatters.PVDChasagreedtocoverthecapitalcostsrelatedtosuchremediationupto$75million.Subjecttotheverificationofcertainconditions,PVDChasagreedtoactasanagentoftheDominicanStatetoremediatethehistoricalenvironmentalliabilitiesoftheState.However,uponPVDCgivingtheDominicanStateaProject
-60-
Notice,whichwasissuedbyPVDCin2008,PVDCassumedtheresponsibilitiesforallhistoricenvironmentalmatterswithintheboundariesofthe“DevelopmentAreas”,exceptforhazardoussubstancesattheRosario’splantsitewhichremaintheresponsibilityoftheDominicanState.Inaddition,theDominicanStateisrequiredundertheSLA,incompliancewiththeapplicableEnvironmentalandSocialGuidelinesandPolicies,andatitssolecostandexpense,torelocateandpayallindemnificationandothercompensationduetocertainpersonswithvalidclaimstolandwithintheMonteNegroFiscalReserve.UndertheSLA,PVDCandtheDominicanState,respectively,wererequiredtocomeintocompliancewiththehistoricenvironmentalmitigationandremediationmattersforwhichtheyareresponsibleunderthatagreementbyNovember2014.PVDCachievedcompliancebythatdeadline.Inthesecondhalfof2016,PVDCwascontractedtoactasanagentoftheDominicanStatetocarryoutactivitiesforwhichtheDominicanStateisresponsibleundertheSLApursuanttotheEnvironmentalManagementPlanoftheState(PlandeAdministracióndelEstado).TherequisiteenvironmentalpermitswerereceivedinNovember2016tocarryoutthefirststageoftheclosureplan,whichwillfocusondewatering,buttressing,andimprovingthestabilityoftheoldMejitatailingsfacility.DewateringoftheoldMejitatailingsfacilitycommencedin2017andageotechnicalinvestigationisunderwaywiththedesignstageexpectedtobecompletedinthethirdquarterof2018.Constructionactivitiesforthebuttressareplannedtocommenceinlate2018.
In2017,allofPVDC’sactivitiesatthePuebloViejominewere,andcontinuetobe,incomplianceinallmaterialrespectswithapplicablecorporatestandardsandenvironmentalregulations.
AsatDecember31,2017,therecordedamountofestimatedfuturereclamationandclosurecoststhatwererecordedunderIFRSasdefinedbyIAS37,andthathavebeenupdatedeachreportingperiodwas$174million(asdescribedinNote2UtotheConsolidatedFinancialStatements).
ExplorationandDrilling
During2017,threeexplorationprogramswereundertakenatPuebloViejoconsistingofacombinationofreversecirculationdrillinganddiamonddrillingatUpperMejita,MonteNegrofeederandtheMonteNegrounderground.In2018,explorationplansincludereversecirculationanddiamonddrillingoverseventargets.Therewillbefourareasofprimaryexploration:MonteNegrowestdeep,Moorewestdeep,ArroyoHondoandMoorenorth.Therewillalsobeadvancedexplorationoccurringatthreepreviouslydrilledtargets:UpperMejita,adjacenttoAcidRockDrainagePond#1andMonteNegrounderground.
AsofDecember31,2017,thedrillholedatabaseusedtosupportthedevelopmentofmineralresourcesforthePuebloViejopropertycontains2,816drillholes,comprisedof937diamonddrillcoreholes,681reversecirculation,and1,198percussionholesandrotarysamples.Samplestotaling185,865metersfromdiamonddrillholes,62,552metersfromrotaryandpercussionholesand100,850metersfromreversecirculationhavebeencollected.Inaddition,13,889close-spacedreversecirculationgradecontroldrillholes,totaling571,279meterswereusedtoestimatethegold,copperandsilverresources.Thedrillholespacingisvariable,rangingfrom10to15meters.
RoyaltiesandTaxes
UndertheSLA,PVDCisobligatedtomakethefollowingpaymentstotheDominicanRepublic:certainfixedpaymentsdueuponachievingcertainmilestones;anetsmelterreturnroyaltyof3.2%,whichdoesnotapplytocopperorzinc;anetprofitsinterestroyaltyof28.75%;anincometaxunderastabilizedtaxregime,whichincludesa25%taxonincome;andawithholdingtaxoninterestpaidonloansandonpaymentsabroadandothergeneraltaxobligations.
-61-
AsecondamendmenttotheSLAbecameeffectiveonOctober5,2013andhasresultedinadditionalandacceleratedtaxrevenuestotheDominicangovernment.ThesecondamendmenttotheSLAincludestheestablishmentofagraduatedminimumtax,whichwillbeadjustedupordownbasedonfuturemetalprices.During2017,PVDCandtheDominicangovernmentreachedanagreementonanupdatedfinancialmodelforthegraduatedminimumtaxratesthatwillapplyfrom2017through2019(see“LegalMatters–GovernmentControlsandRegulations”).
Inaddition,anenvironmentalreservefundhasbeenestablishedinanoffshoreescrowaccountasrequiredbytheSLAandisbeingfundedbyPVDCduringoperationsuntiltheescrowedfundsareadequatetodischargePVDC’sclosurereclamationobligations.
ThegovernmentoftheDominicanRepublichasmadesignificantprogressrepayingbalancesdueundertheSLAforpaymentsmadebyPVDConbehalfofthegovernmentandamountsrelatingtoPuebloViejo’senergysales.AsofDecember31,2017,theremainingbalanceowedtoPVDCbythegovernmentoftheDominicanRepublicforbalancesdueundertheSLAwas$0.1million.
Financing
During2010,PVDCsecuredavariablerate$1.035billionloanfacilityforthePuebloViejominewhichwasinsuredforpoliticalrisksbyExportDevelopmentCorporationofCanada.SubstantiallyalltheassetsofPVDC,includingthePuebloViejominepropertyandrelatedassets,werepledgedassecurityundertheloan.During2017,BarrickandGoldcorprepaidthefull$423millionofprincipalthatwasoutstandingunderthefacility.ThecollateralpledgedbyPVDCassecuritytothelenderswasreleasedfollowingtherepayment.Thesettlementresultedinadebtextinguishmentlossof$24million.
StreamingTransaction
OnSeptember29,2015,BarrickclosedagoldandsilverstreamingtransactionwithRoyalGoldforproductionlinkedtoBarrick’s60%interestinthePuebloViejomine.RoyalGoldmadeanupfrontcashpaymentof$610millionandwillcontinuetomakecashpaymentsforgoldandsilverdeliveredundertheagreement.The$610millionupfrontpaymentisnotrepayableandBarrickisobligatedtodelivergoldandsilverbasedonPuebloViejo’sproduction.Barrickhasaccountedfortheupfrontpaymentasdeferredrevenueandrecognizesitinearnings,alongwiththeongoingcashpayments,asthegoldandsilverisdeliveredtoRoyalGold.Barrickwillalsoberecordingaccretionexpenseonthedeferredrevenuebalanceasthetimevalueoftheupfrontdepositrepresentsasignificantcomponentofthetransaction.
Underthetermsoftheagreement,BarricksellsgoldandsilvertoRoyalGoldequivalentto:(i)7.5%ofBarrick’sinterestinthegoldproducedatPuebloViejountil990,000ouncesofgoldhavebeendelivered,and3.75%thereafter;and(ii)75%ofBarrick’sinterestinthesilverproducedatPuebloViejountil50millionounceshavebeendelivered,and37.5%thereafter.Silverisdeliveredbasedonafixedrecoveryrateof70%.Silverabovethisrecoveryrateisnotsubjecttothestream.ThereisnoobligationtodelivergoldorsilverundertheagreementifthereisnoproductionfromPuebloViejo.
BarrickreceivesongoingcashpaymentsfromRoyalGoldequivalentto30%oftheprevailingspotpricesforthefirst550,000ouncesofgoldand23.1millionouncesofsilverdelivered.Thereafterpaymentswilldoubleto60%ofprevailingspotpricesforeachsubsequentounceofgoldandsilverdelivered.OngoingcashpaymentstoBarrickaretiedtoprevailingspotpricesratherthanfixedinadvance,maintainingexposuretohighergoldandsilverpricesinthefuture.
-62-
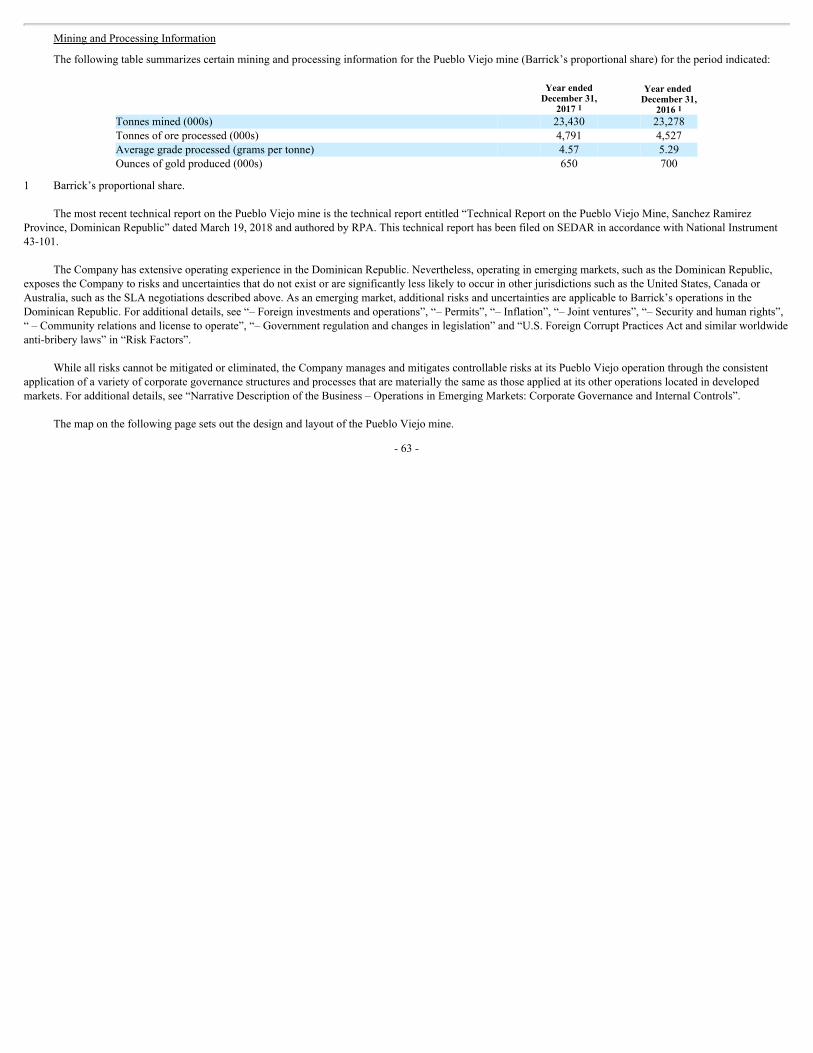
MiningandProcessingInformation
ThefollowingtablesummarizescertainminingandprocessinginformationforthePuebloViejomine(Barrick’sproportionalshare)fortheperiodindicated:
YearendedDecember31,
20171
YearendedDecember31,
20161Tonnesmined(000s) 23,430 23,278Tonnesoforeprocessed(000s) 4,791 4,527Averagegradeprocessed(gramspertonne) 4.57 5.29Ouncesofgoldproduced(000s) 650 700
1 Barrick’sproportionalshare.
ThemostrecenttechnicalreportonthePuebloViejomineisthetechnicalreportentitled“TechnicalReportonthePuebloViejoMine,SanchezRamirezProvince,DominicanRepublic”datedMarch19,2018andauthoredbyRPA.ThistechnicalreporthasbeenfiledonSEDARinaccordancewithNationalInstrument43-101.
TheCompanyhasextensiveoperatingexperienceintheDominicanRepublic.Nevertheless,operatinginemergingmarkets,suchastheDominicanRepublic,exposestheCompanytorisksanduncertaintiesthatdonotexistoraresignificantlylesslikelytooccurinotherjurisdictionssuchastheUnitedStates,CanadaorAustralia,suchastheSLAnegotiationsdescribedabove.Asanemergingmarket,additionalrisksanduncertaintiesareapplicabletoBarrick’soperationsintheDominicanRepublic.Foradditionaldetails,see“–Foreigninvestmentsandoperations”,“–Permits”,“–Inflation”,“–Jointventures”,“–Securityandhumanrights”,“–Communityrelationsandlicensetooperate”,“–Governmentregulationandchangesinlegislation”and“U.S.ForeignCorruptPracticesActandsimilarworldwideanti-briberylaws”in“RiskFactors”.
Whileallriskscannotbemitigatedoreliminated,theCompanymanagesandmitigatescontrollablerisksatitsPuebloViejooperationthroughtheconsistentapplicationofavarietyofcorporategovernancestructuresandprocessesthataremateriallythesameasthoseappliedatitsotheroperationslocatedindevelopedmarkets.Foradditionaldetails,see“NarrativeDescriptionoftheBusiness–OperationsinEmergingMarkets:CorporateGovernanceandInternalControls”.
ThemaponthefollowingpagesetsoutthedesignandlayoutofthePuebloViejomine.
-63-
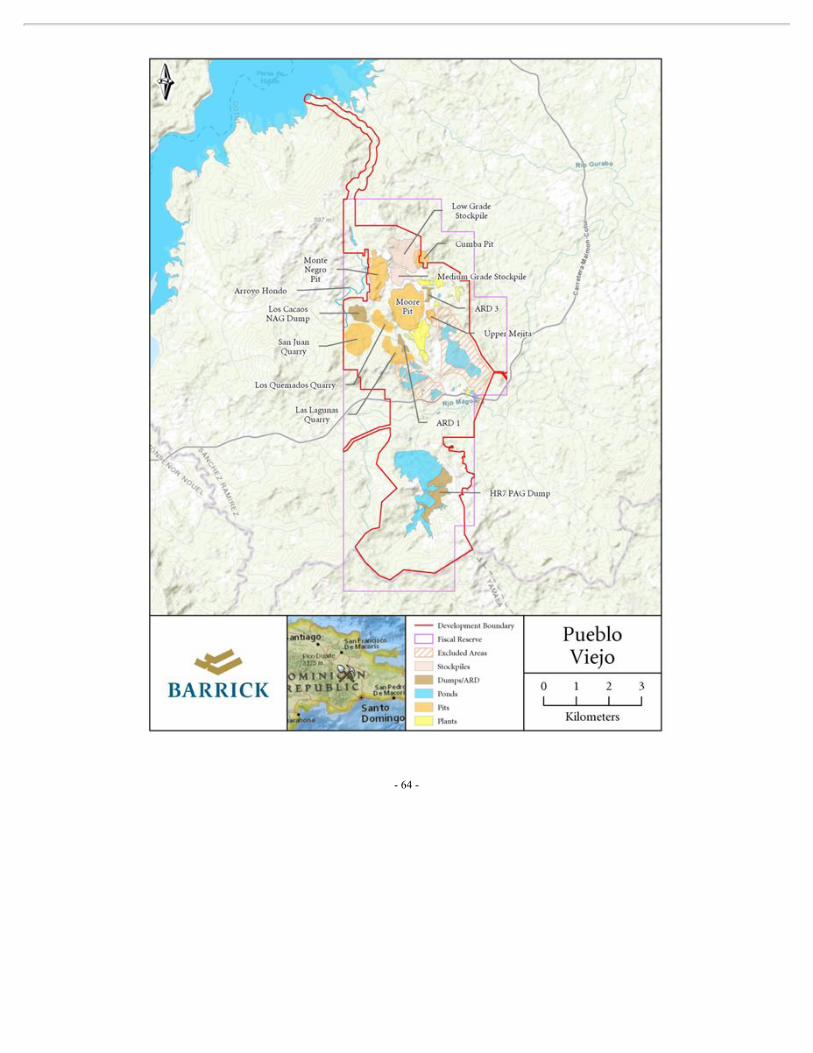
-64-
LagunasNorteMine
GeneralInformation
ProjectDescription
TheLagunasNortemineisanopenpit,heapleachingoperationlocatedintheAltoChicamaminingdistrict,90kilometerseastofthecoastalcityofTrujillo,Peru,and175kilometersnorthofBarrick’sPierinamine(nowinclosure).ThepropertyislocatedonthewesternflankofthePeruvianAndesatanelevationof4,000to4,260metersabovesealevel.Theminehasapproximately782employeesand1,253contractors.
In2002,Barrickacquiredthethreeprimaryminingconcessions,named“DerechosEspecialesdelEstadoNo.1,2and3,”respectively,fromCentrominPeruS.A.(“Centromin”)pursuanttoaninternationalbidprocess.In2004,thesethreeconcessionswereconsolidatedintoasingleminingconcessioncalled“AcumulaciónAltoChicama”withanextensionof18,002hectares,withinwhichtheexistingopenpitandprocessplantarelocated.Threeadditionalminingconcessionsnamed“LosAngeles,”“Lagunas15”and“Lagunas16”weresubsequentlyacquireddirectlybyBarrick.TheAltoChicamaminingpropertyencompassestheabovementionedfourminingconcessionstotaling19,774hectares.Theminingrightshaveanexpirydateifproductionisnotcommencedwithincertaintimeframes.Additionally,tokeeptheminingrightsingoodstanding,rightsholdersarerequiredtopayannuallandfees(currently$3.00perhectare)andadditionalpenaltypaymentsduringanyperiodthepropertiesarenotinproduction.Currently,productionactivitiesarebeingcarriedoutontheAcumulaciónAltoChicama.OnDecember29,2004,BarrickenteredintoaLegalStabilityAgreementwiththePeruvianGovernment.TheLegalStabilityAgreementprovidesincreasedcertaintywithrespecttoforeignexchangeandthefiscalandadministrativeregimefor15years.The15-yearperiodcommencedJanuary1,2006.InJanuary2015,BarrickmadealimitedelectionoutofthetaxstabilityprovisionsincludedintheLegalStabilityAgreementinordertobenefitfromreducedincometaxrates(see“–RoyaltiesandTaxes”below).ThepropertyisaccessibleyearroundbyroadfrombothTrujilloandHuamachuco,Peru.
Sufficientsurfacerightshavebeenobtainedforcurrentoperationsattheproperty.
History
TheAltoChicamaregionhasbeenactivelyminedforcoalsincethe19thcentury,principallyfordomesticconsumption.In1990,MineroPeruS.A.,theStateminingcompany,constructedacamptore-evaluatethepreviouscoaloperations.TheAltoChicamaregionhostsalow-gradeanthracitecoaldeposit,butitwasnotdevelopedduetotheavailabilityofcheapersourcesofenergyelsewhere.
Geology
GeologicalSetting
TheregionalgeologyoftheAltoChicamaareaisdominatedbyathicksequenceofMesozoicmarineclasticandcarbonatesedimentaryrocksandandesiticanddaciticvolcanicrocksoftheTertiaryCalipuyGroup.TheMesozoicsequenceisunconformablyoverlainbytheTertiaryCalipuyvolcanicrocksandcutbynumeroussmallintrusivebodies.TheMesozoicsequencehasbeenaffectedbyatleastoneandprobablytwostagesofcompressivedeformationduringAndeanorogenesis.
-65-

Mineralization
TheLagunasNortemineralizationoccursonthe185squarekilometerAltoChicamaproperty.Themineralizationisofthehighsulfidationtype.Itisdisseminatedandhostedinvariablybrecciatedsedimentaryrocksaswellasinvolcanicbrecciasandtuffs.Mineralizationoutcropshavebeendefinedbydrillingoveranareaof1,000meterslongby2,000meterswideandupto300metersdeep.
MiningOperations
ProductionandMineLife
In2017,miningactivityattheLagunasNorteminewasfocusedonPhases10,11,12,13and14.For2018,BarrickexpectsminingactivitytobeconcentratedinPhases12,13and14(phaseswithabalancedcontentof“clean”oreandcarbonaceousmaterialandsulfurcontent).
Basedonexistingreservesandthecurrentmineplan,productionisexpectedtocontinueuntil2026withtheprocessingofstockpiledmaterial.LagunasNorteproduced387thousandouncesofgoldin2017.
Processing
Theorebodyisbeingminedasanopenpit,truck-and-shoveloperation,atanaverageminingrateof90,025tonnesperday.Oreiscrushedandthentransportedviatrucktotheleachpadandrun-of-mineoreistransporteddirectlytotheleachpadatanaveragerateof48,971tonnesperday.
Goldandsilverrecoveredfromtheleachedoreissmeltedintodoréon-siteandshippedtoanoutsiderefineryforprocessingintobullion.
LagunasNorteMineLifeExtensionProject
BarrickisstudyingasequencedapproachtoextendingthelifeoftheLagunasNorteminebyfirstoptimizingtherecoveryofcarbonaceousoxideorecontainedinexistingstockpiles(“CMOPProject”),followedbypotentialextractionandprocessingofrefractoryores(“PMRProject”),ineachcasesubjecttoafeasibilitystudy,detailedengineeringcompletion,permittingandapprovalofinvestments.
TheprefeasibilitystudyfortheCMOPProjectandPMRProjectcontemplatesanaggregateinitialcapitalexpenditureofapproximately$640millionfortheconstructionofagrindingandcarbon-in-leachprocessingcircuitthatwouldtreatremainingcarbonaceousoxidematerial(theCMOPProject)andtheconstructionofaflotationandautoclaveprocessingcircuittotreatrefractorymaterial(thePMRProject).
BarrickexpectstocompletedetailedengineeringontheCMOPProjectin2018and2019.Ifapproved,constructionandcommissioningareexpectedtotakeplacein2019and2020,withinitialproductionexpectedin2021.
IfthePMRProjectisapproved,detailedengineeringandenvironmentalpermittingisexpectedtotakeplacebetween2021and2023,withconstructionandcommissioningbetween2024and2026,followedbyinitialproductionexpectedin2027.
-66-

Infrastructure,PermittingandCompliance
Powerisprovidedbyautilitycompanythrougha138kilovoltlineconnectedtotheTrujilloNortesubstation,locatedinthecoastalcityofTrujillo,approximately90kilometersfromthemine.Theeastwastedumpandleachpadfacilitiesarecontainedwithinonevalley,limitingpotentialenvironmentalimpacts.Waterforprocessuseistakenfromtwosmalllagoonspursuanttoauthorizationsgrantedbythewaterauthority.LagunasNortehasasurfacewaterandgroundwatermonitoringsysteminordertoidentifyandpreventpotentialadverseeffectstosuchwaterresources.
AllmaterialpermitsandrightstoconductexistingoperationsattheLagunasNorteminehavebeenobtainedandareingoodstanding.
Environment
TheLagunasNortemineislocatedinamountainousclimate.Generally,theclimateoftheareadoesnotimpactthemine’soperations.Vegetationconsistsofsmallshrubsandgrasses.TheareaexperiencesheavyrainfallsbetweenOctoberandApril.
InFebruary2010,BarrickfiledanamendmenttotheEnvironmentalImpactAssessment(the“FirstEIAAmendment”)whichproposedcertainmodificationstosomeoftheminefacilitiesattheLagunasNortemine.TheFirstEIAAmendmentwasapprovedbytheenvironmentalminingauthorityonAugust6,2010.Barrickcompletedconstructionandstart-upofacarbon-in-columnplantin2013andanewleachpad(Phase5),secondarytreatmentplantandoperationalpondsin2014.Anewreverseosmosiswatertreatmentplantwascompletedin2014andachievedstart-upinFebruary2015.ConstructionofPhase6ofthenewleachpadcommencedin2015andwascompletedin2016.
OnNovember18,2013,Barrickobtainedapprovalfromtheenvironmentalminingauthorityforanopenpitexpansion(Phase8openpit)andconnectionbetweenthenewandexistingleachpads(Phase8leachpad)aswellasforanincreaseintheheightoftheexistingleachpadandthedevelopmentofclayquarriesandadditionalauxiliarymininginfrastructure.Inaddition,onFebruary13,2014,BarrickobtainedapprovalfromtheenvironmentalminingauthoritytoincreaseLagunasNorte’sminingfleet,modifythecarbon-in-columnplantandaddstoragecapacityforminingequipment.
InNovember2014,BarricksubmittedtotheenvironmentalminingauthorityasecondamendmenttotheEIA,whichproposedmodificationstotheminingplan,anincreaseinopenpitareaandtonnage,modificationstotheeastwastedumpandheapleachdesignsandadditionalancillaryfacilities.ThissecondamendmenttotheEIAwasapprovedinJuly2015.
InDecember2015,thegovernmentmodifiedthe2008waterqualitystandardsinvariousrespects,includingtobetteralignwithinternationalstandardsandprovidedanewimplementationschedule.Thisplanwassubmittedtotheauthorityduringthefirstquarterof2017.
OnJuly4,2017,BarrickobtainedenvironmentalapprovalfromtheNationalEnvironmentalAuthoritytodeveloptheCMOPProject.
In2017,allactivitiesattheLagunasNortepropertywere,andcontinuetobe,incomplianceinallmaterialrespectswithapplicablecorporatestandardsandenvironmentalregulations.
AsatDecember31,2017,therecordedamountofestimatedfuturereclamationandclosurecoststhatwererecordedunderIFRSasdefinedbyIAS37,andthathavebeenupdatedeachreportingperiodwas$277million(asdescribedinNote2UtotheConsolidatedFinancialStatements).
-67-
ForadditionalinformationregardingtheCompany’senvironmentalinitiatives,see“Environment”.
ExplorationandDrilling
During2017,LagunasNortecompleted10,538.15metersofin-filldrillingin62holeswithdrillspacingof50meters.Theobjectiveofthe2017in-filldrillingprogramwastoimprovetheresourcemodelatthemineandconfirmthepotentialforadditionalmineralizationbelowandsurroundingthecurrentopenpit.Inaddition,aspartofthePMRProject,sixmetallurgicaldrillholesweredrilledtorunmetallurgicaltests.
For2018,LagunasNorteexpectstoconductareservesandresourcesdelineationprograminvolvingapproximately5,000metersofdrilling.Theprogramisintendedtofurtherincreasethereservesandresourcesoftheminesitelookingforin-pitoxidesmineralizationasprioritytobepotentiallyincludedintheshorttermmineplan(dependingonitsprofitability).Theplannedinfilldrillinghasareduceddrillingspacingof25meterstoconfirmthecontinuityofmineralizationassociatedwiththeleachablegoldinoxidesmineralization.Inaddition,LagunasNorteisalsoplanningtodevelopdrilltestprograms(initialexplorationstage)lookingforoxidemineralization(shallowdrilling)inareasnearthemine.
AsofDecember31,2017,atotalof1,557holesand258,445metershavebeendrilledatLagunasNortewithapproximately47.766metersofreversecirculationdrillingandover210,679metersofdiamonddrilling.ThedrillingprogramatLagunasNortehasbeencompletedatanaverageofapproximately30metercenters.
RoyaltiesandTaxes
UnderthetermsoftheagreementwithCentromin,BarrickpaidCentrominanadvancecontractualroyaltyof$2million,whichwascreditedagainstCentromin’sretainednetsmelterreturnroyaltyof2.51%in2005.InDecember2006,Centromintransferredallofitsrightsandobligations(includingtheforegoingroyalty)withrespecttotheminetoActivosMinerosS.A.C.,aStateminingcompany(“Activos”).In2017,$12.6millionwaspaidtoActivosunderthetermsofthisroyalty.
OnOctober20,2011,MineraBarrickMisquichilcaS.A.(“MBM”),Barrick’ssubsidiarythatoperatesLagunasNorte,signedanagreementwiththePeruvianGovernmentunderwhichitvoluntarilycommittedtopayonaquarterlybasistheSpecialMiningContribution(“SMC”)approvedbyLawNo.29790untiltheexpirationoftheLegalStabilityAgreement.BeginninginJanuary2015,followingitslimitedelectionoutofthetaxstabilityprovisionsintheLegalStabilityAgreement,MBMceasedtocontributeSMCandbecamesubjecttotheSpecialTaxonMining(“STM”)approvedbyLawNo.29789,whichisassessedonaslidingscalerangingfrom2.0%to8.4%basedonquarterlyoperatingincomemargin.TheSMCandSTMpaidfor2017totaled$10.6million.
InDecember2013,thePeruviangovernmentestablishedtwodifferentcontributionstobepaidbyminingcompaniestotheregulatoryagenciesinchargeofsupervisingmining,energyandenvironmentalactivities(OSINERGMINandOEFA).Thecontributionsarecalculatedonamonthlybasisofmineralsalesatratesof0.16%forOSINERGMINand0.13%forOEFA.In2017,$1.3millionwaspaidtoOSINERGMINandOEFA,collectively.
Fortheyears2015and2016,followingtheopt-outbyMBMofthetaxstabilityprovisionsintheLegalStabilityAgreement,MBMwassubjecttoa28%incometaxrateatthecorporatelevelanda6.8%incometaxrateattheshareholderlevel.AsaresultofincometaxratesapprovedinDecember2016,MBMisnowsubjecttoa29.5%incometaxrateatthecorporatelevelanda5%incometaxrateatthe
-68-
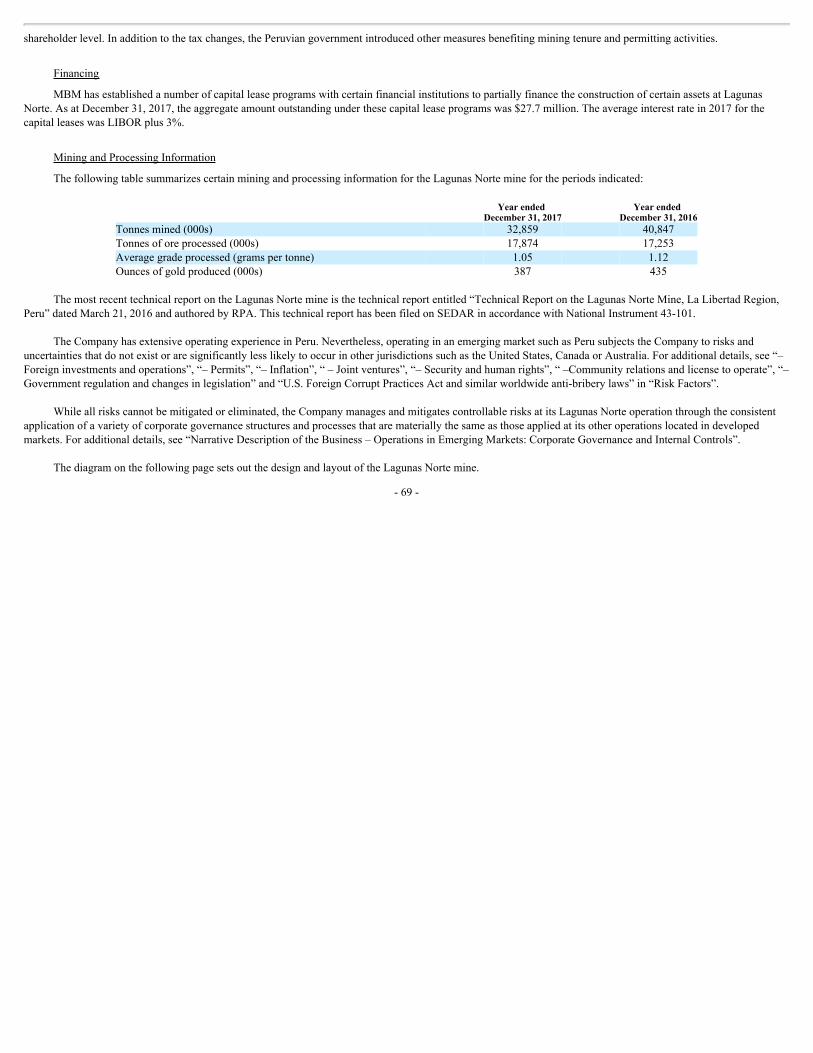
shareholderlevel.Inadditiontothetaxchanges,thePeruviangovernmentintroducedothermeasuresbenefitingminingtenureandpermittingactivities.
Financing
MBMhasestablishedanumberofcapitalleaseprogramswithcertainfinancialinstitutionstopartiallyfinancetheconstructionofcertainassetsatLagunasNorte.AsatDecember31,2017,theaggregateamountoutstandingunderthesecapitalleaseprogramswas$27.7million.Theaverageinterestratein2017forthecapitalleaseswasLIBORplus3%.
MiningandProcessingInformation
ThefollowingtablesummarizescertainminingandprocessinginformationfortheLagunasNorteminefortheperiodsindicated:
Yearended
December31,2017Yearended
December31,2016Tonnesmined(000s) 32,859 40,847Tonnesoforeprocessed(000s) 17,874 17,253Averagegradeprocessed(gramspertonne) 1.05 1.12Ouncesofgoldproduced(000s) 387 435
ThemostrecenttechnicalreportontheLagunasNortemineisthetechnicalreportentitled“TechnicalReportontheLagunasNorteMine,LaLibertadRegion,Peru”datedMarch21,2016andauthoredbyRPA.ThistechnicalreporthasbeenfiledonSEDARinaccordancewithNationalInstrument43-101.
TheCompanyhasextensiveoperatingexperienceinPeru.Nevertheless,operatinginanemergingmarketsuchasPerusubjectstheCompanytorisksanduncertaintiesthatdonotexistoraresignificantlylesslikelytooccurinotherjurisdictionssuchastheUnitedStates,CanadaorAustralia.Foradditionaldetails,see“–Foreigninvestmentsandoperations”,“–Permits”,“–Inflation”,“–Jointventures”,“–Securityandhumanrights”,“–Communityrelationsandlicensetooperate”,“–Governmentregulationandchangesinlegislation”and“U.S.ForeignCorruptPracticesActandsimilarworldwideanti-briberylaws”in“RiskFactors”.
Whileallriskscannotbemitigatedoreliminated,theCompanymanagesandmitigatescontrollablerisksatitsLagunasNorteoperationthroughtheconsistentapplicationofavarietyofcorporategovernancestructuresandprocessesthataremateriallythesameasthoseappliedatitsotheroperationslocatedindevelopedmarkets.Foradditionaldetails,see“NarrativeDescriptionoftheBusiness–OperationsinEmergingMarkets:CorporateGovernanceandInternalControls”.
ThediagramonthefollowingpagesetsoutthedesignandlayoutoftheLagunasNortemine.
-69-

-70-
VeladeroMine
GeneralInformation
ProjectDescription
TheVeladeromineisanopenpitmineusingheapleachinglocatedinSanJuanProvince,Argentina.ThemineislocatedimmediatelytothesouthofBarrick’sPascua-Lamaprojectandapproximately360kilometersbyroadnorthwestofthecityofSanJuanatelevationsofbetween3,900and4,800metersabovesealevel.Theminehasapproximately1,470employeesandanaverageof2,500contractorsbetweensummerhighseasonandwinterlowseason,includingshort-termconstructioncontractors.
TheVeladerominecomprisesthefollowingminingproperties:(i)theVeladeromininggroup,consistingofeightminingconcessionsownedbytheProvincialMiningExplorationandExploitationInstitute(“IPEEM”)andoperatedbyMAGpursuanttoapplicableprovinciallawandtheExploitationContractbetweenIPEEMandMAG(asamended)and(ii)theFiloNortemininggroup,consistingoffiveminingconcessionsownedbyMAG,whichare:UrsulinaSur;Florencia1;GabyM;Río2andRío3.TheVeladerominingpropertiescoveranareaofapproximately14,447hectares.
PursuanttotheArgentinaMiningCode,miningconcessionsdonothaveanexpirydate,however,tokeepthemingoodstanding,concessionholdersarerequiredtopaycertainannualfeesandmeetminimumcapitalinvestmentrequirements.AsofDecember31,2017,theVeladerominehascompliedwiththeserequirementswithrespecttoitscurrentminingproperties.
Barrickhasanundivided90%interestin“CampoLasTaguas,”whichencompassesthesurfacepropertyaffectedbyVeladero’sminingfacilities.Withrespecttothe10%interestof“CampoLasTaguas”ownedbythirdparties,allnecessaryeasementshavebeenobtainedforaccessoversurfaceproperty.CertainotherminerelatedfacilitiesarelocatedinCampoColangui,whichisalsoownedbyBarrick.TheArgentapitisalsolocatedattheCampoLasTaguas.Accesstothepropertyisviaacombinationofpublichighwaysandanupgradedprivategravelroad.
Sufficientsurfacerightshavebeenobtainedforcurrentoperationsattheproperty.
History
FollowingacompetitivebiddingprocesscompletedbyIPEEMin1994,ArgentinaGoldCorp.(“AGC”),aCanadianexplorationcompany,wasawardedexplorationrightstoVeladero.AGCthenenteredintoajointventureagreementwithLacMineralsLtd.(“LacMinerals”),whichwasacquiredbyBarrickashorttimelater.In1995,AGCassigneditsinteresttoMAGandfrom1996through1998theMAG/BarrickjointventuresuccessfullyexploredVeladero.Inearly1999,HomestakeacquiredAGC.TheDecember2001mergerofHomestakeandBarrickresultedinBarrickgaining100%indirectcontrolofVeladerothroughMAGandBarrickExploracionesArgentinaS.A.FullconstructionoftheVeladerominecommencedinthefourthquarterof2003andthefirstgoldpouroccurredinSeptember2005.
OnJune30,2017,Barrickcompletedthesaleofa50%indirectinterestintheVeladerominetoShandong.Shandongholdsits50%indirectinterestintheVeladerominethroughasubsidiarythatholdsa2.1547%equityinterestinMAGanda50%equityinterestinArgentinaGold(Bermuda)IILtd.(“AGBII”).AGBIIholdsa95.6906%equityinterestinMAG.Twowholly-ownedsubsidiariesofBarrickholdtheremaining2.1547%equityinterestinMAG,whileanotherwholly-ownedsubsidiaryofBarrickholdstheremaining50%equityinterestinAGBII.Followingcompletionofthesale,BarrickandShandongjointlyoperatetheVeladerominepursuanttothetermsoftheVeladeroShareholders’Agreement.
-71-
UnderthetermsoftheVeladeroShareholders’Agreement,theMAGmanagementcommittee,asMAG’sgoverningbody,isresponsibleforthemanagementoftheVeladeromineandimplementingdecisionsofBarrickandShandongwithrespecttogovernance,fundingandotheraspectsofjointoperations.TheagreementprovidesthatforsolongasBarrickandShandongeachholda50%proportionateindirectinterestinMAG,eachwillhavetherighttonominateanequalnumberofmanagersoftheMAGmanagementcommitteeandanequalnumberofthedirectorsofAGBII,withthemajorityofmattersrelatingtothebusinessandaffairsofVeladerodecidedbyamajorityvote.TotheextentnotcoveredbyavailablefreecashflowgeneratedfromtheVeladeromine,BarrickandShandongarerequiredtofundAGBIIandMAGfortheirrespectiveindirectproportionateinterestofallexpendituresrequiredunderapprovedprogramsandbudgets,andafailuretosofundcouldresultinthedilutionofthedefaultingparty’sinterest.ThesaleofaninterestbyeitherBarrickorShandongintheVeladeromineissubjecttorestrictionsincludingapreferentialpurchaserightinfavourofthenon-sellingparty.
MAGrebrandedin2017andisnowdoingbusinessasMineraAndinadelSol.
Geology
GeologicalSetting
TheVeladerodepositissituatedatthenorthendoftheElIndioGoldBelt,a120kilometerby25kilometernorth-trendingcorridorofPermiantolateMiocenevolcanicandintrusiverocks.
Mineralization
TheVeladerodepositisanoxidized,highsulfidationgold-silverdeposithostedbyvolcaniclasticsediments,tuffs,andvolcanicbrecciasrelatedtoaMiocenediatreme-domecomplex.Disseminatedpreciousmetalsmineralizationformsabroad,3kilometerlongby400meterto700meterwidetabularblanketlocalizedbetweenthe4,000and4,350meterelevations.TheVeladerodepositcomprisesfourorebodies:CuatroEsquinasinthecenter,FiloFedericointhenorth,andAmableandArgentainthesouth.MuchoftheVeladerodepositiscoveredbyupto170metersofoverburden.AvarietyofvolcanicexplosionbrecciasandtuffsaretheprincipalhostrocksattheFiloFedericoorebody,wherealterationconsistsofintensesilicification.TheAmableorebodywasexhaustedin2013andtheArgentaorebodywasexhaustedin2015.
MiningOperations
ProductionandMineLife
TheVeladeromineisanopenpittruck-and-shoveloperation.ProductioncurrentlyincludestheminingofgoldandsilverfromtheFiloFedericopit.StockpiledorefromtheArgentapit,whereminingwascompletedin2015,willbeprocessedduringtheremaininglifeofthemine.MiningiscurrentlyscheduledtocommenceattheCuatroEsquinasorebodyin2019,withinitialgoldproductionexpectedin2022.
Basedonexistingreservesandproductioncapacity,theexpectedminelifeisapproximatelyeightyears,withminingandprocessingoperationsendingby2024.MAGisinvestigatingextendingprocessingoperationsforanadditionalfouryearsthrough2028viathecontinuedleachingofstackedore.Veladeroproduced432thousandouncesofgoldin2017(Barrick’s100%sharefromJanuary1toJune30,2017and50%sharefromJuly1toDecember31,2017).
-72-
Followingcompletionofthesaleofa50%indirectinterestintheVeladerominetoShandongeffectiveJune30,2017,BarrickandShandongareeachentitledto50%ofallofthegoldproducedattheVeladeromine,basedontheirrespectiveownershipinterestsinAGBII.BarrickisentitledtoallsilverproducedattheVeladeromineuntilMarch31,2018followingwhichBarrickandShandongareeachentitledto50%ofthesilverproducedatthemine.
Processing
TheVeladerominehasavalley-fillheapleachoperationandtwo-stagecrushingprocess.Recoveredgoldissmeltedintodoréon-siteandshippedtoanoutsiderefineryforprocessingintobullion.CurrentcrushingcapacityattheVeladeromineisapproximately83,000tonnesperoperatingday.
Infrastructure,PermittingandCompliance
Veladeroselfgenerateselectricpowerusingadieselpowerplant(permanently-installeddiesel-generatorsets)withanaggregate23.8megawattcapacity,andawindturbinethatcangenerateupto2additionalmegawatts,dependingonwindspeed.
InDecember2015,thenewArgentineangovernmentremovedcertainforeignexchangeandimportcontrolrestrictions.However,animportcontrolregimeremainsinplaceand,whileBarrickcontinuestoexperiencedelaysintheimportationofgoods,supplytimesareslightlymorepredictable.
InDecember2013,theProvinceofSanJuan,Argentinaadoptedanewprovinciallawthatcreatesaregistryofapprovedlocalsupplierstobeadministeredbytheprovincialminingministry.Inordertobedesignatedasa“localsupplier,”acompanymustbebasedanddomiciledintheProvinceofSanJuan,andmustalsohire80%ofitsworkforcefromtheProvinceofSanJuan.ThelawrequiresminingcompaniesconductingexplorationorexploitationactivitiesintheProvince,suchasMAG,toallocate75%oftheirannualpurchasesorcontractstosuchlocalsuppliers.Theregistryofapprovedlocalsuppliersisnotyetoperative.MAGiscontinuingtoevaluatecertainproposedamendmentsaswellasapossiblejudicialoradministrativechallengetothislawandnotesthatwhilethelawisinplace,itiscurrentlynotenforcedduetoalackofapprovedlocalsuppliersontheregistry.
InDecember2016,anagreementwasenteredintobetweentheProvinceofSanJuan,theMiningMinistryofSanJuanandlocalindustrygroupsandunionstoprioritizeprocurementoflocalservicesandmanpower.Thesuccessfulimplementationofthisagreementcouldleadtotherevocationofthelawthatledtothecreationoftheregistryreferredtoabove.
AllmaterialpermitsandrightstoconductexistingoperationsattheVeladerominehavebeenobtainedandareingoodstanding.
Environment
Vegetationattheminesiteissparse.Theareaisconsideredtohaveasub-arid,sub-polar,mountainclimate.Duringthewintermonths,extremeweathermaycreateachallengingoperatingenvironment.Recognizingthisissue,thepotentialimpactofextremeweatherconditions,totheextentpossible,hasbeenincorporatedintothemine’soperatingplan.
TheVeladerominereceivedenvironmentalimpactstudy(“EIS”)approvalinNovember2003fromtheMiningAuthorityoftheSanJuanProvince.UnderArgentinelaw,VeladeroisrequiredtoupdatetheEISatleasteverytwoyears.UpdatestothestudywereapprovedinApril2007,March2009,November2010,April2014andDecember2016.
-73-
OnDecember30,2016,theProvincialminingauthorityapprovedthefifthEISupdate,asamended,whichassubmittedbyBarrickhadincludedarequestforapprovaloftheexpansionofthevalleyleachfacilityatVeladero(the“VLF”)bythebuildingofPhases6to9oftheVLF.EnvironmentalapprovalforPhases6to9oftheVLFexpansionwasconfirmedonMay19,2017bytheSanJuanMiningMinister,however,theconstructionofthesephasesissubjecttoadditionalpermitting,whichMAGisintheprocessofobtaining.
MAGsubmittedasixthEISupdateonFebruary25,2016,incorporatingchangestotheenvironmentalmonitoringprogramaswellasdetailsregardingtheenvironmentalimpactofthe2015cyanidereleasediscussedinfurtherdetailbelow.MAGhasalsopreparedaseventhEISupdatecoveringtheperiodfromJanuary2014toJune2017,andfileditonFebruary9,2018.
ProductionatVeladeroremainssubjecttorestrictionsthataffecttheamountofleachsolutionthatcanbeappliedtotheleachpad.ThefifthEISupdatehasmaintainedrequirementspreviouslyimposedbytheProvincialminingauthoritythatsetalevellimitfortheleachsolutionstoragearea,whichaffectstheoperationoftheleachpad.Thispermitalsorestrictstheadditionofcyanidetotheleachingprocesswhenthelevellimitsofthestorageareaareexceeded.TheserestrictionsarefactoredintoBarrick’s2018operatingguidance.
OnSeptember13,2015,avalveonaleachpadpipelineatVeladerofailed,resultinginareleaseofcyanide-bearingprocesssolutionintoanearbywaterwaythroughadiversionchannelgatethatwasopenatthetimeoftheincident.MAGnotifiedregulatoryauthoritiesofthesituation.EnvironmentalmonitoringwasconductedbyMAGandindependentthirdpartiesfollowingtheincident.TheCompanybelievesthismonitoringdemonstratesthattheincidentposednorisktohumanhealthatdownstreamcommunities.Atemporaryrestrictionontheadditionofnewcyanidetothemine’sprocessingcircuitwasliftedonSeptember24,2015,andmineoperationsreturnedtonormal.Monitoringandinspectionoftheminesitewillcontinueinaccordancewithacourtorder.
OnOctober9,2015,theProvincialminingauthorityinitiatedanadministrativesanctionprocessagainstMAGforallegedviolationsoftheminingcoderelatingtothevalvefailureandreleaseofcyanide-bearingprocesssolution.MAGsubmitteditsresponsetotheseallegationsinOctober2015andprovidedadditionalinformationinJanuary2016.OnMarch11,2016,theProvincialminingauthorityannounceditsintentiontoimposeanadministrativefineagainstMAGinconnectionwiththesolutionrelease.MAGwasformallynotifiedofthisdecisiononMarch15,2016.OnApril6,2016,MAGsoughtreconsiderationofcertainaspectsofthedecisionbutdidnotchallengetheamountoftheadministrativefine.OnApril14,2016,inaccordancewithlocalrequirements,MAGpaidtheadministrativefineofapproximately$10million(atthethen-applicableArgentineanpesotoU.S.dollarexchangerate)whiletherequestforreconsiderationwaspending.OnJuly11,2017,theSanJuangovernmentrejectedMAG’sfinaladministrativeappealofthisdecision.OnSeptember5,2017,BarrickcommencedalegalactiontocontinuechallengingcertainaspectsofthedecisionbeforetheSanJuancourts.Theseproceedingsarestillpending.MAGhasimplementedaremedialactionplanatVeladeroinresponsetotheincidentasrequiredbytheProvincialminingauthority.See“LegalMatters–LegalProceedings–Veladero–September2015ReleaseofCyanide-BearingProcessSolution–SanJuanProvincialRegulatorySanctionProceeding”.
AlsoonMarch11,2016,aSanJuanProvincialcourtlaidcriminalchargesbasedonallegednegligenceagainstninecurrentandformerMAGemployeesinconnectionwiththeincident.TheindictmentsofeightoftheninecurrentandformerMAGemployeeswereconfirmedonappealbytheSanJuanCourtofAppeals.TheseindividualshaveappealedtheindictmentstotheSanJuanSupremeCourt.OnSeptember15,2017,theSanJuanProvincialcourtproceededtotrial.ThedefendantsfiledaMotiontoDismiss,whichwasrejectedonNovember30,2017andappealedonDecember4,2017.No
-74-
confirmationordateforthetrialintheSanJuanProvincialcourthasbeenestablishedasofyet.MAGisnotapartytotheProvincialAction.See“LegalMatters–LegalProceedings–Veladero–September2015ReleaseofCyanide-BearingProcessSolution–CriminalMatters”.
OnSeptember8,2016,icerollingdowntheslopeoftheleachpaddamagedapipecarryingprocesssolution,causingsomematerialtoleavetheleachpad.Thismaterial,primarilycrushedoresaturatedwithprocesssolution,wascontainedontheminesiteandreturnedtotheleachpad.ExtensivewatermonitoringintheareaconductedbyMAGhasconfirmedthattheincidentdidnotresultinanyenvironmentalimpacts.AtemporarysuspensionofoperationsattheVeladerominewasorderedbytheProvincialminingauthorityandaProvincialcourtonSeptember15,2016andSeptember22,2016,respectively,asaresultofthisincident.OnOctober4,2016,following,amongothermatters,thecompletionofcertainurgentworksrequiredbytheProvincialminingauthorityandajudicialinspectionofthemine,theProvincialcourtliftedthesuspensionofoperationsandorderedthatminingactivitiesberesumed.See“LegalMatters–LegalProceedings–Veladero–September2016ReleaseofCrushedOreSaturatedwithProcessSolution–TemporarySuspensionofOperationsandRegulatoryInfringementProceeding”.
OnDecember15,2016,MAGwasservednoticeofalawsuitbycertainpersonswhoclaimtobelivinginJachal,ArgentinaandtobeaffectedbytheVeladeromineand,inparticular,theVLF.Inthelawsuit,whichwasfiledintheSanJuanProvincialcourt,theplaintiffshaverequestedacourtorderthatMAGceaseleachingmetalswithcyanidesolutions,mercuryandothersimilarsubstancesattheVeladeromineandreplacethatprocesswithonethatisfreeofhazardoussubstances,thatMAGimplementaclosureandremediationplanfortheVLFandsurroundingareas,andcreateacommitteetomonitorthisprocess.Thelawsuitisproceedingasanordinarycivilaction.MAGrepliedtothelawsuitonFebruary20,2017.OnMarch31,2017,theplaintiffssupplementedtheiroriginalcomplainttoallegethattheriskofenvironmentdamagehadincreasedasaresultoftheMarch28,2017releaseofgold-bearingprocesssolutiondescribedbelow.See“LegalMatters–LegalProceedings–VeladeroCyanideLeachingProcess–CivilAction”.
OnMarch28,2017,themonitoringsystematBarrick’sVeladerominedetectedaruptureofapipecarryinggold-bearingprocesssolutionontheleachpad.Thissolutionwascontainedwithintheoperatingsite;nosolutionreachedanydiversionchannelsorwatercourses.Allaffectedsoilwaspromptlyexcavatedandplacedontheleachpad.Barricknotifiedregulatoryauthoritiesofthesituation,andSanJuanprovincialauthoritiesinspectedthesiteonMarch29,2017.OnMarch29,2017,theSanJuanProvincialminingauthorityissuedaviolationnoticeagainstMAGinconnectionwiththeincidentandorderedatemporaryrestrictionontheadditionofnewcyanidetotheleachpaduntilcorrectiveactionsonthesystemwerecompleted.TheminingauthorityliftedthesuspensiononJune15,2017,followingthecompletionandinspectionofcorrectiveactions.OnMarch30,2017,theSanJuanMiningMinisterorderedthecommencementofaregulatoryinfringementproceedingagainstMAGaswellasacomprehensiveevaluationofthemine’soperationstobeconductedbyrepresentativesoftheCompanyandtheSanJuanprovincialauthorities.BarrickfileditsdefensetotheregulatoryinfringementproceedingonApril5,2017.OnSeptember14,2017,theSanJuanProvincialminingauthorityconsolidatedthisproceedingintoasingleadministrativeproceedingagainstMAG,encompassingboththeSeptember8,2016incidentdescribedaboveandtheMarch28,2017incident.OnDecember27,2017,MAGreceivednoticeofaresolutionfromtheSanJuanProvincialminingauthorityrequiringpaymentofanadministrativefineofapproximately$5.6million(calculatedattheprevailingexchangerateonDecember31,2017)encompassingboththeSeptember2016incidentandtheMarch2017incident.OnJanuary23,2018,inaccordancewithlocalrequirements,MAGpaidtheadministrativefineandfiledarequestforreconsiderationwiththeSanJuanProvincialminingauthority,whichremainspending.See“LegalMatters–LegalProceedings–Veladero–March2017ReleaseofGold-bearingProcessSolution”.
-75-
OnSeptember30,2010,theNationalLawonMinimumRequirementsfortheProtectionofGlacierswasenactedinArgentina,andcameintoforceinearlyNovember2010.Thefederallawbannednewminingexplorationandexploitationactivitiesonglaciersandinthe“peri-glacial”environment,andsubjectedongoingminingactivitiestoanenvironmentalaudit.Ifsuchauditidentifiessignificantimpactsonglaciersandperi-glacialenvironment,therelevantauthorityisempoweredtotakeaction,whichaccordingtothelegislationcouldincludethesuspensionorrelocationofminingactivity.InlateJanuary2013,theProvinceofSanJuan,whereBarrick’soperationsarelocatedinArgentina,announcedthatithadcompletedtherequiredenvironmentalaudit,whichconcludedthatVeladerodoesnotimpactglaciersorperi-glaciers.OnOctober3,2016,federalauthoritiespublishedapartialnationalinventoryofglaciers,whichincludestheareawheretheVeladeromineandPascua-Lamaprojectarelocated.TheCompanyhasanalyzedthenationalinventoryintheareawhereVeladeroandPascua-LamaarelocatedandhasconcludedthatthisinventoryisconsistentwiththeprovincialinventorythattheProvinceofSanJuanusedinconnectionwithitsJanuary2013environmentalaudit.
TheconstitutionalityofthefederalglacierlawisthesubjectofachallengebeforetheNationalSupremeCourtofArgentina,whichhasnotyetruledontheissue(foradditionalinformationaboutthismatter,see“LegalMatters–LegalProceedings–ArgentineGlacierLegislationandConstitutionalLitigation”).OnOctober27,2014,theCompanysubmitteditsresponsetoamotionbythefederalgovernmenttodismisstheconstitutionalchallengetothefederalglacierlawonstandinggrounds.Adecisiononthemotionispending.
AsatDecember31,2017,therecordedamountofestimatedfuturereclamationandclosurecoststhatwererecordedunderIFRSasdefinedbyIAS37,andthathavebeenupdatedeachreportingperiod,was$56million(asdescribedinNote2UtotheConsolidatedFinancialStatements).
ForadditionalinformationregardingBarrick’senvironmentalinitiatives,see“Environment”.
ExplorationandDrilling
During2017,atotalof1,997metersofreversecirculationdrillingwascompletedintheFedericoareainordertoimprovethereservesandresourcesmodelfortheminein2018.The2017explorationplanincludedapproximately1,564metersofdiamondcoredrillholesintheFedericophases3and4.
The2018explorationplancontemplatesatotalof2,720metersofreversecirculationdrillingtofurtherimprovethemine’sreserves.Forresources,the2018planincludes2,268metersofreversecirculationdrillingand432metersofdiamonddrillholesandresourcemodel.Inaddition,1,750metersindiamonddrillholeswillbecompletedintheFedericopitareasitetoexploreanewtargetarea.ThePecos–BrujastargetthatislocatedwithintheboundariesoftheVeladeropropertycontemplatesatotal2,450metersofdiamonddrillholes.
AsatDecember31,2017,theVeladerodrillingdatabasewascomprisedof1,331drillholestotaling340,977metersandatotalof4,195metersofchannelsamplesfromdeclines.Drillholespacingwithinmineralizedzonesisapproximately60meters.
Drillholespacingvariesacrossthedeposit.InthecentralportionsoftheAmableandFiloFedericopits,averagedrillholespacingisintherangeof35metersto40meters,increasingoutwardsto50metersto90metersspacing,andincreasingtoapproximately100metersto120metersspacingtowardtheperipheriesoftheorebodies.
-76-
RoyaltiesandTaxes
Pursuanttofederallegislationwhichimplementedlaw24.196inMay1993,andprovinciallegislationadheringtothesame,operatingminesarerequiredtopaytotheProvincialgovernmentaroyaltyofupto3%(“BocaMina”)formineralsextractedfromArgentineansoil.ThisBocaMinaisdefinedasthesalesvalueoftheextractedmineralslesscertainpermittedexpenses.Inadditiontotheabove-mentionedroyalty,underthetermsoftheExploitationContractbetweenBarrickandIPEEM,a0.75%BocaMinaroyaltyispayabletoIPEEMforthemetalsproducedfromtheVeladeroproperty,includingfromstockpiledorefromtheArgentadeposit.
Finally,andonlyfortheArgentadeposit,anadditionalroyaltyequivalentto1.5%onsalescalculatedonestimatedlife-of-pitproduction,agoldpriceof$1,500perounceandasilverpriceof$35perouncewasleviedinthefirstquarterof2012,payabletoaProvincialdevelopmenttrustfundpursuanttotheEIS.AlthoughminingofArgentaMineralReservesiscomplete,thereisstillapproximately0.8MtofArgentaoreinstockpilescontaining14,100ouncesofgold.Afinaladjustmenttothisroyaltyistobemadeonceallouncesarerecovered.
InJune2011,theProvincialgovernmentandminingcompaniesoperatinginSanJuanProvince,includingMAG,signedaresponsibleminingagreementunderwhichtheminingcompaniesagreednottodeductcertainexpenseswhencalculatingtheir3%Provincialroyalty.InOctober2011,BarrickandIPEEMagreedtomodifythecalculationofthe0.75%royaltypayabletotheIPEEMundertheExploitationContractusingthesamecriteria,thuseffectivelychangingtheroyaltycalculationto0.75%ofgrosssalesofdoré.
In2002,asanemergencymeasure,Argentinaadopteda5%exportdutyoncertainmineralproducts,includinggold.Atthetime,thedutywasdescribedas“temporary”.Veladero’sexportofgolddoréwassubjecttothis5%exportdutyfromthecommencementofoperationsin2005untilDecember20,2015,whenthedutywasrepealedbythenewArgentineangovernment.
InOctober2011,theArgentineangovernmentissuedDecree1722,whichrequirescrudeoil,naturalgas,andminingcompaniestorepatriateandconvertallforeigncurrencyrevenuesresultingfromexporttransactionsintoArgentinepesos.Abanktransactiontaxof0.6%willapplytothesubsequentconversionofpesostoforeigncurrenciesintransactionsthatwouldotherwisehavebeenexecutedusingoffshorefunds.
InSeptember2013,Argentinaadopteda10%taxondividendspaidbyArgentineanentitiestoindividualsandnon-residentinvestors.ThedividendtaxwasrepealedonJuly23,2016.OnDecember29,2017,Argentinaadopteda7%withholdingtaxondividendsfor2018and2019withtherategoingto13%for2020andonwards.Agrandfatheringruleappliesfordividendspaidoutofprofitsfrom2017andprioryearswherebythereisnowithholdingtax.
FordetailsofArgentinataxreformmeasuresenactedin2017,see“LegalMatters–GovernmentControlsandRegulations”.
-77-
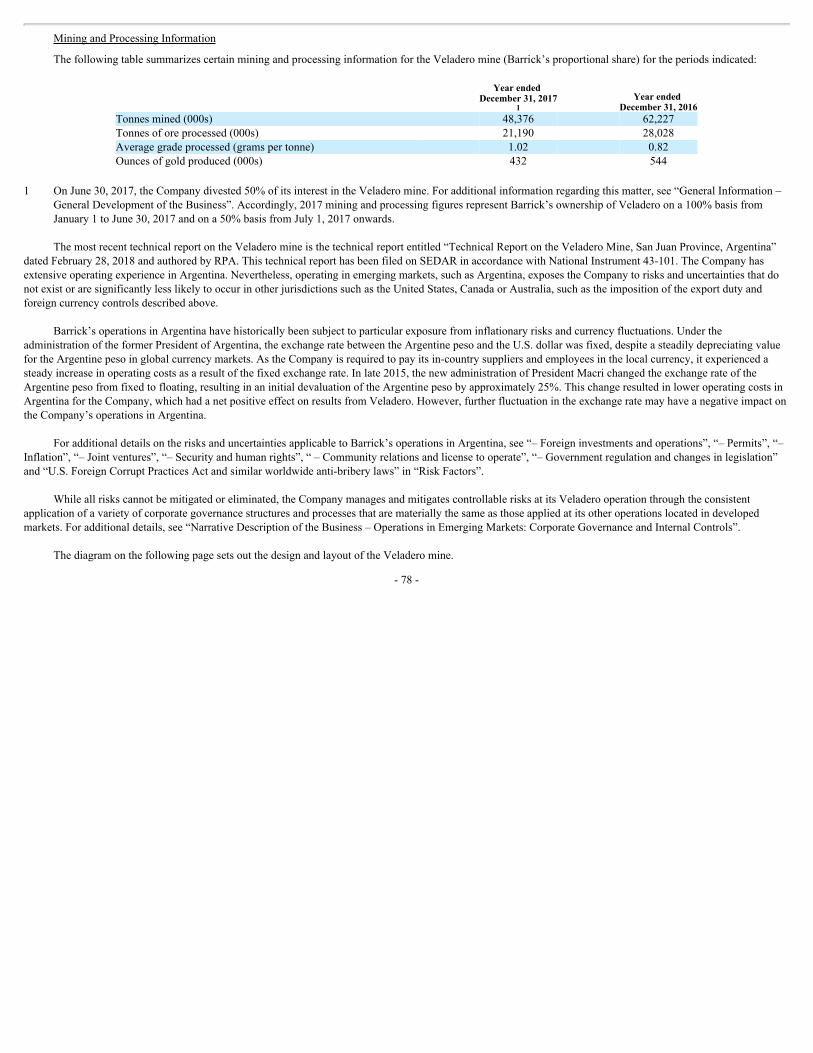
MiningandProcessingInformation
ThefollowingtablesummarizescertainminingandprocessinginformationfortheVeladeromine(Barrick’sproportionalshare)fortheperiodsindicated:
YearendedDecember31,2017
1 Yearended
December31,2016Tonnesmined(000s) 48,376 62,227Tonnesoforeprocessed(000s) 21,190 28,028Averagegradeprocessed(gramspertonne) 1.02 0.82Ouncesofgoldproduced(000s) 432 544
1 OnJune30,2017,theCompanydivested50%ofitsinterestintheVeladeromine.Foradditionalinformationregardingthismatter,see“GeneralInformation–
GeneralDevelopmentoftheBusiness”.Accordingly,2017miningandprocessingfiguresrepresentBarrick’sownershipofVeladeroona100%basisfromJanuary1toJune30,2017andona50%basisfromJuly1,2017onwards.
ThemostrecenttechnicalreportontheVeladeromineisthetechnicalreportentitled“TechnicalReportontheVeladeroMine,SanJuanProvince,Argentina”datedFebruary28,2018andauthoredbyRPA.ThistechnicalreporthasbeenfiledonSEDARinaccordancewithNationalInstrument43-101.TheCompanyhasextensiveoperatingexperienceinArgentina.Nevertheless,operatinginemergingmarkets,suchasArgentina,exposestheCompanytorisksanduncertaintiesthatdonotexistoraresignificantlylesslikelytooccurinotherjurisdictionssuchastheUnitedStates,CanadaorAustralia,suchastheimpositionoftheexportdutyandforeigncurrencycontrolsdescribedabove.
Barrick’soperationsinArgentinahavehistoricallybeensubjecttoparticularexposurefrominflationaryrisksandcurrencyfluctuations.UndertheadministrationoftheformerPresidentofArgentina,theexchangeratebetweentheArgentinepesoandtheU.S.dollarwasfixed,despiteasteadilydepreciatingvaluefortheArgentinepesoinglobalcurrencymarkets.AstheCompanyisrequiredtopayitsin-countrysuppliersandemployeesinthelocalcurrency,itexperiencedasteadyincreaseinoperatingcostsasaresultofthefixedexchangerate.Inlate2015,thenewadministrationofPresidentMacrichangedtheexchangerateoftheArgentinepesofromfixedtofloating,resultinginaninitialdevaluationoftheArgentinepesobyapproximately25%.ThischangeresultedinloweroperatingcostsinArgentinafortheCompany,whichhadanetpositiveeffectonresultsfromVeladero.However,furtherfluctuationintheexchangeratemayhaveanegativeimpactontheCompany’soperationsinArgentina.
ForadditionaldetailsontherisksanduncertaintiesapplicabletoBarrick’soperationsinArgentina,see“–Foreigninvestmentsandoperations”,“–Permits”,“–Inflation”,“–Jointventures”,“–Securityandhumanrights”,“–Communityrelationsandlicensetooperate”,“–Governmentregulationandchangesinlegislation”and“U.S.ForeignCorruptPracticesActandsimilarworldwideanti-briberylaws”in“RiskFactors”.
Whileallriskscannotbemitigatedoreliminated,theCompanymanagesandmitigatescontrollablerisksatitsVeladerooperationthroughtheconsistentapplicationofavarietyofcorporategovernancestructuresandprocessesthataremateriallythesameasthoseappliedatitsotheroperationslocatedindevelopedmarkets.Foradditionaldetails,see“NarrativeDescriptionoftheBusiness–OperationsinEmergingMarkets:CorporateGovernanceandInternalControls”.
ThediagramonthefollowingpagesetsoutthedesignandlayoutoftheVeladeromine.
-78-
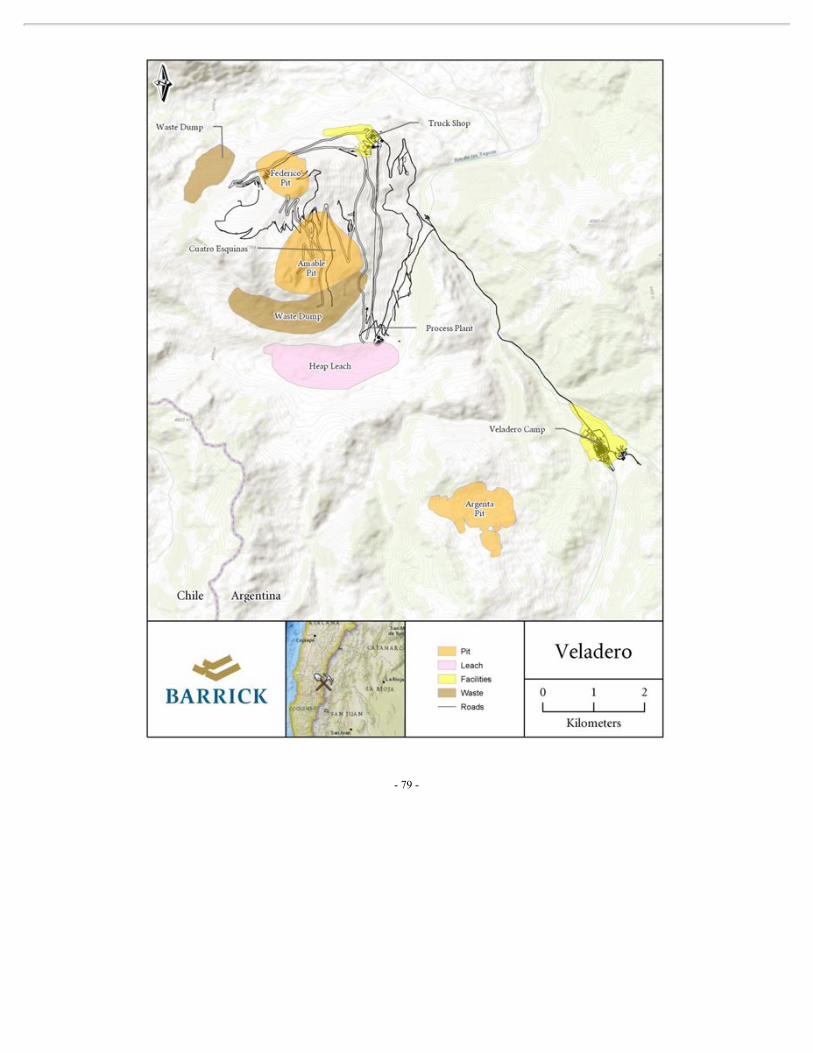
-79-
TurquoiseRidgeMine
GeneralInformation
ProjectDescription
TheTurquoiseRidgemineislocatedonBarrick’sGetchellpropertyinHumboldtCounty,Nevada,approximately40kilometersnortheastofthevillageofGolconda,Nevada,andapproximately70kilometersnortheastofthecityofWinnemucca,atanelevationofapproximately1,600meters.Theminehasapproximately470employeesand90contractors.Barrickistheoperatorand75%owneroftheminewithNewmontowningtheremaining25%.
CurrentminingactivityisfocusedontheTurquoiseRidgeundergroundmine.AsofDecember31,2017,theTurquoiseRidgepropertycoversanareaof11,993hectares,whichconsistsof8,212hectaresofunpatentedminingandmillsiteclaimsand3,781hectaresofpatented/feeland.Allminingclaimsarerenewedonanannualbasis.TurquoiseRidgeisanundergroundgoldminingoperationwithlimitedlanddisturbancethathasbeenpreviouslyapprovedandpermittedwithgoverningstateandfederalagencies.Theundergroundisaccessedviatwoshaftsthatare540metersand550metersindepth.Primaryconveyanceandhoistingisviathesecondshaftwhilethefirstshaftprovidesemergencyegressandventilation.
TurquoiseRidgeusesunderhanddrift-and-fillminingmethodsandoreistransportedtoNewmont’sTwinCreeksmillforprocessingunderthenewTMAwithNewmont.Therefractorygoldoreistreatedbypressureoxidationtechnologyandgoldisrecoveredusingconventionalcarbon-in-leachtechnology.InJanuary2018,BarrickandNewmontreachedanew,seven-yearTMAfortheprocessingofTurquoiseRidgeoreatNewmont’sTwinCreeksfacility.TheTMAsupportsplanstoexpandproductionatTurquoiseRidgebyincreasingprocessingcapacity.Itprovidesforthroughputof850thousandtonsperyearin2018and2019,risingto1.2milliontonsperyearbetween2020and2024.
Sufficientsurfacerightshavebeenobtainedforcurrentoperationsattheproperty.
History
Miningforcopper,lead,andsilverfirstbeganontheminepropertyin1883.Tungstenwasdiscoveredin1916andminedsporadicallyuntil1957.Goldwasdiscoveredin1933andGetchellMineInc.operatedthepropertyfrom1934to1945,producingatotalof788,875ouncesofgold.From1960to2009,therewassporadicproductionattheGetchellmineincludingundergroundmining,openpitminingandheapleachingofthedumps.
Adeepdrillingprogrambeganin1993intheTurquoiseRidgearea.Planningandengineeringforanewundergroundminewascompletedin1995.Bymid-1998,aproductionshaftwascompletedatadepthof1,820feetbelowthesurface.InFebruary2000,miningwassuspendedattheGetchellMainundergroundmine.DrillingcontinuedontheTurquoiseRidgeandNorthZonedeposits,butduetodepressedgoldpricestheentirepropertywasshutdowninFebruary2002.ProductionresumedinFebruary2003.
InApril2003,PlacerDomeannouncedthecommencementofconstructionandthesubsequentstart-upoftheTurquoiseRidgemine.InDecember2003,ajointventureagreementwassignedbetweenPlacerDomeandNewmontfortheTurquoiseRidgeminewherebyNewmontacquireda25%interestinthejointventureinreturnforthecontributionofcertainpre-existingroyaltiesandat-costprocessingatthenearbyTwinCreek’sSagemill.InJanuary2006,BarrickacquiredPlacerDome’s75%interestinthe
-80-
jointventureaspartofitsacquisitionofPlacerDome.Pursuanttothetermsofthejointventureagreement,BarrickistheoperatoroftheTurquoiseRidgemine.
Geology
GeologicalSetting
TheTurquoiseRidgeundergroundgoldmineofnortherncentralNevadaissituatedwithintheBasinandRangeprovince,nearthenortheastendoftheOsgoodMountains.RocksintheareaconsistofCambriantoOrdoviciancarbonates,mudstones,andbasaltsoftheValmy,ComusandPrebleFormations,MississippiantoPennsylvanianHavallahFormation,PennsylvaniantoPermianEtchartlimestone,PennsylvaniantoPermianFarrelCanyonFormationandCretaceousgranodioriteoftheOsgoodStockandrelateddikes.ThemineoccupiesthehangingwalloftheGetchellfault,whichisamajor,moderatelyeast-dippingrangefrontstructureboundingtheeastsideoftheOsgoodMountains.
Mineralization
AttheTurquoiseRidgeproperty,themajorCarlin-typegolddeposits–FootwallGetchellFault,Getchellopen-pitandtheHangingwallGetchellfault–areprimarilyhostedintheComusFormationoftheOrdovicianage.ThegoldmineralizationintheFootwalloftheGetchelliscontrolledbyfavourablestratigraphy,structuralcomplexitiesoffaultintersectionsandalongthemarginsofigneousdikes.The2.2kmlong,0.4kmwideand0.2kmdeepGetchellOpen-pitwasexcavatedfromthesurfaceprincipallyalonganddownthemineralizedNWN-SESstriking,NEdipping,Getchellfaultzone.
Currently,undergroundminingisfocusedonthegoldmineralizationhostedinthelaminatedtothinbeddedsiltylimestonesedimentaryunitsintheHangingwalloftheGetchellFault.Themineralization,muchliketheFootwallmineralization,iscontrolledbyfavourablestratigraphy,complexfaultinggeometries,adjacenttoigneousdikes,andbroadpondingbeneathathickbasaltflowinthesedimentpackage.Theundergroundmineralizedzoneinthehangingwallstartsabout0.4kmbeneaththesurfaceandextendsnorthwardfromtheshaftsfor1.8kmandcontinuestomorethanadepthof1.0kmbelowsurface.
MiningOperations
ProductionandMineLife
TheTurquoiseRidgemineisashaftaccess,mechanizedminewithanextensivesystemoframpsconnectingthenorthandsouthzonesoftheminetotheshafts.Planningandsurfacepreparationsforconstructionofthethirdshaftareunderwayandisincludedinthecurrentlifeofmineplan.ThethirdshaftwillprovideadditionalventilationandwillallowTurquoiseRidgetoincreaseminingrates.
TheprimaryminingmethodusedattheTurquoiseRidgemineisunderhanddrift-and-fill.
Basedonexistingreservesandproductioncapacity,theexpectedremainingminelifeatTurquoiseRidgeextendsto2038.TurquoiseRidgeproduced211thousandouncesofgoldin2017(Barrick’s75%share).
TurquoiseRidgeThirdShaft
InAugust2017,TurquoiseRidgebegansurfacepreparationsforthethirdshaftproject,whichwillprovideanewproductionshaftlocatedclosertothecurrentminingareas.Surfaceearthworks
-81-
preparation,longleadprocurement,finalengineeringandelectricalinfrastructureinstallationcomprisethemajorityoftheworksunderway.TheprojectwasapprovedinJanuary2018.Permittingfortheprojecthasbeencompletedandashaftsinkingcontractorhasbeenselected.
Theshaftwillbesunkconventionallytoapproximately1,000metersoftotaldepthandwillhavetheabilitytoloadskipsattwoelevations.Thefinalshaftconfigurationwillcontainoneservicecageforpersonnelandmaterialsservicedbyadoubledrumhoist,twoskipcompartmentsservicedbyadoubledrumhoistandoneMary-Anncompartmentservicedbyasingledrumhoist.Inadditiontoservicingthemine’sproductionneeds,theshaftwillprovidepowersupply,utilitiestosupportminingeffortsandnewchange/officefacilities.
Throughthedevelopmentofathirdshaft,theminehasthepotentialtoincreaseoutputtoanaverageof500thousandouncesperyear(100%basis)fromexistingreservesatanaveragecostofsalesofaround$720perounceandaverageall-insustainingcostsofroughly$630perounce.Theprojectwouldrequiretotalcapitalexpendituresofapproximately$300to$325million(100%basis)forundergrounddevelopmentandshaftconstruction.SurfacepreparationactivitieswillcontinuethroughQ2of2019,withshaftsinkingactivitiescommencingimmediatelyafter.Initialproductionisexpectedtobeginin2022,andsustainedproductionisexpectedtobeginin2023.
Processing
TurquoiseRidgeorehasbeenprocessedatNewmont’sTwinCreeksoperationsinceestablishingajointventureagreementbetweenthepreviousownerofTurquoiseRidge(nowawhollyownedsubsidiaryofBarrick)andNewmontonJanuary1,2004.Initially,orewassoldbyTurquoiseRidgetoNewmontandsubsequentlyprocessedatTwinCreeks;however,thiswaschangedtoatollmillingagreementonJuly1,2006.InJanuary2018,BarrickandNewmontsignedthenew,seven-yearTMAfortheprocessingofTurquoiseRidgeoreatNewmont’sTwinCreeksmill.TheTMAsupportsplanstoexpandproductionatTurquoiseRidgebyincreasingprocessingcapacity.Itprovidesforthroughputof850,000tonsperyearin2018and2019,risingto1.2milliontonsperyearbetween2020and2024.
Infrastructure,PermittingandCompliance
TheTurquoiseRidgemine’spowerrequirementsarepurchasedoutsidethelocalprovidersystemunderopenaccessprovisionswherebypowerispurchasedontheopenmarketorfromtheWestern102plant(whichisownedandoperatedbyBarrick),whicheverischeaper.Powerrequirementsin2017were8.5MW.
Minewaterisdivertedtosumpsandthentomainpumpingstationsforsettlingandpumpingtothesurface.Waterisrecycledforreuseinthemineandexcesswateristreatedinthewatertreatmentplantbeforedischargetoinfiltrationponds.Whenwaterisnon-compliant,itisdivertedtotheTurquoiseRidgeimpoundmentandeliminatedbyevaporationinthesummermonths.
AllmaterialpermitsandrightstoconductexistingoperationsattheTurquoiseRidgeminehavebeenobtainedandareingoodstanding.
Environment
Theclimateissemi-aridandhaslittleimpactonmineoperations.Vegetationisdominatedbylowdenseshrubsandsagebushmixedwithsparsenativegrassesandlowfloweringplants.
-82-
In2017,allactivitiesattheTurquoiseRidgeminewere,andcontinuetobe,incomplianceinallmaterialrespectswithapplicablecorporatestandardsandenvironmentalregulations.
AsatDecember31,2017,therecordedamountofestimatedfuturereclamationandclosurecoststhatwererecordedunderIFRSasdefinedbyIAS37,andthathavebeenupdatedeachreportingperiodwas$20.3million(asdescribedinNote2UtotheConsolidatedFinancialStatements).Inconnectionwiththereclamationoftheminearea,Barrickhasprovidedthefinancialsecurityasrequiredbygovernmentalauthorities.
ForadditionalinformationregardingBarrick’senvironmentalinitiatives,see“Environment”.
ExplorationandDrilling
Threemineexplorationprogramsweredrilledin2017.Atotalof7,940metersofdiamondcore,in17holes,weredrilledfromundergroundandsurfaceexplorationdrillingprograms.
TheNorthEastTurquoiseRidgeCorridorprogram,whichwasdrilledontheeasternsideoftheundergroundresource,targetedmineralizationextendingnortheastoutontheTurquoiseRidgeCorridorfaultstructures.TheNorthEastTurquoiseRidgeCorridorprogramfolloweduponsuccessesoftheLowerMainBullionDeclineprogramthattargetedtheproximalportionsofTRCorridorfaultstructuresin2016.
Asecondundergroundprogramdrilledconceptualtargetsattheintersectionsofhigh-anglenorth-eaststrikingfaultsandthelow-angleGetchellFault.
Thethirdprogramtargeteddown-dipmineralizationoftheFootwallPond.Two1,700-meterholesweredrilledfromsurfaceanddiscoveredmineralizationbelowtheNorthPillowbasalt,about350metersfromtheexistinginfrastructure.Twowedgeholesfollowedupthisinterceptinlate2017.
In2018,oneprogramwillcontinuetodeveloppotentialnewresourcesfromtheexistingsurfacedrillpadtofollowupon2017explorationsuccesses.AnotherminingexplorationprogramwillbeinfillingsignificantinterceptsfromanewExplorationdriftatthebottomofthemine.ThreeotherprogramswillbeundertakentoexploreupgradingexistingresourcesalongtheGetchellFaultbothfromthesurfaceandunderground.
Inall,atotalofapproximately32,400metersofexplorationanddelineationdrillingisplannedatTurquoiseRidgein2018.
RoyaltiesandTaxes
TherearenoroyaltiesassociatedwiththeTurquoiseRidgemine.TheStateofNevadaimposesa5%netproceedstaxonthevalueofallmineralsseveredintheState.Thistaxiscalculatedandpaidbasedonaprescribednetincomeformulawhichisdifferentfrombookincome.
-83-

MiningandProcessingInformation
ThefollowingtablesummarizescertainminingandprocessinginformationfortheTurquoiseRidgemine(Barrick’s75%share)fortheperiodindicated:
YearendedDecember31,2017
1
YearendedDecember31,2016
1Tonnesmined(000s) 643 598Tonnesoforeprocessed(000s)2 472 523Averagegradeprocessed(gramspertonne)2 15.01 17.04Ouncesofgoldproduced(000s) 211 266
1 Barrick’sproportionalshare.2 Oreisprocessedoff-siteatNewmont’sTwinCreeksmillpursuanttotheTMA.
ThemostrecenttechnicalreportontheTurquoiseRidgemineisthetechnicalreportentitled“TechnicalReportontheTurquoiseRidgeMine,StateofNevada,U.S.A.”datedMarch19,2018andauthoredbyRPA.ThistechnicalreporthasbeenfiledonSEDARinaccordancewithNationalInstrument43-101.
ThemaponthefollowingpagesetsoutthedesignandlayoutoftheTurquoiseRidgemine.
-84-
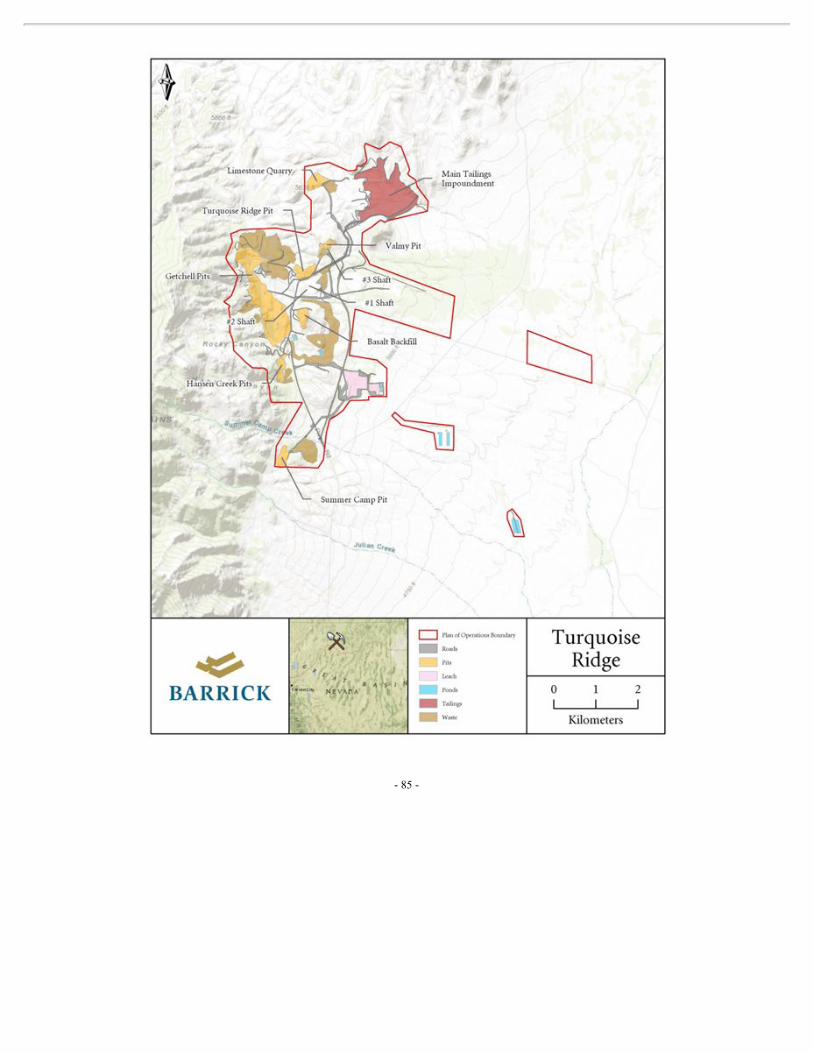
-85-
EXPLORATIONANDEVALUATIONS
Barrickhashistoricallygrownitsreservebasethroughacombinationofdiscoveryandacquisitionsinvolvinganexplorationstrategythatincludesdistrictdevelopmentprograms,whichfocusonexplorationinandarounditsoperatingproperties,aswellasearly-stageexplorationprograms.TheCompany’sstrategyistomaintainamixofprojectsatdifferentstagesintheexplorationanddevelopmentsequence.In2017,Barrickspentatotalof$195milliononitsexplorationandevaluationactivities(2016:$154million),comprisedof$151millionofexplorationexpenditures($129millionexpensed;$22millioncapitalized)and$44millionofexpensedevaluationexpenditures.Ofthetotal$151millionspentonexplorationin2017,approximately$72millionwasspentinNorthAmerica,approximately$41millionwasspentinSouthAmerica,approximately$13millionwasspentinAustraliaPacificandapproximately$25millionwasspentbyAcacia.
Barrick’sexplorationstrategyfocuseson:findingnewdiscoveries;replacingandaddingreservesandresourcesatBarrick’sexistingoperationsanddevelopmentprojects;andidentifyinganddeliveringexplorationupsidefollowingacquisitions.ExplorationisdirectedfromBarrick’sheadofficeinTorontoandisconductedthroughitsregionalexplorationofficesandsitesaroundtheworld.Barrick’sexplorationsuccesscanbelargelyattributedtothefactthatBarrickhasextensivelandpositionsonmanyoftheworld’smostprospectivemineraldistrictsandastructuredanddisciplinedapproachtoexplorationwhichprovidesaframeworkforhowregionsandprojectsareselected,howtheyareresourcedandmanaged,andhowexplorationactivitiesareperformed.TheCompanyhasmaintainedastrongcommitmenttoexplorationbyrecognizingthevaluetotheCompanythroughexplorationandevaluationssuccess.HighlightsoftheCompany’sgreenfieldexplorationprogramfor2018includetheFourmiletarget,adjacenttoitsGoldrushdiscoveryinNevada,andtheFronteraDistrictontheborderofArgentinaandChile.
Barrick’spartnershipsarethoughtfulandstrategicinnature.TheCompanyhascompletedsixnewpartnershipsintheAmericasin2017.ForBarrick’sexplorationpartnershipstherearetwoprimaryobjectives.ThefirstistoaugmentBarrick’soperatingpresenceincoreregions.Thesecondistofocusonemergingnewdistrictplaysthathavethepotentialtoyieldmultipleneweconomicdiscoveries.Barrickseeksoutpartnerswithtalent,credibility,integrity,proventrackrecordsandastrongcommitmenttocommunitiesandtheenvironment.Inaddition,BarrickandShandonghaveformedaworkinggrouptoexplorethejointdevelopmentofthePascua-Lamadeposit,andwillevaluateadditionalinvestmentopportunitiesonthehighlyprospectiveElIndiogoldbeltontheborderofArgentinaandChile.
In2018,Barrickexpectstoincurapproximately$185to$225millionofexplorationandevaluationexpenditures.Approximately80%oftheCompany’stotalexplorationbudgetisallocatedtotheAmericas.Barrick’sexplorationprogramsstrikeabalancebetweenhigh-qualitybrownfieldprojects,greenfieldexploration,andemergingdiscoveriesthathavethepotentialtobecomeprofitablemines.BarrickcontinuestotakeadvantageofexistinginfrastructureandadvancekeygrowthprojectssuchasGoldrush(discussedinfurtherdetailbelow)andCortezHillsDeepSouth(see“MaterialProperties–CortezProperty”).Theseexpendituresareexpectedtoprovideanear-termreturnoninvestmentbyaddingtoand/orupgradingBarrick’sreserveandresourcebase,andinsomecasesmaypositivelyimpactproductionandminelife.
In2018,Barrickexpectstoincurapproximately$140to$180millionofprojectexpensescomparedto$181millionin2017.Projectexpensesfor2018includethePascua-LamastudytoevaluateandpermitthedevelopmentofanundergroundmineatPascua-Lama,accessedfromtheArgentineansideoftheproject,andongoingsitecostswhichincludethecostofcareandmaintenanceassociatedwithwatermanagementandmonitoringactivitiesandotherholdingcosts.2018projectexpensesalsoincludethere-scopingstudyoftheDonlinGoldproject,costsassociatedwithregionaldigitalprojectsandadditional
-86-
costsfortheNorteAbiertoproject(formerlytheCerroCasaleproject).Barrick’skeyprojects,whichareatvariousstagesofdevelopment,aredescribedbelow.
Goldrush
BarrickhascompletedafeasibilitystudyatGoldrush,whichislocatedsixkilometerssoutheastoftheCortezHillsmineand24kilometerssoutheastofthePipelinemineon100%Barrick-ownedpropertyinNevada.Thestudycontemplatesanestimatedinitialcapitalinvestmentofapproximately$1billiontoaccessapproximately1.5millionouncesofgoldclassifiedasprovenandprobablereservesand9.4millionouncesofgoldclassifiedasmeasuredandindicatedresourcesasofyear-end2017.Forfurtherinformation,see“NarrativeDescriptionoftheBusiness–MineralReservesandMineralResources”.
Averageannualproductionforthefirstfullfiveyearsofoperationisexpectedtobeapproximately500,000ouncesofgold.Goldrushisexpectedtohaveaminelifeof21years,withfirstproductionasearlyas2021,andsustainedproductionin2023.Thefeasibilitystudyanticipatesacostofsalesof$750perounce,andaverageall-insustainingcostsof$640perounce.Barrickhasidentifiedopportunitiestofurtherreduceoperatingcostswhileadvancingthefeasibilitystudy.“All-insustainingcosts”isanon-GAAPfinancialperformancemeasure.Foranexplanationofall-insustainingcostsperouncereferto“Non-GAAPFinancialMeasures–All-insustainingcostsperounce,All-incostsperounce,Cashcostsperounce,All-insustainingcostsperpoundandC1cashcostsperpound”atpages150to164ofthisAnnualInformationForm.
During2016,Barrickobtainedthenecessarypermitsfortheconstructionoftwinexplorationdeclines.Thiswillenablefurtherdrillingoftheorebodyinsupportofthefeasibilitystudy,includingtheconversionofmeasuredandindicatedresourcestoprovenandprobablereserves.Thetwindeclineportalaccesssitehasbeenclearedandworkontheportalpadstartedinthesecondquarterof2017andwillbecompleteinthefirstquarterof2018,whichwillprovideaccesstotheorebodyatdepthtoenablefurtherexplorationdrilling.Theseexplorationdeclinescanbeconvertedintoproductiondeclinesinthefuture.
TheGoldrushdepositremainsopeninanumberofdirections.Inaddition,BarrickcontinuestodrillatthehighlyprospectiveFourmiletarget,justnorthoftheGoldrushdiscovery.
Alturas
InApril2015,BarrickannouncedanewgolddiscoveryknownasAlturas,locatedintheAndeanregionofChileapproximately30kilometerssouthoftheformerElIndiomine.Alturasispartofalargemineralizedsystemwhichextendswellbeyondthelimitsofthecurrentdrillingarea.Atyear-end2017,Barrickreportedaninferredresourceof6.8millionouncesofgoldatAlturas.Forfurtherinformation,see“NarrativeDescriptionoftheBusiness–MineralReservesandMineralResources”.In2017,Barrickcompletedascoping-levelstudyforaconventionalopenpitheapleachoperationatAlturas,whichfelljustshortoftheCompany’shurdlerate.Insupportofprojectoptimizationefforts,theCompany’sdrillingprogramsin2018willfocusonincreasingthegrade,definingadditionalshallowmineralizationandincreasingthepotentialmineresourcetonnageofAlturas.ThisdepositisgeologicallysimilartothenearbyVeladeromineinArgentina.
Pascua-Lama
Pascua-LamaislocatedontheborderofChileandArgentina,intheFronteradistrictatanelevationof3,800to5,200meters,approximately10kilometersfromBarrick’sVeladeromine.TheChileanpartofthedeposit,whichisatanelevationofapproximately4,300to5,250metersabovesealevel,was
-87-
acquiredbyBarrickthroughitsacquisitionofLacMineralsin1994.WithrespecttotheportionoftheprojectlocatedinArgentina,Barrickacquiredcertainoftheminingconcessionsthatformpartoftheprojectin1995andtheremainingprojectminingconcessionswereacquiredfromMineraS.A.in1997.ThePascua-Lamaprojecthascross-borderminingoperationsthataregrantedbyaminingtreatybetweenChileandArgentina.TheinitialPascua-Lamaprojectwasdesignedasalarge-scaleopenpitoperationcenteredatanelevationof4,800meterswithprocessingfacilitieshavinganinitialdesignedthroughputcapacityof45,000tonnesperday.
ConstructiononthePascua-LamaprojectbeganinOctober2009.Duringthefourthquarterof2013,Barrickannouncedthetemporarysuspensionofconstruction,exceptforthoseactivitiesrequiredforenvironmentalandregulatorycompliance.TheCompanyhadpreviouslysuspendedconstructionactivitiesontheChileansideoftheproject,exceptforthoseactivitiesdeemednecessaryforenvironmentalprotection,duringthesecondquarterof2013asaresultoftheissuanceofapreliminaryinjunction.ThesuspensionofconstructioninChileandArgentinapostponedandreducednear-termcashoutlays,allowingBarricktoproceedwithdevelopmentattheappropriatetime.Theramp-downwascompletedonscheduleandbudgetinmid-2014.Inlate2015,thePascua-LamaprojectbeganimplementingatemporarysuspensionplanassubmittedtotheminingauthoritiesinChileandArgentina.OnMarch13,2017,theChileanSupremeCourtvacatedthetemporarysuspensionplan,rulingthatadditionalinformationfromChile’senvironmentalregulatorwasrequired,andorderingtheChileanminingauthoritytoissueanewresolutionontheplanafterreceivingsuchinformation(see“LegalMatters–LegalProceedings–Pascua-Lama–ConstitutionalProtectionAction”formoreinformationaboutthismatter).InJanuary2018,BarrickreceivedarevisedresolutionfromtheSMAorderingtheclosureofexistinginfrastructureontheChileansideofthePascua-Lamaproject.
TheCompanyisevaluatinganundergroundblock-cavingoperationatPascua-Lamawithaninitialprocessingcapacityof13,000to15,000tonnesperday,withthepotentialtoexpandto30,000tonnesperdayinthefuture.TheprojectwouldutilizetheexistingprocessplantandtailingsfacilityontheArgentineansideoftheborder,constructionofwhichisalreadywell-advanced.Aswitchtoundergroundminingaddressesanumberofcommunityconcernsbysignificantlyreducingtheoverallenvironmentalfootprintoftheproject,ascomparedtoanopenpitoperation.
InNovember2017,BarrickinitiatedatargeteddrillprogramtoimproveorebodyknowledgeontheArgentineansideofthedeposit,wherefurtherdatawasrequiredtovalidateundergrounddevelopmentplansandmetallurgy.AsofMarch19,2018,alltwelveholeshavebeencompleted.PreparationsforpermittinganundergroundoperationareunderwayinArgentinaandChile,includingclosureofexistingsurfacefacilitiesinChile.
InlightoftheSMAordertoclosesurfacefacilitiesinChile(see“NarrativeDescriptionoftheBusiness–ReportableOperatingSegments–Pascua-LamaProject”andLegalMatters–LegalProceedings–Pascua-Lama–SMARegulatorySanctions”)andcurrentplanstoevaluateanundergroundmine,BarrickhasreclassifiedPascua-Lama’sprovenandprobablegoldreservesofapproximately14millionounces,whichwerebasedonanopenpitmineplan,asmeasuredandindicatedresources.
Atpresent,thePascua-LamaprojectdoesnotmeetBarrick’sinvestmentcriteria.TheCompany’sintentionistoseekapartnerforthedevelopmentoftheproject.BarrickandShandonghaveformedaworkinggrouptoexplorethepossiblejointdevelopmentofthePascua-Lamadeposit,andwillevaluateadditionalinvestmentopportunitiesonthehighlyprospectiveElIndiogoldbeltontheborderofArgentinaandChile.
Formoreinformationaboutthesematters,seethefollowingsectionsof“LegalMatters–LegalProceedings”,“–Pascua-Lama–SMARegulatorySanctions”,“–Pascua-Lama–Constitutional
-88-
ProtectionAction”and“–Pascua-Lama–WaterQualityReview”.Certainadditionalpermitsandauthorizationswillberequiredfortheconstruction,operationand/orclosureofprojectfacilitiesatPascua-Lamainbothcountries.
In2009,BarrickenteredintotheSilverPurchaseAgreementwithWheatonPreciousMetalsInternationalLtd.(“WheatonPreciousMetals”),awhollyownedsubsidiaryofWheatonPreciousMetalsCorp.,wherebyBarricksoldtheequivalentof25%ofthelifeofminePascua-LamasilverproductionfromthelaterofJanuary1,2014orcompletionofprojectconstruction,and100%ofsilverproductionfromtheLagunasNorte,PierinaandVeladerominesuntilthattime.BarrickinitiatedtheclosureofthePierinamineinAugust2013anddoesnotanticipatesignificantsilverproductionfromthatmineinfutureyears.Undertheagreement,theCompanywasentitledtoanupfrontcashpaymentof$625millionpayableoverthreeyearsfromthedateoftheagreement,aswellasongoingpaymentsincashofthelesserof$3.90(subjecttoanannualinflationadjustmentof1%startingthreeyearsafterprojectcompletionatPascua-Lama)andtheprevailingmarketpriceforeachounceofsilverdeliveredundertheagreement.Barrickreceivedthefinalcashinstallmentpaymentof$137.5millionin2012.BarrickhadprovidedWheatonPreciousMetalswithacompletionguarantee,requiringtheCompanytocompletePascua-Lamatoatleast75%designcapacitybyDecember31,2015.In2014,WheatonPreciousMetalsagreedtoextendthecompletiondateforPascua-LamatoJune30,2020andwillcontinuetoreceivesilverproductionfromtheLagunasNorte,Pierina(nowinclosure)andVeladerominesuntilMarch31,2018.IftherequirementsofthecompletionguaranteehavenotbeensatisfiedbyJune30,2020,theagreementmaybeterminatedbyWheatonPreciousMetals,inwhichcaseWheatonPreciousMetalswillbeentitledtothereturnoftheupfrontcashconsiderationpaidlessacreditforsilverdelivereduptothedateofthatevent.AsatDecember31,2017,theremainingcashobligationwas$262million.
AsofDecember31,2017,thePascua-Lamaprojectreceived$484millioninvalueaddedtax(“VAT”)refundsinChilerelatingtothedevelopmentoftheChileansideoftheproject.Underthecurrentarrangement,thisamountplus$313millionofinterestmustberepaidiftheprojectdoesnotevidenceexportsforanamountof$3,538millionwithinatermthatexpiresonDecember31,2026.ThetermsofthecurrentVATarrangementinChileareapplicabletoeitheranopenpitoranundergroundminedesign.NoamountshavebeenrecordedforanypotentialliabilityrelatedtoVATrefundsinChile.AsofDecember31,2017,thePascua-Lamaprojectrecorded$221millioninVATrecoverableinArgentinarelatingtothedevelopmentoftheArgentinesideoftheproject.TheseamountsmaynotberecoverableiftheprojectdoesnotenterintoproductionandaresubjecttodevaluationriskastheamountsarerecoverableinArgentinepesos.
Asaresultofthereclassificationofapproximately14millionouncesofprovenandprobablereservestomeasuredandindicatedresourcesasdescribedabove,Pascua-Lamahadnoprovenandprobablegoldreservesasofyear-end2017andmeasuredandindicatedgoldresourcesof21.3millionounces.Forfurtherinformation,see“NarrativeDescriptionoftheBusiness–MineralReservesandMineralResources”.
DonlinGold
DonlinGoldcontainslarge,longlifemineralresourcesinastablejurisdiction,hassignificantleveragetothepriceofgold,andthereforerepresentsavaluablelong-termopportunityfortheCompany.
TheDonlinGoldprojectisalarge,predominantlyrefractorygolddepositlocatedinSouthwesternAlaska.InDecember2007,BarrickenteredintoanagreementwithNOVAGOLDResourcesInc.toformDonlinGoldLLC.ajointlyownedlimitedliabilitycompanyona50/50basis,toadvancetheproject.In2012,theNationalEnvironmentalPolicyActpermittingprocesscommenced,withtheU.S.ArmyCorpsofEngineers(“USACE”)astheleadagency.Currentactivities,bywhichBarrickmaintainsand
-89-
enhancestheoptionvalueofthisprojectatamodestcost,arefocusedonpermitting,communityoutreachandworkforcedevelopment.DonlinGoldhasalifeofminemineralleasewiththeCalistaCorporation,anAlaskaNativeregionalcorporation,andalifeofminesurfaceuseagreementwithTheKuskokwimCorporation,anAlaskavillagecorporation,fortheproject.In2015,DonlinGoldcontinuedtoadvancekeypermitsfortheproject,andinNovember2015,USACEreleasedaDraftEnvironmentalImpactStatement(“DEIS”)forpublicreviewandcomment.ThecommentperiodfortheDEISendedinMay2016.TheCompanyexpectsthefinalEIStobepublishedbyUSACEinearly2018,withaRecordofDecisionexpectedinthesecondhalfoftheyear.StateofAlaskapermittingisproceedinginparallelwiththefederalprocess.AstheDonlinGoldprojectcontinuestoadvancethroughthepermittingprocess,Barrickisalsoworkingwithitspartneronstrategiestofurtheroptimizetheproject.Thisincludesevaluatingalternativedevelopmentscenarioswiththepotentialtolowercapitalintensity,aswellasincorporatinginnovation,automation,andotheropportunitiestoimproveoveralleconomics.ThiswillprovidetheCompanywiththeoptiontomakeconstructiondecisionsinthefutureshouldinvestmentconditionswarrant.Insupportofthis,adrillingprogramof7,040meterswascompletedin2017tostrengthenunderstandingoftargetmineralizedzones.
Atyear-end2017,DonlinGold,ona50%basis,hadapproximately19.5millionouncesofmeasuredandindicatedgoldresources.Forfurtherinformation,see“NarrativeDescriptionoftheBusiness–MineralReservesandMineralResources”.
NorteAbierto(formerlyCerroCasale)
TheNorteAbiertoproject(formerlyknownastheCerroCasaleproject)containslarge,longlifemineralresourcesinastablejurisdiction,hassignificantleveragetothepriceofgold,andthereforerepresentsavaluablelong-termopportunityfortheCompany.
AcquiredinconnectionwithBarrick’sacquisitionofArizonaStarin2007,theCerroCasaledepositisalarge,undevelopedgoldandcopperdepositlocatedintheMaricungadistrictofRegionIIIinChile,145kmsoutheastofCopiapo.OnJune9,2017,BarrickcompletedatransactionwithGoldcorptoformanewpartnershipatCerroCasale.Pursuanttothetransaction,Goldcorpacquireda25%interestinCerroCasalefromBarrick.Thetransaction,coupledwiththeconcurrentpurchasebyGoldcorpofKinross’s25%interestinCerroCasale,resultedinBarrickandGoldcorpeachholdinga50%interestinthejointoperations.
Asconsiderationforthe25percentinterestacquiredfromBarrick,GoldcorpisrequiredtofundBarrick’sfirst$260millionofexpendituresontheprojectandmustspendanequivalentamountonitsownbehalfforatotalprojectinvestmentcommitmentof$520million.Undertheagreement,Goldcorpmustspendaminimumof$60millioninthetwo-yearperiodfollowingclosingofthetransaction,andthen$80millionineachsuccessivetwo-yearperiod.Theoutstandingfundingcommitmentaccruesinterestatanannualrateof4.75%.IntheeventthatGoldcorpdoesnotspendtheminimumamount,50%ofanyshortfallwillbepaiddirectlytoBarrickincash.
Inaddition,inconnectionwiththetransaction,GoldcorpwasalsorequiredtofundNorteAbierto’sacquisitionofa100%interestintheadjacentQuebradaSecapropertyfromKinrossuponclosing.Uponaconstructiondecision,GoldcorpisrequiredtopayBarrick$40millionincashandBarrickwillreceivea1.25%royaltyon25%ofthegrossrevenuesderivedfrommetalproductionfrombothCerroCasaleandQuebradaSeca.
Inconnectionwiththetransaction,GoldcorpalsoacquiredExeterResourceCorporation,whosesoleassetistheCaspicheproject,located10kilometersnorthofCerroCasale.TheCaspicheprojectwascontributedtothejointventureand50%oftheacquisitioncostsincurredbyGoldcorpwasdeductedfrom
-90-
the$260millionexpenditurecommitmentdescribedabove.Movingforward,thejointventurewillbereferredtoasNorteAbierto,whichincludestheCerroCasale,CaspicheandLucianodeposits.
ApprovaloftheenvironmentalimpactassessmentforCerroCasalewasreceivedinJanuary2013fromtheServiciodeEvaluaciónAmbiental,theenvironmentalauthorityofnorthernChile(foradditionalinformationregardingtheproject’senvironmentalpermits,see“LegalMatters–LegalProceedings–CerroCasale”).BarrickandGoldcorpareevaluatingwaysinwhichtheNorteAbiertodepositscanbeprofitablydevelopedbythejointventure.Amongotherthings,thejointventurehasinitiatedanexplorationprogramonthesedepositswhichincludesvalidatingthemodelsofthesetwogeologicaldeposits,aninitial16,000meterdiamonddrillprogramthatwascommencedinlate2017toincreasegeologicalconfidenceofbothdeposits,anddataevaluationoffoursatellitetargetswhichdemonstrateexplorationpotential.Workin2018willincludetrade-offandengineeringstudiesonpower,water,miningmethodsandmetallurgy,aswellasongoingstakeholderengagementandenvironmentalbaselinemonitoring.
TheCerroCasaledeposit,ona50%basis,hadapproximately11.6millionouncesofprovenandprobablegoldreservesand2,890millionpoundsofcontainedcopperwithinreportedgoldreserves,aswellasapproximately1.7millionouncesofmeasuredandindicatedresources,asatyear-end2017.TheCaspichedeposit,ona50%basis,hadapproximately11.6millionouncesofmeasuredandindicatedresourcesasatyear-end2017.Forfurtherinformation,see“NarrativeDescriptionoftheBusiness–MineralReservesandMineralResources”.
ENVIRONMENT
TheCompany’smining,explorationanddevelopmentactivitiesaresubjecttovariouslevelsoffederal,provincialorstate,andlocallawsandregulationsrelatingtotheprotectionoftheenvironment,includingrequirementsforclosureandreclamationofminingproperties(see“LegalMatters–GovernmentControlsandRegulations”).Barrick’sinvestmentinenvironmentalmanagementsystemsisaimedateliminatingormitigatingenvironmentalrisksastheyareidentified.ThegovernanceaspectsofBarrick’ssystemsaredesignedtoinformmanagementearlyenoughtorespondtorisksastheyarise.
Barrickhasapolicyofconductingperiodicenvironmentalandclosurereviewsofitsbusinessactivities,onaregularandscheduledbasisinordertoevaluatecompliancewith:applicablelawsandregulations;permitandlicenserequirements;companypoliciesandmanagementstandardsincludingguidelinesandprocedures;andadoptedcodesofpractice.TheCorporateResponsibilityCommitteeofBarrick’sBoardofDirectorsreviewstheCompany’senvironmentalpoliciesandprogramsandoverseesBarrick’senvironmentalperformance.Inaddition,allBarrickfacilitieshavestaffandsystemsinplacetomanageBarrick’sregulatoryandpermitobligations.
Barrick’spoliciesandstandardsconformtointernationalandindustrystandards.TenofBarrick’soperatingminesarecurrentlycertifiedundertheISO14001standardforenvironmentalmanagement.Barrickhasadoptedanenvironmentalpolicythatmandatesfullcompliancewithsiteobligationsandprovidesforacultureofcontinualimprovement.BarrickhasalsoadoptedspecificperformancestandardsapplicabletoitsEnvironmentalManagementSystem,EnvironmentalIncidentReportingandInvestigation,Biodiversity,WaterConservation,MineClosure,andTailingsandHeapLeachManagement.Theseperformancestandardsarecontinuallyreviewedandrevisedtoreflectexperienceandbestindustrypractices.
AsofMarch19,2018,overhalfofBarrick-operatedmineswerezerodischargesiteswheremostwaterisrecycledorre-used,therebyreducingBarrick’sdrawonlocalwatersupplies.BecauseofthestrategicimportanceofwatermanagementtoBarrick’soperations,in2016,theCompanycreatedthenew
-91-
positionofVice-PresidentofWaterManagementtofocusonimprovingsites’understandingoftheirwater-relatedrisksandopportunities.In2017,Barrickwasrecognizedasaleaderindisclosureofwater-relatedinformationbytheCDPWaterDisclosureprogram.
Eachyear,BarrickissuesaResponsibilityReportthatoutlinesitsenvironmental,healthandsafetyandsocialresponsibilityperformancefortheyear.Barrickisdeliberatelyworkingtowardsimprovingtransparencyintoitsenvironmentalstewardshipactivities.Forexample,in2016,thePascua-LamaprojectbecamethefirstBarrickoperationtoprovidewaterqualitymonitoringresultsdirectlytothepublicthroughanonlinewebsite.Through2018,Barrickwillcontinuetodevelopsystemsandtoolsthatwillprovideadditionaltransparencyintoitsoperations.
Climatechange,includingshiftsintemperatureandprecipitationandmorefrequentsevereweatherevents,willaffecttheminingindustryinarangeofpossibleways.Volatileclimaticconditionscanaffectthestabilityandeffectivenessofinfrastructureandequipment;potentiallyimpactenvironmentalprotectionandsiteclosurepractices;leadtochangesintheregulatoryenvironment,includingincreasedfinancialexposuretocarbontaxregimes;andpotentiallyimpactthestabilityandcostofwaterandenergysupplies.BarrickthereforeviewsclimatechangeasaCompany,communityandglobalconcern.In2017,Barrickdevelopedaclimatechangestrategyalignedwithitsoverallbusinessstrategytogrowfreecashflowpersharethroughsafeandresponsiblemining.
Barrick’sclimatechangestrategyhasthreepillars:understandandmitigatetherisksassociatedwithclimatechange;reducetheCompany’simpactonclimatechange;andimprovetheCompany’sdisclosureonclimatechange.
In2017,Barrickperformedaclimatechangeriskassessment,usingBarrick’sstandardriskmanagementframework.Barrickassessedrisksandopportunitiesacrossbothpotentialtransition(e.g.,regulatory,policy,reputational)andphysical(e.g.,extremeclimateevents)aspectsofclimatechange.Barrickhasidentifiedthreesalientclimate-relatedrisksandopportunitiesforitsbusiness:anincreaseinextendeddurationextremeprecipitationevents;anincreaseinclimatechangeregulationstolimitgreenhousegas(“GHG”)emissions;andincreasedglobalinvestmentininnovationandlowcarbontechnologies.Theassessmentalsoincludedareviewofthecurrentmitigationandcontrolsassociatedwitheachriskandidentifiedareaswhichmayneedfurtherstrengtheningtoreducerisk.
TheCompanyalsoanalyzeditscurrentandforecastedGHGemissionstodevelopanambitiousbutrealisticgoaltoreduceBarrick’sGHGemissions.Miningisanenergy-intensivebusiness,andtheCompanyunderstandstheimportantlinkbetweenenergyuseandGHGemissions.Byeffectivelymanagingenergyuse,Barrickcanreduceitsdrawfromlocalenergygrids,reduceitsGHGemissions,achievemoreefficientproductionandsavedirectminingcosts.BarrickhassetagoaltokeepitscurrentGHGemissionsflatintheshorttermandistargetinga30%reductioninGHGemissionsby2030,froma2016baselineof3.5MTcarbondioxideequivalentemitted.
In2017,theCompanycommittedtosupportingthevoluntaryrecommendationsoftheindustry-ledFinancialStabilityBoardTaskForceonClimate-relatedFinancialDisclosures(“TCFD”).TheTCFDrecommendationsareconsideredthenewbenchmarkfordisclosureofclimate-relatedrisksandopportunities,andBarrickwastheonlyCanadianminingcompanytomakethispubliccommitment.Barrickaimstoimplementthefullrecommendationsoverthenexttwoyears.
Governanceoverclimate-relatedrisksandopportunitiesisprovidedatboththeBoardandmanagementlevel.TheCompany’sCorporateResponsibilityCommitteemeetsatleastquarterlyandisresponsibleforoverseeingBarrick’spolicies,programsandperformancerelatingtotheenvironment,includingclimatechange.TheRiskCommitteeassiststheBoardinoverseeingtheCompany’s
-92-
managementofenterpriserisksaswellastheimplementationofpoliciesandstandardsformonitoringandmitigatingsuchrisks.ClimatechangeisbuiltintoBarrick’sformalriskmanagementprocess,outputsofwhicharereviewedbytheRiskCommittee.TheAuditCommitteereviewstheCompany’sapproachtoclimatechangeinthecontextofBarrick’sdisclosures.
Atthemanagementlevel,Barrick’sClimateChangeCommittee,comprisedofseniormembersoftheCompany’smanagementteam,providesstrategicoversightandgovernanceoverkeydecisionsrelatedtoBarrick’sClimateChangeStrategy,suchasoverseeingclimatechangeriskandopportunityassessments,monitoringprogressagainstGHGemissionstargetsandprovidingguidanceonexternaldisclosures.
FurthertothespecificfocusoftheClimateChangeCommittee,theweeklyBusinessPlanReviewallowsfordiscussionofopportunitiesandrisksthatmayhelporhindertheCompanyfromachievingitsobjectives,includingclimate-relatedrisks(e.g.,springsnowmelts,hurricanes,floodingandmudslides).
ConsistentwithBarrick’sgoaltominimizetheenvironmentalandsocialimpactsofitsprojectsandoperations,theCompanydevelopscomprehensiveclosureandreclamationplansaspartofitsinitialprojectplanninganddesign.Ifitacquiresapropertythatlacksaclosureplan,Barrickrequirespreparationofaclosureplan.TheCompanyperiodicallyreviewsandupdatesclosureplanstoaccountforadditionalknowledgeacquiredinrespectofapropertyorforchangesinapplicablelawsorregulations.TheCompanyhasestimatedfuturesitereclamationandclosureobligations,whichitbelieveswillmeetcurrentregulatoryrequirements.SeeNotes2Uand27oftheNotestotheConsolidatedFinancialStatements.
TheCompany’soperatingfacilitieshavebeendesignedtomitigateenvironmentalimpactsandBarrickstaffworktocontinuallyimproveitsenvironmentalmanagementprograms.Theoperationshaveprocesses,procedures,orfacilitiesinplacetomanagesubstancesthathavethepotentialtobeharmfultotheenvironment.Tohelppreventandcontrolspillsandprotectwaterquality,Barrickutilizesmultiplelevelsofspillcontainmentproceduresandroutineinspectionandmonitoringofitsfacilities.Environmentalincidentscanoccurdespitetheseprecautions.Forexample,inSeptember2015,avalveonaleachpadpipelineattheVeladerominefailed,resultinginareleaseofcyanide-bearingprocesssolutionintoanearbywaterwaythroughadiversionchannelgatethatwasopenatthetimeoftheincident.InSeptember2016,fallingicedamagedapipecarryingprocesssolutionintheleachpadarea,causingsomematerialtoleavetheleachpad.InMarch2017,themonitoringsystemattheVeladerominedetectedaruptureofapipecarryinggold-bearingprocesssolutionontheleachpad;however,allsolutionwascontainedwithintheoperatingsiteandnosolutionreachedanydiversionchannelsorwatercourses.See“MaterialProperties–VeladeroMine”formoreinformationaboutthesematters.
TheCompanyalsohasvariousprogramstore-useandconservewateratitsoperations.Inordertomitigatetheimpactofdustproducedbyitsoperations,Barrickusesseveraldifferentdustsuppressiontechniquesatitsproperties.TheCompanyalsoinstallsairpollutioncontrolsonairpollutionpointsources,suchasroasterandautoclaveexhauststacks,thatmeetorexceedapplicablelegalstandards.TheCompanyhasalsoimplementedsafeguardsatitspropertiesthataredesignedtoprotectwildlifeinthesurroundingareas.Suchsafeguardsincludefencingandnettingorothercoveringsofpondsandtanks,birdhazingtechniques,suchasmechanizedscarecrowsornoisemakers,andtheestablishmentofalternatewatersourcesandprogramstoimprovewildlifehabitat.
CertainoftheCompany’soperatingandclosedpropertieshandleoreorrockwiththepotentialtoleachacidity,metalsanddissolvedsalts(“AcidRockDrainageMetalLeaching”)andhencepotentiallycontaminatewater.Otheroperatingandclosedpropertieslackthispotential,butstillpresentthepotentialforleachingofdissolvedsalts,suchassulfates,ormetalloids,suchasarsenic,bywaterthatmightrunoffoftheproperty(“NeutralMineDrainage”).TheCompanyhasimplementedprogramstomanagethe
-93-
handlingoforeandrocktoreducethepotentialforcontaminationofsurfaceorgroundwaterbyeitherAcidRockDrainageMetalLeachingorNeutralMineDrainage.Suchproceduresincludesegregationorsubmergenceofrockwithpotentialforleaching,containmentsystemsforthecollectionandtreatmentofdrainageandreclamationandclosurestepsdesignedtominimizewaterinfiltrationandoxygenflux.Wherenecessary,theCompanyinstallsandoperateswatertreatmentfacilitiestomanagethequalityofwaterdischargedintotheenvironment.
ManyoftheCompany’soperatingpropertiesusecyanide.Thosefacilitiesaredesignedandconstructedtopreventprocesssolutionsfrombeingreleasedtosurfacewaterorgroundwater.Thosefacilitiesincludeleakdetectionsystemsandhavetheabilitytocollectandtreatseepagethatmayoccur.Thetailingsstoragefacilitiesarecontrolledandprocesspondsareeithercovered,nettedoradditionaldeterrentsareusedtopreventaccess.InSeptember2005,theCompanybecameasignatorytotheInternationalCyanideManagementCode(the“Code”),whichisadministeredbytheInternationalCyanideManagementInstitute(the“ICMI”).TheICMIisanindependentbodythatwasestablishedbyamulti-stakeholdergroupundertheauspicesoftheUnitedNationsEnvironmentalProgramme.TheCodeestablishesoperatingstandardsformanufacturers,transportersandminesandprovidesforthird-partycertificationoffacilities’compliancewiththeCode.UndertheCode,eachoftheminesthatusescyanidemustreceiveathirdpartycertificationinspection.AllBarrick-operatedminesthatusecyanidehaveachievedcertificationorre-certificationundertheCode.
CertainoftheCompany’soperationsproducemercuryasaby-productoforeprocessedatthosesites.Themercuryiscapturedateachofthesesitesbyspeciallydesignedoperatingequipmentandmercuryemissionscontroldevices.TheCompanyiscommittedtotheoperationofproventechnologyforcontrollingsourcesofmercuryemissions.Site-specificmanagementproceduresformercuryhandling,monitoring,andtransportationexistateachoftheoperationsthatproducemercuryasaby-product.Further,employeesreceivetraininginthesafeuseandpropermanagementofcyanide,mercuryandotherhazardousmaterials.ConsistentwithU.S.law,BarrickceasedtheexportofelementalmercuryfromU.S.facilitiesinJanuary2013.Barrickcomplieswithallapplicableregulatoryrequirementsfortemporarystorageofmercuryinthejurisdictionswhereitoperates.TheCompanyhasdevelopedgeneralmercurystorageguidelinestoestablishenvironmentallysoundpracticesfortemporaryon-sitestorage,whereallowed.
UndertheComprehensiveEnvironmentalResponse,Compensation,andLiabilityActof1980(“CERCLA”)anditsstatelawequivalents,presentorpastownersofapropertymaybeheldjointlyandseverallyliableforcleanupcostsorforcedtoundertakeremedialactionsinresponsetounpermittedreleasesofhazardoussubstancesatsuchproperty,inadditionto,amongotherpotentialconsequences,potentialliabilitytogovernmentalentitiesforthecostofdamagestonaturalresources,whichmaybesubstantial.Thesesubjectpropertiesarereferredtoas“superfund”sites.ThereisachancethatourcurrentorlegacyoperationsintheU.S.couldbedesignatedasasuperfundsiteinthefuture,exposingBarricktopotentialliabilityunderCERCLA.
Seethedisclosureunder“MaterialProperties”abovefordetailsaboutspecificenvironmentalmattersandestimatedfuturereclamationandclosurecostsapplicabletoBarrick’smaterialproperties.
LEGALMATTERS
GovernmentControlsandRegulations
TheCompany’sbusinessissubjecttovariouslevelsandtypesofgovernmentcontrolsandregulations,whicharesupplementedandrevisedfromtimetotime.Accordingly,theCompanymonitorspoliticalandeconomicdevelopmentsinthejurisdictionsinwhichitdoesormaycarryonbusiness,as
-94-
wellaschangesinregulationtowhichBarrickissubject.SetoutbelowisasummaryofpotentiallymaterialdevelopmentsrelatedtogovernmentcontrolsandregulationsthatmayaffectBarrickoritsproperties.
IntheUnitedStates,certainofBarrick’smineralreservesandoperationsoccuronunpatentedlodeminingclaimsandmillsitesthatareonfederallandssubjecttofederalminingandotherpubliclandlaws.Changesinsuchlaws,orregulationspromulgatedundersuchlaws,couldaffectminedevelopment,expansion,andclosureprojects.Significantincreasesinregulatoryobligationscouldraisecompliancecostswithrespecttoexploration,minedevelopment,mineoperationsandclosureandcouldpreventordelaycertainoperationsbytheCompany.ChangestominingandpubliclandslawsareoftenproposedintheU.S.Congress,andchangestotheregulationspromulgatedundersuchlawsareoftenproposedbyfederalregulatoryagencies.Inaddition,non-governmentalorganizationsoftenlitigatetoinfluencetheapplicationofexistingregulations.
InNovember2009,acoalitionofenvironmentalgroupsfiledalawsuitintheU.S.DistrictCourtfortheDistrictofColumbiabychallengingregulationspromulgatedunderthefederalmininglaw:Earthworks,etal.vs.U.S.DepartmentoftheInterior.Thelawsuitseekstoimposedifferentrulesonmill-siteclaimsandunpatentedlodeclaimsandseeksaninjunctionofallpermittingofminesonfederallandsuntilnewrulesarepromulgated.Anunfavourableoutcomeinthatlitigationcouldresultinchangestothemininglaw.Barrickintervenedinsupportofthefederalagencydefendantsinthelawsuit.Cross-motionsforsummaryjudgmenthavebeenfiledandbriefed,andoralargumentwasconductedonOctober27,2017.Adecisioncouldbeissuedatanytime.
InSeptember2015,theBLMamendedlanduseplansgoverningmanagementonfederallandsacrossthewesternstatestoimposeadditionalrestrictionsandmitigationobligationsondevelopmentactivitiesoccurringtoprotecthabitatofthegreatersagegrouse.TheaffectedlandsincludelandsinnorthernNevadawheretheCompanydevelopsandoperatesmines.InanticipationoftheBLMdecision,inMarch2015,theCompanynegotiatedaseparateagreementwiththeBLMandotheragencies,theBarrickNevadaSage-GrouseBankEnablingAgreement(the“Agreement”),whichspecifiesamethodologyformeasuringtheimpactofminedevelopmentactivitiesonsagegrousehabitatandoffsettingmitigationmeasures.TheAgreementallowstheCompanytobankmitigationcreditsinanticipationoffutureminedevelopmentandavoidssomeoftherestrictionsinthelanduseplanamendments.TheAgreementappliestosome,butnotallofthesagegrousehabitatwheredevelopmentactivitiesmayoccur.ThoselandsnotcoveredbytheAgreementwillbesubjecttotheamendedlanduseplans.ImplementationoftheAgreementmayresultinadditionalcostsforsomeoperations.AccesstoordevelopmentofsomelandsnotcoveredbytheAgreementmayberestricted.
InChile,onMarch6,2015,theenvironmentalministerandmembersoftheChileanlegislaturereachedanagreementtoproposeanewglacierprotectionlawinthecurrentlegislativesessionthat,amongotherthings,wouldrecognizecertaintypesofglaciersinthatcountryasenvironmentalreservesandprohibitcommercialactivityinthevicinityofthosereserves.Undertheproposedlaw,miningprojectswillbesubjecttonewpermitting,monitoringandotherregulatoryrequirementsrelatingtoglaciers.Itiscontemplatedthatcertainelementsoftheproposedlaw,includingtherequirementtomonitorandmitigateenvironmentaldamagetoglaciers,couldapplyretroactivelytocertainexistingenvironmentalapprovals.TheproposedlawisstillunderdiscussionintheChileanlegislature.BarrickismonitoringthelegislativeprocessandevaluatingthepotentialimpactoftheproposedlegislationonthePascua-Lamaproject.
InSeptember2014,theChileangovernmentenactedcertaintaxreformmeasures.Underthenewregime,certainChileantaxpayerswereabletoelectbetweenanattributedprofitsorapartiallyintegratedtwo-tiertaxsystem.Fortaxpayerssubjecttotheattributedprofitssystem,a35%Chileanincometaxrate
-95-

appliesonprofitswithnoadditionaltaxondistributionsofprofits.Fortaxpayerssubjecttothepartiallyintegratedtwo-tiersystem,thefirsttiercorporateincometaxrateis27%.Underthissystem,anadditionaltaxappliesondistributionsofprofits,whichcouldresultinamaximumaggregateeffectivetaxrateof35%or44.45%dependingonthedomicileofthecompany’sshareholders.Chile’sDL600foreigninvestmentregimewaseliminatedasofDecember31,2016.However,thecurrentDL600contractsfortheZaldívarjointventure,NorteAbiertoprojectandPascua-Lamaprojectremainineffect.
InArgentina,onDecember29,2017,congressapprovedtaxreformmeasuresthatareeffectivefrom2018.Akeychangeistheintroductionofatwo-tierincometaxregimethatdecreasesthecorporateincometaxratefrom35%to30%andincreasesthewithholdingtaxondividendsfrom0%to7%for2018and2019.From2020andonwards,thecorporateincometaxratewillbe25%andwithholdingtaxwillbe13%.Agrandfatheringruleappliesfordividendspaidoutofprofitsfrom2017andprioryearswherebythereisnowithholdingtax.Additionally,the2:1debttoequityratiowithrespecttothedeductibilityofinteresthasbeeneliminatedandthereisaninterestdeductionlimitationof30%ofearningsbeforeinterest,taxes,depreciationandamortization.Excessinterestnotdeductedcanbecarriedforwardfor5years.TheimpactofthesereformmeasuresontheVeladeromineisbeinganalyzed.
InZambia,thetaxationframeworkeffectiveonJuly1,2015includedtheintroductionofa30%corporateincometax,a50%oftaxableincomelimitationontheutilizationoftaxlosscarry-forwardanda15%variableprofitstax.Whilethe9%mineralroyaltyratewasineffect,theZambianCabinetinFebruary2016announcedtheapprovaloffurtherrevisionstotheminingtaxlaws.EffectiveasofJune1,2016,thegovernmentintroducedmineralroyaltytaxratesforcopperasfollows:4%atcopperpricesbelow$2.04perpound,5%atcopperpricesbetween$2.04perpoundand$2.72perpound,and6%atcopperpricesof$2.72perpoundandabove.AlsoeffectiveasofJune1,2016,theZambiangovernmenteliminatedthevariableprofitstax,withtheeffectthatincomefromminingoperationswillnowbetaxedatthe30%corporateincometaxrate.
TheminingtaxesassessedtotheLumwanaMinehavecontradictedtheDevelopmentAgreementthatwasfinalizedbetweenLumwanaMiningCompanyLimitedandtheGovernmentofZambiaonDecember16,2005.Basedonlocalandinternationallegaladvice,theCompanybelievesthatthecompensationrightsforbreachofthe10-yearstabilityperiodgrantedundertheDevelopmentAgreementprevailoverthehistoricalchangestotheZambianmineralroyaltyandtaxregime.In2015,theCompanybegantotakestepstopreserveitsrightsundertheDevelopmentAgreementandstartedtoengageinformaldiscussionswiththegovernmenttoredresshistoricaltaxissuesrelatingtotheDevelopmentAgreement.
OnMarch3,2017,theTanzanianMinistryofEnergyandMineralsimposedtheBan,abanonexportsofgold/copperconcentrate,followingadirectivemadebythePresidentoftheUnitedRepublicofTanzania.In2016,gold/copperconcentrateexportsamountedtoapproximately30%ofAcacia’srevenues.Acaciaceasedexportsofgold/copperconcentrate,andisseekingtohavetheBanliftedthroughtheappropriategovernmentchannels.See“–LegalProceedings–AcaciaMiningplc–ConcentrateExportBanandRelatedDisputes”below.
InPapuaNewGuinea,arevisedadditionalprofitstax(“APT”)wasenactedinJanuary2017thatappliestoallresourceprojectsinthatcountry.Thegovernment’sobjectiveistosimplifytheadministrationoftheAPTandtoensurealevelplayingfieldacrosstheentireresourcesector.ThehurdleratebeyondwhichtherevisedAPTappliesisaflatnominalrateof15%andtheAPTrateis30%.TherevisedAPTbecameeffectiveonJanuary1,2017.ThegovernmenthasrecentlyconfirmedthatexistingresourceprojectscantakeintoaccountexpenditurefromprioryearsforpurposesofcalculatingtheAPT.Whiletheprecisedetailsarenotyetknown,itisBarrick’sexpectationthatnomaterialAPTliabilityshouldariseinconnectionwithBarrick’sinterestinthePorgeramine.
-96-

IntheDominicanRepublicasecondamendmenttotheSLAbecameeffectiveonOctober5,2013andhasresultedinadditionalandacceleratedtaxrevenuestotheDominicangovernment.ThesecondamendmenttotheSLAincludestheestablishmentofagraduatedminimumtax,whichwillbeadjustedupordownbasedonfuturemetalprices.During2017,PVDCandtheDominicangovernmentreachedanagreementontheupdatedfinancialmodeltoresetthegraduatedminimumtaxratesforthethree-yearperiodfrom2017through2019.
OnDecember22,2017taxreformwasenactedintheUnitedStates.Thesignificantchangesinclude:(i)areductionfrom35%to21%inthecorporateincometaxratefortaxyearsbeginningafterDecember31,2017;(ii)arepealofthecorporateAlternativeMinimumTax(“AMT”)fortaxyearsbeginningafterDecember31,2017;and(iii)amandatoryone-timedeemedrepatriationofearningsandprofitsofspecifiedforeigncorporationseffectiveDecember31,2017thateffectivelyresultsinarepatriationtollchargeof15.5%forliquidassetsand8%fornon-liquidassetswithtollchargepayableininstalmentsover8years(8%forthefirst5years,15%inyear6,20%inyear7and25%inyear8).
Theone-timerepatriationtollchargeisestimatedat$228millionfor2017andisoffsetbyAMTcreditsintheamountof$88million,foranetchargeof$140millionpayableovereightyears,asdiscussedabove.Theimpactofthetaxreformmaydifferfromcurrentestimatesduetochangesininterpretationsandassumptions,andadditionallegislationandguidance.
FordetailsaboutspecificregulatoryinitiativesapplicabletoeachofBarrick’smaterialproperties,seethedisclosureunder“MaterialProperties”above.
Barrickisunabletopredictwhatadditionallegislationorrevisionsmaybeproposedthatmightaffectitsbusinessorwhenanysuchproposals,ifenacted,willbecomeeffective.Suchchanges,however,couldrequireincreasedcapitalandoperatingexpendituresandcouldpreventordelaycertainoperationsbytheCompany.
Variouslevelsofgovernmentcontrolsandregulationsaddress,amongotherthings,theenvironmentalimpactofminingandmineralprocessingoperations.Withrespecttotheregulationofminingandprocessing,legislationandregulationsinvariousjurisdictionsestablishperformancestandards,airandwaterqualityemissionstandardsandotherdesignoroperationalrequirementsforvariouscomponentsofoperations,includinghealthandsafetystandards.Legislationandregulationsalsoestablishrequirementsfordecommissioning,reclamationandrehabilitationofminingpropertiesfollowingthecessationofoperations,andmayrequirethatsomeformerminingpropertiesbemanagedforlongperiodsoftime(see“Environment”).Inaddition,incertainjurisdictions,theCompanyissubjecttoforeigninvestmentcontrolsandregulationsgoverningitsabilitytoremitearningsabroad.
LegalProceedings
SetoutbelowisasummaryofpotentiallymateriallegalandadministrativeproceedingstowhichBarrickisaparty.
U.S. Shareholder Class Action
OnMay10,2017,ShepardBroadfoot,apurportedshareholderofBarrick,filedsuitintheUnitedStatesDistrictCourtfortheSouthernDistrictofNewYork(“SDNY”)againsttheCompany,KelvinDushnisky,CatherineRaw,RichardWilliamsandJorgePalmes.ThecomplaintassertedclaimsagainstthedefendantsarisingfromallegedlyfalseandmisleadingstatementsconcerningproductionestimatesandenvironmentalrisksattheVeladeromine,andseeksunspecifieddamagesandotherrelief.OnMay19,2017,asecondandsubstantiallyidenticalpurportedclassactioncomplaintwasfiledintheSDNY.
-97-

OnOctober4,2017,theCourtconsolidatedtheactionsandappointedtheleadplaintiffandleadcounsel.AbriefingschedulehasbeensetbytheCourt,andtheplaintiff’samendedconsolidatedcomplaintwasfiledonDecember4,2017.TheCompanyfiledamotiontodismissthecomplaintonFebruary2,2018.BriefingonthemotiontodismisswillbecompletedbyApril18,2018.TheCompanybelievesthattheclaimsarewithoutmeritandintendstodefendthemvigorously.
Canadian Securities Class Actions
BetweenAprilandSeptember2014,eightproposedclassactionswerecommencedagainstBarrickinCanadainconnectionwiththePascua-Lamaproject.FouroftheproceedingswerecommencedinOntario,twowerecommencedinAlberta,onewascommencedinSaskatchewan,andonewascommencedinQuebec.TheCanadianproceedingsallegedthattheCompanymadefalseandmisleadingstatementstotheinvestingpublicrelating(amongotherthings)tothecostofthePascua-Lamaproject,theamountoftimeitwouldtakebeforeproductioncommencedattheproject,andtheenvironmentalrisksoftheproject,aswellasallegedinternalcontrolfailures.
ThefirstOntarioandAlbertaactionswerecommencedbyStatementofClaimonApril15and17,2014,respectively.Thesamelawfirmactsfortheplaintiffsinthesetwoproceedings,andtheStatementsofClaimwerelargelyidentical.AaronRegent,JamieSokalskyandAmmarAl-Joundiwerealsonamedasdefendantsinthetwoactions.Bothactionspurportedtobeonbehalfofanyonewho,duringtheperiodfromMay7,2009toMay23,2013,purchasedBarricksecuritiesinCanada.Bothactionssought$4.3billioningeneraldamagesand$350millioninspecialdamagesforallegedmisrepresentationsinBarrick’spublicdisclosure.ThefirstOntarioactionwassubsequentlyconsolidatedwiththefourthOntarioaction,asdiscussedbelow.ThefirstAlbertaactionwasdiscontinuedbyplaintiffs’counselonJune26,2015.
ThesecondOntarioactionwascommencedonApril24,2014.AaronRegent,JamieSokalsky,AmmarAl-JoundiandPeterKinverwerealsonamedasdefendants.FollowingaSeptember8,2014amendmenttotheStatementofClaim,thisactionpurportedtobeonbehalfofanyonewhoacquiredBarricksecuritiesduringtheperiodfromOctober29,2010toOctober30,2013,andsought$3billionindamagesforallegedmisrepresentationsinBarrick’spublicdisclosure.TheamendedclaimalsoreflectedtheadditionofalawfirmthatpreviouslyactedascounselinathirdOntarioaction,whichwascommencedbyNoticeofActiononApril28,2014andincludedsimilarallegationsbutwasneverservedorpursued.Asaresultoftheoutcomeofthecarriagemotionandappealsdescribedbelow,thesecondOntarioactionhasnowbeenstayed.
TheQuebecactionwascommencedonApril30,2014.AaronRegent,JamieSokalsky,AmmarAl-JoundiandPeterKinverwerealsonamedasdefendants.ThisactionpurportedtobeonbehalfofanypersonwhoresidesinQuebecandacquiredBarricksecuritiesduringtheperiodfromMay7,2009toNovember1,2013.TheactionseeksunspecifieddamagesforallegedmisrepresentationsinBarrick’spublicdisclosure.
ThesecondAlbertaactionwascommencedonMay23,2014.AaronRegent,JamieSokalsky,AmmarAl-JoundiandPeterKinverwerealsonamedasdefendants.ThisactionpurportedtobeonbehalfofanypersonwhoacquiredBarricksecuritiesduringtheperiodfromMay7,2009toNovember1,2013,andsought$6billionindamagesforallegedmisrepresentationsinBarrick’spublicdisclosure.TheactionwasdismissedonconsentonJune19,2017.
TheSaskatchewanactionwascommencedbyStatementofClaimonMay26,2014.AaronRegent,JamieSokalsky,AmmarAl-JoundiandPeterKinverwerealsonamedasdefendants.ThisactionpurportedtobeonbehalfofanypersonwhoacquiredBarricksecuritiesduringtheperiodfrom
-98-
May7,2009toNovember1,2013,andsought$6billionindamagesforallegedmisrepresentationsinBarrick’spublicdisclosure.Theactionwasdiscontinuedbyplaintiffs’counselonDecember19,2016.
ThefourthOntarioactionwascommencedonSeptember5,2014.AaronRegent,JamieSokalsky,AmmarAl-JoundiandPeterKinverwerealsonamedasdefendants.ThisactionpurportedtobeonbehalfofanypersonwhoacquiredBarricksecuritiesduringtheperiodfromMay7,2009toNovember1,2013inCanada,andseeks$3billionindamagesplusanunspecifiedamountforallegedmisrepresentationsinBarrick’spublicdisclosure.TheStatementofClaimwasamendedonOctober20,2014,toincludetwoadditionallawfirms,oneofwhichwasactingascounselinthefirstOntarioactionreferredtoaboveandtheotherofwhichnolongerexists.InJanuary2018,plaintiffs’counseldeliveredaconsolidatedstatementofclaiminthisaction.
InNovember2014,anOntariocourtheardamotiontodeterminewhichofthecompetingcounselgroupswouldtaketheleadintheOntariolitigation.ThecourtissuedadecisioninDecember2014infavourofthecounselgroupthatcommencedthefirstandfourthOntarioactions,whichhavebeenconsolidatedinasingleaction.Thelowercourt’sdecisionwassubsequentlyaffirmedbytheDivisionalCourtinMay2015andtheCourtofAppealforOntarioinJuly2016followingappealsbythelosingcounselgroup.ThelosingcounselgroupsoughtleavetoappealtotheSupremeCourtofCanadabutlaterdiscontinuedtheapplicationafterreachinganagreementwiththecounselgroupthatcommencedthefirstandfourthOntarioactions.
TheproposedrepresentativeplaintiffsintheQuebecandOntarioactionshavebroughtmotionsseeking:(i)leavetoproceedwithstatutorymisrepresentationclaimspursuanttoprovincialsecuritieslegislation;and(ii)orderscertifyingtheactionsasclassactions.ItisexpectedthattheQuebecmotionswillbeheardinlateFebruary2019,whilethemotionforleavetoproceedintheOntarioactionwillbeheardinearlyApril2019(withthecertificationmotiontobeheardconcurrentlyorshortlythereafter).
BarrickintendstovigorouslydefendalloftheproposedCanadiansecuritiesclassactions.
Pascua-Lama – SMA Regulatory Sanctions
InMay2013,CompañíaMineraNevada(“CMN”),Barrick’sChileansubsidiarythatholdstheChileanportionofthePascua-Lamaproject,receivedaResolution(the“OriginalResolution”)fromSMA,Chile’senvironmentalregulator,thatrequiresCMNtocompletethewatermanagementsystemfortheprojectinaccordancewiththeproject’senvironmentalpermitbeforeresumingconstructionactivitiesinChile.TheOriginalResolutionalsorequiredCMNtopayanadministrativefineofapproximately$16millionfordeviationsfromcertainrequirementsoftheproject’sChileanenvironmentalapproval,includingaseriesofreportingrequirementsandinstancesofnon-compliancerelatedtotheproject’swatermanagementsystem.CMNpaidtheadministrativefineinMay2013.
InJune2013,CMNbeganengineeringstudiestoreviewtheproject’swatermanagementsysteminaccordancewiththeOriginalResolution.Thestudiesweresuspendedinthesecondhalfof2015asaresultofCMN’sdecisiontofileatemporaryandpartialclosureplanfortheproject(formoreinformationaboutthisplan,see“–Pascua-Lama–ConstitutionalProtectionAction”below).Thereviewoftheproject’swatermanagementsystemmayrequireanewenvironmentalapprovalandtheconstructionofadditionalwatermanagementfacilities.
InJune2013,agroupoflocalfarmersandindigenouscommunitieschallengedtheOriginalResolution.Thechallenge,whichwasbroughtintheEnvironmentalCourtofSantiago,Chile(the“EnvironmentalCourt”),claimedthatthefinewasinadequateandrequestedmoreseveresanctionsagainstCMNincludingtherevocationoftheproject’senvironmentalpermit.TheSMApresentedits
-99-
defenseoftheOriginalResolutioninJuly2013.OnAugust2,2013,CMNjoinedasapartytothisproceedingandvigorouslydefendedtheOriginalResolution.OnMarch3,2014,theEnvironmentalCourtannulledtheOriginalResolutionandremandedthematterbacktotheSMAforfurtherconsiderationinaccordancewithitsdecision(the“EnvironmentalCourtDecision”).Inparticular,theEnvironmentalCourtorderedtheSMAtoissueanewadministrativedecisionthatrecalculatedtheamountofthefinetobepaidbyCMNusingadifferentmethodologyandaddressedcertainothererrorsitidentifiedintheOriginalResolution.TheEnvironmentalCourtdidnotannultheportionoftheOriginalResolutionthatrequiredBarricktohaltconstructionontheChileansideoftheprojectuntilthewatermanagementsystemiscompletedinaccordancewiththeproject’senvironmentalpermit.OnDecember30,2014,theChileanSupremeCourtdeclinedtoconsiderCMN’sappealoftheEnvironmentalCourtDecisiononproceduralgrounds.AsaresultoftheSupremeCourt’sruling,onApril22,2015,theSMAreopenedtheadministrativeproceedingagainstCMNinaccordancewiththeEnvironmentalCourtDecision.
OnApril22,2015,CMNwasnotifiedthattheSMAhadinitiatedanewadministrativeproceedingforallegeddeviationsfromcertainrequirementsoftheproject’senvironmentalapproval,includingwithrespecttotheproject’senvironmentalimpactandaseriesofmonitoringrequirements.InMay2015,CMNsubmittedacomplianceprogramtoaddresscertainoftheallegationsandpresenteditsdefensetotheremainderoftheallegeddeviations.TheSMArejectedCMN’sproposedcomplianceprogramonJune24,2015,anddeniedCMN’sadministrativeappealofthatdecisiononJuly31,2015.OnDecember30,2016,theEnvironmentalCourtrejectedCMN’sappealandCMNdeclinedtochallengethisdecision.
OnJune8,2016,theSMAconsolidatedthetwoadministrativeproceedingsagainstCMNintoasingleproceedingencompassingboththereconsiderationoftheOriginalResolutioninaccordancewiththedecisionoftheEnvironmentalCourtandtheallegeddeviationsfromtheproject’senvironmentalapprovalnotifiedbytheSMAinApril2015.
OnJanuary17,2018,CMNreceivedtherevisedresolution(the“RevisedResolution”)fromtheSMA,inwhichtheenvironmentalregulatorreducedtheoriginaladministrativefinefromapproximately$16millionto$11.5millionandorderedtheclosureofexistingsurfacefacilitiesontheChileansideoftheProjectinadditiontomandatingcertainmonitoringactivities.TheRevisedResolutiondoesnotrevoketheProject’senvironmentalapproval.CMNfiledanappealoftheRevisedResolutiononFebruary3,2018.Theappealargues,amongotherthings,thatthesanctionisdisproportionatetoactualenvironmentalimpacts.
Pascua-Lama – Constitutional Protection Action
CMNfiledatemporaryandpartialclosureplanforthePascua-Lamaproject(the“TemporaryClosurePlan”)withtheChileanminingauthority(“Sernageomin”)onAugust31,2015.SernageominapprovedtheTemporaryClosurePlanonSeptember29,2015,andissuedaresolutionrequiringCMNtocomplywithcertainclosure-relatedmaintenanceandmonitoringobligationsforaperiodoftwoyears.TheTemporaryClosurePlandoesnotaddresscertainfacilities,includingtheproject’swatermanagementsystem,whichremainsubjecttotherequirementsoftheproject’soriginalenvironmentalapprovalandotherregulations.
OnDecember4,2015,aconstitutionalprotectionactionwasfiledintheCourtofAppealsofSantiago,ChilebyagroupoflocalfarmersandotherindividualsagainstCMNandSernageomininordertochallengetheTemporaryClosurePlanandtheresolutionthatapprovedit.TheplaintiffsassertedthattheTemporaryClosurePlancannotbeapproveduntilthewatermanagementsystemfortheprojecthasbeencompletedinaccordancewiththeproject’senvironmentalpermit.OnAugust12,2016,thecourt
-100-

ruledinfavourofCMNandSernageomin,rejectingtheplaintiffs’challengestotheTemporaryClosurePlanforthePascua-Lamaproject.Theplaintiffsappealedthecourt’sdecisiontotheChileanSupremeCourtandonMarch13,2017,theSupremeCourtvacatedtheTemporaryClosurePlan,rulingthatadditionalinformationregardingtheSMAregulatorysanctionprocesswasrequiredfromtheenvironmentalregulator,andorderingSernageomintoissueanewresolutionontheTemporaryClosurePlanafterreceivingsuchinformation.OnAugust29,2017,SernageominissuedanewresolutioninwhichitreapprovedtheTemporaryClosurePlanasoriginallyissued.ThisapprovalisvalidthroughSeptember2019.
Pascua-Lama – Water Quality Review
CMNinitiatedareviewofthebaselinewaterqualityoftheRioEstrechoinAugust2013asrequiredbyaJuly15,2013decisionoftheCourtofAppealsofCopiapo,Chile.ThepurposeofthereviewwastoestablishwhetherthewaterqualitybaselinehaschangedsincethePascua-LamaprojectreceiveditsenvironmentalapprovalinFebruary2006and,ifso,torequireCMNtoadopttheappropriatecorrectivemeasures.Asaresultofthatstudy,CMNrequestedcertainmodificationstoitsenvironmentalpermitwaterqualityrequirements.OnJune6,2016,theresponsibleagencyapprovedapartialamendmentoftheenvironmentalpermittobetterreflectthewaterqualitybaselinefrom2009.ThatapprovalwasappealedbycertainwaterusersandindigenousresidentsoftheHuascoValley.OnOctober19,2016,theChileanCommitteeofMinistersfortheEnvironment,whichhasjurisdictionoverclaimsofthisnature,votedtoupholdthepermitamendments.OnJanuary27,2017,theEnvironmentalCourtagreedtoconsideranappealoftheChileanCommittee’sdecisionbroughtbyCMNandthewaterusersandindigenousresidents.AhearingtookplaceonJuly25,2017.OnDecember12,2017,thewateruserswithdrewtheirappeal.TheEnvironmentalCourtdismissedthatappealonJanuary5,2018.AdecisionoftheEnvironmentalCourtontheremainingappealsisstillpending.
Veladero – September 2015 Release of Cyanide-Bearing Process Solution
SanJuanProvincialRegulatorySanctionProceeding
OnSeptember13,2015,avalveonaleachpadpipelineatBarrick’sVeladeromineinSanJuanProvince,Argentinafailed,resultinginareleaseofcyanide-bearingprocesssolutionintoanearbywaterwaythroughadiversionchannelgatethatwasopenatthetimeoftheincident.MAG,thecompanythatoperatestheVeladeromine,notifiedregulatoryauthoritiesofthesituation.EnvironmentalmonitoringwasconductedbyMAGandindependentthirdpartiesfollowingtheincident.Barrickbelievesthismonitoringdemonstratesthattheincidentposednorisktohumanhealthatdownstreamcommunities.Atemporaryrestrictionontheadditionofnewcyanidetothemine’sprocessingcircuitwasliftedonSeptember24,2015,andmineoperationsreturnedtonormal.Monitoringandinspectionoftheminesitewillcontinueinaccordancewithacourtorder.
OnOctober9,2015,theSanJuanProvincialminingauthorityinitiatedanadministrativesanctionprocessagainstMAGforallegedviolationsoftheminingcoderelatingtothevalvefailureandreleaseofcyanide-bearingprocesssolution.MAGsubmitteditsresponsetotheseallegationsinOctober2015andprovidedadditionalinformationinJanuary2016.
OnMarch11,2016,theSanJuanProvincialminingauthorityannounceditsintentiontoimposeanadministrativefineagainstMAGinconnectionwiththesolutionrelease.MAGwasformallynotifiedofthisdecisiononMarch15,2016.OnApril6,2016,MAGsoughtreconsiderationofcertainaspectsofthedecisionbutdidnotchallengetheamountoftheadministrativefine.OnApril14,2016,inaccordancewithlocalrequirements,MAGpaidtheadministrativefineofapproximately$10million(atthethen-applicableArgentineanpesotoU.S.dollarexchangerate)whiletherequestforreconsiderationwas
-101-
pending.OnDecember29,2016,therequestforreconsiderationwasrejectedbytheSanJuanProvincialminingauthority.OnJuly11,2017,theSanJuangovernmentrejectedMAG’sfinaladministrativeappealofthisdecision.OnSeptember5,2017,MAGcommencedalegalactiontocontinuechallengingcertainaspectsofthedecisionbeforetheSanJuancourts.MAGhasimplementedaremedialactionplanatVeladeroinresponsetotheincidentasrequiredbytheSanJuanProvincialminingauthority.
CriminalMatters
OnMarch11,2016,aSanJuanProvincialcourtlaidcriminalchargesbasedonallegednegligenceagainstninecurrentandformerMAGemployeesinconnectionwiththesolutionrelease(the“ProvincialAction”).OnAugust15,2017,theCourtofAppealsconfirmedtheindictmentagainsteightofthenineindividualsthathadbeenchargedwithallegednegligenceinconnectionwiththesolutionrelease.Theindividualdefendantsfiledaspecialappeal,calleda“cassation”appeal,oftheindictmentswiththeSanJuanSupremeCourt,whichwasrejectedonAugust31,2017.TheSanJuanProvincialcourtrejectedthedefendants’motiontodismissonNovember30,2017,andthedefendantsappealedthisdecisiononDecember4,2017.Atrialdatehasnotyetbeenset.MAGisnotapartytotheProvincialAction.
Inaddition,afederalcriminalinvestigationwasinitiatedbyaBuenosAiresfederalcourtbasedontheallegedfailureofcertaincurrentandformerfederalandprovincialgovernmentofficialsandindividualdirectorsofMAGtopreventthesolutionrelease(the“FederalInvestigation”).ThefederaljudgeoverseeingtheFederalInvestigationadmittedalocalgroupinSanJuanProvinceasaparty.InMarch2016,thisgrouprequestedaninjunctionagainsttheoperationsoftheVeladeromine.Thefederaljudgeorderedtechnicalstudiestoassessthesolutionreleaseanditsimpactandappointedacommitteetoconductasitevisit,whichoccurredinlateApril2016.
OnMay5,2016,theNationalSupremeCourtofArgentinalimitedthescopeoftheFederalInvestigationtothepotentialcriminalliabilityofthefederalgovernmentofficials,rulingthattheBuenosAiresfederalcourtdoesnothavejurisdictiontoinvestigatethesolutionrelease.Asaresultofthisdecision,theinvestigationintotheincidentwillcontinuetobeconductedbytheSanJuanProvincialjudgeintheProvincialAction.Todate,nochargeshavebeenlaidagainstanyspecificindividualsinconnectionwiththeFederalInvestigation,consistentwithitsmorelimitedscope.
OnOctober17,2016,aseparatecriminalinvestigationwasinitiatedbythefederaljudgeoverseeingtheFederalInvestigationbasedontheallegedfailureoffederalgovernmentofficialstoregulatetheVeladeromineunderArgentina’sglacierlegislation(see“–ArgentineGlacierLegislationandConstitutionalLitigation”below).OnJune16,2017,MAGsubmittedamotiontochallengethefederaljudge’sdecisiontoassignthisinvestigationtohimself.MAGalsorequestedtobeadmittedasapartytotheproceedinginordertopresentevidenceinsupportofMAG.OnSeptember14,2017,theCourtofAppealsconsolidatedthetwoinvestigationsbeforethefederaljudgeandallowedMAGtoparticipateintheconsolidatedFederalInvestigation.OnNovember21,2017,theCourtofAppealsclarifiedthatMAGisnotapartytothecaseandthereforedidnothavestandingtoseektherecusalofthefederaljudge.TheCourtrecognizedMAG’srighttocontinuetoparticipateinthecasewithoutclarifyingthescopeofthoserights.
OnNovember27,2017,thefederaljudgeindictedfourformerfederalgovernmentofficials,allegingabuseofauthorityinconnectionwiththeiractionsandomissionsrelatedtotheenforcementofArgentina’snationalglacierlegislationincludingthemethodologyusedtocompletethenationalinventoryofglaciers,aportionofwhichwaspublishedonOctober3,2016,andalsorequiringtheNationalMinistryoftheEnvironmentandSustainableDevelopmenttodetermineiftherehasbeenanyenvironmentaldamagetoglacierssincetheglacierlawwentintoeffectinlightofhisdecision.OnDecember12,2017,theNationalMinistryoftheEnvironmentandSustainableDevelopmentclarifiedthat
-102-

itdoesnothavejurisdictiontoauditenvironmentaldamagetoglaciers,asthisistheresponsibilityoftheProvincialauthorities.OnMarch5,2018,theCourtofAppealsconfirmedtheindictmentagainstthefourformerfederalofficials.
Veladero – September 2016 Release of Crushed Ore Saturated with Process Solution
TemporarySuspensionofOperationsandRegulatoryInfringementProceeding
OnSeptember8,2016,icerollingdowntheslopeoftheleachpadattheVeladerominedamagedapipecarryingprocesssolution,causingsomematerialtoleavetheleachpad.Thismaterial,primarilycrushedoresaturatedwithprocesssolution,wascontainedontheminesiteandreturnedtotheleachpad.ExtensivewatermonitoringintheareaconductedbyMAGhasconfirmedthattheincidentdidnotresultinanyenvironmentalimpacts.AtemporarysuspensionofoperationsattheVeladerominewasorderedbytheSanJuanProvincialminingauthorityandaSanJuanProvincialcourtonSeptember15,2016andSeptember22,2016,respectively,asaresultofthisincident.OnOctober4,2016,following,amongothermatters,thecompletionofcertainurgentworksrequiredbytheSanJuanProvincialminingauthorityandajudicialinspectionofthemine,theSanJuanProvincialcourtliftedthesuspensionofoperationsandorderedthatminingactivitiesberesumed.
OnSeptember14,2016,theSanJuanProvincialminingauthoritycommencedanadministrativeproceedinginconnectionwiththisincidentthatincluded,inadditiontotheissueofthesuspensionorder,aninfringementproceedingagainstMAG.OnDecember2,2016,theSanJuanProvincialminingauthoritynotifiedMAGoftwochargesundertheinfringementproceedingforallegedviolationsoftheMiningCode.AnewcriminaljudicialinvestigationhasalsobeencommencedbytheProvincialprosecutor’sofficeinthesameSanJuanProvincialcourtthatishearingtheProvincialAction.ThecourtinthisproceedingissuedtheorderssuspendingandresumingtheoperationsattheVeladerominedescribedabove.
OnSeptember14,2017,theSanJuanProvincialminingauthorityconsolidatedtheadministrativeproceedingintoasingleproceedingagainstMAGencompassingboththeSeptember2016incidentandtheMarch2017incidentdescribedbelow(see“–Veladero–March2017ReleaseofGold-bearingProcessSolution”).
OnDecember27,2017,MAGreceivednoticeofaresolutionfromtheSanJuanProvincialminingauthorityrequiringpaymentofanadministrativefineofapproximately$5.6million(calculatedattheprevailingexchangerateonDecember31,2017)encompassingboththeSeptember2016incidentandtheMarch2017incidentdescribedbelow.OnJanuary23,2018,inaccordancewithlocalrequirements,MAGpaidtheadministrativefineandfiledarequestforreconsiderationwiththeSanJuanProvincialminingauthority,whichremainspending.
Veladero Cyanide Leaching Process – Civil Action
OnDecember15,2016,MAGwasservednoticeofalawsuitbycertainpersonswhoclaimtobelivinginJachal,ArgentinaandtobeaffectedbytheVeladeromineand,inparticular,theVLF.Inthelawsuit,whichwasfiledintheSanJuanProvincialcourt,theplaintiffshaverequestedacourtorderthatMAGceaseleachingmetalswithcyanidesolutions,mercuryandothersimilarsubstancesattheVeladeromineandreplacethatprocesswithonethatisfreeofhazardoussubstances,thatMAGimplementaclosureandremediationplanfortheVLFandsurroundingareas,andcreateacommitteetomonitorthisprocess.Thelawsuitisproceedingasanordinarycivilaction.MAGrepliedtothelawsuitonFebruary20,2017.OnMarch31,2017,theplaintiffssupplementedtheiroriginalcomplainttoallegethattheriskofenvironmentaldamagehadincreasedasaresultoftheMarch28,2017releaseofgold-bearing
-103-

processsolutionincidentdescribedbelow(see“–Veladero–March2017ReleaseofGold-bearingProcessSolution”above).TheCompanyrespondedtothenewallegationsandintendstocontinuedefendingthismattervigorously.
Veladero – March 2017 Release of Gold-bearing Process Solution
RegulatoryInfringementProceedingandTemporarySuspensionofAdditionofCyanide
OnMarch28,2017,themonitoringsystematBarrick’sVeladerominedetectedaruptureofapipecarryinggold-bearingprocesssolutionontheleachpad.Thissolutionwascontainedwithintheoperatingsite;nosolutionreachedanydiversionchannelsorwatercourses.Allaffectedsoilwaspromptlyexcavatedandplacedontheleachpad.Barricknotifiedregulatoryauthoritiesofthesituation,andSanJuanprovincialauthoritiesinspectedthesiteonMarch29,2017.
OnMarch29,2017,theSanJuanProvincialminingauthorityissuedaviolationnoticeagainstMAGinconnectionwiththeincidentandorderedatemporaryrestrictionontheadditionofnewcyanidetotheleachpaduntilcorrectiveactionsonthesystemwerecompleted.TheminingauthorityliftedthesuspensiononJune15,2017,followinginspectionofcorrectiveactions.
OnMarch30,2017,theSanJuanMiningMinisterorderedthecommencementofaregulatoryinfringementproceedingagainstMAGaswellasacomprehensiveevaluationofthemine’soperationstobeconductedbyrepresentativesoftheCompanyandtheSanJuanprovincialauthorities.BarrickfileditsdefensetotheregulatoryinfringementproceedingonApril5,2017.
OnSeptember14,2017,theSanJuanProvincialminingauthorityconsolidatedthisadministrativeproceedingintoasingleproceedingagainstMAGencompassingboththeSeptember2016incidentdescribedabove(see“–Veladero–September2016ReleaseofCrushedOreSaturatedwithProcessSolution”)andtheMarch2017incident.OnOctober10,2017,theSanJuanProvincialminingauthoritynotifiedMAGoftwochargesundertheinfringementproceedingforallegedviolationsoftheMiningCodeinconnectionwiththeMarch2017incident.
OnDecember27,2017,MAGreceivednoticeofaresolutionfromtheSanJuanProvincialminingauthorityrequiringpaymentofanadministrativefineofapproximately$5.6million(calculatedattheprevailingexchangerateonDecember31,2017)encompassingboththeSeptember2016incidentdescribedaboveandtheMarch2017incident.OnJanuary23,2018,inaccordancewithlocalrequirements,MAGpaidtheadministrativefineandfiledarequestforreconsiderationwiththeSanJuanProvincialminingauthority,whichremainspending.
Provincial Amparo Action
OnMarch30,2017,MAGwasservednoticeofalawsuit,calledan“amparo”protectionaction,filedintheJachalFirstInstanceCourt(the“JachalCourt”)byindividualswhoclaimedtobelivinginJachal,Argentina,seekingthecessationofallactivitiesattheVeladeromine.Theplaintiffssoughtaninjunctionaspartofthelawsuit,requesting,amongotherthings,thecessationofallactivitiesattheVeladeromineor,alternatively,asuspensionoftheleachingprocessatthemine.OnMarch30,2017,theJachalCourtrejectedtherequestforaninjunctiontoceaseallactivitiesattheVeladeromine,butordered,amongotherthings,thesuspensionoftheleachingprocessattheVeladeromineandforMAGandtheSanJuanProvincialminingauthoritytoprovideadditionalinformationtotheJachalCourtinconnectionwiththeincident.
-104-

TheCompanyfiledadefensetotheprovincialamparoactiononApril7,2017.TheJachalCourtliftedthesuspensiononJune15,2017,aftertheSanJuanProvincialminingauthorityprovidedtherequiredinformationandahydraulicassessmentoftheleachpadandprocessplantwasimplemented.FurtherdevelopmentsinthiscasearependingadecisionbytheArgentineSupremeCourtastowhethertheFederalCourtorProvincialcourthasjurisdictiontoassessthemeritsoftheamparoremedy(see“–FederalAmparoAction”below).
Federal Amparo Action
OnApril4,2017,theNationalMinisterofEnvironmentofArgentinafiledalawsuitintheBuenosAiresfederalcourt(the“FederalCourt”)inconnectionwiththeMarch2017incident(see“–Veladero–March2017ReleaseofGold-bearingProcessSolution”above).Theamparoprotectionactionsoughtacourtorderrequiringthecessationand/orsuspensionofactivitiesattheVeladeromine.MAGsubmittedextensiveinformationtotheFederalCourtabouttheincident,thethen-existingadministrativeandprovincialjudicialsuspensions,theremedialactionstakenbytheCompanyandtheliftingofthesuspensionsasdescribedabove.MAGalsochallengedthejurisdictionoftheFederalCourtandthestandingoftheNationalMinisterofEnvironmentofArgentinaandrequestedthatthematterberemandedtotheJachalCourt.TheProvinceofSanJuanalsochallengedthejurisdictionoftheFederalCourtinthismatter.OnJune23,2017,theFederalCourtdecidedthatitwascompetenttohearthecase,andreferredthecasetotheCourtofAppealstodeterminewhethertheFederalCourtorProvincialcourtinthecasedescribedabovehastheauthoritytoassessthemeritsoftheamparoremedy.OnJuly5,2017,theProvincialcourtissuedarequestfortheSupremeCourtofArgentinatoresolvethejurisdictionaldispute.OnJuly30,2017,theCourtofAppealsreferredthejurisdictionaldisputetotheSupremeCourtandadecisiononthematterispending.
Argentine Glacier Legislation and Constitutional Litigation
OnSeptember30,2010,theNationalLawonMinimumRequirementsfortheProtectionofGlacierswasenactedinArgentina,andcameintoforceinearlyNovember2010.Thefederallawbannednewminingexplorationandexploitationactivitiesonglaciersandinthe“peri-glacial”environment,andsubjectedongoingminingactivitiestoanenvironmentalaudit.Iftheauditidentifiessignificantimpactsonglaciersandperi-glacialenvironment,therelevantauthorityisempoweredtotakeaction,whichaccordingtothelegislationcouldincludethesuspensionorrelocationoftheactivity.InthecaseoftheVeladeromineandtheArgentineansideofthePascua-Lamaproject,thecompetentauthorityistheProvinceofSanJuan.InlateJanuary2013,theProvinceannouncedthatithadcompletedtherequiredenvironmentalaudit,whichconcludedthatVeladeroandPascua-Lamadonotimpactglaciersorperi-glaciers.OnOctober3,2016,federalauthoritiespublishedapartialnationalinventoryofglaciers,whichincludedtheareawheretheVeladeromineandPascua-Lamaprojectarelocated.TheCompanyhasanalyzedthenationalinventoryintheareawhereVeladeroandPascua-LamaarelocatedandhasconcludedthatthisinventoryisconsistentwiththeprovincialinventorythattheProvinceofSanJuanusedinconnectionwithitsJanuary2013environmentalaudit.
TheconstitutionalityofthefederalglacierlawisthesubjectofachallengebeforetheNationalSupremeCourtofArgentina,whichhasnotyetruledontheissue.OnOctober27,2014,theCompanysubmitteditsresponsetoamotionbythefederalgovernmenttodismisstheconstitutionalchallengetothefederalglacierlawonstandinggrounds.Adecisiononthemotionispending.Ifthefederalgovernment’sargumentswithrespecttostandingareacceptedthenthecasewillbedismissed.Iftheyarenotaccepted,thentheNationalSupremeCourtofArgentinawillproceedtohearevidenceonthemerits.
-105-

Pueblo Viejo – Amparo Action
InOctober2014,PVDCreceivedacopyofanactionfiledinanadministrativecourt(the“AdministrativeCourt”)intheDominicanRepublicbyRafaelGuillenBeltre(the“Petitioner”),whoclaimstobeaffiliatedwiththeDominicanChristianPeaceOrganization.TheactionallegesthatenvironmentalcontaminationinthevicinityofthePuebloViejominehascausedillnessandaffectedwaterqualityinviolationofthePetitioner’sfundamentalrightsundertheDominicanConstitutionandotherlaws.Theprimaryreliefsoughtintheaction,whichisstyledasan“amparo”remedy,isthesuspensionofoperationsatthePuebloViejomineaswellasotherminingprojectsintheareauntilaninvestigationintotheallegedenvironmentalcontaminationhasbeencompletedbytherelevantgovernmentalauthorities.OnNovember21,2014,theAdministrativeCourtgrantedPVDC’smotiontoremandthemattertoatrialcourtintheMunicipalityofCotuí(the“TrialCourt”)onproceduralgrounds.OnJune25,2015,theTrialCourtrejectedthePetitioner’samparoaction,findingthatthePetitionerfailedtoproduceevidencetosupporthisallegations.ThePetitionerappealedtheTrialCourt’sdecisiontotheConstitutionalCourtonJuly21,2015.OnJuly28,2015,PVDCfiledamotiontochallengethetimelinessofthisappealasitwassubmittedaftertheexpirationoftheapplicablefilingdeadline.TheCompanyintendstovigorouslydefendthismatter.
Perilla Complaint
In2009,BGIandPlacerDomewerepurportedlyservedinOntariowithacomplaintfiledinNovember2008intheRegionalTrialCourtofBoac(the“Court”),onthePhilippineislandofMarinduque,onbehalfoftwonamedindividualsandpurportedlyonbehalfoftheapproximately200,000residentsofMarinduque.ThecomplaintallegesinjurytotheeconomyandtheecologyofMarinduqueasaresultofthedischargeofminetailingsfromtheMarcoppermineintoCalancanBay,theBoacRiver,andtheMogpogRiver.PlacerDome,whichwasacquiredbyBarrickin2006,hadbeenaminorityindirectshareholderoftheMarcoppermine.Theplaintiffsareclaimingforabatementofapublicnuisanceallegedlycausedbythetailingsdischargeandfornominaldamagesforanallegedviolationoftheirconstitutionalrighttoabalancedandhealthfulecology.InJune2010,BGIandPlacerDomefiledamotiontohavetheCourtresolvetheirunresolvedmotionstodismissbeforeconsideringtheplaintiffs’motiontoadmitanamendedcomplaintandalsofiledanoppositiontotheplaintiffs’motiontoadmitonthesamebasis.ByOrderdatedNovember9,2011,theCourtgrantedamotiontosuspendtheproceedingsfiledbytheplaintiffs.ItisnotknownwhenthesemotionsortheoutstandingmotionstodismisswillbedecidedbytheCourt.Todate,neithertheplaintiffsnortheCompanyhasadvisedtheCourtofanintentiontoresumetheproceedings.TheCompanyintendstodefendtheactionvigorously.
Writ of Kalikasan
InFebruary2011,aPetitionfortheIssuanceofaWritofKalikasanwithPrayerforTemporaryEnvironmentalProtectionOrder(the“Petition”)wasfiledintheSupremeCourtoftheRepublicofthePhilippines(the“SupremeCourt”)inElizaM.Hernandez,MamertoM.LaneteandGodofredoL.Manoy(the“Petitioners”)versusPlacerDomeInc.andBarrickGoldCorporation.InMarch2011,theSupremeCourtissuedanEnBancResolutionandWritofKalikasan,directedserviceofsummonsonPlacerDomeandBarrick,orderedPlacerDomeandBarricktomakeaverifiedreturnoftheWritwithten(10)daysofserviceandreferredthecasetotheCourtofAppealforhearing.ThePetitionallegesthatPlacerDomeviolatedthePetitioners’constitutionalrighttoabalancedandhealthfulecologyasaresultof,amongotherthings,thedischargeoftailingsintoCalancanBay,the1993Maguila-Guiladambreak,the1996BoacRivertailingsspillandfailureofMarcoppertoproperlydecommissiontheMarcoppermine.ThePetitionershavepleadedthatBarrickisliablefortheallegedactionsandomissionsofPlacerDome,whichwasaminorityindirectshareholderofMarcopperatallrelevanttimes,andisseekingordersrequiringBarricktoenvironmentallyremediatetheareasinandaroundtheminesitethatareallegedto
-106-
havesustainedenvironmentalimpacts.ThePetitionerspurportedtoserveBarrickinMarch2011,followingwhichBarrickfiledanUrgentMotionForRulingonJurisdictionwiththeSupremeCourtchallengingtheconstitutionalityoftheRulesofProcedureinEnvironmentalCases(the“EnvironmentalRules”)pursuanttowhichthePetitionwasfiled,aswellasthejurisdictionoftheSupremeCourtoverBarrick.ByresolutiondatedOctober12,2011,theCourtofAppealsgrantedthePetitioners’October4,2011motiontosuspendproceedingstopermitthePetitionerstoexplorethepossibilityofasettlement.TheproceedingsaresuspendedpendingfurthernoticefromthePetitioners.InNovember2011,twolocalgovernments,or“baranguays”(BaranguaySanAntonioandBaranguayLobo)filedamotionwiththeSupremeCourtseekingintervenorstatuswiththeintentionofseekingadismissaloftheproceedings.NodecisionhasasyetbeenissuedwithrespecttotheUrgentMotionforRulingonJurisdiction,themotionforinterventionorcertainothermattersbeforetheSupremeCourt.TheCompanyintendstocontinuetodefendtheactionvigorously.
InNovember2016,thePetitionersnotifiedtheCourtofAppealsthatsettlementnegotiationsdidnotresolvetheaction.InMarch2017,theCourtofAppealsrequiredthePetitionerstoadvisewhethertheyintendtopursuetheaction.Withoutrespondingtothecourt,Petitioners’counseladvisedtheCourtofAppealsinJuly2017oftheirwithdrawalascounselforthePetitionersandinformedthecourtofthedeathofoneofthePetitioners.TheCourtofAppealsissuedaresolutioninNovember2017requiringthePetitionerstonotifythecourtwhethertheyhaveengagednewcounsel.Petitioners’newcounselfiledanentryofappearanceinDecember2017withtheCourtofAppeals.Todate,thePetitionershavestillnotadvisedtheCourtofAppealswhethertheyintendtopursuetheaction.TheCompanyisawaitingreceiptofthePetitioners’notificationoftheirintentions.
Cerro Casale
OneoftheenvironmentalpermitsrelatedtotheopenpitandwatermanagementsystematBarrick’s50%-ownedCerroCasaleproject(nowknownastheNorteAbiertoproject)inChileissubjecttoanenvironmentalregulation(the“Regulation”)that,ifappliedaswritten,wouldhaverequiredBarricktobeginconstructionoftheprojectbyJanuary26,2015orriskcancellationoftheenvironmentalpermit.TheCompanysoughtrelieffromtheRegulationasconstructionwasnotfeasibleanddidnotbeginbythatdate.OnOctober15,2015,theChileanenvironmentalauthorityissuedaresolutionconfirmingthatinitialprojectactivitiesweretimelycommencedasrequiredbytheenvironmentalpermitandthematterisnowclosed.Permitsrequiredforthemajorityoftheproject’sproposedoperationswereobtainedunderasecondenvironmentalapproval(the“CerroCasaleenvironmentalpermit”)thatwassubjecttoaJanuary2018constructioncommencementdeadline.TheCompanyrequestedreliefusingthesameproceduredescribedabove,andtheenvironmentalauthorityconfirmedthattheinitialprojectactivitiesweretimelycommenced.
TheCerroCasaleenvironmentalpermitwaschallengedin2013bylocalandindigenouscommunitymembersforallegedproceduraldeficienciesinthecommunityconsultationprocessandotheraspectsoftheevaluationoftheprojectbytheChileanenvironmentalauthority.ThechallengewasbroughtbeforetheChileanCommitteeofMinistersfortheEnvironment,whichhasjurisdictionoverproceduralclaimsofthisnature.OnJanuary19,2015,theCommitteeofMinistersfortheEnvironmentrejectedthemajorityofclaimsmadeagainsttheCerroCasaleenvironmentalpermitwhilealsoimposingnewlimitationsonthevolumeofgroundwaterthattheprojectmayextractforminingoperations.TheCompanyappealedthisdecisiontotheEnvironmentalCourt,whichheldahearingonAugust27,2015.OnJune12,2017,theEnvironmentalCourtorderedtheChileanCommitteeofMinistersfortheEnvironmenttoreviewitsJanuary9,2015decisiontoimposenewlimitationsonthevolumeofgroundwaterthattheCerroCasaleprojectmayextractforminingoperations.TheCompanyandtheChileanenvironmentalauthorityappealedthisdecisiontotheChileanSupremeCourt.
-107-

Whilethisappealwaspending,theChileanCommitteeofMinistersfortheEnvironmentissuedanewdecisiononNovember23,2017inwhichitmodifiedthelimitationsongroundwaterextractionimposedinitsoriginalruling.ThedecisionmayprovideadditionalwaterresourcesfortheprojectandthereforetheCompanyandtheChileanenvironmentalauthorityagreedtowithdrawtheappealtotheSupremeCourt.Thematterisnowclosed.
Acacia Mining plc – Tanzanian Revenue Authority Assessments
TheTanzanianRevenueAuthority(“TRA”)hasissuedanumberoftaxassessmentstoAcaciarelatedtopasttaxationyearsfrom2002onwards.AcaciabelievesthatthemajorityoftheseassessmentsareincorrectandhasfiledobjectionsandappealsaccordinglyinanattempttoresolvethesemattersbymeansofdiscussionswiththeTRAorthroughtheTanzanianappealsprocess.Overall,itisAcacia’scurrentassessmentthattherelevantassessmentsandclaimsbytheTRAarewithoutmerit.
TheclaimsincludeanassessmentissuedtoAcaciaintheamountof$41.3millionforwithholdingtaxoncertainhistoricoffshoredividendpaymentspaidbyAcaciatoitsshareholdersfrom2010to2013.Acaciaisappealingthisassessmentonthesubstantivegroundsthat,asanEnglishincorporatedcompany,itisnotresidentinTanzaniafortaxationpurposes.TheappealiscurrentlypendingattheCourtofAppeal.Accordingly,noamountshavebeenrecordedforanypotentialliabilityandAcaciaintendstocontinuetodefendthisactionvigorously.
FurtherTRAassessmentswereissuedtoAcaciainJanuary2016intheamountof$500.7million,basedonanallegationthatAcaciaisresidentinTanzaniaforcorporateanddividendwithholdingtaxpurposes.ThecorporatetaxassessmentshavebeenleviedoncertainofAcacia’snetprofitsbeforetax.AcaciaisintheprocessofappealingtheseassessmentsattheTRABoardlevel.Acacia’ssubstantivegroundsofappealarebasedonthecorrectinterpretationofTanzanianpermanentestablishmentprinciplesandlaw,relevanttoanon-residentEnglishincorporatedcompany.
Inaddition,theTRAissuedadjustedtaxassessmentstotalingapproximately$190billionforallegedunpaidtaxes,interestandpenalties,apparentlyissuedinrespectofallegedanddisputedunder-declaredexportrevenues,andappearingtofollowonfromtheannouncedfindingsoftheFirstandSecondPresidentialCommittees.Formoreinformationabouttheseadjustedtaxassessments,see“–AcaciaMiningplc–ConcentrateExportBanandRelatedDisputes”below.
Acacia Mining plc – Concentrate Export Ban and Related Disputes
OnMarch3,2017,theTanzanianMinistryofEnergyandMineralsimposedtheBan,ageneralbanontheexportofmetallicconcentrates.Thisincludesgold/copperconcentrateexportedbyAcacia’sBulyanhuluandBuzwagimines.FollowingtheimpositionoftheBan,Acaciaimmediatelyceasedallexportsofitsgold/copperconcentrate,including27containerspreviouslyapprovedforexportpriortotheBan.
Duringthesecondquarterof2017,investigationswereconductedonbehalfoftheTanzanianGovernmentbytwoTanzanianGovernmentPresidentialCommittees,whichhaveresultedinallegationsofhistoricalundeclaredrevenueandunpaidtaxesbeingmadeagainstAcaciaanditspredecessorcompanies.AcaciaconsidersthesefindingstobeimplausibleandhasfullyrefutedthefindingsofbothPresidentialCommittees.AcaciahasrequestedcopiesofthereportsissuedbythetwoPresidentialCommitteesandcalledforindependentverificationofthefindings,buthasnotyetreceivedaresponsetotheserequests.
-108-
OnJuly4,2017,Acacia’ssubsidiaries,BulyanhuluGoldMineLimited(“BGML”),theowneroftheBulyanhulumine,andPangeaMineralsLimited(“PML”),theowneroftheBuzwagimine,eachcommencedinternationalarbitrationsagainsttheGovernmentofTanzaniainaccordancewiththedisputeresolutionprocessesagreedbytheGovernmentofTanzaniaintheMineralDevelopmentAgreements(“MDAs”)withBGMLandPML.Thesearbitrationsremainongoing.
InJuly2017,Acaciareceivedadjustedassessmentsforthetaxyears2000-2017fromtheTRAforatotalamountofapproximately$190billionforallegedunpaidtaxes,interestandpenalties,apparentlyissuedinrespectofallegedanddisputedunder-declaredexportrevenues,andappearingtofollowonfromtheannouncedfindingsoftheFirstandSecondPresidentialCommittees.Theseassessmentsarebeingdisputedandtheunderlyingallegationsareincludedinthemattersthathavebeenreferredtointernationalarbitration.
Inaddition,followingtheendofthethirdquarter,Acaciawasservedwithnoticesofconflictingadjustedcorporateincometaxandwithholdingtaxassessmentsfortaxyears2005to2011withrespecttoAcacia’sformerTulawakajointventure,anddemandsforpayment,foratotalamountofapproximately$3billion.Interestandpenaltiesrepresentthevastmajorityofthenewassessments.TheTRAhasnotprovidedAcaciawithanyexplanationsorreasonsfortheadjustedassessments,orwiththeTRA’spositiononhowtheassessmentshavebeencalculatedorwhytheyhavebeenissued.Acaciadisputestheseassessmentsandhasrequestedsupportingcalculations,whichhavenotyetbeenreceived.AcaciaisobjectingtotheseassessmentsanddefendingthismatterthroughtheTanzaniantaxappealsprocess.
InadditiontotheBan,newandamendedlegislationwaspassedinTanzaniainearlyJuly2017,includingvariousamendmentstothe2010MiningActandanewFinanceAct.Theamendmentstothe2010MiningActincreasedtheroyaltyrateapplicabletometallicmineralssuchasgold,copperandsilverto6%(from4%),andthenewFinanceActimposesa1%clearingfeeonthevalueofallmineralsexportedfromTanzaniafromJuly1,2017.InJanuary2018,newMiningRegulationswereannouncedbytheTanzanianGovernmentintroducing,amongotherthings,localcontentrequirements,exportregulationsandmineralrightsregulations,thescopeandeffectofwhichremainunderreviewbyAcacia.AcaciacontinuestomonitortheimpactofallnewlegislationinlightofitsMDAswiththeGovernmentofTanzania.However,tominimizefurtherdisruptionstoitsoperationsAcaciawill,intheinterim,satisfytherequirementsimposedasregardstheincreasedroyaltyrateinadditiontotherecentlyimposed1%clearingfeeonexports.Acaciaismakingthesepaymentsunderprotest,withoutprejudicetoitslegalrightsunderitsMDAs.
AcaciahasbeenlookingtoaddressallissuesinrespectoftheBanalongwithotherongoingdisputesthroughdialoguewiththeTanzanianGovernment.AcaciaremainsoftheviewthatanegotiatedresolutionisthepreferableoutcometothecurrentdisputesandAcaciawillcontinuetoworktoachievethis.Duringthethirdquarterof2017,BarrickandtheGovernmentofTanzaniaengagedindiscussionsforthepotentialresolutionofthedisputes.AcaciadidnotparticipatedirectlyinthesediscussionsastheGovernmentofTanzaniahadinformedBarrickthatitwishedtocontinuedialoguesolelywithBarrick.
OnOctober19,2017,BarrickannouncedthatithadagreedwiththeGovernmentofTanzaniaonaproposedframeworkforanewpartnershipbetweenAcaciaandtheGovernmentofTanzania.BarrickandtheGovernmentofTanzaniaalsoagreedtoformaworkinggroupthatwillfocusontheresolutionofoutstandingtaxclaimsagainstAcacia.KeytermsoftheproposedframeworkannouncedbyBarrickandtheGovernmentofTanzaniainclude:(i)thecreationofanewTanzaniancompanytomanageAcacia’sBulyanhulu,BuzwagiandNorthMaraminesandallfutureoperationsinthecountrywithkeyofficerslocatedinTanzaniaandTanzanianrepresentationontheboardofdirectors;(ii)maximizationoflocalemploymentofTanzaniansandprocurementofgoodsandserviceswithinTanzania;(iii)economicbenefitsfromBulyanhulu,BuzwagiandNorthMaratobesharedona50/50basis,withtheGovernment’s
-109-
sharedeliveredintheformofroyalties,taxesanda16%freecarryinterestinAcacia’sTanzanianoperations;and(iv)insupportoftheworkinggroup’songoingeffortstoresolveoutstandingtaxclaims,Acaciawouldmakeapaymentof$300milliontotheGovernmentofTanzania,stagedovertime,ontermstobesettledbytheworkinggroup.BarrickandtheGovernmentofTanzaniaarealsoreviewingtheconditionsfortheliftingoftheBan.Negotiationsconcerningtheproposedframeworkremainongoingandthedefinitivetermsofanyfinalproposalfortheimplementationoftheframeworkremainoutstanding.SuchtermswouldbesubjecttoreviewandapprovalbyAcacia.
General
Barrickanditssubsidiariesare,fromtimetotime,involvedinvariousclaims,legalproceedingsandcomplaintsarisingintheordinarycourseofbusiness.Barrickisalsosubjecttoreassessmentforincomeandminingtaxesforcertainyears.Theresultsofpendingorthreatenedproceedingsrelatedtoanypotentialtaxassessmentsorothermatterscannotbepredictedwithcertainty.
RISKFACTORS
TherisksdescribedbelowarenottheonlyonesfacingBarrick.AdditionalrisksnotcurrentlyknowntoBarrick,orthatBarrickcurrentlydeemsimmaterial,mayalsoimpairBarrick’soperations.
Metal price volatility
Barrick’sbusinessisstronglyaffectedbytheworldmarketpriceofgoldandcopper.IftheworldmarketpriceofgoldorcopperwastodropandthepricesrealizedbyBarrickongoldorcoppersalesweretodecreasesignificantlyandremainatsuchalevelforanysubstantialperiod,Barrick’sprofitabilityandcashflowwouldbenegativelyaffected.
Goldandcopperpriceshavefluctuatedwidelyinrecentyears.Thesefluctuationscanbematerialandcanoccurovershortperiodsoftimeandareaffectedbynumerousfactors,allofwhicharebeyondBarrick’scontrol.FutureproductionfromBarrick’sminingpropertiesisdependentongoldandcopperpricesthatareadequatetomakethesepropertieseconomicallyviable.During2017,thegoldpricerangedfrom$1,146perounceto$1,358perounce.Theaveragemarketpriceofgoldin2017was$1,257perounce,anincreaseof0.5%comparedtothe2016average.BasedoncurrentestimatesofBarrick’s2018goldproductionandsales,a$100perounceincreaseordecreaseinthemarketgoldpricewillresultinanapproximately$468millionincreaseordecreaseintheCompany’srevenue,netofroyalties,excludingtheimpactofBarrick’shedgingstrategies.Factorstendingtoaffectthepriceofgoldinclude:
• industrialandjewelrydemand;
• thelevelofdemandforgoldasaninvestment;
• centralbanklending,salesandpurchasesofgold;
• thevolumeofrecycledmaterialavailableinthemarket;
• speculativetrading;and
• costsandlevelsofglobalgoldproductionbyproducersofgold.
Goldpricesmayalsobeaffectedbymacroeconomicfactors,including:
• expectationsofthefuturerateofinflation;
-110-
• thestrengthof,andconfidencein,theU.S.dollar,thecurrencyinwhichthepriceofgoldisgenerallyquoted,andothercurrencies;
• thevalueofalternativeinvestments,includingglobalequityprices;
• interestrates;and
• globalorregional,politicaloreconomicuncertainties.
BasedoncurrentestimatesofBarrick’s2018copperproductionandsales,a$0.50perpoundincreaseordecreaseinthemarketcopperpricewillresultinanapproximately$205millionincreaseor$180milliondecreaseintheCompany’srevenue,netofroyalties,excludingtheimpactofBarrick’shedgingstrategies.Factorstendingtoaffectthepriceofcopperinclude:
• theworldwidebalanceofcopperdemandandsupply;
• ratesofglobaleconomicgrowth,trendsinindustrialproductionandconditionsinthehousingandautomotiveindustries,allofwhichcorrelatewithdemandforcopper;
• economicgrowthandpoliticalconditionsinChina,whichhasbecomethelargestconsumerofrefinedcopperintheworld,andothermajordevelopingeconomies;
• speculativeinvestmentpositionsincopperandcopperfutures;
• theavailabilityofsecondarymaterialforsmelting;
• expectationsofthefuturerateofinflation;
• thepriceofinputcosts,includingfuel;
• theavailabilityandcostofsubstitutematerials;and
• currencyexchangefluctuations,includingtherelativestrengthoftheU.S.dollar.
Barrick’sgoldproductionissoldintothespotmarket.ThesalespriceforBarrick’scopperproductionisdeterminedprovisionallyatthedateofsalewiththefinalpricedeterminedbasedonmarketcopperpricesatafuturedatesetbythecustomer,generallyonetothreemonthsaftertheinitialdateofsale.Marketpricesforcoppermayfluctuateduringthisextendedsettlementperiod.ThepricesofBarrick’scoppersalesaremarked-to-marketatthebalancesheetdatebasedontheforwardcopperpricefortherelevantquotationalperiod.Allsuchmark-to-marketadjustmentsarerecordedincoppersalerevenues.Ifthemarketpriceforcopperdeclines,thefinalsalepricerealizedbytheCompanyatsettlementmaybelowerthantheprovisionalsalepriceinitiallyrecognizedbytheCompany,requiringnegativeadjustmentstoBarrick’saveragerealizedcopperpricefortherelevantperiod.
Inaddition,certainofBarrick’smineralprojectsincludeotherminerals(principallysilver),eachofwhichissubjecttopricevolatilitybasedonfactorsbeyondBarrick’scontrol.
Dependingonthemarketpriceoftherelevantmetal,Barrickmaydeterminethatitisnoteconomicallyfeasibletocontinuecommercialproductionatsomeorallofitsoperationsorthedevelopmentofsomeorallofitscurrentprojects,asapplicable,whichcouldhaveanadverseimpactonBarrick’sfinancialperformanceandresultsofoperations.Insuchacircumstance,Barrickmayalsocurtailorsuspendsomeorallofitsexplorationactivities,withtheresultthatdepletedreservesarenotreplaced.Inaddition,themarketvalueofBarrick’sgoldorcopperinventorymaybereducedandexistingreservesmaybereducedtotheextentthatorecannotbeminedandprocessedeconomicallyattheprevailingprices.
-111-
Foreign investments and operations
Barrickconductsorparticipatesinmining,developmentandexplorationandotheractivitiesthroughsubsidiariesand/orjointventuresinmanyforeigncountries,includingtheUnitedStates,Australia,Argentina,Chile,Peru,DominicanRepublic,PapuaNewGuinea,SaudiArabia,TanzaniaandZambia.Mininginvestmentsaresubjecttotherisksnormallyassociatedwithanyconductofbusinessinforeigncountriesincluding:
• renegotiation,cancellationorforcedmodificationofexistingcontracts;
• expropriationornationalizationofproperty;
• changesinlawsorpoliciesorincreasinglegalandregulatoryrequirementsofparticularcountries,includingthoserelatingtotaxation,royalties,imports,
exports,duties,currency,orotherclaimsbygovernmententities,includingretroactiveclaimsand/orchangesintheadministrationoflaws,policiesandpractices(see“LegalMatters–GovernmentControlsandRegulations”);
• uncertainpoliticalandeconomicenvironments,war,terrorism,sabotageandcivildisturbances;
• lackofcertaintywithrespecttoforeignlegalsystems,corruptionandotherfactorsthatareinconsistentwiththeruleoflaw;
• delaysinobtainingortheinabilitytoobtainormaintainnecessarygovernmentalpermitsortooperateinaccordancewithsuchpermitsorregulatoryrequirements;
• currencyfluctuations;
• restrictionsontheabilityoflocaloperatingcompaniestosellgold,copperorothermineralsoffshoreforU.S.dollars,andontheabilityofsuchcompaniestoholdU.S.dollarsorotherforeigncurrenciesinoffshorebankaccounts;
• importandexportregulations,includingrestrictionsontheexportofgold,copperorotherminerals;
• limitationsontherepatriationofearnings;
• relianceonadvisorsandconsultantsinforeignjurisdictionsinconnectionwithregulatory,permittingorothergovernmentalrequirements;and
• increasedfinancingcosts.
Operatinginemergingmarketscanincreasetheriskthatcontractualand/ormineralrightsmaybedisregardedorunilaterallyaltered.AspecialleaseagreementbetweentheDominicanStateandPVDCgovernsthedevelopmentandoperationofthePuebloViejomine,includingapplicabletaxrates.Barrickhasa60%equityinterestinPVDC.FollowingtheachievementofcommercialproductionatPuebloViejomineinJanuary2013,theDominicanStateengagedPVDCindiscussionstoamendtheSLA.TheseamendmentsbecameeffectiveonOctober5,2013andresultedinadditionalandacceleratedtaxrevenuestotheDominicanState.
OnMarch3,2017,theTanzanianMinistryofEnergyandMineralsimposedtheBan,abanonexportsofgold/copperconcentratefollowingadirectivemadebythePresidentoftheUnitedRepublicofTanzania.Despiteeffortstohavethisbanlifted,itcontinuestoremaininforceatthedatehereof.Inadditiontosuchban,newandamendedlegislationwaspassedinTanzaniainearlyJuly2017which,amongotherthings,increasedtheroyaltyrateapplicabletometallicmineralssuchasgold,copperandsilverto6%(from4%),andimposeda1%clearingfeeonthevalueofallmineralsexportedfromTanzaniafromJuly1,2017.TheTanzanianGovernmenthasalsoallegedthatAcaciafailedtodeclarerevenueintaxyears2000-2017andhasre-assessedAcaciaforapproximately$190billionforthatperiodwhichAcaciaconsiderstobeimplausible.See“–AcaciaMiningplc–ConcentrateExportBanand
-112-
RelatedDisputes”and“–AcaciaMiningplc–TanzanianRevenueAuthority”in“LegalMatters–LegalProceedings”.
Inadditiontopotentiallyaffectingthepriceofgold,copperandsilver,generalinflationarypressuresmayalsoaffectBarrick’slabor,commodityandotherinputcostsatoperationsinemergingmarkets,whichcouldhaveamateriallyadverseeffectonBarrick’sfinancialcondition,resultsofoperationsandcapitalexpendituresforthedevelopmentofitsprojects.Forexample,operatingandcapitalcostsatBarrick’sVeladeromineandPascua-LamaprojectinArgentinahavebeenimpactedinrecentyearsbysustainedinflationarypressuresinthatcountryandcurrencyfluctuations.
Therecanbeagreaterlevelofpolitical,socialandeconomicriskinemergingmarketscomparedtosomeothercountriesinwhichBarrickoperates.Operationsinemergingmarketsmaybesubjecttomorefrequentcivildisturbancesandcriminalactivitiessuchastrespass,illegalmining,sabotage,theftandvandalism.ThesedisturbancesandcriminalactivitieshavecauseddisruptionsatcertainofBarrick’soperationsorjointventures,includingthePorgerajointventureinPapuaNewGuinea(inwhichBarrickhasa47.5%interest),theLagunasNorteandPierina(nowinclosure)minesinPeru,thePuebloViejomineintheDominicanRepublic(inwhichBarrickhasa60%interest)andcertainofAcacia’soperationsinTanzania,occasionallyresultinginthesuspensionofoperations.Affectedsiteshavetakencertainmeasurestoprotecttheiremployees,propertyandproductionfacilitiesfromtheserisks,includingenteringintoarrangementswithlawenforcementagenciestoprovidepolicingandlawandorderintheareassurroundingtheapplicablesite.ThemeasuresthathavebeenimplementedbyBarrickorAcaciawillnotguaranteethatsuchincidentswillnotcontinuetooccurandsuchincidentsmayhaltordelayproduction,increaseoperatingcosts,resultinharmtoemployeesortrespassers,causedamagetoproductionfacilitiesorotherwisedecreaseoperationalefficiency,increasecommunitytensionsorresultincriminaland/orcivilliabilityforBarrick,Acaciaortheirrespectiveemployeesand/orfinancialdamagesorpenalties.
Similarly,differenteconomicandsocialissuesexistinemergingmarketswhichmayaffectBarrick’soperatingandfinancialresults.Forexample,infectiousdiseases(includingmalaria,HIV/AIDSandtuberculosis)aremajorhealthcareissuesinAfricancountries.InZambia,BarrickhascontinuedworkforcetrainingandhealthprogramsatitsLumwanaminetomaximizepreventionawarenessandminimizetheimpactofinfectiousdiseases,includingHIV/AIDSandmalaria.Similarly,inTanzania,Acacia,inwhichBarrickhasa63.9%equityinterest,hasimplementedinfectiousdiseaseprograms,includingmalariacontrolprogramsandHIV/AIDSawarenessandpreventionprograms.
Theforegoingrisksmaylimitordisruptoperatingminesorprojects,restrictthemovementoffunds,causeBarricktohavetoexpendmorefundsthanpreviouslyexpected,orresultinthedeprivationofcontractrightsorthetakingofpropertybynationalizationorexpropriationwithoutfaircompensation,andmaymateriallyadverselyaffectBarrick’sfinancialpositionorresultsofoperations.Certainoftheseriskshaveincreasedinrecentyears.Furthermore,intheeventofdisputesarisingfromBarrick’sactivitiesinArgentina,Chile,Peru,DominicanRepublic,PapuaNewGuinea,Tanzania,Zambia,SaudiArabiaandPakistan,BarrickhasbeenandmaycontinuetobesubjecttothejurisdictionofcourtsoutsideNorthAmericaandAustralia,whichcouldadverselyaffecttheoutcomeofthedispute.
Environmental, health and safety regulations
Barrick’sminingandprocessingoperationsanddevelopmentandexplorationactivitiesaresubjecttoextensivelawsandregulationsgoverningtheprotectionoftheenvironment,wastedisposal,workersafety,minedevelopment,watermanagementandprotectionofendangeredandotherspecialstatusspecies.Failuretocomplywithapplicableenvironmentalandhealthandsafetylawsandregulationscouldresultininjunctions,fines,suspensionorrevocationofpermitsandotherpenalties.WhileBarrick
-113-
strivestoachievefullcompliancewithallsuchlawsandregulationsandwithitsenvironmentalandhealthandsafetypermits,therecanbenoassurancethatBarrickwillatalltimesbeinfullcompliancewithsuchrequirements.Activitiesrequiredtoachievefullcompliancecanbecostlyandinvolveextendedtimelines.Failuretocomplywithsuchlaws,regulationsandpermitscanhaveseriousconsequences,includingdamagetoBarrick’sreputation;stoppingBarrickfromproceedingwiththedevelopmentofaproject;negativelyimpactingtheoperationorfurtherdevelopmentofamine;increasingthecostsofdevelopmentorproductionandlitigationorregulatoryactionagainstBarrick,andmaymateriallyadverselyaffectBarrick’sbusiness,resultsofoperationsorfinancialcondition.
FuturechangesinapplicableenvironmentalandhealthandsafetylawsandregulationscouldsubstantiallyincreasecostsandburdenstoachievecomplianceorotherwisehaveanadverseimpactonBarrick’sbusiness,resultsofoperationsorfinancialcondition(see“–Governmentregulationandchangesinlegislation”).
Barrickmayalsobeheldresponsibleforthecostsofaddressingcontaminationatthesiteofcurrentorformeractivitiesoratthirdpartysites.Barrickcouldalsobeheldliabletothirdpartiesforexposuretohazardoussubstances.Thecostsassociatedwithsuchresponsibilitiesandliabilitiesmaybesignificant.WhileBarrickhasimplementedextensivehealthandsafetyinitiativesatitssitestoprotectthehealthandsafetyofitsemployees,contractorsandmembersofthecommunitiesaffectedbyitsoperations,thereisnoguaranteethatsuchmeasureswilleliminatetheoccurrenceofaccidentsorotherincidentswhichmayresultinpersonalinjuriesordamagetoproperty,andincertaininstancessuchoccurrencescouldgiverisetoregulatoryfinesand/orcivilliability.
IncertainofthecountriesinwhichBarrickhasoperations,itisrequiredtosubmit,forgovernmentapproval,areclamationplanforeachofitsminingsitesthatestablishesBarrick’sobligationtoreclaimpropertyaftermineralshavebeenminedfromthesite.Insomejurisdictions,bondsorotherformsoffinancialassurancesarerequiredsecurityforthesereclamationactivities.Barrickmayincursignificantcostsinconnectionwiththesereclamationactivities,whichmaymateriallyexceedtheprovisionsBarrickhasmadeforsuchreclamation.Inaddition,theunknownnatureofpossiblefutureadditionalregulatoryrequirementsandthepotentialforadditionalreclamationactivitiescreatefurtheruncertaintiesrelatedtofuturereclamationcosts,whichmayhaveamaterialadverseeffectonBarrick’sfinancialcondition,liquidityorresultsofoperations.Barrickisinvolvedinvariousinvestigativeandremedialactions.Therecanbenoassurancethatthecostsofsuchactionswouldnotbematerial.Whenapreviouslyunrecognizedreclamationliabilitybecomesknownorapreviouslyestimatedcostisincreased,theamountofthatliabilityoradditionalcostisexpensed,whichmaymateriallyreducenetincomeinthatperiod.
Inaddition,Barrick’sactivitiesandownershipinterestscouldexposetheCompanytoliabilityintheU.S.underCERCLAanditsstatelawequivalents.UnderCERCLAanditsstatelawequivalents,presentorpastownersofapropertymaybeheldjointlyandseverallyliableforcleanupcostsorforcedtoundertakeremedialactionsinresponsetounpermittedreleasesofhazardoussubstancesatsuchproperty,inadditionto,amongotherpotentialconsequences,potentialliabilitytogovernmentalentitiesforthecostofdamagestonaturalresources,whichmaybesubstantial.Thesesubjectpropertiesarereferredtoas“superfund”sites.ThereisachancethatourcurrentorlegacyoperationsintheU.S.couldbedesignatedasasuperfundsiteinthefuture,exposingBarricktopotentialliabilityunderCERCLA.
Permits
Barrick’sminingandprocessingoperationsanddevelopmentandexplorationactivitiesaresubjecttoextensivepermittingrequirements.Failuretoobtainrequiredpermitsand/ortomaintaincompliancewithpermitsonceobtainedcouldresultininjunctions,fines,suspensionorrevocationofpermitsandotherpenalties.WhileBarrickstrivestoobtainandcomplywithallofitsrequiredpermits,therecanbeno
-114-

assurancethatBarrickwillobtainallsuchpermitsand/orachieveormaintainfullcompliancewithsuchpermitsatalltimes.Activitiesrequiredtoobtainand/orachieveormaintainfullcompliancewithsuchpermitscanbecostlyandinvolveextendedtimelines.Previouslyissuedpermitsmaybesuspendedorrevokedforavarietyofreasons,includingthroughgovernmentorcourtaction(see“LegalMatters–LegalProceedings–Pascua-Lama–SMARegulatorySanctions”forinformationregardingthestatusoftheChileanenvironmentalapprovalforthePascua-Lamaproject).Failuretoobtainand/orcomplywithrequiredpermitscanhaveseriousconsequences,includingdamagetoBarrick’sreputation;stoppingBarrickfromproceedingwiththedevelopmentofaproject;negativelyimpactingtheoperationorfurtherdevelopmentofamine;increasingthecostsofdevelopmentorproductionandlitigationorregulatoryactionagainstBarrick,andmaymateriallyadverselyaffectBarrick’sbusiness,resultsofoperationsorfinancialcondition.
Barrick’sabilitytosuccessfullyobtainandmaintainkeypermitsandapprovalswillbeimpactedbyitsabilitytodevelop,operateandcloseminesinamannerthatisconsistentwiththecreationofsocialandeconomicbenefitsinthesurroundingcommunitiesandmaybeadverselyimpactedbyrealorperceiveddetrimentaleventsassociatedwithBarrick’sactivitiesorthoseofotherminingcompaniesaffectingtheenvironment,humanhealthandsafetyorthesurroundingcommunities.Barrickhasmade,andexpectstomakeinthefuture,significantexpenditurestocomplywithpermittingrequirementsand,totheextentreasonablypracticable,createsocialandeconomicbenefitinthesurroundingcommunities.
Climate change risks
Barrick’sminingandprocessingoperationsareenergyintensive,resultinginasignificantcarbonfootprint.Barrickacknowledgesclimatechangeasaninternationalandcommunityconcern.Anumberofgovernmentsorgovernmentalbodieshaveintroducedorarecontemplatingregulatorychangesinresponsetothepotentialimpactsofclimatechange.Wherelegislationalreadyexists,regulationrelatingtoemissionlevelsandenergyefficiencyisbecomingmorestringent.Someofthecostsassociatedwithreducingemissionscanbeoffsetbyincreasedenergyefficiencyandtechnologicalinnovation.However,ifthecurrentregulatorytrendcontinues,thismayresultinincreasedcostsatsomeofitsoperations.Inaddition,thephysicalrisksofclimatechangemayalsohaveanadverseeffectatsomeofBarrick’soperations.Thesemayincludeextremeweatherevents,resourceshortages,changesinrainfallandstormpatternsandintensities,watershortages,changingsealevelsandchangingtemperatures.
Replacement of depleted reserves
Barrick’smineralreservesmustbereplacedtomaintainproductionlevelsoverthelong-term.Reservescanbereplacedbyexpandingknownorebodies,locatingnewdepositsormakingacquisitions.Explorationishighlyspeculativeinnature.Barrick’sexplorationprojectsinvolvemanyrisksandarefrequentlyunsuccessful.Onceasitewithmineralizationisdiscovered,itmaytakeseveralyearsfromtheinitialphasesofdrillinguntilproductionispossible,duringwhichtimetheeconomicfeasibilityofproductionmaychange.Substantialexpendituresarerequiredtoestablishprovenandprobablereservesandtoconstructminingandprocessingfacilities.Asaresult,thereisnoassurancethatcurrentorfutureexplorationprogramswillbesuccessful.Depletionofreservesmaynotbeoffsetbydiscoveriesoracquisitionsanddivestituresofassetscouldleadtoalowerreservebase.In2017,aspartofmeetingitsdebtreductiontargetandfocusingonhigh-qualityassets,Barrickdisposedof50%ofitsinterestintheVeladeromineand25%ofitsinterestintheCerroCasaleproject,resultinginadecreaseinitsreservebase.Barrickmaycontinuetodisposeofadditionalassetsin2018orfutureyearsaspartofitsongoingdebtreductionstrategyandotherstrategicinitiatives,whichmayfurtherdepleteBarrick’sreserves.ReservesestimatedinaccordancewithNationalInstrument43-101mayalsodecreaseduetoeconomicfactorssuchastheuseofalowermetalpriceassumption.However,suchadeclinewouldnotbeareductionintheactualmineralbaseoftheCompany,astheouncesremovedfromBarrick’sreservesdue
-115-

totheuseofalowergoldpriceassumptionwouldbetransferredtoresources,preservingtheoptiontoaccesstheminthefutureathighergoldprices.ThemineralbaseofBarrickwilldeclineifreservesareminedwithoutadequatereplacementandBarrickmaynotbeabletosustainproductiontoorbeyondthecurrentlycontemplatedminelives,basedoncurrentproductionrates.
OnFebruary6,2018,followingthedecisionoftheSMAtoordertheclosureoftheexistinginfrastructureontheChileansideofthePascua-Lamaproject(see“LegalMatters–LegalProceedings–Pascua-Lama–SMARegulatorySanctions”),theCompanyannouncedthatapproximately14millionouncesofPascua-Lama’sprovenandprobablereserveswerereclassifiedasmeasuredandindicatedresources.Barrickcontinuestoevaluateanunderground,block-cavingoperationatPascua-Lamawhichmayresultinthereclassificationofsomeoralloftheseresourcesbacktoreserves.However,therecanbenoassurancethattheseresourceswilleverbeupgradedtoreserveswiththeuseofanunderground,block-cavingoperationoranyotherminingmethod.
Projects
Barrick’sabilitytosustainorincreaseitspresentlevelsofgoldandcopperproductionisdependentinpartonthesuccessofitsprojects.Therearemanyrisksandunknownsinherentinallprojects.Forexample,theeconomicfeasibilityofprojectsisbaseduponmanyfactors,including:
• theaccuracyofreserveestimates;
• metallurgicalrecoverieswithrespecttogold,copperandby-products;
• capitalandoperatingcostsofsuchprojects;
• thetimetablesfortheconstruction,commissioningandramp-upofsuchprojectsandanydelaysorinterruptions;
• theaccuracyofengineeringandchangesinscope;
• theabilitytomanagelarge-scaleconstruction;
• thefuturepricesoftherelevantminerals;and
• theabilitytosecureappropriatefinancingtodevelopsuchprojects.
TheCompany’sabilitytomaintainitslicensetooperateinallofthejurisdictionsinwhichBarrickhasprojectsisalsoimportanttothesuccessofthoseprojects(see“–Communityrelationsandlicensetooperate”).
Projectsalsorequirethesuccessfulcompletionoffeasibilitystudies,theresolutionofvariousfiscal,taxandroyaltymatters,theissuanceof,andcompliancewith,necessarygovernmentalpermitsandtheacquisitionofsatisfactorysurfaceorotherlandrights.ItmayalsobenecessaryforBarrickto,amongotherthings,findorgeneratesuitablesourcesofwaterandpowerforaproject,ensurethatappropriatecommunityinfrastructureisdevelopedbythirdpartiestosupporttheprojectandtosecureappropriatefinancingtofundtheseexpenditures(see“–Globalfinancialconditions”and“–Liquidityandlevelofindebtedness”).Itisalsonotunusualintheminingindustryfornewminingoperationstoexperienceunexpectedproblemsduringthestart-upphase,resultingindelaysandrequiringtheinvestmentofmorecapitalthananticipated.
Projectshavenooperatinghistoryuponwhichtobaseestimatesoffuturefinancialandoperatingperformance,includingfuturecashflow.Thecapitalexpendituresandtimerequiredtodevelopnewminesorotherprojectsareconsiderableandchangesincostsorconstructionschedulescanaffectprojecteconomics.Thus,itispossiblethatactualcostsmayincreasesignificantlyandeconomicreturnsmaydiffermateriallyfromBarrick’sestimatesorthatmetalpricesmaydecreasesignificantlyorthatBarrick
-116-
couldfailtoobtainthesatisfactoryresolutionoffiscalandtaxmattersorthegovernmentalapprovalsnecessaryfortheoperationofaprojectorobtainprojectfinancingonacceptabletermsandconditionsoratall,inwhichcase,theprojectmaynotproceedeitheronitsoriginaltimingoratall.Infact,Barrick’sPascua-Lamaprojecthasexperiencedasignificantincreaseinitscapitalcostestimateandlengthofconstructionschedulesincethefeasibilitystudyontheproject.Theprojecthasbeensuspendedsince2013andadecisiontoproceedwithdevelopmentofanundergroundminewilldependonimprovedeconomicsandmorecertaintyrelatingtolegalandpermittingmatters(formoreinformation,see“ExplorationandEvaluations–Pascua-Lama”).
IfBarrickdeclinestoadvanceaprojectonaparticulartimetableoratall,therightsassociatedwiththeprojectcouldbenegativelyaffected.
Liquidity and level of indebtedness
AsofDecember31,2017,Barrickhadcashandcashequivalentsofapproximately$2.2billionandcapitalleasesandtotaldebtofapproximately$6.4billion.AlthoughBarrickhasbeensuccessfulinrepayingdebtinthepastandissuingnewdebtsecuritiesincapitalmarketstransactions,therecanbenoassurancethatitcancontinuetodoso.Inaddition,Barrickmayassumeadditionaldebtinfutureperiodsorreduceitsholdingsofcashandcashequivalentsinconnectionwithfundingfutureacquisitions,existingoperations,capitalexpenditures,dividendsorinpursuingotherbusinessopportunities.Barrick’slevelofindebtednesscouldhaveimportantconsequencesforitsoperations,including: • Barrickmayneedtousealargeportionofitscashflowtorepayprincipalandpayinterestonitsdebt,whichwillreducetheamountoffundsavailabletofinance
itsoperationsandotherbusinessactivities;and
• Barrick’sdebtlevelmaylimititsabilitytopursueotherbusinessopportunities,borrowmoneyforoperationsorcapitalexpendituresinthefutureorimplementitsbusinessstrategy.
AsofDecember31,2017,Barrickhadapproximately$32millionindebtmaturingbytheendof2018.Thisamountexcludes$27millionincapitalleasepaymentsin2018andincludes$28millioninprojectfinancingpaymentsatAcacia(100%basis).Currently,$3.977billionoftheCompany’s$4.0billionrevolvingcreditfacilityterminatesinJanuary2023,whiletheremaining$23millionterminatesinJanuary2020.
Barrickistargetingreducingitstotaldebttoapproximately$5billionbytheendof2018.TheCompanyexpectstoachievethisprimarilybyusingcashflowfromoperationsandcashonhand,andpotentiallythroughfurtherportfoliooptimization.Barrickintendstocontinuetopursuedebtreductionwithdiscipline,takingonlythoseactionsthataresensiblefortheCompany,ontermsfavourabletoshareholders.Therecanbenoassurancethattheseinitiativeswillbesuccessfullycompletedor,ifcompleted,thattheywillbesufficienttoachievethestateddebtreductionobjectives.
Inadditiontofuturecashflowfromoperations,potentialdivestmentsandthecreationofnewjointventuresandpartnerships,Barrick’spotentialothersourcesofliquidityforthepaymentofitsexpensesandprincipalandinterestpayableonitsdebtin2018includeissuingadditionalequityorunsecureddebtandborrowingundertheCompany’s$4.0billionrevolvingcreditfacility(subjecttocompliancewithcovenantsandthemakingofcertainrepresentationsandwarranties).ThekeyfinancialcovenantinBarrick’s$4.0billionrevolvingcreditfacility,asamendedinthefourthquarterof2015,requiresBarricktomaintainanetdebttototalcapitalizationratiooflessthan0.60:1(asofDecember31,2017,thisratiowasapproximately0.27:1).Barrick’sabilitytoreduceitsindebtednessandmeetitspaymentobligationswilldependonitsfuturefinancialperformance,whichwillbeimpactedbyfinancial,business,economic
-117-

andotherfactors.Barrickwillnotbeabletocontrolmanyofthesefactors,suchaseconomicconditionsinthemarketsinwhichitoperates.BarrickcannotbecertainthatitsexistingcapitalresourcesandfuturecashflowfromoperationswillbesufficienttoallowittopayprincipalandinterestonBarrick’sdebtandmeetitsotherobligations.Iftheseamountsareinsufficientorifthereisacontraventionofitsdebtcovenants,Barrickmayberequiredtorefinanceallorpartofitsexistingdebt,sellassets,borrowmoremoneyorissueadditionalequity.TheabilityofBarricktoaccessthebank,publicdebtorequitycapitalmarketsonanefficientbasismaybeconstrainedbyadislocationinthecreditmarketsand/orcapitaland/orliquidityconstraintsinthebanking,debtand/orequitymarketsatthetimeofissuance.See“–Globalfinancialconditions”.IfBarrickisunabletomaintainitsindebtednessandfinancialratiosatlevelsacceptabletoitscreditratingagencies,orshouldBarrick’sbusinessprospectsdeteriorate,theratingscurrentlyassignedtoBarrickbyMoody’sInvestorServices,Standard&Poor’sRatingsServicesorDBRScouldbedowngraded,whichcouldadverselyaffectthevalueofBarrick’soutstandingsecuritiesandexistingdebtanditsabilitytoobtainnewfinancingonfavourableterms,andincreaseBarrick’sborrowingcosts.
Barrickisalsoexposedtoliquidityandvariouscounterpartyrisksincluding,butnotlimitedto:(i)Barrick’slendersandotherbankingcounterparties;(ii)Barrick’sinsuranceproviders;(iii)financialinstitutionsthatholdBarrick’scash;(iv)companiesthathavepayablestoBarrick,includingconcentratecustomers;and(v)companiesthathavereceiveddepositsfromBarrickforthefuturedeliveryofequipment.
Global financial conditions
Followingtheonsetofthecreditcrisisin2008,globalfinancialconditionswerecharacterizedbyextremevolatilityandseveralmajorfinancialinstitutionseitherwentintobankruptcyorwererescuedbygovernmentalauthorities.Whileglobalfinancialconditionssubsequentlystabilized,thereremainsconsiderableriskinthesystemgiventheextraordinarymeasuresadoptedbygovernmentauthoritiestoachievethatstability.Globalfinancialconditionscouldsuddenlyandrapidlydestabilizeinresponsetofutureeconomicshocks,asgovernmentauthoritiesmayhavelimitedresourcestorespondtofuturecrises.Futureeconomicshocksmaybeprecipitatedbyanumberofcauses,includingariseinthepriceofoil,geopoliticalinstabilityandnaturaldisasters.AnysuddenorrapiddestabilizationofglobaleconomicconditionscouldimpactBarrick’sabilitytoobtainequityordebtfinancinginthefutureontermsfavourabletoBarrick.Additionally,anysuchoccurrencecouldcausedecreasesinassetvaluesthataredeemedtobeotherthantemporary,whichmayresultinimpairmentlosses.Further,insuchanevent,Barrick’soperationsandfinancialconditioncouldbeadverselyimpacted.
Inflation
Inadditiontopotentiallyaffectingthepriceofgold,copperandsilver,generalinflationarypressuresmayalsoaffectBarrick’slabor,commodityandotherinputcosts,whichcouldhaveamateriallyadverseeffectonBarrick’sfinancialcondition,resultsofoperationsandcapitalexpendituresforthedevelopmentofitsprojects.Inparticular,operatingandcapitalcostsatBarrick’sVeladeromineandPascua-LamaprojectinArgentinahavebeenimpactedbysustainedinflationarypressuresinthatcountry.See“–Metalpricevolatility”,“–Projects”,“–Pricevolatilityandavailabilityofothercommodities”,“–Productionandcostestimates”and“–Availabilityandincreasedcostofcriticalparts,equipmentandskilledlabor”.
Mineral reserves and resources
Barrick’smineralreservesandmineralresourcesareestimates,andnoassurancecanbegiventhattheestimatedreservesandresourcesareaccurateorthattheindicatedlevelofgold,copperoranyother
-118-
mineralwillbeproduced.Suchestimatesare,inlargepart,basedoninterpretationsofgeologicaldataobtainedfromdrillholesandothersamplingtechniques.Actualmineralizationorformationsmaybedifferentfromthosepredicted.Further,itmaytakemanyyearsfromtheinitialphaseofdrillingbeforeproductionispossible,andduringthattimetheeconomicfeasibilityofexploitingadiscoverymaychange.
TheSECdoesnotpermitminingcompaniesintheirfilingswiththeSECtodiscloseestimatesotherthanmineralreserves.However,becauseBarrickpreparesthisAnnualInformationForminaccordancewiththedisclosurerequirementsofCanadiansecuritieslaws,itcontainsresourceestimates,whicharerequiredbyNationalInstrument43-101.Mineralresourceestimatesforpropertiesthathavenotcommencedproductionarebased,inmanyinstances,onlimitedandwidelyspaceddrillholeinformation,whichisnotnecessarilyindicativeoftheconditionsbetweenandarounddrillholes.Accordingly,suchmineralresourceestimatesmayrequirerevisionasmoredrillinginformationbecomesavailable,asactualproductionexperienceisgainedorastheCompany’sminingmethodsarechanged.Forexample,iftheCompanyultimatelydecidestoproceedwithaphasedundergrounddevelopmentatPascua-Lama,theamountofresourcesultimatelyreclassifiedbacktoreservesmaybelessthantheamountofreservesoriginallycontemplatedundertheoriginalopenpitplanforPascua-Lama.NoassurancecanbegiventhatanypartorallofBarrick’smineralresourcesconstituteorwillbeconvertedintoreserves.
Marketpricefluctuationsofgold,copper,silverandcertainothermetals,aswellasincreasedproductionandcapitalcostsorreducedrecoveryrates,mayrenderBarrick’sprovenandprobablereservesuneconomictodevelopataparticularsiteorsitesforperiodsoftimeormayrendermineralreservescontainingrelativelylowergrademineralizationuneconomic.Moreover,short-termoperatingfactorsrelatingtothemineralreserves,suchastheneedfortheorderlydevelopmentoforebodies,theprocessingofnewordifferentoregrades,thetechnicalcomplexityoforebodies,unusualorunexpectedorebodyformations,oredilutionorvaryingmetallurgicalandotherorecharacteristicsmaycausemineralreservestobereducedorBarricktobeunprofitableinanyparticularaccountingperiod.Estimatedreservesmayhavetoberecalculatedbasedonactualproductionexperience,fluctuationsinthepriceofmetals,orchangesinotherassumptionsonwhichtheyarebased.AnyofthesefactorsmayrequireBarricktoreduceitsmineralreservesandresources,whichcouldhaveanegativeimpactonBarrick’sfinancialresults.
FailuretoobtainormaintainnecessarypermitsorgovernmentapprovalsorchangestoapplicablelegislationcouldalsocauseBarricktoreduceitsreserves.Inaddition,changestomineplansduetocapitalallocationdecisionscouldcauseBarricktoreduceitsreserves.ThereisalsonoassurancethatBarrickwillachieveindicatedlevelsofgoldorcopperrecoveryorobtainthepricesassumedindeterminingsuchreserves.
Joint ventures
Barrickholdsanindirectinterestinanumberofjointventureproperties,includingtheVeladeromineinArgentina(50%),theZaldívarcoppermineinChile(50%),thePuebloViejomineintheDominicanRepublic(60%),thePorgeramineinPapuaNewGuinea(47.5%),theKalgoorliemineinAustralia(50%),theTurquoiseRidgemineinNevada(75%),theJabalSayidcoppermineinSaudiArabia(50%)andtheNorteAbierto(formerlyknownasCerroCasale)projectinChile(50%),theremaininginterestsinwhichareheldbythirdparties.Barrick’sinterestsinthesepropertiesaresubjecttotheriskscustomarilyassociatedwiththeconductofjointventures,including(i)disagreementwithjointventurepartnersonhowtodevelopandoperatethemineefficientlyor,inthecaseofexplorationprojects,ontheexplorationplanandrelatedexpenditures,(ii)inabilitytoexertinfluenceovercertainstrategicdecisions,(iii)inabilityofjointventurepartnerstomeettheirobligations,and(iv)litigationregardingjointventurematters.EachoftheseriskscouldhaveamaterialadverseimpactonBarrick’sprofitabilityortheviabilityofits
-119-

interestsheldthroughjointventures,whichcouldhaveamaterialadverseimpactonBarrick’sfuturecashflows,earnings,resultsofoperationsandfinancialcondition.Inaddition,Barrickisnotalwaystheoperatorofitsjointventureprojects.TotheextentBarrickisnottheoperator,thesuccessofanyoperationswillbedependentonthirdpartyoperatorsandBarrickmaybeunabletohaveanysignificantinfluenceonthedirectionorcontroloftheactivitiesoftheoperators.Barrickwillbesubjecttothedecisionsmadebytheoperatorsofthejointventurepropertiesandwillrelyontheoperatorsforaccurateinformationabouttheproperties.
Price volatility and availability of other commodities
TheprofitabilityofBarrick’sbusinessisaffectedbythemarketpricesofcommoditiesproducedasby-productsatBarrick’smines,suchassilver,aswellasthecostandavailabilityofcommoditiesandcriticalpartsandequipmentwhichareconsumedorotherwiseusedinconnectionwithBarrick’soperationsandprojects,including,butnotlimitedto,dieselfuel,naturalgas,electricity,acid,steel,concreteandcyanide.Pricesofsuchcommoditiescanbesubjecttovolatility,whichcanbematerialandcanoccurovershortperiodsoftime,andareaffectedbyfactorsthatarebeyondBarrick’scontrol.Anincreaseinthecost,ordecreaseintheavailability,ofconstructionmaterialssuchassteelandconcretemayaffectthetimingandcostofBarrick’sprojects.IfBarrick’sproceedsfromthesaleofby-productsweretodecreasesignificantly,orthecostsofcertaincommoditiesconsumedorotherwiseusedinconnectionwithBarrick’soperationsandprojectsweretoincrease,ortheiravailabilitytodecrease,significantly,andremainatsuchlevelsforasubstantialperiodoftime,BarrickmaydeterminethatitisnoteconomicallyfeasibletocontinuecommercialproductionatsomeorallofBarrick’soperations,orthedevelopmentofsomeorallofBarrick’scurrentprojects,whichcouldhaveanadverseimpactonBarrickasdescribedunder“–Metalpricevolatility”above.
Geotechnical challenges could impact profitability
Barrickandtheminingindustryarefacingcontinuedgeotechnicalchallengesassociatedwiththeagingofcertainminesandtheneedtominedeeperpitsandmorecomplexdeposits.Thisleadstohigherpitwalls,morecomplexundergroundoperationsandincreasedexposuretogeotechnicalinstability.AsBarrick’soperationsmature,theopenpitsandundergroundoperationsatcertainsitesaregettingdeeper.Barrickhasexperiencedgeotechnicalfailuresatsomeopenpitoperationsandseismiceventsatsomeundergroundoperations.Seismiceventsmayalsoaffectminingoperationsinotherways.Forexample,onFebruary26,2018,a7.5magnitudeearthquakestruckPapuaNewGuinea,causingsignificantdamagetotheHidesnaturalgaspowerplantthatsupplieselectricitytothePorgeramine.Noassurancescanbegiventhatunanticipatedadversegeotechnicalconditions,suchaspitwallfailures,undergroundcave-insandotherground-relatedinstability,willnotoccurinthefutureorthatsucheventswillbedetectedinadvance.GeotechnicalinstabilitiescanbedifficulttopredictandareoftenaffectedbyrisksbeyondBarrick’scontrol,suchassevereweather,higherthanaveragerainfallandseismicevents.Geotechnicalfailurescanresultinlimitedaccesstominesites,suspensionofoperations,productiondelays,governmentinvestigations,increasedcosts,aswellasinjuriesanddeathsinthemostextremecases.AllofthesecouldadverselyimpactBarrick’sresultsofoperationsandfinancialposition.
Infrastructure and information technology systems
Barrick’smining,processing,developmentandexplorationactivitiesdependonadequateinfrastructureanddependableinformationtechnologysystems.Reliablepowersources,watersupply,roadsandotherinfrastructureareimportantforBarrick’soperations.Watershortages,poweroutages,sabotage,community,governmentorotherinterferenceinthemaintenanceorprovisionofsuchinfrastructurecouldadverselyaffectBarrick’sbusiness,financialconditionandresultsofoperations.
-120-

Barrickisalsodependentuponinformationtechnologysystemsintheconductofitsoperations.TheCompanycouldbeadverselyaffectedbynetworkdisruptionsfromavarietyofsources,including,withoutlimitation,computerviruses,securitybreaches,cyber-attacks,naturaldisastersanddefectsindesign.Barrick’soperationsalsodependonthetimelymaintenance,upgradeandreplacementofnetworks,equipmentinformationtechnologysystemsandsoftware,aswellaspre-emptiveexpensestomitigatetheriskoffailure.Anyoftheseorothereventscouldresultininformationsystemfailures,delaysand/orincreasesincapitalexpenditures.Giventheunpredictabilityofthetiming,natureandscopeofinformationtechnologydisruptions,Barrickcouldpotentiallybesubjecttoproductiondowntimes,operationaldelays,destructionorcorruptionofdata,anyofwhichcouldhaveamaterialadverseeffectontheCompany’scashflows,competitiveposition,financialconditionorresultsofoperations.
Best-in-Class initiatives and digitization
ThroughitsBest-in-Classapproach,Barrickpursuesinitiativestoimprovetheproductivityandefficiencyofexistingsystemsandoperations,includingthroughinvestmentsindigitaltechnologies.TherecanbenocertaintythatsomeoranyofBarrick’sBest-in-ClassinitiativesandtargetedinvestmentswillmeettheCompany’scapitalallocationobjectives.Inaddition,certainBest-in-Classinitiativesarestillintheearlystagesofevaluation,andadditionalengineeringandotheranalysisisrequiredtofullyassesstheirimpact.Further,therecanbenocertaintyastothetimerequiredforBarricktoextractvaluefromitsdigitaltransformationinitiative,orthatBarrickwillachievetheexpectedsavingsorefficiencyimprovementsfromthisorotherBest-in-Classinitiatives.
Reputational risk
Asaresultoftheincreasedusageandthespeedandglobalreachofsocialmediaandotherweb-basedtoolsusedtogenerate,publishanddiscussuser-generatedcontentandtoconnectwithotherusers,companiestodayareatmuchgreaterriskoflosingcontroloverhowtheyareperceivedinthemarketplace.DamagetoBarrick’sreputationcanbetheresultoftheactualorperceivedoccurrenceofanynumberofevents,andcouldincludeanynegativepublicity(forexample,withrespecttoBarrick’shandlingofenvironmentalmattersortheCompany’sdealingswithcommunitygroups),whethertrueornot.Barrickplacesagreatemphasisonprotectingitsimageandreputation,buttheCompanydoesnotultimatelyhavedirectcontroloverhowitisperceivedbyothers.Reputationlossmayleadtoincreasedchallengesindevelopingandmaintainingcommunityrelations,decreasedinvestorconfidenceandanimpedimenttoBarrick’soverallabilitytoadvanceitsprojects,therebyhavingamaterialadverseimpactonfinancialperformance,cashflowsandgrowthprospects.
Mining risks and insurance risks
Theminingindustryissubjecttosignificantrisksandhazards,includingenvironmentalhazards,industrialaccidents,unusualorunexpectedgeologicalconditions,laborforcedisruptions,civilstrife,unavailabilityofmaterialsandequipment,weatherconditions,pitwallfailures,rockbursts,cave-ins,flooding,seismicactivityandwaterconditions,mostofwhicharebeyondBarrick’scontrol.Barrickisalsoexposedtotheftorlossofgoldbullion,coppercathodeorgold/copperconcentrate.Theserisksandhazardscouldresultin:damageto,ordestructionof,mineralpropertiesorproducingfacilities;personalinjuryordeath;environmentaldamage;delaysinmining;andmonetarylossesandpossiblelegalliability.Asaresult,productionmayfallbelowhistoricorestimatedlevelsandBarrickmayincursignificantcostsorexperiencesignificantdelaysthatcouldhaveamaterialadverseeffectonBarrick’sfinancialperformance,liquidityandresultsofoperations.
Barrickmaintainsinsurancetocoversomeoftheserisksandhazards.Theinsuranceismaintainedinamountsthatarebelievedtobereasonabledependingonthecircumstancessurroundingtheidentified
-121-
risk.Noassurancecanbegiventhatsuchinsurancewillcontinuetobeavailable,orthatitwillbeavailableateconomicallyfeasiblepremiums,orthatBarrickwillobtainormaintainsuchinsurance.Barrick’sproperty,liabilityandotherinsurancemaynotprovidesufficientcoverageforlossesrelatedtotheseorotherrisksorhazards.Inaddition,Barrickdoesnothavecoverageforcertainenvironmentallossesandotherrisks,assuchcoveragecannotbepurchasedatacommerciallyreasonablecost.Thelackof,orinsufficiencyof,insurancecoveragecouldadverselyaffectBarrick’scashflowandoverallprofitability.
Production and cost estimates
Barrickpreparesestimatesoffutureproduction,cashcostsandcapitalcostsofproductionforparticularoperations.Noassurancecanbegiventhatsuchestimateswillbeachieved.FailuretoachieveproductionorcostestimatesormaterialincreasesincostscouldhaveanadverseimpactonBarrick’sfuturecashflows,profitability,resultsofoperationsandfinancialcondition.
Barrick’sactualproductionandcostsmayvaryfromestimatesforavarietyofreasons,including:actualoreminedvaryingfromestimatesofgrade,tonnage,dilutionandmetallurgicalandothercharacteristics;short-termoperatingfactorsrelatingtoorereserves,suchastheneedforsequentialdevelopmentoforebodiesandtheprocessingofnewordifferentoregrades;revisionstomineplans;unusualorunexpectedorebodyformations;risksandhazardsassociatedwithmining;naturalphenomena,suchasinclementweatherconditions,wateravailability,floods,andearthquakes;andunexpectedlaborshortagesorstrikes.Costsofproductionmayalsobeaffectedbyavarietyoffactors,including:changingwaste-to-oreratios,oregrademetallurgy,laborcosts,thecostofcommodities,generalinflationarypressuresandcurrencyexchangerates.
Security and human rights
Civildisturbancesandcriminalactivities,suchastrespass,illegalmining,sabotage,theftandvandalism,havecauseddisruptionsatcertainofBarrick’soperations,includingthePorgerajointventureinPapuaNewGuineaoperatedbyBNL,theLagunasNorteandPierina(nowinclosure)minesinPeruandthePuebloViejomineintheDominicanRepublicandcertainofAcacia’soperationsinTanzania,occasionallyresultinginthesuspensionofoperations.Affectedsiteshavetakencertainmeasurestoprotecttheiremployees,propertyandproductionfacilitiesfromtheserisks.Certainsiteshaveengagedarmedandunarmedsecuritypersonnelandinstalledperimeterfencing,wallsandcamerasinsensitiveareas,suchasmainentrancesandprocessingplants.Somesiteshaveenteredintoarrangementswithlawenforcementagenciestoprovidepolicingandlawandorderintheareassurroundingtheapplicablesite.Incidentsofcriminalactivity,trespass,illegalmining,theftandvandalismhaveoccasionallyledtoconflictwithsecuritypersonneland/orpolice,whichinsomecasesresultedininjuriesand/orfatalities.ThemeasuresthathavebeenimplementedbytheCompanyorAcaciacannotguaranteethatsuchincidentswillnotcontinuetooccurandsuchincidentsmayhaltordelayproduction,increaseoperatingcosts,resultinharmtoemployeesortrespassers,decreaseoperationalefficiency,increasecommunitytensionsorresultincriminaland/orcivilliabilityfortheCompanyoritsemployeesand/orfinancialdamagesorpenalties.
ThemannerinwhichtheCompany’sorAcacia’spersonnelrespondtocivildisturbancesandcriminalactivitiescangiverisetoadditionalriskswherethoseresponsesarenotconductedinamannerthatisconsistentwithinternationalstandardsrelatingtotheuseofforceandrespectforhumanrights(see“NarrativeDescriptionoftheBusiness–CorporateSocialResponsiblity”).BarrickandAcaciahaveimplementedanumberofmeasuresandsafeguardswhicharedesignedtoassisttheirpersonnelinunderstandingandupholdingthesestandards.TheimplementationofthesemeasureswillnotguaranteethattheCompany’sorAcacia’spersonnelwillupholdthesestandardsineveryinstance.Thefailureto
-122-
conductsecurityoperationsinaccordancewiththesestandardscanresultinharmtoemployeesorcommunitymembers,increasecommunitytensions,reputationalharmtoBarrickanditspartnersorresultinlitigation,criminaland/orcivilliabilityfortheCompany,Acaciaortheirrespectiveemployeesand/orfinancialdamagesorpenalties.
Illegalmining,whichinvolvestrespassintotheoperatingareaofthemine,isbothasecurityandsafetyissueatthePorgerajointventureoperatedbyBNLandatcertainofAcacia’soperationsinTanzania.Theillegalminersfromtimetotimehaveclashedwithminesecuritystaffandlawenforcementpersonnelwhohaveattemptedtomovethemawayfromthefacilities.Thepresenceoftheillegalminers,giventhenatureofthemines’operations,createsasafetyissuefortheillegalminersaswellasBarrick’sandAcacia’semployeesandcancausedisruptionstomineoperations.
ItisnotpossibletodeterminewithcertaintythefuturecoststhatBarrickmayincurindealingwiththeissuesdescribedaboveatitsoperations.However,ifthenumberofincidentsincreases,costsassociatedwithsecurity,inthecaseofcivildisturbancesandillegalmining,mayalsoincrease,affectingprofitability.
Community relations and license to operate
TheCompany’srelationshipswiththecommunitiesinwhichitoperatesarecriticaltothefuturesuccessofitsexistingoperationsandtheconstructionanddevelopmentofitsprojects.Thereisanincreasinglevelofpublicconcernrelatingtotheperceivedeffectofminingactivitiesontheenvironmentandoncommunitiesimpactedbysuchactivities.Certainnon-governmentalorganizations(“NGOs”),someofwhichopposeglobalizationandresourcedevelopment,areoftenvocalcriticsoftheminingindustryanditspractices,includingtheuseofcyanideandotherhazardoussubstancesinprocessingactivities.AdversepublicitygeneratedbysuchNGOsorothersrelatedtoextractiveindustriesgenerally,orBarrick’soperationsspecifically,couldhaveanadverseeffectontheCompany’sreputationorfinancialconditionandmayimpactitsrelationshipwiththecommunitiesinwhichitoperates.WhileBarrickiscommittedtooperatinginasociallyresponsiblemanner,thereisnoguaranteethattheCompany’seffortsinthisrespectwillmitigatethispotentialrisk.
Government regulation and changes in legislation
TheCompany’sbusinessissubjecttovariouslevelsofgovernmentcontrolsandregulations,whicharesupplementedandrevisedfromtimetotime.Barrickisunabletopredictwhatlegislationorrevisionsmaybeproposedthatmightaffectitsbusinessorwhenanysuchproposals,ifenacted,mightbecomeeffective.Suchchanges,however,couldrequireincreasedcapitalandoperatingexpendituresandcouldpreventordelaycertainoperationsbytheCompany.TotheextentthatBarrickfailstoorisallegedtofailtocomplywithanyapplicableregulation,whetherinthefutureorinthepast,theCompanymaybeunabletocontinuetooperatesuccessfullyataparticularlocation.See“LegalMatters–GovernmentControlsandRegulations”.
Exchange and Capital Controls
FromtimetotimeemergingmarketcountriesinwhichtheCompanyoperatesorhasinterestshaveadoptedmeasurestorestricttheavailabilityofthelocalcurrencyortherepatriationofcapitalacrossborders.Thesemeasuresaretypicallyimposedbygovernmentsand/orcentralbanksduringtimesoflocaleconomicinstabilitytopreventtheremovalofcapitalorthesuddendevaluationoflocalcurrenciesortomaintainin-countryforeigncurrencyreserves.Inaddition,manyemergingmarketsrequiresupplementaryconsentsorreportingprocessesbeforelocalcurrencyearningscanbeconvertedintoU.S.dollarsorothercurrenciesand/orsuchearningscanberepatriatedorotherwisetransferredoutsideofthe
-123-
operatingjurisdiction.Furthermore,somejurisdictionsregulatetheamountofearningsthatcanbemaintainedbyoperatingentitiesinoff-shorebankaccountsandrequireadditionalearningstobeheldbybankslocatedinthecountryofoperation.
ThesemeasurescanhaveanumberofnegativeeffectsontheCompany’soperations.Forexample,exchangeandcapitalcontrolsreducethequantumofimmediatelyavailablecapitalthattheCompanycouldotherwisedeployforinvestmentopportunitiesorthepaymentofexpenses.Asaresult,theCompanymayberequiredtouseothersourcesoffundsfortheseobjectiveswhichmayresultinincreasedfinancingcosts.Inaddition,measuresthatrestricttheavailabilityofthelocalcurrencyorimposearequirementtooperateinthelocalcurrencymaycreatepracticaldifficultiesfortheCompany.
Currency fluctuations
CurrencyfluctuationsmayaffectthecostsBarrickincursatitsoperationsandmayaffectBarrick’soperatingresultsandcashflows.GoldandcopperareeachsoldthroughouttheworldbasedprincipallyontheU.S.dollarprice,butaportionofBarrick’soperatingexpensesareincurredinlocalcurrencies,suchastheAustraliandollar,Canadiandollar,Chileanpeso,Argentinepeso,Dominicanpeso,Peruviansol,PapuaNewGuineakina,TanzanianshillingandZambiankwacha.Appreciationofcertainnon-U.S.dollarcurrenciesagainsttheU.S.dollarwouldincreasethecostsofproductionatBarrick’smines,makingsuchmineslessprofitable.Fromtimetotime,Barrickentersintocurrencyhedgingcontractstomitigatetheimpactonoperatingcostsoftheappreciationofcertainnon-U.S.dollarcurrenciesagainsttheU.S.dollar.BarrickmayincuranopportunitylossiftheU.S.dollarappreciatesinvaluerelativetonon-U.S.dollarcurrencies.AsofDecember31,2017,Barrickhadnoforeigncurrencyderivativecontractsbeyondspotrequirements.TherecanbenoassurancethatBarrickwillenterintoforeigncurrencyhedgingactivitiesinthefuture.See“–Useofderivatives”.
U.S. Foreign Corrupt Practices Act and similar worldwide anti-bribery laws
TheForeignCorruptPracticesAct(UnitedStates)andtheCorruptionofForeignPublicOfficialsAct(Canada)andanti-briberylawsinotherjurisdictionsgenerallyprohibitcompaniesandtheirintermediariesfrommakingimproperpaymentsforthepurposeofobtainingorretainingbusinessorothercommercialadvantage.Barrick’spoliciesmandatecompliancewiththeseanti-briberylaws,whichoftencarrysubstantialpenalties.Barrickoperatesinjurisdictionsthathaveexperiencedgovernmentalandprivatesectorcorruptiontosomedegreeand,incertaincircumstances,strictcompliancewithanti-briberylawsmayconflictwithcertainlocalcustomsandpractices.TherecanbenoassurancethatBarrick’sinternalcontrolpoliciesandprocedureswillalwaysprotectitfromrecklessorotherinappropriateactscommittedbytheCompany’saffiliates,employeesoragents.Violationsoftheselaws,orallegationsofsuchviolations,couldhaveamaterialadverseeffectonBarrick’sreputation,aswellasbusiness,financialpositionandresultsofoperationsandcouldcausethemarketvalueofBarrick’scommonsharestodecline.
Interest rates
Asignificant,prolongeddecreaseininterestratescouldhaveamaterialadverseimpactontheinterestearnedonBarrick’scashbalances($2.2billionatDecember31,2017).TheCompany’sinterestrateexposuremainlyrelatestothemark-to-marketvalueofderivativeinstruments,thefairvalueofandongoingpaymentsunderU.S.dollarinterestrateswaps,thecarryingvalueofcertainlonglivedassetsandliabilities,andtotheinterestpaymentsonitsvariable-ratedebt($0.1billionatDecember31,2017).TherecanbenoassurancethatBarrickwillcontinuethehedgingactivitiesthatitcurrentlyundertakes.See“–Useofderivatives”.
-124-

Use of derivatives
Fromtimetotime,Barrickmayusecertainderivativeproductstomanagetherisksassociatedwithgold,copperandsilverpricevolatility,changesinothercommodityinputprices,interestrates,foreigncurrencyexchangeratesandenergyprices.Theuseofderivativeinstrumentsinvolvescertaininherentrisksincluding:(i)creditrisk–theriskthatthecreditworthinessofacounterpartymayadverselyaffectitsabilitytoperformitspaymentandotherobligationsunderitsagreementwithBarrickoradverselyaffectthefinancialandothertermsthecounterpartyisabletoofferBarrick;(ii)marketliquidityrisk–theriskthatBarrickhasenteredintoaderivativepositionthatcannotbeclosedoutquickly,byeitherliquidatingsuchderivativeinstrumentorbyestablishinganoffsettingposition;and(iii)unrealizedmark-to-marketrisk–theriskthat,inrespectofcertainderivativeproducts,anadversechangeinmarketpricesforcommodities,currenciesorinterestrateswillresultinBarrickincurringanunrealizedmark-to-marketlossinrespectofsuchderivativeproducts.ForasummaryofthederivativeinstrumentsusedintheCompany’scurrency,interestrateandcommodityhedgeprograms,seepage49oftheMD&AandNote25totheConsolidatedFinancialStatements.Seealso“–Globalfinancialconditions”.
Litigation
Barrickiscurrentlysubjecttolitigationandmaybeinvolvedindisputeswithotherpartiesinthefuturewhichmayresultinlitigation.Theresultsoflitigationcannotbepredictedwithcertainty.Thecostsofdefendingorsettlingsuchlitigationcanbesignificant.IfBarrickisunabletoresolvethesedisputesfavourably,itmayhaveamaterialadverseimpactonBarrick’sfinancialperformance,cashflowandresultsofoperations.See“LegalMatters–LegalProceedings”.
Holding of Acacia
OnMarch24,2010,Acaciabeganoperatingasaseparate,publiclytradedcompanythatholdsallofBarrick’sformerAfricangoldmines,goldprojectsandgoldexplorationproperties.Barrickretainedanequityinterestof73.9%inAcacia.Thisholdingwasreducedto63.9%followingapartialdivestmentofsharescompletedonMarch11,2014.BarrickandAcaciaarepartiestoarelationshipagreementthatregulatesvariousaspectsoftheongoingrelationshipbetweenthetwocompanies,theprincipalpurposeofwhichistoensurethatAcaciaiscapableofcarryingonitsbusinessindependentlyofBarrickandthatanytransactionsandrelationshipswithBarrickoccuratarm’slengthandundernormalcommercialterms.Accordingly,theboardofdirectorsand/orexecutivemanagementteamofAcaciamaydeterminetoundertakeactionsthataredifferentthanthosethattheboardofdirectorsand/orexecutivemanagementteamofBarrickwouldhavetaken.Inaddition,theminorityshareholdersofAcaciarepresentanimportantstakeholdergroupthatisrequiredtobeconsideredinAcacia’scorporategovernanceanddecision-making.Giventhepotentialdivergenceinstakeholderinterests,thereisariskthatactionsundertakenbyAcaciacoulddifferfromactionsthatwouldhavebeentakenbyBarrickandincertaincircumstancescouldadverselyaffectBarrick’sreputationand/orresultinpotentialcivilorcriminalliabilityfortheCompany.Inaddition,holdingacontrollingequityinterestinaLondonStockExchange-listedcompanysuchasAcaciaplacescertainpracticalandregulatoryconstraintsonthemannerinwhichBarrickcoulddisposeofitsinterestinAcacia,shoulditdetermineitwishestodoso.Furthermore,marketfluctuationscouldadverselyaffectthemarketpriceofAcaciaandthevaluewhichBarrickcouldrealizeonthisinvestment.
OnMarch3,2017,theTanzanianMinistryofEnergyandMineralsimposedtheBan,abanonexportsofgold/copperconcentrate,followingadirectivemadebythePresidentoftheUnitedRepublicofTanzania.Thisincludesgold/copperconcentrateexportedbyAcacia’sBulyanhuluandBuzwagimines.DespiteeffortstohavetheBanlifted,itcontinuestoremaininforceatthedatehereof.InadditiontotheBan,newandamendedlegislationwaspassedinTanzaniainearlyJuly2017,includingvarious
-125-
amendmentstothe2010MiningActandanewFinanceAct.Theamendmentstothe2010MiningActincreasedtheroyaltyrateapplicabletometallicmineralssuchasgold,copperandsilverto6%(from4%),andthenewFinanceActimposesa1%clearingfeeonthevalueofallmineralsexportedfromTanzaniafromJuly1,2017.InJanuary2018,newMiningRegulationswereannouncedbytheTanzanianGovernmentintroducing,amongotherthings,localcontentrequirements,exportregulationsandmineralrightsregulations,thescopeandeffectofwhichremainunderreviewbyAcacia.
TheTanzanianGovernmenthasalsoallegedthatAcaciafailedtodeclarerevenueintaxyears2000-2017andhasre-assessedAcaciaforapproximately$190billionforthatperiodwhichAcaciaconsiderstobeimplausible.See“–AcaciaMiningplc–ConcentrateExportBanandRelatedDisputes”and“–AcaciaMiningplc–TanzanianRevenueAuthority”in“LegalMatters–LegalProceedings”.
TherecanbenoassurancethatBarrickand/orAcaciawillcometoanagreementtoresolvetheBanorthetaxre-assessmentdescribedabove,orthattheGovernmentofTanzaniawillnotimposeothermeasuresthatmaynegativelyimpactAcacia’sperformanceoroperations.Failuretoreachasatisfactorysettlementwith,ortheimpositionofothermeasuresby,theGovernmentofTanzaniamayhaveamaterialadverseimpactonBarrick’scashflows,earnings,resultsofoperationsandfinancialposition.
Title to properties
Thevalidityofminingclaims,whichconstitutemostofBarrick’spropertyholdings,canbeuncertainandmaybecontested.AlthoughBarrickhasattemptedtoacquiresatisfactorytitletoitsproperties,someriskexiststhatsometitles,particularlytitletoundevelopedproperties,maybedefective.AnydisputesaboutBarrick’spropertyholdingsortitlemayhaveamaterialadverseimpactonBarrick’sfinancialperformance,cashflowandresultsofoperations.
Acquisitions and integration
Fromtimetotime,Barrickexaminesopportunitiestoacquireadditionalminingassetsandbusinesses.AnyacquisitionthatBarrickmaychoosetocompletemaybeofasignificantsize,maychangethescaleofBarrick’sbusinessandoperations,andmayexposeBarricktoneworgreatergeographic,political,operating,financial,legalandgeologicalrisks.Barrick’ssuccessinitsacquisitionactivitiesdependsonitsabilitytoidentifysuitableacquisitioncandidates,negotiateacceptabletermsforanysuchacquisitionandintegratetheacquiredoperationssuccessfullywiththoseofBarrick.Anyacquisitionswouldbeaccompaniedbyrisks.Forexample,theremaybeasignificantchangeincommoditypricesafterBarrickhascommittedtocompletethetransactionandestablishedthepurchasepriceorexchangeratio;amaterialorebodymayprovetobebelowexpectations;Barrickmayhavedifficultyintegratingandassimilatingtheoperationsandpersonnelofanyacquiredcompanies,realizinganticipatedsynergiesandmaximizingthefinancialandstrategicpositionofthecombinedenterprise,andmaintaininguniformstandards,policiesandcontrolsacrosstheorganization;theintegrationoftheacquiredbusinessorassetsmaydisruptBarrick’songoingbusinessanditsrelationshipswithemployees,customers,suppliersandcontractors;andtheacquiredbusinessorassetsmayhaveunknownliabilitieswhichmaybesignificant.IntheeventthatBarrickchoosestoraisedebtcapitaltofinanceanysuchacquisition,Barrick’sleveragewillbeincreased.IfBarrickchoosestouseequityasconsiderationforanysuchacquisition,existingshareholdersmaysufferdilution.Inaddition,manycompaniesintheminingindustryhaverecentlyseensubstantialdownwardpressureontheirequityvaluesafterannouncingsignificantacquisitions.ThereisariskthatifBarrickwastoannounceasignificantacquisition,thevalueofBarrick’scommonsharescoulddecreaseovertheshort-,medium-and/orlong-term.Barrickcannotassurethatitcancompleteanyacquisitionorbusinessarrangementthatitpursues,orispursuing,onfavourableterms,orthatanyacquisitionsorbusinessarrangementscompletedwillultimatelybenefitBarrick’sbusiness.Therecanbe
-126-
noassurancethatBarrickwouldbesuccessfulinovercomingtherisksnotedaboveoranyotherproblemsencounteredinconnectionwithsuchacquisitions.
Divestitures
Barrickhasrecentlysoldorreduceditsinterestincertainassets.Inconnectionwiththesedispositions,Barrickhasgivenrepresentationsandwarrantiesandindemnitiescustomaryfortransactionsofthistypeandmayhavealso,incertaincases,agreedtoretainresponsibilityforcertainliabilitiesrelatedtotheperiodpriortothesale.Asaresult,Barrickmayincurliabilityinthefutureassociatedwithassetsitnolongerownsorinwhichithasareducedinterest.
Employee relations
Barrick’sabilitytoachieveitsfuturegoalsandobjectivesisdependent,inpart,onmaintaininggoodrelationswithitsemployeesandminimizingemployeeturnover.WorkstoppagesorotherindustrialrelationseventsatBarrick’smajorcapitalprojectscouldleadtoprojectdelaysorincreasedcosts.Aprolongedlabordisruptionatanyofitsmaterialpropertiescouldhaveamaterialadverseimpactonitsoperationsasawhole.
Availability and increased cost of critical parts, equipment and skilled labor
Anincreaseinworldwidedemandforcriticalresourcessuchasinputcommodities,drillingequipment,tiresandskilledlabormaycauseunanticipatedcostincreasesanddelaysindeliverytimes,therebyimpactingtheCompany’soperatingcosts,capitalexpendituresandproductionschedules.
Internal control environment
Internalcontroloverfinancialreportingisaprocessdesignedtoprovidereasonableassuranceregardingthereliabilityoffinancialreportingandthepreparationoffinancialstatementsforexternalpurposesinaccordancewithgenerallyacceptedaccountingprinciples.Disclosurecontrolsandproceduresaredesignedtoensurethatinformationrequiredtobedisclosedbyacompanyinreportsfiledwithsecuritiesregulatoryagenciesisrecorded,processed,summarizedandreportedonatimelybasisandisaccumulatedandcommunicatedtoacompany’smanagement,includingitsPresidentandChiefFinancialOfficer,asappropriate,toallowtimelydecisionsregardingrequireddisclosure.Barrickhasinvestedresourcestodocumentandanalyzeitssystemofdisclosurecontrolsanditsinternalcontroloverfinancialreporting.Acontrolsystem,nomatterhowwelldesignedandoperated,canprovideonlyreasonable,notabsolute,assurancewithrespecttothereliabilityoffinancialreportingandfinancialstatementpreparation.See“InternalControlOverFinancialReportingandDisclosureControlsandProcedures”.
Competition
Barrickcompeteswithotherminingcompaniesandindividualsforminingclaimsandleasesonexplorationproperties,theacquisitionofminingassetsandaccesstowater,powerandotherrequiredinfrastructure.ThiscompetitionmayincreaseBarrick’scostofacquiringsuitableclaims,propertiesandassets,shouldtheybecomeavailabletoBarrick.Barrickalsocompeteswithotherminingcompaniestoattractandretainkeyexecutivesandemployees.TherecanbenoassurancethatBarrickwillcontinuetobeabletocompetesuccessfullywithitscompetitorsinacquiringproperties,assetsoraccesstoinfrastructureorinattractingandretainingskilledandexperiencedemployees.
-127-
Ability to support the carrying value of goodwill and non-current assets
AsofDecember31,2017,thecarryingvalueofBarrick’sgoodwillwasapproximately$1.3billionor5%ofBarrick’stotalassets.Goodwillisallocatedtoeachcashgeneratingunit(“CGU”),whereCGUsgenerallyrepresentindividualmineralproperties.Goodwillistestedannuallyforimpairmentatthebeginningofthefourthquarter.Inaddition,ateachreportingperiod,Barrickassesseswhetherthereisanindicationthatgoodwillisimpairedand,ifthereissuchanindication,Barricktestsforgoodwillimpairmentatthattime.Thetestforgoodwillimpairmentinvolvesacomparisonoftherecoverableamountofanoperatingsegmenttoitscarryingvalue.Agoodwillimpairmentchargeisrecognizedforanyexcessofthecarryingamountoftheoperatingsegmentoveritsrecoverableamount.
Non-currentassetsaretestedforimpairmentwheneventsorchangesincircumstancessuggestthatthecarryingamountoftheseassetsmaynotberecoverable.Theimpairmenttestiscarriedoutusingthesameapproachthatisusedforgoodwill.
Barrickrecordednetimpairmentreversalsof$7million(after-taxandourshare)onnon-currentassetsfortheyearendedDecember31,2017.ThisincludesimpairmentstakenatAcacia’sBulyanhuluminerelatedtothecontinuedchallengesexperiencedintheoperatingenvironmentinTanzaniaandnetimpairmentstakenatPascua-Lama,mainlyattributabletothereclassificationofopen-pitreservestoresourcesafterreceivingaclosureorderfromtheChileanregulators.Theassessmentforgoodwillandnon-currentassetimpairmentissubjectiveandrequiresmanagementtomakeestimatesandassumptionsforanumberoffactorsthatmarketparticipantswouldmakeabouttherecoverableamountoftheCGU,includingestimatesofproductionlevels,operatingcostsandcapitalexpendituresandpermittingassumptionsreflectedinBarrick’slifeofmineplans,aswellaseconomicfactorsbeyondmanagement’scontrol,suchasgoldandcopperprices,discountratesandobservablenetassetvaluemultiples.Shouldmanagement’sestimateofthefuturenotreflectactualevents,furthergoodwillornon-currentassetimpairmentchargesmaymaterializeandthetimingandamountofsuchimpairmentchargesaredifficulttopredict.
Market price of Barrick’s shares
Securitiesofminingcompanieshaveexperiencedvolatilityinthepast,attimesunrelatedtothefinancialperformanceorprospectsofthecompaniesinvolved.ThesefactorsincludemacroeconomicdevelopmentsinNorthAmericaandinternationally,currencyfluctuationsandmarketperceptionsoftheattractivenessofparticularindustries.ThepriceofBarrick’scommonsharesisalsolikelytobeaffectedbyshort-termchangesingoldandcopperprices.Asaresultofthesechanges,themarketpriceofBarrick’scommonsharesatanygivenpointintimemaynotaccuratelyreflectBarrick’slong-termvalue.Securitiesclassactionlitigationisalsobecomingmoreprevalentandisoftenbroughtagainstcompaniesfollowingperiodsofvolatilityinthemarketpriceoftheirsecurities.Barrickmayinthefuturebethetargetofsimilarlitigationwhichcouldresultinsubstantialdefensecostsanddivertmanagement’sattentionandresources.
Foreign Subsidiaries
AsignificantportionofBarrick’sbusinessiscarriedonthroughsubsidiaries,includingforeignsubsidiaries.Accordingly,anylimitationonthetransferofcashorotherassetsbetweentheparentcorporationandsuchentities,oramongsuchentities,couldrestrictBarrick’sabilitytofunditsoperationsefficiently.Anysuchlimitations,ortheperceptionthatsuchlimitationsmayexistnoworinthefuture,couldhaveanadverseimpactonBarrick’svaluationandstockprice.
-128-
MANAGEMENT’SDISCUSSIONANDANALYSISOFFINANCIALCONDITIONANDRESULTSOFOPERATIONS
ReferenceismadetotheManagement’sDiscussionandAnalysisofFinancialandOperatingResultsoftheCompany(IFRS)fortheyearendedDecember31,2017,whichisavailableonSEDARatwww.sedar.comandonEDGARatwww.sec.govasanexhibittoBarrick’sForm40-F.
CONSOLIDATEDFINANCIALSTATEMENTS
ReferenceismadetotheCompany’sConsolidatedFinancialStatementsasatandfortheyearendedDecember31,2017(IFRS),whichareavailableonSEDARatwww.sedar.comandonEDGARatwww.sec.govasanexhibittoBarrick’sForm40-F.
CAPITALSTRUCTURE
SetforthbelowisadescriptionofBarrick’ssharecapital.Thefollowingstatementsarebriefsummariesof,andaresubjecttotheprovisionsof,thearticlesofamalgamationandby-lawsofBarrickandtherelevantprovisionsoftheBusinessCorporationsAct(Ontario).
General
Barrick’sauthorizedsharecapitalconsistsofanunlimitednumberofBarrickcommonshares,anunlimitednumberoffirstpreferredsharesissuableinseries(the“FirstPreferredShares”)andanunlimitednumberofsecondpreferredsharesissuableinseries(the“SecondPreferredShares”).
CommonShares
TheholdersofBarrickcommonsharesareentitledtoonevoteforeachshareonallmatterssubmittedtoavoteofshareholdersanddonothavecumulativevotingrights.TheholdersofBarrickcommonsharesareentitledtoreceivedividendsif,asandwhendeclaredbytheBoardofDirectorsofBarrickinrespectoftheBarrickcommonshares.Subjecttothepriorrightsoftheholders,ifany,oftheFirstPreferredSharesandSecondPreferredSharesthenoutstandingandofthesharesthenoutstandingofanyotherclassrankingseniortotheBarrickcommonshares,theholdersofBarrickcommonsharesareentitledtoshareratablyinanydistributionoftheassetsofBarrickuponliquidation,dissolutionorwinding-up,aftersatisfactionofalldebtsandotherliabilities.AsofMarch19,2018,therewere1,166,892,835Barrickcommonsharesissuedandoutstanding.
Therights,preferencesandprivilegesofholdersofBarrickcommonsharesaresubjecttotherightsoftheholdersofsharesofanyseriesofFirstPreferredSharesorSecondPreferredSharesoranyotherclassrankingseniortotheBarrickcommonsharesthatBarrickmayissueinthefuture.
Therearenolimitationscontainedinthearticlesorby-lawsofBarrickorintheBusinessCorporationsAct(Ontario)ontheabilityofapersonwhoisnotaCanadianresidenttoholdBarrickcommonsharesorexercisethevotingrightsassociatedwithBarrickcommonshares.TheBarrickcommonsharesarenotsubjecttoanyexchange,conversion,exercise,redemption,retraction,surrenderorsimilarrightsorrestrictions.
-129-

PreferredShares
FirstPreferredSharesandSecondPreferredSharesmaybeissuedfromtimetotimeinseries.TheBoardofDirectorsoftheCompanydeterminesbyresolutionthedesignation,rights,privileges,restrictionsandconditionstobeattachedtoeachsuchseries.
TheCompanyisentitledtoredeemalloranypartoftheFirstPreferredSharesorSecondPreferredSharesofanyseriesonpaymentforeachshareoftheamountequaltotheresultobtainedwhenthestatedcapitalaccountfortheseriesisdividedbythenumberofissuedandoutstandingsharesofsuchseriestogetherwithsuchpremium,ifany,asmaybedeterminedbytheBoardofDirectorsinconnectionwithitsdeterminationofthedesignation,rights,privileges,restrictionsandconditionstobeattachedtotheapplicableseries,andalldeclaredandunpaiddividendsthereon.TheCompanyisalsoentitledtopurchaseforcancellationalloranypartoftheFirstPreferredSharesofanyseries.
TheFirstPreferredSharesandtheSecondPreferredSharesofeachseriesareentitledtoapreferenceoverthecommonsharesoftheCompanyandanyothersharesrankingjuniortotheFirstPreferredSharesorSecondPreferredShares,asthecasemaybe,withrespecttothepaymentofdividendsandthedistributionofassetsintheeventofaliquidation,dissolutionorwinding-upoftheCompany.AnyseriesofFirstPreferredSharesorSecondPreferredSharesmayalsobegivensuchotherpreferencesoverthecommonsharesandanyothersharesrankingjuniortotheFirstPreferredSharesorSecondPreferredShares,asthecasemaybe,asmaybedetermined.Intheeventofaliquidation,dissolutionorwinding-upoftheCompany,theholdersoftheFirstPreferredSharesareentitledtoreceive,intheaggregate,theamountofthestatedcapitalaccountoftheFirstPreferredSharesplusalldeclaredandunpaiddividendsplus,iftheliquidation,dissolutionorwinding-upisvoluntary,anypremiumtowhichtheshareswouldbeentitledonaredemption,beforeanyamountispaidorpropertyorassetsaredistributedtotheholdersofcommonsharesoranyothersharesrankingjuniortotheFirstPreferredShares.Afterpaymentofsuchamount,theholdersoftheFirstPreferredSharesarenotentitledtoshareinanyfurtherdistributionofthepropertyorassetsoftheCompany.Intheeventofaliquidation,dissolutionorwinding-upoftheCompany,theholdersoftheSecondPreferredSharesareentitledtoreceive,intheaggregate,theamountofthestatedcapitalaccountoftheSecondPreferredSharesplusalldeclaredandunpaiddividendsplus,iftheliquidation,dissolutionorwinding-upisvoluntary,anypremiumtowhichtheshareswouldbeentitledonaredemption,beforeanyamountispaidorpropertyorassetsaredistributedtotheholdersofcommonsharesoranyothersharesrankingjuniortotheSecondPreferredShares.Afterpaymentofsuchamount,theholdersoftheSecondPreferredSharesarenotentitledtoshareinanyfurtherdistributionofthepropertyorassetsoftheCompany.
TheholdersofFirstPreferredSharesandSecondPreferredSharesareentitledtoreceivefixed,non-cumulativepreferentialquarterlycashdividendsatsuchrateandonsuchdatesasmaybedeterminedbytheBoardofDirectorsinconnectionwithitsdeterminationofthedesignation,rights,privileges,restrictionsandconditionstobeattachedtotheapplicableseries.
TheapprovaloftheholdersoftheFirstPreferredSharesortheSecondPreferredSharesisrequiredtodeleteorvaryanyright,privilege,restrictionorconditionattachingtotheFirstPreferredSharesorSecondPreferredShares,asthecasemaybe,asaclassandanyothermatterrequiringtheapprovalorconsentoftheholdersoftheFirstPreferredSharesortheSecondPreferredShares,asthecasemaybe,asaclass.
ThefirstseriesofFirstPreferredSharesisdesignatedas“$0.114Non-cumulativeRedeemableConvertibleFirstPreferredShares,SeriesA”(the“FirstPreferredShares,SeriesA”),consistingof10,000,000FirstPreferredShares.Inadditiontotherights,privileges,restrictionsandconditionsattachedtotheFirstPreferredSharesasaclass,theFirstPreferredShares,SeriesAareentitledtofixed
-130-
non-cumulativepreferentialcashdividendsofC$0.114peryear,payablequarterlyandcanbeconvertedintocommonsharesonaoneforonebasis(subjecttoadjustment)ifcalledforredemption.TheredemptionpricefortheFirstPreferredShares,SeriesAisinitiallyC$1.90pershare,butitmaychangeiftheCompanygivesnoticethatithasdeterminedthatthemarketpriceoftheFirstPreferredShares,SeriesAisastipulatedprice.Onorafterthedaythatis30daysaftersuchnoticeisgiven,aholderofFirstPreferredShares,SeriesAcanrequiretheCompanytoredeemhisorherFirstPreferredShares,SeriesA.TheapprovaloftheholdersoftheFirstPreferredShares,SeriesAisrequiredinrespectofcertainchangestotheprovisionsrelatingtotheFirstPreferredSharesortheFirstPreferredShares,SeriesA.AsofMarch19,2018,therewerenoFirstPreferredShares,SeriesAissuedandoutstanding.
ThesecondseriesofFirstPreferredSharesisdesignatedas“$0.126Non-cumulativeRedeemableConvertibleFirstPreferredShares,SeriesB”(the“FirstPreferredShares,SeriesB”),consistingof10,000,000FirstPreferredShares.Inadditiontotherights,privileges,restrictionsandconditionsattachedtotheFirstPreferredSharesasaclass,theFirstPreferredShares,SeriesBareentitledtofixednon-cumulativepreferentialcashdividendsofC$0.126peryear,payablequarterlyandcanbeconvertedintocommonsharesonaoneforonebasis(subjecttoadjustment)ifcalledforredemption.TheredemptionpriceforeachFirstPreferredShare,SeriesBisitsstatedcapital(beingC$2.10pershare)plusapremiumofC$0.2625pershare,togetherwithalldeclaredandunpaiddividends.TheapprovaloftheholdersoftheFirstPreferredShares,SeriesBisrequiredinrespectofcertainchangestotheprovisionsrelatingtotheFirstPreferredSharesortheFirstPreferredShares,SeriesB.NoclassofsharesmaybecreatedorissuedrankingastocapitalordividendspriortooronparitywiththeFirstPreferredSharesexceptwiththepriorapprovaloftheholdersoftheFirstPreferredShares,SeriesB.AsofMarch19,2018,therewerenoFirstPreferredShares,SeriesBissuedandoutstanding.
ThethirdseriesofFirstPreferredSharesisdesignatedas“FirstPreferredShares,SeriesCSpecialVotingShare”(the“SpecialVotingShare”),consistingofoneSpecialVotingShare.TheSpecialVotingSharewasissuedtoeffecttheassumptionbyBarrickoftheBGIexchangeablesharestructureinconnectionwiththeacquisitionofHomestake.Inadditiontotherights,privileges,restrictionsandconditionsattachedtotheFirstPreferredSharesasaclass,exceptasotherwiserequiredbyapplicablelaw,theholderofrecordoftheSpecialVotingSharehasanumberofvotesequaltothenumberofBGIexchangeablesharesoutstandingfromtimetotime,whicharenotownedbyBarrickoritssubsidiariesoraffiliates,multipliedby0.53.TheholderoftheSpecialVotingSharewillvotetogetherwiththeholdersofBarrickcommonsharesasasingleclassonallmatterssubmittedtoavoteoftheholdersoftheBarrickcommonshares,exceptasmayberequiredbyapplicablelaw.TheholderoftheSpecialVotingShareisentitledtoreceive,inanydistributionofpropertyorassetsofBarrickuponanyliquidation,dissolutionorwindingupofBarrick,anamountequaltothestatedcapitaloftheshareplusalldeclaredandunpaiddividendsontheshare,beforeanyamountispaidordistributedinrespectoftheBarrickcommonsharesoranyotherBarricksharesrankingjuniortotheSpecialVotingShare.TheholderoftheSpecialVotingShareisentitledtoreceiveadividendofC$0.04peryear.AlloutstandingBGIexchangeableshares(otherthanBGIexchangeablesharesownedbyBarrickoranysubsidiaryoraffiliateofBarrick)wereredeemedbyBarrickonFebruary27,2009.TheSpecialVotingSharewasredeemedandcancelledbyBarrickinMarch2009.
ThefirstseriesofSecondPreferredSharesisdesignatedas“$0.222Non-cumulativeRedeemableConvertibleSecondPreferredShares,SeriesA”(the“SecondPreferredShares,SeriesA”),consistingof15,000,000SecondPreferredShares.Inadditiontotherights,privileges,restrictionsandconditionsattachedtotheSecondPreferredSharesasaclass,theSecondPreferredShares,SeriesAareentitledtofixednon-cumulativepreferentialcashdividendsofC$0.222peryear,payablequarterlyandcanbeconvertedintocommonsharesonaoneforonebasis(subjecttoadjustment)ifcalledforredemption.TheredemptionpriceforeachSecondPreferredShare,SeriesAisC$2.43pershare,togetherwithalldeclaredandunpaiddividends.AholderofSecondPreferredShares,SeriesAcanrequiretheCompany
-131-
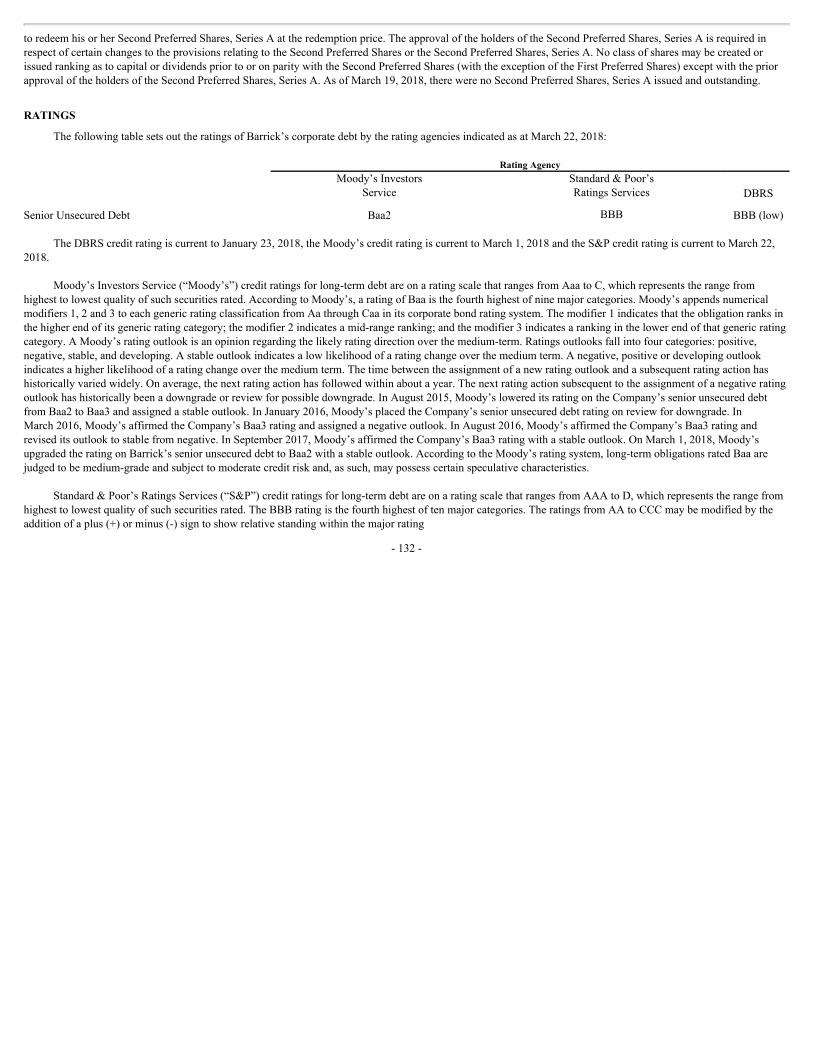
toredeemhisorherSecondPreferredShares,SeriesAattheredemptionprice.TheapprovaloftheholdersoftheSecondPreferredShares,SeriesAisrequiredinrespectofcertainchangestotheprovisionsrelatingtotheSecondPreferredSharesortheSecondPreferredShares,SeriesA.NoclassofsharesmaybecreatedorissuedrankingastocapitalordividendspriortooronparitywiththeSecondPreferredShares(withtheexceptionoftheFirstPreferredShares)exceptwiththepriorapprovaloftheholdersoftheSecondPreferredShares,SeriesA.AsofMarch19,2018,therewerenoSecondPreferredShares,SeriesAissuedandoutstanding.
RATINGS
ThefollowingtablesetsouttheratingsofBarrick’scorporatedebtbytheratingagenciesindicatedasatMarch22,2018: RatingAgency
Moody’sInvestors
Service Standard&Poor’sRatingsServices DBRS
SeniorUnsecuredDebt Baa2 BBB BBB(low)
TheDBRScreditratingiscurrenttoJanuary23,2018,theMoody’screditratingiscurrenttoMarch1,2018andtheS&PcreditratingiscurrenttoMarch22,2018.
Moody’sInvestorsService(“Moody’s”)creditratingsforlong-termdebtareonaratingscalethatrangesfromAaatoC,whichrepresentstherangefromhighesttolowestqualityofsuchsecuritiesrated.AccordingtoMoody’s,aratingofBaaisthefourthhighestofninemajorcategories.Moody’sappendsnumericalmodifiers1,2and3toeachgenericratingclassificationfromAathroughCaainitscorporatebondratingsystem.Themodifier1indicatesthattheobligationranksinthehigherendofitsgenericratingcategory;themodifier2indicatesamid-rangeranking;andthemodifier3indicatesarankinginthelowerendofthatgenericratingcategory.AMoody’sratingoutlookisanopinionregardingthelikelyratingdirectionoverthemedium-term.Ratingsoutlooksfallintofourcategories:positive,negative,stable,anddeveloping.Astableoutlookindicatesalowlikelihoodofaratingchangeoverthemediumterm.Anegative,positiveordevelopingoutlookindicatesahigherlikelihoodofaratingchangeoverthemediumterm.Thetimebetweentheassignmentofanewratingoutlookandasubsequentratingactionhashistoricallyvariedwidely.Onaverage,thenextratingactionhasfollowedwithinaboutayear.Thenextratingactionsubsequenttotheassignmentofanegativeratingoutlookhashistoricallybeenadowngradeorreviewforpossibledowngrade.InAugust2015,Moody’slowereditsratingontheCompany’sseniorunsecureddebtfromBaa2toBaa3andassignedastableoutlook.InJanuary2016,Moody’splacedtheCompany’sseniorunsecureddebtratingonreviewfordowngrade.InMarch2016,Moody’saffirmedtheCompany’sBaa3ratingandassignedanegativeoutlook.InAugust2016,Moody’saffirmedtheCompany’sBaa3ratingandreviseditsoutlooktostablefromnegative.InSeptember2017,Moody’saffirmedtheCompany’sBaa3ratingwithastableoutlook.OnMarch1,2018,Moody’supgradedtheratingonBarrick’sseniorunsecureddebttoBaa2withastableoutlook.AccordingtotheMoody’sratingsystem,long-termobligationsratedBaaarejudgedtobemedium-gradeandsubjecttomoderatecreditriskand,assuch,maypossesscertainspeculativecharacteristics.
Standard&Poor’sRatingsServices(“S&P”)creditratingsforlong-termdebtareonaratingscalethatrangesfromAAAtoD,whichrepresentstherangefromhighesttolowestqualityofsuchsecuritiesrated.TheBBBratingisthefourthhighestoftenmajorcategories.TheratingsfromAAtoCCCmaybemodifiedbytheadditionofaplus(+)orminus(-)signtoshowrelativestandingwithinthemajorrating
-132-
categories.IfS&Panticipatesthatacreditratingmaychangeinthenextsixto24months,itmayissueanupdatedratingsoutlookindicatingwhetherthepossiblechangeislikelytobe“positive”,“negative”,“stable”or“developing”.However,aratingoutlookdoesnotmeanthataratingchangeisinevitable.InMarch2015,S&PloweredtheCompany’slong-termcorporatecreditratingtoBBB-andalsoplacedastableoutlookontherating,notingtheCompany’sliquiditypositionasstrongandthatthedowngradereflectsitsrevisedestimatesfortheCompanyfollowingthereleaseofitsyear-end2014results.InMarch2016,S&PaffirmedtheCompany’sBBB-ratingwithastableoutlook.InAugust2016,S&PaffirmedtheCompany’sBBB-ratingandraiseditsoutlooktopositivefromstable.OnMarch22,2018,S&PupgradedtheratingonBarrick’sseniorunsecureddebttoBBBwithastableoutlook.AccordingtotheS&Pratingsystem,anobligorratedBBBhasadequatecapacitytomeetitsfinancialcommitments,butadverseeconomicconditionsorchangingcircumstancesaremorelikelytoleadtoaweakenedcapacityoftheobligortomeetitsfinancialcommitments.
DBRSLimited(“DBRS”)usesalong-termdebtratingscalethatrangesfromAAAtoD,whichrepresentstherangefromhighesttolowestqualityofsuchsecuritiesrated,and,withtheexceptionoftheAAAandDcategories,alsocontainsthesubcategories“high”and“low”.Theabsenceofeithera“high”or“low”designationindicatestheratingisinthe“middle”ofthecategory.InAugust2015,DBRSdowngradeditsratingontheCompany’sseniorunsecureddebttoBBB(low)fromBBBandassignedastabletrend.InNovember2016,DBRSaffirmedtheCompany’sBBB(low)ratingwithastabletrend.InJanuary2018,DBRSaffirmedtheCompany’sBBB(low)ratingandraiseditstrendtopositivefromstable.AccordingtoDBRS,aratingofBBBisinthefourthhighestoftenmajorcategoriesandisofadequatecreditquality.Thecapacityforthepaymentoffinancialobligationsisconsideredacceptable.Entitiesinthiscategoryareconsideredtobevulnerabletofutureevents,butqualifyingnegativefactorsareconsideredmanageable.
Barrickunderstandsthattheratingsarebasedon,amongotherthings,informationfurnishedtotheaboveratingsagenciesbyBarrickandinformationobtainedbytheratingsagenciesfrompubliclyavailablesources.ThecreditratingsgiventoBarrick’sdebtinstrumentsbytheratingagenciesarenotrecommendationstobuy,holdorsellsuchdebtinstrumentssincesuchratingsdonotcommentastomarketpriceorsuitabilityforaparticularinvestor.Thereisnoassurancethatanyratingwillremainineffectforanygivenperiodoftimeorthatanyratingwillnotberevisedorwithdrawnentirelybyaratingagencyinthefutureif,initsjudgment,circumstancessowarrant.Creditratingsareintendedtoprovideinvestorswith(i)anindependentmeasureofthecreditqualityofanissueofsecurities;(ii)anindicationofthelikelihoodofrepaymentforanissueofsecurities;and(iii)anindicationofthecapacityandwillingnessoftheissuertomeetitsfinancialobligationsinaccordancewiththetermsofthosesecurities.CreditratingsaccordedtoBarrick’sdebtinstrumentsmaynotreflectthepotentialimpactofallrisksonthevalueofsuchinstruments,includingrisksrelatedtomarketorotherfactorsdiscussedinthisAnnualInformationForm(seealso“RiskFactors”).
BarrickhaspaideachofMoody’sandS&Pitscustomaryfeesinconnectionwiththeprovisionoftheabovecreditratings.TheCompanyhasnotmadeanypaymentstoDBRSandnopaymentshavebeenmadetoMoody’sandS&Punrelatedtotheprovisionoftheirratingservicesforthelasttwoyears.
MARKETFORSECURITIES
Barrick’scommonsharesarelistedandpostedfortradingontheTorontoStockExchangeandtheNewYorkStockExchangeunderthesymbolABX.Thefollowingtableoutlinestheclosingsharepricetradingrangeandvolumeofsharestradedbymonthin2017,andfortheperiodfromJanuary1,2018toMarch19,2018,basedontradinginformationpublishedbyeachexchange.
-133-
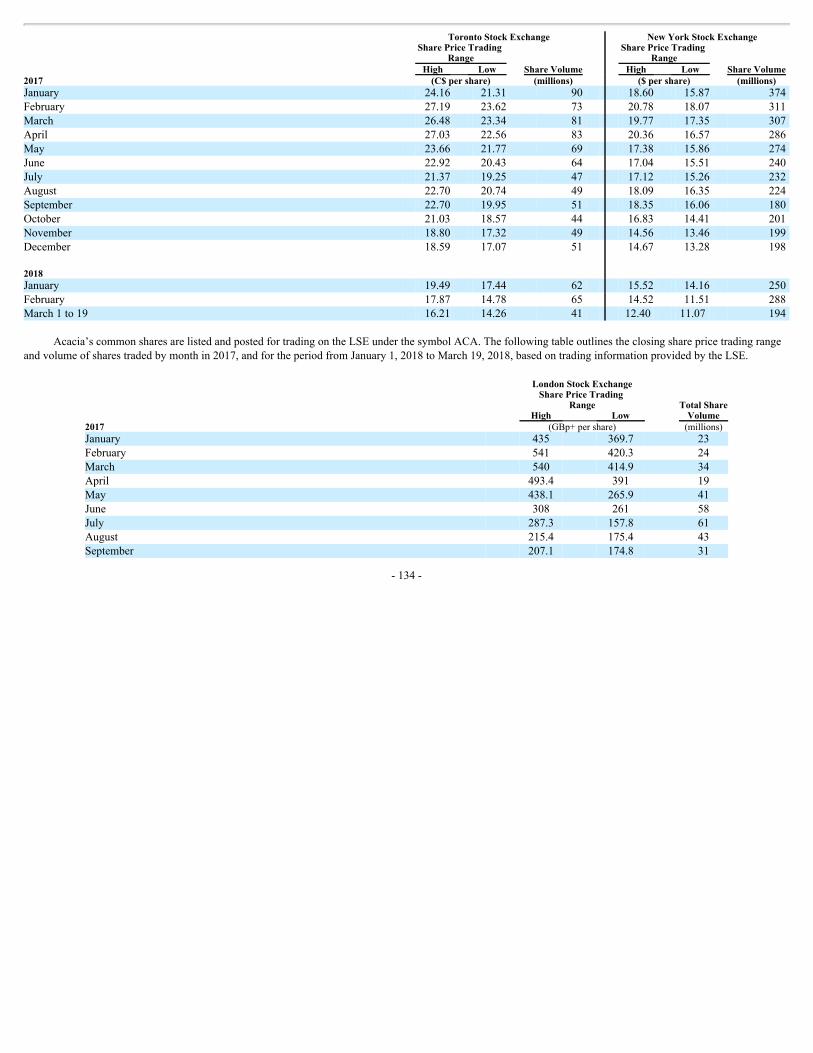
TorontoStockExchange NewYorkStockExchange
SharePriceTrading
Range ShareVolume
SharePriceTradingRange
ShareVolume High Low High Low 2017 (C$pershare) (millions) ($pershare) (millions) January 24.16 21.31 90 18.60 15.87 374February 27.19 23.62 73 20.78 18.07 311March 26.48 23.34 81 19.77 17.35 307April 27.03 22.56 83 20.36 16.57 286May 23.66 21.77 69 17.38 15.86 274June 22.92 20.43 64 17.04 15.51 240July 21.37 19.25 47 17.12 15.26 232August 22.70 20.74 49 18.09 16.35 224September 22.70 19.95 51 18.35 16.06 180October 21.03 18.57 44 16.83 14.41 201November 18.80 17.32 49 14.56 13.46 199December 18.59 17.07 51 14.67 13.28 198
2018 January 19.49 17.44 62 15.52 14.16 250February 17.87 14.78 65 14.52 11.51 288March1to19 16.21 14.26 41 12.40 11.07 194
Acacia’scommonsharesarelistedandpostedfortradingontheLSEunderthesymbolACA.Thefollowingtableoutlinestheclosingsharepricetradingrangeandvolumeofsharestradedbymonthin2017,andfortheperiodfromJanuary1,2018toMarch19,2018,basedontradinginformationprovidedbytheLSE.
LondonStockExchange
SharePriceTrading
Range TotalShareVolume High Low
2017 (GBp+pershare) (millions)January 435 369.7 23February 541 420.3 24March 540 414.9 34April 493.4 391 19May 438.1 265.9 41June 308 261 58July 287.3 157.8 61August 215.4 175.4 43September 207.1 174.8 31
-134-
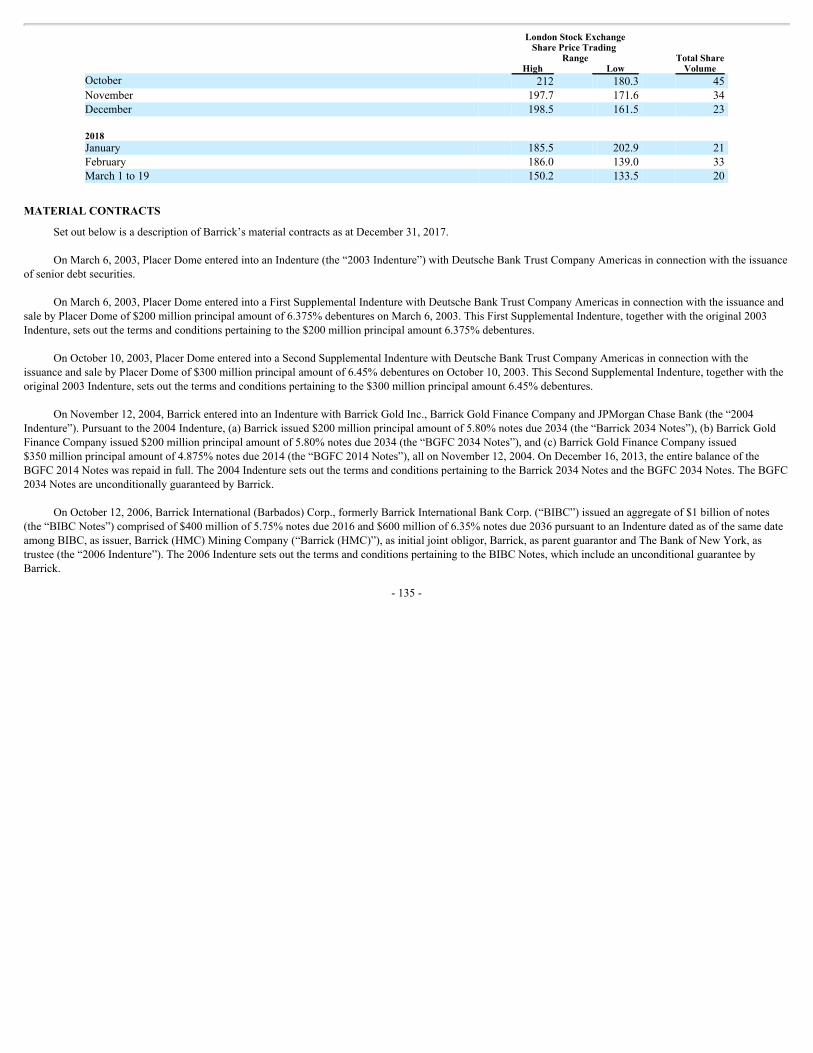
LondonStockExchange
SharePriceTrading
Range TotalShareVolume High Low
October 212 180.3 45November 197.7 171.6 34December 198.5 161.5 23
2018 January 185.5 202.9 21February 186.0 139.0 33March1to19 150.2 133.5 20
MATERIALCONTRACTS
SetoutbelowisadescriptionofBarrick’smaterialcontractsasatDecember31,2017.
OnMarch6,2003,PlacerDomeenteredintoanIndenture(the“2003Indenture”)withDeutscheBankTrustCompanyAmericasinconnectionwiththeissuanceofseniordebtsecurities.
OnMarch6,2003,PlacerDomeenteredintoaFirstSupplementalIndenturewithDeutscheBankTrustCompanyAmericasinconnectionwiththeissuanceandsalebyPlacerDomeof$200millionprincipalamountof6.375%debenturesonMarch6,2003.ThisFirstSupplementalIndenture,togetherwiththeoriginal2003Indenture,setsoutthetermsandconditionspertainingtothe$200millionprincipalamount6.375%debentures.
OnOctober10,2003,PlacerDomeenteredintoaSecondSupplementalIndenturewithDeutscheBankTrustCompanyAmericasinconnectionwiththeissuanceandsalebyPlacerDomeof$300millionprincipalamountof6.45%debenturesonOctober10,2003.ThisSecondSupplementalIndenture,togetherwiththeoriginal2003Indenture,setsoutthetermsandconditionspertainingtothe$300millionprincipalamount6.45%debentures.
OnNovember12,2004,BarrickenteredintoanIndenturewithBarrickGoldInc.,BarrickGoldFinanceCompanyandJPMorganChaseBank(the“2004Indenture”).Pursuanttothe2004Indenture,(a)Barrickissued$200millionprincipalamountof5.80%notesdue2034(the“Barrick2034Notes”),(b)BarrickGoldFinanceCompanyissued$200millionprincipalamountof5.80%notesdue2034(the“BGFC2034Notes”),and(c)BarrickGoldFinanceCompanyissued$350millionprincipalamountof4.875%notesdue2014(the“BGFC2014Notes”),allonNovember12,2004.OnDecember16,2013,theentirebalanceoftheBGFC2014Noteswasrepaidinfull.The2004IndenturesetsoutthetermsandconditionspertainingtotheBarrick2034NotesandtheBGFC2034Notes.TheBGFC2034NotesareunconditionallyguaranteedbyBarrick.
OnOctober12,2006,BarrickInternational(Barbados)Corp.,formerlyBarrickInternationalBankCorp.(“BIBC”)issuedanaggregateof$1billionofnotes(the“BIBCNotes”)comprisedof$400millionof5.75%notesdue2016and$600millionof6.35%notesdue2036pursuanttoanIndenturedatedasofthesamedateamongBIBC,asissuer,Barrick(HMC)MiningCompany(“Barrick(HMC)”),asinitialjointobligor,Barrick,asparentguarantorandTheBankofNewYork,astrustee(the“2006Indenture”).The2006IndenturesetsoutthetermsandconditionspertainingtotheBIBCNotes,whichincludeanunconditionalguaranteebyBarrick.
-135-
Onthesamedate,andaspartofthesametransaction,ABXFinancingCompany(“ABXFC”),acompanyincorporatedforthepurposeofacquiringtheBIBCNotes,issuedanaggregateof$1billionofnotes(the“ABXFCNotes”)comprisedof$400millionof5.75%notesdue2016and$600millionof6.35%notesdue2036pursuanttoanIndenturedatedasofthesamedateamongABXFC,asissuer,BIBC,Barrick(HMC)andBarrick,asguarantors,andTheBankofNewYork,astrustee(the“ABXFCIndenture”).OnOctober15,2015,theoutstandingprincipalamountofthe5.75%notesdue2016wasrepaidinfull.TheABXFCIndenturesetsoutthetermsandconditionspertainingtotheABXFCNotes,whichincludeanunconditionalguaranteebyBarrick,BIBCandBarrick(HMC).
OnSeptember11,2008,BarrickenteredintoanIndenturewithBarrickGoldFinancecoLLC,BarrickNorthAmericaFinanceLLCandTheBankofNewYorkMellon(“2008Indenture”).Pursuanttothe2008Indenture,(i)BarrickGoldFinancecoLLCissued$500millionprincipalamount6.125%notesdue2013(the“BGFC2013Notes”),and(ii)BarrickNorthAmericaFinanceLLCissued$500millionprincipalamount6.80%notesdue2018(the“BNAF2018Notes”)and$250millionprincipalamount7.50%notesdue2038(the“BNAF2038Notes”),allonSeptember11,2008.OnMarch19,2009,Barrickissuedanaggregateof$750millionprincipalamount6.95%notesdue2019(the“BGC2019Notes”)pursuanttothe2008Indenture.During2013,uponmaturity,theoutstandingprincipalamountoftheBGFC2013Noteswasrepaidinfull.OnOctober28,2015,pursuanttoacashtenderoffer,$275millionoftheprincipalamountoftheBGC2019Noteswasrepaid.OnMarch21,2016,pursuanttoacashtenderoffer,approximately$227millionoftheprincipalamountoftheBNAF2018Notesandapproximately$196millionoftheprincipalamountoftheBGC2019Noteswasrepaid.OnSeptember26,2016,theoutstandingprincipalamountoftheBNAF2018Noteswasrepaidinfull.OnJune20,2017,theoutstandingprincipalamountoftheBGC2019Noteswasrepaidinfull.The2008IndenturesetsoutthetermsandconditionspertainingtotheBNAF2018Notes,theBNAF2038NotesandtheBGC2019Notes.TheBNAF2038NotesareunconditionallyguaranteedbyBarrick.
OnOctober16,2009,BarrickenteredintoanIndenturewithBarrick(PD)AustraliaFinancePtyLtd.andtheBankofNewYorkMellon(the“2009Indenture”).Pursuanttothe2009Indenture,Barrick(PD)AustraliaFinancePtyLtd.issued$400millionprincipalamount4.950%notesdue2020(the“BPDAF2020Notes”)and$850millionprincipalamount5.950%notesdue2039(the“BPDAF2039Notes”),allonOctober16,2009.OnMarch21,2016,pursuanttoacashtenderoffer,approximately$152millionoftheprincipalamountoftheBPDAF2020Noteswasrepaid.The2009IndenturesetsoutthetermsandconditionspertainingtotheBPDAF2020NotesandtheBPDAF2039Notes.EachoftheBPDAF2020NotesandtheBPDAF2039NotesareunconditionallyguaranteedbyBarrick.
OnJune1,2011,BarrickenteredintoanIndenturewithBarrickNorthAmericaFinanceLLC(“BNAF”),CitibankN.A.andWilmingtonTrustCompany(the“2011Indenture”).Pursuanttothe2011Indenture,BarrickandBNAFissuedanaggregateof$4.0billionindebtsecuritiescomprisedof:$700millionof1.75%notesdue2014(the“Barrick2014Notes”)and$1.1billionof2.90%notesdue2016(the“Barrick2016Notes”),eachissuedbyBarrick,aswellas$1.35billionof4.40%notesdue2021(the“BNAF2021Notes”)and$850millionof5.70%notesdue2041(the“BNAF2041Notes”),eachissuedbyBNAF.OnDecember16,2013,theoutstandingprincipalamountoftheBarrick2014Noteswasrepaidinfull.OnSeptember9,2015,theoutstandingprincipalamountoftheBarrick2016Noteswasrepaidinfull.In2016,approximately$721millionoftheprincipalamountoftheBNAF2021Noteswasrepaidpursuanttocashtenderoffers.TheBNAF2021NotesandtheBNAF2041NotesareunconditionallyguaranteedbyBarrick.
OnApril3,2012,Barrickissuedanaggregateof$2billionindebtsecuritiespursuanttothe2011Indenture,comprisedof$1.25billionof3.85%notesdue2022and$750millionof5.25%notesdue2042.In2015,approximately$913millionoftheprincipalamountofthe3.85%notesdue2022wasrepaidpursuanttocashtenderoffers.
-136-
OnMay2,2013,BarrickandBNAFissuedanaggregateof$3billionindebtsecuritiespursuanttothe2011Indenture,comprisedof$650millionof2.50%notesdue2018and$1.5billionof4.10%notesdue2023issuedbyBarrickaswellas$850millionof5.75%notesdue2043issuedbyBNAF(the“BNAFNotes”).TheBNAFNotesareunconditionallyguaranteedbyBarrick.OnDecember3,2013,pursuanttoacashtenderoffer,approximately$398millionoftheprincipalamountofthe2.50%notesdue2018wasrepaid.In2015,approximately$129millionoftheprincipalamountofthe2.50%notesdue2018andapproximately$769millionoftheprincipalamountofthe4.10%notesdue2023wasrepaidpursuanttocashtenderoffers.OnMarch21,2016,pursuanttoacashtenderoffer,approximately$18millionoftheprincipalamountofthe2.50%notesdue2018wasrepaid.OnJune24,2016,theoutstandingprincipalamountofthe2.50%notesdue2018wasrepaidinfull.OnSeptember21,2017,theoutstandingprincipalamountofthe4.10%notesdue2023wasrepaidinfull.
TRANSFERAGENTSANDREGISTRARS
Barrick’stransferagentandregistrarforitscommonsharesisASTTrustCompany(Canada)inCanadaatitsprincipalofficeinToronto,OntarioandAmericanStockTransfer&TrustCompany,LLCintheUnitedStatesatitsprincipalofficeinBrooklyn,NewYork.
DIVIDENDPOLICY
OnAugust5,2015,BarrickannouncedthatitsBoardofDirectorsreducedthequarterlydividendonitscommonsharesby60%from$0.05to$0.02perquartertoincreasefinancialflexibilityinlightofmarketconditions.Thereductioninthequarterlydividendbecameeffectivestartingwiththedividendpayableinmid-September2015.In2015,Barrickpaidanaggregatecashdividendof$0.14percommonshare:$0.05inmid-March,$0.05inmid-June,$0.02inmid-Septemberand$0.02inmid-December.In2016,Barrickpaidanaggregatecashdividendof$0.08percommonshare:$0.02inmid-March,$0.02inmid-June,$0.02inmid-Septemberand$0.02inmid-December.OnFebruary15,2017,BarrickannouncedthatitsBoardofDirectorsincreaseditsquarterlydividendfrom$0.02pershareto$0.03persharebeginningwiththedividendpayableinmid-March2017.In2017,Barrickpaidanaggregatecashdividendof$0.12percommonshare:$0.03inmid-March,$0.03inmid-June,$0.03inmid-Septemberand$0.03inmid-December.OnFebruary14,2017,BarrickannouncedthatitsBoardofDirectorshaddeclaredadividendof$0.03,payableonMarch15,2018.TheamountandtimingofdividendsarewithinthediscretionoftheBoardofDirectors.TheBoardofDirectorsreviewsthedividendquarterlybasedon,amongotherthings,theCompany’scurrentandprojectedliquidityprofile.
AlsoonAugust5,2015,theBoardofDirectorsapprovedaDividendReinvestmentPlan(the“DRIP”),whichwasmadeavailabletoeligibleshareholdersbeginningwiththemid-September2015dividend.TheDRIPallowsregisteredorbeneficialholdersofBarrick’scommonshareswhoresideinCanadaortheUnitedStatestoreinvestcashdividendspaidontheircommonsharesinadditionalcommonsharesissuedfromtreasuryatadiscounttotheaveragemarketprice(asdefinedintheDRIP),currentlysetat3%andsubjecttochangeatthediscretionoftheBoardofDirectors.
DIRECTORSANDOFFICERSOFTHECOMPANY
AsofMarch19,2018,directorsandexecutiveofficersofBarrickasagroupbeneficiallyown,directlyorindirectly,orexercisecontrolordirectionover3,099,209commonsharesrepresentingapproximately0.27%oftheoutstandingcommonsharesofBarrick.
-137-
DirectorsoftheCompany
GaryA.DoerandDambisaF.Moyowillnotstandforre-electionasdirectorsattheCompany’supcomingannualmeetingofshareholderstobeheldonApril24,2018(the“AGM”).TheBoardofDirectorshasnominatedtwonewindependentdirectorstostandforelectionattheAGM:MaríaI.BenítezandPatriciaA.Hatter.
Thepresenttermofeachdirectorwillexpireatthenextannualmeetingofshareholdersoruponsuchdirector’ssuccessorbeingelectedorappointed.ThefollowingarethedirectorsoftheCompanyasatMarch19,2018:Name(age)andmunicipalityofresidence Principaloccupationsduringpast5yearsGustavoA.Cisneros(72)SantoDomingo,DominicanRepublic
Mr.CisnerosistheChairmanofCisneros,aprivately-heldmedia,entertainment,technology,andconsumerproductsorganization.Mr.CisnerosisamemberofBarrick’sInternationalAdvisoryBoard.HeisalsoasenioradvisortoRREVenturesLLC,aventurecapitalfirm.Mr.Cisnerosisamemberoftheadvisoryboardsofanumberoforganizationsanduniversities,includingtheUnitedNationsInformationandCommunicationTechnologies(ICT)TaskForce,HaitiPresidentialInternationalAdvisoryBoard,TheAmericasSociety,andHarvardUniversity.Mr.CisnerosholdsanundergraduatedegreefromBabsonCollege.
BarrickBoardDetails:
• DirectorsinceSeptember9,2003
GrahamG.Clow(67)Toronto,OntarioCanada
Mr.ClowistheChairmanandPrincipalMiningEngineerofRoscoePostleAssociatesInc.(RPA),aconsultingfirmprovidingreservesandresourcesservicestotheminingindustryatallstagesofprojectdevelopment.Hehasmorethan40yearsofexperienceinallaspectsofmining,includingacquisitions,exploration,feasibility,finance,development,construction,operations,andclosure.PriortojoiningRPAin2001,Mr.Clowspentmorethan20yearsinseniorexecutiveandoperatingpositions,includingwithpubliclylistedminingcompanies.Foranumberofyears,Mr.ClowservedasanAdjunctProfessorattheLassondeMineralInstitute,UniversityofToronto,wherehelecturedinresourceandreserveestimation.HewasformerlytheChairmanoftheMetalMiningDivisionoftheCanadianInstituteofMining,Metallurgy,andPetroleum(CIM)andwasamemberofthecommitteeonorereservedefinitionsthatestablishedtherequirementsfortheCanadianSecuritiesAdministrators’NationalInstrument43-101–StandardsofDisclosureforMineralProjects.Mr.ClowisaFellowoftheCIMandhasbeenawardedtheValeMedalandtheCIMMetalMiningAwardforhiscontributionstotheindustry.HeholdsdegreesingeologyandminingengineeringfromQueen’sUniversity.
-138-
Name(age)andmunicipalityofresidence Principaloccupationsduringpast5years
BarrickBoardDetails:
• DirectorsinceApril26,2016
GaryA.Doer(69)Winnipeg,ManitobaCanada
Mr.DoerhasbeenaSeniorBusinessAdvisortothelawfirmDentonsCanadaLLPsinceAugust2016.FromOctober2009untilJanuary2016,Mr.DoerwasCanada’sambassadortotheUnitedStates,ajurisdictionthatrepresentsaverysignificantportionofBarrick’sbusiness.Priortothat,hewasPremierofManitobafor10years.Mr.DoerisavolunteerCo-ChairoftheWilsonCentre’sCanadaInstitute,anon-partisanpublicpolicyforumfocusedonCanada-U.S.relations.In2010,hebecameaMemberoftheOrderofManitobaand,in2011,hereceivedadistinguisheddiplomaticserviceawardfromtheWorldAffairsCouncil.
BarrickBoardDetails:
• DirectorsinceApril26,2016
KelvinP.M.Dushnisky(54)Toronto,OntarioCanada
Mr.DushniskyjoinedBarrickin2002asDirectorofRegulatoryAffairsandwasappointedPresidentofBarrickonAugust17,2015.Hehas30yearsofinternationalminingindustryexperience.AsPresidentofBarrick,hehasoverallresponsibilityforexecutionoftheCompany’sstrategicpriorities.Mr.DushniskyisalsoChairmanoftheBoardofDirectorsofAcaciaMiningplcandrepresentsBarrickattheWorldGoldCouncil,theInternationalCouncilonMiningandMetals,andtheBusinessCouncilofCanada.PriortojoiningBarrick,heheldmanagementpositionsatEuroZincMiningCorporation,SuttonResources,andRescanConsultants.Mr.DushniskyholdsanHonoursBachelorofSciencedegreefromtheUniversityofManitoba,inadditiontoaMasterofSciencedegreeandaJurisDoctordegreefromtheUniversityofBritishColumbia.
BarrickBoardDetails:
• DirectorsinceFebruary17,2016
J.MichaelEvans(60)NewYork,NewYorkUSA
Mr.EvansisthePresidentofAlibabaGroupHoldingLtd.,apositionhehasheldsinceAugust2015.PriortobecomingPresident,Mr.EvanswasanindependentdirectorandmemberoftheauditcommitteeofAlibabaGroupHoldingLtd.withresponsibility,amongotherthings,fortheoversightandevaluationofoperatingandfinancialriskandinternalcontrols.HeservedasViceChairmanofTheGoldmanSachsGroup,Inc.fromFebruary2008untilhisretirementinDecember2013.Mr.EvanswasChairmanofGoldmanSachs’Asiaoperationsfrom2004to2013andheldvariousleadershippositionswithinthefirm’ssecuritiesbusiness,includingglobalheadofequity
-139-
Name(age)andmunicipalityofresidence Principaloccupationsduringpast5years
capitalmarkets.Astheco-headofGoldmanSachs’securitiesdivisionforsevenyears,Mr.Evanswasresponsible,withtheotherdivisionco-heads,amongotherthings,forthecontinuousreviewofriskincludingoperatingandfinancialrisk.HeisaboardmemberofCityHarvest.HeisalsoatrusteeoftheAsiaSocietyandamemberoftheAdvisoryCouncilfortheBendheimCenterforFinanceatPrincetonUniversity.Mr.EvansholdsanundergraduatedegreefromPrincetonUniversity.Mr.EvanswonagoldmedalforCanadaatthe1984summerOlympicsinmen’seightrowing.
BarrickBoardDetails:
• DirectorsinceJuly30,2014
BrianL.Greenspun(71)Henderson,NevadaUSA
Mr.GreenspunisthePublisherandEditoroftheLasVegasSun.HeisalsoChairmanandChiefExecutiveOfficerofGreenspunMediaGroup.Mr.GreenspunhasbeenappointedtotwoU.S.PresidentialCommissions.Intheearly1990s,hewasappointedbyPresidentBillClintontotheWhiteHouseCommissiononSmallBusiness.InDecember2014,hewasappointedbyPresidentBarackObamatotheCommissionforthePreservationofAmerica’sHeritageAbroad.HeisaTrusteeofTheBrookingsInstitution,theUniversityofNevadaLasVegasFoundationandtheSimonWiesenthalMuseumofTolerance.HeisactiveinnumerouscivicandcharitableorganizationsintheLasVegascommunity.Mr.GreenspunholdsalawdegreeandanundergraduatedegreefromGeorgetownUniversity.
BarrickBoardDetails:
• DirectorsinceJuly30,2014
J.BrettHarvey(67)Mesquite,NevadaUSA
Mr.HarveywasChairmanEmeritusofCONSOLEnergyInc.,acoal,gas,andenergyservicescompanyfromMay2016toMay2017.HewasCONSOLEnergyInc.’sChairmanfromJanuary2015toMay2016,ExecutiveChairmanfromMay2014toJanuary2015,ChairmanandChiefExecutiveOfficerfromJune2010toMay2014,andChiefExecutiveOfficerfromJanuary1998toJune2010.FromJanuary2009toMay2014,hewasalsotheChairmanandChiefExecutiveOfficerofCNXGasCorporation,asubsidiaryofCONSOLEnergyInc.Hebeganhisbusinesscareerinmining,joiningtheKaiserSteelCompanyin1979attheSunnysideMineinUtah,and,in1984,hewasappointedasVicePresidentandGeneralManagerofKaiserCoalofNewMexico.Mr.HarveyalsoservedasVicePresident,MiningforPacifiCorp.In2016,hereceivedtheCharlesF.RandMemorialGoldMedal,awardedbytheSocietyforMining,MetallurgyandExplorationfordistinguishedachievementinminingadministration.
-140-
Name(age)andmunicipalityofresidence Principaloccupationsduringpast5years
Mr.HarveyistheformerchairoftheNationalMiningAssociationandoftheCoalIndustryAdvisoryBoardtotheInternationalEnergyAgency.HeisamemberoftheNationalExecutiveBoardoftheBoyScoutsofAmericaandadirectorandpastchairmanoftheLaurelHighlandsCounciloftheBoyScouts.Mr.HarveyholdsanundergraduatedegreeinminingengineeringfromtheUniversityofUtah.
BarrickBoardDetails:
• DirectorsinceDecember15,2005
NancyH.O.Lockhart(63)Toronto,OntarioCanada
Ms.LockhartisaCorporateDirector.ShewastheChiefAdministrativeOfficerofFrumDevelopmentGroup,apropertydevelopmentandmanagementcompany,from1995toSeptember2013.SheisalsoamemberoftheSotheby’sCanadaAdvisoryBoard.Ms.LockhartisadirectoroftheRoyalConservatoryofMusicandtheChairofCrow’sTheatreCompany.SheisapastdirectoroftheCanadaDepositInsuranceCorporation.
BarrickBoardDetails:
• DirectorsinceApril30,2014
PabloMarcet(54)BuenosAires,Argentina
Mr.MarcetisaCorporateDirector.Heisaseasonedminingprofessionalwithnearly30yearsofexperienceintheexploration,development,andoperationofminesacrossLatinAmericaandinEastAfrica.Duringhiscareer,Mr.Marcethasheldseniormanagementpositionsingeology,miningoperations,andbusinessdevelopment,including15yearsatBHP.HealsoservedasPresidentofNorthernOrionResources’SouthAmericanoperationsbeforethecompany’sacquisitionbyYamanaGold,andlaterasChiefExecutiveOfficerofWaymarResources,untilitsacquisitionbyOrosurMining.Mr.MarcetholdsaBachelorofSciencedegreeinGeologyfromtheUniversityofthePacificinStockton,California,aMaster’sdegreeinEconomicGeologyfromHarvardUniversity,andaMasterofBusinessAdministrationdegreefromtheUniversityofPhoenix.
BarrickBoardDetails:
• DirectorsinceDecember6,2016
DambisaF.Moyo(49)NewYork,NewYorkUSA
Dr.Moyoisaninternationaleconomistandauthorontheglobaleconomy.Dr.MoyoworkedattheWorldBankfrom1993to1995andatGoldmanSachsfrom2001to2008,wheresheworkedindebtcapitalmarkets,hedgefundcoverage,andasaneconomistintheglobalmacroeconomicsteam.Dr.MoyoholdsanundergraduatedegreeandaMaster’sdegreein
-141-

Name(age)andmunicipalityofresidence Principaloccupationsduringpast5years
BusinessAdministrationfromAmericanUniversity,aMaster’sdegreefromHarvardUniversity’sKennedySchoolofGovernment,andaDoctorateinEconomicsfromOxfordUniversity.
BarrickBoardDetails:
• DirectorsinceApril27,2011
AnthonyMunk(57)Toronto,OntarioCanada
Mr.MunkhasbeenaSeniorManagingDirectorofOnexCorporation,aleadingNorthAmericanprivateequityfirm,since2013.Priorto2013hewasaManagingDirectorofOnexCorporation.InhiscapacitywithOnexCorporation,Mr.Munkhasworkedonnumerousprivateequitytransactionsandservedontheboardsofanumberofportfoliocompanies.Mr.MunkcurrentlyservesontheboardsofJELD-WENHolding,Inc.,Jack’sFamilyRestaurants,Inc.,Save-A-LotandClaravateAnalytics.Mr.MunkholdsaBachelorofArts(Honours)degreefromQueen’sUniversity.
BarrickBoardDetails:
• DirectorsinceDecember10,1996
J.RobertS.Prichard(69)Toronto,OntarioCanada
Mr.PrichardisChairmanoftheBoardofBankofMontreal,aCanadianfinancialinstitution,apositionhehasheldsinceMarch2012.SinceSeptember2010,Mr.Prichardhasservedasnon-executiveChairmanofTorysLLP,aCanadianlawfirm.HealsoservesasChairmanofMetrolinx,theregionaltransportationagencyandoperatorfortheGreaterTorontoandHamiltonarea.Mr.PrichardwasformerlyPresidentandChiefExecutiveOfficerofMetrolinx,PresidentandChiefExecutiveOfficerofTorstarCorporation,andPresidentoftheUniversityofToronto.Mr.PrichardisatrusteeofTheHospitalforSickChildren.Mr.PrichardholdsaMaster’sdegreeinBusinessAdministrationfromtheUniversityofChicagoandlawdegreesfromtheUniversityofTorontoandYaleUniversity.HeisanOfficeroftheOrderofCanada,aMemberoftheOrderofOntario,aFellowoftheRoyalSocietyofCanada,andaFellowofCanada’sInstituteofCorporateDirectors.
BarrickBoardDetails:
• DirectorsinceDecember3,2015
StevenJ.Shapiro(66)Silverthorne,ColoradoUSA
Mr.ShapiroisaCorporateDirectorwithmorethan35yearsofexperienceintheenergyandminingbusiness.HespentnineyearsinthecoalandmineralsbusinessatARCO,aproducerofcopper,molybdenum,uranium,andcoal,withbyproductsincludinggoldandsilver.Mr.ShapirowasPresidentofARCOCoalAustralia,overseeingfouroperatingmineswith1,100employees.HewasalsoManagerofAcquisitionsforthe
-142-
Name(age)andmunicipalityofresidence Principaloccupationsduringpast5years
AnacondaCompany(asubsidiaryofARCOatthetime)andtheVicePresident,FinanceforARCO’scoalandmineralsdivision.Mr.ShapirowasformerlyExecutiveVicePresident,FinanceandCorporateDevelopmentandadirectorofBurlingtonResources,Inc.,anoilandgasexplorationandproductioncompany.HewasalsoformerlySeniorVicePresidentandadirectorofVastarResources,anoilandgasexplorationandproductioncompany.Mr.ShapiroholdsanundergraduatedegreefromUnionCollegeandaMaster’sdegreeinBusinessAdministrationfromHarvardUniversity.
BarrickBoardDetails:
• DirectorsinceSeptember1,2004
JohnL.Thornton(64)PalmBeach,FloridaUSA
Mr.ThorntonwasappointedExecutiveChairmanofBarrickonApril30,2014.FromJune5,2012toApril29,2014,Mr.ThorntonwasCo-ChairmanofBarrick.HeisalsoChairmanofSilkRoadFinanceCorporation,anAsianinvestmentfirm,andNon-ExecutiveChairmanofPineBridgeInvestments,aglobalassetmanager.HeisaProfessor,DirectoroftheGlobalLeadershipProgram,andaMemberoftheAdvisoryBoardoftheTsinghuaUniversitySchoolofEconomicsandManagementinBeijing.HeisalsoChairmanoftheBoardofTrusteesoftheBrookingsInstitutioninWashington,D.C.Heretiredin2003asPresidentandamemberoftheboardofTheGoldmanSachsGroupInc.Mr.ThorntonisCo-ChairoftheAsiaSociety,andisalsoatrustee,advisoryboardmemberormemberof,theChinaInvestmentCorporation(CIC),McKinseyAdvisoryCouncil,MorehouseCollege,andtheAfricanLeadershipAcademy.Mr.ThorntonholdsanundergraduatedegreefromHarvardCollege,adegreeinjurisprudencefromOxfordUniversity,andaMaster’sdegreefromtheYaleSchoolofManagement.
BarrickBoardDetails:
• ExecutiveChairmansince2014andDirectorsinceFebruary15,2012
ErnieL.Thrasher(62)Latrobe,PennsylvaniaUSA
Mr.Thrasherisaseasonedveteranoftheminingandresourcesindustrywithacareerspanningfivedecades.Heisthefounder,ChiefExecutiveOfficer,andChiefMarketingOfficerofXcoalEnergy&Resources,aglobalcoalproductssupplierandthelargestexporterofU.S.origincoaltoAsia,whoseactivitiesalsoincludethefinancinganddevelopmentofminingandrelatedinfrastructureprojectsinWestVirginiaandintheanthracitecoalfieldinNortheasternPennsylvania.Mr.Thrasher’scareerinminingdatesbackto1971,workingforhisfamily’sminingcompanyfor10yearsasamanuallabourer,equipmentoperator,pitsuperintendent,andultimately
-143-

Name(age)andmunicipalityofresidence Principaloccupationsduringpast5years
inoperationsandmineplanning.From1981to1991,Mr.ThrasherworkedatPrimaryCoal,Inc.,wherehisresponsibilitiesincludedcoalprocurement,inlandtransport,andlogistics.Overthenext12years,priortofoundingXcoal,Mr.ThrasherservedasPresidentofAMCIExportCorporationandExecutiveVice-President,MarketingofAMCIInternational(bothcoalproductssuppliers)where,inadditiontohisroleoverseeingthecommercialoperationsofthebusiness,hewasinvolvedinmineplanningandthedevelopmentofAMCI’sminingoperationsinAustraliaandMozambique.Mr.ThrasherisamemberoftheCouncilonForeignRelations(USA)andadirectorontheNationalCommitteeonUnitedStates-ChinaRelations.
BarrickBoardDetails:
• DirectorsinceApril30,2014
Mr.Clow,adirectoroftheCompany,wasadirectorofCampbellResourcesInc.(“CampbellResources”)in2005whenthatcompanyfiledforprotectionundertheCompaniesCreditors’ArrangementAct(Canada)(the“CCAA”).Mr.ClowceasedtobeadirectorofCampbellResourcesonNovember14,2008,priortoCampbellResourcesfilingforprotectionfromitscreditorsundertheCCAAforasecondtime,onJanuary28,2009.
Mr.Greenspun,adirectoroftheCompany,wasadirectoroftheTribuneCompany,aprivately-heldcompany,whenitfiledforbankruptcyprotectioninDecember2008.Mr.GreenspunceasedtobeadirectoroftheTribuneCompanyonDecember31,2012.
Mr.Shapiro,adirectoroftheCompany,wasadirectorofAsiaResourceMineralsplc(formerlyBumiplc)from2011to2014.TradingontheLSEofthevotingordinarysharesofBumiplc(whichchangeditsnametoAsiaResourceMineralsplconDecember17,2013)wassuspendedbytheUnitedKingdomFinancialConductAuthority(the“FCA”)fromApril22,2013toJuly22,2013.Bumiplcvoluntarilyrequestedthistemporarytradingsuspensionpendingclarificationofthecompany’sfinancialpositiononthepublicationofitsauditedfullyearresultsfortheyearendedDecember31,2012.TradinginthevotingordinarysharesofBumiplcresumedonJuly22,2013,followingthepublicationofitsauditedfullyearresultsfor2012anddiscussionswiththeFCA.Mr.ShapiroceasedtobeadirectorofAsiaResourceMineralsplconJune5,2014.
CorporateGovernanceandCommitteesoftheBoard
Barrick’scurrentcorporategovernancepoliciesandpracticesareconsistentwiththerequirementsofCanadiansecuritieslaws.Barrick’spoliciesandpracticesalsotakeintoaccounttherulesoftheTorontoStockExchangeandthecorporategovernancestandardsadoptedbytheNewYorkStockExchange(the“NYSEStandards”),eventhoughthemajorityoftheNYSEStandardsdonotdirectlyapplytoBarrickasaCanadiancompany.TheonesignificantdifferencebetweenBarrick’scorporategovernancepracticesandtheNYSEStandardswhichareapplicabletoU.S.companiesissummarizedbelow:
-144-
Section303A.08oftheNYSEStandardsrequiresshareholderapprovalofall“equitycompensationplans”andmaterialrevisions.ThedefinitionofequitycompensationplansundertheNYSEStandardscoversplansthatprovideforthedeliveryofnewlyissuedsecurities,aswellasplansthatrelyonsecuritiesreacquiredonthemarketbytheissuingcompanyforthepurposeofredistributiontoemployeesanddirectors.Incomparison,theTorontoStockExchangerulesrequireshareholderapprovalofsecurity-basedcompensationarrangementsonlyinrespectofarrangementswhichinvolvethedeliveryofnewlyissuedsecuritiesorspecifiedamendmentsthereto.Therefore,BarrickdoesnotseekshareholderapprovalforequitycompensationplansandamendmentsunlesstheyinvolvenewlyissuedsecuritiesorconstitutespecifiedamendmentsundertheTorontoStockExchangerules.
Corporate Governance and Nominating Committee
TheCorporateGovernanceandNominatingCommitteeiscomprisedofG.A.Cisneros,B.L.Greenspun,N.H.O.LockhartandD.F.Moyo.
Audit Committee
TheAuditCommitteeiscomprisedofP.Marcet,D.F.Moyo,S.J.ShapiroandE.L.Thrasher.
Compensation Committee
TheCompensationCommitteeiscomprisedofG.A.Cisneros,J.B.Harvey,J.R.S.Prichard,S.J.ShapiroandE.L.Thrasher.
Corporate Responsibility Committee
TheCorporateResponsibilityCommitteeiscomprisedofG.A.Doer,B.L.Greenspun,N.H.O.Lockhart,P.MarcetandE.L.Thrasher.
Risk Committee
TheRiskCommitteeiscomprisedofG.G.Clow,J.M.Evans,D.F.Moyo,A.MunkandJ.R.S.Prichard.
International Advisory Board
TheonlymemberoftheBoardofDirectorsthatalsositsontheInternationalAdvisoryBoardisG.A.Cisneros.
Executive Officers of the Company
InadditiontoJohnL.ThorntonandKelvinP.M.Dushnisky,assetoutabove,thefollowingaretheexecutiveofficersoftheCompanyasatMarch19,2018.Name(age)andmunicipalityofresidence Office Principaloccupationsduringpast5yearsMarkHill(53)Oakville,OntarioCanada
ChiefInvestmentOfficer
ChiefInvestmentOfficer;priortoSeptember2016,PartnerandHeadofMiningatWatertonGlobalResourceManagement.
-145-
Name(age)andmunicipalityofresidence Office Principaloccupationsduringpast5yearsRobertKrcmarov(53)Toronto,OntarioCanada
ExecutiveVicePresident,ExplorationandGrowth
ExecutiveVicePresident,ExplorationandGrowth;priortoMarch2016,SeniorVicePresident,GlobalExploration.
CatherineRaw(36)Toronto,OntarioCanada
ExecutiveVicePresident,ChiefFinancialOfficer
ExecutiveVicePresident,ChiefFinancialOfficer;priortoMarch2016,ExecutiveVicePresident,BusinessPerformance;priortoMay2015,MemberoftheNaturalResourcesTeamandManagerofgold,miningandnaturalresourcefundsincludingCo-ManagerofBlackRockWorldMiningTrustandBGFWorldMiningFundatBlackRockInc.
DarianRich(57)Mississauga,OntarioCanada
ExecutiveVicePresident,TalentManagement
ExecutiveVicePresident,TalentManagement;priortoJuly2014,SeniorVicePresident,HumanResources;priortoJuly2013,VicePresident,HumanResources.
KathySipos(49)Toronto,OntarioCanada
ChiefofStaff
ChiefofStaff;priortoSeptember2015,SeniorVicePresident,BusinessProcessIntegration;priortoJanuary2015,VicePresidentofInvestorandStakeholderRelationsatTerangaGoldCorporation.
KevinThomson(61)Toronto,OntarioCanada
SeniorExecutiveVicePresident,StrategicMatters
SeniorExecutiveVicePresident,StrategicMatters;priortoOctober2014,SeniorPartneratDaviesWardPhillips&VinebergLLP.
GregWalker(57)Toronto,OntarioCanada
SeniorVicePresident,OperationalandTechnicalExcellence
SeniorVicePresident,OperationalandTechnicalExcellence;priortoDecember2017,ExecutiveGeneralManager,PuebloViejoMine;priortoSeptember2016,ExecutiveManagingDirector,BarrickNiuginiLtd;priortoOctober2015,ExecutiveGeneralManager,PorgeraMine
-146-
AUDITCOMMITTEE
AuditCommitteeMandate
AcopyoftheAuditCommittee’smandateisattachedheretoasSchedule“A”.
CompositionoftheAuditCommittee
TheAuditCommitteeiscomprisedentirelyofindependentdirectors(P.Marcet,D.Moyo,S.J.ShapiroandE.L.Thrasher).TherewerefivemeetingsoftheAuditCommitteein2017.AllofthemembersoftheCommitteeattendedallofthemeetingsheldin2017whiletheyweremembers.
RelevantEducationandExperience
AllofthemembersoftheAuditCommitteearefinanciallyliterateandatleastonememberhasaccountingorrelatedfinancialmanagementexpertise.Barrick’sBoardofDirectorshasdeterminedthatD.F.Moyo,S.J.ShapiroandE.L.Thrasherareeachan“auditcommitteefinancialexpert”asdefinedbySECrulesandisindependent,asthattermisdefinedbytheNewYorkStockExchange’scorporategovernancestandardsapplicabletoBarrick.
TherulesadoptedbytheSECindicatethatthedesignationofDr.MoyoandMessrs.ShapiroandThrasherasauditcommitteefinancialexpertswillnotdeemanyofthemtobean“expert”foranypurposeorimposeanyduties,obligationsorliabilityonthemthataregreaterthanthoseimposedonmembersoftheAuditCommitteeandBarrick’sBoardofDirectorswhodonotcarrythisdesignation.Mr.Marcetisalsoanexperiencedauditcommitteemember;however,theBoardofDirectorshasnotdesignatedhimasanauditcommitteefinancialexpert.
SetoutbelowisadescriptionoftheeducationandexperienceofeachAuditCommitteememberthatisrelevanttotheperformanceofhisorherresponsibilitiesinthatcapacity.FormoreinformationaboutthemembersofBarrick’sAuditCommittee,see“DirectorsandOfficersoftheCompany–DirectorsoftheCompany”.PabloMarcet
Mr.MarcetholdsaBachelorofSciencedegreeinGeologyfromtheUniversityofthePacificinStockton,California,aMaster’sdegreeinEconomicGeologyfromHarvardUniversityandaMasterofBusinessAdministrationdegreefromtheUniversityofPhoenix.Duringhiscareer,Mr.Marcethasheldseniormanagementpositions,includingservingasPresidentofNorthernOrionResources’SouthAmericanoperationsbeforetheCompany’sacquisitionbyYamanaGold,andlaterasChiefExecutiveOfficerofWaymarResourcesuntilitsacquisitionbyOrosurMining.Mr.MarcethasbeenamemberoftheAuditCommitteeofEsreyResourcesLtdsince2017andwasamemberoftheAuditCommitteeofU3O8Corp.from2012to2017.Mr.MarcetbringsextensivemanagementexperiencetotheBoardofDirectors,aswellasexperiencewithinternalcontrolsandproceduresforfinancialreporting.
-147-
DambisaF.Moyo
Dr.Moyoholdsanundergraduatedegreeandamaster’sdegreeinbusinessadministrationfromAmericanUniversity,amaster’sdegreefromHarvardUniversity’sKennedySchoolofGovernmentandadoctorateineconomicsfromOxfordUniversity.ShehasbeenamemberoftheauditcommitteeofChevronCorporationsince2016andwasformerlyamemberoftheauditcommitteeofSeagateTechnologyandBarclaysBank.Dr.MoyobringsextensivemanagementexperiencetotheBoardofDirectorsaswellasexperiencewithinternalcontrolsandproceduresforfinancialreporting.
StevenJ.Shapiro
Mr.ShapiroholdsanundergraduatedegreefromUnionCollegeandamaster’sdegreeinbusinessadministrationfromHarvardUniversity.Mr.ShapirowasChiefFinancialOfficerofBurlingtonResources,Inc.from2000to2006andChiefFinancialOfficerofVastarResourcesfrom1994to2000.HewasamemberoftheauditcommitteeofAsiaResourceMineralsplcfrom2011to2014andwasamemberoftheauditcommitteeofElPasoCorporationfrom2006to2012.TheBoardofDirectorsbenefitsfromMr.Shapiro’sfinancialandaccountingexperience.
ErnieL.Thrasher
Mr.Thrasheristhefounder,ChiefExecutiveOfficerandChiefMarketingOfficerofXcoalEnergy&Resources,aglobalcoalproductssupplier.HeistheformerPresidentofAMCIExportCorporationandExecutiveVice-President,MarketingofAMCIInternational(bothcoalproductssuppliers).Mr.ThrasherbringsextensivemanagementexperiencetotheBoardofDirectorsaswellasexperiencewithfinancialreporting.
ParticipationonOtherAuditCommittees
MembersoftheAuditCommitteemaynotserveonmorethantwootherpubliccompanyauditcommitteeswithoutapprovaloftheBoardofDirectors.NomemberoftheAuditCommitteecurrentlyservesontheauditcommitteeofmorethanthreepublicly-tradedcompanies,includingBarrick.
AuditCommitteePre-ApprovalPoliciesandProcedures
Barrick’sAuditCommitteehasadoptedaPolicyonPre-ApprovalofAudit,Audit-RelatedandNon-AuditServices(the“Pre-ApprovalPolicy”)forthepre-approvalofservicesperformedbyBarrick’sauditors.TheobjectiveofthePre-ApprovalPolicyistospecifythescopeofservicespermittedtobeperformedbytheCompany’sauditorandtoensurethattheindependenceoftheCompany’sauditorisnotcompromisedthroughtheirengagementforotherservices.AllservicesprovidedbytheCompany’sauditorarepre-approvedbytheAuditCommitteeastheyariseorthroughanannualpre-approvalofservicesandrelatedfeesforspecificservices.AllservicesperformedbyBarrick’sauditorcomplywiththePre-ApprovalPolicy,andprofessionalstandardsandsecuritiesregulationsgoverningauditorindependence.
ExternalAuditorServiceFees
PricewaterhouseCoopersLLParetheauditorsofBarrick’sConsolidatedFinancialStatements.ThefollowingPricewaterhouseCoopersLLPfeeswereincurredbyBarrickineachoftheyearsendedDecember31,2017and2016forprofessionalservicesrenderedtoBarrick:
-148-
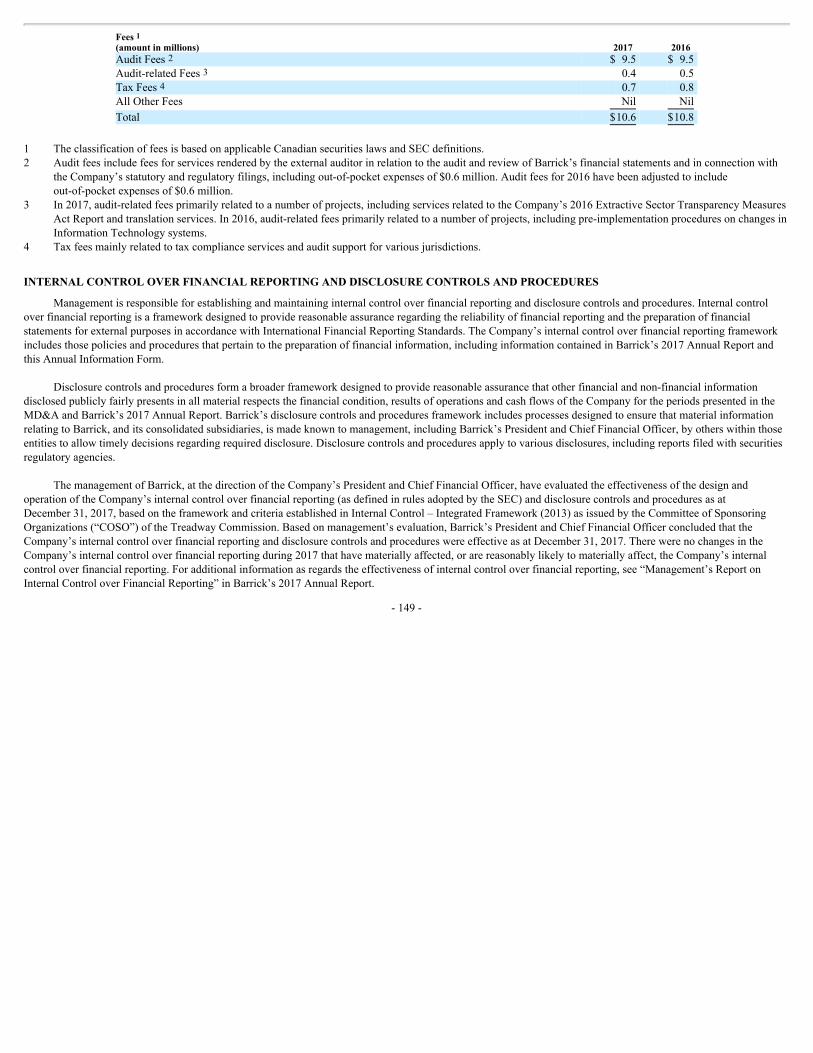
Fees1(amountinmillions) 2017 2016 AuditFees2 $ 9.5 $ 9.5Audit-relatedFees3 0.4 0.5TaxFees4 0.7 0.8AllOtherFees Nil Nil
Total $10.6 $10.8
1 TheclassificationoffeesisbasedonapplicableCanadiansecuritieslawsandSECdefinitions.2 AuditfeesincludefeesforservicesrenderedbytheexternalauditorinrelationtotheauditandreviewofBarrick’sfinancialstatementsandinconnectionwith
theCompany’sstatutoryandregulatoryfilings,includingout-of-pocketexpensesof$0.6million.Auditfeesfor2016havebeenadjustedtoincludeout-of-pocketexpensesof$0.6million.
3 In2017,audit-relatedfeesprimarilyrelatedtoanumberofprojects,includingservicesrelatedtotheCompany’s2016ExtractiveSectorTransparencyMeasuresActReportandtranslationservices.In2016,audit-relatedfeesprimarilyrelatedtoanumberofprojects,includingpre-implementationproceduresonchangesinInformationTechnologysystems.
4 Taxfeesmainlyrelatedtotaxcomplianceservicesandauditsupportforvariousjurisdictions.
INTERNALCONTROLOVERFINANCIALREPORTINGANDDISCLOSURECONTROLSANDPROCEDURES
Managementisresponsibleforestablishingandmaintaininginternalcontroloverfinancialreportinganddisclosurecontrolsandprocedures.InternalcontroloverfinancialreportingisaframeworkdesignedtoprovidereasonableassuranceregardingthereliabilityoffinancialreportingandthepreparationoffinancialstatementsforexternalpurposesinaccordancewithInternationalFinancialReportingStandards.TheCompany’sinternalcontroloverfinancialreportingframeworkincludesthosepoliciesandproceduresthatpertaintothepreparationoffinancialinformation,includinginformationcontainedinBarrick’s2017AnnualReportandthisAnnualInformationForm.
Disclosurecontrolsandproceduresformabroaderframeworkdesignedtoprovidereasonableassurancethatotherfinancialandnon-financialinformationdisclosedpubliclyfairlypresentsinallmaterialrespectsthefinancialcondition,resultsofoperationsandcashflowsoftheCompanyfortheperiodspresentedintheMD&AandBarrick’s2017AnnualReport.Barrick’sdisclosurecontrolsandproceduresframeworkincludesprocessesdesignedtoensurethatmaterialinformationrelatingtoBarrick,anditsconsolidatedsubsidiaries,ismadeknowntomanagement,includingBarrick’sPresidentandChiefFinancialOfficer,byotherswithinthoseentitiestoallowtimelydecisionsregardingrequireddisclosure.Disclosurecontrolsandproceduresapplytovariousdisclosures,includingreportsfiledwithsecuritiesregulatoryagencies.
ThemanagementofBarrick,atthedirectionoftheCompany’sPresidentandChiefFinancialOfficer,haveevaluatedtheeffectivenessofthedesignandoperationoftheCompany’sinternalcontroloverfinancialreporting(asdefinedinrulesadoptedbytheSEC)anddisclosurecontrolsandproceduresasatDecember31,2017,basedontheframeworkandcriteriaestablishedinInternalControl–IntegratedFramework(2013)asissuedbytheCommitteeofSponsoringOrganizations(“COSO”)oftheTreadwayCommission.Basedonmanagement’sevaluation,Barrick’sPresidentandChiefFinancialOfficerconcludedthattheCompany’sinternalcontroloverfinancialreportinganddisclosurecontrolsandprocedureswereeffectiveasatDecember31,2017.TherewerenochangesintheCompany’sinternalcontroloverfinancialreportingduring2017thathavemateriallyaffected,orarereasonablylikelytomateriallyaffect,theCompany’sinternalcontroloverfinancialreporting.Foradditionalinformationasregardstheeffectivenessofinternalcontroloverfinancialreporting,see“Management’sReportonInternalControloverFinancialReporting”inBarrick’s2017AnnualReport.
-149-
Together,theinternalcontroloverfinancialreportinganddisclosurecontrolsandproceduresframeworksprovideinternalcontroloverfinancialreportinganddisclosure.Acontrolsystem,nomatterhowwelldesignedandoperated,canprovideonlyreasonable,notabsolute,assurancewithrespecttothereliabilityoffinancialstatementpreparationandfinancialreporting.Accordingly,Barrick’smanagement,includingBarrick’sPresidentandChiefFinancialOfficer,doesnotexpectthatBarrick’sinternalcontroloverfinancialreportinganddisclosurewillpreventordetectallmisstatementsorfraud.Further,projectionsofanyevaluationoftheeffectivenessofinternalcontroltofutureperiodsissubjecttotheriskthatcontrolsmaybecomeinadequatebecauseofchangesinconditions,orthatthedegreeofcompliancewithpoliciesorproceduresmaychange.
Barrickwillcontinuetomonitortheeffectivenessofitsinternalcontroloverfinancialreportinganddisclosureandmaymakemodificationsfromtimetotimeasconsiderednecessaryordesirable.
Barrick’sannualmanagementreportoninternalcontroloverfinancialreportingandtheintegratedauditreportofBarrick’sauditorsfortheyearendedDecember31,2017areincludedinBarrick’s2017AnnualReportandits2017Form40-F/AnnualInformationFormonfilewiththeSECandCanadianprovincialsecuritiesregulatoryauthorities.
NON-GAAPFINANCIALMEASURES
All-insustainingcostsperounce,All-incostsperounce,Cashcostsperounce,All-insustainingcostsperpoundandC1cashcostsperpound
Cashcostsperounce,all-insustainingcostsperounceandall-incostsperouncearenon-GAAPfinancialmeasureswhicharecalculatedbasedonthedefinitionpublishedbytheWorldGoldCouncil(“WGC”)(amarketdevelopmentorganizationforthegoldindustrycomprisedofandfundedby23goldminingcompaniesfromaroundtheworld,includingBarrick).TheWGCisnotaregulatoryorganization.ManagementusesthesemeasurestomonitortheperformanceofBarrick’sgoldminingoperationsanditsabilitytogeneratepositivecashflow,bothonanindividualsitebasisandanoverallcompanybasis.
CashcostsstartwithBarrick’scostofsalesrelatedtogoldproductionandremovesdepreciation,thenon-controllinginterestofcostofsalesandincludesby-productcredits.All-insustainingcostsstartwithcashcostsandincludesustainingcapitalexpenditures,generalandadministrativecosts,minesiteexplorationandevaluationcostsandreclamationcostaccretionandamortization.Theseadditionalcostsreflecttheexpendituresmadetomaintaincurrentproductionlevels.
All-incostsstartswithall-insustainingcostsandaddsadditionalcoststhatreflectthevaryingcostsofproducinggoldoverthelife-cycleofamine,including:projectcapitalexpenditures(capitalexpendituresatnewprojectsanddiscreteprojectsatexistingoperationsintendedtoincreaseproductioncapacityandwillnotbenefitproductionforatleast12months)andothernon-sustainingcosts(primarilyexplorationandevaluationcosts,communityrelationscostsandgeneralandadministrativecoststhatarenotassociatedwithcurrentoperations).Thesedefinitionsrecognizethattherearedifferentcostsassociatedwiththelife-cycleofamine,andthatitisthereforeappropriatetodistinguishbetweensustainingandnon-sustainingcosts.
WebelievethatBarrick’suseofcashcosts,all-insustainingcostsandall-incostswillassistanalysts,investorsandotherstakeholdersofBarrickinunderstandingthecostsassociatedwithproducinggold,understandingtheeconomicsofgoldmining,assessingBarrick’soperatingperformanceandalsoitsabilitytogeneratefreecashflowfromcurrentoperationsandtogeneratefreecashflowonanoverallcompanybasis.Duetothecapital-intensivenatureoftheindustryandthelongusefullivesoverwhichtheseitemsaredepreciated,therecanbeasignificanttimingdifferencebetweennetearningscalculatedin
-150-

accordancewithIFRSandtheamountoffreecashflowthatisbeinggeneratedbyamineandthereforeBarrickbelievesthesemeasuresareusefulnon-GAAPoperatingmetricsandsupplementitsIFRSdisclosures.ThesemeasuresarenotrepresentativeofallofBarrick’scashexpendituresastheydonotincludeincometaxpayments,interestcostsordividendpayments.Thesemeasuresdonotincludedepreciationoramortization.
Cashcostsperounce,all-insustainingcostsandall-incostsareintendedtoprovideadditionalinformationonlyanddonothavestandardizeddefinitionsunderIFRS,andshouldnotbeconsideredinisolationorasasubstituteformeasuresofperformancepreparedinaccordancewithIFRS.ThesemeasuresarenotequivalenttonetincomeorcashflowfromoperationsasdeterminedunderIFRS.AlthoughtheWGChaspublishedastandardizeddefinition,othercompaniesmaycalculatethesemeasuresdifferently.
Inadditiontopresentingthesemetricsonaby-productbasis,Barrickhascalculatedthesemetricsonaco-productbasis.Barrick’sco-productmetricsremovetheimpactofothermetalsalesthatareproducedasaby-productofitsgoldproductionfromcostperouncecalculations,butdoesnotreflectareductionincostsforcostsassociatedwithothermetalsales.
C1cashcostsperpoundandall-insustainingcostsperpoundarenon-GAAPfinancialmeasuresrelatedtoBarrick’scoppermineoperations.BarrickbelievesthatC1cashcostsperpoundenablesinvestorstobetterunderstandtheperformanceofitscopperoperationsincomparisontoothercopperproducerswhopresentresultsonasimilarbasis.C1cashcostsperpoundexcludesroyaltiesandnon-routinechargesastheyarenotdirectproductioncosts.All-insustainingcostsperpoundissimilartothegoldall-insustainingcostsmetricandmanagementusesthistobetterevaluatethecostsofcopperproduction.Barrickbelievesthatthismeasureenablesinvestorstobetterunderstandtheoperatingperformanceofitscopperminesasthismeasurereflectsallofthesustainingexpendituresincurredinordertoproducecopper.All-insustainingcostsperpoundincludesC1cashcosts,corporategeneralandadministrativecosts,minesiteexplorationandevaluationcosts,royalties,environmentalrehabilitationcostsandwrite-downstakenoninventorytonetrealizablevalue.
-151-
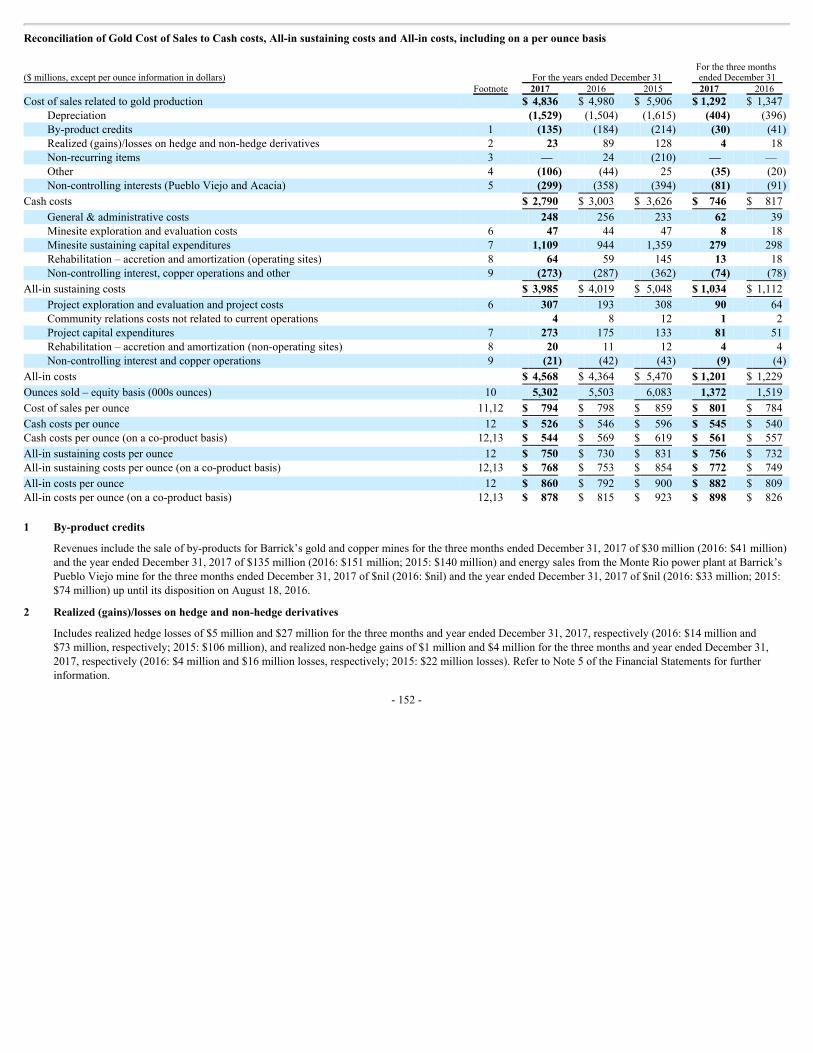
ReconciliationofGoldCostofSalestoCashcosts,All-insustainingcostsandAll-incosts,includingonaperouncebasis($millions,exceptperounceinformationindollars) FortheyearsendedDecember31
ForthethreemonthsendedDecember31
Footnote 2017 2016 2015 2017 2016 Costofsalesrelatedtogoldproduction $ 4,836 $ 4,980 $ 5,906 $ 1,292 $ 1,347
Depreciation (1,529) (1,504) (1,615) (404) (396)By-productcredits 1 (135) (184) (214) (30) (41)Realized(gains)/lossesonhedgeandnon-hedgederivatives 2 23 89 128 4 18Non-recurringitems 3 — 24 (210) — —Other 4 (106) (44) 25 (35) (20)Non-controllinginterests(PuebloViejoandAcacia) 5 (299) (358) (394) (81) (91)
Cashcosts $ 2,790 $ 3,003 $ 3,626 $ 746 $ 817
General&administrativecosts 248 256 233 62 39Minesiteexplorationandevaluationcosts 6 47 44 47 8 18Minesitesustainingcapitalexpenditures 7 1,109 944 1,359 279 298Rehabilitation–accretionandamortization(operatingsites) 8 64 59 145 13 18Non-controllinginterest,copperoperationsandother 9 (273) (287) (362) (74) (78)
All-insustainingcosts $ 3,985 $ 4,019 $ 5,048 $ 1,034 $ 1,112
Projectexplorationandevaluationandprojectcosts 6 307 193 308 90 64Communityrelationscostsnotrelatedtocurrentoperations 4 8 12 1 2Projectcapitalexpenditures 7 273 175 133 81 51Rehabilitation–accretionandamortization(non-operatingsites) 8 20 11 12 4 4Non-controllinginterestandcopperoperations 9 (21) (42) (43) (9) (4)
All-incosts $ 4,568 $ 4,364 $ 5,470 $ 1,201 $ 1,229
Ouncessold–equitybasis(000sounces) 10 5,302 5,503 6,083 1,372 1,519
Costofsalesperounce 11,12 $ 794 $ 798 $ 859 $ 801 $ 784
Cashcostsperounce 12 $ 526 $ 546 $ 596 $ 545 $ 540Cashcostsperounce(onaco-productbasis) 12,13 $ 544 $ 569 $ 619 $ 561 $ 557
All-insustainingcostsperounce 12 $ 750 $ 730 $ 831 $ 756 $ 732All-insustainingcostsperounce(onaco-productbasis) 12,13 $ 768 $ 753 $ 854 $ 772 $ 749
All-incostsperounce 12 $ 860 $ 792 $ 900 $ 882 $ 809All-incostsperounce(onaco-productbasis) 12,13 $ 878 $ 815 $ 923 $ 898 $ 8261 By-productcredits
Revenuesincludethesaleofby-productsforBarrick’sgoldandcopperminesforthethreemonthsendedDecember31,2017of$30million(2016:$41million)andtheyearendedDecember31,2017of$135million(2016:$151million;2015:$140million)andenergysalesfromtheMonteRiopowerplantatBarrick’sPuebloViejomineforthethreemonthsendedDecember31,2017of$nil(2016:$nil)andtheyearendedDecember31,2017of$nil(2016:$33million;2015:$74million)upuntilitsdispositiononAugust18,2016.
2 Realized(gains)/lossesonhedgeandnon-hedgederivatives
Includesrealizedhedgelossesof$5millionand$27millionforthethreemonthsandyearendedDecember31,2017,respectively(2016:$14millionand$73million,respectively;2015:$106million),andrealizednon-hedgegainsof$1millionand$4millionforthethreemonthsandyearendedDecember31,2017,respectively(2016:$4millionand$16millionlosses,respectively;2015:$22millionlosses).RefertoNote5oftheFinancialStatementsforfurtherinformation.
-152-
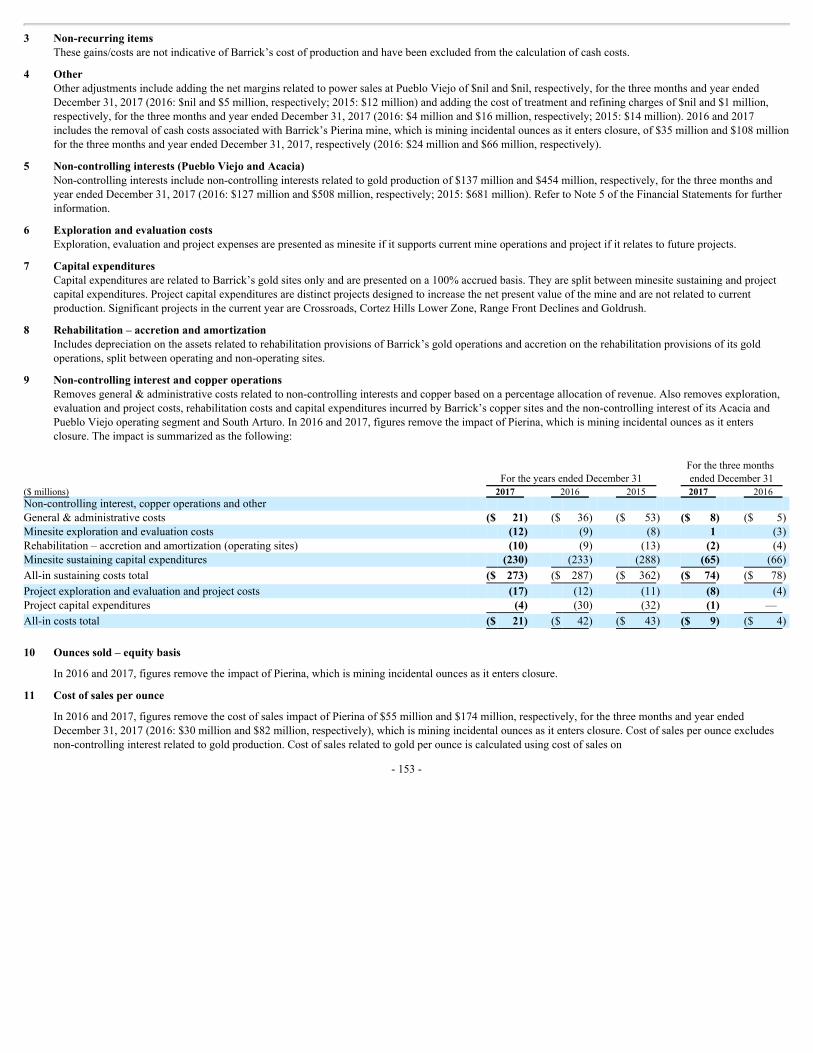
3 Non-recurringitemsThesegains/costsarenotindicativeofBarrick’scostofproductionandhavebeenexcludedfromthecalculationofcashcosts.
4 OtherOtheradjustmentsincludeaddingthenetmarginsrelatedtopowersalesatPuebloViejoof$niland$nil,respectively,forthethreemonthsandyearendedDecember31,2017(2016:$niland$5million,respectively;2015:$12million)andaddingthecostoftreatmentandrefiningchargesof$niland$1million,respectively,forthethreemonthsandyearendedDecember31,2017(2016:$4millionand$16million,respectively;2015:$14million).2016and2017includestheremovalofcashcostsassociatedwithBarrick’sPierinamine,whichisminingincidentalouncesasitentersclosure,of$35millionand$108millionforthethreemonthsandyearendedDecember31,2017,respectively(2016:$24millionand$66million,respectively).
5 Non-controllinginterests(PuebloViejoandAcacia)Non-controllinginterestsincludenon-controllinginterestsrelatedtogoldproductionof$137millionand$454million,respectively,forthethreemonthsandyearendedDecember31,2017(2016:$127millionand$508million,respectively;2015:$681million).RefertoNote5oftheFinancialStatementsforfurtherinformation.
6 ExplorationandevaluationcostsExploration,evaluationandprojectexpensesarepresentedasminesiteifitsupportscurrentmineoperationsandprojectifitrelatestofutureprojects.
7 CapitalexpendituresCapitalexpendituresarerelatedtoBarrick’sgoldsitesonlyandarepresentedona100%accruedbasis.Theyaresplitbetweenminesitesustainingandprojectcapitalexpenditures.Projectcapitalexpendituresaredistinctprojectsdesignedtoincreasethenetpresentvalueofthemineandarenotrelatedtocurrentproduction.SignificantprojectsinthecurrentyearareCrossroads,CortezHillsLowerZone,RangeFrontDeclinesandGoldrush.
8 Rehabilitation–accretionandamortizationIncludesdepreciationontheassetsrelatedtorehabilitationprovisionsofBarrick’sgoldoperationsandaccretionontherehabilitationprovisionsofitsgoldoperations,splitbetweenoperatingandnon-operatingsites.
9 Non-controllinginterestandcopperoperationsRemovesgeneral&administrativecostsrelatedtonon-controllinginterestsandcopperbasedonapercentageallocationofrevenue.Alsoremovesexploration,evaluationandprojectcosts,rehabilitationcostsandcapitalexpendituresincurredbyBarrick’scoppersitesandthenon-controllinginterestofitsAcaciaandPuebloViejooperatingsegmentandSouthArturo.In2016and2017,figuresremovetheimpactofPierina,whichisminingincidentalouncesasitentersclosure.Theimpactissummarizedasthefollowing:
FortheyearsendedDecember31 ForthethreemonthsendedDecember31
($millions) 2017 2016 2015 2017 2016 Non-controllinginterest,copperoperationsandother General&administrativecosts ($ 21) ($ 36) ($ 53) ($ 8) ($ 5)Minesiteexplorationandevaluationcosts (12) (9) (8) 1 (3)Rehabilitation–accretionandamortization(operatingsites) (10) (9) (13) (2) (4)Minesitesustainingcapitalexpenditures (230) (233) (288) (65) (66)
All-insustainingcoststotal ($ 273) ($ 287) ($ 362) ($ 74) ($ 78)
Projectexplorationandevaluationandprojectcosts (17) (12) (11) (8) (4)Projectcapitalexpenditures (4) (30) (32) (1) —
All-incoststotal ($ 21) ($ 42) ($ 43) ($ 9) ($ 4)
10 Ouncessold–equitybasis
In2016and2017,figuresremovetheimpactofPierina,whichisminingincidentalouncesasitentersclosure.
11 Costofsalesperounce
In2016and2017,figuresremovethecostofsalesimpactofPierinaof$55millionand$174million,respectively,forthethreemonthsandyearendedDecember31,2017(2016:$30millionand$82million,respectively),whichisminingincidentalouncesasitentersclosure.Costofsalesperounceexcludesnon-controllinginterestrelatedtogoldproduction.Costofsalesrelatedtogoldperounceiscalculatedusingcostofsaleson
-153-
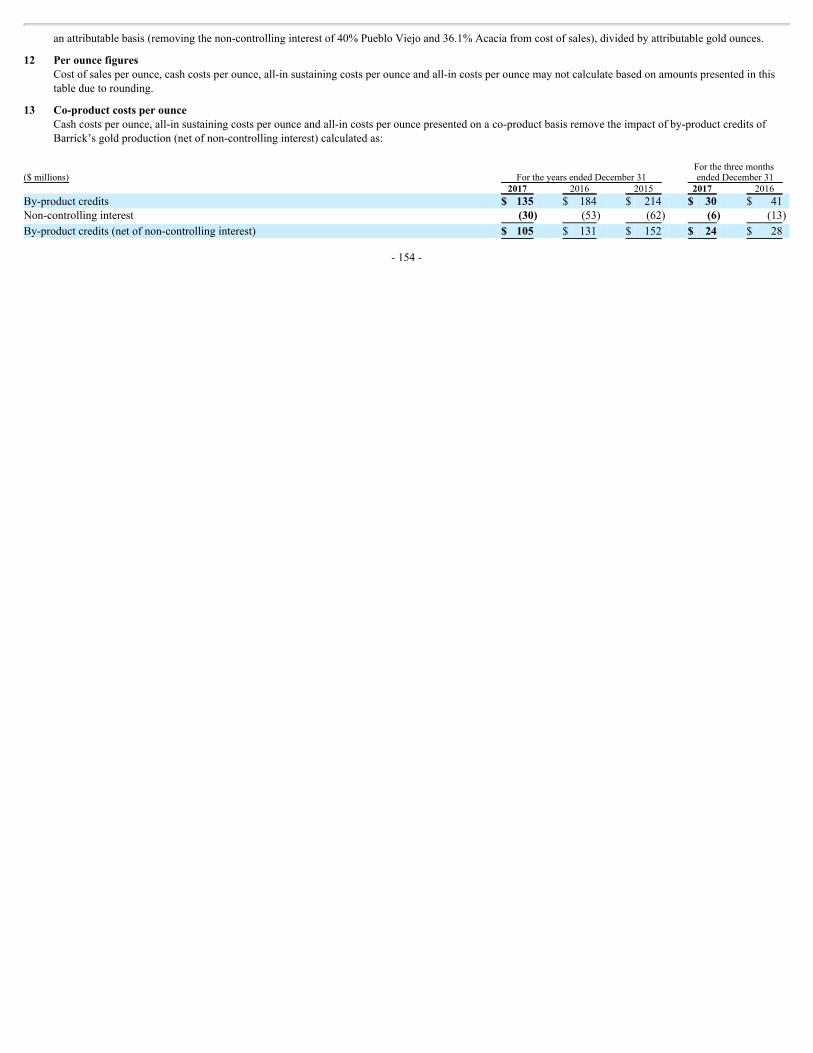
anattributablebasis(removingthenon-controllinginterestof40%PuebloViejoand36.1%Acaciafromcostofsales),dividedbyattributablegoldounces.
12 PerouncefiguresCostofsalesperounce,cashcostsperounce,all-insustainingcostsperounceandall-incostsperouncemaynotcalculatebasedonamountspresentedinthistableduetorounding.
13 Co-productcostsperounceCashcostsperounce,all-insustainingcostsperounceandall-incostsperouncepresentedonaco-productbasisremovetheimpactofby-productcreditsofBarrick’sgoldproduction(netofnon-controllinginterest)calculatedas:
($millions) FortheyearsendedDecember31
ForthethreemonthsendedDecember31
2017 2016 2015 2017 2016 By-productcredits $ 135 $ 184 $ 214 $ 30 $ 41Non-controllinginterest (30) (53) (62) (6) (13)
By-productcredits(netofnon-controllinginterest) $ 105 $ 131 $ 152 $ 24 $ 28
-154-
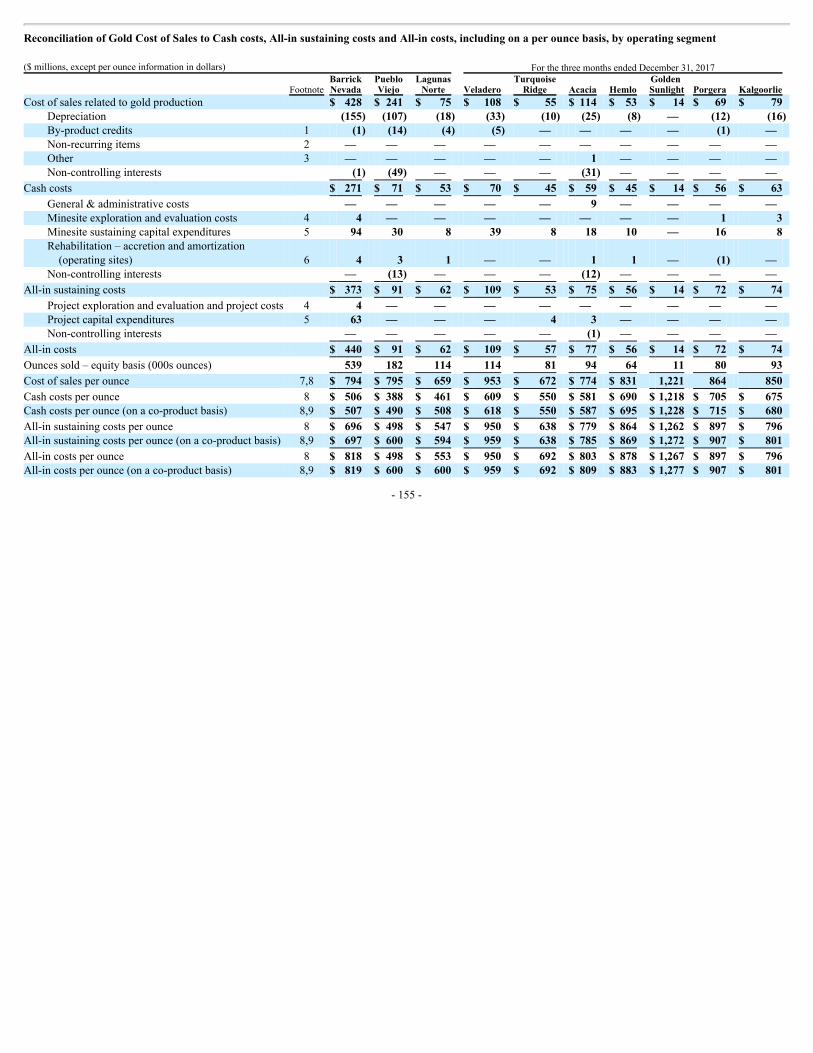
ReconciliationofGoldCostofSalestoCashcosts,All-insustainingcostsandAll-incosts,includingonaperouncebasis,byoperatingsegment($millions,exceptperounceinformationindollars) ForthethreemonthsendedDecember31,2017
FootnoteBarrickNevada
PuebloViejo
LagunasNorte Veladero
TurquoiseRidge Acacia Hemlo
GoldenSunlight Porgera Kalgoorlie
Costofsalesrelatedtogoldproduction $ 428 $ 241 $ 75 $ 108 $ 55 $ 114 $ 53 $ 14 $ 69 $ 79Depreciation (155) (107) (18) (33) (10) (25) (8) — (12) (16)By-productcredits 1 (1) (14) (4) (5) — — — — (1) —Non-recurringitems 2 — — — — — — — — — —Other 3 — — — — — 1 — — — —Non-controllinginterests (1) (49) — — — (31) — — — —
Cashcosts $ 271 $ 71 $ 53 $ 70 $ 45 $ 59 $ 45 $ 14 $ 56 $ 63
General&administrativecosts — — — — — 9 — — — —Minesiteexplorationandevaluationcosts 4 4 — — — — — — — 1 3Minesitesustainingcapitalexpenditures 5 94 30 8 39 8 18 10 — 16 8Rehabilitation–accretionandamortization(operatingsites) 6 4 3 1 — — 1 1 — (1) —
Non-controllinginterests — (13) — — — (12) — — — —
All-insustainingcosts $ 373 $ 91 $ 62 $ 109 $ 53 $ 75 $ 56 $ 14 $ 72 $ 74
Projectexplorationandevaluationandprojectcosts 4 4 — — — — — — — — —Projectcapitalexpenditures 5 63 — — — 4 3 — — — —Non-controllinginterests — — — — — (1) — — — —
All-incosts $ 440 $ 91 $ 62 $ 109 $ 57 $ 77 $ 56 $ 14 $ 72 $ 74
Ouncessold–equitybasis(000sounces) 539 182 114 114 81 94 64 11 80 93
Costofsalesperounce 7,8 $ 794 $ 795 $ 659 $ 953 $ 672 $ 774 $ 831 1,221 864 850
Cashcostsperounce 8 $ 506 $ 388 $ 461 $ 609 $ 550 $ 581 $ 690 $ 1,218 $ 705 $ 675Cashcostsperounce(onaco-productbasis) 8,9 $ 507 $ 490 $ 508 $ 618 $ 550 $ 587 $ 695 $ 1,228 $ 715 $ 680
All-insustainingcostsperounce 8 $ 696 $ 498 $ 547 $ 950 $ 638 $ 779 $ 864 $ 1,262 $ 897 $ 796All-insustainingcostsperounce(onaco-productbasis) 8,9 $ 697 $ 600 $ 594 $ 959 $ 638 $ 785 $ 869 $ 1,272 $ 907 $ 801
All-incostsperounce 8 $ 818 $ 498 $ 553 $ 950 $ 692 $ 803 $ 878 $ 1,267 $ 897 $ 796All-incostsperounce(onaco-productbasis) 8,9 $ 819 $ 600 $ 600 $ 959 $ 692 $ 809 $ 883 $ 1,277 $ 907 $ 801
-155-

($millions,exceptperounceinformationindollars) ForthethreemonthsendedDecember31,2016
FootnoteBarrickNevada
PuebloViejo
LagunasNorte Veladero
TurquoiseRidge Acacia Hemlo
GoldenSunlight Porgera Kalgoorlie
Costofsalesrelatedtogoldproduction $ 504 $ 144 $ 60 $ 173 $ 41 $ 195 $ 53 $ 17 $ 54 $ 76Depreciation (224) (21) (19) (42) (8) (44) (7) (2) (9) (15)By-productcredits 1 (1) (17) (4) (7) — (10) — — — —Non-recurringitems 2 — — — — — — — — — —Other 3 — 1 — — — 1 — — — 2Non-controllinginterests — (39) — — — (52) — — — —
Cashcosts $ 279 $ 68 $ 37 $ 124 $ 33 $ 90 $ 46 $ 15 $ 45 $ 63
General&administrativecosts — — — — — (1) — — — —Minesiteexplorationandevaluationcosts 4 8 — — 1 — 1 — — 1 2Minesitesustainingcapitalexpenditures 5 74 32 3 49 9 56 14 1 13 6Rehabilitation–accretionandamortization(operatingsites) 6 9 2 2 1 — 2 — — — 1
Non-controllinginterests (4) (13) — — — (21) — — — —
All-insustainingcosts $ 366 $ 89 $ 42 $ 175 $ 42 $ 127 $ 60 $ 16 $ 59 $ 72
Projectexplorationandevaluationandprojectcosts 4 6 — — — — — — — — —Projectcapitalexpenditures 5 34 — 1 — — — — — — —Non-controllinginterests — — — — — — — — — —
All-incosts $ 406 $ 89 $ 43 $ 175 $ 42 $ 127 $ 60 $ 16 $ 59 $ 72
Ouncessold–equitybasis(000sounces) 582 198 98 194 69 134 74 13 59 99
Costofsalesperounce 7,8 $ 864 $ 450 $ 612 $ 892 $ 595 $ 935 $ 728 $ 1,264 $ 912 $ 772
Cashcostsperounce 8 $ 478 $ 341 $ 379 $ 642 $ 484 $ 679 $ 625 $ 1,162 $ 765 $ 638Cashcostsperounce(onaco-productbasis) 8,9 $ 479 $ 471 $ 418 $ 716 $ 484 $ 713 $ 630 $ 1,173 $ 775 $ 631
All-insustainingcostsperounce 8 $ 630 $ 443 $ 436 $ 905 $ 610 $ 952 $ 822 $ 1,245 $ 981 $ 731All-insustainingcostsperounce(onaco-productbasis) 8,9 $ 631 $ 573 $ 475 $ 979 $ 610 $ 986 $ 827 $ 1,256 $ 991 $ 724
All-incostsperounce 8 $ 696 $ 443 $ 447 $ 905 $ 610 $ 953 $ 822 $ 1,245 $ 981 $ 731All-incostsperounce(onaco-productbasis) 8,9 $ 697 $ 573 $ 486 $ 979 $ 610 $ 987 $ 827 $ 1,256 $ 991 $ 724
-156-
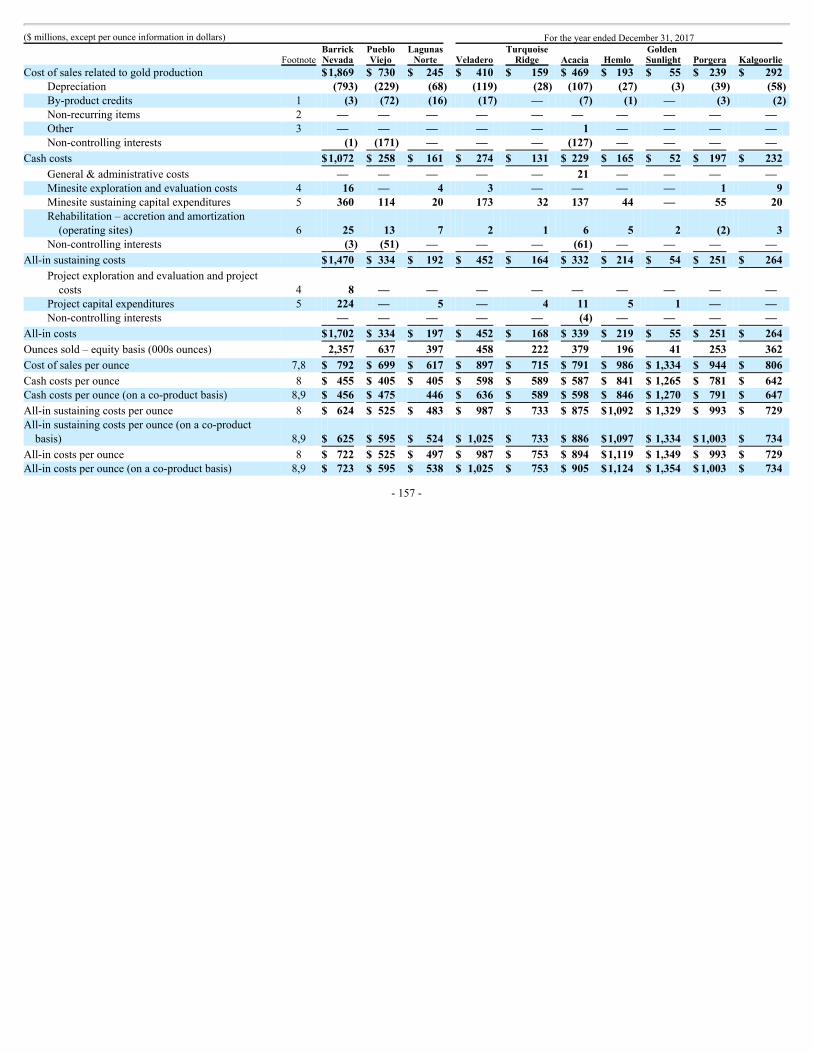
($millions,exceptperounceinformationindollars) FortheyearendedDecember31,2017
FootnoteBarrickNevada
PuebloViejo
LagunasNorte Veladero
TurquoiseRidge Acacia Hemlo
GoldenSunlight Porgera Kalgoorlie
Costofsalesrelatedtogoldproduction $1,869 $ 730 $ 245 $ 410 $ 159 $ 469 $ 193 $ 55 $ 239 $ 292Depreciation (793) (229) (68) (119) (28) (107) (27) (3) (39) (58)By-productcredits 1 (3) (72) (16) (17) — (7) (1) — (3) (2)Non-recurringitems 2 — — — — — — — — — —Other 3 — — — — — 1 — — — —Non-controllinginterests (1) (171) — — — (127) — — — —
Cashcosts $1,072 $ 258 $ 161 $ 274 $ 131 $ 229 $ 165 $ 52 $ 197 $ 232
General&administrativecosts — — — — — 21 — — — —Minesiteexplorationandevaluationcosts 4 16 — 4 3 — — — — 1 9Minesitesustainingcapitalexpenditures 5 360 114 20 173 32 137 44 — 55 20Rehabilitation–accretionandamortization(operatingsites) 6 25 13 7 2 1 6 5 2 (2) 3
Non-controllinginterests (3) (51) — — — (61) — — — —
All-insustainingcosts $1,470 $ 334 $ 192 $ 452 $ 164 $ 332 $ 214 $ 54 $ 251 $ 264
Projectexplorationandevaluationandprojectcosts 4 8 — — — — — — — — —
Projectcapitalexpenditures 5 224 — 5 — 4 11 5 1 — —Non-controllinginterests — — — — — (4) — — — —
All-incosts $1,702 $ 334 $ 197 $ 452 $ 168 $ 339 $ 219 $ 55 $ 251 $ 264
Ouncessold–equitybasis(000sounces) 2,357 637 397 458 222 379 196 41 253 362
Costofsalesperounce 7,8 $ 792 $ 699 $ 617 $ 897 $ 715 $ 791 $ 986 $ 1,334 $ 944 $ 806
Cashcostsperounce 8 $ 455 $ 405 $ 405 $ 598 $ 589 $ 587 $ 841 $ 1,265 $ 781 $ 642Cashcostsperounce(onaco-productbasis) 8,9 $ 456 $ 475 446 $ 636 $ 589 $ 598 $ 846 $ 1,270 $ 791 $ 647
All-insustainingcostsperounce 8 $ 624 $ 525 $ 483 $ 987 $ 733 $ 875 $1,092 $ 1,329 $ 993 $ 729All-insustainingcostsperounce(onaco-productbasis) 8,9 $ 625 $ 595 $ 524 $ 1,025 $ 733 $ 886 $1,097 $ 1,334 $ 1,003 $ 734
All-incostsperounce 8 $ 722 $ 525 $ 497 $ 987 $ 753 $ 894 $1,119 $ 1,349 $ 993 $ 729All-incostsperounce(onaco-productbasis) 8,9 $ 723 $ 595 $ 538 $ 1,025 $ 753 $ 905 $1,124 $ 1,354 $ 1,003 $ 734
-157-
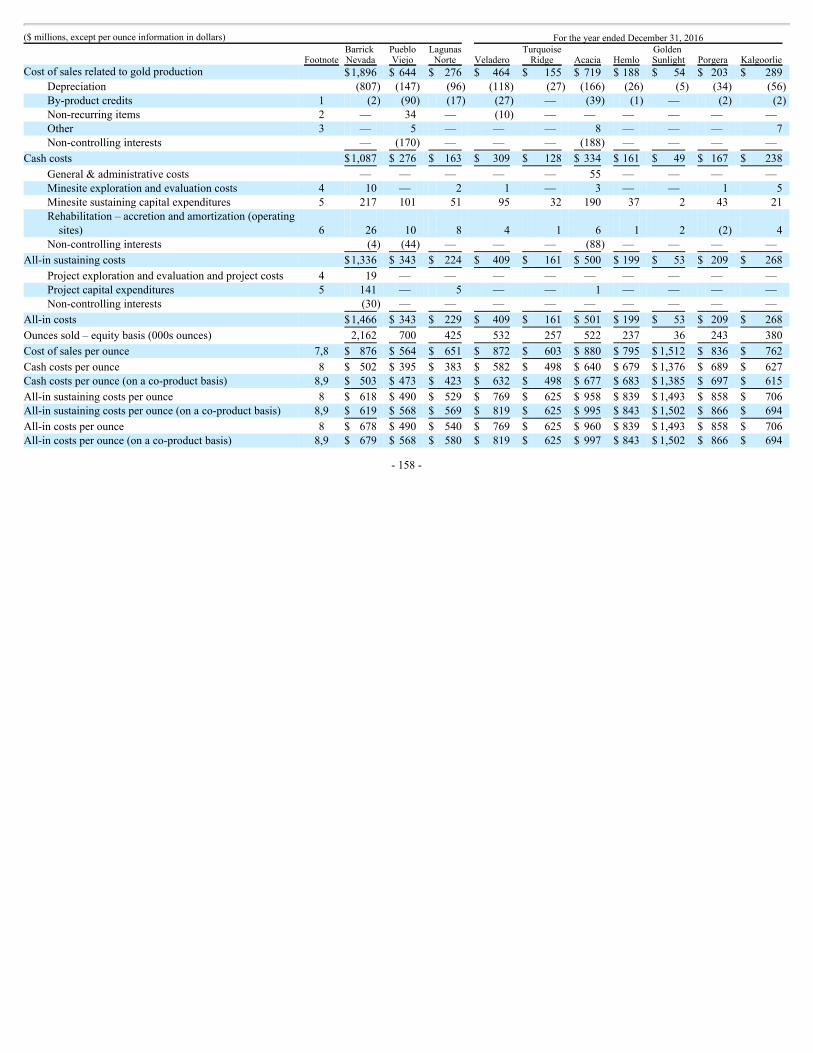
($millions,exceptperounceinformationindollars) FortheyearendedDecember31,2016
FootnoteBarrickNevada
PuebloViejo
LagunasNorte Veladero
TurquoiseRidge Acacia Hemlo
GoldenSunlight Porgera Kalgoorlie
Costofsalesrelatedtogoldproduction $1,896 $ 644 $ 276 $ 464 $ 155 $ 719 $ 188 $ 54 $ 203 $ 289Depreciation (807) (147) (96) (118) (27) (166) (26) (5) (34) (56)By-productcredits 1 (2) (90) (17) (27) — (39) (1) — (2) (2)Non-recurringitems 2 — 34 — (10) — — — — — —Other 3 — 5 — — — 8 — — — 7Non-controllinginterests — (170) — — — (188) — — — —
Cashcosts $1,087 $ 276 $ 163 $ 309 $ 128 $ 334 $ 161 $ 49 $ 167 $ 238
General&administrativecosts — — — — — 55 — — — —Minesiteexplorationandevaluationcosts 4 10 — 2 1 — 3 — — 1 5Minesitesustainingcapitalexpenditures 5 217 101 51 95 32 190 37 2 43 21Rehabilitation–accretionandamortization(operatingsites) 6 26 10 8 4 1 6 1 2 (2) 4
Non-controllinginterests (4) (44) — — — (88) — — — —
All-insustainingcosts $1,336 $ 343 $ 224 $ 409 $ 161 $ 500 $ 199 $ 53 $ 209 $ 268
Projectexplorationandevaluationandprojectcosts 4 19 — — — — — — — — —Projectcapitalexpenditures 5 141 — 5 — — 1 — — — —Non-controllinginterests (30) — — — — — — — — —
All-incosts $1,466 $ 343 $ 229 $ 409 $ 161 $ 501 $ 199 $ 53 $ 209 $ 268
Ouncessold–equitybasis(000sounces) 2,162 700 425 532 257 522 237 36 243 380
Costofsalesperounce 7,8 $ 876 $ 564 $ 651 $ 872 $ 603 $ 880 $ 795 $ 1,512 $ 836 $ 762
Cashcostsperounce 8 $ 502 $ 395 $ 383 $ 582 $ 498 $ 640 $ 679 $ 1,376 $ 689 $ 627Cashcostsperounce(onaco-productbasis) 8,9 $ 503 $ 473 $ 423 $ 632 $ 498 $ 677 $ 683 $ 1,385 $ 697 $ 615
All-insustainingcostsperounce 8 $ 618 $ 490 $ 529 $ 769 $ 625 $ 958 $ 839 $ 1,493 $ 858 $ 706All-insustainingcostsperounce(onaco-productbasis) 8,9 $ 619 $ 568 $ 569 $ 819 $ 625 $ 995 $ 843 $ 1,502 $ 866 $ 694
All-incostsperounce 8 $ 678 $ 490 $ 540 $ 769 $ 625 $ 960 $ 839 $ 1,493 $ 858 $ 706All-incostsperounce(onaco-productbasis) 8,9 $ 679 $ 568 $ 580 $ 819 $ 625 $ 997 $ 843 $ 1,502 $ 866 $ 694
-158-
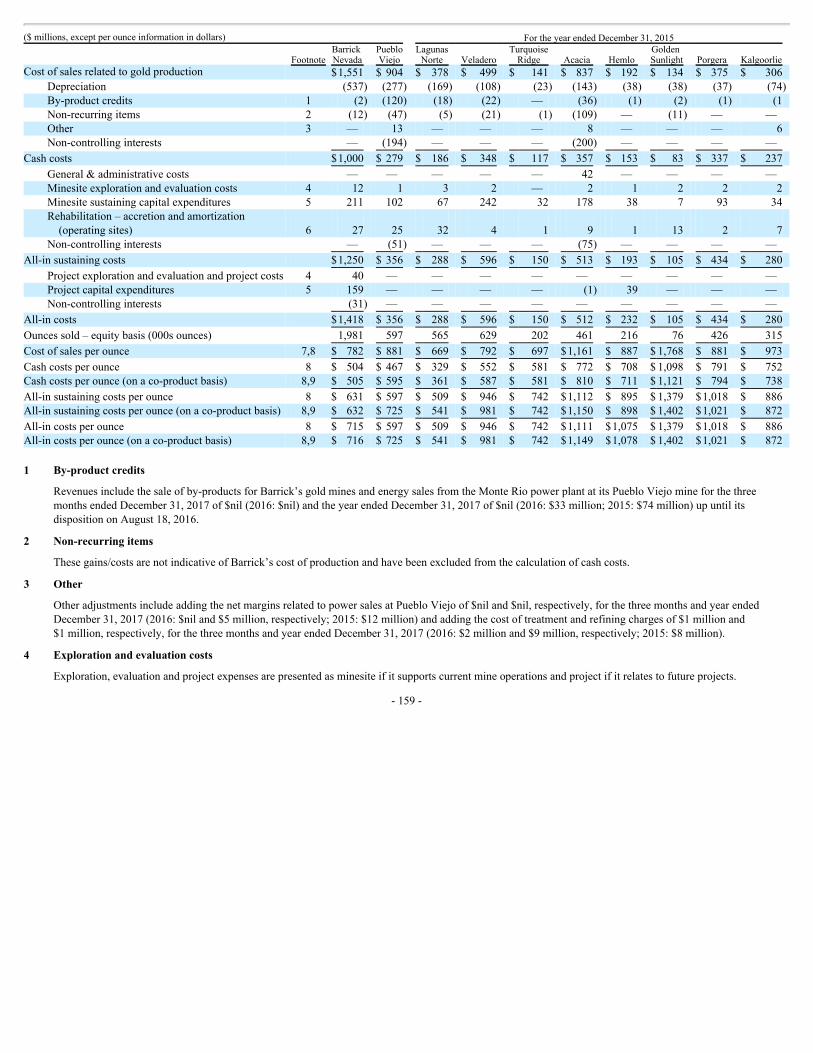
($millions,exceptperounceinformationindollars) FortheyearendedDecember31,2015
FootnoteBarrickNevada
PuebloViejo
LagunasNorte Veladero
TurquoiseRidge Acacia Hemlo
GoldenSunlight Porgera Kalgoorlie
Costofsalesrelatedtogoldproduction $1,551 $ 904 $ 378 $ 499 $ 141 $ 837 $ 192 $ 134 $ 375 $ 306Depreciation (537) (277) (169) (108) (23) (143) (38) (38) (37) (74)By-productcredits 1 (2) (120) (18) (22) — (36) (1) (2) (1) (1Non-recurringitems 2 (12) (47) (5) (21) (1) (109) — (11) — —Other 3 — 13 — — — 8 — — — 6Non-controllinginterests — (194) — — — (200) — — — —
Cashcosts $1,000 $ 279 $ 186 $ 348 $ 117 $ 357 $ 153 $ 83 $ 337 $ 237
General&administrativecosts — — — — — 42 — — — —Minesiteexplorationandevaluationcosts 4 12 1 3 2 — 2 1 2 2 2Minesitesustainingcapitalexpenditures 5 211 102 67 242 32 178 38 7 93 34Rehabilitation–accretionandamortization(operatingsites) 6 27 25 32 4 1 9 1 13 2 7
Non-controllinginterests — (51) — — — (75) — — — —
All-insustainingcosts $1,250 $ 356 $ 288 $ 596 $ 150 $ 513 $ 193 $ 105 $ 434 $ 280
Projectexplorationandevaluationandprojectcosts 4 40 — — — — — — — — —Projectcapitalexpenditures 5 159 — — — — (1) 39 — — —Non-controllinginterests (31) — — — — — — — — —
All-incosts $1,418 $ 356 $ 288 $ 596 $ 150 $ 512 $ 232 $ 105 $ 434 $ 280
Ouncessold–equitybasis(000sounces) 1,981 597 565 629 202 461 216 76 426 315
Costofsalesperounce 7,8 $ 782 $ 881 $ 669 $ 792 $ 697 $1,161 $ 887 $ 1,768 $ 881 $ 973
Cashcostsperounce 8 $ 504 $ 467 $ 329 $ 552 $ 581 $ 772 $ 708 $ 1,098 $ 791 $ 752Cashcostsperounce(onaco-productbasis) 8,9 $ 505 $ 595 $ 361 $ 587 $ 581 $ 810 $ 711 $ 1,121 $ 794 $ 738
All-insustainingcostsperounce 8 $ 631 $ 597 $ 509 $ 946 $ 742 $1,112 $ 895 $ 1,379 $1,018 $ 886All-insustainingcostsperounce(onaco-productbasis) 8,9 $ 632 $ 725 $ 541 $ 981 $ 742 $1,150 $ 898 $ 1,402 $1,021 $ 872
All-incostsperounce 8 $ 715 $ 597 $ 509 $ 946 $ 742 $1,111 $1,075 $ 1,379 $1,018 $ 886All-incostsperounce(onaco-productbasis) 8,9 $ 716 $ 725 $ 541 $ 981 $ 742 $1,149 $1,078 $ 1,402 $1,021 $ 8721 By-productcredits
Revenuesincludethesaleofby-productsforBarrick’sgoldminesandenergysalesfromtheMonteRiopowerplantatitsPuebloViejomineforthethreemonthsendedDecember31,2017of$nil(2016:$nil)andtheyearendedDecember31,2017of$nil(2016:$33million;2015:$74million)upuntilitsdispositiononAugust18,2016.
2 Non-recurringitems
Thesegains/costsarenotindicativeofBarrick’scostofproductionandhavebeenexcludedfromthecalculationofcashcosts.
3 Other
OtheradjustmentsincludeaddingthenetmarginsrelatedtopowersalesatPuebloViejoof$niland$nil,respectively,forthethreemonthsandyearendedDecember31,2017(2016:$niland$5million,respectively;2015:$12million)andaddingthecostoftreatmentandrefiningchargesof$1millionand$1million,respectively,forthethreemonthsandyearendedDecember31,2017(2016:$2millionand$9million,respectively;2015:$8million).
4 Explorationandevaluationcosts
Exploration,evaluationandprojectexpensesarepresentedasminesiteifitsupportscurrentmineoperationsandprojectifitrelatestofutureprojects.
-159-

5 Capitalexpenditures
CapitalexpendituresarerelatedtoBarrick’sgoldsitesonlyandarepresentedona100%accruedbasis.Theyaresplitbetweenminesitesustainingandprojectcapitalexpenditures.Projectcapitalexpendituresaredistinctprojectsdesignedtoincreasethenetpresentvalueofthemineandarenotrelatedtocurrentproduction.SignificantprojectsinthecurrentyearareCrossroads,CortezHillsLowerZone,RangeFrontDeclinesandGoldrush.
6 Rehabilitation–accretionandamortization
IncludesdepreciationontheassetsrelatedtorehabilitationprovisionsofBarrick’sgoldoperationsandaccretionontherehabilitationprovisionsofitsgoldoperations,splitbetweenoperatingandnon-operatingsites.
7 Costofsalesperounce
Costofsalesrelatedtogoldperounceiscalculatedusingcostofsalesonanattributablebasis(removingthenon-controllinginterestof40%PuebloViejoand36.1%Acaciafromcostofsales),dividedbyattributablegoldounces.
8 Perouncefigures
Costofsalesperounce,cashcostsperounce,all-insustainingcostsperounceandall-incostsperouncemaynotcalculatebasedonamountspresentedinthistableduetorounding.
9 Co-productcostsperounce
Costofsalesperounce,cashcostsperounce,all-insustainingcostsperounceandall-incostsperouncemaynotcalculatebasedonamountspresentedinthistableduetorounding.
-160-
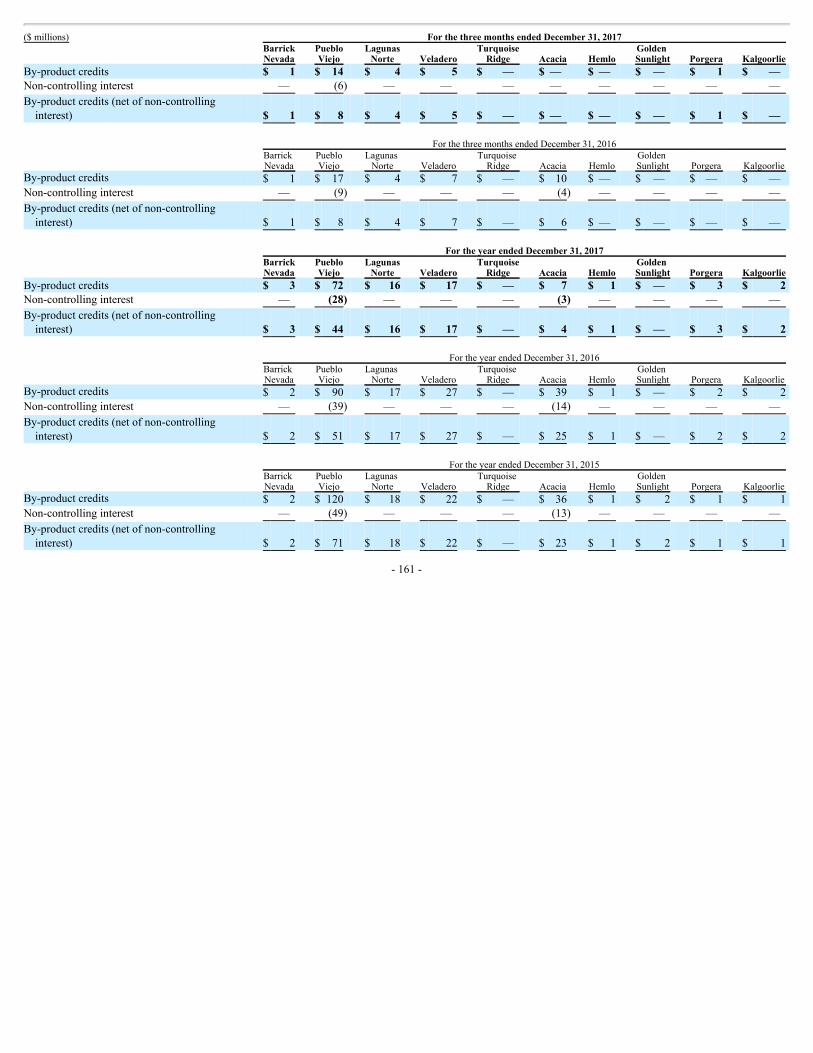
($millions) ForthethreemonthsendedDecember31,2017
BarrickNevada
PuebloViejo
LagunasNorte Veladero
TurquoiseRidge Acacia Hemlo
GoldenSunlight Porgera Kalgoorlie
By-productcredits $ 1 $ 14 $ 4 $ 5 $ — $ — $ — $ — $ 1 $ —Non-controllinginterest — (6) — — — — — — — —
By-productcredits(netofnon-controllinginterest) $ 1 $ 8 $ 4 $ 5 $ — $ — $ — $ — $ 1 $ —
ForthethreemonthsendedDecember31,2016
BarrickNevada
PuebloViejo
LagunasNorte Veladero
TurquoiseRidge Acacia Hemlo
GoldenSunlight Porgera Kalgoorlie
By-productcredits $ 1 $ 17 $ 4 $ 7 $ — $ 10 $ — $ — $ — $ —Non-controllinginterest — (9) — — — (4) — — — —
By-productcredits(netofnon-controllinginterest) $ 1 $ 8 $ 4 $ 7 $ — $ 6 $ — $ — $ — $ —
FortheyearendedDecember31,2017
BarrickNevada
PuebloViejo
LagunasNorte Veladero
TurquoiseRidge Acacia Hemlo
GoldenSunlight Porgera Kalgoorlie
By-productcredits $ 3 $ 72 $ 16 $ 17 $ — $ 7 $ 1 $ — $ 3 $ 2Non-controllinginterest — (28) — — — (3) — — — —
By-productcredits(netofnon-controllinginterest) $ 3 $ 44 $ 16 $ 17 $ — $ 4 $ 1 $ — $ 3 $ 2
FortheyearendedDecember31,2016
BarrickNevada
PuebloViejo
LagunasNorte Veladero
TurquoiseRidge Acacia Hemlo
GoldenSunlight Porgera Kalgoorlie
By-productcredits $ 2 $ 90 $ 17 $ 27 $ — $ 39 $ 1 $ — $ 2 $ 2Non-controllinginterest — (39) — — — (14) — — — —
By-productcredits(netofnon-controllinginterest) $ 2 $ 51 $ 17 $ 27 $ — $ 25 $ 1 $ — $ 2 $ 2
FortheyearendedDecember31,2015
BarrickNevada
PuebloViejo
LagunasNorte Veladero
TurquoiseRidge Acacia Hemlo
GoldenSunlight Porgera Kalgoorlie
By-productcredits $ 2 $ 120 $ 18 $ 22 $ — $ 36 $ 1 $ 2 $ 1 $ 1Non-controllinginterest — (49) — — — (13) — — — —
By-productcredits(netofnon-controllinginterest) $ 2 $ 71 $ 18 $ 22 $ — $ 23 $ 1 $ 2 $ 1 $ 1
-161-
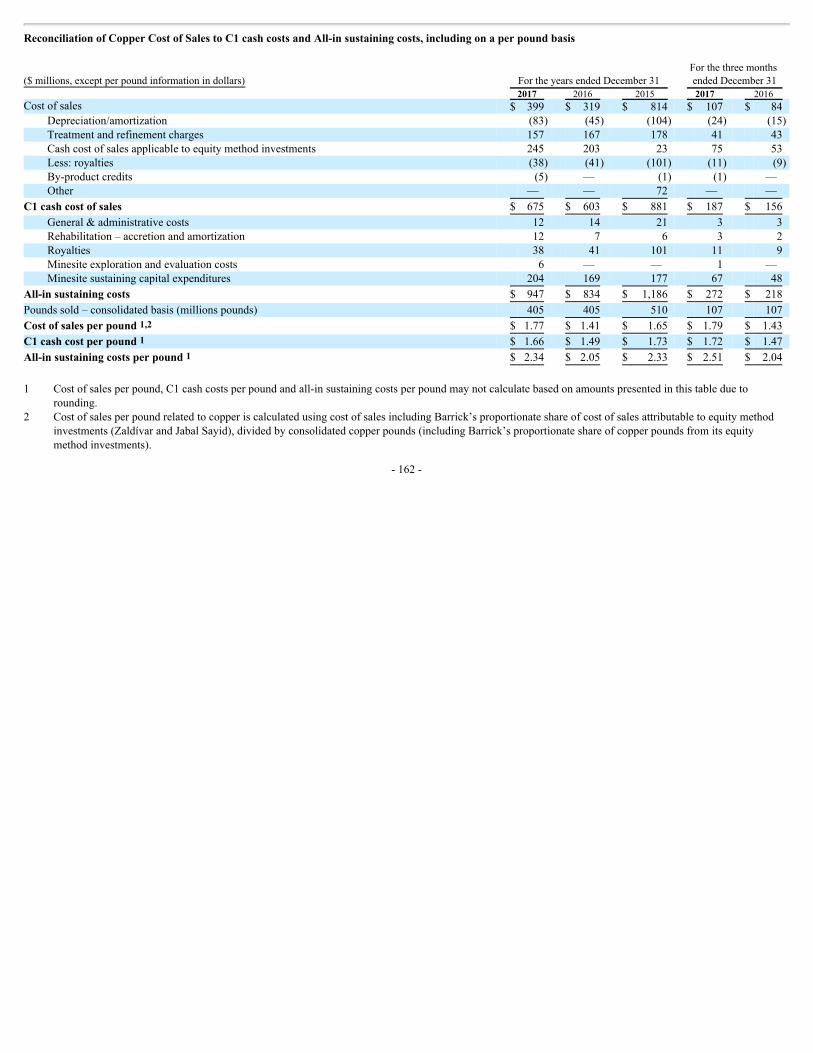
ReconciliationofCopperCostofSalestoC1cashcostsandAll-insustainingcosts,includingonaperpoundbasis
($millions,exceptperpoundinformationindollars) FortheyearsendedDecember31 ForthethreemonthsendedDecember31
2017 2016 2015 2017 2016 Costofsales $ 399 $ 319 $ 814 $ 107 $ 84
Depreciation/amortization (83) (45) (104) (24) (15)Treatmentandrefinementcharges 157 167 178 41 43Cashcostofsalesapplicabletoequitymethodinvestments 245 203 23 75 53Less:royalties (38) (41) (101) (11) (9)By-productcredits (5) — (1) (1) —Other — — 72 — —
C1cashcostofsales $ 675 $ 603 $ 881 $ 187 $ 156
General&administrativecosts 12 14 21 3 3Rehabilitation–accretionandamortization 12 7 6 3 2Royalties 38 41 101 11 9Minesiteexplorationandevaluationcosts 6 — — 1 —Minesitesustainingcapitalexpenditures 204 169 177 67 48
All-insustainingcosts $ 947 $ 834 $ 1,186 $ 272 $ 218
Poundssold–consolidatedbasis(millionspounds) 405 405 510 107 107
Costofsalesperpound1,2 $ 1.77 $ 1.41 $ 1.65 $ 1.79 $ 1.43
C1cashcostperpound1 $ 1.66 $ 1.49 $ 1.73 $ 1.72 $ 1.47
All-insustainingcostsperpound1 $ 2.34 $ 2.05 $ 2.33 $ 2.51 $ 2.04
1 Costofsalesperpound,C1cashcostsperpoundandall-insustainingcostsperpoundmaynotcalculatebasedonamountspresentedinthistabledueto
rounding.2 CostofsalesperpoundrelatedtocopperiscalculatedusingcostofsalesincludingBarrick’sproportionateshareofcostofsalesattributabletoequitymethod
investments(ZaldívarandJabalSayid),dividedbyconsolidatedcopperpounds(includingBarrick’sproportionateshareofcopperpoundsfromitsequitymethodinvestments).
-162-
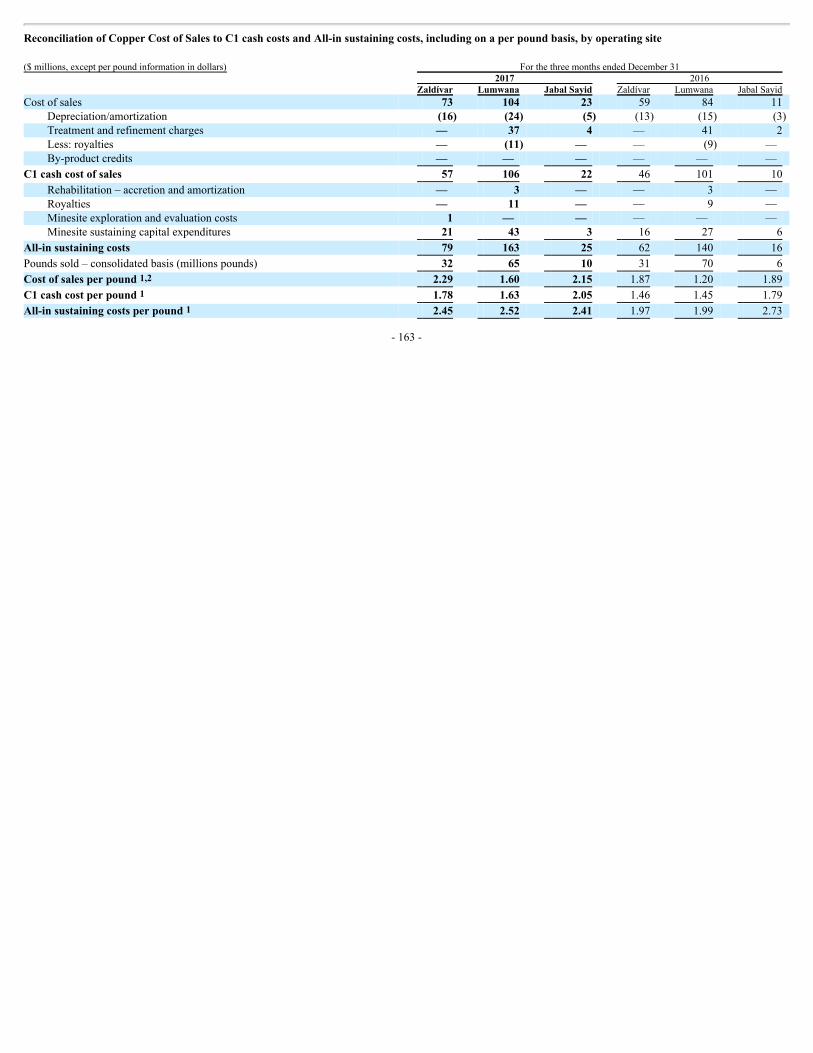
ReconciliationofCopperCostofSalestoC1cashcostsandAll-insustainingcosts,includingonaperpoundbasis,byoperatingsite($millions,exceptperpoundinformationindollars) ForthethreemonthsendedDecember31 2017 2016 Zaldívar Lumwana JabalSayid Zaldívar Lumwana JabalSayidCostofsales 73 104 23 59 84 11
Depreciation/amortization (16) (24) (5) (13) (15) (3)Treatmentandrefinementcharges — 37 4 — 41 2Less:royalties — (11) — — (9) —By-productcredits — — — — — —
C1cashcostofsales 57 106 22 46 101 10
Rehabilitation–accretionandamortization — 3 — — 3 —Royalties — 11 — — 9 —Minesiteexplorationandevaluationcosts 1 — — — — —Minesitesustainingcapitalexpenditures 21 43 3 16 27 6
All-insustainingcosts 79 163 25 62 140 16
Poundssold–consolidatedbasis(millionspounds) 32 65 10 31 70 6
Costofsalesperpound1,2 2.29 1.60 2.15 1.87 1.20 1.89
C1cashcostperpound1 1.78 1.63 2.05 1.46 1.45 1.79
All-insustainingcostsperpound1 2.45 2.52 2.41 1.97 1.99 2.73
-163-
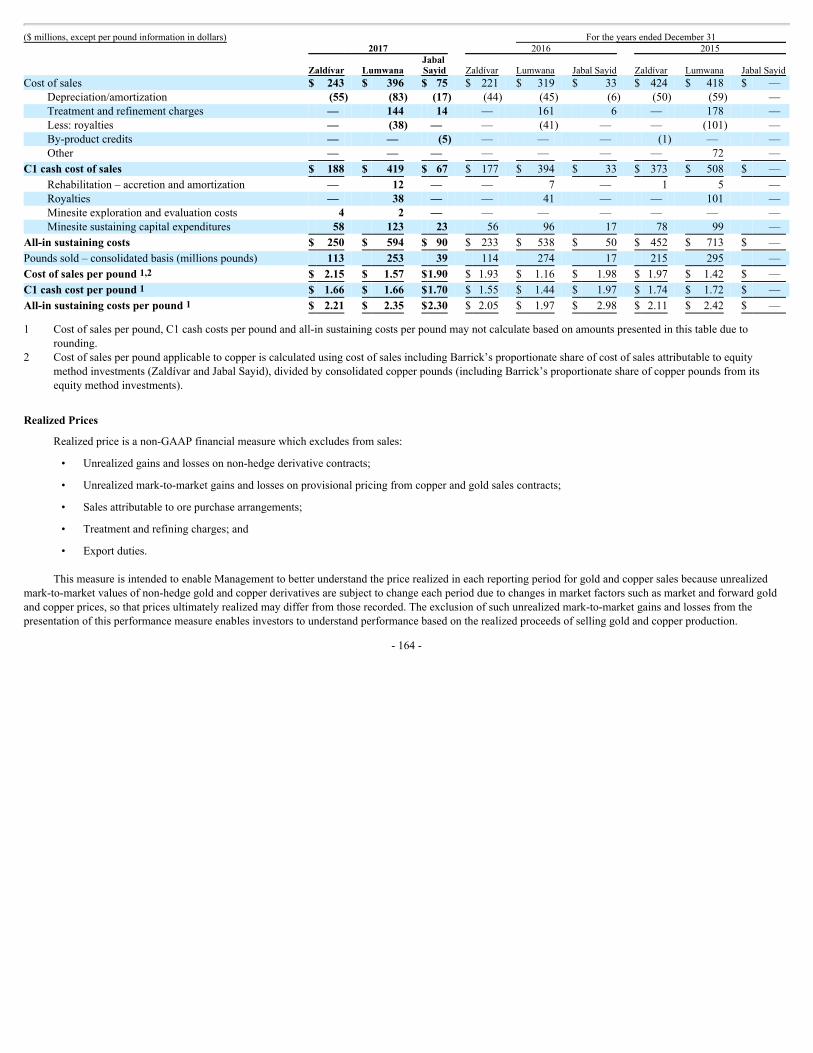
($millions,exceptperpoundinformationindollars) FortheyearsendedDecember31 2017 2016 2015
Zaldívar Lumwana JabalSayid Zaldívar Lumwana JabalSayid Zaldívar Lumwana JabalSayid
Costofsales $ 243 $ 396 $ 75 $ 221 $ 319 $ 33 $ 424 $ 418 $ —Depreciation/amortization (55) (83) (17) (44) (45) (6) (50) (59) —Treatmentandrefinementcharges — 144 14 — 161 6 — 178 —Less:royalties — (38) — — (41) — — (101) —By-productcredits — — (5) — — — (1) — —Other — — — — — — — 72 —
C1cashcostofsales $ 188 $ 419 $ 67 $ 177 $ 394 $ 33 $ 373 $ 508 $ —
Rehabilitation–accretionandamortization — 12 — — 7 — 1 5 —Royalties — 38 — — 41 — — 101 —Minesiteexplorationandevaluationcosts 4 2 — — — — — — —Minesitesustainingcapitalexpenditures 58 123 23 56 96 17 78 99 —
All-insustainingcosts $ 250 $ 594 $ 90 $ 233 $ 538 $ 50 $ 452 $ 713 $ —
Poundssold–consolidatedbasis(millionspounds) 113 253 39 114 274 17 215 295 —
Costofsalesperpound1,2 $ 2.15 $ 1.57 $1.90 $ 1.93 $ 1.16 $ 1.98 $ 1.97 $ 1.42 $ —
C1cashcostperpound1 $ 1.66 $ 1.66 $1.70 $ 1.55 $ 1.44 $ 1.97 $ 1.74 $ 1.72 $ —
All-insustainingcostsperpound1 $ 2.21 $ 2.35 $2.30 $ 2.05 $ 1.97 $ 2.98 $ 2.11 $ 2.42 $ —
1 Costofsalesperpound,C1cashcostsperpoundandall-insustainingcostsperpoundmaynotcalculatebasedonamountspresentedinthistableduetorounding.
2 CostofsalesperpoundapplicabletocopperiscalculatedusingcostofsalesincludingBarrick’sproportionateshareofcostofsalesattributabletoequitymethodinvestments(ZaldívarandJabalSayid),dividedbyconsolidatedcopperpounds(includingBarrick’sproportionateshareofcopperpoundsfromitsequitymethodinvestments).
RealizedPrices
Realizedpriceisanon-GAAPfinancialmeasurewhichexcludesfromsales:
• Unrealizedgainsandlossesonnon-hedgederivativecontracts;
• Unrealizedmark-to-marketgainsandlossesonprovisionalpricingfromcopperandgoldsalescontracts;
• Salesattributabletoorepurchasearrangements;
• Treatmentandrefiningcharges;and
• Exportduties.
ThismeasureisintendedtoenableManagementtobetterunderstandthepricerealizedineachreportingperiodforgoldandcoppersalesbecauseunrealizedmark-to-marketvaluesofnon-hedgegoldandcopperderivativesaresubjecttochangeeachperiodduetochangesinmarketfactorssuchasmarketandforwardgoldandcopperprices,sothatpricesultimatelyrealizedmaydifferfromthoserecorded.Theexclusionofsuchunrealizedmark-to-marketgainsandlossesfromthepresentationofthisperformancemeasureenablesinvestorstounderstandperformancebasedontherealizedproceedsofsellinggoldandcopperproduction.
-164-

Thegainsandlossesonnon-hedgederivativesandreceivablebalancesrelatetoinstruments/balancesthatmatureinfutureperiods,atwhichtimethegainsandlosseswillbecomerealized.Theamountsofthesegainsandlossesreflectfairvaluesbasedonmarketvaluationassumptionsattheendofeachperiodanddonotnecessarilyrepresenttheamountsthatwillbecomerealizedonmaturity.Barrickalsoexcludesexportdutiesthatarepaiduponsaleandnettedagainstrevenuesaswellastreatmentandrefiningchargesthatarepaidtotherefinerongoldandcopperconcentratesalesthatarenettedagainstrevenues.Barrickbelievesthisprovidesinvestorsandanalystswithamoreaccuratemeasurewithwhichtocomparetomarketgoldpricesandtoassessitsgoldsalesperformance.Forthosereasons,managementbelievesthatthismeasureprovidesamoreaccuratereflectionoftheCompany’spastperformanceandisabetterindicatorofitsexpectedperformanceinfutureperiods.
Therealizedpricemeasureisintendedtoprovideadditionalinformation,anddoesnothaveanystandardizeddefinitionunderIFRSandshouldnotbeconsideredinisolationorasasubstituteformeasuresofperformancepreparedinaccordancewithIFRS.ThemeasureisnotnecessarilyindicativeofsalesasdeterminedunderIFRS.Othercompaniesmaycalculatethismeasuredifferently.ThefollowingtablereconcilesrealizedpricestothemostdirectlycomparableIFRSmeasure.
-165-
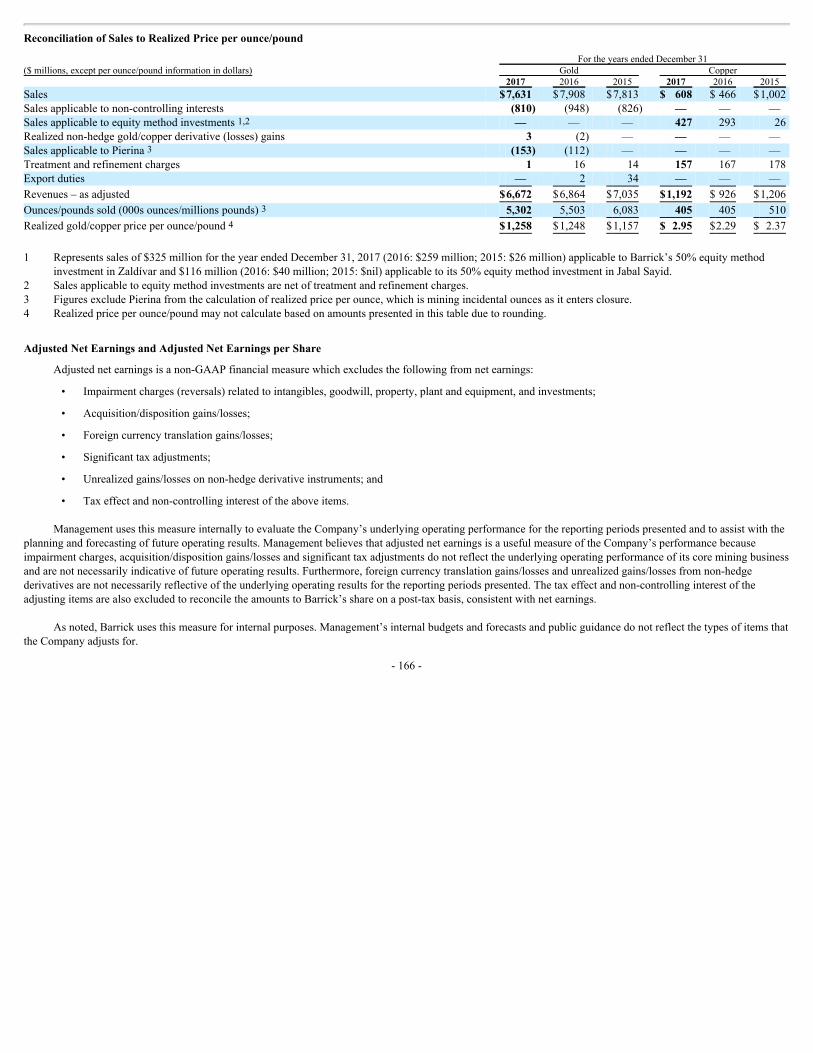
ReconciliationofSalestoRealizedPriceperounce/pound FortheyearsendedDecember31 ($millions,exceptperounce/poundinformationindollars) Gold Copper 2017 2016 2015 2017 2016 2015 Sales $7,631 $7,908 $7,813 $ 608 $ 466 $1,002Salesapplicabletonon-controllinginterests (810) (948) (826) — — —Salesapplicabletoequitymethodinvestments1,2 — — — 427 293 26Realizednon-hedgegold/copperderivative(losses)gains 3 (2) — — — —SalesapplicabletoPierina3 (153) (112) — — — —Treatmentandrefinementcharges 1 16 14 157 167 178Exportduties — 2 34 — — —
Revenues–asadjusted $6,672 $6,864 $7,035 $1,192 $ 926 $1,206
Ounces/poundssold(000sounces/millionspounds)3 5,302 5,503 6,083 405 405 510
Realizedgold/copperpriceperounce/pound4 $1,258 $1,248 $1,157 $ 2.95 $2.29 $ 2.37
1 Representssalesof$325millionfortheyearendedDecember31,2017(2016:$259million;2015:$26million)applicabletoBarrick’s50%equitymethod
investmentinZaldívarand$116million(2016:$40million;2015:$nil)applicabletoits50%equitymethodinvestmentinJabalSayid.2 Salesapplicabletoequitymethodinvestmentsarenetoftreatmentandrefinementcharges.3 FiguresexcludePierinafromthecalculationofrealizedpriceperounce,whichisminingincidentalouncesasitentersclosure.4 Realizedpriceperounce/poundmaynotcalculatebasedonamountspresentedinthistableduetorounding.
AdjustedNetEarningsandAdjustedNetEarningsperShare
Adjustednetearningsisanon-GAAPfinancialmeasurewhichexcludesthefollowingfromnetearnings:
• Impairmentcharges(reversals)relatedtointangibles,goodwill,property,plantandequipment,andinvestments;
• Acquisition/dispositiongains/losses;
• Foreigncurrencytranslationgains/losses;
• Significanttaxadjustments;
• Unrealizedgains/lossesonnon-hedgederivativeinstruments;and
• Taxeffectandnon-controllinginterestoftheaboveitems.
ManagementusesthismeasureinternallytoevaluatetheCompany’sunderlyingoperatingperformanceforthereportingperiodspresentedandtoassistwiththeplanningandforecastingoffutureoperatingresults.ManagementbelievesthatadjustednetearningsisausefulmeasureoftheCompany’sperformancebecauseimpairmentcharges,acquisition/dispositiongains/lossesandsignificanttaxadjustmentsdonotreflecttheunderlyingoperatingperformanceofitscoreminingbusinessandarenotnecessarilyindicativeoffutureoperatingresults.Furthermore,foreigncurrencytranslationgains/lossesandunrealizedgains/lossesfromnon-hedgederivativesarenotnecessarilyreflectiveoftheunderlyingoperatingresultsforthereportingperiodspresented.Thetaxeffectandnon-controllinginterestoftheadjustingitemsarealsoexcludedtoreconciletheamountstoBarrick’sshareonapost-taxbasis,consistentwithnetearnings.
Asnoted,Barrickusesthismeasureforinternalpurposes.Management’sinternalbudgetsandforecastsandpublicguidancedonotreflectthetypesofitemsthattheCompanyadjustsfor.
-166-
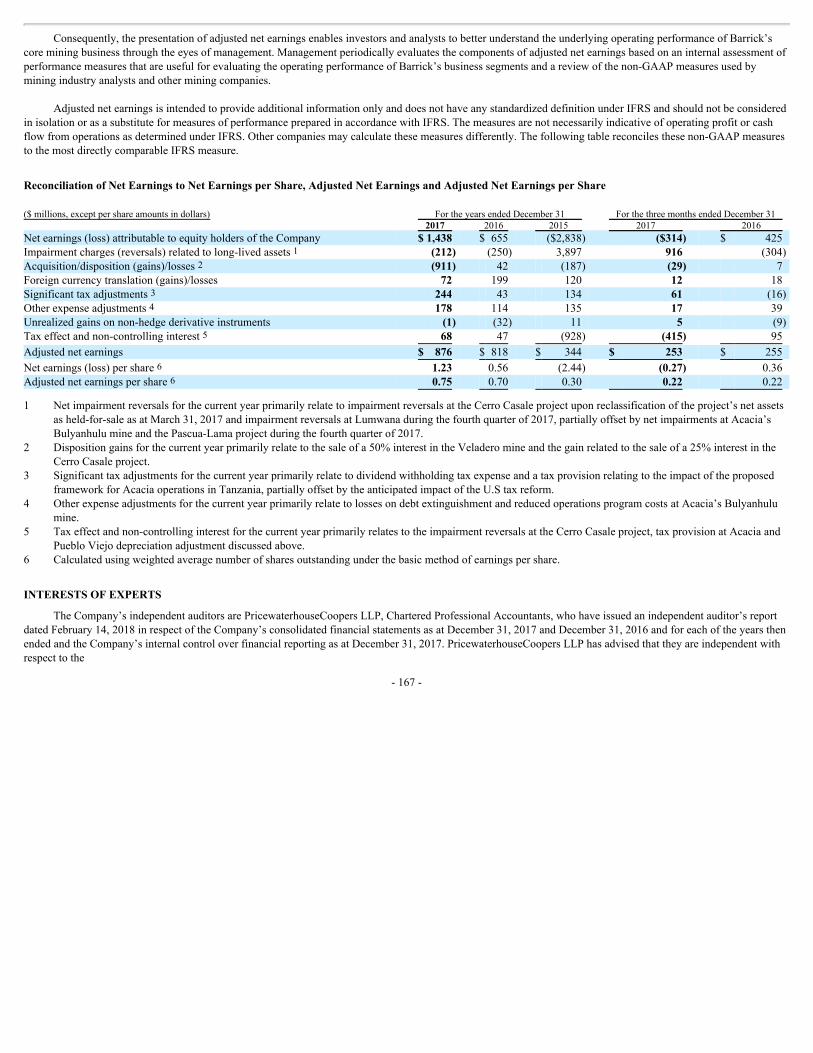
Consequently,thepresentationofadjustednetearningsenablesinvestorsandanalyststobetterunderstandtheunderlyingoperatingperformanceofBarrick’scoreminingbusinessthroughtheeyesofmanagement.ManagementperiodicallyevaluatesthecomponentsofadjustednetearningsbasedonaninternalassessmentofperformancemeasuresthatareusefulforevaluatingtheoperatingperformanceofBarrick’sbusinesssegmentsandareviewofthenon-GAAPmeasuresusedbyminingindustryanalystsandotherminingcompanies.
AdjustednetearningsisintendedtoprovideadditionalinformationonlyanddoesnothaveanystandardizeddefinitionunderIFRSandshouldnotbeconsideredinisolationorasasubstituteformeasuresofperformancepreparedinaccordancewithIFRS.ThemeasuresarenotnecessarilyindicativeofoperatingprofitorcashflowfromoperationsasdeterminedunderIFRS.Othercompaniesmaycalculatethesemeasuresdifferently.Thefollowingtablereconcilesthesenon-GAAPmeasurestothemostdirectlycomparableIFRSmeasure.
ReconciliationofNetEarningstoNetEarningsperShare,AdjustedNetEarningsandAdjustedNetEarningsperShare($millions,exceptpershareamountsindollars) FortheyearsendedDecember31 ForthethreemonthsendedDecember31 2017 2016 2015 2017 2016 Netearnings(loss)attributabletoequityholdersoftheCompany $ 1,438 $ 655 ($2,838) ($314) $ 425Impairmentcharges(reversals)relatedtolong-livedassets1 (212) (250) 3,897 916 (304)Acquisition/disposition(gains)/losses2 (911) 42 (187) (29) 7Foreigncurrencytranslation(gains)/losses 72 199 120 12 18Significanttaxadjustments3 244 43 134 61 (16)Otherexpenseadjustments4 178 114 135 17 39Unrealizedgainsonnon-hedgederivativeinstruments (1) (32) 11 5 (9)Taxeffectandnon-controllinginterest5 68 47 (928) (415) 95
Adjustednetearnings $ 876 $ 818 $ 344 $ 253 $ 255
Netearnings(loss)pershare6 1.23 0.56 (2.44) (0.27) 0.36Adjustednetearningspershare6 0.75 0.70 0.30 0.22 0.22
1 NetimpairmentreversalsforthecurrentyearprimarilyrelatetoimpairmentreversalsattheCerroCasaleprojectuponreclassificationoftheproject’snetassetsasheld-for-saleasatMarch31,2017andimpairmentreversalsatLumwanaduringthefourthquarterof2017,partiallyoffsetbynetimpairmentsatAcacia’sBulyanhulumineandthePascua-Lamaprojectduringthefourthquarterof2017.
2 Dispositiongainsforthecurrentyearprimarilyrelatetothesaleofa50%interestintheVeladeromineandthegainrelatedtothesaleofa25%interestintheCerroCasaleproject.
3 SignificanttaxadjustmentsforthecurrentyearprimarilyrelatetodividendwithholdingtaxexpenseandataxprovisionrelatingtotheimpactoftheproposedframeworkforAcaciaoperationsinTanzania,partiallyoffsetbytheanticipatedimpactoftheU.Staxreform.
4 OtherexpenseadjustmentsforthecurrentyearprimarilyrelatetolossesondebtextinguishmentandreducedoperationsprogramcostsatAcacia’sBulyanhulumine.
5 Taxeffectandnon-controllinginterestforthecurrentyearprimarilyrelatestotheimpairmentreversalsattheCerroCasaleproject,taxprovisionatAcaciaandPuebloViejodepreciationadjustmentdiscussedabove.
6 Calculatedusingweightedaveragenumberofsharesoutstandingunderthebasicmethodofearningspershare.
INTERESTSOFEXPERTS
TheCompany’sindependentauditorsarePricewaterhouseCoopersLLP,CharteredProfessionalAccountants,whohaveissuedanindependentauditor’sreportdatedFebruary14,2018inrespectoftheCompany’sconsolidatedfinancialstatementsasatDecember31,2017andDecember31,2016andforeachoftheyearsthenendedandtheCompany’sinternalcontroloverfinancialreportingasatDecember31,2017.PricewaterhouseCoopersLLPhasadvisedthattheyareindependentwithrespecttothe
-167-

CompanywithinthemeaningoftheCharteredProfessionalAccountantsofOntarioCPACodeofProfessionalConductandtherulesoftheUSSecuritiesandExchangeCommission.
ADDITIONALINFORMATION
Additionalinformation,includingdirectors’andofficers’remunerationandindebtedness,principalholdersoftheCompany’ssecuritiesandoptionstopurchasesecuritiesiscontainedintheCompany’sManagementInformationCircularandProxyStatementdatedMarch16,2018.Aswell,additionalfinancialinformationisprovidedintheCompany’s2017AnnualReport,intheCompany’sConsolidatedFinancialStatements(aspreparedunderIFRS)andManagement’sDiscussionandAnalysisofFinancialandOperatingResultsfortheyearendedDecember31,2017(aspreparedunderIFRS),eachofwhichisavailableelectronicallyfromSEDAR(www.sedar.com)andfromEDGAR(www.sec.gov).AdditionalInformationrelatingtoBarrickisavailableonSEDARatwww.sedar.comandonEDGARatwww.sec.gov.
-168-
SCHEDULE“A”AUDITCOMMITTEEMANDATE
Purpose
1.ThepurposeoftheAuditCommittee(the“Committee”)oftheBoardofDirectors(the“Board”)istoassisttheBoardinitsoversightof:(i)thefinancialreportingprocessandthequality,transparencyandintegrityoftheCompany’sfinancialstatementsandotherrelatedpublicdisclosures;(ii)theCompany’sinternalcontrolsoverfinancialreporting;(iii)theCompany’scompliancewithlegalandregulatoryrequirementsrelevanttothefinancialstatementsandfinancialreporting;(v)theexternalauditor’squalificationsandindependence;and(vi)theperformanceoftheinternalauditfunctionandtheexternalauditor.
2.ThefunctionoftheCommitteeisoversight.ThemembersoftheCommitteearenotfull-timeemployeesoftheCompany.TheCompany’smanagementisresponsibleforthepreparationoftheCompany’sfinancialstatementsinaccordancewithapplicableaccountingstandardsandapplicablelawsandregulations.TheCompany’sexternalauditorisresponsiblefortheauditorreview,asapplicable,oftheCompany’sfinancialstatementsinaccordancewithapplicableauditingstandardsandlawsandregulations.
CommitteeResponsibilities
3. TheCommittee’sresponsibilitiesshallinclude:
External Auditors
(a) retainingandterminating,and/ormakingrecommendationstotheBoardofDirectorsandtheshareholderswithrespecttotheretentionorterminationofanexternalauditingfirmtoconductreviewengagementsonaquarterlybasisandanannualauditoftheCompany’sfinancialstatements;
(b) communicatingtotheexternalauditorthatitisultimatelyaccountabletotheBoardandtheCommitteeasrepresentativesoftheshareholders;
(c) obtainingandreviewinganannualreportpreparedbytheexternalauditordescribing:thefirm’sinternalqualitycontrolprocedures;anymaterialissuesraisedbythemostrecentinternalqualitycontrolreview,orpeerreview,ofthefirm,orbyanyinquiryorinvestigationbygovernmentalorprofessionalauthorities,withintheprecedingfiveyears,respectingoneormoreindependentauditscarriedoutbythefirm,andanystepstakentodealwithanysuchissues;
(d) evaluatingtheindependenceoftheexternalauditorandanypotentialconflictsofinterestand(toassesstheauditor’sindependence)allrelationships
betweentheexternalauditorandtheCompany,includingobtainingandreviewinganannualreportpreparedbytheexternalauditordescribingallrelationshipsbetweentheexternalauditorandtheCompany;
(e) approving,orrecommendingtotheBoardofDirectorsforapproval,allauditengagementfeesandterms,aswellasallnon-auditengagementsoftheexternalauditorpriortothecommencementoftheengagement;
A-1-
(f) reviewingwiththeexternalauditortheplanandscopeofthequarterlyreviewandannualauditengagements;
(g) settinghiringpolicieswithrespecttotheemploymentofcurrentorformeremployeesoftheexternalauditor;
Financial Reporting
(h) reviewing,discussingandrecommendingtotheBoardforapprovaltheannualauditedfinancialstatementsandrelatedmanagement’sdiscussionandanalysisoffinancialandoperatingresultspriortofilingwithsecuritiesregulatoryauthoritiesanddeliverytoshareholders;
(i) reviewinganddiscussingwiththeexternalauditortheresultsofitsreviewsandaudit,anyissuesarisingandmanagement’sresponse,includingany
restrictionsonthescopeoftheexternalauditor’sactivitiesorrequestedinformationandanysignificantdisagreementswithmanagement,andresolvinganydisputes;
(j) reviewing,discussingandapproving,orrecommendingtotheBoardforapproval,thequarterlyfinancialstatementsandquarterlymanagement’sdiscussionandanalysisoffinancialandoperatingresultspriortofilingwithsecuritiesregulatoryauthoritiesanddeliverytoshareholders;
(k) reviewinganddiscussingwithmanagementandtheexternalauditortheCompany’scriticalaccountingpoliciesandpractices,materialalternative
accountingtreatments,significantaccountingandreportingjudgments,materialwrittencommunicationsbetweentheexternalauditorandmanagement(includingmanagementrepresentationlettersandanyscheduleofunadjusteddifferences)andsignificantadjustmentsresultingfromtheauditorreview;
(l) reviewinganddiscussingwithmanagementtheCompany’searningspressreleases,aswellastypesoffinancialinformationandearningsguidance(ifany)providedtoanalystsandratingsagencies;
(m) reviewinganddiscussingsuchotherrelevantpublicdisclosurescontainingfinancialinformationastheCommitteemayconsidernecessaryorappropriate;
(n) reviewinganddiscussingwithmanagementthedisclosurecontrolsrelatingtotheCompany’spublicdisclosureoffinancialinformation,includinginformationextractedorderivedfromthefinancialstatements,andperiodicallyassessingtheadequacyofsuchprocedures;
Internal Controls Over Financial Reporting
(o) reviewinganddiscussingwithmanagement,theexternalauditorandtheheadofinternalaudittheeffectivenessoftheCompany’sinternalcontrolsover
financialreporting,includingreviewinganddiscussinganysignificantdeficienciesinthedesignoroperationofinternalcontrols,andanyfraud,whetherornotmaterial,thatinvolvesmanagementorotheremployeeswhohaveasignificantroleintheCompany’sinternalcontrolsoverfinancialreporting;
A-2-
(p) discussingtheCompany’sprocesswithrespecttoriskassessment(includingfraudrisk),riskmanagementandtheCompany’smajorfinancialrisksand
financialreportingexposures,allastheyrelatetointernalcontrolsoverfinancialreporting,andthestepsmanagementhastakentomonitorandcontrolsuchrisks;
(q) reviewinganddiscussingwithmanagementtheCompany’sCodeofBusinessConductandEthicsandanti-fraudprogramandtheactionstakentomonitorandenforcecompliance;
(r) establishingproceduresfor:
(i) thereceipt,retentionandtreatmentofcomplaintsregardingaccounting,internalcontrolsorauditingmatters;and
(ii) theconfidential,anonymoussubmissionbyemployeesoftheCompanyofconcernsregardingquestionableaccounting,internalcontrolsorauditingmatters;
Internal Audit
(s) reviewinganddiscussingwithmanagement,theexternalauditorandtheheadofinternalaudittheresponsibilitiesandeffectivenessoftheCompany’s
internalauditfunction,includingreviewingtheinternalauditmandate,independence,organizationalstructure,internalauditplansandadequacyofresources,receivingperiodicinternalauditreportsandmeetingprivatelywiththeheadofinternalauditonaperiodicbasis;
(t) approvinginadvancetheretentionanddismissaloftheheadofinternalaudit;
Other
(u) meetingseparately,periodically,witheachofmanagement,theheadofinternalauditandtheexternalauditor;
(v) reportingregularlytotheBoardand,whereappropriate,makingrecommendationstomanagementoftheCompanyand/ortotheBoard;
(w) liaisingwiththeRiskCommitteeoftheBoard,asappropriate,onmattersrelevanttotheCompany’smanagementofenterpriserisks;
(x) reviewingandassessingitsmandateandrecommendinganyproposedchangestotheCorporateGovernance&NominatingCommitteeoftheBoardonanannualbasis;and
(y) evaluatingthefunctioningoftheCommitteeonanannualbasis,includingwithreferencetothedischargeofitsmandate.
A-3-
ResponsibilitiesoftheCommitteeChair
4.ThefundamentalresponsibilityoftheCommitteeChairistoberesponsibleforthemanagementandeffectiveperformanceoftheCommitteeandprovideleadershiptotheCommitteeinfulfillingitsmandateandanyothermattersdelegatedtoitbytheBoard.Tothatend,theCommitteeChair’sresponsibilitiesinclude:
(a) workingwiththeExecutiveChairmanandtheSecretarytoestablishthefrequencyofCommitteemeetingsandtheagendasformeetings;
(b) providingleadershiptotheCommitteeandpresidingoverCommitteemeetings;
(c) facilitatingtheflowofinformationtoandfromtheCommitteeandfosteringanenvironmentinwhichCommitteemembersmayaskquestionsandexpresstheirviewpoints;
(d) reportingtotheBoardwithrespecttothesignificantactivitiesoftheCommitteeandanyrecommendationsoftheCommittee;
(e) liaisingwiththeChairoftheRiskCommitteeoftheBoard,asappropriate,onmattersrelevanttotheCompany’smanagementofenterpriserisks;
(f) leadingtheCommitteeinannuallyreviewingandassessingtheadequacyofitsmandateandevaluatingitseffectivenessinfulfillingitsmandate;and
(g) takingsuchotherstepsasarereasonablyrequiredtoensurethattheCommitteecarriesoutitsmandate.
Powers
5.TheCommitteeshallhavetheauthority,includingapprovaloffeesandotherretentionterms,toobtainadviceandassistancefromoutsidelegal,accountingorotheradvisorsinitssolediscretion,attheexpenseoftheCompany,whichshallprovideadequatefundingforsuchpurposes.TheCompanyshallalsoprovidetheCommitteewithadequatefundingfortheordinaryadministrativeexpensesoftheCommittee.TheCommitteeshallhaveunrestrictedaccesstoinformation,management,theexternalauditorandtheheadofinternalaudit,includingprivatemeetings,asitconsidersnecessaryorappropriatetodischargeitsdutiesandresponsibilities.TheCommitteemay,initsdiscretion,delegatealloraportionofitsdutiesandresponsibilitiestoasubcommitteeoftheCommittee.
Composition
6.TheCommitteeshallbeappointedbytheBoardannuallyandshallbecomprisedofaminimumofthreedirectors.IfanappointmentofmembersoftheCommitteeisnotmadeasprescribed,themembersshallcontinueassuchuntiltheirsuccessorsareappointed.
7.AllofthemembersoftheCommitteeshallbedirectorswhomtheBoardhasdeterminedareindependent,takingintoaccounttheapplicablerulesandregulationsofsecuritiesregulatoryauthoritiesand/orstockexchanges.
A-4-
8.EachmemberoftheCommitteeshallbe“financiallyliterate”andatleastonememberoftheCommitteeshallhave“accountingorrelatedfinancialmanagementexpertise”1.AtleastonememberoftheCommitteeshallbean“auditcommitteefinancialexpert”,asdefinedintheapplicablerulesandauthoritiesand/orstockexchanges.
9.IfaCommitteemembersimultaneouslyservesontheauditcommitteeofmorethantwootherpubliccompanies,theBoardshallmakeadeterminationastowhethersuchserviceimpairstheabilityofsuchmembertoserveeffectivelyontheCommitteeanddisclosesuchdeterminationintheCompany’sannualproxystatement.
Meetings
10.TheCommitteeshallhaveaminimumoffourmeetingsperyear,tocoincidewiththeCompany’sfinancialreportingcycle.Additionalmeetingswillbescheduledasconsiderednecessaryorappropriate,includingtoconsiderspecificmattersattherequestoftheexternalauditorortheheadofinternalaudit.
11.ThetimeandplaceofthemeetingsoftheCommittee,thecallingofmeetingsandtheprocedureatsuchmeetingsshallbedeterminedbytheChairoftheCommitteeunlessotherwisedeterminedbytheby-lawsoftheCompanyorbyresolutionoftheBoard,providedthatallmattersputforwardforapprovalbytheCommitteeshallbedeterminedbymajorityvote.1 Forpurposesofthismandate,“financiallyliterate”meanstheabilitytoreadandunderstandabalancesheet,anincomestatement,acashflowstatementandthe
relatednotesthatpresentabreadthandlevelofcomplexityofaccountingissuesthataregenerallycomparabletothebreadthandcomplexityofissuesthatcanreasonablybeexpectedtoberaisedbytheCompany’sfinancialstatements,and“accountingorrelatedfinancialmanagementexpertise”meanstheabilitytoanalyzeandinterpretafullsetoffinancialstatements,includingtherelatednotesthatpresentabreadthandlevelofcomplexityofaccountingissuesthataregenerallycomparabletothebreadthandcomplexityofissuesthatcanreasonablybeexpectedtoberaisedbytheCompany’sfinancialstatements.
A-5-

Exhibit 99.2
MANAGEMENT’S REPORT ON INTERNAL CONTROL OVER FINANCIAL REPORTING
Barrick’s management is responsible for establishing and maintaining internal control over financial reporting.
Barrick’s management assessed the effectiveness of the Company’s internal control over financial reporting as at December 31, 2017. Barrick’sManagement used the Internal Control – Integrated Framework (2013) as issued by the Committee of Sponsoring Organizations of the TreadwayCommission (COSO) to evaluate the effectiveness of Barrick’s internal control over financial reporting. Based on management’s assessment, Barrick’sinternal control over financial reporting is effective as at December 31, 2017.
The effectiveness of the Company’s internal control over financial reporting as at December 31, 2017 has been audited by PricewaterhouseCoopersLLP, Chartered Professional Accountants, as stated in their report which is located on pages 95 - 96 of Barrick’s 2017 Annual Financial Statements.BARRICK YEAR-END 2017 94
Exhibit 99.3
MANAGEMENT’S RESPONSIBILITY
Management’s Responsibility for Financial Statements
The accompanying consolidated financial statements have been prepared by and are the responsibility of the Board of Directors and Management ofthe Company.
The consolidated financial statements have been prepared in accordance with International Financial Reporting Standards as issued by theInternational Accounting Standards Board and reflect Management’s best estimates and judgments based on currently available information. TheCompany has developed and maintains a system of internal controls in order to ensure, on a reasonable and cost effective basis, the reliability of itsfinancial information.
The consolidated financial statements have been audited by PricewaterhouseCoopers LLP, Chartered Professional Accountants. Their report outlinesthe scope of their examination and opinion on the consolidated financial statements.
Catherine RawExecutive Vice Presidentand Chief Financial OfficerToronto, CanadaFebruary 14, 2018BARRICK YEAR-END 2017 93

MANAGEMENT’S REPORT ON INTERNAL CONTROL OVER FINANCIAL REPORTING
Barrick’s management is responsible for establishing and maintaining internal control over financial reporting.
Barrick’s management assessed the effectiveness of the Company’s internal control over financial reporting as at December 31, 2017. Barrick’sManagement used the Internal Control – Integrated Framework (2013) as issued by the Committee of Sponsoring Organizations of the TreadwayCommission (COSO) to evaluate the effectiveness of Barrick’s internal control over financial reporting. Based on management’s assessment, Barrick’sinternal control over financial reporting is effective as at December 31, 2017.
The effectiveness of the Company’s internal control over financial reporting as at December 31, 2017 has been audited by PricewaterhouseCoopersLLP, Chartered Professional Accountants, as stated in their report which is located on pages 95 - 96 of Barrick’s 2017 Annual Financial Statements.BARRICK YEAR-END 2017 94
ReportofIndependentRegisteredPublicAccountingFirm
TotheBoardofDirectorsandShareholdersofBarrickGoldCorporation
Opinions on the Financial Statements and Internal Control over Financial Reporting
We have audited the accompanying consolidated balance sheets of Barrick Gold Corporation and its subsidiaries, (together, the company) as ofDecember31,2017and2016,andtherelatedconsolidatedstatementsofincome,comprehensiveincome,cashflowandchangesinequityfortheyearsthenended,includingtherelatednotes(collectivelyreferredtoastheconsolidatedfinancial statements). Wealsohaveauditedthecompany’sinternalcontroloverfinancialreportingasofDecember31,2017,basedoncriteriaestablishedinInternalControl—IntegratedFramework(2013)issuedbytheCommitteeofSponsoringOrganizationsoftheTreadwayCommission(COSO).
Inouropinion,theconsolidatedfinancialstatementsreferredtoabovepresentfairly, inall material respects, theconsolidatedfinancial positionofthecompany as of December 31, 2017 and 2016, and the results of their operations and their cash flows for the years then ended in conformity withInternational Financial Reporting Standards as issued by the International Accounting Standards Board (IFRS). Also in our opinion, the companymaintained,inallmaterialrespects,effectiveinternalcontroloverfinancialreportingasofDecember31,2017,basedoncriteriaestablishedinInternalControl–IntegratedFramework(2013)issuedbytheCOSO.
BasisforOpinions
Thecompany’smanagementisresponsiblefortheseconsolidatedfinancialstatements,formaintainingeffectiveinternalcontroloverfinancialreporting,andforitsassessmentoftheeffectivenessofinternalcontroloverfinancialreporting,includedintheaccompanyingManagement’sReportonInternalControl over Financial Reporting. Ourresponsibility is toexpress opinionsonthecompany’s consolidatedfinancial statements andonthecompany’sinternalcontroloverfinancialreportingbasedonouraudits.WeareapublicaccountingfirmregisteredwiththePublicCompanyAccountingOversightBoard(UnitedStates)(PCAOB)andarerequiredtobeindependentwithrespecttothecompanyinaccordancewiththeU.S.federalsecuritieslawsandtheapplicablerulesandregulationsoftheSecuritiesandExchangeCommissionandthePCAOB.
WeconductedourauditsinaccordancewiththestandardsofthePCAOB.Thosestandardsrequirethatweplanandperformtheauditstoobtainreasonableassuranceaboutwhethertheconsolidatedfinancialstatementsarefreeofmaterialmisstatement,whetherduetoerrororfraud,andwhethereffectiveinternalcontroloverfinancialreportingwasmaintainedinallmaterialrespects.
Our audits of the consolidated financial statements included performing procedures to assess the risks of material misstatement of the consolidatedfinancialstatements,whetherduetoerrororfraud,
PricewaterhouseCoopersLLPPwCTower,18YorkStreet,Suite2600,Toronto,Ontario,CanadaM5JoB2T:+14168631133,F:+14163658215,www.pwc.com/ca “PwC” refers to PricewaterhouseCoopers LLP, an Ontario limited liability partnership.
and performing procedures that respond to those risks. Such procedures included examining, on a test basis, evidence regarding the amounts anddisclosuresintheconsolidatedfinancialstatements.Ourauditsalsoincludedevaluatingtheaccountingprinciplesusedandsignificantestimatesmadebymanagement,aswellasevaluatingtheoverallpresentationoftheconsolidatedfinancialstatements.Ourauditofinternalcontroloverfinancialreportingincluded obtaining an understanding of internal control over financial reporting, assessing the risk that a material weakness exists, and testing andevaluatingthedesignandoperatingeffectivenessofinternalcontrolbasedontheassessedrisk.Ourauditsalsoincludedperformingsuchotherproceduresasweconsiderednecessaryinthecircumstances.Webelievethatourauditsprovideareasonablebasisforouropinions.
DefinitionandLimitationsofInternalControloverFinancialReporting
Acompany’sinternalcontroloverfinancialreportingisaprocessdesignedtoprovidereasonableassuranceregardingthereliabilityoffinancialreportingandthepreparationofconsolidatedfinancialstatementsforexternalpurposesinaccordancewithgenerallyacceptedaccountingprinciples.Acompany’sinternal controloverfinancial reportingincludesthosepolicies andproceduresthat (i) pertaintothemaintenanceofrecordsthat, inreasonabledetail,accuratelyandfairlyreflectthetransactionsanddispositionsoftheassetsofthecompany;(ii)providereasonableassurancethattransactionsarerecordedasnecessarytopermitpreparationofconsolidatedfinancialstatementsinaccordancewithgenerallyacceptedaccountingprinciples,andthatreceiptsandexpenditures of the company are being made only in accordance with authorizations of management and directors of the company; and (iii) providereasonableassuranceregardingpreventionortimelydetectionofunauthorizedacquisition,use,ordispositionofthecompany’sassetsthatcouldhaveamaterialeffectontheconsolidatedfinancialstatements.
Becauseofitsinherentlimitations,internalcontroloverfinancialreportingmaynotpreventordetectmisstatements.Also,projectionsofanyevaluationof effectiveness to future periods are subject to the risk that controls may become inadequate because of changes in conditions, or that the degree ofcompliancewiththepoliciesorproceduresmaydeteriorate.
(Signed)“PricewaterhouseCoopersLLP”
CharteredProfessionalAccountants,LicensedPublicAccountants
Toronto,CanadaFebruary14,2018
Wehaveservedasthecompany’sauditorsinceatleast1982.Wehavenotdeterminedthespecificyearwebeganservingasauditorofthecompany.
2
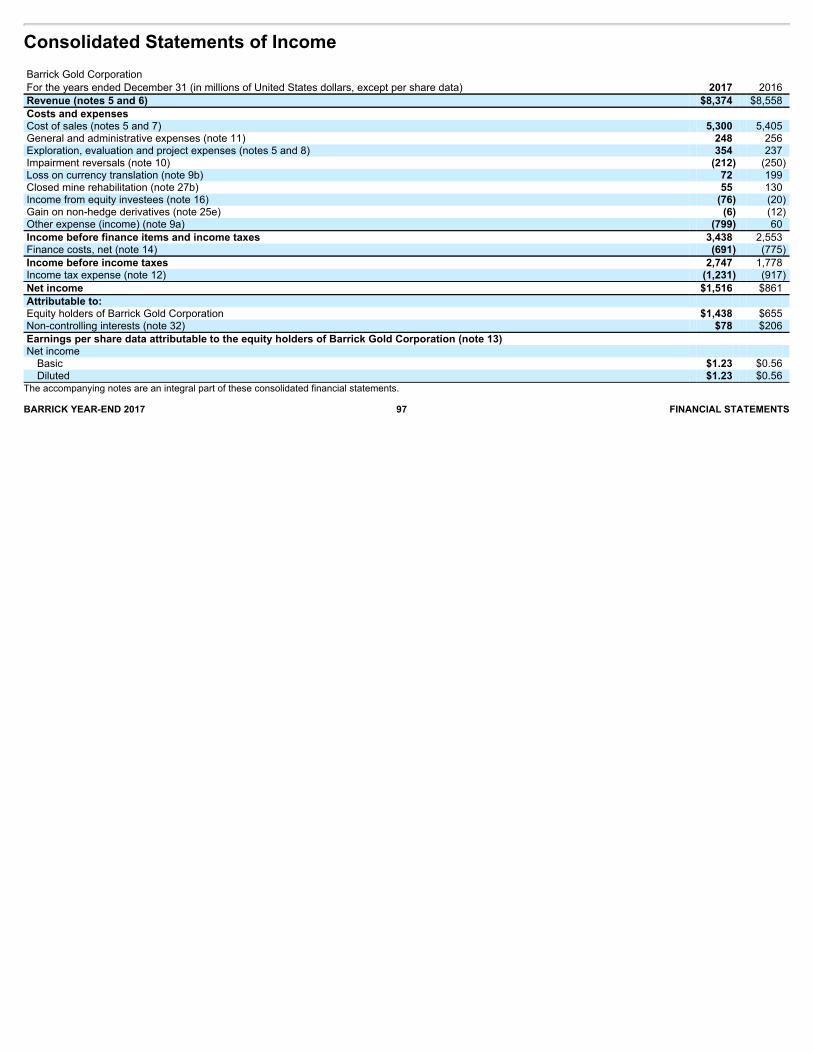
Consolidated Statements of Income Barrick Gold Corporation For the years ended December 31 (in millions of United States dollars, except per share data) 2017 2016 Revenue (notes 5 and 6) $8,374 $8,558 Costs and expenses Cost of sales (notes 5 and 7) 5,300 5,405 General and administrative expenses (note 11) 248 256 Exploration, evaluation and project expenses (notes 5 and 8) 354 237 Impairment reversals (note 10) (212) (250) Loss on currency translation (note 9b) 72 199 Closed mine rehabilitation (note 27b) 55 130 Income from equity investees (note 16) (76) (20) Gain on non-hedge derivatives (note 25e) (6) (12) Other expense (income) (note 9a) (799) 60 Income before finance items and income taxes 3,438 2,553 Finance costs, net (note 14) (691) (775) Income before income taxes 2,747 1,778 Income tax expense (note 12) (1,231) (917) Net income $1,516 $861 Attributable to: Equity holders of Barrick Gold Corporation $1,438 $655 Non-controlling interests (note 32) $78 $206 Earnings per share data attributable to the equity holders of Barrick Gold Corporation (note 13) Net income Basic $1.23 $0.56 Diluted $1.23 $0.56
The accompanying notes are an integral part of these consolidated financial statements.BARRICK YEAR-END 2017 97 FINANCIAL STATEMENTS
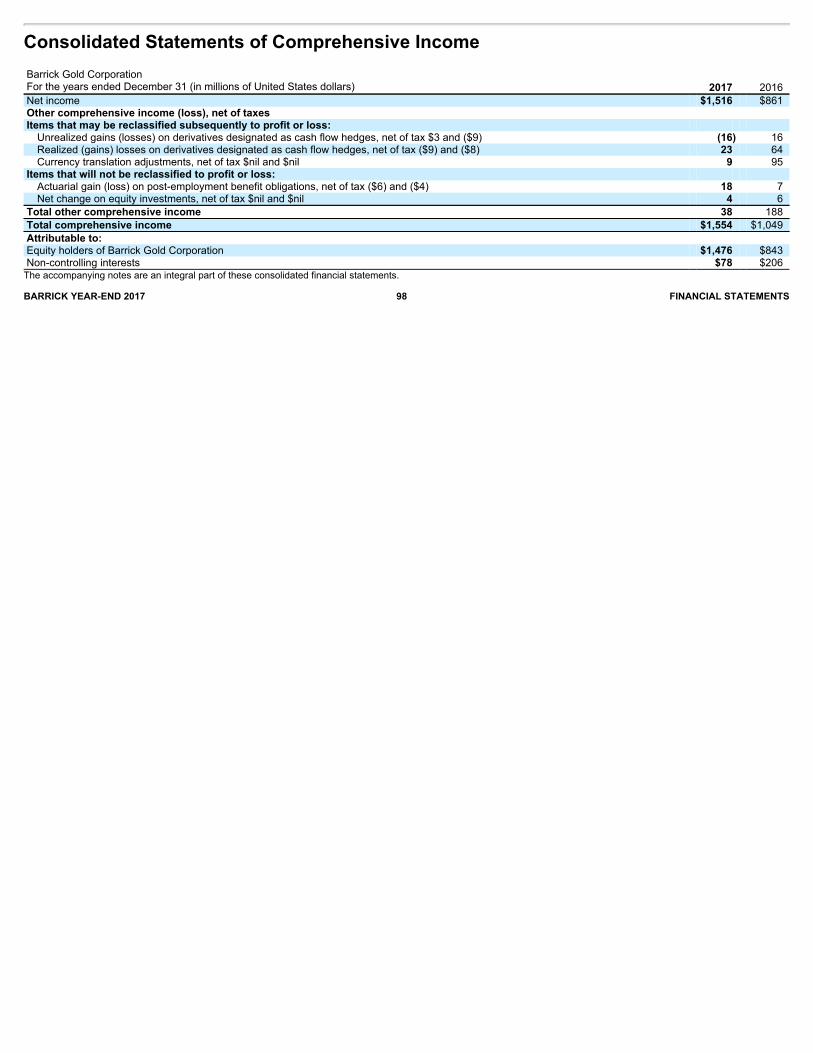
Consolidated Statements of Comprehensive Income Barrick Gold Corporation For the years ended December 31 (in millions of United States dollars) 2017 2016 Net income $1,516 $861 Other comprehensive income (loss), net of taxes Items that may be reclassified subsequently to profit or loss: Unrealized gains (losses) on derivatives designated as cash flow hedges, net of tax $3 and ($9) (16) 16 Realized (gains) losses on derivatives designated as cash flow hedges, net of tax ($9) and ($8) 23 64 Currency translation adjustments, net of tax $nil and $nil 9 95
Items that will not be reclassified to profit or loss: Actuarial gain (loss) on post-employment benefit obligations, net of tax ($6) and ($4) 18 7 Net change on equity investments, net of tax $nil and $nil 4 6
Total other comprehensive income 38 188 Total comprehensive income $1,554 $1,049 Attributable to: Equity holders of Barrick Gold Corporation $1,476 $843 Non-controlling interests $78 $206 The accompanying notes are an integral part of these consolidated financial statements.BARRICK YEAR-END 2017 98 FINANCIAL STATEMENTS

Consolidated Statements of Cash Flow Barrick Gold Corporation For the years ended December 31 (in millions of United States dollars) 2017 2016 OPERATING ACTIVITIES Net income $1,516 $861 Adjustments for the following items:
Depreciation 1,647 1,574 Finance costs (note 14) 705 788 Impairment reversals (note 10) (212) (250) Income tax expense (note 12) 1,231 917 Currency translation losses (note 9b) 72 199 Loss (gain) on sale of non-current assets/investments (note 9a) (911) 42
Change in working capital (note 15) (728) (428) Other operating activities (note 15) (181) (63) Operating cash flows before interest and income taxes 3,139 3,640 Interest paid (425) (513) Income taxes paid (649) (487) Net cash provided by operating activities 2,065 2,640 INVESTING ACTIVITIES Property, plant and equipment
Capital expenditures (note 5) (1,396) (1,126) Sales proceeds 28 135
Divestitures (note 4) 990 588 Investment purchases (7) — Net funds (invested) received from equity method investments 48 (9) Net cash provided by (used in) investing activities (337) (412) FINANCING ACTIVITIES Debt (note 25b)
Proceeds — 5 Repayments (1,533) (2,062)
Dividends (note 31) (125) (86) Funding from non-controlling interests (note 32) 13 70 Disbursements to non-controlling interests (note 32) (139) (95) Debt extinguishment costs (102) (129) Net cash used in financing activities (1,886) (2,297) Effect of exchange rate changes on cash and equivalents 3 3 Net decrease in cash and equivalents (155) (66) Cash and equivalents at beginning of year (note 25a) 2,389 2,455 Cash and equivalents at the end of year $2,234 $2,389 The accompanying notes are an integral part of these consolidated financial statements.BARRICK YEAR-END 2017 99 FINANCIAL STATEMENTS
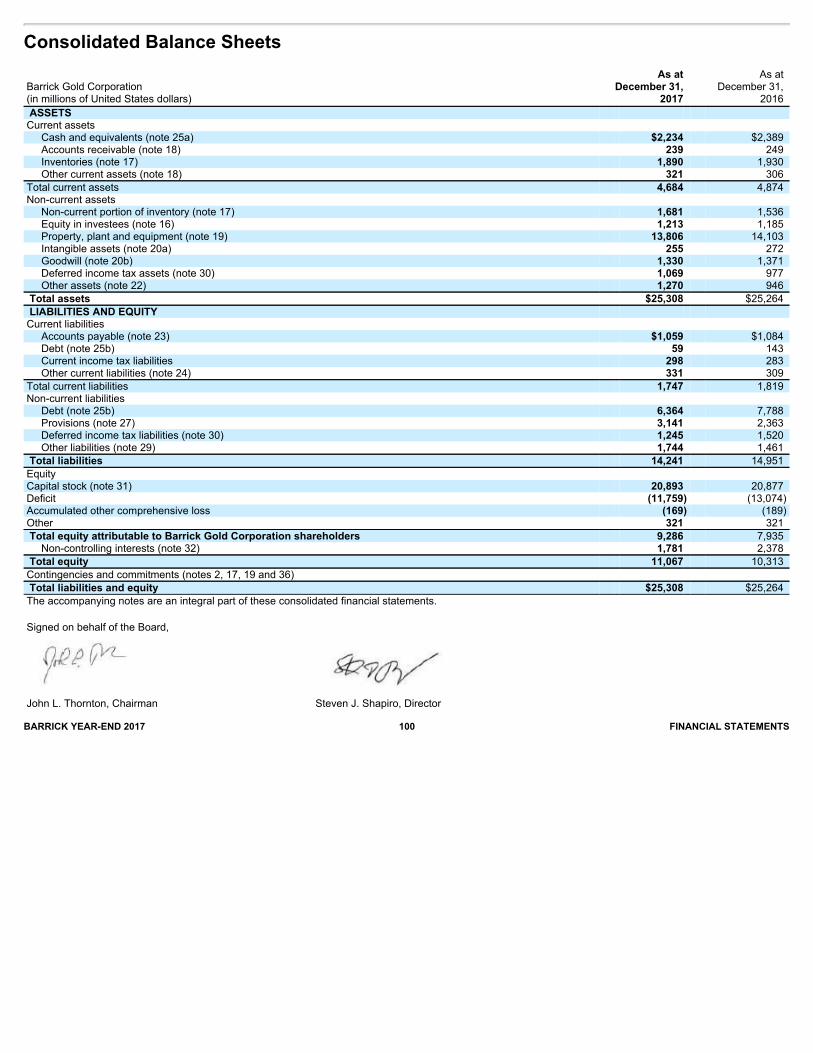
Consolidated Balance Sheets
Barrick Gold Corporation (in millions of United States dollars)
As atDecember 31,
2017
As at December 31,
2016 ASSETS Current assets Cash and equivalents (note 25a) $2,234 $2,389 Accounts receivable (note 18) 239 249 Inventories (note 17) 1,890 1,930 Other current assets (note 18) 321 306 Total current assets 4,684 4,874 Non-current assets Non-current portion of inventory (note 17) 1,681 1,536 Equity in investees (note 16) 1,213 1,185 Property, plant and equipment (note 19) 13,806 14,103 Intangible assets (note 20a) 255 272 Goodwill (note 20b) 1,330 1,371 Deferred income tax assets (note 30) 1,069 977 Other assets (note 22) 1,270 946 Total assets $25,308 $25,264 LIABILITIES AND EQUITY Current liabilities Accounts payable (note 23) $1,059 $1,084 Debt (note 25b) 59 143 Current income tax liabilities 298 283 Other current liabilities (note 24) 331 309 Total current liabilities 1,747 1,819 Non-current liabilities Debt (note 25b) 6,364 7,788 Provisions (note 27) 3,141 2,363 Deferred income tax liabilities (note 30) 1,245 1,520 Other liabilities (note 29) 1,744 1,461 Total liabilities 14,241 14,951 Equity Capital stock (note 31) 20,893 20,877 Deficit (11,759) (13,074) Accumulated other comprehensive loss (169) (189) Other 321 321 Total equity attributable to Barrick Gold Corporation shareholders 9,286 7,935 Non-controlling interests (note 32) 1,781 2,378 Total equity 11,067 10,313 Contingencies and commitments (notes 2, 17, 19 and 36) Total liabilities and equity $25,308 $25,264 The accompanying notes are an integral part of these consolidated financial statements. Signed on behalf of the Board,
John L. Thornton, Chairman
Steven J. Shapiro, Director
BARRICK YEAR-END 2017 100 FINANCIAL STATEMENTS

Consolidated Statements of Changes in Equity Barrick Gold Corporation Attributable to equity holders of the Company
(in millions of United States dollars)
CommonShares (inthousands)
Capitalstock
Retainedearnings(deficit)
Accumulatedother
comprehensiveincome (loss) 1
Other2
Total equityattributable
toshareholders
Non-controllinginterests
Totalequity
At January 1, 2017 1,165,574 $20,877 ($13,074) ($189) $321 $7,935 $2,378 $10,313 Net income — — 1,438 — — 1,438 78 1,516 Total other comprehensive income — — 18 20 — 38 — 38 Total comprehensive income — $— $1,456 $20 $— $1,476 $78 $1,554 Transactions with owners Dividends — — (125) — — (125) — (125) Dividend reinvestment plan 1,003 16 (16) — — — — — Decrease in non-controlling interest (note 4b) — — — — — — (493) (493) Funding from non-controlling interests — — — — — — 13 13 Other decrease in non-controlling interests — — — — — — (195) (195) Total transactions with owners 1,003 $16 ($141) $— $— ($125) ($675) ($800) At December 31, 2017 1,166,577 $20,893 ($11,759) ($169) $321 $9,286 $1,781 $11,067 At January 1, 2016 1,165,081 $20,869 ($13,642) ($370) $321 $7,178 $2,277 $9,455 Net Income — — 655 — — 655 206 861 Total other comprehensive income — — 7 181 — 188 — 188 Total comprehensive income — $— $662 $181 $— $843 $206 $1,049 Transactions with owners Dividends — — (86) — — (86) — (86) Dividend reinvestment plan 493 8 (8) — — — — — Funding from non-controlling interests — — — — — — 70 70 Other decrease in non-controlling interests — — — — — — (175) (175) Total transactions with owners 493 $8 ($94) $— $— ($86) ($105) ($191) At December 31, 2016 1,165,574 $20,877 ($13,074) ($189) $321 $7,935 $2,378 $10,313 1 Includes cumulative translation adjustments as at December 31, 2017: $73 million loss (2016: $82 million).2 Includes additional paid-in capital as at December 31, 2017: $283 million (December 31, 2016: $283 million) and convertible borrowings - equity component as at December 31,2017: $38 million (December 31, 2016: $38 million).
The accompanying notes are an integral part of these consolidated financial statements.BARRICK YEAR-END 2017 101 FINANCIAL STATEMENTS
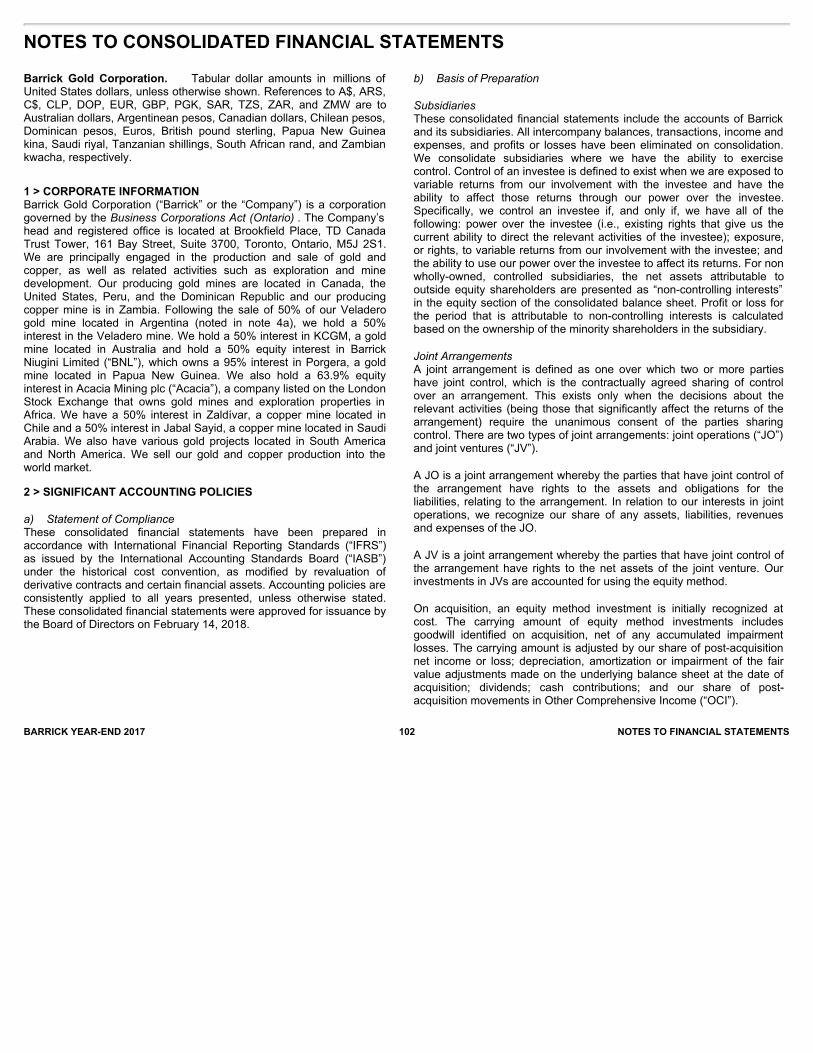
NOTES TO CONSOLIDATED FINANCIAL STATEMENTS
BARRICK YEAR-END 2017 102 NOTES TO FINANCIAL STATEMENTS
Barrick Gold Corporation. Tabular dollar amounts in millions ofUnited States dollars, unless otherwise shown. References to A$, ARS,C$, CLP, DOP, EUR, GBP, PGK, SAR, TZS, ZAR, and ZMW are toAustralian dollars, Argentinean pesos, Canadian dollars, Chilean pesos,Dominican pesos, Euros, British pound sterling, Papua New Guineakina, Saudi riyal, Tanzanian shillings, South African rand, and Zambiankwacha, respectively.
1 > CORPORATE INFORMATIONBarrick Gold Corporation (“Barrick” or the “Company”) is a corporationgoverned by the Business Corporations Act (Ontario) . The Company’shead and registered office is located at Brookfield Place, TD CanadaTrust Tower, 161 Bay Street, Suite 3700, Toronto, Ontario, M5J 2S1.We are principally engaged in the production and sale of gold andcopper, as well as related activities such as exploration and minedevelopment. Our producing gold mines are located in Canada, theUnited States, Peru, and the Dominican Republic and our producingcopper mine is in Zambia. Following the sale of 50% of our Veladerogold mine located in Argentina (noted in note 4a), we hold a 50%interest in the Veladero mine. We hold a 50% interest in KCGM, a goldmine located in Australia and hold a 50% equity interest in BarrickNiugini Limited (“BNL”), which owns a 95% interest in Porgera, a goldmine located in Papua New Guinea. We also hold a 63.9% equityinterest in Acacia Mining plc (“Acacia”), a company listed on the LondonStock Exchange that owns gold mines and exploration properties inAfrica. We have a 50% interest in Zaldívar, a copper mine located inChile and a 50% interest in Jabal Sayid, a copper mine located in SaudiArabia. We also have various gold projects located in South Americaand North America. We sell our gold and copper production into theworld market.
2 > SIGNIFICANT ACCOUNTING POLICIES
a) Statement of ComplianceThese consolidated financial statements have been prepared inaccordance with International Financial Reporting Standards (“IFRS”)as issued by the International Accounting Standards Board (“IASB”)under the historical cost convention, as modified by revaluation ofderivative contracts and certain financial assets. Accounting policies areconsistently applied to all years presented, unless otherwise stated.These consolidated financial statements were approved for issuance bythe Board of Directors on February 14, 2018.
b) Basis of Preparation
SubsidiariesThese consolidated financial statements include the accounts of Barrickand its subsidiaries. All intercompany balances, transactions, income andexpenses, and profits or losses have been eliminated on consolidation.We consolidate subsidiaries where we have the ability to exercisecontrol. Control of an investee is defined to exist when we are exposed tovariable returns from our involvement with the investee and have theability to affect those returns through our power over the investee.Specifically, we control an investee if, and only if, we have all of thefollowing: power over the investee (i.e., existing rights that give us thecurrent ability to direct the relevant activities of the investee); exposure,or rights, to variable returns from our involvement with the investee; andthe ability to use our power over the investee to affect its returns. For nonwholly-owned, controlled subsidiaries, the net assets attributable tooutside equity shareholders are presented as “non-controlling interests”in the equity section of the consolidated balance sheet. Profit or loss forthe period that is attributable to non-controlling interests is calculatedbased on the ownership of the minority shareholders in the subsidiary.
Joint ArrangementsA joint arrangement is defined as one over which two or more partieshave joint control, which is the contractually agreed sharing of controlover an arrangement. This exists only when the decisions about therelevant activities (being those that significantly affect the returns of thearrangement) require the unanimous consent of the parties sharingcontrol. There are two types of joint arrangements: joint operations (“JO”)and joint ventures (“JV”).
A JO is a joint arrangement whereby the parties that have joint control ofthe arrangement have rights to the assets and obligations for theliabilities, relating to the arrangement. In relation to our interests in jointoperations, we recognize our share of any assets, liabilities, revenuesand expenses of the JO.
A JV is a joint arrangement whereby the parties that have joint control ofthe arrangement have rights to the net assets of the joint venture. Ourinvestments in JVs are accounted for using the equity method.
On acquisition, an equity method investment is initially recognized atcost. The carrying amount of equity method investments includesgoodwill identified on acquisition, net of any accumulated impairmentlosses. The carrying amount is adjusted by our share of post-acquisitionnet income or loss; depreciation, amortization or impairment of the fairvalue adjustments made on the underlying balance sheet at the date ofacquisition; dividends; cash contributions; and our share of post-acquisition movements in Other Comprehensive Income (“OCI”).
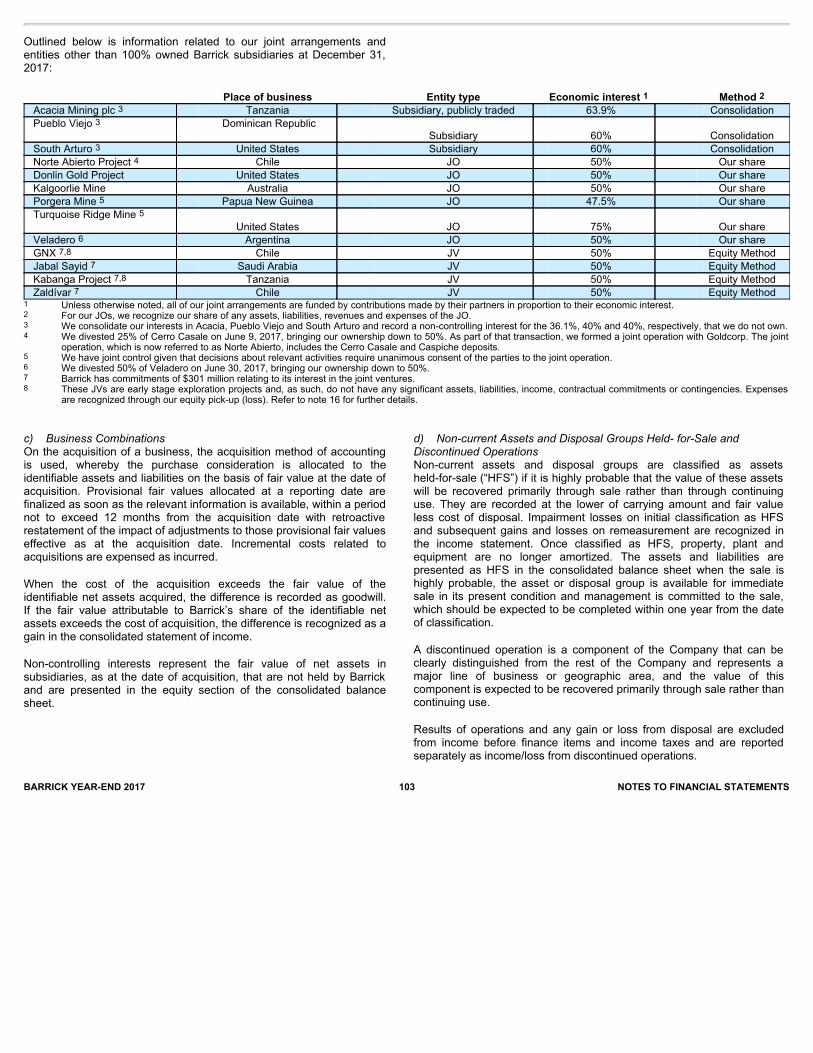
Place of business Entity type Economic interest 1 Method 2 Acacia Mining plc 3 Tanzania Subsidiary, publicly traded 63.9% Consolidation Pueblo Viejo 3
Dominican Republic
Subsidiary 60% Consolidation South Arturo 3 United States Subsidiary 60% Consolidation Norte Abierto Project 4 Chile JO 50% Our share Donlin Gold Project United States JO 50% Our share Kalgoorlie Mine Australia JO 50% Our share Porgera Mine 5 Papua New Guinea JO 47.5% Our share Turquoise Ridge Mine 5 United States JO 75% Our share
Veladero 6 Argentina JO 50% Our share GNX 7,8 Chile JV 50% Equity Method Jabal Sayid 7 Saudi Arabia JV 50% Equity Method Kabanga Project 7,8 Tanzania JV 50% Equity Method Zaldívar 7 Chile JV 50% Equity Method
1 Unless otherwise noted, all of our joint arrangements are funded by contributions made by their partners in proportion to their economic interest.2 For our JOs, we recognize our share of any assets, liabilities, revenues and expenses of the JO.3 We consolidate our interests in Acacia, Pueblo Viejo and South Arturo and record a non-controlling interest for the 36.1%, 40% and 40%, respectively, that we do not own.4 We divested 25% of Cerro Casale on June 9, 2017, bringing our ownership down to 50%. As part of that transaction, we formed a joint operation with Goldcorp. The joint
operation, which is now referred to as Norte Abierto, includes the Cerro Casale and Caspiche deposits.5 We have joint control given that decisions about relevant activities require unanimous consent of the parties to the joint operation.6 We divested 50% of Veladero on June 30, 2017, bringing our ownership down to 50%.7 Barrick has commitments of $301 million relating to its interest in the joint ventures.8 These JVs are early stage exploration projects and, as such, do not have any significant assets, liabilities, income, contractual commitments or contingencies. Expenses
are recognized through our equity pick-up (loss). Refer to note 16 for further details.
BARRICK YEAR-END 2017 103 NOTES TO FINANCIAL STATEMENTS
Outlined below is information related to our joint arrangements andentities other than 100% owned Barrick subsidiaries at December 31,2017:
c) Business CombinationsOn the acquisition of a business, the acquisition method of accountingis used, whereby the purchase consideration is allocated to theidentifiable assets and liabilities on the basis of fair value at the date ofacquisition. Provisional fair values allocated at a reporting date arefinalized as soon as the relevant information is available, within a periodnot to exceed 12 months from the acquisition date with retroactiverestatement of the impact of adjustments to those provisional fair valueseffective as at the acquisition date. Incremental costs related toacquisitions are expensed as incurred.
When the cost of the acquisition exceeds the fair value of theidentifiable net assets acquired, the difference is recorded as goodwill.If the fair value attributable to Barrick’s share of the identifiable netassets exceeds the cost of acquisition, the difference is recognized as again in the consolidated statement of income.
Non-controlling interests represent the fair value of net assets insubsidiaries, as at the date of acquisition, that are not held by Barrickand are presented in the equity section of the consolidated balancesheet.
d) Non-current Assets and Disposal Groups Held- for-Sale andDiscontinued OperationsNon-current assets and disposal groups are classified as assetsheld-for-sale (“HFS”) if it is highly probable that the value of these assetswill be recovered primarily through sale rather than through continuinguse. They are recorded at the lower of carrying amount and fair valueless cost of disposal. Impairment losses on initial classification as HFSand subsequent gains and losses on remeasurement are recognized inthe income statement. Once classified as HFS, property, plant andequipment are no longer amortized. The assets and liabilities arepresented as HFS in the consolidated balance sheet when the sale ishighly probable, the asset or disposal group is available for immediatesale in its present condition and management is committed to the sale,which should be expected to be completed within one year from the dateof classification.
A discontinued operation is a component of the Company that can beclearly distinguished from the rest of the Company and represents amajor line of business or geographic area, and the value of thiscomponent is expected to be recovered primarily through sale rather thancontinuing use.
Results of operations and any gain or loss from disposal are excludedfrom income before finance items and income taxes and are reportedseparately as income/loss from discontinued operations.
BARRICK YEAR-END 2017 104 NOTES TO FINANCIAL STATEMENTS
e) Foreign Currency TranslationThe functional currency of the Company, for each subsidiary of theCompany, and for joint arrangements and associates, is the currency ofthe primary economic environment in which it operates. The functionalcurrency of all of our operations is the US dollar. We translate non-USdollar balances for these operations into US dollars as follows:
· Property, plant and equipment (“PP&E”), intangible assets and
equity method investments using the rates at the time ofacquisition;
· Fair value through other comprehensive income (“FVOCI”)equity investments using the closing exchange rate as at thebalance sheet date with translation gains and lossespermanently recorded in Other Comprehensive Income(“OCI”);
· Deferred tax assets and liabilities using the closing exchange
rate as at the balance sheet date with translation gains andlosses recorded in income tax expense;
· Other assets and liabilities using the closing exchange rate as
at the balance sheet date with translation gains and lossesrecorded in other income/expense; and
· Income and expenses using the average exchange rate for theperiod, except for expenses that relate to non-monetary assetsand liabilities measured at historical rates, which are translatedusing the same historical rate as the associated non-monetaryassets and liabilities.
f) Revenue RecognitionWe record revenue when evidence exists that all of the following criteriaare met: · The significant risks and rewards of ownership of the product
have been transferred to the buyer;
· Neither continuing managerial involvement to the degree
usually associated with ownership, nor effective control overthe goods sold, has been retained;
· The amount of revenue can be reliably measured; · It is probable that the economic benefits associated with the
sale will flow to us; and
· The costs incurred or to be incurred in respect of the sale canbe reliably measured.
These conditions are generally satisfied when title passes to thecustomer.
Gold Bullion SalesGold bullion is sold primarily in the London spot market. The sales priceis fixed on the date of sale based on the gold spot price. Generally, werecord revenue from gold bullion sales at the time of physical delivery,which is also the date that title to the gold passes.
Concentrate SalesUnder the terms of concentrate sales contracts with independent smeltingcompanies, gold and copper sales prices are provisionally set on aspecified future date after shipment based on market prices. We recordrevenues under these contracts at the time of shipment, which is alsowhen the risk and rewards of ownership pass to the smelting companies,using forward market gold and copper prices on the expected date thatfinal sales prices will be determined. Variations between the pricerecorded at the shipment date and the actual final price set under thesmelting contracts are caused by changes in market gold and copperprices, which result in the existence of an embedded derivative inaccounts receivable. The embedded derivative is recorded at fair valueeach period until final settlement occurs, with changes in fair valueclassified as provisional price adjustments and included in revenue in theconsolidated statement of income.
g) Exploration and Evaluation (“E&E”)Exploration expenditures are the costs incurred in the initial search formineral deposits with economic potential or in the process of obtainingmore information about existing mineral deposits. Explorationexpenditures typically include costs associated with prospecting,sampling, mapping, diamond drilling and other work involved in searchingfor ore.
Evaluation expenditures are the costs incurred to establish the technicaland commercial viability of developing mineral deposits identified throughexploration activities or by acquisition. Evaluation expenditures include thecost of (i) establishing the volume and grade of deposits through drilling ofcore samples, trenching and sampling activities in an ore body that isclassified as either a mineral resource or a proven and probable reserve;(ii) determining the optimal methods of extraction and metallurgical andtreatment processes; (iii) studies related to surveying, transportation andinfrastructure requirements; (iv) permitting activities; and (v) economicevaluations to determine whether development of the mineralized materialis commercially justified, including scoping, prefeasibility and finalfeasibility studies.
Exploration and evaluation expenditures are expensed as incurred unlessmanagement determines that probable future economic benefits will begenerated as a result of the expenditures. Once the technical feasibilityand commercial viability of a program or project has been demonstratedwith a prefeasibility study, and we have recognized reserves inaccordance with the Canadian Securities Administrators’ NationalInstrument 43-101, we account for future expenditures incurred in thedevelopment of that program or project in accordance with our policy forProperty, Plant and Equipment, as described in note 2n.
BARRICK YEAR-END 2017 105 NOTES TO FINANCIAL STATEMENTS
h) Production StageA mine that is under construction is determined to enter the productionstage when the project is in the location and condition necessary for it tobe capable of operating in the manner intended by management. Weuse the following factors to assess whether these criteria have beenmet: (1) the level of capital expenditures compared to construction costestimates; (2) the completion of a reasonable period of testing of mineplant and equipment; (3) the ability to produce minerals in saleable form(within specifications); and (4) the ability to sustain ongoing production ofminerals.
When a mine construction project moves into the production stage, thecapitalization of certain mine construction costs ceases and costs areeither capitalized to inventory or expensed, except for capitalizable costsrelated to property, plant and equipment additions or improvements,open pit stripping activities that provide a future benefit, undergroundmine development or expenditures that meet the criteria for capitalizationin accordance with IAS 16 Property, Plant and Equipment.
i) Earnings per ShareEarnings per share as computed by dividing net income available tocommon shareholders by the weighted average number of commonshares outstanding for the period. Diluted earnings per share reflects thepotential dilution that could occur if additional common shares areassumed to be issued under securities that entitle their holders to obtaincommon shares in the future. For stock options, the number of additionalshares for inclusion in diluted earnings per share calculations isdetermined using the treasury stock method. Under this method, stockoptions that have an exercise price less than the average market price ofour common shares are assumed to be exercised and the proceeds areused to repurchase common shares at the average market price for theperiod. The incremental number of common shares issued under stockoptions and repurchased from proceeds is included in the calculation ofdiluted earnings per share.
j) TaxationCurrent tax for each taxable entity is based on the local taxable incomeat the local statutory tax rate enacted or substantively enacted at thebalance sheet date and includes adjustments to tax payable orrecoverable in respect of previous periods.
Deferred tax is recognized using the balance sheet method in respect ofall temporary differences between the tax bases of assets and liabilities,and their carrying amounts for financial reporting purposes, except asindicated below.
Deferred income tax liabilities are recognized for all taxable temporarydifferences, except:
· Where the deferred income tax liability arises from the initialrecognition of goodwill, or the initial recognition of an asset orliability in an acquisition that is not a business combination and,at the time of the acquisition, affects neither the accountingprofit nor taxable profit or loss; and
· In respect of taxable temporary differences associated withinvestments in subsidiaries and interests in joint arrangements,where the timing of the reversal of the temporary differencescan be controlled and it is probable that the temporarydifferences will not reverse in the foreseeable future.
Deferred income tax assets are recognized for all deductible temporarydifferences and the carry forward of unused tax assets and unused taxlosses, to the extent that it is probable that taxable profit will be availableagainst which the deductible temporary differences and the carry forwardof unused tax assets and unused tax losses can be utilized, except:
· Where the deferred income tax asset relating to the deductibletemporary difference arises from the initial recognition of anasset or liability in an acquisition that is not a businesscombination and, at the time of the acquisition, affects neitherthe accounting profit nor taxable profit or loss; and
· In respect of deductible temporary differences associated withinvestments in subsidiaries and interests in joint arrangements,deferred tax assets are recognized only to the extent that it isprobable that the temporary differences will reverse in theforeseeable future and taxable profit will be available againstwhich the temporary differences can be utilized.
The carrying amount of deferred income tax assets is reviewed at eachbalance sheet date and reduced to the extent that it is no longer probablethat sufficient taxable profit will be available to allow all or part of thedeferred income tax asset to be utilized. To the extent that an asset notpreviously recognized fulfills the criteria for recognition, a deferred incometax asset is recorded.
Deferred tax is measured on an undiscounted basis at the tax rates thatare expected to apply in the periods in which the asset is realized or theliability is settled, based on tax rates and tax laws enacted or substantivelyenacted at the balance sheet date.
Current and deferred tax relating to items recognized directly in equity arerecognized in equity and not in the income statement.
BARRICK YEAR-END 2017 106 NOTES TO FINANCIAL STATEMENTS
Royalties and Special Mining TaxesIncome tax expense includes the cost of royalties and special miningtaxes payable to governments that are calculated based on apercentage of taxable profit whereby taxable profit represents netincome adjusted for certain items defined in the applicable legislation.
Indirect TaxesIndirect tax recoverable is recorded at its undiscounted amount, and isdisclosed as non-current if not expected to be recovered within twelvemonths.
k) Other InvestmentsInvestments in publicly quoted equity securities that are neithersubsidiaries nor associates are categorized as fair value through othercomprehensive income (“FVOCI”) pursuant to the irrevocable electionavailable in IFRS 9 for these instruments. FVOCI equity investments(referred to as “other investments”) are recorded at fair value with allrealized and unrealized gains and losses recorded permanently in OCI.
l) InventoryMaterial extracted from our mines is classified as either ore or waste.Ore represents material that, at the time of extraction, we expect toprocess into a saleable form and sell at a profit. Raw materials arecomprised of both ore in stockpiles and ore on leach pads as processingis required to extract benefit from the ore. Ore is accumulated instockpiles that are subsequently processed into gold/copper in asaleable form. The recovery of gold and copper from certain oxide oresis achieved through the heap leaching process. Work in processrepresents gold/copper in the processing circuit that has not completedthe production process, and is not yet in a saleable form. Finished goodsinventory represents gold/copper in saleable form.
Metal inventories are valued at the lower of cost and net realizablevalue. Cost is determined on a weighted average basis and includes allcosts incurred, based on a normal production capacity, in bringing eachproduct to its present location and condition. Cost of inventoriescomprises direct labor, materials and contractor expenses, includingnon-capitalized stripping costs; depreciation on PP&E includingcapitalized stripping costs; and an allocation of general andadministrative costs. As ore is removed for processing, costs areremoved based on the average cost per ounce/pound in the stockpile.Net realizable value is determined with reference to relevant marketprices less applicable variable selling expenses.
Mine operating supplies represent commodity consumables and otherraw materials used in the production process, as well as spare parts andother maintenance supplies that are not classified as capital items.Provisions are recorded to reduce mine operating
supplies to net realizable value, which is generally calculated by referenceto its salvage or scrap value, when it is determined that the supplies areobsolete. Provisions are reversed to reflect subsequent recoveries in netrealizable value where the inventory is still on hand.
m) RoyaltiesCertain of our properties are subject to royalty arrangements based onmineral production at the properties. The primary type of royalty is a netsmelter return (NSR) royalty. Under this type of royalty we pay the holderan amount calculated as the royalty percentage multiplied by the value ofgold production at market gold prices less third-party smelting, refiningand transportation costs. Royalty expense is recorded on completion ofthe production or sales process in cost of sales. Other types of royaltiesinclude: · Net profits interest (NPI) royalty to other than a government, · Modified net smelter return (NSR) royalty, · Net smelter return sliding scale (NSRSS) royalty, · Gross proceeds sliding scale (GPSS) royalty, · Gross smelter return (GSR) royalty, · Net value (NV) royalty, · Land tenement (LT) royalty, and a · Gold revenue royalty.
n) Property, Plant and Equipment
Estimated useful lives of Major Asset Categories
Buildings, plant and equipment 7 – 27 years Underground mobile equipment 5 - 7 years Light vehicles and other mobile equipment 2 - 3 years Furniture, computer and office equipment 2 - 3 years
Buildings, Plant and EquipmentAt acquisition, we record buildings, plant and equipment at cost, includingall expenditures incurred to prepare an asset for its intended use. Theseexpenditures consist of: the purchase price; brokers’ commissions; andinstallation costs including architectural, design and engineering fees,legal fees, survey costs, site preparation costs, freight charges,transportation insurance costs, duties, testing and preparation charges.
We capitalize costs that meet the asset recognition criteria. Costs incurredthat do not extend the productive capacity or useful economic life of anasset are considered repairs and maintenance expense and areaccounted for as a cost of the inventory produced in the period.
Buildings, plant and equipment are depreciated on a straight-line basisover their expected useful life, which commences when the assets areconsidered available for use. Once buildings, plant and equipment areconsidered available for use they are measured at cost less
BARRICK YEAR-END 2017 107 NOTES TO FINANCIAL STATEMENTS
accumulated depreciation and applicable impairment losses.
Depreciation on equipment utilized in the development of assets,including open pit and underground mine development, is recapitalizedas development costs attributable to the related asset.
Mineral PropertiesMineral properties consist of: the fair value attributable to mineralreserves and resources acquired in a business combination or assetacquisition; underground mine development costs; open pit minedevelopment costs; capitalized exploration and evaluation costs; andcapitalized interest. In addition, we incur project costs which aregenerally capitalized when the expenditures result in a future benefit.
i) Acquired Mining PropertiesOn acquisition of a mining property, we prepare an estimate of the fairvalue attributable to the proven and probable mineral reserves, mineralresources and exploration potential attributable to the property. Theestimated fair value attributable to the mineral reserves and the portionof mineral resources considered to be probable of economic extractionat the time of the acquisition is depreciated on a units of production(“UOP”) basis whereby the denominator is the proven and probablereserves and the portion of mineral resources considered to be probableof economic extraction. The estimated fair value attributable to mineralresources that are not considered to be probable of economic extractionat the time of the acquisition is not subject to depreciation until theresources become probable of economic extraction in the future. Theestimated fair value attributable to exploration licenses is recorded as anintangible asset and is not subject to depreciation until the propertyenters production.
ii) Underground Mine Development CostsAt our underground mines, we incur development costs to build newshafts, drifts and ramps that will enable us to physically access oreunderground. The time over which we will continue to incur these costsdepends on the mine life. These underground development costs arecapitalized as incurred.
Capitalized underground development costs are depreciated on a UOPbasis, whereby the denominator is the estimated ounces/pounds ofgold/copper in proven and probable reserves and the portion ofresources considered probable of economic extraction based on thecurrent life of mine (“LOM”) plan that benefit from the development andare considered probable of economic extraction.
iii) Open Pit Mine Development CostsIn open pit mining operations, it is necessary to remove overburden andother waste materials to access ore from
which minerals can be extracted economically. The process of miningoverburden and waste materials is referred to as stripping. Stripping costsincurred in order to provide initial access to the ore body (referred to aspre-production stripping) are capitalized as open pit mine developmentcosts.
Pre-production stripping costs are capitalized until an “other than deminimis” level of mineral is extracted, after which time such costs areeither capitalized to inventory or, if it qualifies as an open pit strippingactivity that provides a future benefit, to PP&E. We consider variousrelevant criteria to assess when an “other than de minimis” level of mineralis produced. Some of the criteria considered would include, but are notlimited to, the following: (1) the amount of minerals mined versus totalounces in LOM ore; (2) the amount of ore tons mined versus total LOMexpected ore tons mined; (3) the current stripping ratio versus the LOMstrip ratio; and (4) the ore grade versus the LOM grade.
Stripping costs incurred during the production stage of a pit are accountedfor as costs of the inventory produced during the period that the strippingcosts are incurred, unless these costs are expected to provide a futureeconomic benefit to an identifiable component of the ore body.Components of the ore body are based on the distinct developmentphases identified by the mine planning engineers when determining theoptimal development plan for the open pit. Production phase strippingcosts generate a future economic benefit when the related strippingactivity: (1) improves access to a component of the ore body to be minedin the future; (2) increases the fair value of the mine (or pit) as access tofuture mineral reserves becomes less costly; and (3) increases theproductive capacity or extends the productive life of the mine (or pit).Production phase stripping costs that are expected to generate a futureeconomic benefit are capitalized as open pit mine development costs.
Capitalized open pit mine development costs are depreciated on a UOPbasis whereby the denominator is the estimated ounces/pounds ofgold/copper in proven and probable reserves and the portion of resourcesconsidered probable of economic extraction based on the current LOMplan that benefit from the development and are considered probable ofeconomic extraction.
Construction-in-ProgressAssets under construction are capitalized as construction-in-progress untilthe asset is available for use. The cost ofconstruction-in-progress comprises its purchase price and any costsdirectly attributable to bringing it into working condition for its intendeduse. Construction-in-progress amounts related to development projectsare included in the carrying amount of the development project.Construction-in-progress amounts incurred at operating mines arepresented as a separate asset within PP&E.

BARRICK YEAR-END 2017 108 NOTES TO FINANCIAL STATEMENTS
Construction-in-progress also includes deposits on long lead items.Construction-in-progress is not depreciated. Depreciation commencesonce the asset is complete and available for use.
Leasing ArrangementsThe determination of whether an arrangement is, or contains, a lease isbased on the substance of the arrangement at inception date, includingwhether the fulfillment of the arrangement is dependent on the use of aspecific asset or assets or whether the arrangement conveys a right touse the asset.
Leasing arrangements that transfer substantially all the risks andrewards of ownership of the asset to Barrick are classified as financeleases. Assets acquired via a finance lease are recorded as an assetwith a corresponding liability at an amount equal to the lower of the fairvalue of the leased property and the present value of the minimum leasepayments. Each lease payment is allocated between the liability andfinance costs using the effective interest method, whereby a constantrate of interest expense is recognized on the balance of the liabilityoutstanding. The interest element of the lease is charged to theconsolidated statement of income as a finance cost.
PP&E assets acquired under finance leases are depreciated over theshorter of the useful life of the asset and the lease term.
All other leases are classified as operating leases. Operating leasepayments are recognized as an operating cost in the consolidatedstatements of income on a straight-line basis over the lease term.
Capitalized InterestWe capitalize interest costs for qualifying assets. Qualifying assets areassets that require a significant amount of time to prepare for theirintended use, including projects that are in the exploration andevaluation, development or construction stages. Qualifying assets alsoinclude significant expansion projects at our operating mines. Capitalizedinterest costs are considered an element of the cost of the qualifyingasset which is determined based on gross expenditures incurred on anasset. Capitalization ceases when the asset is substantially complete orif active development is suspended or ceases. Where the funds used tofinance a qualifying asset form part of general borrowings, the amountcapitalized is calculated using a weighted average of rates applicable tothe relevant borrowings during the period. Where funds borrowed aredirectly attributable to a qualifying asset, the amount capitalizedrepresents the borrowing costs specific to those borrowings. Wheresurplus funds available out of money borrowed specifically to finance aproject are temporarily invested, the total capitalized interest is reducedby
income generated from short-term investments of such funds.
InsuranceWe record losses relating to insurable events as they occur. Proceedsreceivable from insurance coverage are recorded at such time as receiptis receivable or virtually certain and the amount receivable is fixed ordeterminable. For business interruption insurance the amount recoverableis only recognized when receipt is virtually certain, as supported bynotification of a minimum or proposed settlement amount from theinsurance adjuster.
o) Impairment (and Reversals of Impairment) of Non-Current AssetsWe review and test the carrying amounts of PP&E and intangible assetswith finite lives when an indicator of impairment is considered to exist.Impairment assessments on PP&E and intangible assets are conducted atthe level of the cash generating unit (“CGU”), which is the lowest level forwhich identifiable cash flows are largely independent of the cash flows ofother assets and includes most liabilities specific to the CGU. Foroperating mines and projects, the individual mine/project represents aCGU for impairment testing.
The recoverable amount of a CGU is the higher of Value in Use (“VIU”)and Fair Value Less Costs of Disposal (“FVLCD”). We have determinedthat the FVLCD is greater than the VIU amounts and therefore used asthe recoverable amount for impairment testing purposes. An impairmentloss is recognized for any excess of the carrying amount of a CGU over itsrecoverable amount where both the recoverable amount and carryingvalue include the associated other assets and liabilities, including taxeswhere applicable, of the CGU. Where it is not appropriate to allocate theloss to a separate asset, an impairment loss related to a CGU is allocatedto the carrying amount of the assets of the CGU on a pro rata basis basedon the carrying amount of its non-monetary assets.
Impairment ReversalAn assessment is made at each reporting date to determine whether thereis an indication that previously recognized impairment losses may nolonger exist or may have decreased. A previously recognized impairmentloss is reversed only if there has been a change in the assumptions usedto determine the CGU’s recoverable amount since the last impairmentloss was recognized. This reversal is recognized in the consolidatedstatements of income and is limited to the carrying value that would havebeen determined, net of any depreciation where applicable, had noimpairment charge been recognized in prior years. When an impairmentreversal is undertaken, the recoverable amount is assessed by referenceto the higher of VIU and FVLCD. We have determined that the FVLCD isgreater than the VIU
BARRICK YEAR-END 2017 109 NOTES TO FINANCIAL STATEMENTS
amounts and therefore used as recoverable amount for impairmenttesting purposes.
p) Intangible AssetsIntangible assets acquired by way of an asset acquisition or businesscombination are recognized if the asset is separable or arises fromcontractual or legal rights and the fair value can be measured reliably oninitial recognition.
On acquisition of a mineral property in the exploration stage, we preparean estimate of the fair value attributable to the exploration licensesacquired, including the fair value attributable to mineral resources, if any,of that property. The fair value of the exploration license is recorded asan intangible asset (acquired exploration potential) as at the date ofacquisition. When an exploration stage property moves intodevelopment, the acquired exploration potential attributable to thatproperty is transferred to mining interests within PP&E.
We also have water rights associated with our mineral properties. Uponacquisition, they are measured at initial cost and are depreciated whenthey are being used. They are also subject to impairment testing whenan indicator of impairment is considered to exist.
q) GoodwillUnder the acquisition method of accounting, the costs of businesscombinations are allocated to the assets acquired and liabilitiesassumed based on the estimated fair value at the date of acquisition.The excess of the fair value of consideration paid over the fair value ofthe identifiable net assets acquired is recorded as goodwill. Goodwill isnot amortized; instead it is tested for impairment in the fourth quarterand also when there is an indicator of impairment. At the date ofacquisition, goodwill is assigned to the CGU or group of CGUs that isexpected to benefit from the synergies of the business combination. Forthe purposes of impairment testing, goodwill is allocated to theCompany’s operating segments, which are our individual mine sites andcorresponds to the level at which goodwill is internally monitored by theChief Operating Decision Maker (“CODM”), the President.
The recoverable amount of an operating segment is the higher of VIUand FVLCD. A goodwill impairment is recognized for any excess of thecarrying amount of the operating segment over its recoverable amount.Goodwill impairment charges are not reversible.
r) DebtDebt is recognized initially at fair value, net of financing costs incurred,and subsequently measured at amortized cost. Any difference betweenthe amounts originally received and the redemption value of the debt isrecognized in the consolidated statements of income over the period tomaturity using the effective interest method.
s) Derivative Instruments and Hedge Accounting
Derivative InstrumentsDerivative instruments are recorded at fair value on the consolidatedbalance sheet, classified based on contractual maturity. Derivativeinstruments are classified as either hedges of the fair value of recognizedassets or liabilities or of firm commitments (“fair value hedges”), hedges ofhighly probable forecasted transactions (“cash flow hedges”) ornon-hedge derivatives. Derivatives designated as either a fair value orcash flow hedge that are expected to be highly effective in achievingoffsetting changes in fair value or cash flows are assessed on an ongoingbasis to determine that they actually have been highly effective throughoutthe financial reporting periods for which they were designated. Derivativeassets and derivative liabilities are shown separately in the balance sheetunless there is a legal right to offset and intent to settle on a net basis.
Fair Value HedgesChanges in the fair value of derivatives that are designated and qualify asfair value hedges are recorded in the consolidated statements of income,together with any changes in the fair value of the hedged asset or liabilityor firm commitment that is attributable to the hedged risk.
Cash Flow HedgesThe effective portion of changes in the fair value of derivatives that aredesignated and qualify as cash flow hedges is recognized in equity. Thegain or loss relating to the ineffective portion is recognized in theconsolidated statements of income. Amounts accumulated in equity aretransferred to the consolidated statements of income in the period whenthe forecasted transaction impacts earnings. When the forecastedtransaction that is hedged results in the recognition of a non-financialasset or a non-financial liability, the gains and losses previously deferredin equity are transferred from equity and included in the measurement ofthe initial carrying amount of the asset or liability.
When a derivative designated as a cash flow hedge expires or is sold andthe forecasted transaction is still expected to occur, any cumulative gainor loss relating to the derivative that is recorded in equity at that timeremains in equity and is recognized in the consolidated statements ofincome when the forecasted transaction occurs. When a forecastedtransaction is no longer expected to occur, the cumulative gain or loss thatwas recorded in equity is immediately transferred to the consolidatedstatements of income.
Non-Hedge DerivativesDerivative instruments that do not qualify as either fair value or cash flowhedges are recorded at their fair value
BARRICK YEAR-END 2017 110 NOTES TO FINANCIAL STATEMENTS
at the balance sheet date, with changes in fair value recognized in theconsolidated statements of income.
t) Embedded DerivativesDerivatives embedded in other financial instruments or executorycontracts are accounted for as separate derivatives when their risks andcharacteristics are not closely related to their host financial instrument orcontract. In some cases, the embedded derivatives may be designatedas hedges and are accounted for as described above.
u) Environmental Rehabilitation ProvisionMining, extraction and processing activities normally give rise toobligations for environmental rehabilitation. Rehabilitation work caninclude facility decommissioning and dismantling; removal or treatmentof waste materials; site and land rehabilitation, including compliance withand monitoring of environmental regulations; security and other site-related costs required to perform the rehabilitation work; and operationof equipment designed to reduce or eliminate environmental effects. Theextent of work required and the associated costs are dependent on therequirements of relevant authorities and our environmental policies.Routine operating costs that may impact the ultimate closure andrehabilitation activities, such as waste material handling conducted as anintegral part of a mining or production process, are not included in theprovision. Abnormal costs arising from unforeseen circumstances, suchas the contamination caused by unplanned discharges, are recognizedas an expense and liability when the event that gives rise to anobligation occurs and reliable estimates of the required rehabilitationcosts can be made.
Provisions for the cost of each rehabilitation program are normallyrecognized at the time that an environmental disturbance occurs or anew legal or constructive obligation is determined. When the extent ofdisturbance increases over the life of an operation, the provision isincreased accordingly. The major parts of the carrying amount ofprovisions relate to closure/rehabilitation of tailings ponds, heap leachpads and waste dumps; demolition of buildings/mine facilities; ongoingwater treatment; and ongoing care and maintenance and security ofclosed mines. Costs included in the provision encompass all closure andrehabilitation activity expected to occur progressively over the life of theoperation at the time of closure and post-closure in connection withdisturbances as at the reporting date. Estimated costs included in thedetermination of the provision reflect the risks and probabilities ofalternative estimates of cash flows required to settle the obligation ateach particular operation. The expected rehabilitation costs areestimated based on the cost of external contractors performing the workor the cost of performing the work internally depending onmanagement’s intention.
The timing of the actual rehabilitation expenditure is dependent upon anumber of factors such as the life and nature of the asset, the operatinglicense conditions and the environment in which the mine operates.Expenditures may occur before and after closure and can continue for anextended period of time depending on rehabilitation requirements.Rehabilitation provisions are measured at the expected value of futurecash flows, which exclude the effect of inflation, discounted to theirpresent value using a current US dollar real risk-free pre-tax discount rate.The unwinding of the discount, referred to as accretion expense, isincluded in finance costs and results in an increase in the amount of theprovision. Provisions are updated each reporting period for changes toexpected cash flows and for the effect of changes in the discount rate, andthe change in estimate is added or deducted from the related asset anddepreciated over the expected economic life of the operation to which itrelates.
Significant judgments and estimates are involved in forming expectationsof future activities, the amount and timing of the associated cash flowsand the period over which we estimate those cash flows. Thoseexpectations are formed based on existing environmental and regulatoryrequirements or, if more stringent, our environmental policies which giverise to a constructive obligation.
When provisions for closure and rehabilitation are initially recognized, thecorresponding cost is capitalized as an asset, representing part of the costof acquiring the future economic benefits of the operation. The capitalizedcost of closure and rehabilitation activities is recognized in PP&E anddepreciated over the expected economic life of the operation to which itrelates.
Adjustments to the estimated amount and timing of future closure andrehabilitation cash flows are a normal occurrence in light of the significantjudgments and estimates involved. The principal factors that can causeexpected cash flows to change are: the construction of new processingfacilities; changes in the quantities of material in reserves and resourceswith a corresponding change in the life of mine plan; changing orecharacteristics that impact required environmental protection measuresand related costs; changes in water quality that impact the extent of watertreatment required; changes in discount rates; changes in foreignexchange rates; changes in Barrick’s closure policies; and changes inlaws and regulations governing the protection of the environment.
Rehabilitation provisions are adjusted as a result of changes in estimatesand assumptions. Those adjustments are accounted for as a change inthe corresponding cost of the related assets, including the related mineralproperty, except where a reduction in the provision is greater than theremaining net book value of
BARRICK YEAR-END 2017 111 NOTES TO FINANCIAL STATEMENTS
the related assets, in which case the value is reduced to nil and theremaining adjustment is recognized in the consolidated statements ofincome. In the case of closed sites, changes in estimates andassumptions are recognized immediately in the consolidated statementsof income. For an operating mine, the adjusted carrying amount of therelated asset is depreciated prospectively. Adjustments also result inchanges to future finance costs.
v) Litigation and Other ProvisionsProvisions are recognized when a present obligation exists (legal orconstructive), as a result of a past event, for which it is probable that anoutflow of resources will be required to settle the obligation, and areliable estimate can be made of the amount of the obligation. Provisionsare discounted to their present value using a current US dollar real risk-free pre-tax discount rate and the accretion expense is included infinance costs.
Certain conditions may exist as of the date the financial statements areissued, which may result in a loss to the Company, but which will only beresolved when one or more future events occur or fail to occur. Inassessing loss contingencies related to legal proceedings that arepending against us or unasserted claims that may result in suchproceedings, the Company with assistance from its legal counselevaluates the perceived merits of any legal proceedings or unassertedclaims as well as the perceived merits of the amount of relief sought orexpected to be sought.
If the assessment of a contingency suggests that a loss is probable, andthe amount can be reliably estimated, then a loss is recorded. When acontingent loss is not probable but is reasonably possible, or is probablebut the amount of loss cannot be reliably estimated, then details of thecontingent loss are disclosed. Loss contingencies considered remote aregenerally not disclosed unless they involve guarantees, in which casewe disclose the nature of the guarantee. Legal fees incurred inconnection with pending legal proceedings are expensed as incurred.Contingent gains are only recognized when the inflow of economicbenefits is virtually certain.
w) Stock-Based CompensationWe recognize the expense related to these plans over the vestingperiod, beginning once the grant has been approved and announced tothe beneficiaries.
Cash-settled awards are measured at fair value initially using the marketvalue of the underlying shares on the day preceding the date of the grantof the award and are required to be remeasured to fair value at eachreporting date until settlement. The cost is then recorded over thevesting period of the award. This expense, and any changes in the fairvalue of the award, is recorded to the same expense category as theaward recipient’s payroll costs. The cost of a cash-settled award isrecorded within liabilities until settled. Barrick offers cash-settled
(Restricted Share Units (“RSU”), Deferred Share Units (“DSU”),Performance Restricted Share Units (“PRSU”) and Performance GrantedShare Units (“PGSU”)) awards to certain employees, officers and directorsof the Company.
Equity-settled awards are measured at fair value, using the Lattice modelfor stock options, with market related inputs as of the date of the grant.The cost is recorded over the vesting period of the award to the sameexpense category as the award recipient’s payroll costs (i.e., cost of salesor general and administrative) and the corresponding entry is recorded inequity. Equity-settled awards are not remeasured subsequent to the initialgrant date. Barrick offers equity-settled (Employee Stock Option Plan(“ESOP”), Employee Share Purchase Plan (“ESPP”) and GlobalEmployee Share Plan (“GESP”)) awards to certain employees, officersand directors of the Company.
We use the accelerated method (also referred to as ‘graded’ vesting) forattributing stock option expense over the vesting period. Stock optionexpense incorporates an expected forfeiture rate. The expected forfeiturerate is estimated based on historical forfeiture rates and expectations offuture forfeiture rates. We make adjustments if the actual forfeiture ratediffers from the expected rate.
Employee Stock Option Plan (“ESOP”)Under Barrick’s ESOP, certain officers and key employees of theCorporation may purchase common shares at an exercise price that isequal to the closing share price on the day before the grant of the option.The grant date is the date when the details of the award, including thenumber of options granted to the individual and the exercise price, areapproved. Stock options vest equally over four years, beginning in theyear after granting. The ESOP arrangement has graded vesting terms,and therefore multiple vesting periods must be valued and accounted forseparately over their respective vesting periods. The compensationexpense of the instruments issued for each grant under the ESOP iscalculated using the Lattice model. The compensation expense isadjusted by the estimated forfeiture rate which is estimated based onhistorical forfeiture rates and expectations of future forfeiture rates. Wemake adjustments if the actual forfeiture rate differs from the expectedrate.
Restricted Share Units (“RSU”)Under our RSU plan, selected employees are granted RSUs where eachRSU has a value equal to one Barrick common share. RSUs generallyvest within three years and upon vesting the employee will receive eithercash or common shares, depending on the terms of the grant. AdditionalRSUs are credited to reflect dividends paid on Barrick common sharesover the vesting period.
A liability for RSUs is measured at fair value on the grant date and issubsequently adjusted for changes in fair

BARRICK YEAR-END 2017 112 NOTES TO FINANCIAL STATEMENTS
value. The liability is recognized on a straight-line basis over the vestingperiod, with a corresponding charge to compensation expense, as acomponent of corporate administration and operating segmentadministration. Compensation expenses for RSUs incorporate anestimate for expected forfeiture rates based on which the fair value isadjusted.
Deferred Share Units (“DSU”)Under our DSU plan, Directors must receive at least 75% of their basicannual retainer in the form of DSUs or cash to purchase common sharesthat cannot be sold, transferred or otherwise disposed of until theDirector leaves the Board. Each DSU has the same value as one Barrickcommon share. DSUs must be retained until the Director leaves theBoard, at which time the cash value of the DSUs is paid out. AdditionalDSUs are credited to reflect dividends paid on Barrick common shares.The initial fair value of the liability is calculated as of the grant date andis recognized immediately. Subsequently, at each reporting date and onsettlement, the liability is remeasured, with any change in fair valuerecorded as compensation expense in the period. Officers may alsoelect to receive a portion or all of their incentive compensation in theform of DSUs. We also allow granting of DSUs to other officers andemployees at the discretion of the Board Compensation Committee.
Performance Restricted Share Units (“PRSU”)Under our PRSU plan, selected employees are granted PRSUs, whereeach PRSU has a value equal to one Barrick common share. PRSUsvest at the end of a three-year period and are settled in cash on the thirdanniversary of the grant date. Additional PRSUs are credited to reflectdividends paid on Barrick common shares over the vesting period.Vesting, and therefore the liability, is based on the achievement ofperformance goals and the target settlement ranges from 0% to 200% ofthe original grant of units.
The value of a PRSU reflects the value of a Barrick common share andthe number of share units issued is adjusted for its relative performanceagainst certain competitors and other internal financial performancemeasures. Therefore, the fair value of the PRSUs is determined withreference to the closing stock price at each remeasurement date.
The initial fair value of the liability is calculated as of the grant date andis recognized within compensation expense using the straight-linemethod over the vesting period. Subsequently, at each reporting dateand on settlement, the liability is remeasured, with any changes in fairvalue recorded as compensation expense. The fair value is adjusted forthe revised estimated forfeiture rate.
Performance Granted Share Units (“PGSU”)Under our PGSU plan, selected employees are granted PGSUs, whereeach PGSU has a value equal to one
Barrick common share. Annual PGSU awards are determined based on amultiple ranging from one to six times base salary (depending on positionand level of responsibility) multiplied by a performance factor. The numberof PGSUs granted to a plan participant is determined by dividing the dollarvalue of the award by the closing price of Barrick common shares on theday prior to the grant, or if the grant date occurs during a blackout period,by the greater of (i) the closing price of Barrick common shares on the dayprior to the grant date and (ii) the closing price of Barrick common shareson the first day following the expiration of the blackout. Upon vesting, theafter-tax value of the award is used to purchase common shares andgenerally these shares cannot be sold until the employee retires or leavesBarrick. PGSUs vest at the end of the third year from the date of the grant.
The initial fair value of the liability is calculated as of the grant date and isrecognized within compensation expense using the straight-line methodover the vesting period. Subsequently, at each reporting date and onsettlement, the liability is remeasured, with any changes in fair valuerecorded as compensation expense.
Employee Share Purchase Plan (“ESPP”)Under our ESPP plan, certain Barrick employees can purchase Companyshares through payroll deduction. Each year, employees may contribute1%-6% of their combined base salary and annual short-term incentive,and Barrick will match 50% of the contribution, up to a maximum ofC$5,000 per year.
Both Barrick and the employee make the contributions on a semi-monthlybasis with the funds being transferred to a custodian who purchasesBarrick Common Shares in the open market. Shares purchased withemployee contributions have no vesting requirement; however, sharespurchased with Barrick’s contributions vest approximately one year fromcontribution date. All dividend income is used to purchase additionalBarrick shares.
Barrick records an expense equal to its semi-monthly cash contribution.No forfeiture rate is applied to the amounts accrued. Where an employeeleaves prior to vesting, any accrual for contributions by Barrick during theyear related to that employee is reversed.
Global Employee Share Plan (“GESP”)Under our GESP plan, Barrick employees are awarded CompanyCommon Shares. These shares vest immediately, but must be held untilthe employee ceases to be employed by the Company. Barrick recognizesthe expense when the award is announced and has no ongoing liability.
BARRICK YEAR-END 2017 113 NOTES TO FINANCIAL STATEMENTS
x) Post-Retirement Benefits
Defined Contribution Pension PlansCertain employees take part in defined contribution employee benefitplans whereby we contribute up to 6% of the employee’s annual salary.We also have a retirement plan for certain officers of Barrick underwhich we contribute 15% of the officer’s annual salary and annual short-term incentive. The contributions are recognized as compensationexpense as incurred. The Company has no further payment obligationsonce the contributions have been paid.
Defined Benefit Pension PlansWe have qualified defined benefit pension plans that cover certainformer United States and Canadian employees and provide benefitsbased on employees’ years of service. Our policy is to fund the amountsnecessary on an actuarial basis to provide enough assets to meet thebenefits payable to plan members. Independent trustees administerassets of the plans, which are invested mainly in fixed-income and equitysecurities.
As well as the qualified plans, we have non-qualified defined benefitpension plans covering certain employees and former directors ofBarrick. No funding is done on these plans and contributions for futureyears are required to be equal to benefit payments.
Actuarial gains and losses arising from experience adjustments andchanges in actuarial assumptions are charged or credited to equity inOCI in the period in which they arise.
Our valuations are carried out using the projected unit credit method. Werecord the difference between the fair value of the plan assets and thepresent value of the plan obligations as an asset or liability on theconsolidated balance sheets.
Pension Plan Assets and LiabilitiesPension plan assets, which consist primarily of fixed-income and equitysecurities, are valued using current market quotations. Plan obligationsand the annual pension expense are determined on an actuarial basisand are affected by numerous assumptions and estimates including themarket value of plan assets, estimates of the expected return on planassets, discount rates, future wage increases and other assumptions.
The discount rate and life expectancy are the assumptions that generallyhave the most significant impact on our pension cost and obligation.
Other Post-Retirement BenefitsWe provide post-retirement medical, dental, and life insurance benefitsto certain employees. Actuarial gains and losses resulting fromvariances between actual results
and economic estimates or actuarial assumptions are recorded in OCI.
y) New Accounting Standards Issued But Not Yet Effective
IFRS 15 Revenue from Contracts with CustomersIn May 2014, the IASB issued IFRS 15 Revenue from Contracts withCustomers, which covers principles that an entity shall apply to reportuseful information to users of financial statements about the nature,amount, timing, and uncertainty of revenue and cash flows arising from acontract with a customer. In September 2015, the IASB deferred theeffective date of the standard to annual reporting periods beginning on orafter January 1, 2018, with earlier application permitted. We have notearly adopted IFRS 15. In 2017 we completed our assessment of theimpact on our consolidated financial statements. Our assessment is asfollows: · Bullion (gold and silver) sales – these sales will not be affected
by IFRS 15.
· Concentrate (gold and copper) and cathode (copper) sales – therecognition of these sales will not be affected by IFRS 15, butwe will begin separate presentation of the provisional pricingadjustments within our revenue note disclosure.
· Streaming arrangements – IFRS 15 requires us to treat deferredrevenue earned on streaming transactions as variable, whichmust be adjusted each time there is a change in the underlyingproduction profile. As at January 1, 2018, an insignificantopening balance sheet adjustment will be recorded upontransition to retroactively adjust the historical revenuerecognized from our streaming transactions, resulting in anincrease to our deferred revenue balance and a decrease inretained earnings. The retroactive adjustment reflects thechange in the transaction price per unit due to a change in thelife of mine production profile of the mines since the inception ofthe streaming agreements and the corresponding impact onaccretion. Going forward, each time we have an update to thelife of mine production profile (typically in the fourth quarter ofeach year) we will record an adjustment to revenue toretroactively adjust for the new number of ounces expected tobe delivered to our streaming counterparty.
· We will use the modified retrospective approach of adoption.
IFRS 16 LeasesIn January 2016, the IASB issued IFRS 16 Leases, which requireslessees to recognize assets and liabilities for most leases. Application ofthe standard is mandatory for annual reporting periods beginning on orafter January 1, 2019, with earlier application permitted, provided the newrevenue standard, IFRS 15 Revenue from Contracts with Customers, hasbeen applied or is applied at the
BARRICK YEAR-END 2017 114 NOTES TO FINANCIAL STATEMENTS
same date as IFRS 16. We are not early adopting IFRS 16. We expectthat IFRS 16 will result in an increase in assets and liabilities as fewerleases will be expensed as payments are made. We expect an increasein depreciation and accretion expenses and also an increase in cashflow from operating activities as these lease payments will be recordedas financing outflows in our cash flow statement. We have developed afull implementation plan to determine the impact on our financialstatements and internal controls. In fourth quarter 2017, we formed anIFRS 16 working group and began the process of compiling all of ourexisting operating leases and service contracts. In 2018, we will reviewthe relevant agreements and determine which of the operating leasesand service contracts are in scope for IFRS 16.
3 > CRITICAL JUDGMENTS, ESTIMATES, ASSUMPTIONS ANDRISKSMany of the amounts included in the consolidated balance sheet requiremanagement to make judgments and/or estimates. These judgmentsand estimates are continuously evaluated and are based onmanagement’s experience and knowledge of the relevant facts andcircumstances. Actual results may differ from the estimates. Informationabout such judgments and estimates is contained in the description ofour accounting policies and/or other notes to the financial statements.The key areas where judgments, estimates and assumptions have beenmade are summarized below.
Life of Mine (“LOM”) Plans and Reserves and ResourcesEstimates of the quantities of proven and probable mineral reserves andmineral resources form the basis for our LOM plans, which are used fora number of important business and accounting purposes, including: thecalculation of depreciation expense; the capitalization of productionphase stripping costs; and forecasting the timing of the payments relatedto the environmental rehabilitation provision. In addition, the underlyingLOM plans are used in the impairment tests for goodwill andnon-current assets. In certain cases, these LOM plans have madeassumptions about our ability to obtain the necessary permits required tocomplete the planned activities. We estimate our ore reserves andmineral resources based on information compiled by qualified personsas defined in accordance with the Canadian Securities Administrators’National Instrument 43-101 Standards of Disclosure for Mineral Projectsrequirements. To calculate our gold reserves, as at December 31, 2017we have used a per ounce gold price of $1,200, compared to $1,000short-term and $1,200 long-term as at December 31, 2016. To calculateour measured, indicated, and inferred gold resources, as atDecember 31, 2017 we have used a gold price assumption of $1,500 perounce, consistent with the prior year. Refer to notes 19 and 21.
InventoryThe measurement of inventory including the determination of its netrealizable value, especially as it relates to ore in stockpiles, involves theuse of estimates. Estimation is required in determining the tonnage,recoverable gold and copper contained therein, and in determining theremaining costs of completion to bring inventory into its saleable form.Judgment also exists in determining whether to recognize a provision forobsolescence on mine operating supplies, and estimates are required todetermine salvage or scrap value of supplies.
Estimates of recoverable gold or copper on the leach pads are calculatedfrom the quantities of ore placed on the leach pads (measured tons addedto the leach pads), the grade of ore placed on the leach pads (based onassay data) and a recovery percentage (based on ore type).
Impairment and Reversal of Impairment for Non-Current Assets andImpairment of GoodwillGoodwill and non-current assets are tested for impairment if there is anindicator of impairment or reversal of impairment, and in the case ofgoodwill annually during the fourth quarter, for all of our operatingsegments. We consider both external and internal sources of informationfor indications that non-current assets and/or goodwill are impaired.External sources of information we consider include changes in themarket, economic and legal environment in which the CGU operates thatare not within its control and affect the recoverable amount of mininginterests and goodwill. Internal sources of information we consider includethe manner in which mining properties and plant and equipment are beingused or are expected to be used and indications of economic performanceof the assets. Calculating the FVLCD of CGUs for non-current asset andgoodwill impairment tests requires management to make estimates andassumptions with respect to future production levels, operating, capitaland closure costs in our LOM plans, future metal prices, foreign exchangerates, Net Asset Value (“NAV”) multiples, value of reserves outside LOMplans in relation to the assumptions related to comparable entities and themarket values per ounce and per pound and discount rates. Changes inany of the assumptions or estimates used in determining the fair valuescould impact the impairment analysis. Refer to notes 2o, 2q and 21 forfurther information.
Provisions for Environmental RehabilitationManagement assesses its provision for environmental rehabilitation on anannual basis or when new information becomes available. Thisassessment includes the estimation of the future rehabilitation costs, thetiming of these expenditures, and the impact of changes in discount ratesand foreign exchange rates. The actual future expenditures may differfrom the amounts currently provided if the estimates made aresignificantly different than actual results or if there are significant
BARRICK YEAR-END 2017 115 NOTES TO FINANCIAL STATEMENTS
changes in environmental and/or regulatory requirements in the future.Refer to notes 2u and 27 for further information.
TaxesManagement is required to make estimations regarding the tax basis ofassets and liabilities and related deferred income tax assets andliabilities, amounts recorded for uncertain tax positions, themeasurement of income tax expense and indirect taxes, and estimatesof the timing of repatriation of earnings, which would impact therecognition of withholding taxes and taxes related to the outside basis onsubsidiaries/associates. A number of these estimates requiremanagement to make estimates of future taxable profit, as well as therecoverability of indirect taxes, and if actual results are significantlydifferent than our estimates, the ability to realize the deferred tax assetsand indirect tax receivables recorded on our balance sheet could beimpacted. Refer to notes 2j, 12 and 30 for further information.
ContingenciesContingencies can be either possible assets or possible liabilities arisingfrom past events which, by their nature, will only be resolved when oneor more future events not wholly within our control occur or fail to occur.The assessment of such contingencies inherently involves the exerciseof significant judgment and estimates of the outcome of future events. Inassessing loss contingencies related to legal proceedings that arepending against us or unasserted claims that may result in suchproceedings or regulatory or government actions that may negativelyimpact our business or operations, the Company with assistance from itslegal counsel evaluates the perceived merits of any legal proceedings orunasserted claims or actions as well as the perceived merits of thenature and amount of relief sought or expected to be sought, whendetermining the amount, if any, to recognize as a contingent liability orassessing the impact on the carrying value of assets. Contingent assetsare not recognized in the consolidated financial statements. Refer tonote 36 for more information.
Pascua-LamaThe Pascua-Lama project received $484 million as at December 31,2017 ($429 million as at December 31, 2016) in value added tax (“VAT”)refunds in Chile relating to the development of the Chilean side of theproject. Under the current arrangement this amount plus interest of$313 million (2016: $236 million) must be repaid if the project does notevidence exports for an amount of $3,538 million within a term thatexpires on December 31, 2026. The terms of the current VATarrangement in Chile are applicable to either an open pit or anunderground mine design. We have recorded $221 million in VATrecoverable in Argentina as at December 31, 2017 ($255 million as atDecember 31, 2016) relating to the development of the Argentinean sideof the project. These amounts may not be recoverable if the project doesnot
enter into production and are subject to devaluation risk as the amountsare recoverable in Argentinean pesos.
Streaming TransactionsThe upfront cash deposit received from Royal Gold on the gold and silverstreaming transaction for production linked to Barrick’s 60% interest in thePueblo Viejo mine has been accounted for as deferred revenue as wehave determined that it is not a derivative as it will be satisfied through thedelivery of non-financial items (i.e., gold and silver) rather than cash orfinancial assets. It is our intention to settle the obligations under thestreaming arrangement through our own production and if we were to failto settle the obligations with Royal Gold through our own production, thiswould lead to the streaming arrangement becoming a derivative. Thiswould cause a change to the accounting treatment, resulting in therevaluation of the fair value of the agreement through profit and loss on arecurring basis. Refer to note 29 for further details.
Our silver sale agreement with Wheaton Precious Metals Corp.(“Wheaton”) (formerly Silver Wheaton Corp.) requires us to deliver 25% ofthe life of mine silver production from the Pascua-Lama project once it isconstructed and 100% of silver from Lagunas Norte, Pierina and Veladeromines until March 31, 2018. The completion date for Pascua-Lama wasoriginally December 31, 2015 but was subsequently extended to June 30,2020. Per the terms of the amended silver purchase agreement, if therequirements of the completion guarantee have not been satisfied byJune 30, 2020, the agreement may be terminated by Wheaton, in whichcase, they will be entitled to the return of the upfront cash considerationpaid less credit for silver delivered up to the date of that event. The cashliability at December 31, 2017 is $262 million.
Refer to note 28 for a summary of our key financial risks.
BARRICK YEAR-END 2017 116 NOTES TO FINANCIAL STATEMENTS
Other Notes to the Financial Statements
Note Acquisitions and Divestitures 4 Segment information 5 Revenue 6 Cost of sales 7 Exploration, evaluation and project expenses 8 Other expense (income) 9 Impairment reversals 10 General and administrative expenses 11 Income tax expense 12 Earnings per share 13 Finance costs, net 14 Cash flow - other items 15 Investments 16 Inventories 17 Accounts receivable and other current assets 18 Property, plant and equipment 19 Goodwill and other intangible assets 20 Impairment and reversal of non-current assets 21 Other assets 22 Accounts payable 23 Other current liabilities 24 Financial instruments 25 Fair value measurements 26 Provisions 27 Financial risk management 28 Other non-current liabilities 29 Deferred income taxes 30 Capital stock 31 Non-controlling interests 32 Remuneration of key management personnel 33 Stock-based compensation 34 Post-retirement benefits 35 Contingencies 36
4 > ACQUISITIONS AND DIVESTITURES For the years ended December 31 2017 2016 Gross cash proceeds on divestiture Veladero $990 $— Bald Mountain — 423 Round Mountain — 165
$990 $588
a) Sale of 50% of VeladeroOn April 6, 2017, we announced a strategic cooperation agreement withShandong Gold Group Co., Ltd. (“Shandong”) where Shandong agreed toacquire 50 percent of Barrick’s Veladero mine in Argentina. Thetransaction closed on June 30, 2017 and we received total cashconsideration of $990 million, which includes working capital adjustmentsof $30 million received in the fourth quarter of 2017. The transactionresulted in a gain of $718 million, partially on the sale of 50 percent toShandong and partially upon remeasurement of our remaining interest inVeladero. We have accounted for our remaining 50 percent interest as ajoint operation and consolidated our proportionate share of the assets andliabilities. We have recognized our share of the revenue and expenses ofVeladero starting July 1, 2017.
In accordance with the acquisition method of accounting, the acquisitioncost has been allocated to the underlying assets acquired and liabilitiesassumed. We completed the purchase price allocation in the fourthquarter of 2017 and recognized a deferred tax liability for the differencebetween the fair values and the tax base of those assets and now have anupdated goodwill balance of $154 million, which is not deductible for taxpurposes.
b) Sale of 25% of Cerro CasaleOn March 28, 2017, we announced an agreement with Goldcorp Inc.(“Goldcorp”) to form a new partnership at the Cerro Casale Project inChile. The transaction closed on June 9, 2017. Under the terms of theagreement, Goldcorp agreed to purchase a 25 percent interest in CerroCasale from Barrick. This transaction, coupled with the concurrentpurchase by Goldcorp of Kinross Gold Corporation’s (“Kinross”)25 percent interest in Cerro Casale, resulted in Barrick and Goldcorp eachholding a 50 percent interest in the joint operation.
The total consideration received by Barrick and Kinross implies a fairvalue of $1.2 billion for 100 percent of Cerro Casale, which resulted in areversal of impairment of $1.12 billion in the first quarter of 2017. Refer tonote 21 to the Financial Statements for further details of the impairmentreversal. We are accounting for our remaining 50 percent interest as ajoint operation and consolidate our proportionate share of the assets,liabilities, revenue and expenses of Cerro Casale. We recognized a gainof $193 million due to the
BARRICK YEAR-END 2017 117 NOTES TO FINANCIAL STATEMENTS
deconsolidation of the non-controlling interest in Cerro Casale in thesecond quarter of 2017.
As consideration for the 25 percent interest acquired from Barrick,Goldcorp will fund Barrick’s first $260 million of expenditures on theproject and will spend an equivalent amount on its own behalf for a totalproject investment commitment of $520 million. Under the agreement,Goldcorp must spend a minimum of $60 million in the two-year periodfollowing closing, and then $80 million in each successive two-yearperiod. The outstanding funding commitment will accrue interest at anannual rate of 4.75 percent. In the event that Goldcorp does not spendthe minimum amount in any two-year period, 50 percent of any shortfallwill be paid directly to Barrick in cash.
In addition, Goldcorp also funded Cerro Casale’s acquisition of a100 percent interest in the adjacent Quebrada Seca property fromKinross upon closing. Upon a construction decision Goldcorp will payBarrick $40 million in cash and Barrick will receive a 1.25 percent royaltyon 25 percent of the gross revenues derived from metal production fromboth Cerro Casale and Quebrada Seca. The contingent considerationpayable to Barrick has been recorded at its estimated fair value in otherlong-term assets.
Goldcorp entered into a separate agreement for the acquisition of ExeterResource Corporation, whose sole asset is the Caspiche Project,located approximately 10 kilometers north of Cerro Casale. Theacquisition of 100 percent of Exeter was completed in the third quarterand Goldcorp contributed the Caspiche Project into the joint venture at atotal acquisition cost of approximately $157 million. The acquisition costsincurred by Goldcorp have been deducted from the $520 million totalproject investment commitment, but will not count towards the minimumexpenditures for the initial two-year period. We have recorded areceivable of $181 million, split $15 million as short-term and$166 million as long-term, in other current assets and other long-termassets, respectively. Moving forward, this joint venture will be referred toas Norte Abierto and includes the Cerro Casale, Caspiche and Lucianodeposits.
c) Investment in Reunion GoldOn December 1, 2017, we announced the acquisition of 48 millioncommon shares, representing approximately 15 percent of issued andoutstanding common shares of Reunion Gold Corporation in anon-brokered private placement for total consideration of $9 million.Subsequent to acquisition of the shares, we will be accounting for ourinterest as other investments with changes in fair value recorded in OCI.
d) Acquisition of Robertson Property in NevadaOn June 7, 2017, we completed the acquisition of the Robertson Propertyin Nevada from Coral Gold Resources (“Coral”). Consideration paid byBarrick consisted of $16 million, the return of 4.15 million shares(approximate value of $1 million) held by Barrick and a sliding scaleroyalty on any future production from the Robertson Property.
e) Disposition of Bald Mountain and Round Mountain MinesOn January 11, 2016, we closed the sale of our Bald Mountain mine andour 50% interest in the Round Mountain mine. We received net cashconsideration of $588 million, which reflected working capital adjustmentsof $22 million in the second quarter of 2016. The transactions resulted in aloss of $17 million for the year ended December 31, 2016.
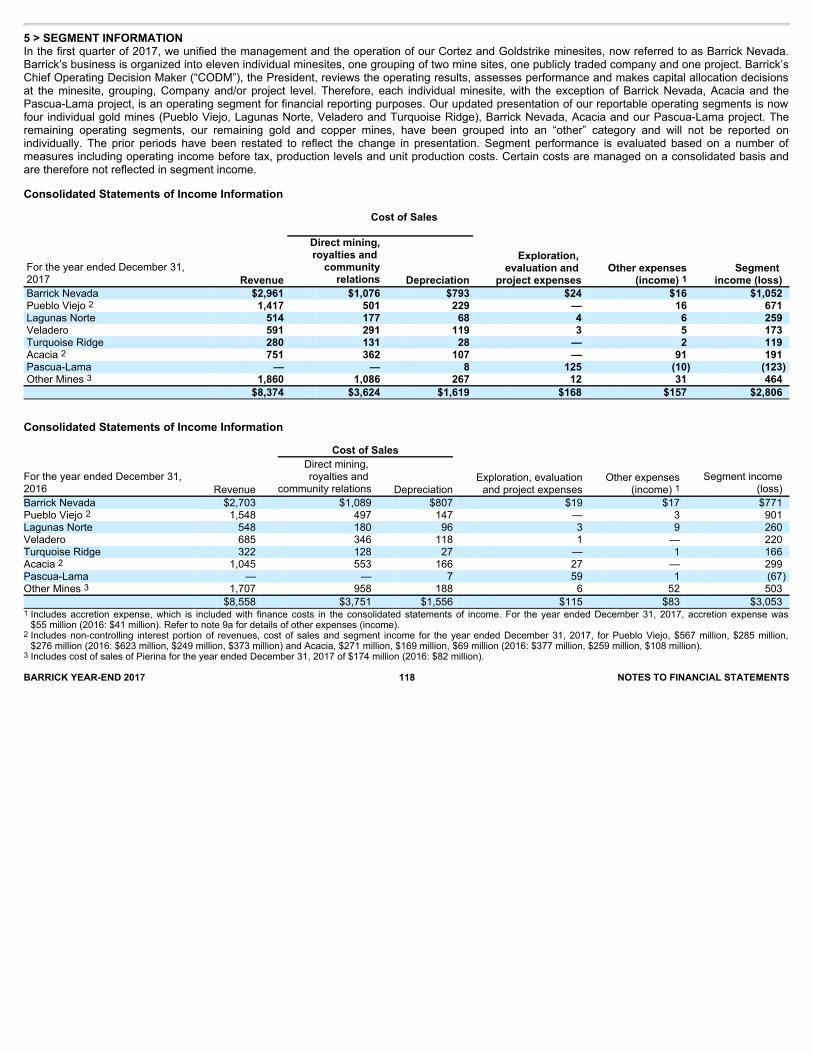
5 > SEGMENT INFORMATIONIn the first quarter of 2017, we unified the management and the operation of our Cortez and Goldstrike minesites, now referred to as Barrick Nevada.Barrick’s business is organized into eleven individual minesites, one grouping of two mine sites, one publicly traded company and one project. Barrick’sChief Operating Decision Maker (“CODM”), the President, reviews the operating results, assesses performance and makes capital allocation decisionsat the minesite, grouping, Company and/or project level. Therefore, each individual minesite, with the exception of Barrick Nevada, Acacia and thePascua-Lama project, is an operating segment for financial reporting purposes. Our updated presentation of our reportable operating segments is nowfour individual gold mines (Pueblo Viejo, Lagunas Norte, Veladero and Turquoise Ridge), Barrick Nevada, Acacia and our Pascua-Lama project. Theremaining operating segments, our remaining gold and copper mines, have been grouped into an “other” category and will not be reported onindividually. The prior periods have been restated to reflect the change in presentation. Segment performance is evaluated based on a number ofmeasures including operating income before tax, production levels and unit production costs. Certain costs are managed on a consolidated basis andare therefore not reflected in segment income.
Consolidated Statements of Income Information
Cost of Sales
For the year ended December 31, 2017 Revenue
Direct mining,royalties and
communityrelations Depreciation
Exploration, evaluation and
project expenses Other expenses
(income) 1 Segment
income (loss) Barrick Nevada $2,961 $1,076 $793 $24 $16 $1,052 Pueblo Viejo 2 1,417 501 229 — 16 671 Lagunas Norte 514 177 68 4 6 259 Veladero 591 291 119 3 5 173 Turquoise Ridge 280 131 28 — 2 119 Acacia 2 751 362 107 — 91 191 Pascua-Lama — — 8 125 (10) (123) Other Mines 3 1,860 1,086 267 12 31 464 $8,374 $3,624 $1,619 $168 $157 $2,806
Consolidated Statements of Income Information Cost of Sales
For the year ended December 31,2016 Revenue
Direct mining, royalties and
community relations Depreciation Exploration, evaluationand project expenses
Other expenses(income) 1
Segment income(loss)
Barrick Nevada $2,703 $1,089 $807 $19 $17 $771 Pueblo Viejo 2 1,548 497 147 — 3 901 Lagunas Norte 548 180 96 3 9 260 Veladero 685 346 118 1 — 220 Turquoise Ridge 322 128 27 — 1 166 Acacia 2 1,045 553 166 27 — 299 Pascua-Lama — — 7 59 1 (67) Other Mines 3 1,707 958 188 6 52 503 $8,558 $3,751 $1,556 $115 $83 $3,053 1 Includes accretion expense, which is included with finance costs in the consolidated statements of income. For the year ended December 31, 2017, accretion expense was$55 million (2016: $41 million). Refer to note 9a for details of other expenses (income).
2 Includes non-controlling interest portion of revenues, cost of sales and segment income for the year ended December 31, 2017, for Pueblo Viejo, $567 million, $285 million,$276 million (2016: $623 million, $249 million, $373 million) and Acacia, $271 million, $169 million, $69 million (2016: $377 million, $259 million, $108 million).
3 Includes cost of sales of Pierina for the year ended December 31, 2017 of $174 million (2016: $82 million).BARRICK YEAR-END 2017 118 NOTES TO FINANCIAL STATEMENTS

Reconciliation of Segment Income to Income from Continuing Operations Before Income Taxes
For the years ended December 31 2017 2016 Segment income $2,806 $3,053 Other cost of sales/amortization 1 (57) (98) Exploration, evaluation and project expenses not attributable to segments (186) (122) General and administrative expenses (248) (256) Other (expense) income not attributable to segments 901 (18) Impairment reversals 212 250 Loss on currency translation (72) (199) Closed mine rehabilitation (55) (130) Income from equity investees 76 20 Finance costs, net (includes non-segment accretion) 2 (636) (734) Gain on non-hedge derivatives 3 6 12 Income before income taxes $2,747 $1,778 1 Includes all realized hedge losses of $27 million (2016: $73 million).2 Includes debt extinguishment losses of $127 million (2016: $129 million).3 Includes unrealized non-hedge gains of $1 million (2016: $32 million).
Geographic Information Non-current assets Revenue 1
As at December
31, 2017 As at December
31, 2016 2017 2016 United States $6,641 $6,768 $3,299 $3,081 Dominican Republic 3,480 3,540 1,417 1,548 Argentina 2,217 2,366 591 685 Chile 2,469 1,945 — — Tanzania 1,129 1,673 751 1,045 Peru 734 678 676 663 Australia 463 478 456 472 Zambia 787 473 612 466 Papua New Guinea 351 353 322 304 Saudi Arabia 371 346 — — Canada 625 503 250 294 Unallocated 1,357 1,267 — — Total $20,624 $20,390 $8,374 $8,558 1 Presented based on the location from which the product originated.
Capital Expenditures Information Segment Capital Expenditures 1 As at December 31, 2017 As at December 31, 2016 Barrick Nevada $585 $358 Pueblo Viejo 114 101 Lagunas Norte 25 56 Veladero 173 95 Turquoise Ridge 36 32 Acacia 148 191 Pascua-Lama 6 20 Other Mines 259 230 Segment total $1,346 $1,083 Other items not allocated to segments 36 36 Total $1,382 $1,119 1 Segment capital expenditures are presented for internal management reporting purposes on an accrual basis. Capital expenditures in the consolidated statements of cash
flow are presented on a cash basis. In 2017, cash expenditures were $1,396 million (2016: $1,126 million) and the decrease in accrued expenditures was $14 million (2016:$7 million decrease).
BARRICK YEAR-END 2017 119 NOTES TO FINANCIAL STATEMENTS

7 > COST OF SALES Gold Copper Other 5 Total
For the years ended December 31 2017 2016 2017 2016 2017 2016 2017 2016 Direct mining cost 1,2,3,4 $3,063 $3,215 $274 $228 $28 $77 $3,365 $3,520 Depreciation 1,529 1,504 83 45 35 25 1,647 1,574 Royalty expense 206 224 38 41 — — 244 265 Community relations 38 37 4 5 2 4 44 46 Total $4,836 $4,980 $399 $319 $65 $106 $5,300 $5,405 1 Direct mining cost includes charges to reduce the cost of inventory to net realizable value of $21 million (2016: $68 million). 2 Direct mining cost includes the costs of extracting by-products. 3 Includes employee costs of $1,051 million (2016: $1,048 million). 4 Cost of sales also includes costs associated with power sales to third parties from our Monte Rio power plant in the Dominican Republic up until its disposition on August 18,
2016. 5 Other includes all realized hedge gains and losses and corporate amortization. BARRICK YEAR-END 2017 120 NOTES TO FINANCIAL STATEMENTS
6 > REVENUEFor the years ended December 31 2017 2016 Gold bullion sales 1 Spot market sales $7,566 $7,650 Concentrate sales 65 258 $7,631 $7,908 Copper concentrate sales 1 $608 $466 Other sales 2 $135 $184 Total $8,374 $8,558 1 Revenues include amounts transferred from OCI to earnings for commodity
cash flow hedges (see note 25d). Revenue is presented net of direct salestaxes of $nil (2016: $2 million).
2 Revenues include the sale of by-products from our gold and copper mines andenergy sales to third parties from the Monte Rio power plant at our Pueblo Viejomine up until its disposition on August 18, 2016.
Principal ProductsAll of our gold mining operations produce gold in doré form, exceptAcacia’s gold mines of Bulyanhulu and Buzwagi, which produce bothgold doré and gold concentrate. Gold doré is unrefined gold bullion barsusually consisting of 90% gold that is refined to pure gold bullion prior tosale to our customers. Concentrate is a processing product containingthe valuable ore mineral from which most of the waste mineral has beeneliminated. Our Lumwana and Jabal Sayid mines produce aconcentrate that primarily contains copper. Incidental revenues from thesale of by-products, primarily copper, silver and energy at our goldmines, are classified within other sales.
Provisional Copper and Gold SalesWe have provisionally priced sales for which price finalization, referencedto the relevant copper and gold index, is outstanding at the balance sheetdate. Our exposure at December 31, 2017 to the impact of movements inmarket commodity prices for provisionally priced sales is set out in thefollowing table:
Volumes subject tofinal pricing
Copper (millions)Gold (000s)
Impact on net incomebefore taxation of 10%movement in market
price US$ As at December 31 2017 2016 2017 2016 Copper pounds 40 44 $13 $11 Gold ounces — 13 — 2
For the year ended December 31, 2017, our provisionally priced coppersales included provisional pricing gains of $46 million (2016: $22 millionloss) and our provisionally priced gold sales included provisional pricingadjustments of $1 million (2016: $nil).
At December 31, 2017, our provisionally priced copper sales subject tofinal settlement were recorded at average prices of $3.29/lb (2016:$2.51/lb). At December 31, 2017, there were no provisionally priced goldsales subject to final settlement. At December 31, 2016, our provisionallypriced gold sales subject to final settlement were recorded at an averageprice of $1,152/oz. The sensitivities in the above tables have beendetermined as the impact of a 10% change in commodity prices at eachreporting date, while holding all other variables, including foreigncurrency exchange rates, constant.
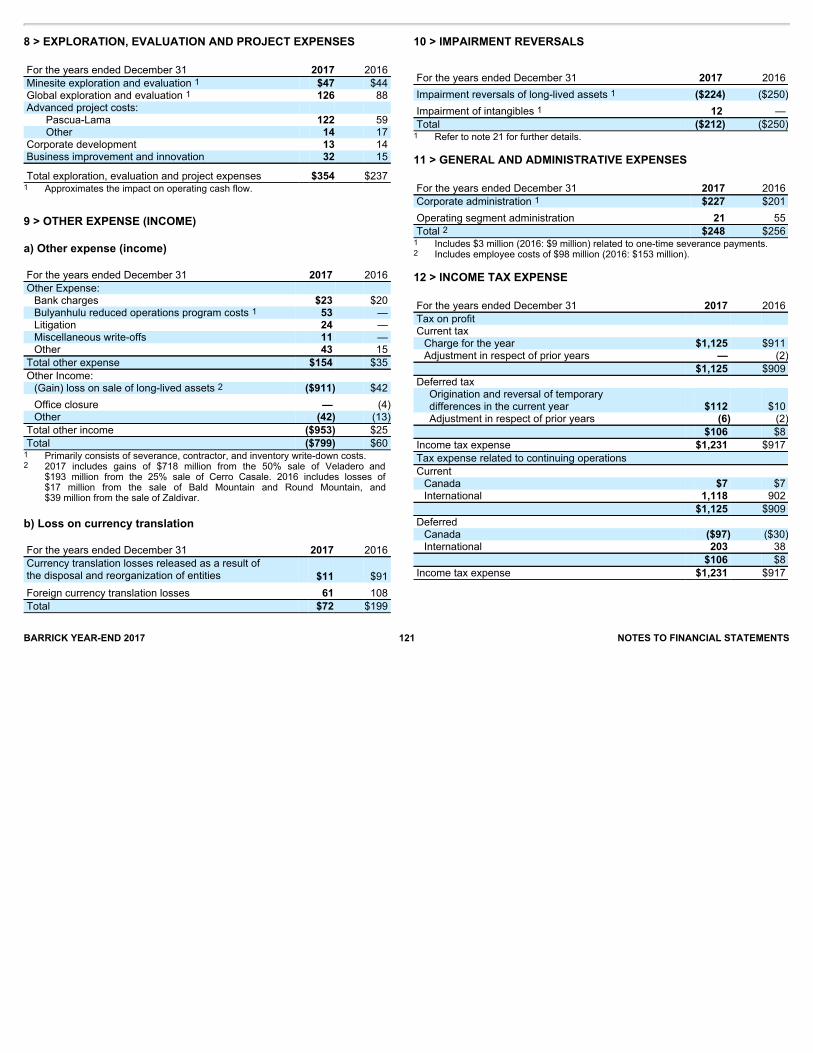
BARRICK YEAR-END 2017 121 NOTES TO FINANCIAL STATEMENTS
8 > EXPLORATION, EVALUATION AND PROJECT EXPENSES For the years ended December 31 2017 2016 Minesite exploration and evaluation 1 $47 $44 Global exploration and evaluation 1 126 88 Advanced project costs: Pascua-Lama 122 59 Other 14 17
Corporate development 13 14 Business improvement and innovation 32 15
Total exploration, evaluation and project expenses $354 $237 1 Approximates the impact on operating cash flow.
9 > OTHER EXPENSE (INCOME)
a) Other expense (income) For the years ended December 31 2017 2016 Other Expense: Bank charges $23 $20 Bulyanhulu reduced operations program costs 1 53 — Litigation 24 — Miscellaneous write-offs 11 — Other 43 15
Total other expense $154 $35 Other Income: (Gain) loss on sale of long-lived assets 2 ($911) $42 Office closure — (4)Other (42) (13)
Total other income ($953) $25 Total ($799) $60 1 Primarily consists of severance, contractor, and inventory write-down costs. 2 2017 includes gains of $718 million from the 50% sale of Veladero and
$193 million from the 25% sale of Cerro Casale. 2016 includes losses of$17 million from the sale of Bald Mountain and Round Mountain, and$39 million from the sale of Zaldivar.
b) Loss on currency translation For the years ended December 31 2017 2016 Currency translation losses released as a result of the disposal and reorganization of entities $11 $91 Foreign currency translation losses 61 108 Total $72 $199
10 > IMPAIRMENT REVERSALS
For the years ended December 31 2017 2016 Impairment reversals of long-lived assets 1 ($224) ($250) Impairment of intangibles 1 12 — Total ($212) ($250)1 Refer to note 21 for further details.
11 > GENERAL AND ADMINISTRATIVE EXPENSES For the years ended December 31 2017 2016 Corporate administration 1 $227 $201 Operating segment administration 21 55 Total 2 $248 $256 1 Includes $3 million (2016: $9 million) related to one-time severance payments.2 Includes employee costs of $98 million (2016: $153 million).
12 > INCOME TAX EXPENSE For the years ended December 31 2017 2016 Tax on profit Current tax Charge for the year $1,125 $911 Adjustment in respect of prior years — (2)
$1,125 $909 Deferred tax
Origination and reversal of temporarydifferences in the current year $112 $10 Adjustment in respect of prior years (6) (2)
$106 $8 Income tax expense $1,231 $917 Tax expense related to continuing operations Current Canada $7 $7 International 1,118 902
$1,125 $909 Deferred Canada ($97) ($30)International 203 38
$106 $8 Income tax expense $1,231 $917
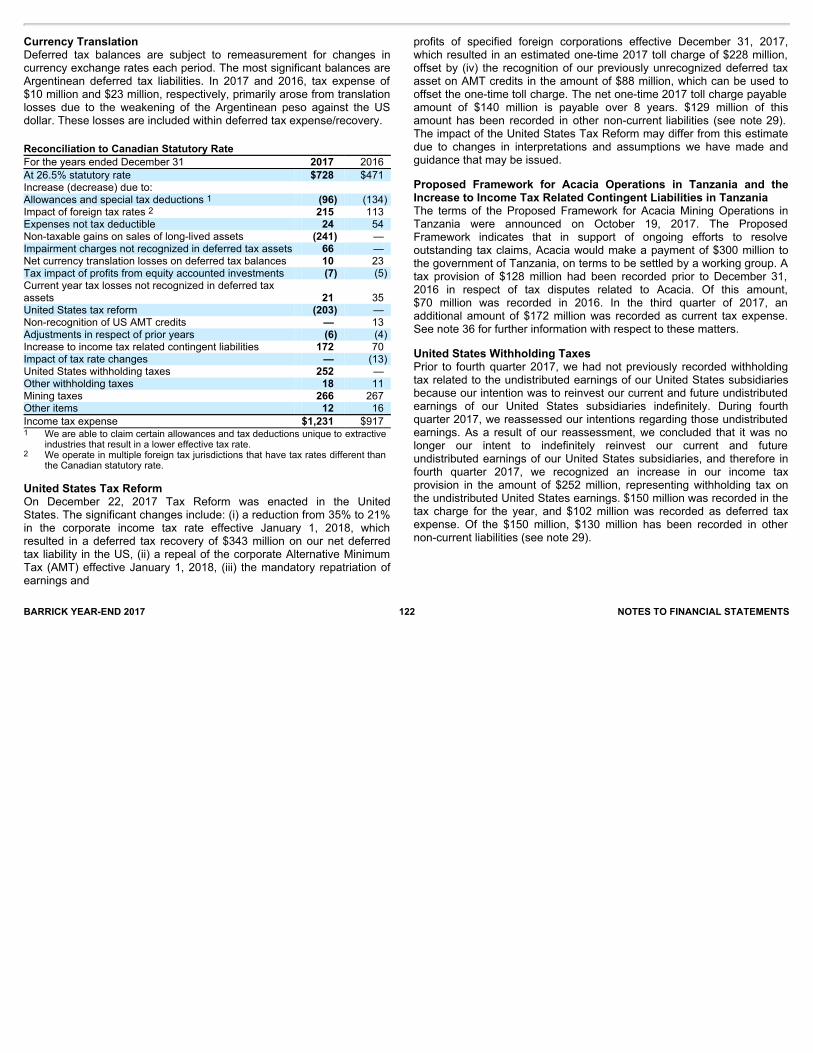
BARRICK YEAR-END 2017 122 NOTES TO FINANCIAL STATEMENTS
Currency TranslationDeferred tax balances are subject to remeasurement for changes incurrency exchange rates each period. The most significant balances areArgentinean deferred tax liabilities. In 2017 and 2016, tax expense of$10 million and $23 million, respectively, primarily arose from translationlosses due to the weakening of the Argentinean peso against the USdollar. These losses are included within deferred tax expense/recovery.Reconciliation to Canadian Statutory Rate For the years ended December 31 2017 2016 At 26.5% statutory rate $728 $471 Increase (decrease) due to: Allowances and special tax deductions 1 (96) (134) Impact of foreign tax rates 2 215 113 Expenses not tax deductible 24 54 Non-taxable gains on sales of long-lived assets (241) — Impairment charges not recognized in deferred tax assets 66 — Net currency translation losses on deferred tax balances 10 23 Tax impact of profits from equity accounted investments (7) (5) Current year tax losses not recognized in deferred taxassets 21 35 United States tax reform (203) — Non-recognition of US AMT credits — 13 Adjustments in respect of prior years (6) (4) Increase to income tax related contingent liabilities 172 70 Impact of tax rate changes — (13) United States withholding taxes 252 — Other withholding taxes 18 11 Mining taxes 266 267 Other items 12 16 Income tax expense $1,231 $917 1 We are able to claim certain allowances and tax deductions unique to extractive
industries that result in a lower effective tax rate. 2 We operate in multiple foreign tax jurisdictions that have tax rates different than
the Canadian statutory rate.
United States Tax ReformOn December 22, 2017 Tax Reform was enacted in the UnitedStates. The significant changes include: (i) a reduction from 35% to 21%in the corporate income tax rate effective January 1, 2018, whichresulted in a deferred tax recovery of $343 million on our net deferredtax liability in the US, (ii) a repeal of the corporate Alternative MinimumTax (AMT) effective January 1, 2018, (iii) the mandatory repatriation ofearnings and
profits of specified foreign corporations effective December 31, 2017,which resulted in an estimated one-time 2017 toll charge of $228 million,offset by (iv) the recognition of our previously unrecognized deferred taxasset on AMT credits in the amount of $88 million, which can be used tooffset the one-time toll charge. The net one-time 2017 toll charge payableamount of $140 million is payable over 8 years. $129 million of thisamount has been recorded in other non-current liabilities (see note 29).The impact of the United States Tax Reform may differ from this estimatedue to changes in interpretations and assumptions we have made andguidance that may be issued.
Proposed Framework for Acacia Operations in Tanzania and theIncrease to Income Tax Related Contingent Liabilities in TanzaniaThe terms of the Proposed Framework for Acacia Mining Operations inTanzania were announced on October 19, 2017. The ProposedFramework indicates that in support of ongoing efforts to resolveoutstanding tax claims, Acacia would make a payment of $300 million tothe government of Tanzania, on terms to be settled by a working group. Atax provision of $128 million had been recorded prior to December 31,2016 in respect of tax disputes related to Acacia. Of this amount,$70 million was recorded in 2016. In the third quarter of 2017, anadditional amount of $172 million was recorded as current tax expense.See note 36 for further information with respect to these matters.
United States Withholding TaxesPrior to fourth quarter 2017, we had not previously recorded withholdingtax related to the undistributed earnings of our United States subsidiariesbecause our intention was to reinvest our current and future undistributedearnings of our United States subsidiaries indefinitely. During fourthquarter 2017, we reassessed our intentions regarding those undistributedearnings. As a result of our reassessment, we concluded that it was nolonger our intent to indefinitely reinvest our current and futureundistributed earnings of our United States subsidiaries, and therefore infourth quarter 2017, we recognized an increase in our income taxprovision in the amount of $252 million, representing withholding tax onthe undistributed United States earnings. $150 million was recorded in thetax charge for the year, and $102 million was recorded as deferred taxexpense. Of the $150 million, $130 million has been recorded in othernon-current liabilities (see note 29).
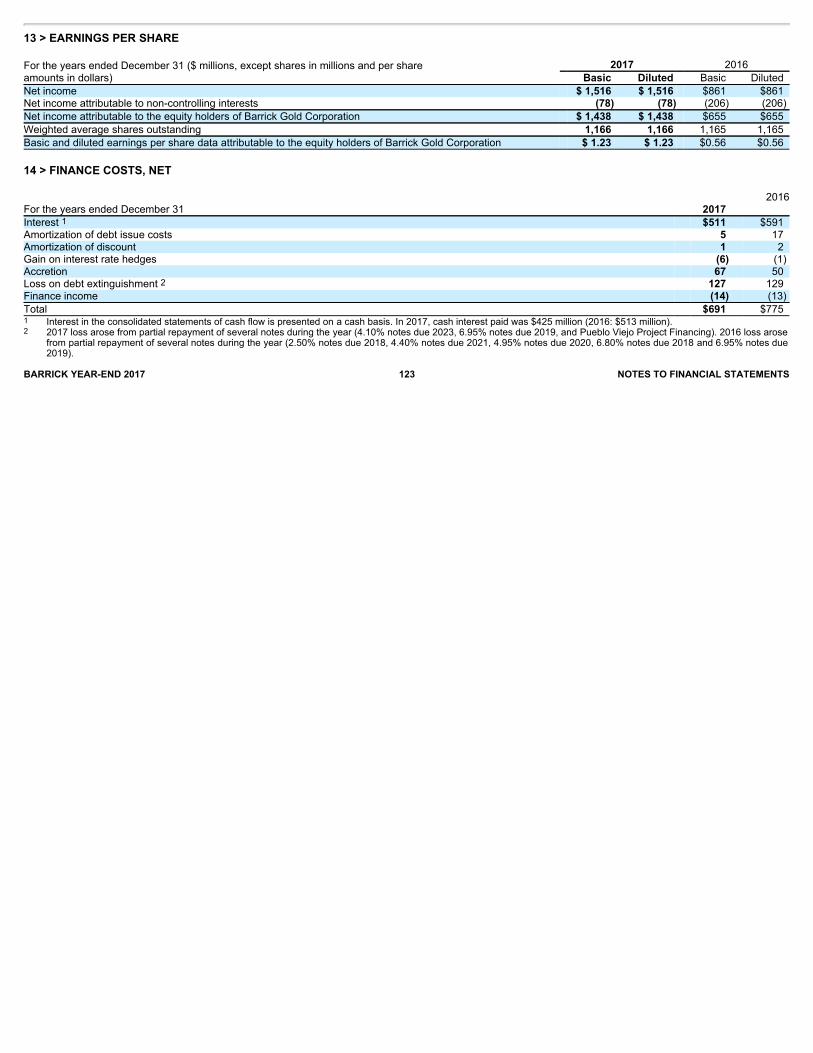
13 > EARNINGS PER SHAREFor the years ended December 31 ($ millions, except shares in millions and per share amounts in dollars)
2017 2016 Basic Diluted Basic Diluted
Net income $ 1,516 $ 1,516 $861 $861 Net income attributable to non-controlling interests (78) (78) (206) (206) Net income attributable to the equity holders of Barrick Gold Corporation $ 1,438 $ 1,438 $655 $655 Weighted average shares outstanding 1,166 1,166 1,165 1,165 Basic and diluted earnings per share data attributable to the equity holders of Barrick Gold Corporation $ 1.23 $ 1.23 $0.56 $0.56
14 > FINANCE COSTS, NET
For the years ended December 31 2017 2016
Interest 1 $511 $591 Amortization of debt issue costs 5 17 Amortization of discount 1 2 Gain on interest rate hedges (6) (1) Accretion 67 50 Loss on debt extinguishment 2 127 129 Finance income (14) (13) Total $691 $775 1 Interest in the consolidated statements of cash flow is presented on a cash basis. In 2017, cash interest paid was $425 million (2016: $513 million).2 2017 loss arose from partial repayment of several notes during the year (4.10% notes due 2023, 6.95% notes due 2019, and Pueblo Viejo Project Financing). 2016 loss arose
from partial repayment of several notes during the year (2.50% notes due 2018, 4.40% notes due 2021, 4.95% notes due 2020, 6.80% notes due 2018 and 6.95% notes due2019).
BARRICK YEAR-END 2017 123 NOTES TO FINANCIAL STATEMENTS
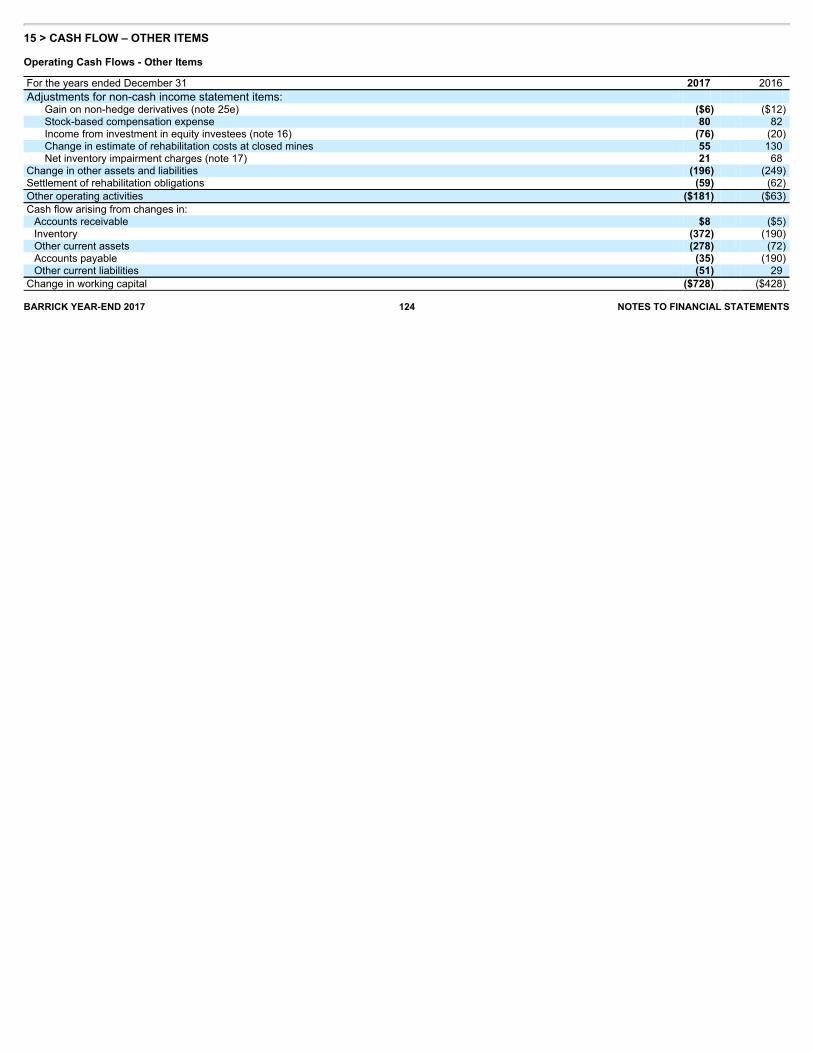
15 > CASH FLOW – OTHER ITEMS
Operating Cash Flows - Other Items
For the years ended December 31 2017 2016 Adjustments for non-cash income statement items:
Gain on non-hedge derivatives (note 25e) ($6) ($12) Stock-based compensation expense 80 82 Income from investment in equity investees (note 16) (76) (20) Change in estimate of rehabilitation costs at closed mines 55 130 Net inventory impairment charges (note 17) 21 68
Change in other assets and liabilities (196) (249) Settlement of rehabilitation obligations (59) (62) Other operating activities ($181) ($63) Cash flow arising from changes in: Accounts receivable $8 ($5) Inventory (372) (190) Other current assets (278) (72) Accounts payable (35) (190) Other current liabilities (51) 29
Change in working capital ($728) ($428) BARRICK YEAR-END 2017 124 NOTES TO FINANCIAL STATEMENTS
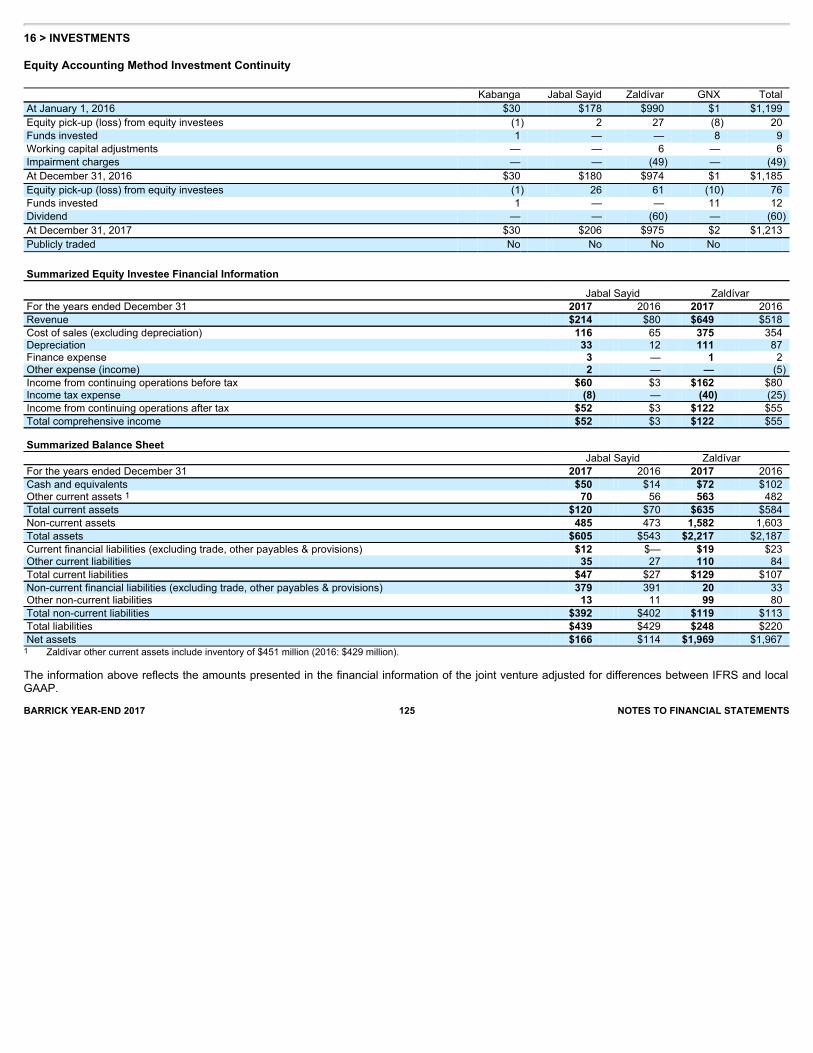
16 > INVESTMENTS
Equity Accounting Method Investment Continuity Kabanga Jabal Sayid Zaldívar GNX Total At January 1, 2016 $30 $178 $990 $1 $1,199 Equity pick-up (loss) from equity investees (1) 2 27 (8) 20 Funds invested 1 — — 8 9 Working capital adjustments — — 6 — 6 Impairment charges — — (49) — (49) At December 31, 2016 $30 $180 $974 $1 $1,185 Equity pick-up (loss) from equity investees (1) 26 61 (10) 76 Funds invested 1 — — 11 12 Dividend — — (60) — (60) At December 31, 2017 $30 $206 $975 $2 $1,213 Publicly traded No No No No
Summarized Equity Investee Financial Information
Jabal Sayid Zaldívar For the years ended December 31 2017 2016 2017 2016 Revenue $214 $80 $649 $518 Cost of sales (excluding depreciation) 116 65 375 354 Depreciation 33 12 111 87 Finance expense 3 — 1 2 Other expense (income) 2 — — (5) Income from continuing operations before tax $60 $3 $162 $80 Income tax expense (8) — (40) (25) Income from continuing operations after tax $52 $3 $122 $55 Total comprehensive income $52 $3 $122 $55
Summarized Balance Sheet Jabal Sayid Zaldívar For the years ended December 31 2017 2016 2017 2016 Cash and equivalents $50 $14 $72 $102 Other current assets 1 70 56 563 482 Total current assets $120 $70 $635 $584 Non-current assets 485 473 1,582 1,603 Total assets $605 $543 $2,217 $2,187 Current financial liabilities (excluding trade, other payables & provisions) $12 $— $19 $23 Other current liabilities 35 27 110 84 Total current liabilities $47 $27 $129 $107 Non-current financial liabilities (excluding trade, other payables & provisions) 379 391 20 33 Other non-current liabilities 13 11 99 80 Total non-current liabilities $392 $402 $119 $113 Total liabilities $439 $429 $248 $220 Net assets $166 $114 $1,969 $1,967 1 Zaldívar other current assets include inventory of $451 million (2016: $429 million).
The information above reflects the amounts presented in the financial information of the joint venture adjusted for differences between IFRS and localGAAP.BARRICK YEAR-END 2017 125 NOTES TO FINANCIAL STATEMENTS
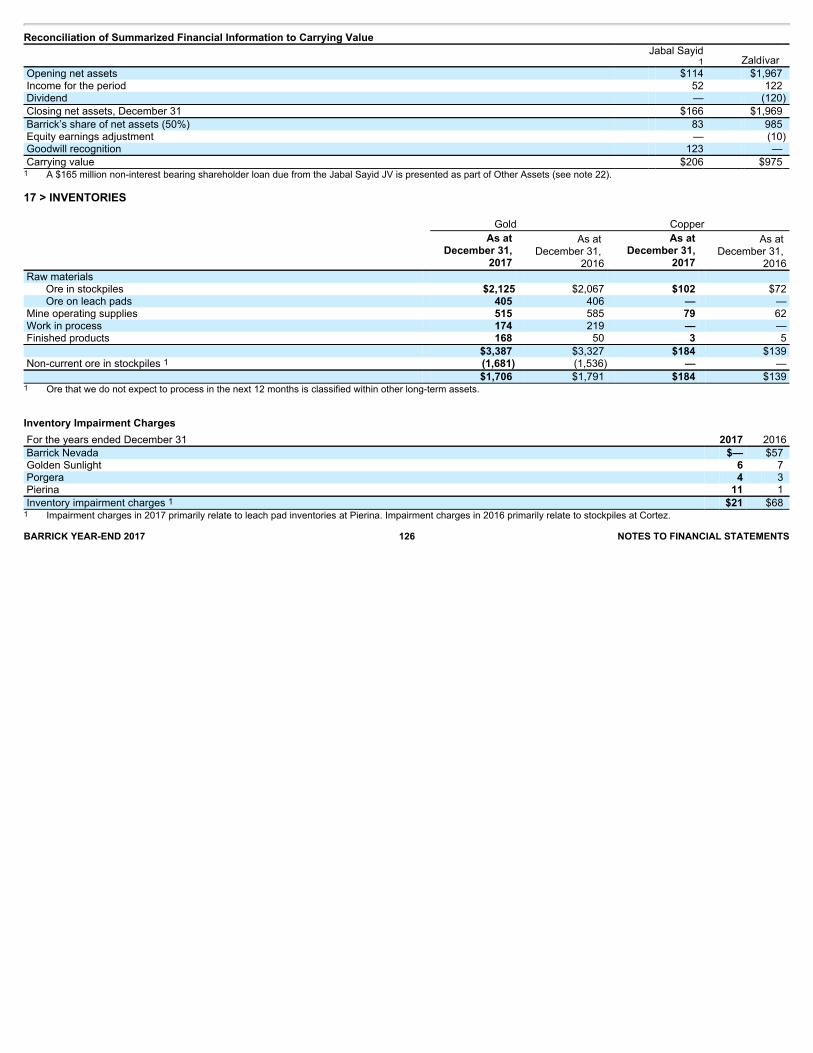
Reconciliation of Summarized Financial Information to Carrying Value
Jabal Sayid
1 Zaldívar Opening net assets $114 $1,967 Income for the period 52 122 Dividend — (120) Closing net assets, December 31 $166 $1,969 Barrick’s share of net assets (50%) 83 985 Equity earnings adjustment — (10) Goodwill recognition 123 — Carrying value $206 $975 1 A $165 million non-interest bearing shareholder loan due from the Jabal Sayid JV is presented as part of Other Assets (see note 22).
17 > INVENTORIES Gold Copper
As at December 31,
2017
As at December 31,
2016
As at December 31,
2017
As at December 31,
2016 Raw materials Ore in stockpiles $2,125 $2,067 $102 $72 Ore on leach pads 405 406 — —
Mine operating supplies 515 585 79 62 Work in process 174 219 — — Finished products 168 50 3 5
$3,387 $3,327 $184 $139 Non-current ore in stockpiles 1 (1,681) (1,536) — — $1,706 $1,791 $184 $139 1 Ore that we do not expect to process in the next 12 months is classified within other long-term assets.
Inventory Impairment Charges
For the years ended December 31 2017 2016 Barrick Nevada $— $57 Golden Sunlight 6 7 Porgera 4 3 Pierina 11 1 Inventory impairment charges 1 $21 $68 1 Impairment charges in 2017 primarily relate to leach pad inventories at Pierina. Impairment charges in 2016 primarily relate to stockpiles at Cortez.BARRICK YEAR-END 2017 126 NOTES TO FINANCIAL STATEMENTS
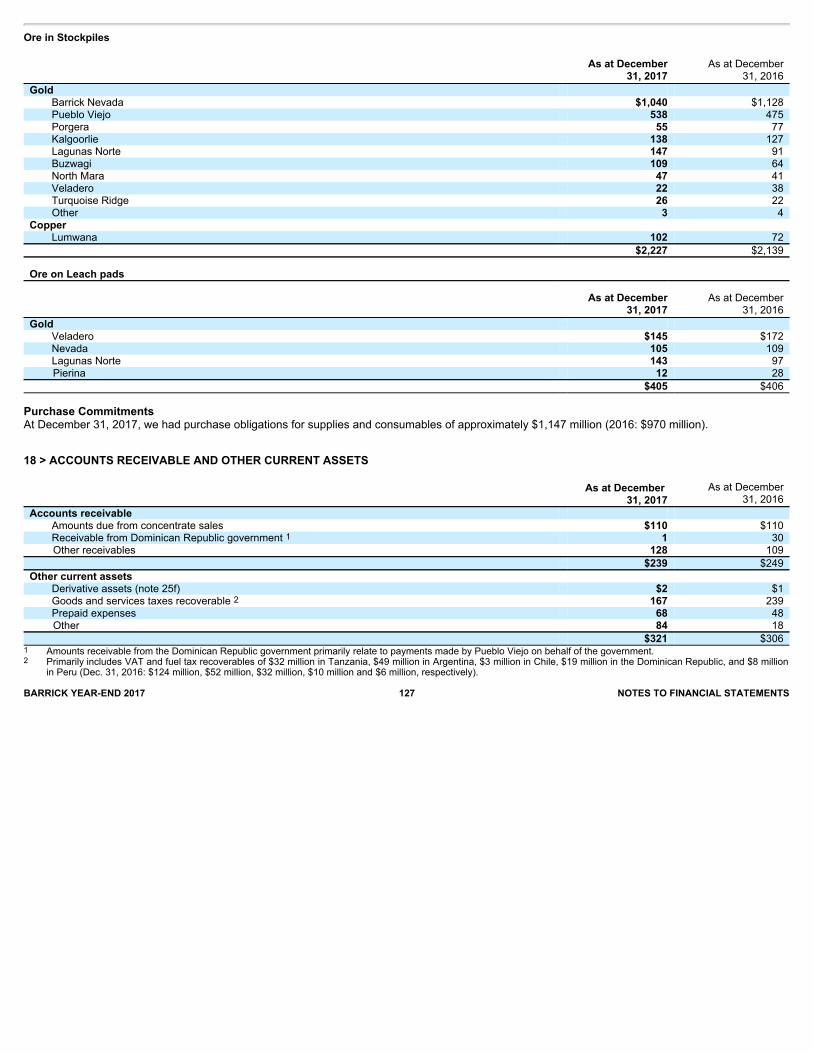
Ore in Stockpiles
As at December
31, 2017 As at December
31, 2016 Gold Barrick Nevada $1,040 $1,128 Pueblo Viejo 538 475 Porgera 55 77 Kalgoorlie 138 127 Lagunas Norte 147 91 Buzwagi 109 64 North Mara 47 41 Veladero 22 38 Turquoise Ridge 26 22 Other 3 4
Copper Lumwana 102 72
$2,227 $2,139
Ore on Leach pads
As at December
31, 2017 As at December
31, 2016 Gold Veladero $145 $172 Nevada 105 109 Lagunas Norte 143 97
Pierina 12 28 $405 $406
Purchase CommitmentsAt December 31, 2017, we had purchase obligations for supplies and consumables of approximately $1,147 million (2016: $970 million).
18 > ACCOUNTS RECEIVABLE AND OTHER CURRENT ASSETS
As at December
31, 2017 As at December
31, 2016 Accounts receivable Amounts due from concentrate sales $110 $110 Receivable from Dominican Republic government 1 1 30
Other receivables 128 109 $239 $249 Other current assets Derivative assets (note 25f) $2 $1 Goods and services taxes recoverable 2 167 239 Prepaid expenses 68 48
Other 84 18 $321 $306 1 Amounts receivable from the Dominican Republic government primarily relate to payments made by Pueblo Viejo on behalf of the government.2 Primarily includes VAT and fuel tax recoverables of $32 million in Tanzania, $49 million in Argentina, $3 million in Chile, $19 million in the Dominican Republic, and $8 million
in Peru (Dec. 31, 2016: $124 million, $52 million, $32 million, $10 million and $6 million, respectively).BARRICK YEAR-END 2017 127 NOTES TO FINANCIAL STATEMENTS
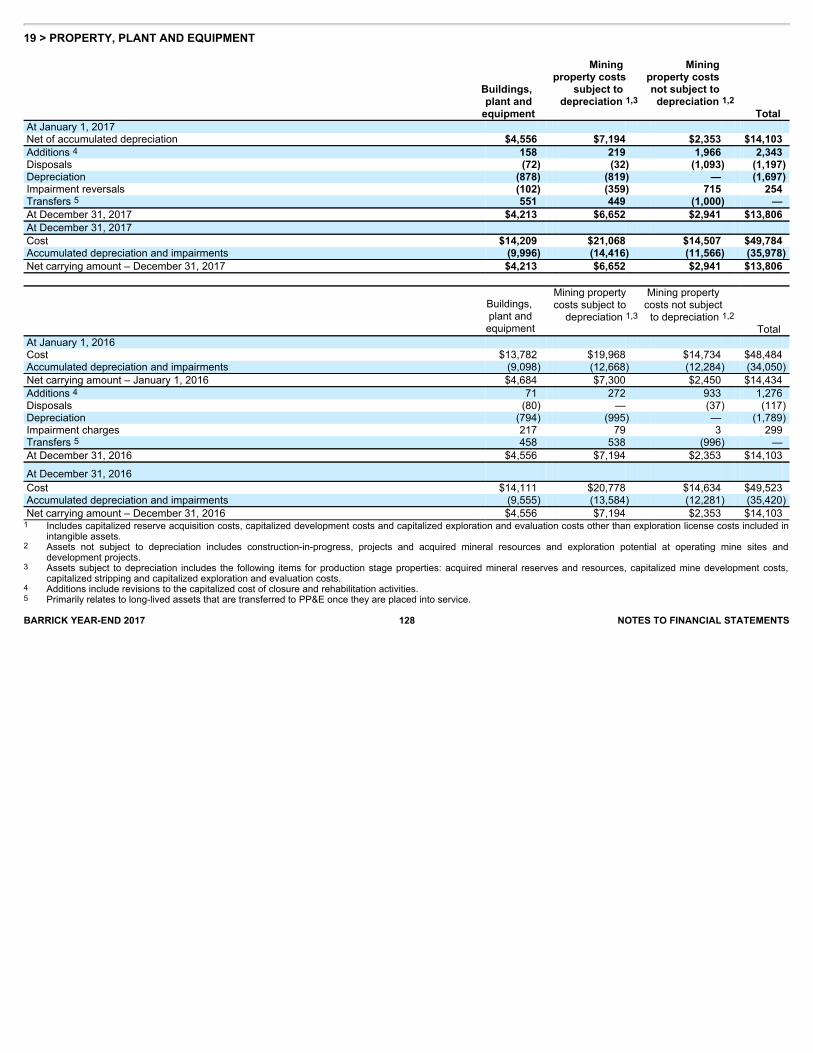
19 > PROPERTY, PLANT AND EQUIPMENT
Buildings, plant and
equipment
Mining property costs
subject to depreciation 1,3
Mining property costs not subject to
depreciation 1,2 Total
At January 1, 2017 Net of accumulated depreciation $4,556 $7,194 $2,353 $14,103 Additions 4 158 219 1,966 2,343 Disposals (72) (32) (1,093) (1,197) Depreciation (878) (819) — (1,697) Impairment reversals (102) (359) 715 254 Transfers 5 551 449 (1,000) — At December 31, 2017 $4,213 $6,652 $2,941 $13,806 At December 31, 2017 Cost $14,209 $21,068 $14,507 $49,784 Accumulated depreciation and impairments (9,996) (14,416) (11,566) (35,978) Net carrying amount – December 31, 2017 $4,213 $6,652 $2,941 $13,806
Buildings, plant and equipment
Mining property costs subject to depreciation 1,3
Mining property costs not subject to depreciation 1,2
Total At January 1, 2016 Cost $13,782 $19,968 $14,734 $48,484 Accumulated depreciation and impairments (9,098) (12,668) (12,284) (34,050) Net carrying amount – January 1, 2016 $4,684 $7,300 $2,450 $14,434 Additions 4 71 272 933 1,276 Disposals (80) — (37) (117) Depreciation (794) (995) — (1,789) Impairment charges 217 79 3 299 Transfers 5 458 538 (996) — At December 31, 2016 $4,556 $7,194 $2,353 $14,103
At December 31, 2016 Cost $14,111 $20,778 $14,634 $49,523 Accumulated depreciation and impairments (9,555) (13,584) (12,281) (35,420) Net carrying amount – December 31, 2016 $4,556 $7,194 $2,353 $14,103 1 Includes capitalized reserve acquisition costs, capitalized development costs and capitalized exploration and evaluation costs other than exploration license costs included in
intangible assets.2 Assets not subject to depreciation includes construction-in-progress, projects and acquired mineral resources and exploration potential at operating mine sites and
development projects.3 Assets subject to depreciation includes the following items for production stage properties: acquired mineral reserves and resources, capitalized mine development costs,
capitalized stripping and capitalized exploration and evaluation costs.4 Additions include revisions to the capitalized cost of closure and rehabilitation activities.5 Primarily relates to long-lived assets that are transferred to PP&E once they are placed into service.BARRICK YEAR-END 2017 128 NOTES TO FINANCIAL STATEMENTS
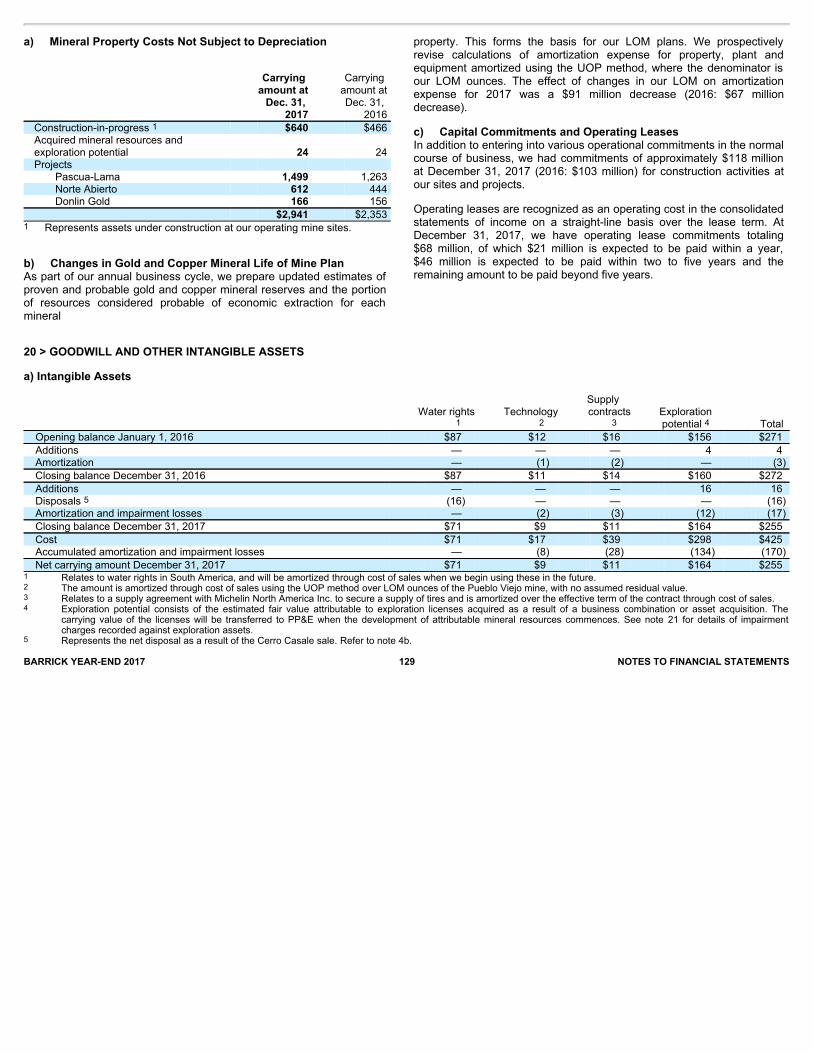
20 > GOODWILL AND OTHER INTANGIBLE ASSETS
a) Intangible Assets
Water rights
1 Technology
2
Supply contracts
3 Exploration potential 4 Total
Opening balance January 1, 2016 $87 $12 $16 $156 $271 Additions — — — 4 4 Amortization — (1) (2) — (3) Closing balance December 31, 2016 $87 $11 $14 $160 $272 Additions — — — 16 16 Disposals 5 (16) — — — (16) Amortization and impairment losses — (2) (3) (12) (17) Closing balance December 31, 2017 $71 $9 $11 $164 $255 Cost $71 $17 $39 $298 $425 Accumulated amortization and impairment losses — (8) (28) (134) (170) Net carrying amount December 31, 2017 $71 $9 $11 $164 $255 1 Relates to water rights in South America, and will be amortized through cost of sales when we begin using these in the future.2 The amount is amortized through cost of sales using the UOP method over LOM ounces of the Pueblo Viejo mine, with no assumed residual value.3 Relates to a supply agreement with Michelin North America Inc. to secure a supply of tires and is amortized over the effective term of the contract through cost of sales.4 Exploration potential consists of the estimated fair value attributable to exploration licenses acquired as a result of a business combination or asset acquisition. The
carrying value of the licenses will be transferred to PP&E when the development of attributable mineral resources commences. See note 21 for details of impairmentcharges recorded against exploration assets.
5 Represents the net disposal as a result of the Cerro Casale sale. Refer to note 4b.BARRICK YEAR-END 2017 129 NOTES TO FINANCIAL STATEMENTS
a) Mineral Property Costs Not Subject to Depreciation
Carrying amount at
Dec. 31, 2017
Carrying amount atDec. 31,
2016 Construction-in-progress 1 $640 $466 Acquired mineral resources andexploration potential 24 24 Projects
Pascua-Lama 1,499 1,263 Norte Abierto 612 444 Donlin Gold 166 156
$2,941 $2,353 1 Represents assets under construction at our operating mine sites.
b) Changes in Gold and Copper Mineral Life of Mine PlanAs part of our annual business cycle, we prepare updated estimates ofproven and probable gold and copper mineral reserves and the portionof resources considered probable of economic extraction for eachmineral
property. This forms the basis for our LOM plans. We prospectivelyrevise calculations of amortization expense for property, plant andequipment amortized using the UOP method, where the denominator isour LOM ounces. The effect of changes in our LOM on amortizationexpense for 2017 was a $91 million decrease (2016: $67 milliondecrease).
c) Capital Commitments and Operating LeasesIn addition to entering into various operational commitments in the normalcourse of business, we had commitments of approximately $118 millionat December 31, 2017 (2016: $103 million) for construction activities atour sites and projects.
Operating leases are recognized as an operating cost in the consolidatedstatements of income on a straight-line basis over the lease term. AtDecember 31, 2017, we have operating lease commitments totaling$68 million, of which $21 million is expected to be paid within a year,$46 million is expected to be paid within two to five years and theremaining amount to be paid beyond five years.
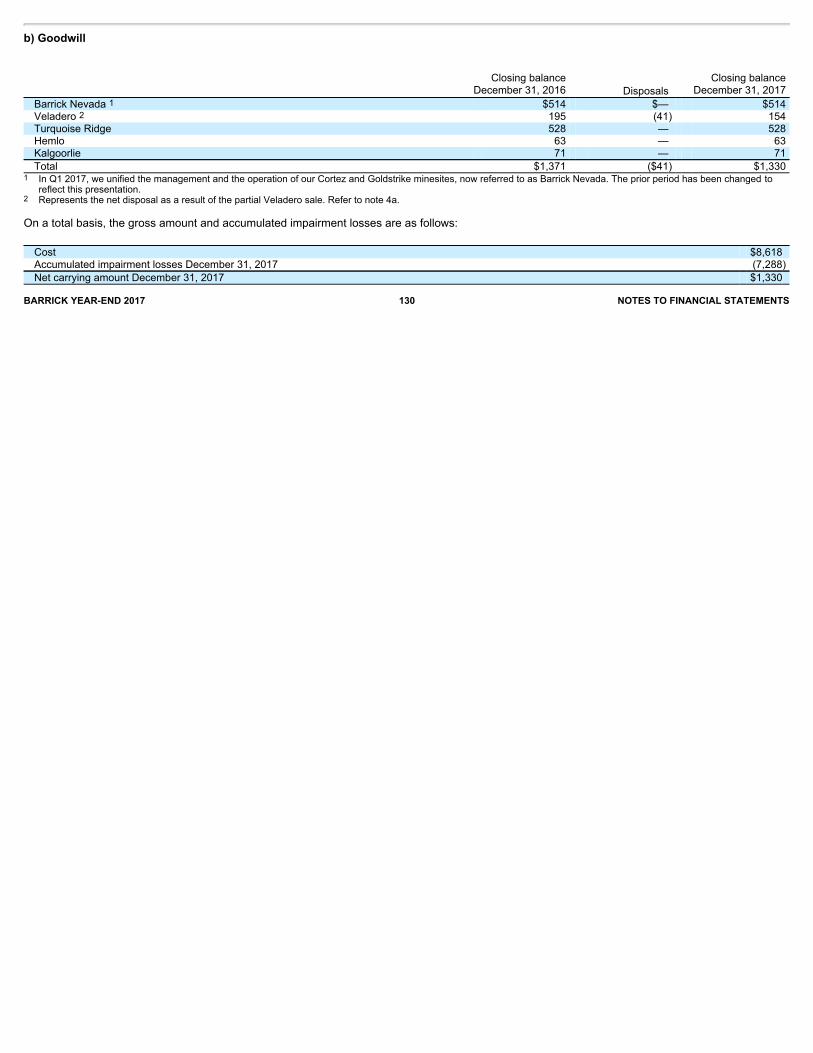
b) Goodwill
Closing balanceDecember 31, 2016 Disposals
Closing balance December 31, 2017
Barrick Nevada 1 $514 $— $514 Veladero 2 195 (41) 154 Turquoise Ridge 528 — 528 Hemlo 63 — 63 Kalgoorlie 71 — 71 Total $1,371 ($41) $1,330
1 In Q1 2017, we unified the management and the operation of our Cortez and Goldstrike minesites, now referred to as Barrick Nevada. The prior period has been changed toreflect this presentation.
2 Represents the net disposal as a result of the partial Veladero sale. Refer to note 4a.
On a total basis, the gross amount and accumulated impairment losses are as follows:Cost $8,618 Accumulated impairment losses December 31, 2017 (7,288) Net carrying amount December 31, 2017 $1,330
BARRICK YEAR-END 2017 130 NOTES TO FINANCIAL STATEMENTS
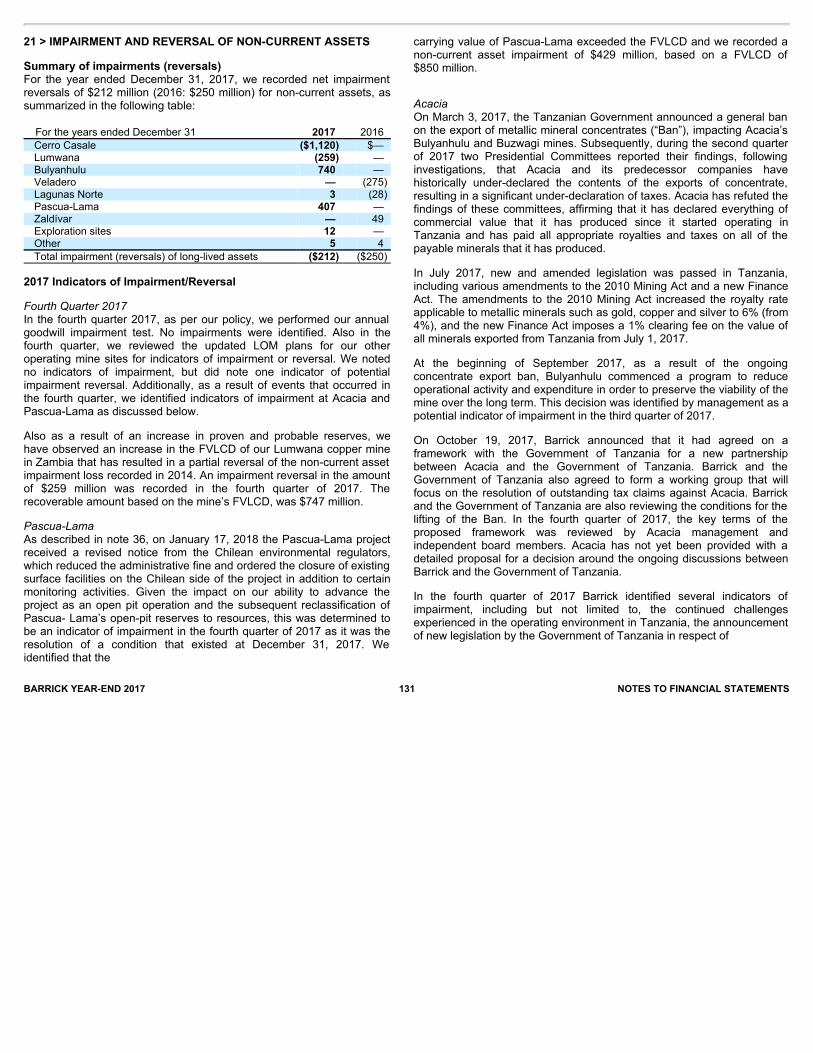
BARRICK YEAR-END 2017 131 NOTES TO FINANCIAL STATEMENTS
21 > IMPAIRMENT AND REVERSAL OF NON-CURRENT ASSETS
Summary of impairments (reversals)For the year ended December 31, 2017, we recorded net impairmentreversals of $212 million (2016: $250 million) for non-current assets, assummarized in the following table: For the years ended December 31 2017 2016 Cerro Casale ($1,120) $— Lumwana (259) — Bulyanhulu 740 — Veladero — (275) Lagunas Norte 3 (28) Pascua-Lama 407 — Zaldívar — 49 Exploration sites 12 — Other 5 4 Total impairment (reversals) of long-lived assets ($212) ($250)
2017 Indicators of Impairment/Reversal
Fourth Quarter 2017In the fourth quarter 2017, as per our policy, we performed our annualgoodwill impairment test. No impairments were identified. Also in thefourth quarter, we reviewed the updated LOM plans for our otheroperating mine sites for indicators of impairment or reversal. We notedno indicators of impairment, but did note one indicator of potentialimpairment reversal. Additionally, as a result of events that occurred inthe fourth quarter, we identified indicators of impairment at Acacia andPascua-Lama as discussed below.
Also as a result of an increase in proven and probable reserves, wehave observed an increase in the FVLCD of our Lumwana copper minein Zambia that has resulted in a partial reversal of the non-current assetimpairment loss recorded in 2014. An impairment reversal in the amountof $259 million was recorded in the fourth quarter of 2017. Therecoverable amount based on the mine’s FVLCD, was $747 million.
Pascua-LamaAs described in note 36, on January 17, 2018 the Pascua-Lama projectreceived a revised notice from the Chilean environmental regulators,which reduced the administrative fine and ordered the closure of existingsurface facilities on the Chilean side of the project in addition to certainmonitoring activities. Given the impact on our ability to advance theproject as an open pit operation and the subsequent reclassification ofPascua- Lama’s open-pit reserves to resources, this was determined tobe an indicator of impairment in the fourth quarter of 2017 as it was theresolution of a condition that existed at December 31, 2017. Weidentified that the
carrying value of Pascua-Lama exceeded the FVLCD and we recorded anon-current asset impairment of $429 million, based on a FVLCD of$850 million.
AcaciaOn March 3, 2017, the Tanzanian Government announced a general banon the export of metallic mineral concentrates (“Ban”), impacting Acacia’sBulyanhulu and Buzwagi mines. Subsequently, during the second quarterof 2017 two Presidential Committees reported their findings, followinginvestigations, that Acacia and its predecessor companies havehistorically under-declared the contents of the exports of concentrate,resulting in a significant under-declaration of taxes. Acacia has refuted thefindings of these committees, affirming that it has declared everything ofcommercial value that it has produced since it started operating inTanzania and has paid all appropriate royalties and taxes on all of thepayable minerals that it has produced.
In July 2017, new and amended legislation was passed in Tanzania,including various amendments to the 2010 Mining Act and a new FinanceAct. The amendments to the 2010 Mining Act increased the royalty rateapplicable to metallic minerals such as gold, copper and silver to 6% (from4%), and the new Finance Act imposes a 1% clearing fee on the value ofall minerals exported from Tanzania from July 1, 2017.
At the beginning of September 2017, as a result of the ongoingconcentrate export ban, Bulyanhulu commenced a program to reduceoperational activity and expenditure in order to preserve the viability of themine over the long term. This decision was identified by management as apotential indicator of impairment in the third quarter of 2017.
On October 19, 2017, Barrick announced that it had agreed on aframework with the Government of Tanzania for a new partnershipbetween Acacia and the Government of Tanzania. Barrick and theGovernment of Tanzania also agreed to form a working group that willfocus on the resolution of outstanding tax claims against Acacia. Barrickand the Government of Tanzania are also reviewing the conditions for thelifting of the Ban. In the fourth quarter of 2017, the key terms of theproposed framework was reviewed by Acacia management andindependent board members. Acacia has not yet been provided with adetailed proposal for a decision around the ongoing discussions betweenBarrick and the Government of Tanzania.
In the fourth quarter of 2017 Barrick identified several indicators ofimpairment, including but not limited to, the continued challengesexperienced in the operating environment in Tanzania, the announcementof new legislation by the Government of Tanzania in respect of
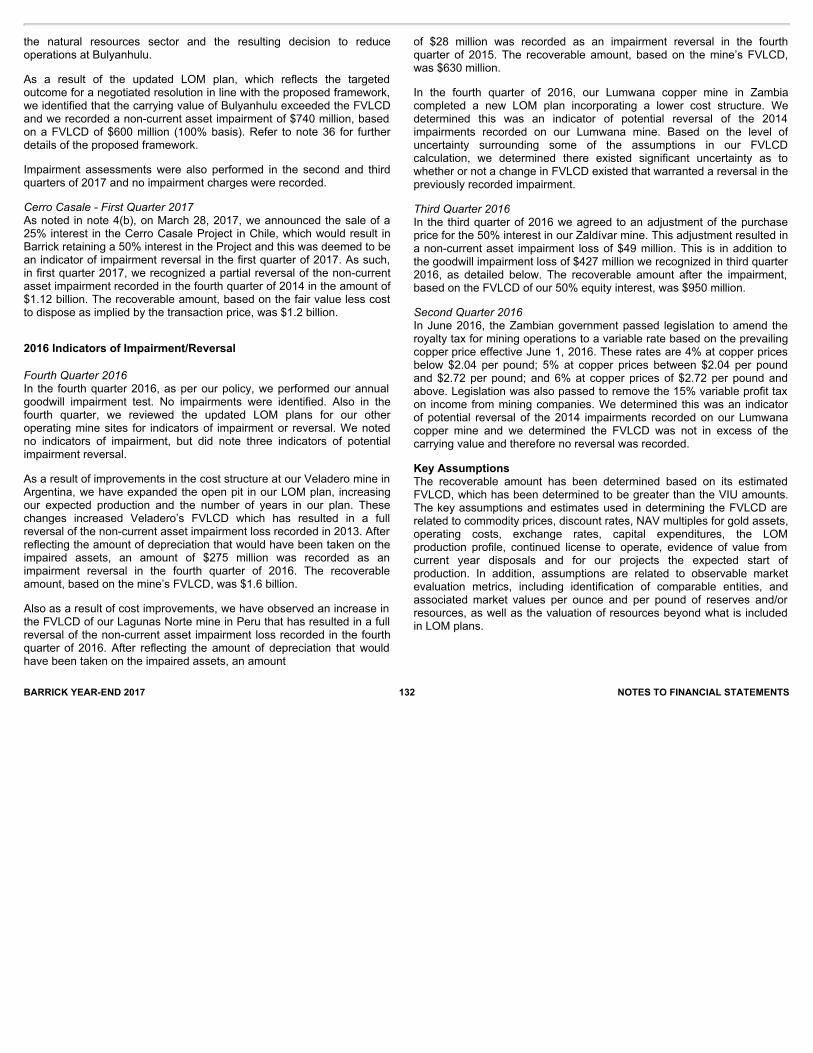
BARRICK YEAR-END 2017 132 NOTES TO FINANCIAL STATEMENTS
the natural resources sector and the resulting decision to reduceoperations at Bulyanhulu.
As a result of the updated LOM plan, which reflects the targetedoutcome for a negotiated resolution in line with the proposed framework,we identified that the carrying value of Bulyanhulu exceeded the FVLCDand we recorded a non-current asset impairment of $740 million, basedon a FVLCD of $600 million (100% basis). Refer to note 36 for furtherdetails of the proposed framework.
Impairment assessments were also performed in the second and thirdquarters of 2017 and no impairment charges were recorded.
Cerro Casale - First Quarter 2017As noted in note 4(b), on March 28, 2017, we announced the sale of a25% interest in the Cerro Casale Project in Chile, which would result inBarrick retaining a 50% interest in the Project and this was deemed to bean indicator of impairment reversal in the first quarter of 2017. As such,in first quarter 2017, we recognized a partial reversal of the non-currentasset impairment recorded in the fourth quarter of 2014 in the amount of$1.12 billion. The recoverable amount, based on the fair value less costto dispose as implied by the transaction price, was $1.2 billion.
2016 Indicators of Impairment/Reversal
Fourth Quarter 2016In the fourth quarter 2016, as per our policy, we performed our annualgoodwill impairment test. No impairments were identified. Also in thefourth quarter, we reviewed the updated LOM plans for our otheroperating mine sites for indicators of impairment or reversal. We notedno indicators of impairment, but did note three indicators of potentialimpairment reversal.
As a result of improvements in the cost structure at our Veladero mine inArgentina, we have expanded the open pit in our LOM plan, increasingour expected production and the number of years in our plan. Thesechanges increased Veladero’s FVLCD which has resulted in a fullreversal of the non-current asset impairment loss recorded in 2013. Afterreflecting the amount of depreciation that would have been taken on theimpaired assets, an amount of $275 million was recorded as animpairment reversal in the fourth quarter of 2016. The recoverableamount, based on the mine’s FVLCD, was $1.6 billion.
Also as a result of cost improvements, we have observed an increase inthe FVLCD of our Lagunas Norte mine in Peru that has resulted in a fullreversal of the non-current asset impairment loss recorded in the fourthquarter of 2016. After reflecting the amount of depreciation that wouldhave been taken on the impaired assets, an amount
of $28 million was recorded as an impairment reversal in the fourthquarter of 2015. The recoverable amount, based on the mine’s FVLCD,was $630 million.
In the fourth quarter of 2016, our Lumwana copper mine in Zambiacompleted a new LOM plan incorporating a lower cost structure. Wedetermined this was an indicator of potential reversal of the 2014impairments recorded on our Lumwana mine. Based on the level ofuncertainty surrounding some of the assumptions in our FVLCDcalculation, we determined there existed significant uncertainty as towhether or not a change in FVLCD existed that warranted a reversal in thepreviously recorded impairment.
Third Quarter 2016In the third quarter of 2016 we agreed to an adjustment of the purchaseprice for the 50% interest in our Zaldívar mine. This adjustment resulted ina non-current asset impairment loss of $49 million. This is in addition tothe goodwill impairment loss of $427 million we recognized in third quarter2016, as detailed below. The recoverable amount after the impairment,based on the FVLCD of our 50% equity interest, was $950 million.
Second Quarter 2016In June 2016, the Zambian government passed legislation to amend theroyalty tax for mining operations to a variable rate based on the prevailingcopper price effective June 1, 2016. These rates are 4% at copper pricesbelow $2.04 per pound; 5% at copper prices between $2.04 per poundand $2.72 per pound; and 6% at copper prices of $2.72 per pound andabove. Legislation was also passed to remove the 15% variable profit taxon income from mining companies. We determined this was an indicatorof potential reversal of the 2014 impairments recorded on our Lumwanacopper mine and we determined the FVLCD was not in excess of thecarrying value and therefore no reversal was recorded.
Key AssumptionsThe recoverable amount has been determined based on its estimatedFVLCD, which has been determined to be greater than the VIU amounts.The key assumptions and estimates used in determining the FVLCD arerelated to commodity prices, discount rates, NAV multiples for gold assets,operating costs, exchange rates, capital expenditures, the LOMproduction profile, continued license to operate, evidence of value fromcurrent year disposals and for our projects the expected start ofproduction. In addition, assumptions are related to observable marketevaluation metrics, including identification of comparable entities, andassociated market values per ounce and per pound of reserves and/orresources, as well as the valuation of resources beyond what is includedin LOM plans.

BARRICK YEAR-END 2017 133 NOTES TO FINANCIAL STATEMENTS
GoldFor the gold segments where a recoverable amount was required to bedetermined, FVLCD was determined by calculating the net present value(“NPV”) of the future cash flows expected to be generated by the minesand projects within the segments (level 3 of the fair value hierarchy). Theestimates of future cash flows were derived from the most recent LOMplans and, where the LOM plans exclude a material portion of totalreserves and resources, we assign value to reserves and resources notconsidered in these models. Based on observable market or publiclyavailable data, including forward prices and equity sell-side analystforecasts, we make an assumption of future gold and silver prices toestimate future revenues. The future cash flows for each gold mine arediscounted using a real weighted average cost of capital (“WACC”),which reflects specific market risk factors for each mine. Some goldcompanies trade at a market capitalization greater than the NPV of theirexpected cash flows. Market participants describe this as a “NAVmultiple”, which represents the multiple applied to the NPV to arrive atthe trading price. The NAV multiple is generally understood to takeaccount of a variety of additional value factors such as the explorationpotential of the mineral property, namely the ability to find and producemore metal than what is currently included in the LOM plan or reserveand resource estimates, and the benefit of gold price optionality. As aresult, we applied a specific NAV multiple to the NPV of each CGUwithin each gold segment based on the NAV multiples observed in themarket in recent periods and that we judged to be appropriate to theCGU.
Pascua-LamaThe FVLCD for Pascua-Lama was determined by consideringobservable market values for comparable assets expressed as dollar perounce of measured and indicated resources (level 3 of the fair valuehierarchy). We used the market approach as the LOM for Pascua-Lamahas significant uncertainty with respect to the scope and estimatedtimeline for the project. The observable market values were adjusted,where appropriate, for country risk if the comparable asset was in adifferent country.
CopperFor our copper operating segments, the FVLCD for each of the CGUswas determined based on the NPV of future cash flows expected to begenerated using the most recent LOM plans (level 3 of the fair valuehierarchy). Based on observable market or publicly available dataincluding spot and forward prices and equity sell-side analyst consensus,we make an assumption of future copper prices to estimate futurerevenues. The future cash flows for each copper mine are discountedusing a WACC depending on the location and market risk factors foreach mine.
AssumptionsOur gold price assumptions used in our 2017 impairment testing is $1,200per ounce. Our gold price assumptions used in our 2016 impairmenttesting were 2017: $1,050 per ounce and 2018+: $1,200 per ounce. Theother key assumptions used in our impairment testing, based on theCGUs tested in each year, are summarized in the table below: 2017 2016 Copper price per lb (long-term) $2.75 $2.75 WACC - gold (range) 3%-11% 3%-6% WACC - gold (avg) 6% 4% WACC - copper 9% 9% NAV multiple - gold (avg) 1.2 1.2 LOM years - gold (avg) 17 15 Value per ounce of gold $30 - $55 n/a Value per ounce of silver $0.41 - $0.76 n/a
SensitivitiesShould there be a significant increase or decline in commodity prices, wewould take actions to assess the implications on our life of mine plans,including the determination of reserves and resources, and theappropriate cost structure for the operating segments. The recoverableamount of the CGUs would be affected by these changes and also beimpacted by other market factors such as changes in net asset valuemultiples and the value per ounce/pound of comparable market entities.
We performed a sensitivity analysis on each CGU that was tested as partof the goodwill impairment test, as well as those CGUs which have had animpairment or impairment reversal in recent years. We flexed the gold andcopper prices and the WACC, which are the most significant assumptionsthat impact the impairment calculations. We first assumed a +/- $100 perounce change in our gold price assumptions or a +/- $0.25 per poundchange in copper price assumptions, while holding all other assumptionsconstant. We then assumed a +/- 1% change in our WACC, independentfrom the change in gold or copper prices, while holding all otherassumptions constant. These sensitivities help to determine thetheoretical impairment losses or impairment reversals that would berecorded with these changes in gold or copper prices and WACC. If thegold price per ounce was decreased by $100, a further non-current assetimpairment of $172 million, net of tax, would be recognized forBulyanhulu, with a similar increase in the gold price per ounce resulting ina reduction in the impairment of $172 million. The partial reversal of thenon-current asset impairment reversal recorded for Lumwana would notbe recognized if the copper price per ounce was decreased by $0.25 andwould result in the recognition of a further impairment reversal of$303 million if the copper price per ounce was increased by $0.25.Lumwana was otherwise not affected by the sensitivity analysis.
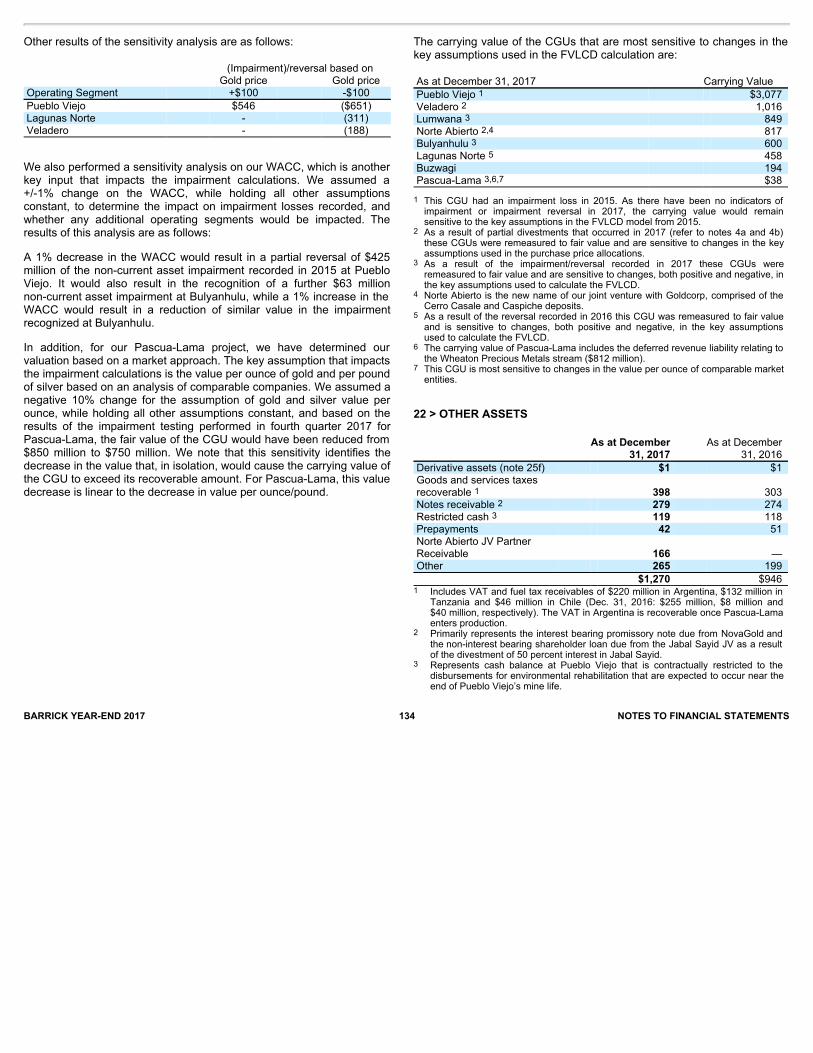
BARRICK YEAR-END 2017 134 NOTES TO FINANCIAL STATEMENTS
Other results of the sensitivity analysis are as follows: (Impairment)/reversal based on Gold price Gold price Operating Segment +$100 -$100 Pueblo Viejo $546 ($651) Lagunas Norte - (311) Veladero - (188)
We also performed a sensitivity analysis on our WACC, which is anotherkey input that impacts the impairment calculations. We assumed a+/-1% change on the WACC, while holding all other assumptionsconstant, to determine the impact on impairment losses recorded, andwhether any additional operating segments would be impacted. Theresults of this analysis are as follows:
A 1% decrease in the WACC would result in a partial reversal of $425million of the non-current asset impairment recorded in 2015 at PuebloViejo. It would also result in the recognition of a further $63 millionnon-current asset impairment at Bulyanhulu, while a 1% increase in theWACC would result in a reduction of similar value in the impairmentrecognized at Bulyanhulu.
In addition, for our Pascua-Lama project, we have determined ourvaluation based on a market approach. The key assumption that impactsthe impairment calculations is the value per ounce of gold and per poundof silver based on an analysis of comparable companies. We assumed anegative 10% change for the assumption of gold and silver value perounce, while holding all other assumptions constant, and based on theresults of the impairment testing performed in fourth quarter 2017 forPascua-Lama, the fair value of the CGU would have been reduced from$850 million to $750 million. We note that this sensitivity identifies thedecrease in the value that, in isolation, would cause the carrying value ofthe CGU to exceed its recoverable amount. For Pascua-Lama, this valuedecrease is linear to the decrease in value per ounce/pound.
The carrying value of the CGUs that are most sensitive to changes in thekey assumptions used in the FVLCD calculation are: As at December 31, 2017 Carrying Value Pueblo Viejo 1 $3,077 Veladero 2 1,016 Lumwana 3 849 Norte Abierto 2,4 817 Bulyanhulu 3 600 Lagunas Norte 5 458 Buzwagi 194 Pascua-Lama 3,6,7 $38 1 This CGU had an impairment loss in 2015. As there have been no indicators ofimpairment or impairment reversal in 2017, the carrying value would remainsensitive to the key assumptions in the FVLCD model from 2015.
2 As a result of partial divestments that occurred in 2017 (refer to notes 4a and 4b)these CGUs were remeasured to fair value and are sensitive to changes in the keyassumptions used in the purchase price allocations.
3 As a result of the impairment/reversal recorded in 2017 these CGUs wereremeasured to fair value and are sensitive to changes, both positive and negative, inthe key assumptions used to calculate the FVLCD.
4 Norte Abierto is the new name of our joint venture with Goldcorp, comprised of theCerro Casale and Caspiche deposits.
5 As a result of the reversal recorded in 2016 this CGU was remeasured to fair valueand is sensitive to changes, both positive and negative, in the key assumptionsused to calculate the FVLCD.
6 The carrying value of Pascua-Lama includes the deferred revenue liability relating tothe Wheaton Precious Metals stream ($812 million).
7 This CGU is most sensitive to changes in the value per ounce of comparable marketentities.
22 > OTHER ASSETS
As at December
31, 2017 As at December
31, 2016 Derivative assets (note 25f) $1 $1 Goods and services taxes recoverable 1 398 303 Notes receivable 2 279 274 Restricted cash 3 119 118 Prepayments 42 51 Norte Abierto JV Partner Receivable 166 — Other 265 199 $1,270 $946 1 Includes VAT and fuel tax receivables of $220 million in Argentina, $132 million in
Tanzania and $46 million in Chile (Dec. 31, 2016: $255 million, $8 million and$40 million, respectively). The VAT in Argentina is recoverable once Pascua-Lamaenters production.
2 Primarily represents the interest bearing promissory note due from NovaGold andthe non-interest bearing shareholder loan due from the Jabal Sayid JV as a resultof the divestment of 50 percent interest in Jabal Sayid.
3 Represents cash balance at Pueblo Viejo that is contractually restricted to thedisbursements for environmental rehabilitation that are expected to occur near theend of Pueblo Viejo’s mine life.
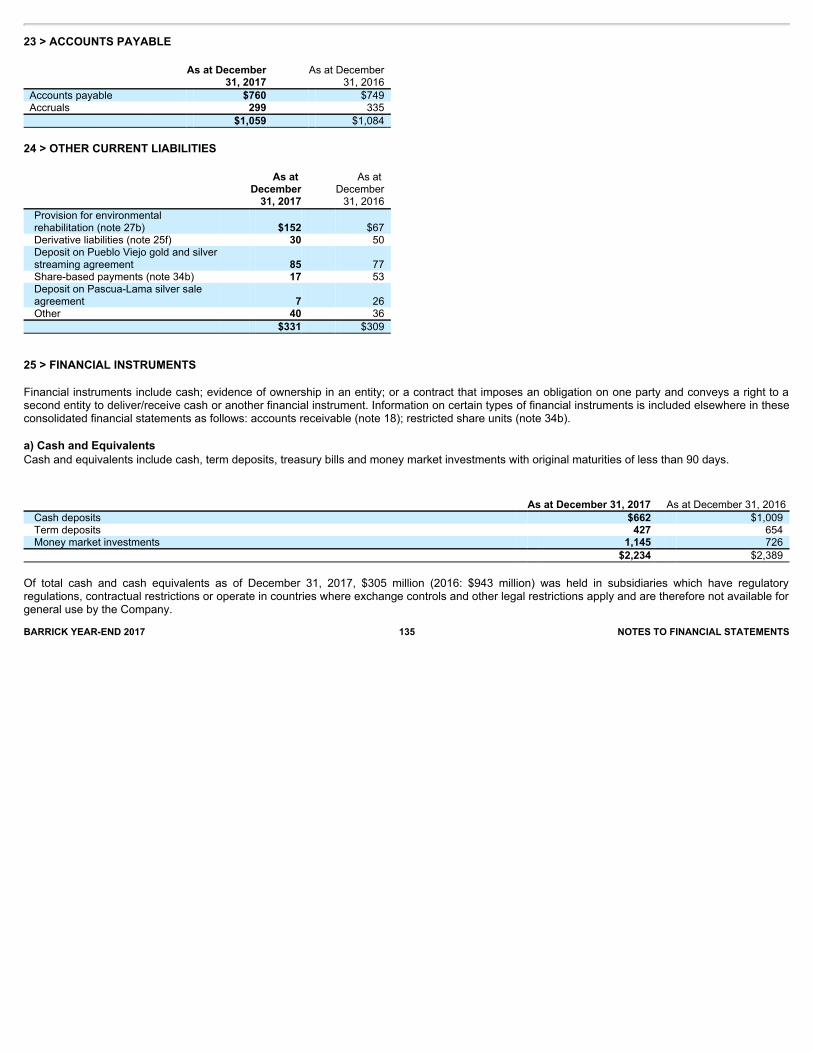
25 > FINANCIAL INSTRUMENTS
Financial instruments include cash; evidence of ownership in an entity; or a contract that imposes an obligation on one party and conveys a right to asecond entity to deliver/receive cash or another financial instrument. Information on certain types of financial instruments is included elsewhere in theseconsolidated financial statements as follows: accounts receivable (note 18); restricted share units (note 34b).
a) Cash and EquivalentsCash and equivalents include cash, term deposits, treasury bills and money market investments with original maturities of less than 90 days.
As at December 31, 2017 As at December 31, 2016 Cash deposits $662 $1,009 Term deposits 427 654 Money market investments 1,145 726
$2,234 $2,389
Of total cash and cash equivalents as of December 31, 2017, $305 million (2016: $943 million) was held in subsidiaries which have regulatoryregulations, contractual restrictions or operate in countries where exchange controls and other legal restrictions apply and are therefore not available forgeneral use by the Company.BARRICK YEAR-END 2017 135 NOTES TO FINANCIAL STATEMENTS
23 > ACCOUNTS PAYABLE
As at December
31, 2017 As at December
31, 2016 Accounts payable $760 $749 Accruals 299 335 $1,059 $1,084
24 > OTHER CURRENT LIABILITIES
As at December
31, 2017
As at December 31, 2016
Provision for environmentalrehabilitation (note 27b) $152 $67 Derivative liabilities (note 25f) 30 50 Deposit on Pueblo Viejo gold and silverstreaming agreement 85 77 Share-based payments (note 34b) 17 53 Deposit on Pascua-Lama silver saleagreement 7 26 Other 40 36
$331 $309
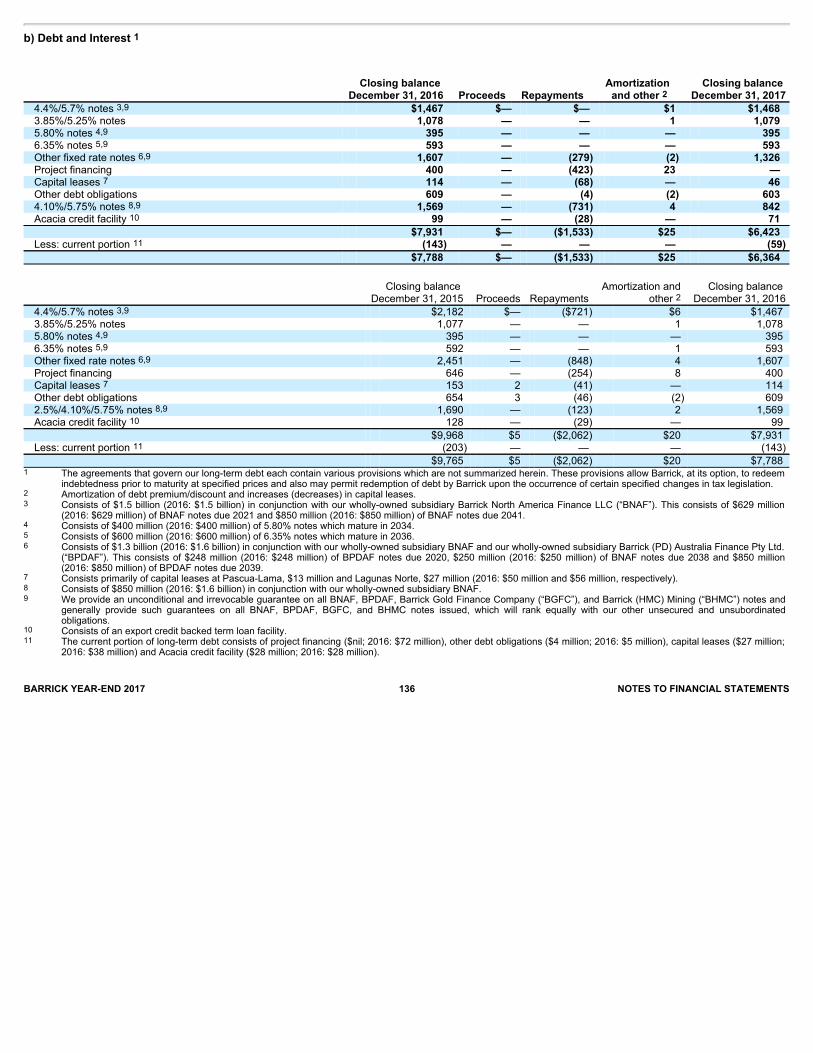
b) Debt and Interest 1
Closing balance December 31, 2016 Proceeds Repayments
Amortization and other 2
Closing balance December 31, 2017
4.4%/5.7% notes 3,9 $1,467 $— $— $1 $1,468 3.85%/5.25% notes 1,078 — — 1 1,079 5.80% notes 4,9 395 — — — 395 6.35% notes 5,9 593 — — — 593 Other fixed rate notes 6,9 1,607 — (279) (2) 1,326 Project financing 400 — (423) 23 — Capital leases 7 114 — (68) — 46 Other debt obligations 609 — (4) (2) 603 4.10%/5.75% notes 8,9 1,569 — (731) 4 842 Acacia credit facility 10 99 — (28) — 71
$7,931 $— ($1,533) $25 $6,423 Less: current portion 11 (143) — — — (59)
$7,788 $— ($1,533) $25 $6,364
Closing balance
December 31, 2015 Proceeds Repayments Amortization and
other 2 Closing balance
December 31, 2016 4.4%/5.7% notes 3,9 $2,182 $— ($721) $6 $1,467 3.85%/5.25% notes 1,077 — — 1 1,078 5.80% notes 4,9 395 — — — 395 6.35% notes 5,9 592 — — 1 593 Other fixed rate notes 6,9 2,451 — (848) 4 1,607 Project financing 646 — (254) 8 400 Capital leases 7 153 2 (41) — 114 Other debt obligations 654 3 (46) (2) 609 2.5%/4.10%/5.75% notes 8,9 1,690 — (123) 2 1,569 Acacia credit facility 10 128 — (29) — 99
$9,968 $5 ($2,062) $20 $7,931 Less: current portion 11 (203) — — — (143)
$9,765 $5 ($2,062) $20 $7,788 1 The agreements that govern our long-term debt each contain various provisions which are not summarized herein. These provisions allow Barrick, at its option, to redeem
indebtedness prior to maturity at specified prices and also may permit redemption of debt by Barrick upon the occurrence of certain specified changes in tax legislation. 2 Amortization of debt premium/discount and increases (decreases) in capital leases. 3 Consists of $1.5 billion (2016: $1.5 billion) in conjunction with our wholly-owned subsidiary Barrick North America Finance LLC (“BNAF”). This consists of $629 million
(2016: $629 million) of BNAF notes due 2021 and $850 million (2016: $850 million) of BNAF notes due 2041. 4 Consists of $400 million (2016: $400 million) of 5.80% notes which mature in 2034. 5 Consists of $600 million (2016: $600 million) of 6.35% notes which mature in 2036. 6 Consists of $1.3 billion (2016: $1.6 billion) in conjunction with our wholly-owned subsidiary BNAF and our wholly-owned subsidiary Barrick (PD) Australia Finance Pty Ltd.
(“BPDAF”). This consists of $248 million (2016: $248 million) of BPDAF notes due 2020, $250 million (2016: $250 million) of BNAF notes due 2038 and $850 million(2016: $850 million) of BPDAF notes due 2039.
7 Consists primarily of capital leases at Pascua-Lama, $13 million and Lagunas Norte, $27 million (2016: $50 million and $56 million, respectively). 8 Consists of $850 million (2016: $1.6 billion) in conjunction with our wholly-owned subsidiary BNAF. 9 We provide an unconditional and irrevocable guarantee on all BNAF, BPDAF, Barrick Gold Finance Company (“BGFC”), and Barrick (HMC) Mining (“BHMC”) notes and
generally provide such guarantees on all BNAF, BPDAF, BGFC, and BHMC notes issued, which will rank equally with our other unsecured and unsubordinatedobligations.
10 Consists of an export credit backed term loan facility. 11 The current portion of long-term debt consists of project financing ($nil; 2016: $72 million), other debt obligations ($4 million; 2016: $5 million), capital leases ($27 million;
2016: $38 million) and Acacia credit facility ($28 million; 2016: $28 million).
BARRICK YEAR-END 2017 136 NOTES TO FINANCIAL STATEMENTS
BARRICK YEAR-END 2017 137 NOTES TO FINANCIAL STATEMENTS
1.75%/2.9%/4.4%/5.7% NotesIn June 2011, BNAF issued an aggregate of $4.0 billion in debtsecurities comprised of: $700 million of 1.75% notes that had an originalmaturity date in 2014 and $1.1 billion of 2.90% notes that had an originalmaturity date in 2016 issued by Barrick (collectively, the “Barrick Notes”)as well as $1.35 billion of 4.40% notes that mature in 2021 and$850 million of 5.70% notes that mature in 2041 issued by BNAF(collectively, the “BNAF Notes”). Barrick provides an unconditional andirrevocable guarantee of the BNAF Notes. The Barrick Notes and theguarantee in respect of the BNAF Notes will rank equally with Barrick’sother unsecured and unsubordinated obligations.
During 2013, the entire balance ($700 million) of the 1.75% notes wasrepaid along with $871 million of the $1.1 billion of 2.9% notes. During2015, the remainder ($229 million) of the $1.1 billion of 2.9% notes wasrepaid. During 2016, $721 million of the $1.35 billion of the 4.4% noteswas repaid.
3.85% and 5.25% NotesOn April 3, 2012, we issued an aggregate of $2 billion in debt securitiescomprised of $1.25 billion of 3.85% notes that mature in 2022 and$750 million of 5.25% notes that mature in 2042. During 2015,$913 million of the 3.85% notes was repaid.
Other Fixed Rate NotesOn October 16, 2009, we issued two tranches of debentures totaling$1.25 billion through our wholly-owned indirect subsidiary Barrick (PD)Australia Finance Pty Ltd. (“BPDAF”) consisting of $850 million of30-year notes with a coupon rate of 5.95%, and $400 million of 10-yearnotes with a coupon rate of 4.95%. We also provide an unconditionaland irrevocable guarantee of these payments, which rank equally withour other unsecured and unsubordinated obligations. During 2016,$152 million of the $400 million of the 4.95% notes was repaid.
On March 19, 2009, we issued an aggregate of $750 million of 10-yearnotes with a coupon rate of 6.95% for general corporate purposes. Thenotes are unsecured, unsubordinated obligations and rank equally withour other unsecured, unsubordinated obligations. During 2015,$275 million was repaid. During 2016, an additional $196 million wasrepaid. During 2017, the remaining $279 million was repaid.
In September 2008, we issued an aggregate of $1.25 billion of notesthrough our wholly-owned indirect subsidiaries Barrick North AmericaFinance LLC and Barrick Gold Financeco LLC (collectively, the “LLCs”)consisting of $500 million of 5-year notes with a coupon rate of 6.125%,$500 million of 10-year notes with a coupon rate of 6.8%, and$250 million of 30-year notes with a coupon rate of 7.5%. We alsoprovide an
unconditional and irrevocable guarantee of these payments, which rankequally with our other unsecured and unsubordinated obligations.
During 2013, the entire balance ($500 million) of the 5-year notes with acoupon rate of 6.125% that was due in September 2013 was repaid.During 2016, the entire balance ($500 million) of the 10-year notes with acoupon rate of 6.8% was repaid.
Pueblo Viejo Project Financing AgreementIn April 2010, Barrick and Goldcorp finalized terms for $1.035 billion(100% basis) in project financing for Pueblo Viejo. The project financingwas non-recourse subject to guarantees provided by Barrick and Goldcorpfor their proportionate share which would terminate upon Pueblo Viejomeeting certain operating completion tests and are subject to an exclusionfor certain political risk events. On February 17, 2015, we receivednotification that the completion tests had been met, resulting in terminationof the guarantees. The lending syndicate was comprised of internationalfinancial institutions including export development agencies andcommercial banks.
We had drawn the entire $1.035 billion. During 2017, the remainingprincipal balance of the Pueblo Viejo Financing Agreement was fullyrepaid.
Refinancing of the Credit FacilityIn January 2012, we finalized a credit and guarantee agreement (the“Credit Facility”, previously referred to as the “2012 Credit Facility”) withcertain Lenders, which requires such Lenders to make available to us acredit facility of $4.0 billion or the equivalent amount in Canadian dollars.The Credit Facility, which is unsecured, currently has an interest rate ofLondon Interbank Offered Rate (“LIBOR”) plus 2.00% on drawn amounts,and a commitment rate of 0.35% on undrawn amounts. In November2017, $3.977 billion of the $4 billion credit facility was agreed to beextended from January 2022 to January 2023. The remaining $23 millioncurrently terminates in January 2020. The Credit Facility is undrawn as atDecember 31, 2017.
2.50%/4.10%/5.75% NotesOn May 2, 2013, we issued an aggregate of $3 billion in notes throughBarrick and our wholly-owned indirect subsidiary BNAF consisting of$650 million of 2.50% notes that mature in 2018, $1.5 billion of 4.10%notes that mature in 2023 and $850 million of 5.75% notes issued byBNAF that mature in 2043. $2 billion of the net proceeds from this offeringwere used to repay existing indebtedness under our $4 billion revolvingcredit facility. We provided an unconditional and irrevocable guarantee onthe $850 million of 5.75% notes issued by BNAF, which will rank equallywith our other unsecured and unsubordinated obligations.
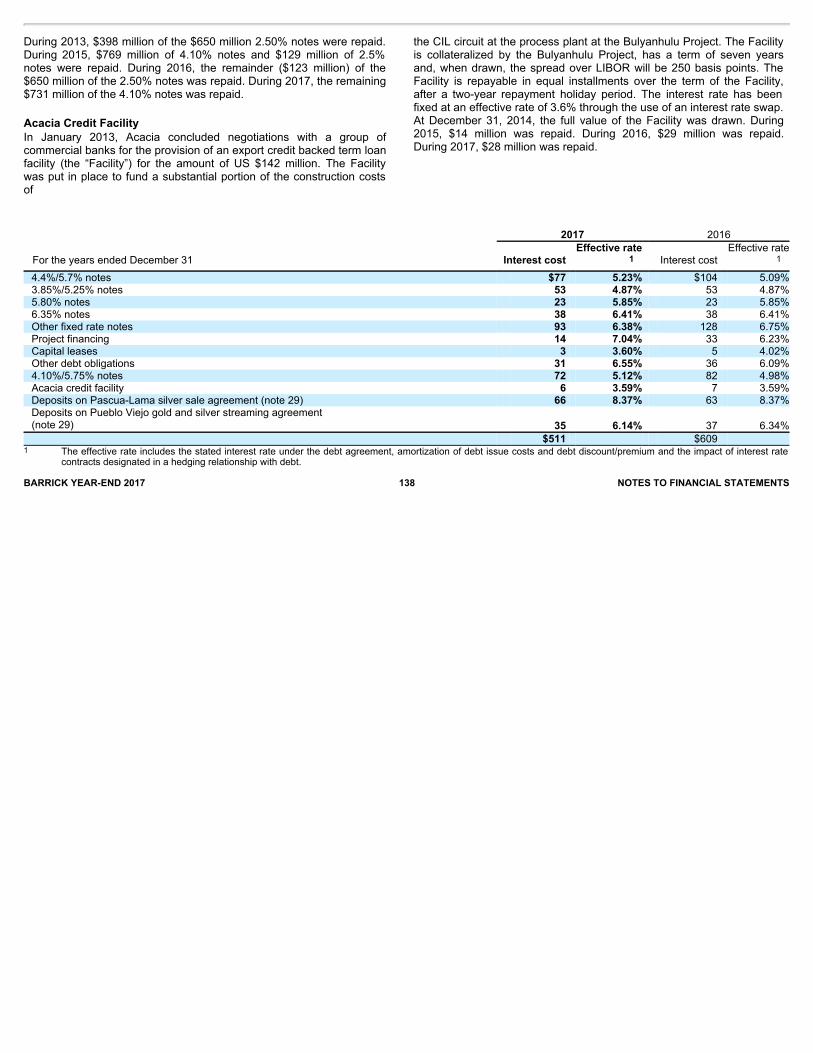
2017 2016
For the years ended December 31
Interest cost
Effective rate1
Interest cost Effective rate
1
4.4%/5.7% notes $77 5.23% $104 5.09%3.85%/5.25% notes 53 4.87% 53 4.87%5.80% notes 23 5.85% 23 5.85%6.35% notes 38 6.41% 38 6.41%Other fixed rate notes 93 6.38% 128 6.75%Project financing 14 7.04% 33 6.23%Capital leases 3 3.60% 5 4.02%Other debt obligations 31 6.55% 36 6.09%4.10%/5.75% notes 72 5.12% 82 4.98%Acacia credit facility 6 3.59% 7 3.59%Deposits on Pascua-Lama silver sale agreement (note 29) 66 8.37% 63 8.37%Deposits on Pueblo Viejo gold and silver streaming agreement(note 29) 35 6.14% 37 6.34%
$511 $609 1 The effective rate includes the stated interest rate under the debt agreement, amortization of debt issue costs and debt discount/premium and the impact of interest rate
contracts designated in a hedging relationship with debt.BARRICK YEAR-END 2017 138 NOTES TO FINANCIAL STATEMENTS
During 2013, $398 million of the $650 million 2.50% notes were repaid.During 2015, $769 million of 4.10% notes and $129 million of 2.5%notes were repaid. During 2016, the remainder ($123 million) of the$650 million of the 2.50% notes was repaid. During 2017, the remaining$731 million of the 4.10% notes was repaid.
Acacia Credit FacilityIn January 2013, Acacia concluded negotiations with a group ofcommercial banks for the provision of an export credit backed term loanfacility (the “Facility”) for the amount of US $142 million. The Facilitywas put in place to fund a substantial portion of the construction costsof
the CIL circuit at the process plant at the Bulyanhulu Project. The Facilityis collateralized by the Bulyanhulu Project, has a term of seven yearsand, when drawn, the spread over LIBOR will be 250 basis points. TheFacility is repayable in equal installments over the term of the Facility,after a two-year repayment holiday period. The interest rate has beenfixed at an effective rate of 3.6% through the use of an interest rate swap.At December 31, 2014, the full value of the Facility was drawn. During2015, $14 million was repaid. During 2016, $29 million was repaid.During 2017, $28 million was repaid.

Scheduled Debt Repayments 1
Issuer MaturityYear 2018 2019 2020 2021 2022
2023 andthereafter Total
4.95% notes 3 BPDAF 2020 $— $— $248 $— $— $— $248 7.31% notes 2 BGC 2021 — — — 7 — — 7 4.40% notes BNAF 2021 — — — 629 — — 629 3.85% notes BGC 2022 — — — — 337 — 337 7.73% notes 2 BGC 2025 — — — — — 7 7 7.70% notes 2 BGC 2025 — — — — — 5 5 7.37% notes 2 BGC 2026 — — — — — 32 32 8.05% notes 2 BGC 2026 — — — — — 15 15 6.38% notes 2 BGC 2033 — — — — — 200 200 5.80% notes BGC 2034 — — — — — 200 200 5.80% notes BGFC 2034 — — — — — 200 200 6.45% notes 2 BGC 2035 — — — — — 300 300 6.35% notes BHMC 2036 — — — — — 600 600 7.50% notes 3 BNAF 2038 — — — — — 250 250 5.95% notes 3 BPDAF 2039 — — — — — 850 850 5.70% notes BNAF 2041 — — — — — 850 850 5.25% notes BGC 2042 — — — — — 750 750 5.75% notes BNAF 2043 — — — — — 850 850 Other debt obligations 2 4 5 — — — — 9 Acacia credit facility 28 28 15 — — — 71 $32 $33 $263 $636 $337 $5,109 $6,410 Minimum annual payments under capitalleases $27 $11 $4 $1 $1 $2 $46
1 This table illustrates the contractual undiscounted cash flows, and may not agree with the amounts disclosed in the consolidated balance sheet.2 Included in Other debt obligations in the Long-Term Debt table.3 Included in Other fixed rate notes in the Long-Term Debt table.BARRICK YEAR-END 2017 139 NOTES TO FINANCIAL STATEMENTS
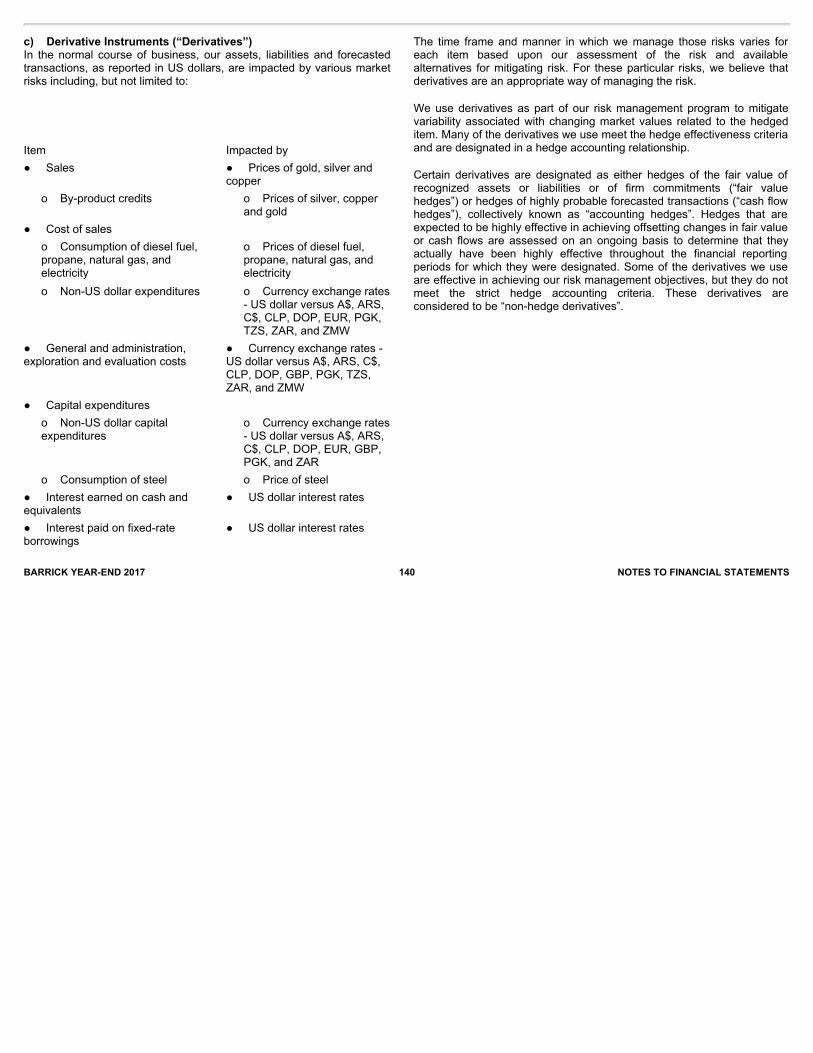
BARRICK YEAR-END 2017 140 NOTES TO FINANCIAL STATEMENTS
c) Derivative Instruments (“Derivatives”)In the normal course of business, our assets, liabilities and forecastedtransactions, as reported in US dollars, are impacted by various marketrisks including, but not limited to:
Item Impacted by● Sales
● Prices of gold, silver andcopper
o By-product credits
o Prices of silver, copperand gold
● Cost of sales
o Consumption of diesel fuel,propane, natural gas, andelectricity
o Prices of diesel fuel,propane, natural gas, andelectricity
o Non-US dollar expenditures
o Currency exchange rates- US dollar versus A$, ARS,C$, CLP, DOP, EUR, PGK,TZS, ZAR, and ZMW
● General and administration,exploration and evaluation costs
● Currency exchange rates -US dollar versus A$, ARS, C$,CLP, DOP, GBP, PGK, TZS,ZAR, and ZMW
● Capital expenditures
o Non-US dollar capitalexpenditures
o Currency exchange rates- US dollar versus A$, ARS,C$, CLP, DOP, EUR, GBP,PGK, and ZAR
o Consumption of steel o Price of steel● Interest earned on cash andequivalents
● US dollar interest rates
● Interest paid on fixed-rateborrowings
● US dollar interest rates
The time frame and manner in which we manage those risks varies foreach item based upon our assessment of the risk and availablealternatives for mitigating risk. For these particular risks, we believe thatderivatives are an appropriate way of managing the risk.
We use derivatives as part of our risk management program to mitigatevariability associated with changing market values related to the hedgeditem. Many of the derivatives we use meet the hedge effectiveness criteriaand are designated in a hedge accounting relationship.
Certain derivatives are designated as either hedges of the fair value ofrecognized assets or liabilities or of firm commitments (“fair valuehedges”) or hedges of highly probable forecasted transactions (“cash flowhedges”), collectively known as “accounting hedges”. Hedges that areexpected to be highly effective in achieving offsetting changes in fair valueor cash flows are assessed on an ongoing basis to determine that theyactually have been highly effective throughout the financial reportingperiods for which they were designated. Some of the derivatives we useare effective in achieving our risk management objectives, but they do notmeet the strict hedge accounting criteria. These derivatives areconsidered to be “non-hedge derivatives”.
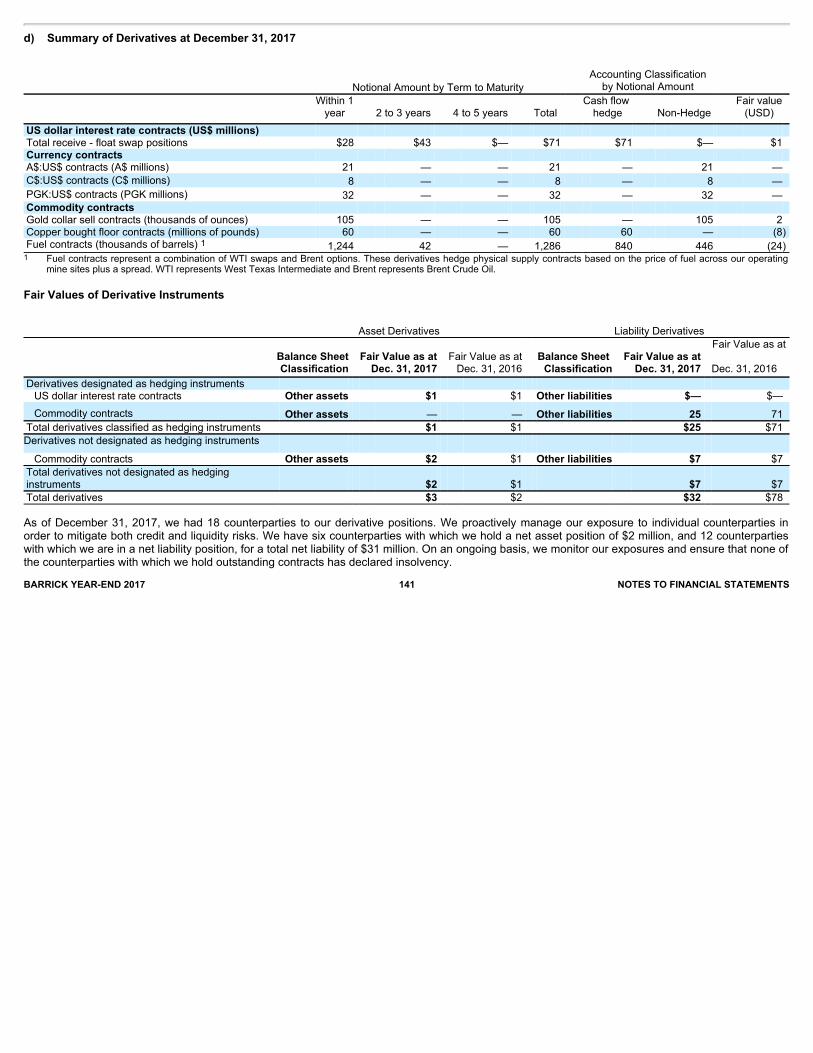
d) Summary of Derivatives at December 31, 2017
Notional Amount by Term to Maturity
Accounting Classificationby Notional Amount
Within 1year
2 to 3 years 4 to 5 years
Total
Cash flow hedge
Non-Hedge
Fair value(USD)
US dollar interest rate contracts (US$ millions) Total receive - float swap positions $28 $43 $— $71 $71 $— $1 Currency contracts A$:US$ contracts (A$ millions) 21 — — 21 — 21 — C$:US$ contracts (C$ millions) 8 — — 8 — 8 — PGK:US$ contracts (PGK millions) 32 — — 32 — 32 — Commodity contracts Gold collar sell contracts (thousands of ounces) 105 — — 105 — 105 2 Copper bought floor contracts (millions of pounds) 60 — — 60 60 — (8) Fuel contracts (thousands of barrels) 1 1,244 42 — 1,286 840 446 (24) 1 Fuel contracts represent a combination of WTI swaps and Brent options. These derivatives hedge physical supply contracts based on the price of fuel across our operating
mine sites plus a spread. WTI represents West Texas Intermediate and Brent represents Brent Crude Oil.
Fair Values of Derivative Instruments
Asset Derivatives Liability Derivatives
Balance SheetClassification
Fair Value as at
Dec. 31, 2017
Fair Value as atDec. 31, 2016
Balance Sheet
Classification
Fair Value as at
Dec. 31, 2017
Fair Value as at
Dec. 31, 2016
Derivatives designated as hedging instruments US dollar interest rate contracts Other assets $1 $1 Other liabilities $— $—
Commodity contracts Other assets — — Other liabilities 25 71 Total derivatives classified as hedging instruments $1 $1 $25 $71 Derivatives not designated as hedging instruments Commodity contracts Other assets $2 $1 Other liabilities $7 $7
Total derivatives not designated as hedginginstruments $2 $1 $7 $7 Total derivatives $3 $2 $32 $78
As of December 31, 2017, we had 18 counterparties to our derivative positions. We proactively manage our exposure to individual counterparties inorder to mitigate both credit and liquidity risks. We have six counterparties with which we hold a net asset position of $2 million, and 12 counterpartieswith which we are in a net liability position, for a total net liability of $31 million. On an ongoing basis, we monitor our exposures and ensure that none ofthe counterparties with which we hold outstanding contracts has declared insolvency.BARRICK YEAR-END 2017 141 NOTES TO FINANCIAL STATEMENTS
BARRICK YEAR-END 2017 142 NOTES TO FINANCIAL STATEMENTS
US Dollar Interest Rate ContractsCash Flow HedgesAt December 31, 2017, Acacia has $71 million of pay-fixed receive-floatinterest rate swaps to hedge the floating rate debt associated with theBulyanhulu plant expansion. These contracts, designated as cash flowhedges, convert the floating rate debt as it is drawn against the financingagreement.
Currency ContractsCash Flow HedgesDuring the year, no currency contracts have been designated againstforecasted non-US dollar denominated expenditures. As atDecember 31, 2017, there are no outstanding currency contractsdesignated as cash flow hedges of our anticipated operating,administrative and sustaining capital spend.
During 2013, we sold back and effectively closed out approximately A$990 million of our Australian dollar forward contracts as a lossmitigation strategy. No cash settlement occurred and payments will netat maturity (2014-2016). During 2016, losses of $14 million wererecognized in the consolidated statement of income based on theoriginal hedge contract maturity dates. No losses remain crystallized inOCI at December 31, 2016 and December 31, 2017.
Commodity ContractsDiesel/Propane/Electricity/Natural GasCash Flow HedgesDuring 2015, 8,040 thousand barrels of WTI contracts designatedagainst forecasted fuel consumption at our mines were designated ashedging instruments as a result of adopting IFRS 9 and did not qualifyfor hedge accounting prior to January 1, 2015. As at December 31,2017, we have 840 thousand barrels of WTI designated as cash flowhedges at an average rate of $79 per barrel of our exposure toforecasted fuel purchases at our mines.
Non-hedge DerivativesDuring the year, Acacia entered into a contract to purchase 79 thousandbarrels of Brent to economically hedge our exposure to forecasted fuelpurchases for expected consumption at our mines. In total, on acombined basis Acacia has 206 thousand barrels of Brent swapsoutstanding that economically hedge our exposure to forecasted fuelpurchases at our mines.
Metals ContractsCash Flow HedgesDuring 2017, we purchased 115 million pounds of copper collars, of which60 million pounds remain outstanding at December 31, 2017. Theoutstanding positions will mature evenly throughout the first half of 2018.These contracts contained purchased put and sold call options withweighted average strike prices of $2.83/lb and $3.25/lb, respectively.These contracts are designated as cash flow hedges, with the effectiveportion and the changes in time value of the hedge recognized in OCI andthe ineffective portion recognized in non-hedge derivative gains (losses).
During 2014, we early terminated 65 million ounces of silver hedges. Werealized net cash proceeds of approximately $190 million with $2 millionremaining crystallized in OCI at December 31, 2017, to be recognized inrevenue as the exposure occurs. Any unrealized changes and realizedgains/losses on ineffective amounts or time value have been recognizedin the consolidated statements of income as gains on non-hedgederivatives.
Non-hedge DerivativesWe enter into purchased and written contracts with the primary objectiveof increasing the realized price on some of our gold and copper sales.During the year, Acacia purchased gold put options of 210 thousandounces. As a result of these activities, we recorded approximately$4 million in the consolidated statement of income as gains on non-hedgederivatives. There are 105 thousand ounces of gold positions outstandingat December 31, 2017.
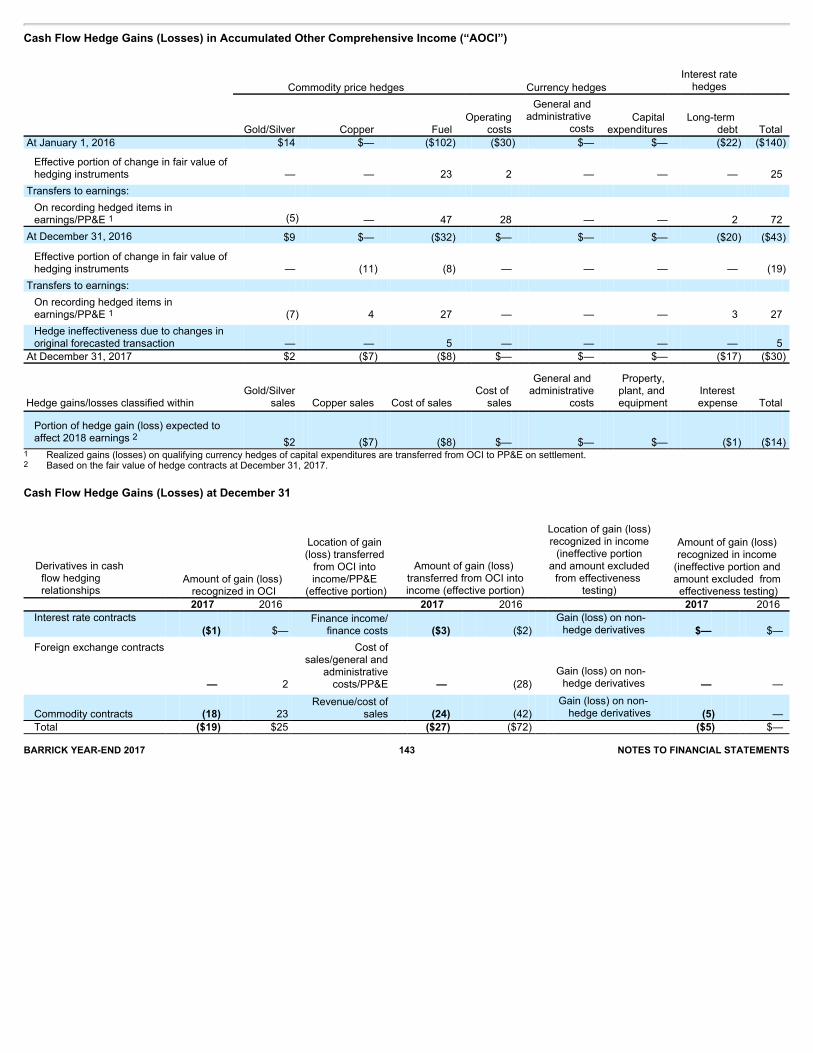
Cash Flow Hedge Gains (Losses) in Accumulated Other Comprehensive Income (“AOCI”)
Commodity price hedges Currency hedges
Interest ratehedges
Gold/Silver Copper Fuel Operating
costs
General and administrative
costs Capital
expenditures Long-term
debt Total At January 1, 2016 $14 $— ($102) ($30) $— $— ($22) ($140)
Effective portion of change in fair value ofhedging instruments — — 23 2 — — — 25
Transfers to earnings: On recording hedged items inearnings/PP&E 1
(5
)
— 47 28 — — 2 72 At December 31, 2016 $9 $— ($32) $— $— $— ($20) ($43)
Effective portion of change in fair value ofhedging instruments — (11) (8) — — — — (19)
Transfers to earnings: On recording hedged items inearnings/PP&E 1 (7) 4 27 — — — 3 27 Hedge ineffectiveness due to changes inoriginal forecasted transaction — — 5 — — — — 5
At December 31, 2017 $2 ($7) ($8) $— $— $— ($17) ($30)
Hedge gains/losses classified within
Gold/Silversales
Copper sales
Cost of sales
Cost of sales
General and administrative
costs
Property, plant, and equipment
Interest expense
Total
Portion of hedge gain (loss) expected toaffect 2018 earnings 2 $2 ($7) ($8) $— $— $— ($1) ($14)
1 Realized gains (losses) on qualifying currency hedges of capital expenditures are transferred from OCI to PP&E on settlement.2 Based on the fair value of hedge contracts at December 31, 2017.
Cash Flow Hedge Gains (Losses) at December 31
Derivatives in cash flow hedging relationships
Amount of gain (loss) recognized in OCI
Location of gain (loss) transferred from OCI into income/PP&E
(effective portion)
Amount of gain (loss) transferred from OCI intoincome (effective portion)
Location of gain (loss)recognized in income(ineffective portion
and amount excludedfrom effectiveness
testing)
Amount of gain (loss) recognized in income (ineffective portion and amount excluded from effectiveness testing)
2017 2016 2017 2016 2017 2016 Interest rate contracts
($1) $— Finance income/
finance costs ($3) ($2) Gain (loss) on non- hedge derivatives
$— $—
Foreign exchange contracts
— 2
Cost ofsales/general and
administrativecosts/PP&E — (28)
Gain (loss) on non- hedge derivatives
— —
Commodity contracts (18) 23 Revenue/cost of
sales (24) (42) Gain (loss) on non- hedge derivatives
(5) —
Total ($19) $25 ($27) ($72) ($5) $— BARRICK YEAR-END 2017 143 NOTES TO FINANCIAL STATEMENTS

26 > FAIR VALUE MEASUREMENTSFair value is the price that would be received to sell an asset or paid to transfer a liability in an orderly transaction between market participants at themeasurement date. The fair value hierarchy establishes three levels to classify the inputs to valuation techniques used to measure fair value. Level 1inputs are quoted prices (unadjusted) in active markets for identical assets or liabilities. Level 2 inputs are quoted prices in markets that are not active,quoted prices for similar assets or liabilities in active markets, inputs other than quoted prices that are observable for the asset or liability (for example,interest rate and yield curves observable at commonly quoted intervals, forward pricing curves used to value currency and commodity contracts andvolatility measurements used to value option contracts), or inputs that are derived principally from or corroborated by observable market data or othermeans. Level 3 inputs are unobservable (supported by little or no market activity). The fair value hierarchy gives the highest priority to Level 1 inputsand the lowest priority to Level 3 inputs.BARRICK YEAR-END 2017 144 NOTES TO FINANCIAL STATEMENTS
e) Gains (Losses) on Non-hedge Derivatives
For the years ended December 31 2017 2016
Commodity contracts Gold $4 $2 Silver 1 7 6 Copper (1) — Fuel — 5 Currency Contracts 1 (1)
$11 $12 Hedge ineffectiveness (5) —
$6 $12 1 Relates to the amortization of crystallized OCI.
f) Derivative Assets and Liabilities
2017 2016
At January 1 ($76) ($263) Derivatives cash (inflow) outflow Operating activities 62 156 Change in fair value of: Non-hedge derivatives 4 6
Cash flow hedges: Effective portion (19) 25 Ineffective portion 5 — Excluded from effectiveness changes (5) —
At December 31 ($29) ($76) Classification: Other current assets $2 $1 Other long-term assets 1 1 Other current liabilities (30) (50) Other long-term obligations (2) (28)
($29) ($76)
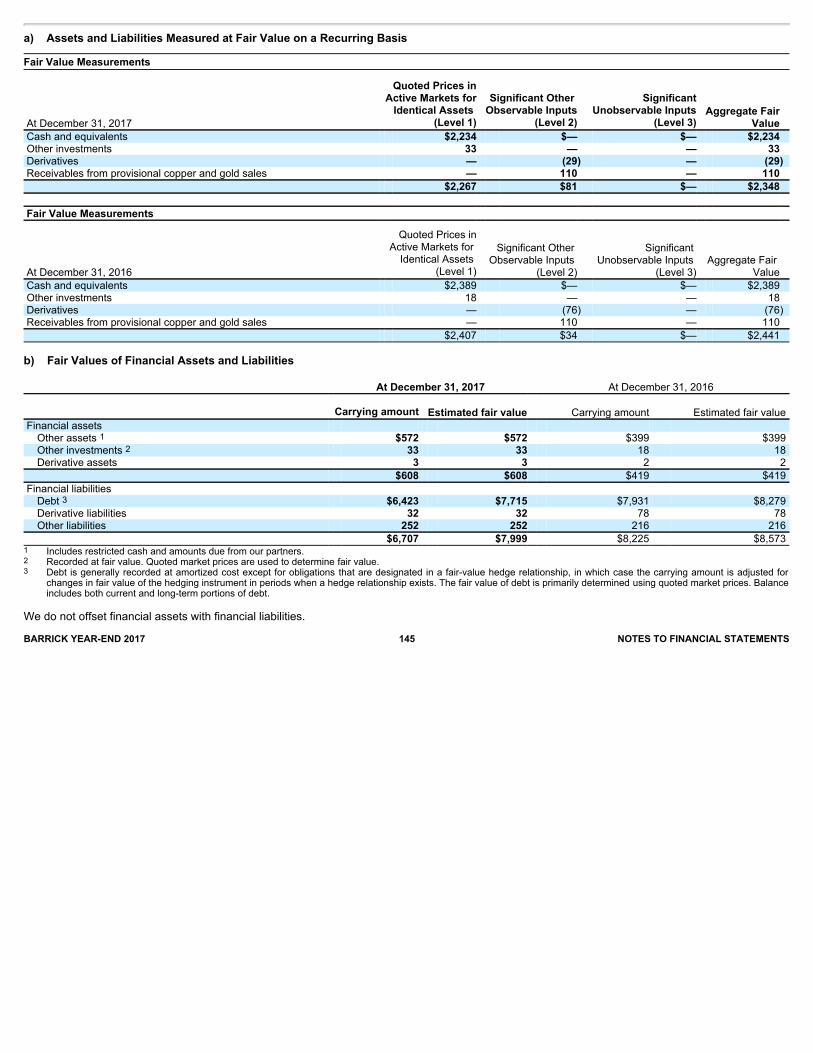
a) Assets and Liabilities Measured at Fair Value on a Recurring BasisFair Value Measurements
At December 31, 2017
Quoted Prices in
Active Markets forIdentical Assets
(Level 1)
Significant Other Observable Inputs
(Level 2)
SignificantUnobservable Inputs
(Level 3) Aggregate Fair
Value Cash and equivalents $2,234 $— $— $2,234 Other investments 33 — — 33 Derivatives — (29) — (29) Receivables from provisional copper and gold sales — 110 — 110 $2,267 $81 $— $2,348 Fair Value Measurements
At December 31, 2016
Quoted Prices in
Active Markets for Identical Assets
(Level 1)
Significant Other Observable Inputs
(Level 2)
Significant Unobservable Inputs
(Level 3) Aggregate Fair
Value Cash and equivalents $2,389 $— $— $2,389 Other investments 18 — — 18 Derivatives — (76) — (76) Receivables from provisional copper and gold sales — 110 — 110 $2,407 $34 $— $2,441
b) Fair Values of Financial Assets and Liabilities At December 31, 2017 At December 31, 2016
Carrying amount
Estimated fair value Carrying amount Estimated fair value
Financial assets Other assets 1 $572 $572 $399 $399 Other investments 2 33 33 18 18 Derivative assets 3 3 2 2
$608 $608 $419 $419 Financial liabilities Debt 3 $6,423 $7,715 $7,931 $8,279 Derivative liabilities 32 32 78 78 Other liabilities 252 252 216 216
$6,707 $7,999 $8,225 $8,573 1 Includes restricted cash and amounts due from our partners.2 Recorded at fair value. Quoted market prices are used to determine fair value.3 Debt is generally recorded at amortized cost except for obligations that are designated in a fair-value hedge relationship, in which case the carrying amount is adjusted for
changes in fair value of the hedging instrument in periods when a hedge relationship exists. The fair value of debt is primarily determined using quoted market prices. Balanceincludes both current and long-term portions of debt.
We do not offset financial assets with financial liabilities.BARRICK YEAR-END 2017 145 NOTES TO FINANCIAL STATEMENTS
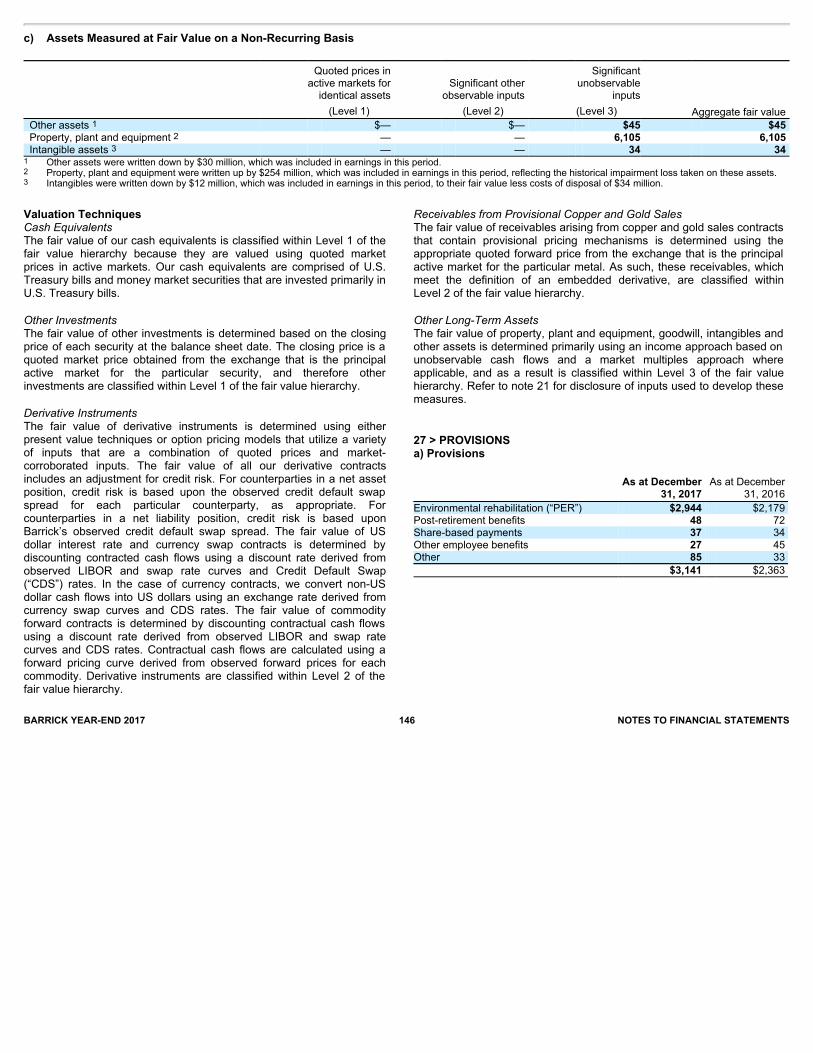
c) Assets Measured at Fair Value on a Non-Recurring Basis
Quoted prices inactive markets foridentical assets
(Level 1)
Significant otherobservable inputs
(Level 2)
Significantunobservable
inputs
(Level 3) Aggregate fair value Other assets 1 $— $— $45 $45 Property, plant and equipment 2 — — 6,105 6,105 Intangible assets 3 — — 34 34 1 Other assets were written down by $30 million, which was included in earnings in this period. 2 Property, plant and equipment were written up by $254 million, which was included in earnings in this period, reflecting the historical impairment loss taken on these assets. 3 Intangibles were written down by $12 million, which was included in earnings in this period, to their fair value less costs of disposal of $34 million.
BARRICK YEAR-END 2017 146 NOTES TO FINANCIAL STATEMENTS
Valuation TechniquesCash EquivalentsThe fair value of our cash equivalents is classified within Level 1 of thefair value hierarchy because they are valued using quoted marketprices in active markets. Our cash equivalents are comprised of U.S.Treasury bills and money market securities that are invested primarily inU.S. Treasury bills.
Other InvestmentsThe fair value of other investments is determined based on the closingprice of each security at the balance sheet date. The closing price is aquoted market price obtained from the exchange that is the principalactive market for the particular security, and therefore otherinvestments are classified within Level 1 of the fair value hierarchy.
Derivative InstrumentsThe fair value of derivative instruments is determined using eitherpresent value techniques or option pricing models that utilize a varietyof inputs that are a combination of quoted prices and market-corroborated inputs. The fair value of all our derivative contractsincludes an adjustment for credit risk. For counterparties in a net assetposition, credit risk is based upon the observed credit default swapspread for each particular counterparty, as appropriate. Forcounterparties in a net liability position, credit risk is based uponBarrick’s observed credit default swap spread. The fair value of USdollar interest rate and currency swap contracts is determined bydiscounting contracted cash flows using a discount rate derived fromobserved LIBOR and swap rate curves and Credit Default Swap(“CDS”) rates. In the case of currency contracts, we convert non-USdollar cash flows into US dollars using an exchange rate derived fromcurrency swap curves and CDS rates. The fair value of commodityforward contracts is determined by discounting contractual cash flowsusing a discount rate derived from observed LIBOR and swap ratecurves and CDS rates. Contractual cash flows are calculated using aforward pricing curve derived from observed forward prices for eachcommodity. Derivative instruments are classified within Level 2 of thefair value hierarchy.
Receivables from Provisional Copper and Gold SalesThe fair value of receivables arising from copper and gold sales contractsthat contain provisional pricing mechanisms is determined using theappropriate quoted forward price from the exchange that is the principalactive market for the particular metal. As such, these receivables, whichmeet the definition of an embedded derivative, are classified withinLevel 2 of the fair value hierarchy.
Other Long-Term AssetsThe fair value of property, plant and equipment, goodwill, intangibles andother assets is determined primarily using an income approach based onunobservable cash flows and a market multiples approach whereapplicable, and as a result is classified within Level 3 of the fair valuehierarchy. Refer to note 21 for disclosure of inputs used to develop thesemeasures.
27 > PROVISIONSa) Provisions
As at December
31, 2017 As at December
31, 2016 Environmental rehabilitation (“PER”) $2,944 $2,179 Post-retirement benefits 48 72 Share-based payments 37 34 Other employee benefits 27 45 Other 85 33 $3,141 $2,363
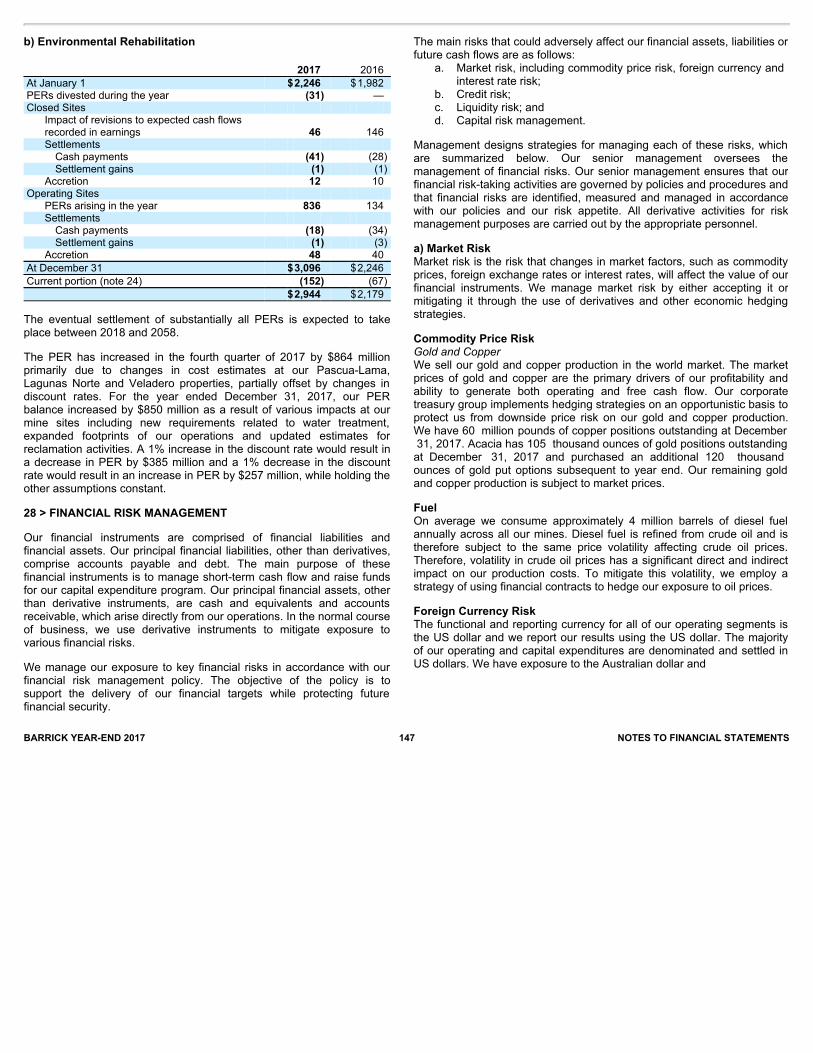
BARRICK YEAR-END 2017 147 NOTES TO FINANCIAL STATEMENTS
b) Environmental Rehabilitation 2017 2016 At January 1 $2,246 $1,982 PERs divested during the year (31) — Closed Sites
Impact of revisions to expected cash flowsrecorded in earnings 46 146 Settlements Cash payments (41) (28) Settlement gains (1) (1)
Accretion 12 10 Operating Sites
PERs arising in the year 836 134 Settlements Cash payments (18) (34) Settlement gains (1) (3)
Accretion 48 40 At December 31 $3,096 $2,246 Current portion (note 24) (152) (67) $2,944 $2,179
The eventual settlement of substantially all PERs is expected to takeplace between 2018 and 2058.
The PER has increased in the fourth quarter of 2017 by $864 millionprimarily due to changes in cost estimates at our Pascua-Lama,Lagunas Norte and Veladero properties, partially offset by changes indiscount rates. For the year ended December 31, 2017, our PERbalance increased by $850 million as a result of various impacts at ourmine sites including new requirements related to water treatment,expanded footprints of our operations and updated estimates forreclamation activities. A 1% increase in the discount rate would result ina decrease in PER by $385 million and a 1% decrease in the discountrate would result in an increase in PER by $257 million, while holding theother assumptions constant.
28 > FINANCIAL RISK MANAGEMENT
Our financial instruments are comprised of financial liabilities andfinancial assets. Our principal financial liabilities, other than derivatives,comprise accounts payable and debt. The main purpose of thesefinancial instruments is to manage short-term cash flow and raise fundsfor our capital expenditure program. Our principal financial assets, otherthan derivative instruments, are cash and equivalents and accountsreceivable, which arise directly from our operations. In the normal courseof business, we use derivative instruments to mitigate exposure tovarious financial risks.
We manage our exposure to key financial risks in accordance with ourfinancial risk management policy. The objective of the policy is tosupport the delivery of our financial targets while protecting futurefinancial security.
The main risks that could adversely affect our financial assets, liabilities orfuture cash flows are as follows: a. Market risk, including commodity price risk, foreign currency and
interest rate risk;
b. Credit risk; c. Liquidity risk; and d. Capital risk management.
Management designs strategies for managing each of these risks, whichare summarized below. Our senior management oversees themanagement of financial risks. Our senior management ensures that ourfinancial risk-taking activities are governed by policies and procedures andthat financial risks are identified, measured and managed in accordancewith our policies and our risk appetite. All derivative activities for riskmanagement purposes are carried out by the appropriate personnel.
a) Market RiskMarket risk is the risk that changes in market factors, such as commodityprices, foreign exchange rates or interest rates, will affect the value of ourfinancial instruments. We manage market risk by either accepting it ormitigating it through the use of derivatives and other economic hedgingstrategies.
Commodity Price RiskGold and CopperWe sell our gold and copper production in the world market. The marketprices of gold and copper are the primary drivers of our profitability andability to generate both operating and free cash flow. Our corporatetreasury group implements hedging strategies on an opportunistic basis toprotect us from downside price risk on our gold and copper production.We have 60 million pounds of copper positions outstanding at December 31, 2017. Acacia has 105 thousand ounces of gold positions outstandingat December 31, 2017 and purchased an additional 120 thousandounces of gold put options subsequent to year end. Our remaining goldand copper production is subject to market prices.
FuelOn average we consume approximately 4 million barrels of diesel fuelannually across all our mines. Diesel fuel is refined from crude oil and istherefore subject to the same price volatility affecting crude oil prices.Therefore, volatility in crude oil prices has a significant direct and indirectimpact on our production costs. To mitigate this volatility, we employ astrategy of using financial contracts to hedge our exposure to oil prices.
Foreign Currency RiskThe functional and reporting currency for all of our operating segments isthe US dollar and we report our results using the US dollar. The majorityof our operating and capital expenditures are denominated and settled inUS dollars. We have exposure to the Australian dollar and
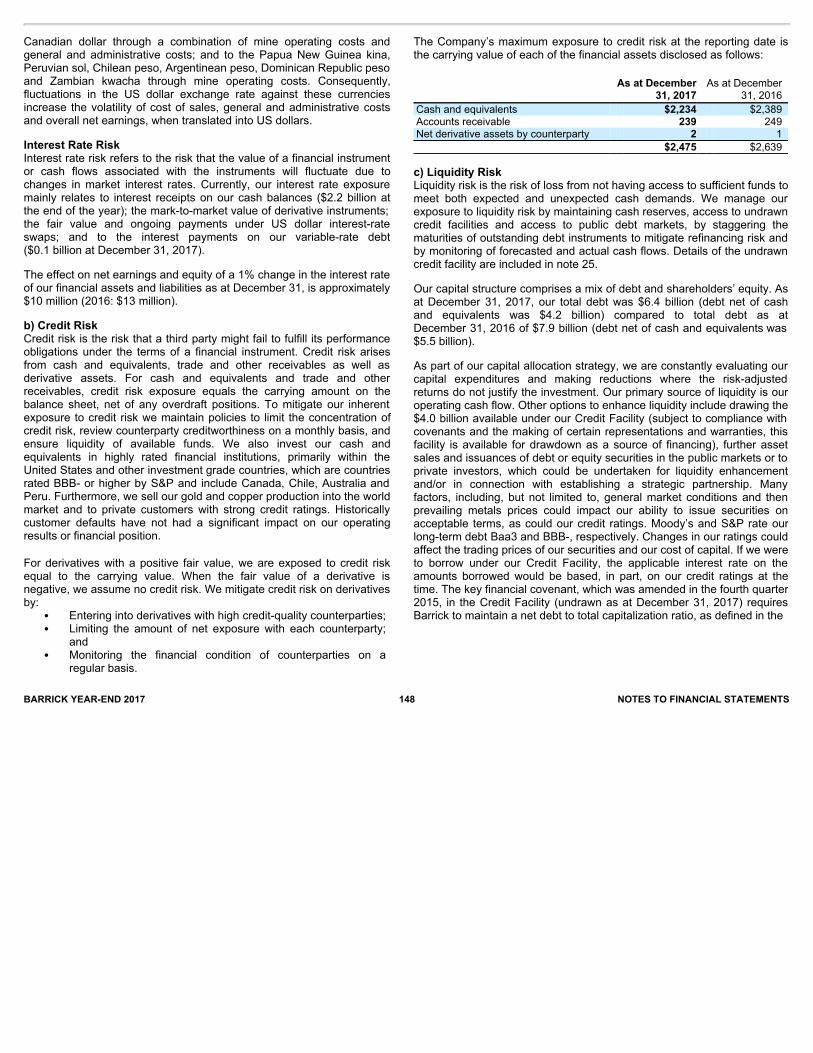
BARRICK YEAR-END 2017 148 NOTES TO FINANCIAL STATEMENTS
Canadian dollar through a combination of mine operating costs andgeneral and administrative costs; and to the Papua New Guinea kina,Peruvian sol, Chilean peso, Argentinean peso, Dominican Republic pesoand Zambian kwacha through mine operating costs. Consequently,fluctuations in the US dollar exchange rate against these currenciesincrease the volatility of cost of sales, general and administrative costsand overall net earnings, when translated into US dollars.
Interest Rate RiskInterest rate risk refers to the risk that the value of a financial instrumentor cash flows associated with the instruments will fluctuate due tochanges in market interest rates. Currently, our interest rate exposuremainly relates to interest receipts on our cash balances ($2.2 billion atthe end of the year); the mark-to-market value of derivative instruments;the fair value and ongoing payments under US dollar interest-rateswaps; and to the interest payments on our variable-rate debt($0.1 billion at December 31, 2017).
The effect on net earnings and equity of a 1% change in the interest rateof our financial assets and liabilities as at December 31, is approximately$10 million (2016: $13 million).
b) Credit RiskCredit risk is the risk that a third party might fail to fulfill its performanceobligations under the terms of a financial instrument. Credit risk arisesfrom cash and equivalents, trade and other receivables as well asderivative assets. For cash and equivalents and trade and otherreceivables, credit risk exposure equals the carrying amount on thebalance sheet, net of any overdraft positions. To mitigate our inherentexposure to credit risk we maintain policies to limit the concentration ofcredit risk, review counterparty creditworthiness on a monthly basis, andensure liquidity of available funds. We also invest our cash andequivalents in highly rated financial institutions, primarily within theUnited States and other investment grade countries, which are countriesrated BBB- or higher by S&P and include Canada, Chile, Australia andPeru. Furthermore, we sell our gold and copper production into the worldmarket and to private customers with strong credit ratings. Historicallycustomer defaults have not had a significant impact on our operatingresults or financial position.
For derivatives with a positive fair value, we are exposed to credit riskequal to the carrying value. When the fair value of a derivative isnegative, we assume no credit risk. We mitigate credit risk on derivativesby: · Entering into derivatives with high credit-quality counterparties; · Limiting the amount of net exposure with each counterparty;
and
· Monitoring the financial condition of counterparties on aregular basis.
The Company’s maximum exposure to credit risk at the reporting date isthe carrying value of each of the financial assets disclosed as follows:
As at December
31, 2017 As at December
31, 2016 Cash and equivalents $2,234 $2,389 Accounts receivable 239 249 Net derivative assets by counterparty 2 1 $2,475 $2,639
c) Liquidity RiskLiquidity risk is the risk of loss from not having access to sufficient funds tomeet both expected and unexpected cash demands. We manage ourexposure to liquidity risk by maintaining cash reserves, access to undrawncredit facilities and access to public debt markets, by staggering thematurities of outstanding debt instruments to mitigate refinancing risk andby monitoring of forecasted and actual cash flows. Details of the undrawncredit facility are included in note 25.
Our capital structure comprises a mix of debt and shareholders’ equity. Asat December 31, 2017, our total debt was $6.4 billion (debt net of cashand equivalents was $4.2 billion) compared to total debt as atDecember 31, 2016 of $7.9 billion (debt net of cash and equivalents was$5.5 billion).
As part of our capital allocation strategy, we are constantly evaluating ourcapital expenditures and making reductions where the risk-adjustedreturns do not justify the investment. Our primary source of liquidity is ouroperating cash flow. Other options to enhance liquidity include drawing the$4.0 billion available under our Credit Facility (subject to compliance withcovenants and the making of certain representations and warranties, thisfacility is available for drawdown as a source of financing), further assetsales and issuances of debt or equity securities in the public markets or toprivate investors, which could be undertaken for liquidity enhancementand/or in connection with establishing a strategic partnership. Manyfactors, including, but not limited to, general market conditions and thenprevailing metals prices could impact our ability to issue securities onacceptable terms, as could our credit ratings. Moody’s and S&P rate ourlong-term debt Baa3 and BBB-, respectively. Changes in our ratings couldaffect the trading prices of our securities and our cost of capital. If we wereto borrow under our Credit Facility, the applicable interest rate on theamounts borrowed would be based, in part, on our credit ratings at thetime. The key financial covenant, which was amended in the fourth quarter2015, in the Credit Facility (undrawn as at December 31, 2017) requiresBarrick to maintain a net debt to total capitalization ratio, as defined in the
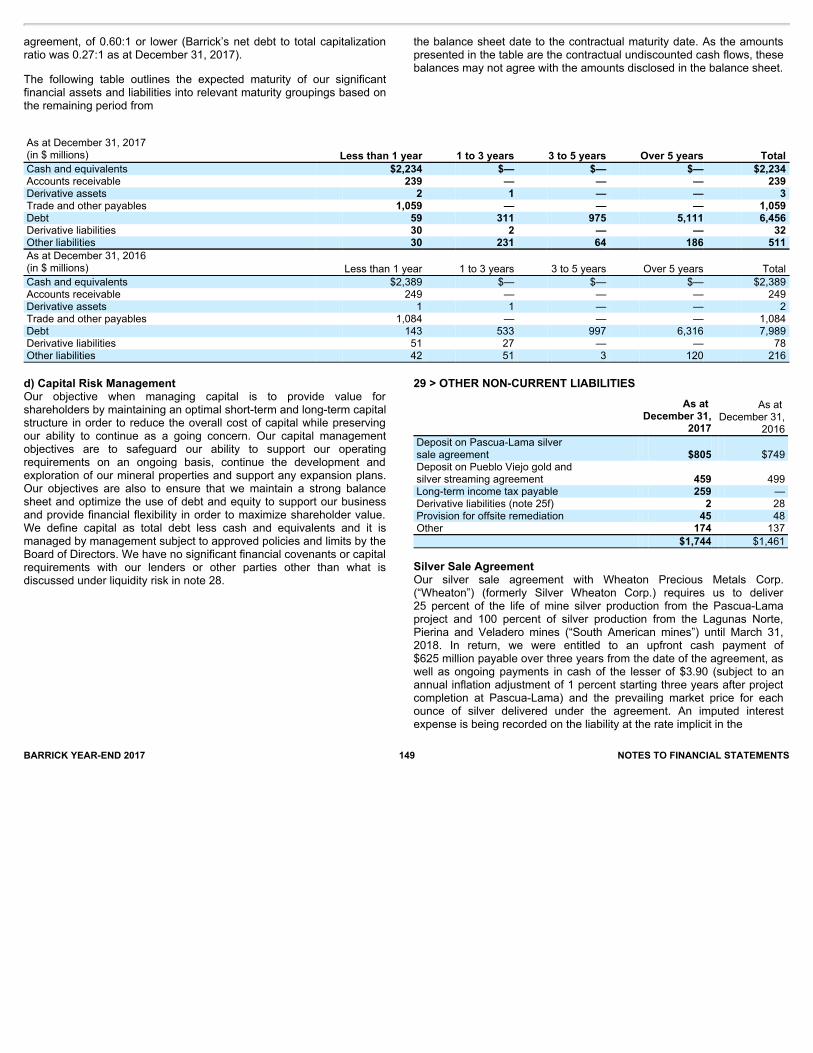
As at December 31, 2017 (in $ millions) Less than 1 year 1 to 3 years 3 to 5 years Over 5 years Total Cash and equivalents $2,234 $— $— $— $2,234 Accounts receivable 239 — — — 239 Derivative assets 2 1 — — 3 Trade and other payables 1,059 — — — 1,059 Debt 59 311 975 5,111 6,456 Derivative liabilities 30 2 — — 32 Other liabilities 30 231 64 186 511 As at December 31, 2016 (in $ millions) Less than 1 year 1 to 3 years 3 to 5 years Over 5 years Total Cash and equivalents $2,389 $— $— $— $2,389 Accounts receivable 249 — — — 249 Derivative assets 1 1 — — 2 Trade and other payables 1,084 — — — 1,084 Debt 143 533 997 6,316 7,989 Derivative liabilities 51 27 — — 78 Other liabilities 42 51 3 120 216
BARRICK YEAR-END 2017 149 NOTES TO FINANCIAL STATEMENTS
agreement, of 0.60:1 or lower (Barrick’s net debt to total capitalizationratio was 0.27:1 as at December 31, 2017).
The following table outlines the expected maturity of our significantfinancial assets and liabilities into relevant maturity groupings based onthe remaining period from
the balance sheet date to the contractual maturity date. As the amountspresented in the table are the contractual undiscounted cash flows, thesebalances may not agree with the amounts disclosed in the balance sheet.
d) Capital Risk ManagementOur objective when managing capital is to provide value forshareholders by maintaining an optimal short-term and long-term capitalstructure in order to reduce the overall cost of capital while preservingour ability to continue as a going concern. Our capital managementobjectives are to safeguard our ability to support our operatingrequirements on an ongoing basis, continue the development andexploration of our mineral properties and support any expansion plans.Our objectives are also to ensure that we maintain a strong balancesheet and optimize the use of debt and equity to support our businessand provide financial flexibility in order to maximize shareholder value.We define capital as total debt less cash and equivalents and it ismanaged by management subject to approved policies and limits by theBoard of Directors. We have no significant financial covenants or capitalrequirements with our lenders or other parties other than what isdiscussed under liquidity risk in note 28.
29 > OTHER NON-CURRENT LIABILITIES
As at December 31,
2017
As at December 31,
2016 Deposit on Pascua-Lama silver sale agreement $805 $749 Deposit on Pueblo Viejo gold and silver streaming agreement 459 499 Long-term income tax payable 259 — Derivative liabilities (note 25f) 2 28 Provision for offsite remediation 45 48 Other 174 137 $1,744 $1,461
Silver Sale AgreementOur silver sale agreement with Wheaton Precious Metals Corp.(“Wheaton”) (formerly Silver Wheaton Corp.) requires us to deliver25 percent of the life of mine silver production from the Pascua-Lamaproject and 100 percent of silver production from the Lagunas Norte,Pierina and Veladero mines (“South American mines”) until March 31,2018. In return, we were entitled to an upfront cash payment of$625 million payable over three years from the date of the agreement, aswell as ongoing payments in cash of the lesser of $3.90 (subject to anannual inflation adjustment of 1 percent starting three years after projectcompletion at Pascua-Lama) and the prevailing market price for eachounce of silver delivered under the agreement. An imputed interestexpense is being recorded on the liability at the rate implicit in the

BARRICK YEAR-END 2017 150 NOTES TO FINANCIAL STATEMENTS
agreement. The liability plus imputed interest will be amortized based onthe difference between the effective contract price for silver and theamount of the ongoing cash payment per ounce of silver delivered underthe agreement.
Gold and Silver Streaming AgreementOn September 29, 2015, we closed a gold and silver streamingtransaction with Royal Gold, Inc. (“Royal Gold”) for production linked toBarrick’s 60 percent interest in the Pueblo Viejo mine. Royal Gold madean upfront cash payment of $610 million and will continue to make cashpayments for gold and silver delivered under the agreement. The$610 million upfront payment is not repayable and Barrick is obligated todeliver gold and silver based on Pueblo Viejo’s production. We haveaccounted for the upfront payment as deferred revenue and willrecognize it in earnings, along with the ongoing cash payments, as thegold and silver is delivered to Royal Gold. We will also be recordingaccretion expense on the deferred revenue balance as the time value ofthe upfront deposit represents a significant component of thetransaction.
Under the terms of the agreement, Barrick will sell gold and silver toRoyal Gold equivalent to:
· 7.5 percent of Barrick’s interest in the gold produced at Pueblo
Viejo until 990,000 ounces of gold have been delivered, and3.75 percent thereafter.
· 75 percent of Barrick’s interest in the silver produced at PuebloViejo until 50 million ounces have been delivered, and37.5 percent thereafter. Silver will be delivered based on afixed recovery rate of 70 percent. Silver above this recoveryrate is not subject to the stream.
Barrick will receive ongoing cash payments from Royal Gold equivalentto 30 percent of the prevailing spot prices for the first 550,000 ounces ofgold and 23.1 million ounces of silver delivered. Thereafter payments willdouble to 60 percent of prevailing spot prices for each subsequent ounceof gold and silver delivered. Ongoing cash payments to Barrick are tiedto prevailing spot prices rather than fixed in advance, maintainingexposure to higher gold and silver prices in the future.
30 > DEFERRED INCOME TAXES
Recognition and MeasurementWe record deferred income tax assets and liabilities where temporarydifferences exist between the carrying amounts of assets and liabilities inour balance sheet and their tax bases. The measurement andrecognition of deferred income tax assets and liabilities takes intoaccount: substantively enacted rates that will apply when temporarydifferences reverse; interpretations of relevant tax legislation; estimatesof the tax bases of assets and liabilities; and the deductibility ofexpenditures for income
tax purposes. In addition, the measurement and recognition of deferredtax assets takes into account tax planning strategies. We recognize theeffect of changes in our assessment of these estimates and factors whenthey occur. Changes in deferred income tax assets and liabilities areallocated between net income, other comprehensive income, and goodwillbased on the source of the change.
Current income taxes of $239 million and deferred income taxes of $155million have been provided on the undistributed earnings of certain foreignsubsidiaries. Deferred income taxes have not been provided on theundistributed earnings of all other foreign subsidiaries for which we areable to control the timing of the remittance, and it is probable that therewill be no remittance in the foreseeable future. These undistributedearnings amounted to $3,916 million as at December 31, 2017.
Sources of Deferred Income Tax Assets and Liabilities
As atDecember
31, 2017
As at December 31, 2016
Deferred tax assets Tax loss carry forwards $926 $735 Environmental rehabilitation 594 639 Property, plant and equipment 175 273 Post-retirement benefit obligations and other employee benefits 49 47 Accrued interest payable 40 75 Other working capital 23 54 Derivative instruments 74 89 Other 21 41
$1,902 $1,953 Deferred tax liabilities Property, plant and equipment (1,571) (1,963) Inventory (507) (533) ($176) ($543) Classification: Non-current assets $1,069 $977 Non-current liabilities (1,245) (1,520) ($176) ($543)
The deferred tax asset of $1,069 million includes $1,064 million expectedto be realized in more than one year. The deferred tax liability of$1,245 million includes $1,228 million expected to be realized in morethan one year.
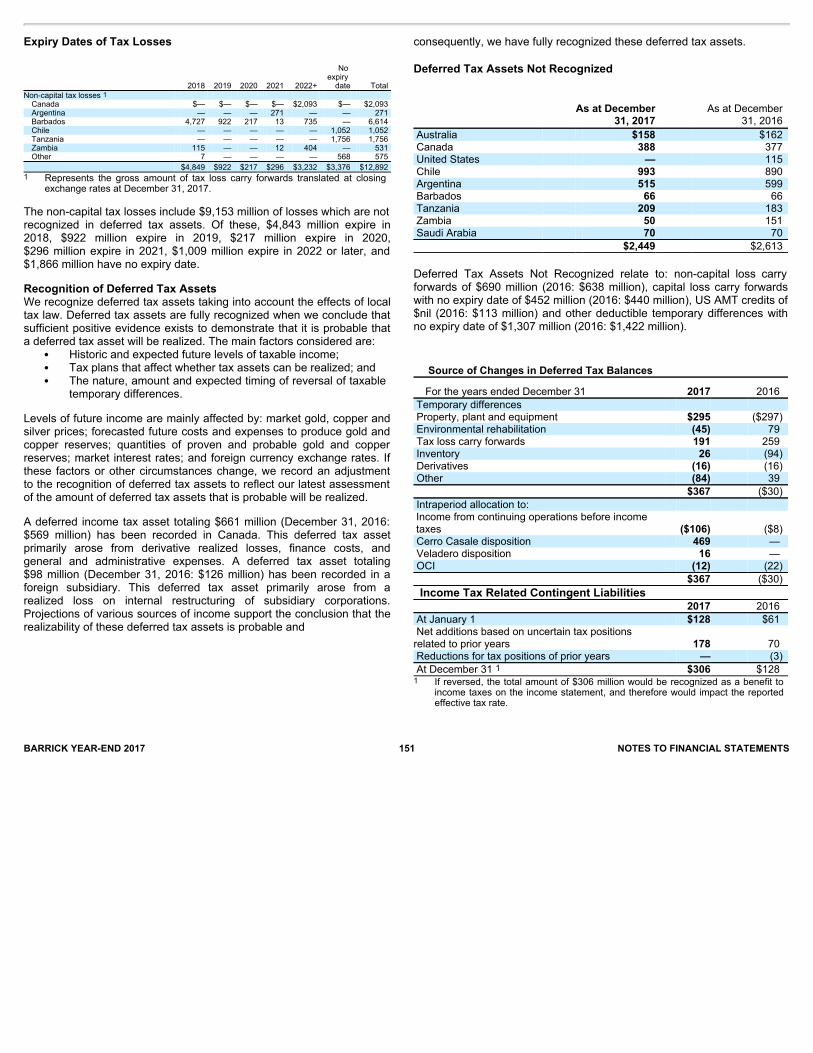
BARRICK YEAR-END 2017 151 NOTES TO FINANCIAL STATEMENTS
Expiry Dates of Tax Losses
2018 2019 2020 2021 2022+
No expiry date Total
Non-capital tax losses 1 Canada $— $— $— $— $2,093 $— $2,093 Argentina — — — 271 — — 271 Barbados 4,727 922 217 13 735 — 6,614 Chile — — — — — 1,052 1,052 Tanzania — — — — — 1,756 1,756 Zambia 115 — — 12 404 — 531 Other 7 — — — — 568 575
$4,849 $922 $217 $296 $3,232 $3,376 $12,892 1 Represents the gross amount of tax loss carry forwards translated at closing
exchange rates at December 31, 2017.
The non-capital tax losses include $9,153 million of losses which are notrecognized in deferred tax assets. Of these, $4,843 million expire in2018, $922 million expire in 2019, $217 million expire in 2020,$296 million expire in 2021, $1,009 million expire in 2022 or later, and$1,866 million have no expiry date.
Recognition of Deferred Tax AssetsWe recognize deferred tax assets taking into account the effects of localtax law. Deferred tax assets are fully recognized when we conclude thatsufficient positive evidence exists to demonstrate that it is probable thata deferred tax asset will be realized. The main factors considered are: · Historic and expected future levels of taxable income; · Tax plans that affect whether tax assets can be realized; and · The nature, amount and expected timing of reversal of taxable
temporary differences.
Levels of future income are mainly affected by: market gold, copper andsilver prices; forecasted future costs and expenses to produce gold andcopper reserves; quantities of proven and probable gold and copperreserves; market interest rates; and foreign currency exchange rates. Ifthese factors or other circumstances change, we record an adjustmentto the recognition of deferred tax assets to reflect our latest assessmentof the amount of deferred tax assets that is probable will be realized.
A deferred income tax asset totaling $661 million (December 31, 2016:$569 million) has been recorded in Canada. This deferred tax assetprimarily arose from derivative realized losses, finance costs, andgeneral and administrative expenses. A deferred tax asset totaling$98 million (December 31, 2016: $126 million) has been recorded in aforeign subsidiary. This deferred tax asset primarily arose from arealized loss on internal restructuring of subsidiary corporations.Projections of various sources of income support the conclusion that therealizability of these deferred tax assets is probable and
consequently, we have fully recognized these deferred tax assets.
Deferred Tax Assets Not Recognized
As at December31, 2017
As at December 31, 2016
Australia $158 $162 Canada 388 377 United States — 115 Chile 993 890 Argentina 515 599 Barbados 66 66 Tanzania 209 183 Zambia 50 151 Saudi Arabia 70 70 $2,449 $2,613
Deferred Tax Assets Not Recognized relate to: non-capital loss carryforwards of $690 million (2016: $638 million), capital loss carry forwardswith no expiry date of $452 million (2016: $440 million), US AMT credits of$nil (2016: $113 million) and other deductible temporary differences withno expiry date of $1,307 million (2016: $1,422 million). Source of Changes in Deferred Tax Balances
For the years ended December 31 2017 2016 Temporary differences Property, plant and equipment $295 ($297) Environmental rehabilitation (45) 79 Tax loss carry forwards 191 259 Inventory 26 (94) Derivatives (16) (16) Other (84) 39 $367 ($30) Intraperiod allocation to: Income from continuing operations before incometaxes ($106) ($8) Cerro Casale disposition 469 — Veladero disposition 16 — OCI (12) (22) $367 ($30) Income Tax Related Contingent Liabilities 2017 2016 At January 1 $128 $61 Net additions based on uncertain tax positionsrelated to prior years 178 70 Reductions for tax positions of prior years — (3) At December 31 1 $306 $128 1 If reversed, the total amount of $306 million would be recognized as a benefit to
income taxes on the income statement, and therefore would impact the reportedeffective tax rate.
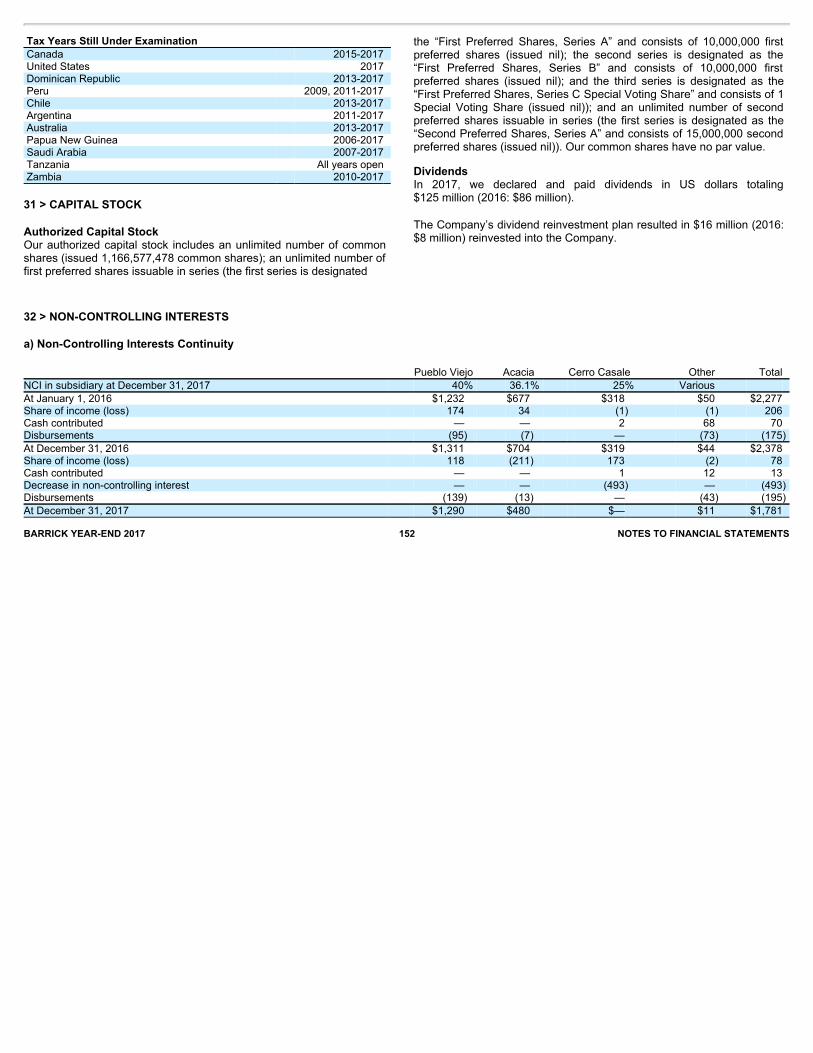
32 > NON-CONTROLLING INTERESTS
a) Non-Controlling Interests Continuity Pueblo Viejo Acacia Cerro Casale Other Total NCI in subsidiary at December 31, 2017 40% 36.1% 25% Various At January 1, 2016 $1,232 $677 $318 $50 $2,277 Share of income (loss) 174 34 (1) (1) 206 Cash contributed — — 2 68 70 Disbursements (95) (7) — (73) (175) At December 31, 2016 $1,311 $704 $319 $44 $2,378 Share of income (loss) 118 (211) 173 (2) 78 Cash contributed — — 1 12 13 Decrease in non-controlling interest — — (493) — (493) Disbursements (139) (13) — (43) (195) At December 31, 2017 $1,290 $480 $— $11 $1,781 BARRICK YEAR-END 2017 152 NOTES TO FINANCIAL STATEMENTS
Tax Years Still Under Examination Canada 2015-2017 United States 2017 Dominican Republic 2013-2017 Peru 2009, 2011-2017 Chile 2013-2017 Argentina 2011-2017 Australia 2013-2017 Papua New Guinea 2006-2017 Saudi Arabia 2007-2017 Tanzania All years open Zambia 2010-2017
31 > CAPITAL STOCK
Authorized Capital StockOur authorized capital stock includes an unlimited number of commonshares (issued 1,166,577,478 common shares); an unlimited number offirst preferred shares issuable in series (the first series is designated
the “First Preferred Shares, Series A” and consists of 10,000,000 firstpreferred shares (issued nil); the second series is designated as the“First Preferred Shares, Series B” and consists of 10,000,000 firstpreferred shares (issued nil); and the third series is designated as the“First Preferred Shares, Series C Special Voting Share” and consists of 1Special Voting Share (issued nil)); and an unlimited number of secondpreferred shares issuable in series (the first series is designated as the“Second Preferred Shares, Series A” and consists of 15,000,000 secondpreferred shares (issued nil)). Our common shares have no par value.
DividendsIn 2017, we declared and paid dividends in US dollars totaling$125 million (2016: $86 million).
The Company’s dividend reinvestment plan resulted in $16 million (2016:$8 million) reinvested into the Company.

b) Summarized Financial Information on Subsidiaries with Material Non-Controlling Interests
Summarized Balance Sheets Pueblo Viejo Acacia
As at December
31, 2017 As at December
31, 2016 As at December
31, 2017 As at December
31, 2016 Current assets $488 $833 $464 $673 Non-current assets 3,489 3,703 1,333 1,725 Total assets $3,977 $4,536 $1,797 $2,398 Current liabilities 907 1,357 212 71 Non-current liabilities 248 603 280 381 Total liabilities $1,155 $1,960 $492 $452
Summarized Statements of Income Pueblo Viejo Acacia For the years ended December 31 2017 2016 2017 2016 Revenue $1,417 $1,548 $751 $1,045 Income (loss) from continuing operations after tax 293 810 (630) 81 Other comprehensive income (loss) — — — — Total comprehensive income (loss) $293 $810 ($630) $81 Dividends paid to NCI $— $— $13 $7
Summarized Statements of Cash Flows Pueblo Viejo Acacia For the years ended December 31 2017 2016 2017 2016 Net cash provided by (used in) operating activities $283 $602 ($15) $324 Net cash used in investing activities (112) (54) (160) (190) Net cash provided by (used in) financing activities (539) (350) (62) (49) Net increase (decrease) in cash and cash equivalents ($368) $198 ($237) $85
BARRICK YEAR-END 2017 153 NOTES TO FINANCIAL STATEMENTS
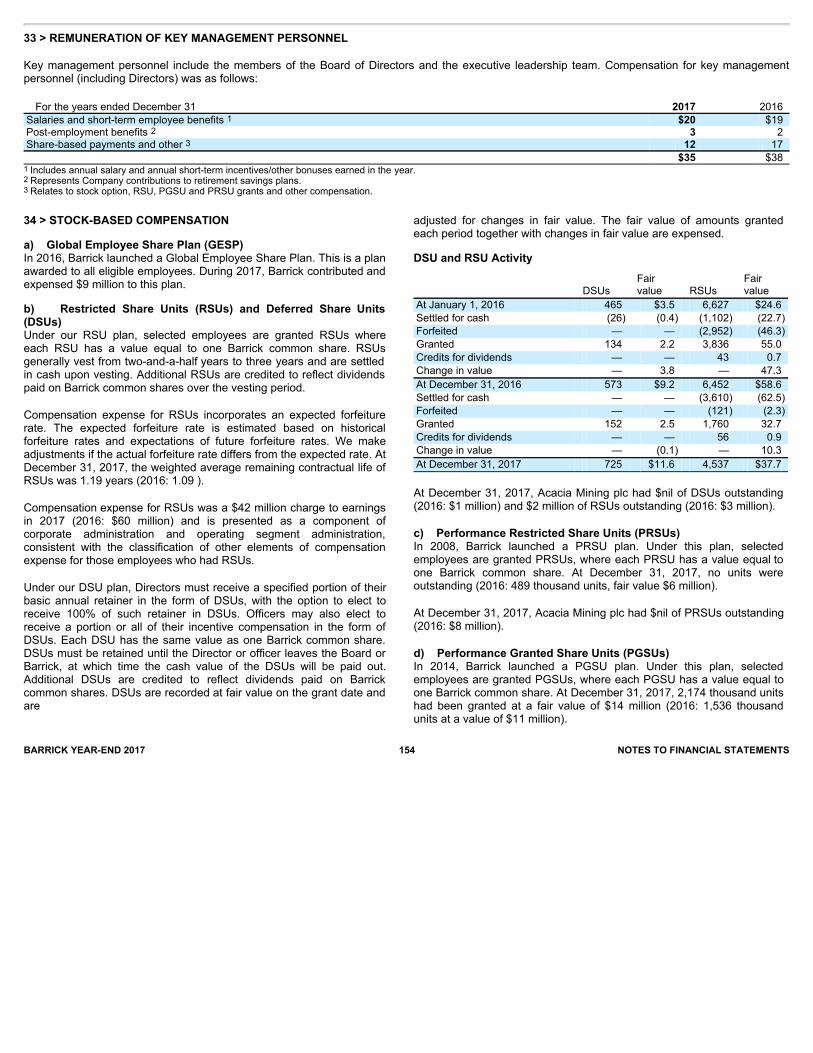
33 > REMUNERATION OF KEY MANAGEMENT PERSONNEL
Key management personnel include the members of the Board of Directors and the executive leadership team. Compensation for key managementpersonnel (including Directors) was as follows: For the years ended December 31 2017 2016 Salaries and short-term employee benefits 1 $20 $19 Post-employment benefits 2 3 2 Share-based payments and other 3 12 17 $35 $38 1 Includes annual salary and annual short-term incentives/other bonuses earned in the year.2 Represents Company contributions to retirement savings plans.3 Relates to stock option, RSU, PGSU and PRSU grants and other compensation.
BARRICK YEAR-END 2017 154 NOTES TO FINANCIAL STATEMENTS
34 > STOCK-BASED COMPENSATION
a) Global Employee Share Plan (GESP)In 2016, Barrick launched a Global Employee Share Plan. This is a planawarded to all eligible employees. During 2017, Barrick contributed andexpensed $9 million to this plan.
b) Restricted Share Units (RSUs) and Deferred Share Units(DSUs)Under our RSU plan, selected employees are granted RSUs whereeach RSU has a value equal to one Barrick common share. RSUsgenerally vest from two-and-a-half years to three years and are settledin cash upon vesting. Additional RSUs are credited to reflect dividendspaid on Barrick common shares over the vesting period.
Compensation expense for RSUs incorporates an expected forfeiturerate. The expected forfeiture rate is estimated based on historicalforfeiture rates and expectations of future forfeiture rates. We makeadjustments if the actual forfeiture rate differs from the expected rate. AtDecember 31, 2017, the weighted average remaining contractual life ofRSUs was 1.19 years (2016: 1.09 ).
Compensation expense for RSUs was a $42 million charge to earningsin 2017 (2016: $60 million) and is presented as a component ofcorporate administration and operating segment administration,consistent with the classification of other elements of compensationexpense for those employees who had RSUs.
Under our DSU plan, Directors must receive a specified portion of theirbasic annual retainer in the form of DSUs, with the option to elect toreceive 100% of such retainer in DSUs. Officers may also elect toreceive a portion or all of their incentive compensation in the form ofDSUs. Each DSU has the same value as one Barrick common share.DSUs must be retained until the Director or officer leaves the Board orBarrick, at which time the cash value of the DSUs will be paid out.Additional DSUs are credited to reflect dividends paid on Barrickcommon shares. DSUs are recorded at fair value on the grant date andare
adjusted for changes in fair value. The fair value of amounts grantedeach period together with changes in fair value are expensed.
DSU and RSU Activity
DSUs Fair value RSUs
Fair value
At January 1, 2016 465 $3.5 6,627 $24.6 Settled for cash (26) (0.4) (1,102) (22.7) Forfeited — — (2,952) (46.3) Granted 134 2.2 3,836 55.0 Credits for dividends — — 43 0.7 Change in value — 3.8 — 47.3 At December 31, 2016 573 $9.2 6,452 $58.6 Settled for cash — — (3,610) (62.5) Forfeited — — (121) (2.3) Granted 152 2.5 1,760 32.7 Credits for dividends — — 56 0.9 Change in value — (0.1) — 10.3 At December 31, 2017 725 $11.6 4,537 $37.7
At December 31, 2017, Acacia Mining plc had $nil of DSUs outstanding(2016: $1 million) and $2 million of RSUs outstanding (2016: $3 million).
c) Performance Restricted Share Units (PRSUs)In 2008, Barrick launched a PRSU plan. Under this plan, selectedemployees are granted PRSUs, where each PRSU has a value equal toone Barrick common share. At December 31, 2017, no units wereoutstanding (2016: 489 thousand units, fair value $6 million).
At December 31, 2017, Acacia Mining plc had $nil of PRSUs outstanding(2016: $8 million).
d) Performance Granted Share Units (PGSUs)In 2014, Barrick launched a PGSU plan. Under this plan, selectedemployees are granted PGSUs, where each PGSU has a value equal toone Barrick common share. At December 31, 2017, 2,174 thousand unitshad been granted at a fair value of $14 million (2016: 1,536 thousandunits at a value of $11 million).

Employee Stock Option Activity (Number of Shares in Millions)
2017 2016
Shares Average
Price Shares Average Price C$ options At January 1 0.3 $13 0.3 $13 Granted — — — — Cancelled/expired — — — — At December 31 0.3 $13 0.3 $13 US$ options At January 1 1.8 $42 2.6 $42 Forfeited (0.7) 40 (0.4) 45 Cancelled/expired (0.4) 45 (0.4) 39 At December 31 0.7 $40 1.8 $42
Stock Options Outstanding (Number of Shares in Millions) Outstanding Exercisable
Range of exercise prices Shares Average price Average life
(years)
Intrinsic value
1 ($ millions) Shares Average price
Intrinsic value1
($ millions) C$ options $ 9 - $ 17 0.2 $10 4.6 $2 0.1 $10 $1 $ 18 - $ 21 0.1 18 2.6 — 0.1 18 — 0.3 $13 3.9 $2 0.2 $14 $1 US$ options $ 32 - $ 41 0.4 $32 2.0 $— 0.4 $33 $— $ 42 - $ 55 0.3 49 1.0 — 0.3 49 — 0.7 $40 1.5 $— 0.7 $40 $— 1 Based on the closing market share price on December 31, 2017 of C $18.18 and US $14.47.
As at December 31, 2017, there was $nil (2016: $0.1 million) of total unrecognized compensation cost relating to unvested stock options. We expect torecognize this cost over a weighted average period of 1 year (2016: 1 year).BARRICK YEAR-END 2017 155 NOTES TO FINANCIAL STATEMENTS
e) Employee Share Purchase Plan (ESPP)In 2008, Barrick launched an Employee Share Purchase Plan. This planenables Barrick employees to purchase Company shares throughpayroll deduction. During 2017, Barrick contributed and expensed$0.4 million to this plan (2016: $0.3 million).
f) Stock OptionsUnder Barrick’s stock option plan, certain officers and key employees ofthe Corporation may purchase common shares at an exercise price thatis equal to the closing share price on the day before the grant of theoption. The grant date is the date when the details of the award,including the number of options granted by individual and the exerciseprice, are approved. Stock options vest evenly over four years,beginning in the year after granting. Options are exercisable over sevenyears. At
December 31, 2017, 1.0 million (2016: 2.1 million) stock options wereoutstanding.
Compensation expense for stock options was $nil in 2017 (2016: $nil ),and is presented as a component of corporate administration andoperating segment administration, consistent with the classification ofother elements of compensation expense for those employees who hadstock options. The recognition of compensation expense for stock optionshad no impact on earnings per share for 2017 and 2016.
Total intrinsic value relating to options exercised in 2017 was $nil (2016:$nil).
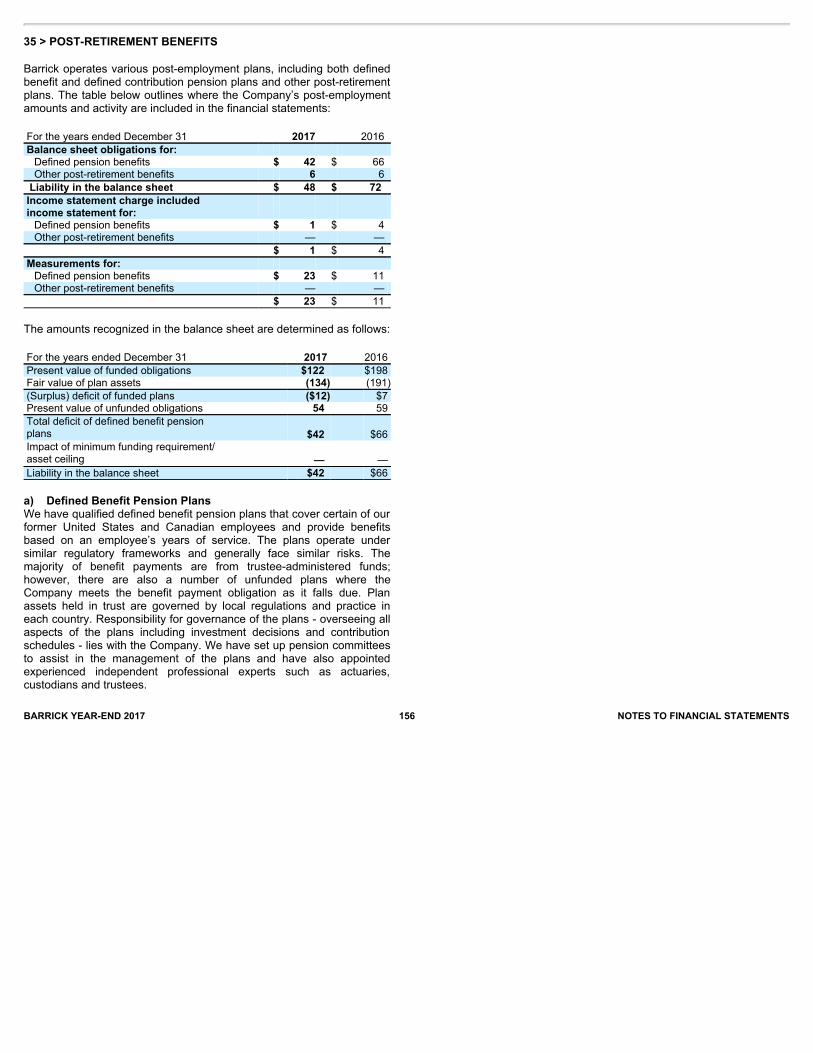
BARRICK YEAR-END 2017 156 NOTES TO FINANCIAL STATEMENTS
35 > POST-RETIREMENT BENEFITS
Barrick operates various post-employment plans, including both definedbenefit and defined contribution pension plans and other post-retirementplans. The table below outlines where the Company’s post-employmentamounts and activity are included in the financial statements: For the years ended December 31 2017 2016 Balance sheet obligations for: Defined pension benefits $ 42 $ 66 Other post-retirement benefits 6 6
Liability in the balance sheet $ 48 $ 72 Income statement charge included income statement for: Defined pension benefits $ 1 $ 4 Other post-retirement benefits — —
$ 1 $ 4 Measurements for: Defined pension benefits $ 23 $ 11 Other post-retirement benefits — —
$ 23 $ 11
The amounts recognized in the balance sheet are determined as follows: For the years ended December 31 2017 2016 Present value of funded obligations $122 $198 Fair value of plan assets (134) (191) (Surplus) deficit of funded plans ($12) $7 Present value of unfunded obligations 54 59 Total deficit of defined benefit pension plans $42 $66 Impact of minimum funding requirement/ asset ceiling — — Liability in the balance sheet $42 $66
a) Defined Benefit Pension PlansWe have qualified defined benefit pension plans that cover certain of ourformer United States and Canadian employees and provide benefitsbased on an employee’s years of service. The plans operate undersimilar regulatory frameworks and generally face similar risks. Themajority of benefit payments are from trustee-administered funds;however, there are also a number of unfunded plans where theCompany meets the benefit payment obligation as it falls due. Planassets held in trust are governed by local regulations and practice ineach country. Responsibility for governance of the plans - overseeing allaspects of the plans including investment decisions and contributionschedules - lies with the Company. We have set up pension committeesto assist in the management of the plans and have also appointedexperienced independent professional experts such as actuaries,custodians and trustees.
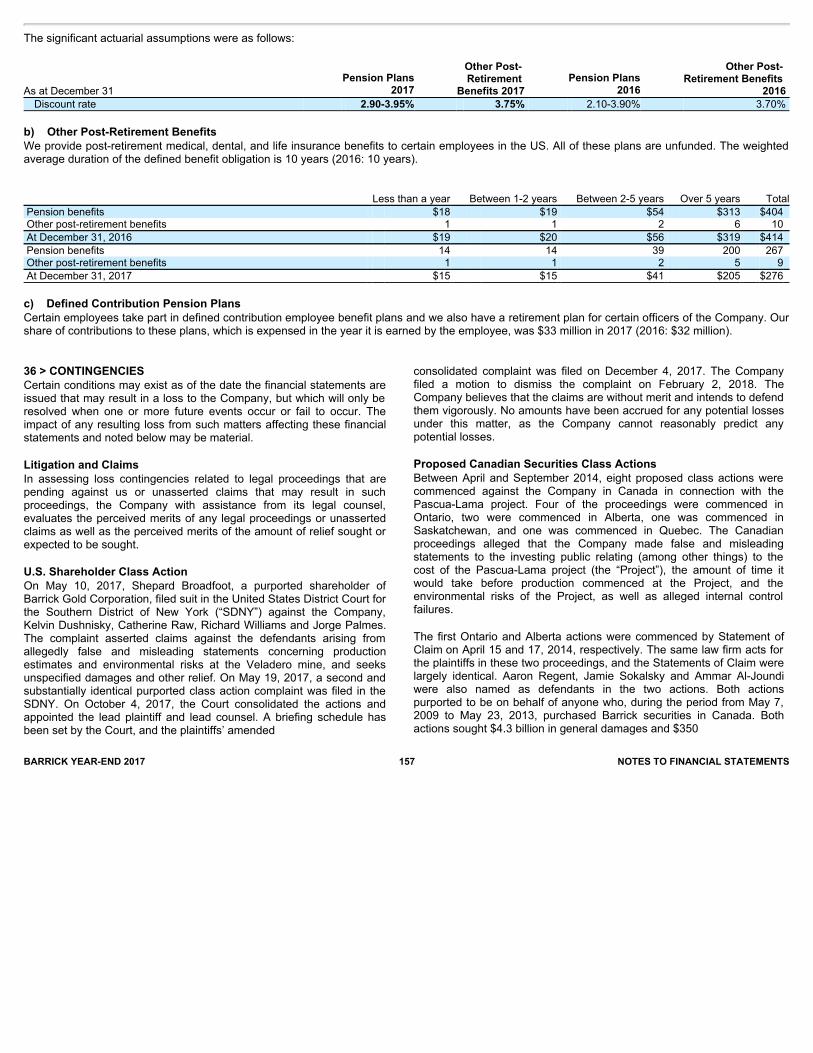
The significant actuarial assumptions were as follows:
As at December 31 Pension Plans
2017
Other Post- Retirement
Benefits 2017 Pension Plans
2016
Other Post- Retirement Benefits
2016 Discount rate 2.90-3.95% 3.75% 2.10-3.90% 3.70%
b) Other Post-Retirement BenefitsWe provide post-retirement medical, dental, and life insurance benefits to certain employees in the US. All of these plans are unfunded. The weightedaverage duration of the defined benefit obligation is 10 years (2016: 10 years).
Less than a year Between 1-2 years Between 2-5 years Over 5 years Total Pension benefits $18 $19 $54 $313 $404 Other post-retirement benefits 1 1 2 6 10 At December 31, 2016 $19 $20 $56 $319 $414 Pension benefits 14 14 39 200 267 Other post-retirement benefits 1 1 2 5 9 At December 31, 2017 $15 $15 $41 $205 $276
c) Defined Contribution Pension PlansCertain employees take part in defined contribution employee benefit plans and we also have a retirement plan for certain officers of the Company. Ourshare of contributions to these plans, which is expensed in the year it is earned by the employee, was $33 million in 2017 (2016: $32 million).
BARRICK YEAR-END 2017 157 NOTES TO FINANCIAL STATEMENTS
36 > CONTINGENCIESCertain conditions may exist as of the date the financial statements areissued that may result in a loss to the Company, but which will only beresolved when one or more future events occur or fail to occur. Theimpact of any resulting loss from such matters affecting these financialstatements and noted below may be material.
Litigation and ClaimsIn assessing loss contingencies related to legal proceedings that arepending against us or unasserted claims that may result in suchproceedings, the Company with assistance from its legal counsel,evaluates the perceived merits of any legal proceedings or unassertedclaims as well as the perceived merits of the amount of relief sought orexpected to be sought.
U.S. Shareholder Class ActionOn May 10, 2017, Shepard Broadfoot, a purported shareholder ofBarrick Gold Corporation, filed suit in the United States District Court forthe Southern District of New York (“SDNY”) against the Company,Kelvin Dushnisky, Catherine Raw, Richard Williams and Jorge Palmes.The complaint asserted claims against the defendants arising fromallegedly false and misleading statements concerning productionestimates and environmental risks at the Veladero mine, and seeksunspecified damages and other relief. On May 19, 2017, a second andsubstantially identical purported class action complaint was filed in theSDNY. On October 4, 2017, the Court consolidated the actions andappointed the lead plaintiff and lead counsel. A briefing schedule hasbeen set by the Court, and the plaintiffs’ amended
consolidated complaint was filed on December 4, 2017. The Companyfiled a motion to dismiss the complaint on February 2, 2018. TheCompany believes that the claims are without merit and intends to defendthem vigorously. No amounts have been accrued for any potential lossesunder this matter, as the Company cannot reasonably predict anypotential losses.
Proposed Canadian Securities Class ActionsBetween April and September 2014, eight proposed class actions werecommenced against the Company in Canada in connection with thePascua-Lama project. Four of the proceedings were commenced inOntario, two were commenced in Alberta, one was commenced inSaskatchewan, and one was commenced in Quebec. The Canadianproceedings alleged that the Company made false and misleadingstatements to the investing public relating (among other things) to thecost of the Pascua-Lama project (the “Project”), the amount of time itwould take before production commenced at the Project, and theenvironmental risks of the Project, as well as alleged internal controlfailures.
The first Ontario and Alberta actions were commenced by Statement ofClaim on April 15 and 17, 2014, respectively. The same law firm acts forthe plaintiffs in these two proceedings, and the Statements of Claim werelargely identical. Aaron Regent, Jamie Sokalsky and Ammar Al-Joundiwere also named as defendants in the two actions. Both actionspurported to be on behalf of anyone who, during the period from May 7,2009 to May 23, 2013, purchased Barrick securities in Canada. Bothactions sought $4.3 billion in general damages and $350
BARRICK YEAR-END 2017 158 NOTES TO FINANCIAL STATEMENTS
million in special damages for alleged misrepresentations in theCompany’s public disclosure. The first Ontario action was subsequentlyconsolidated with the fourth Ontario action, as discussed below. The firstAlberta action was discontinued by plaintiffs’ counsel on June 26, 2015.
The second Ontario action was commenced on April 24, 2014. AaronRegent, Jamie Sokalsky, Ammar Al-Joundi and Peter Kinver were alsonamed as defendants. Following a September 8, 2014 amendment tothe Statement of Claim, this action purported to be on behalf of anyonewho acquired Barrick securities during the period from October 29, 2010to October 30, 2013, and sought $3 billion in damages for allegedmisrepresentations in the Company’s public disclosure. The amendedclaim also reflected the addition of a law firm that previously acted ascounsel in a third Ontario action, which was commenced by Notice ofAction on April 28, 2014 and included similar allegations but was neverserved or pursued. As a result of the outcome of the carriage motion andappeals described below, the second Ontario action has now beenstayed.
The Quebec action was commenced on April 30, 2014. Aaron Regent,Jamie Sokalsky, Ammar Al-Joundi and Peter Kinver are also named asdefendants. This action purported to be on behalf of any person whoresides in Quebec and acquired Barrick securities during the period fromMay 7, 2009 to November 1, 2013. The action seeks unspecifieddamages for alleged misrepresentations in the Company’s publicdisclosure.
The second Alberta action was commenced on May 23, 2014. AaronRegent, Jamie Sokalsky, Ammar Al-Joundi and Peter Kinver are alsonamed as defendants. This action purports to be on behalf of any personwho acquired Barrick securities during the period from May 7, 2009 toNovember 1, 2013, and sought $6 billion in damages for allegedmisrepresentations in the Company’s public disclosure. The action wasdismissed on consent on June 19, 2017.
The Saskatchewan action was commenced by Statement of Claim onMay 26, 2014. Aaron Regent, Jamie Sokalsky, Ammar Al-Joundi andPeter Kinver were also named as defendants. This action purported tobe on behalf of any person who acquired Barrick securities during theperiod from May 7, 2009 to November 1, 2013, and sought $6 billion indamages for alleged misrepresentations in the Company’s publicdisclosure. The action was discontinued by plaintiffs’ counsel onDecember 19, 2016.
The fourth Ontario action was commenced on September 5, 2014.Aaron Regent, Jamie Sokalsky, Ammar Al-Joundi and Peter Kinver arealso named as defendants. This action purports to be on behalf of anyperson who acquired Barrick securities during the period from May 7,
2009 to November 1, 2013 in Canada, and seeks $3 billion in damagesplus an unspecified amount for alleged misrepresentations in theCompany’s public disclosure. The Statement of Claim was amended onOctober 20, 2014, to include two additional law firms, one of which wasacting as counsel in the first Ontario action referred to above and the otherof which no longer exists. In January 2018, plaintiffs’ counsel delivered aconsolidated statement of claim in this action.
In November 2014, an Ontario court heard a motion to determine which ofthe competing counsel groups would take the lead in the Ontario litigation.The court issued a decision in December 2014 in favor of the counselgroup that commenced the first and fourth Ontario actions, which havebeen consolidated in a single action. The lower court’s decision wassubsequently affirmed by the Divisional Court in May 2015 and the Courtof Appeal for Ontario in July 2016 following appeals by the losing counselgroup. The losing counsel group sought leave to appeal to the SupremeCourt of Canada but later discontinued the application after reaching anagreement with the counsel group that commenced the first and fourthOntario actions.
The proposed representative plaintiffs in the Quebec and Ontario actionshave brought motions seeking: (i) leave to proceed with statutorymisrepresentation claims pursuant to provincial securities legislation; and(ii) orders certifying the actions as class actions. It is expected that theQuebec motions will be heard in late February 2019, while the motion forleave to proceed in the Ontario action will be heard in early April 2019(with the certification motion to be heard concurrently or shortlythereafter).
The Company intends to vigorously defend all of the proposed Canadiansecurities class actions. No amounts have been recorded for any potentialliability arising from any of the proposed class actions, as the Companycannot reasonably predict the outcome.
Pascua-Lama – SMA Regulatory SanctionsIn May 2013, Compañía Minera Nevada (“CMN”), Barrick’s Chileansubsidiary that holds the Chilean portion of the Pascua-Lama project (the“Project”), received a Resolution (the “Original Resolution”) from Chile’senvironmental regulator (the Superintendencia del Medio Ambiente, or“SMA”) that requires the company to complete the water managementsystem for the Project in accordance with the Project’s environmentalpermit before resuming construction activities in Chile. The OriginalResolution also required CMN to pay an administrative fine ofapproximately $16 million for deviations from certain requirements of theProject’s Chilean environmental approval, including a series of reportingrequirements and instances of non-compliance related to the Project’swater management system. CMN paid the administrative fine in May2013.
BARRICK YEAR-END 2017 159 NOTES TO FINANCIAL STATEMENTS
In June 2013, CMN began engineering studies to review the Project’swater management system in accordance with the Original Resolution.The studies were suspended in the second half of 2015 as a result ofCMN’s decision to file a temporary and partial closure plan for theProject (for more information about this plan, see “Pascua-Lama -Constitutional Protection Action” below). The review of the Project’swater management system may require a new environmental approvaland the construction of additional water management facilities.
In June 2013, a group of local farmers and indigenous communitieschallenged the Original Resolution. The challenge, which was brought inthe Environmental Court of Santiago, Chile (the “Environmental Court”),claimed that the fine was inadequate and requested more severesanctions against CMN including the revocation of the Project’senvironmental permit. The SMA presented its defense of the OriginalResolution in July 2013. On August 2, 2013, CMN joined as a party tothis proceeding and vigorously defended the Original Resolution. OnMarch 3, 2014, the Environmental Court annulled the Original Resolutionand remanded the matter back to the SMA for further consideration inaccordance with its decision (the “Environmental Court Decision”). Inparticular, the Environmental Court ordered the SMA to issue a newadministrative decision that recalculated the amount of the fine to bepaid by CMN using a different methodology and addressed certain othererrors it identified in the Resolution. The Environmental Court did notannul the portion of the Original Resolution that required the Company tohalt construction on the Chilean side of the Project until the watermanagement system is completed in accordance with the Project’senvironmental permit. On December 30, 2014, the Chilean SupremeCourt declined to consider CMN’s appeal of the Environmental CourtDecision on procedural grounds. As a result of the Supreme Court’sruling, on April 22, 2015, the SMA reopened the administrativeproceeding against CMN in accordance with the Environmental CourtDecision.
On April 22, 2015, CMN was notified that the SMA had initiated a newadministrative proceeding for alleged deviations from certainrequirements of the Project’s environmental approval, including withrespect to the Project’s environmental impact and a series of monitoringrequirements. In May 2015, CMN submitted a compliance program toaddress certain of the allegations and presented its defense to theremainder of the alleged deviations. The SMA rejected CMN’s proposedcompliance program on June 24, 2015, and denied CMN’sadministrative appeal of that decision on July 31, 2015. OnDecember 30, 2016, the Environmental Court rejected CMN’s appealand CMN declined to challenge this decision.
On June 8, 2016, the SMA consolidated the two administrativeproceedings against CMN into a single
proceeding encompassing both the reconsideration of the OriginalResolution in accordance with the decision of the Environmental Courtand the alleged deviations from the Project’s environmental approvalnotified by the SMA in April 2015.
On January 17, 2018, CMN received the revised resolution (the “RevisedResolution”) from the SMA, in which the environmental regulator reducedthe original administrative fine from approximately $16 million to$11.5 million and ordered the closure of existing surface facilities on theChilean side of the Project in addition to certain monitoring activities. TheRevised Resolution does not revoke the Project’s environmental approval.CMN filed an appeal of the Revised Resolution on February 3, 2018.
In light of the SMA’s decision, the Company has reversed the estimatedamount previously recorded for any additional proposed administrativefines in this matter. In addition, the Company has reclassified Pascua-Lama’s proven and probable gold reserves as measured and indicatedresources and recorded a pre-tax impairment of $429 million. See note 21of these Financial Statements for information related to impairment lossesarising from this matter.
Pascua-Lama – Constitutional Protection ActionCMN filed a temporary and partial closure plan for the Pascua-Lamaproject (the “Temporary Closure Plan”) with the Chilean mining authority(Sernageomin) on August 31, 2015. Sernageomin approved theTemporary Closure Plan on September 29, 2015, and issued a resolutionrequiring CMN to comply with certain closure-related maintenance andmonitoring obligations for a period of two years. The Temporary ClosurePlan does not address certain facilities, including the Project’s watermanagement system, which remain subject to the requirements of theProject’s original environmental approval and other regulations.
On December 4, 2015, a constitutional protection action was filed in theCourt of Appeals of Santiago, Chile by a group of local farmers and otherindividuals against CMN and Sernageomin in order to challenge theTemporary Closure Plan and the resolution that approved it. The plaintiffsasserted that the Temporary Closure Plan cannot be approved until thewater management system for the Project has been completed inaccordance with the Project’s environmental permit. On August 12, 2016,the court ruled in favor of CMN and Sernageomin, rejecting the plaintiffs’challenges to the Temporary Closure Plan for the Pascua-Lama project.The plaintiffs appealed the court’s decision to the Chilean Supreme Courtand on March 13, 2017, the Supreme Court vacated the TemporaryClosure Plan, ruling that additional information regarding the SMAregulatory sanction process was required from the environmentalregulator, and ordering Sernageomin to issue a new resolution on
BARRICK YEAR-END 2017 160 NOTES TO FINANCIAL STATEMENTS
the Temporary Closure Plan after receiving such information. OnAugust 29, 2017, Sernageomin issued a new resolution in which itreapproved the Temporary Closure Plan as originally issued. Thisapproval is valid through September 2019.
Pascua-Lama – Water Quality ReviewCMN initiated a review of the baseline water quality of the Rio Estrechoin August 2013 as required by a July 15, 2013 decision of the Court ofAppeals of Copiapo, Chile. The purpose of the review was to establishwhether the water quality baseline has changed since the Pascua-Lamaproject received its environmental approval in February 2006 and, if so,to require CMN to adopt the appropriate corrective measures. As aresult of that study, CMN requested certain modifications to itsenvironmental permit water quality requirements. On June 6, 2016, theresponsible agency approved a partial amendment of the environmentalpermit to better reflect the water quality baseline from 2009. Thatapproval was appealed by certain water users and indigenous residentsof the Huasco Valley. On October 19, 2016, the Chilean Committee ofMinisters for the Environment, which has jurisdiction over claims of thisnature, voted to uphold the permit amendments. On January 27, 2017,the Environmental Court agreed to consider an appeal of the ChileanCommittee’s decision brought by CMN and the water users andindigenous residents. A hearing took place on July 25, 2017. OnDecember 12, 2017, the water users withdrew their appeal. TheEnvironmental Court dismissed that appeal on January 5, 2018. Adecision of the Environmental Court on the remaining appeals is stillpending. No amounts have been recorded for any potential liabilityarising from this matter, as the Company cannot reasonably predict anypotential losses.
Veladero – September 2015 Release of Cyanide-Bearing ProcessSolution
San Juan Provincial Regulatory Sanction ProceedingOn September 13, 2015, a valve on a leach pad pipeline at theCompany’s Veladero mine in San Juan Province, Argentina failed,resulting in a release of cyanide-bearing process solution into a nearbywaterway through a diversion channel gate that was open at the time ofthe incident. Minera Argentina Gold SRL (“MAG”) (formerly, MineraArgentina Gold S.A. or MAGSA), Barrick’s Argentine subsidiary thatoperates the Veladero mine, notified regulatory authorities of thesituation. Environmental monitoring was conducted by MAG andindependent third parties following the incident. The Company believesthis monitoring demonstrates that the incident posed no risk to humanhealth at downstream communities. A temporary restriction on theaddition of new cyanide to the mine’s processing circuit was lifted onSeptember 24, 2015, and mine operations returned to normal.Monitoring and inspection of the mine site will continue in accordancewith a court order.
On October 9, 2015, the San Juan mining authority initiated anadministrative sanction process against MAG for alleged violations of themining code relating to the valve failure and release of cyanide-bearingprocess solution. MAG submitted its response to these allegations inOctober 2015 and provided additional information in January 2016.
On March 11, 2016, the San Juan Provincial mining authority announcedits intention to impose an administrative fine against MAG in connectionwith the solution release. MAG was formally notified of this decision onMarch 15, 2016. On April 6, 2016, MAG sought reconsideration of certainaspects of the decision but did not challenge the amount of theadministrative fine. On April 14, 2016, in accordance with localrequirements, MAG paid the administrative fine of approximately$10 million (at the then-applicable Argentinean peso/$ exchange rate)while the request for reconsideration was pending. On December 29,2016, the request for reconsideration was rejected by the Provincialmining authority. On July 11, 2017, the San Juan government rejectedMAG’s final administrative appeal of this decision. On September 5, 2017,the Company commenced a legal action to continue challenging certainaspects of the decision before the San Juan courts. MAG hasimplemented a remedial action plan at Veladero in response to theincident as required by the San Juan mining authority.
Criminal MattersOn March 11, 2016, a San Juan Provincial court laid criminal chargesbased on alleged negligence against nine current and former MAGemployees in connection with the solution release (the “ProvincialAction”). On August 15, 2017, the Court of Appeals confirmed theindictment against eight of the nine individuals that had been charged withalleged negligence in connection with the solution release. The individualdefendants filed a special appeal, called a “cassation” appeal, of theindictments with the San Juan Supreme Court, which was rejected onAugust 31, 2017. The San Juan Provincial court rejected the defendants’motion to dismiss on November 30, 2017, and the defendants appealedthis decision on December 4, 2017. A trial date has not yet been set. MAGis not a party to the Provincial Action.
In addition, a federal criminal investigation was initiated by a Buenos Airesfederal court based on the alleged failure of certain current and formerfederal and provincial government officials and individual directors of MAGto prevent the solution release (the “Federal Investigation”). The federaljudge overseeing the Federal Investigation admitted a local group in SanJuan Province as a party. In March 2016, this group requested aninjunction against the operations of the Veladero mine. The federal judgeordered technical studies to assess the solution release and its impactand appointed a committee to conduct a site visit, which occurred in lateApril 2016.
BARRICK YEAR-END 2017 161 NOTES TO FINANCIAL STATEMENTS
On May 5, 2016, the National Supreme Court of Argentina limited thescope of the Federal Investigation to the potential criminal liability of thefederal government officials, ruling that the Buenos Aires federal courtdoes not have jurisdiction to investigate the solution release. As a resultof this decision, the investigation into the incident will continue to beconducted by the San Juan Provincial judge in the Provincial Action. Todate, no charges have been laid against any specific individuals inconnection with the Federal Investigation, consistent with its more limitedscope.
On October 17, 2016, a separate criminal investigation was initiated bythe federal judge overseeing the Federal Investigation based on thealleged failure of federal government officials to regulate the Veladeromine under Argentina’s glacier legislation (see “Argentine GlacierLegislation and Constitutional Litigation” below). On June 16, 2017, MAGsubmitted a motion to challenge the federal judge’s decision to assignthis investigation to himself. MAG also requested to be admitted as aparty to the proceeding in order to present evidence in support of theMAG. On September 14, 2017, the Court of Appeals consolidated thetwo investigations before the federal judge and allowed MAG toparticipate in the consolidated Federal Investigation. On November 21,2017, the Court of Appeals clarified that MAG is not a party to the caseand therefore did not have standing to seek the recusal of the federaljudge. The Court recognized MAG’s right to continue to participate in thecase without clarifying the scope of those rights.
On November 27, 2017, the federal judge indicted four former federalgovernment officials, alleging abuse of authority in connection with theiractions and omissions related to the enforcement of Argentina’s nationalglacier legislation including the methodology used to complete thenational inventory of glaciers, a portion of which was published onOctober 3, 2016, and also requiring the National Ministry of theEnvironment and Sustainable Development to determine if there hasbeen any environmental damage to glaciers since the glacier law wentinto effect in light of his decision. On December 12, 2017, the NationalMinistry of the Environment and Sustainable Development clarified that itdoes not have jurisdiction to audit environmental damage to glaciers, asthis is the responsibility of the Provincial authorities.
No amounts have been recorded for any potential liability arising fromthese matters, as the Company cannot reasonably predict any potentiallosses.
Veladero – September 2016 Release of Crushed Ore Saturated withProcess SolutionTemporary Suspension of Operations and Regulatory InfringementProceedingOn September 8, 2016, ice rolling down the slope of the leach pad at theVeladero mine damaged a pipe carrying process solution, causing somematerial to leave the leach pad. This material, primarily crushed oresaturated with process solution, was contained on the mine site andreturned to the leach pad. Extensive water monitoring in the areaconducted by MAG has confirmed that the incident did not result in anyenvironmental impacts. A temporary suspension of operations at theVeladero mine was ordered by the San Juan Provincial mining authorityand a San Juan Provincial court on September 15, 2016 andSeptember 22, 2016, respectively, as a result of this incident. OnOctober 4, 2016, following, among other matters, the completion of certainurgent works required by the San Juan Provincial mining authority and ajudicial inspection of the mine, the San Juan Provincial court lifted thesuspension of operations and ordered that mining activities be resumed.
On September 14, 2016, the San Juan Provincial mining authoritycommenced an administrative proceeding in connection with this incidentthat included, in addition to the issue of the suspension order, aninfringement proceeding against MAG. On December 2, 2016, the SanJuan Provincial mining authority notified MAG of two charges under theinfringement proceeding for alleged violations of the Mining Code. A newcriminal judicial investigation has also been commenced by the Provincialprosecutor’s office in the same San Juan Provincial court that is hearingthe Provincial Action. The court in this proceeding issued the orderssuspending and resuming the operations at the Veladero mine describedabove.
On September 14, 2017, the San Juan Provincial mining authorityconsolidated the administrative proceeding into a single proceedingagainst MAG encompassing both the September 2016 incident and theMarch 2017 incident described below (see “Veladero - Release of Gold-bearing Process Solution”).
On December 27, 2017, MAG received notice of a resolution from the SanJuan Provincial mining authority requiring payment of an administrativefine of approximately $5.6 million (calculated at the prevailing exchangerate on December 31, 2017) encompassing both the September 2016incident and the March 2017 incident. On January 23, 2018, inaccordance with local requirements, MAG paid the administrative fine andfiled a request for reconsideration with the San Juan Provincial miningauthority, which remains pending.
BARRICK YEAR-END 2017 162 NOTES TO FINANCIAL STATEMENTS
Veladero Cyanide Leaching Process – Civil ActionOn December 15, 2016, MAG was served notice of a lawsuit by certainpersons who claim to be living in Jachal, Argentina and to be affected bythe Veladero mine and, in particular, the valley leach facility (“VLF”). Inthe lawsuit, which was filed in the San Juan Provincial court, the plaintiffshave requested a court order that MAG cease leaching metals withcyanide solutions, mercury and other similar substances at the Veladeromine and replace that process with one that is free of hazardoussubstances, that MAG implement a closure and remediation plan for theVLF and surrounding areas, and create a committee to monitor thisprocess. The lawsuit is proceeding as an ordinary civil action. MAGreplied to the lawsuit on February 20, 2017. On March 31, 2017, theplaintiffs supplemented their original complaint to allege that the risk ofenvironmental damage had increased as a result of the March 28, 2017release of gold-bearing process solution incident described below (see“Veladero - Release of Gold-bearing Process Solution”). The Companyresponded to the new allegations and intends to continue defending thismatter vigorously. No amounts have been recorded for any potentialliability or asset impairment under this matter, as the Company cannotreasonably predict the outcome.
Veladero - March 2017 Release of Gold-bearing Process Solution
Regulatory Infringement Proceeding and Temporary Suspension ofAddition of CyanideOn March 28, 2017, the monitoring system at the Company’s Veladeromine detected a rupture of a pipe carrying gold-bearing process solutionon the leach pad. This solution was contained within the operating site;no solution reached any diversion channels or watercourses. All affectedsoil was promptly excavated and placed on the leach pad. The Companynotified regulatory authorities of the situation, and San Juan provincialauthorities inspected the site on March 29, 2017.
On March 29, 2017, the San Juan provincial mining authority issued aviolation notice against MAG in connection with the incident and ordereda temporary restriction on the addition of new cyanide to the leach paduntil corrective actions on the system were completed. The miningauthority lifted the suspension on June 15, 2017, following inspection ofcorrective actions.
On March 30, 2017, the San Juan Mining Minister ordered thecommencement of a regulatory infringement proceeding against MAG aswell as a comprehensive evaluation of the mine’s operations to beconducted by representatives of the Company and the San Juanprovincial authorities. The Company filed its defense to the regulatoryinfringement proceeding on April 5, 2017. On September 14, 2017, theSan Juan Provincial mining authority consolidated this administrativeproceeding
into a single proceeding against MAG encompassing both the September2016 incident described above and the March 2017 incident. On October10, 2017, the San Juan Provincial mining authority notified MAG of twocharges under the infringement proceeding for alleged violations of theMining Code in connection with the March 2017 incident.
On December 27, 2017, MAG received notice of a resolution from the SanJuan Provincial mining authority requiring payment of an administrativefine of approximately $5.6 million (calculated at the prevailing exchangerate on December 31, 2017) encompassing both the September 2016incident described above and the March 2017 incident. On January 23,2018, in accordance with local requirements, MAG paid the administrativefine and filed a request for reconsideration with the San Juan Provincialmining authority, which remains pending.
Provincial Amparo ActionOn March 30, 2017, MAG was served notice of a lawsuit, called an “amparo ” protection action, filed in the Jachal First Instance Court (the“Jachal Court”) by individuals who claimed to be living in Jachal,Argentina, seeking the cessation of all activities at the Veladero mine. Theplaintiffs sought an injunction as part of the lawsuit, requesting, amongother things, the cessation of all activities at the Veladero mine or,alternatively, a suspension of the leaching process at the mine. OnMarch 30, 2017, the Jachal Court rejected the request for an injunction tocease all activities at the Veladero mine, but ordered, among other things,the suspension of the leaching process at the Veladero mine and for MAGand the San Juan Provincial mining authority to provide additionalinformation to the Jachal Court in connection with the incident.
The Company filed a defense to the provincial amparo action on April 7,2017. The Jachal Court lifted the suspension on June 15, 2017, after theSan Juan Provincial mining authority provided the required informationand a hydraulic assessment of the leach pad and process plant wasimplemented. Further developments in this case are pending a decisionby the Argentine Supreme Court as to whether the Federal Court orProvincial Court has jurisdiction to assess the merits of the amparoremedy (see “Veladero - Release of Gold-bearing Process Solution -Federal Amparo Action” below). No amounts have been recorded for anypotential liability or asset impairment under this matter, as the Companycannot reasonably predict the outcome.
Federal Amparo ActionOn April 4, 2017, the National Minister of Environment of Argentina filed alawsuit in the Buenos Aires federal court (the “Federal Court”) inconnection with the March 2017 incident. The amparo protection actionsought a court order requiring the cessation and/or suspension of
BARRICK YEAR-END 2017 163 NOTES TO FINANCIAL STATEMENTS
activities at the Veladero mine. MAG submitted extensive information tothe Federal Court about the incident, the then-existing administrative andprovincial judicial suspensions, the remedial actions taken by theCompany and the lifting of the suspensions as described above. MAGalso challenged the jurisdiction of the Federal Court and the standing ofthe National Minister of Environment of Argentina and requested that thematter be remanded to the Jachal Court. The Province of San Juan alsochallenged the jurisdiction of the Federal Court in this matter. OnJune 23, 2017, the Federal Court decided that it was competent to hearthe case, and referred the case to the Court of Appeals to determinewhether the Federal Court or Provincial Court in the case describedabove has the authority to assess the merits of the amparo remedy. OnJuly 5, 2017, the Provincial Court issued a request for the SupremeCourt of Argentina to resolve the jurisdictional dispute. On July 30, 2017,the Court of Appeals referred the jurisdictional dispute to the SupremeCourt and a decision on the matter is pending. No amounts have beenrecorded for any potential liability or asset impairment under this matter,as the Company cannot reasonably predict the outcome.
Argentine Glacier Legislation and Constitutional LitigationOn September 30, 2010, the National Law on Minimum Requirementsfor the Protection of Glaciers was enacted in Argentina, and came intoforce in early November 2010. The federal law banned new miningexploration and exploitation activities on glaciers and in the “peri-glacial”environment, and subjected ongoing mining activities to anenvironmental audit. If the audit identifies significant impacts on glaciersand peri-glacial environment, the relevant authority is empowered to takeaction, which according to the legislation could include the suspension orrelocation of the activity. In the case of the Veladero mine and theArgentinean side of the Pascua-Lama project, the competent authority isthe Province of San Juan. In late January 2013, the Province announcedthat it had completed the required environmental audit, which concludedthat Veladero and Pascua-Lama do not impact glaciers or peri-glaciers.On October 3, 2016, federal authorities published a partial nationalinventory of glaciers, which included the area where the Veladero mineand Pascua-Lama Project are located. The Company has analyzed thenational inventory in the area where Veladero and Pascua-Lama arelocated and has concluded that this inventory is consistent with theprovincial inventory that the Province of San Juan used in connectionwith its January 2013 environmental audit.
The constitutionality of the federal glacier law is the subject of achallenge before the National Supreme Court of Argentina, which hasnot yet ruled on the issue. On October 27, 2014, the Company submittedits response to a motion by the federal government to dismiss theconstitutional challenge to the federal glacier law on
standing grounds. A decision on the motion is pending. If the federalgovernment’s arguments with respect to standing are accepted, then thecase will be dismissed. If they are not accepted, then the NationalSupreme Court of Argentina will proceed to hear evidence on the merits.No amounts have been recorded for any potential liability or assetimpairment under this matter, as the Company cannot reasonably predictthe outcome and in any event the provincial audit concluded that theCompany’s activities do not impact glaciers or peri-glaciers.
Pueblo Viejo – AmparoActionIn October 2014, Pueblo Viejo Dominicana Corporation (“PVDC”) receiveda copy of an action filed in an administrative court (the “AdministrativeCourt”) in the Dominican Republic by Rafael Guillen Beltre (the“Petitioner”), who claims to be affiliated with the Dominican ChristianPeace Organization. The action alleges that environmental contaminationin the vicinity of the Pueblo Viejo mine has caused illness and affectedwater quality in violation of the Petitioner’s fundamental rights under theDominican Constitution and other laws. The primary relief sought in theaction, which is styled as an “ amparo ” remedy, is the suspension ofoperations at the Pueblo Viejo mine as well as other mining projects in thearea until an investigation into the alleged environmental contaminationhas been completed by the relevant governmental authorities. OnNovember 21, 2014, the Administrative Court granted PVDC’s motion toremand the matter to a trial court in the Municipality of Cotuí (the “TrialCourt”) on procedural grounds. On June 25, 2015, the Trial Court rejectedthe Petitioner’s amparo action, finding that the Petitioner failed to produceevidence to support his allegations. The Petitioner appealed the TrialCourt’s decision to the Constitutional Court on July 21, 2015. On July 28,2015, PVDC filed a motion to challenge the timeliness of this appeal as itwas submitted after the expiration of the applicable filing deadline. TheCompany intends to vigorously defend this matter. No amounts have beenrecorded for any potential liability or asset impairment arising from thismatter, as the Company cannot reasonably predict any potential losses.
Perilla ComplaintIn 2009, Barrick Gold Inc. and Placer Dome Inc. were purportedly servedin Ontario with a complaint filed in November 2008 in the Regional TrialCourt of Boac (the “Court”), on the Philippine island of Marinduque, onbehalf of two named individuals and purportedly on behalf of theapproximately 200,000 residents of Marinduque. The complaint allegesinjury to the economy and the ecology of Marinduque as a result of thedischarge of mine tailings from the Marcopper mine into Calancan Bay,the Boac River, and the Mogpog River. The plaintiffs are claiming forabatement of a public nuisance allegedly caused by the tailings dischargeand for nominal damages for an alleged violation of their constitutionalright to a balanced and healthful ecology. In June 2010,
BARRICK YEAR-END 2017 164 NOTES TO FINANCIAL STATEMENTS
Barrick Gold Inc. and Placer Dome Inc. filed a motion to have the Courtresolve their unresolved motions to dismiss before considering theplaintiffs’ motion to admit an amended complaint and also filed anopposition to the plaintiffs’ motion to admit on the same basis. By Orderdated November 9, 2011 the Court granted a motion to suspend theproceedings filed by the plaintiffs. It is not known when these motions orthe outstanding motions to dismiss will be decided by the Court. To dateneither the plaintiffs nor the Company has advised the Court of anintention to resume the proceedings. The Company intends to defendthe action vigorously. No amounts have been recorded for any potentialliability under this complaint, as the Company cannot reasonably predictthe outcome.
Writ of KalikasanIn February 2011, a Petition for the Issuance of a Writ of Kalikasan withPrayer for Temporary Environmental Protection Order was filed in theSupreme Court of the Republic of the Philippines (the “Supreme Court”)in Eliza M. Hernandez, Mamerto M. Lanete and Godofredo L. Manoyversus Placer Dome Inc. and Barrick Gold Corporation (the“Petitioners”). In March 2011, the Supreme Court issued an En BancResolution and Writ of Kalikasan, directed service of summons on PlacerDome Inc. and the Company, ordered Placer Dome Inc. and theCompany to make a verified return of the Writ with ten (10) days ofservice and referred the case to the Court of Appeal for hearing. ThePetition alleges that Placer Dome Inc. violated the petitioners’constitutional right to a balanced and healthful ecology as a result of,among other things, the discharge of tailings into Calancan Bay, the1993 Maguila-Guila dam break, the 1996 Boac River tailings spill andfailure of Marcopper to properly decommission the Marcopper mine. Thepetitioners have pleaded that the Company is liable for the allegedactions and omissions of Placer Dome Inc., which was a minority indirectshareholder of Marcopper at all relevant times, and is seeking ordersrequiring the Company to environmentally remediate the areas in andaround the mine site that are alleged to have sustained environmentalimpacts. The petitioners purported to serve the Company in March 2011,following which the Company filed an Urgent Motion For Ruling onJurisdiction with the Supreme Court challenging the constitutionality ofthe Rules of Procedure in Environmental Cases (the “EnvironmentalRules”) pursuant to which the Petition was filed, as well as thejurisdiction of the Supreme Court over the Company. By resolution datedOctober 12, 2011 the Court of Appeals granted the Petitioners’October 4, 2011 motion to suspend proceedings to permit the Petitionersto explore the possibility of a settlement. The proceedings aresuspended pending further notice from the Petitioners. In November2011, two local governments, or “baranguays” (Baranguay San Antonioand Baranguay Lobo) filed a motion with the Supreme Court seekingintervenor status with the intention of seeking a dismissal of theproceedings. No decision has
as yet been issued with respect to the Urgent Motion for Ruling onJurisdiction, the motion for intervention, or certain other matters before theSupreme Court. The Company intends to continue to defend the actionvigorously.
In November 2016, the Petitioners notified the Court of Appeals thatsettlement negotiations did not resolve the action. In March 2017, theCourt of Appeals required the Petitioners to advise whether they intend topursue the action. Without responding to the court, Petitioners’ counseladvised the Court in July 2017 of their withdrawal as counsel for thePetitioners and informed the Court of the death of one of the Petitioners.The Court of Appeals issued a resolution in November 2017 requiring thePetitioners to notify the Court whether they have engaged new counsel.Petitioners’ new counsel filed an entry of appearance in December 2017with the Court. To date, the Petitioners have still not advised the Courtwhether they intend to pursue the action. The Company is awaiting receiptof the Petitioners’ notification of their intentions.
No amounts have been recorded for any potential liability under thismatter, as the Company cannot reasonably predict the outcome.
Cerro CasaleOne of the environmental permits related to the open pit and watermanagement system at the Company’s 50 percent-owned Cerro Casaleproject in Chile is subject to an environmental regulation (the “Regulation”)that, if applied as written, would have required the Company to beginconstruction of the project by January 26, 2015 or risk cancellation of theenvironmental permit. The Company sought relief from the Regulation asconstruction was not feasible and did not begin by that date. OnOctober 15, 2015, the Chilean environmental authority issued a resolutionconfirming that initial project activities were timely commenced as requiredby the environmental permit and the matter is now closed. Permitsrequired for the majority of the project’s proposed operations wereobtained under a second environmental approval (the “Cerro Casaleenvironmental permit”) that was subject to a January 2018 constructioncommencement deadline. The Company requested relief using the sameprocedure described above, and the environmental authority confirmedthat the initial project activities were timely commenced.
The Cerro Casale environmental permit was challenged in 2013 by localand indigenous community members for alleged procedural deficiencies inthe community consultation process and other aspects of the evaluation ofthe project by the Chilean environmental authority. The challenge wasbrought before the Chilean Committee of Ministers for the Environment,which has jurisdiction over procedural claims of this nature. OnJanuary 19, 2015, the Committee of Ministers for the

BARRICK YEAR-END 2017 165 NOTES TO FINANCIAL STATEMENTS
Environment rejected the majority of claims made against the CerroCasale environmental permit while also imposing new limitations on thevolume of groundwater that the project may extract for miningoperations. The Company appealed this decision to the EnvironmentalCourt, which held a hearing on August 27, 2015. On June 12, 2017, theEnvironmental Court ordered the Chilean Committee of Ministers for theEnvironment to review its January 9, 2015 decision to impose newlimitations on the volume of groundwater that the Cerro Casale projectmay extract for mining operations. The Company and the Chileanenvironmental authority appealed this decision to the Chilean SupremeCourt.
While this appeal was pending, the Chilean Committee of Ministers forthe Environment issued a new decision on November 23, 2017 in whichit modified the limitations on groundwater extraction imposed in itsoriginal ruling. The decision may provide additional water resources forthe project and therefore the Company and the Chilean environmentalauthority agreed to withdraw the appeal to the Supreme Court. Thematter is now closed.
Acacia Mining plc - Tanzanian Revenue Authority AssessmentsThe Tanzanian Revenue Authority (“TRA”) has issued a number of taxassessments to the Acacia Mining plc group (“Acacia”) related to pasttaxation years from 2002-onwards. Acacia believes that the majority ofthese assessments are incorrect and has filed objections and appealsaccordingly in an attempt to resolve these matters by means ofdiscussions with the TRA or through the Tanzanian appeals process.Overall, it is Acacia’s current assessment that the relevant assessmentsand claims by the TRA are without merit.
The claims include an assessment issued to Acacia in the amount of$41.3 million for withholding tax on certain historic offshore dividendpayments paid by Acacia to its shareholders in 2010 to 2013. Acacia isappealing this assessment on the substantive grounds that, as anEnglish incorporated company, it is not resident in Tanzania for taxationpurposes. The appeal is currently pending at the Court of Appeal.Accordingly, no amounts have been recorded for any potential liabilityand Acacia intends to continue to defend this action vigorously.
Further TRA assessments were issued to Acacia in January 2016 in theamount of $500.7 million, based on an allegation that Acacia is residentin Tanzania for corporate and dividend withholding tax purposes. Thecorporate tax assessments have been levied on certain of Acacia’s netprofits before tax. Acacia is in the process of appealing theseassessments at the TRA Board level. Acacia’s substantive grounds ofappeal are based on the correct interpretation of Tanzanian permanentestablishment principles and law, relevant to a non-resident Englishincorporated company.
In addition, the TRA issued adjusted tax assessments totalingapproximately $190 billion for alleged unpaid taxes, interest and penalties,apparently issued in respect of alleged and disputed under-declaredexport revenues, and appearing to follow on from the announced findingsof the First and Second Presidential Committees. For more informationabout these adjusted tax assessments, see “Acacia Mining plc -Concentrate Export Ban and Related Disputes” below.
See note 12 of these Financial Statements for information related toincome tax expenses recorded with respect to these matters.
Acacia Mining plc - Concentrate Export Ban and Related DisputesOn March 3, 2017, the Tanzanian Ministry of Energy and Mineralsimposed a general ban on the export of metallic concentrates (the “Ban”).This includes gold/copper concentrate exported by Acacia’s Bulyanhuluand Buzwagi mines. Following the imposition of the Ban, Acaciaimmediately ceased all exports of its gold/copper concentrate, including27 containers previously approved for export prior to the Ban.
During the second quarter of 2017, investigations were conducted onbehalf of the Tanzanian Government by two Tanzanian GovernmentPresidential Committees, which have resulted in allegations of historicalundeclared revenue and unpaid taxes being made against Acacia and itspredecessor companies. Acacia considers these findings to beimplausible and has fully refuted the findings of both PresidentialCommittees. Acacia has requested copies of the reports issued by the twoPresidential Committees and called for independent verification of thefindings, but has not yet received a response to these requests.
On July 4, 2017, Acacia’s subsidiaries, Bulyanhulu Gold Mine Limited(“BGML”), the owner of the Bulyanhulu mine, and Pangea MineralsLimited (“PML”), the owner of the Buzwagi mine, each commencedinternational arbitrations against the Government of Tanzania inaccordance with the dispute resolution processes agreed by theGovernment of Tanzania in the Mineral Development Agreements(“MDAs”) with BGML and PML. These arbitrations remain ongoing.
In July 2017, Acacia received adjusted assessments for the tax years2000-2017 from the Tanzania Revenue Authority (the “TRA”) for a totalamount of approximately $190 billion for alleged unpaid taxes, interestand penalties, apparently issued in respect of alleged and disputed under-declared export revenues, and appearing to follow on from the announcedfindings of the First and Second Presidential Committees. Theseassessments are being disputed and the underlying allegations areincluded in the matters that have been referred to international arbitration.
BARRICK YEAR-END 2017 166 NOTES TO FINANCIAL STATEMENTS
In addition, following the end of the third quarter, Acacia was served withnotices of conflicting adjusted corporate income tax and withholding taxassessments for tax years 2005 to 2011 with respect to Acacia’s formerTulawaka joint venture, and demands for payment, for a total amount ofapproximately $3 billion. Interest and penalties represent the vastmajority of the new assessments. The TRA has not provided Acacia withany explanations or reasons for the adjusted assessments, or with theTRA’s position on how the assessments have been calculated or whythey have been issued. Acacia disputes these assessments and hasrequested supporting calculations, which have not yet been received.Acacia is objecting to these assessments and defending this matterthrough the Tanzanian tax appeals process.
In addition to the Ban, new and amended legislation was passed inTanzania in early July 2017, including various amendments to the 2010Mining Act and a new Finance Act. The amendments to the 2010 MiningAct increased the royalty rate applicable to metallic minerals such asgold, copper and silver to 6% (from 4%), and the new Finance Actimposes a 1% clearing fee on the value of all minerals exported fromTanzania from July 1, 2017. In January 2018, new Mining Regulationswere announced by the Tanzanian Government introducing, amongother things, local content requirements, export regulations and mineralrights regulations, the scope and effect of which remain under review byAcacia. Acacia continues to monitor the impact of all new legislation inlight of its MDAs with the Government of Tanzania. However, tominimize further disruptions to its operations Acacia will, in the interim,satisfy the requirements imposed as regards the increased royalty ratein addition to the recently imposed 1% clearing fee on exports. Acacia ismaking these payments under protest, without prejudice to its legalrights under its MDAs.
Acacia has been looking to address all issues in respect of the Banalong with other ongoing disputes through dialogue with the TanzanianGovernment. Acacia remains of the view that a negotiated resolution isthe preferable outcome to the current disputes and Acacia will continueto work to achieve this. During the third
quarter of 2017, Barrick and the Government of Tanzania engaged indiscussions for the potential resolution of the disputes. Acacia did notparticipate directly in these discussions as the Government of Tanzaniahad informed Barrick that it wished to continue dialogue solely withBarrick.
On October 19, 2017, Barrick announced that it had agreed with theGovernment of Tanzania on a proposed framework for a new partnershipbetween Acacia and the Government of Tanzania. Barrick and theGovernment of Tanzania also agreed to form a working group that willfocus on the resolution of outstanding tax claims against Acacia. Keyterms of the proposed framework announced by Barrick and theGovernment of Tanzania include (i) the creation of a new Tanzaniancompany to manage Acacia’s Bulyanhulu, Buzwagi and North Mara minesand all future operations in the country with key officers located inTanzania and Tanzanian representation on the board of directors;(ii) maximization of local employment of Tanzanians and procurement ofgoods and services within Tanzania; (iii) economic benefits fromBulyanhulu, Buzwagi and North Mara to be shared on a 50/50 basis, withthe Government’s share delivered in the form of royalties, taxes and a16% free carry interest in Acacia’s Tanzanian operations; and (iv) insupport of the working group’s ongoing efforts to resolve outstanding taxclaims, Acacia would make a payment of $300 million to the Governmentof Tanzania, staged over time, on terms to be settled by the workinggroup. Barrick and the Government of Tanzania are also reviewing theconditions for the lifting of the Ban. Negotiations concerning the proposedframework remain ongoing and the definitive terms of any final proposalfor the implementation of the framework remain outstanding. Such termswould be subject to review and approval by Acacia.
See note 12 of these Financial Statements for information related toincome tax expenses recorded with respect to these matters and note 21of these Financial Statements for impairment losses arising from thesematters.
Exhibit 99.4
MANAGEMENT’S DISCUSSION AND ANALYSIS (“MD&A”)
CAUTIONARY STATEMENT ON FORWARD-LOOKING INFORMATION
BARRICK YEAR-END 2017 22 MANAGEMENT’S DISCUSSION AND ANALYSIS
Management’s Discussion and Analysis (“MD&A”) is intended to help thereader understand Barrick Gold Corporation (“Barrick”, “we”, “our” or the“Company”), our operations, financial performance and the present andfuture business environment. This MD&A, which has been prepared asof February 14, 2018, should be read in conjunction with our auditedconsolidated financial statements (“Financial Statements”) for the yearended December 31, 2017. Unless otherwise indicated, all amounts arepresented in U.S. dollars.
For the purposes of preparing our MD&A, we consider the materiality ofinformation. Information is considered material if: (i) such informationresults in, or would reasonably be expected to result in, a significantchange in the market price or value of our shares; (ii) there is a
substantial likelihood that a reasonable investor would consider itimportant in making an investment decision; or (iii) it would significantlyalter the total mix of information available to investors. We evaluatemateriality with reference to all relevant circumstances, including potentialmarket sensitivity.
Continuous disclosure materials, including our most recentForm 40-F/Annual Information Form, annual MD&A, audited consolidatedfinancial statements, and Notice of Annual Meeting of Shareholders andProxy Circular will be available on our website at www.barrick.com, onSEDAR at www.sedar.com and on EDGAR at www.sec.gov. For anexplanation of terminology unique to the mining industry, readers shouldrefer to the glossary on page 86.
Certain information contained or incorporated by reference in this MD&A,including any information as to our strategy, projects, plans or futurefinancial or operating performance, constitutes “forward-lookingstatements”. All statements, other than statements of historical fact, areforward-looking statements. The words “believe”, “expect”, “anticipate”,“target”, “plan”, “objective”, “assume”, “intend”, “intention”, “project”,“goal”, “continue”, “budget”, “estimate”, “potential”, “may”, “will”, “can”,“could”, “would” and similar expressions identify forward-lookingstatements. In particular, this MD&A contains forward-lookingstatements including, without limitation, with respect to: (i) Barrick’sforward-looking production guidance; (ii) estimates of future cost of salesper ounce for gold and per pound for copper, cash costs per ounce andC1 cash costs per pound, and all-in-sustaining costs per ounce/pound;(iii) cash flow forecasts; (iv) projected capital, operating and explorationexpenditures; (v) Barrick’s expectations regarding the potential benefitsresulting from a new partnership between Acacia Mining plc (“Acacia”)and the Government of Tanzania; (vi) targeted debt and cost reductions;(vii) mine life and production rates; (viii) potential mineralization andmetal or mineral recoveries; (ix) savings from our improved capitalmanagement program; (x) Barrick’s Best-in-Class program (includingpotential improvements to financial and operating performance that mayresult from certain Best-in-Class initiatives); (xi) the timing and results ofthe prefeasibility study at Pascua-Lama; (xii) our pipeline of highconfidence projects at or near existing operations; (xiii) the benefits ofunifying the Cortez and Goldstrike operations; (xiv) the potential impactand benefits of Barrick’s ongoing digital transformation; (xv) our ability toconvert resources into reserves; (xvi) asset sales, joint
ventures and partnerships; and (xvii) expectations regarding future priceassumptions, financial performance and other outlook or guidance.
Forward-looking statements are necessarily based upon a number ofestimates and assumptions including material estimates and assumptionsrelated to the factors set forth below that, while considered reasonable bythe Company as at the date of this MD&A in light of management’sexperience and perception of current conditions and expecteddevelopments, are inherently subject to significant business, economicand competitive uncertainties and contingencies. Known and unknownfactors could cause actual results to differ materially from those projectedin the forward-looking statements and undue reliance should not beplaced on such statements and information. Such factors include, but arenot limited to: fluctuations in the spot and forward price of gold, copper orcertain other commodities (such as silver, diesel fuel, natural gas andelectricity); the speculative nature of mineral exploration and development;changes in mineral production performance, exploitation and explorationsuccesses; risks associated with the fact that certainBest-in-Class initiatives are still in the early stages of evaluation andadditional engineering and other analysis is required to fully assess theirimpact; the duration of the Tanzanian ban on mineral concentrate exports;the ultimate terms of any definitive agreement between Acacia and theGovernment of Tanzania to resolve a dispute relating to the imposition ofthe concentrate export ban and allegations by the Government ofTanzania that Acacia under-declared the metal content of concentrateexports from Tanzania; the status of certain tax reassessments by theTanzanian government; the manner in which amendments to the
BARRICK YEAR-END 2017 23 MANAGEMENT’S DISCUSSION AND ANALYSIS
2010 Mining Act (Tanzania) increasing the royalty rate applicable tometallic minerals such as gold, copper and silver to 6% (from 4%), thenew Finance Act (Tanzania) imposing a 1% clearing fee on the value ofall minerals exported from Tanzania from July 1, 2017 and the newMining Regulations announced by the Government of Tanzania inJanuary 2018 will be implemented and the impact of these and otherlegislative changes on Acacia; whether Acacia will approve the terms ofany final agreement reached between Barrick and the Government ofTanzania with respect to the dispute between Acacia and theGovernment of Tanzania; the benefits expected from recent transactionsbeing realized; diminishing quantities or grades of reserves; increasedcosts, delays, suspensions and technical challenges associated with theconstruction of capital projects; operating or technical difficulties inconnection with mining or development activities, including geotechnicalchallenges and disruptions in the maintenance or provision of requiredinfrastructure and information technology systems; failure to comply withenvironmental and health and safety laws and regulations; timing ofreceipt of, or failure to comply with, necessary permits and approvals;uncertainty whether some or all of the Best-in-Class initiatives, targetedinvestments and projects will meet the Company’s capital allocationobjectives and internal hurdle rate; the impact of global liquidity andcredit availability on the timing of cash flows and the values of assetsand liabilities based on projected future cash flows; adverse changes inour credit ratings; the impact of inflation; fluctuations in the currencymarkets; changes in U.S. dollar interest rates; risks arising from holdingderivative instruments; changes in national and local governmentlegislation, taxation, controls or regulations and/or changes in theadministration of laws, policies and practices; expropriation ornationalization of property and political or economic developments inCanada, the United States and other jurisdictions in which the Companyor its affiliates do or may carry on business in the future; lack of certaintywith respect to foreign legal systems, corruption and other factors thatare inconsistent with the rule of law; the outcome of the appeal of thedecision of Chile’s Superintendencia del Medio Ambiente; damage to theCompany’s reputation due to the actual or perceived occurrence of anynumber of events, including negative publicity with respect to theCompany’s handling of environmental matters or dealings withcommunity groups, whether true or not; the possibility that futureexploration results will not be consistent with the Company’sexpectations; risks that exploration data may be incomplete andconsiderable additional work may be required to complete furtherevaluation, including but not limited to drilling, engineering andsocioeconomic studies and investment; risk of loss due to acts of war,terrorism, sabotage and civil disturbances; litigation; contests over title toproperties, particularly title to undeveloped properties, or over access towater, power and other required infrastructure; business opportunitiesthat may be presented to, or pursued by, the Company; risks
associated with the fact that certain of the initiatives described in thisMD&A are still in the early stages and may not materialize; our ability tosuccessfully integrate acquisitions or complete divestitures; risksassociated with working with partners in jointly controlled assets;employee relations including loss of key employees; increased costs andphysical risks, including extreme weather events and resource shortages,related to climate change; availability and increased costs associated withmining inputs and labor; and the organization of our previously heldAfrican gold operations and properties under a separate listed Company.In addition, there are risks and hazards associated with the business ofmineral exploration, development and mining, including environmentalhazards, industrial accidents, unusual or unexpected formations,pressures, cave-ins, flooding and gold bullion, copper cathode or gold orcopper concentrate losses (and the risk of inadequate insurance, orinability to obtain insurance, to cover these risks).
Many of these uncertainties and contingencies can affect our actualresults and could cause actual results to differ materially from thoseexpressed or implied in any forward-looking statements made by, or onbehalf of, us. Readers are cautioned that forward-looking statements arenot guarantees of future performance. All of the forward-lookingstatements made in this MD&A are qualified by these cautionarystatements. Specific reference is made to the most recent Form40-F/Annual Information Form on file with the SEC and Canadianprovincial securities regulatory authorities for a more detailed discussionof some of the factors underlying forward-looking statements and the risksthat may affect Barrick’s ability to achieve the expectations set forth in theforward-looking statements contained in this MD&A. We disclaim anyintention or obligation to update or revise any forward-looking statementswhether as a result of new information, future events or otherwise, exceptas required by applicable law.

BARRICK YEAR-END 2017 24 MANAGEMENT’S DISCUSSION AND ANALYSIS
USE OF NON-GAAP FINANCIAL PERFORMANCE MEASURES
We use the following non-GAAP financial performance measures in ourMD&A: ● “adjusted net earnings” ● “free cash flow” ● “EBITDA” ● “adjusted EBITDA” ● “cash costs per ounce” ● “C1 cash costs per pound” ● “all-in sustaining costs per ounce/pound” ● “all-in costs per ounce” and ● “realized price”
For a detailed description of each of the non-GAAP measures used inthis MD&A and a detailed reconciliation to the most directly comparablemeasure under International Financial Reporting Standards (“IFRS”),please refer to the Non-GAAP Financial Performance Measures sectionof this MD&A on pages 69 to 84. Each non-GAAP financial performancemeasure has been annotated with a reference to an endnote on page85. The non-GAAP financial performance measures set out in thisMD&A are intended to provide additional information to investors and donot have any standardized meaning under IFRS, and therefore may notbe comparable to other issuers, and should not be considered inisolation or as a substitute for measures of performance prepared inaccordance with IFRS.
Changes in presentation of non-GAAP financial performancemeasures
Adjusted EBITDAStarting in the second quarter 2017 MD&A, we began includingadditional adjusting items in the Adjusted EBITDA reconciliation toprovide a greater level of consistency with the adjusting items included inour Adjusted Net Earnings reconciliation. These new items include:acquisition/disposition gains/losses; foreign currency translationgains/losses; other expense adjustments; and unrealized gains onnon-hedge derivative instruments. These amounts are adjusted toremove any impact on finance costs/income, income tax expense and/ordepreciation as they do not affect EBITDA. The prior periods have beenrestated to reflect the change in presentation. We believe this additionalinformation will assist analysts, investors and other stakeholders ofBarrick in better understanding our ability to generate liquidity fromoperating cash flow, by excluding these amounts from the calculation asthey are not indicative of the performance of our core mining businessand not necessarily reflective of the underlying operating results for theperiods presented.
INDEX page
Overview
Our Vision 25 Our Business 25 Our Strategy 25 Full Year Financial and Operating Highlights 26 Outlook for 2018 33 Risks and Risk Management 37 Market Overview 39
Review of Annual Financial Results 42
Revenue 42 Production Costs 42 Capital Expenditures 43 General and Administrative Expenses 44 Exploration, Evaluation and Project Costs 44 Finance Costs, Net 44 Additional Significant Statement of Income Items 45 Income Tax Expense 45
Financial Condition Review 47
Balance Sheet Review 47 Shareholders’ Equity 47 Financial Position and Liquidity 47 Summary of Cash Inflow (Outflow) 48 Summary of Financial Instruments 49
Operating Segments Performance 49
Barrick Nevada 50 Pueblo Viejo 52 Lagunas Norte 54 Veladero 56 Turquoise Ridge 60 Acacia Mining plc 62 Pascua-Lama 65
Commitments and Contingencies 66
Review of Quarterly Results 67
Internal Control over Financial Reporting and Disclosure Controlsand Procedures 68
IFRS Critical Accounting Policies and Accounting Estimates 69
Non-GAAP Financial Performance Measures 69
Technical Information 85
Endnotes 85
Glossary of Technical Terms 86
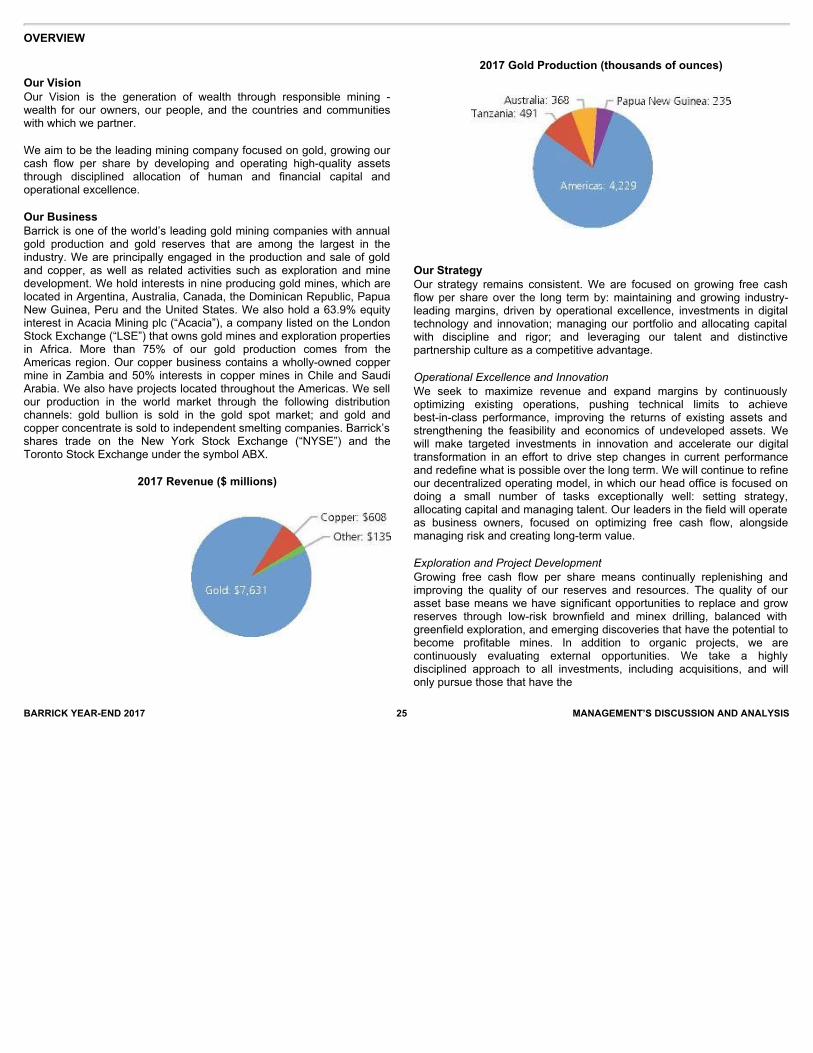
OVERVIEW
BARRICK YEAR-END 2017 25 MANAGEMENT’S DISCUSSION AND ANALYSIS
Our VisionOur Vision is the generation of wealth through responsible mining -wealth for our owners, our people, and the countries and communitieswith which we partner.
We aim to be the leading mining company focused on gold, growing ourcash flow per share by developing and operating high-quality assetsthrough disciplined allocation of human and financial capital andoperational excellence.
Our BusinessBarrick is one of the world’s leading gold mining companies with annualgold production and gold reserves that are among the largest in theindustry. We are principally engaged in the production and sale of goldand copper, as well as related activities such as exploration and minedevelopment. We hold interests in nine producing gold mines, which arelocated in Argentina, Australia, Canada, the Dominican Republic, PapuaNew Guinea, Peru and the United States. We also hold a 63.9% equityinterest in Acacia Mining plc (“Acacia”), a company listed on the LondonStock Exchange (“LSE”) that owns gold mines and exploration propertiesin Africa. More than 75% of our gold production comes from theAmericas region. Our copper business contains a wholly-owned coppermine in Zambia and 50% interests in copper mines in Chile and SaudiArabia. We also have projects located throughout the Americas. We sellour production in the world market through the following distributionchannels: gold bullion is sold in the gold spot market; and gold andcopper concentrate is sold to independent smelting companies. Barrick’sshares trade on the New York Stock Exchange (“NYSE”) and theToronto Stock Exchange under the symbol ABX.
2017 Revenue ($ millions)
2017 Gold Production (thousands of ounces)
Our StrategyOur strategy remains consistent. We are focused on growing free cashflow per share over the long term by: maintaining and growing industry-leading margins, driven by operational excellence, investments in digitaltechnology and innovation; managing our portfolio and allocating capitalwith discipline and rigor; and leveraging our talent and distinctivepartnership culture as a competitive advantage.
Operational Excellence and InnovationWe seek to maximize revenue and expand margins by continuouslyoptimizing existing operations, pushing technical limits to achievebest-in-class performance, improving the returns of existing assets andstrengthening the feasibility and economics of undeveloped assets. Wewill make targeted investments in innovation and accelerate our digitaltransformation in an effort to drive step changes in current performanceand redefine what is possible over the long term. We will continue to refineour decentralized operating model, in which our head office is focused ondoing a small number of tasks exceptionally well: setting strategy,allocating capital and managing talent. Our leaders in the field will operateas business owners, focused on optimizing free cash flow, alongsidemanaging risk and creating long-term value.
Exploration and Project DevelopmentGrowing free cash flow per share means continually replenishing andimproving the quality of our reserves and resources. The quality of ourasset base means we have significant opportunities to replace and growreserves through low-risk brownfield and minex drilling, balanced withgreenfield exploration, and emerging discoveries that have the potential tobecome profitable mines. In addition to organic projects, we arecontinuously evaluating external opportunities. We take a highlydisciplined approach to all investments, including acquisitions, and willonly pursue those that have the
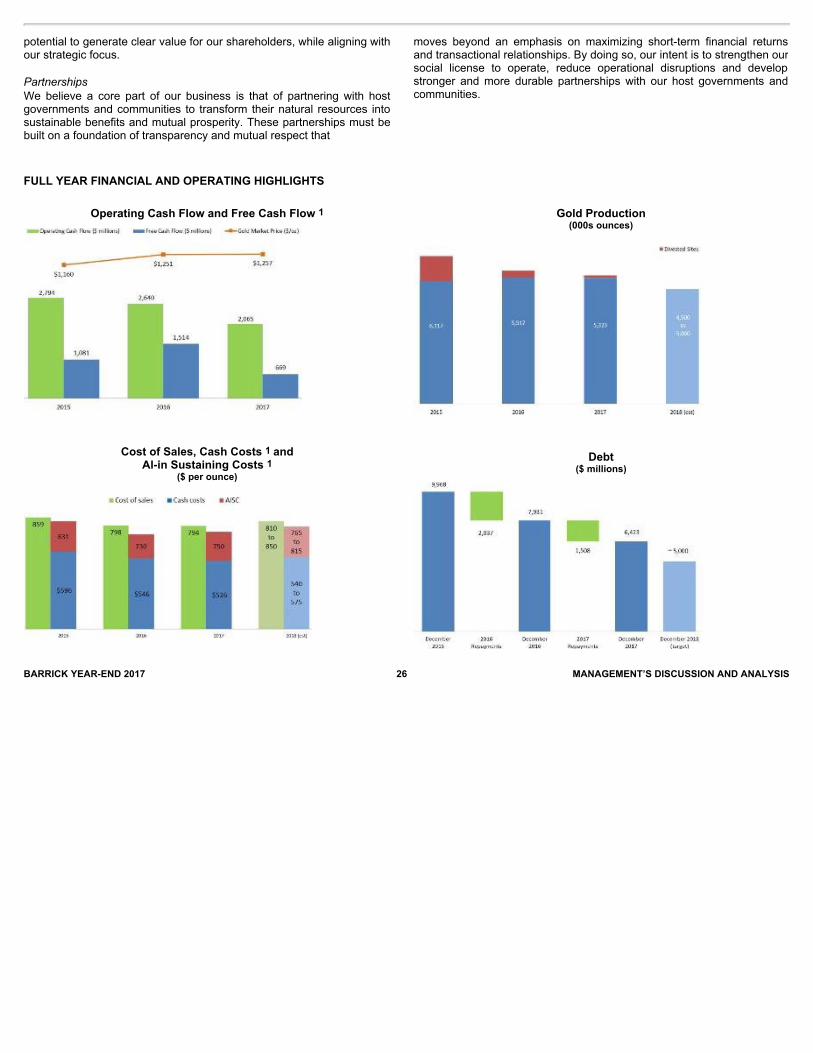
FULL YEAR FINANCIAL AND OPERATING HIGHLIGHTS
BARRICK YEAR-END 2017 26 MANAGEMENT’S DISCUSSION AND ANALYSIS
potential to generate clear value for our shareholders, while aligning withour strategic focus.
PartnershipsWe believe a core part of our business is that of partnering with hostgovernments and communities to transform their natural resources intosustainable benefits and mutual prosperity. These partnerships must bebuilt on a foundation of transparency and mutual respect that
moves beyond an emphasis on maximizing short-term financial returnsand transactional relationships. By doing so, our intent is to strengthen oursocial license to operate, reduce operational disruptions and developstronger and more durable partnerships with our host governments andcommunities.
Operating Cash Flow and Free Cash Flow 1
Cost of Sales, Cash Costs 1 andAl-in Sustaining Costs 1
($ per ounce)
Gold Production(000s ounces)
Debt($ millions)
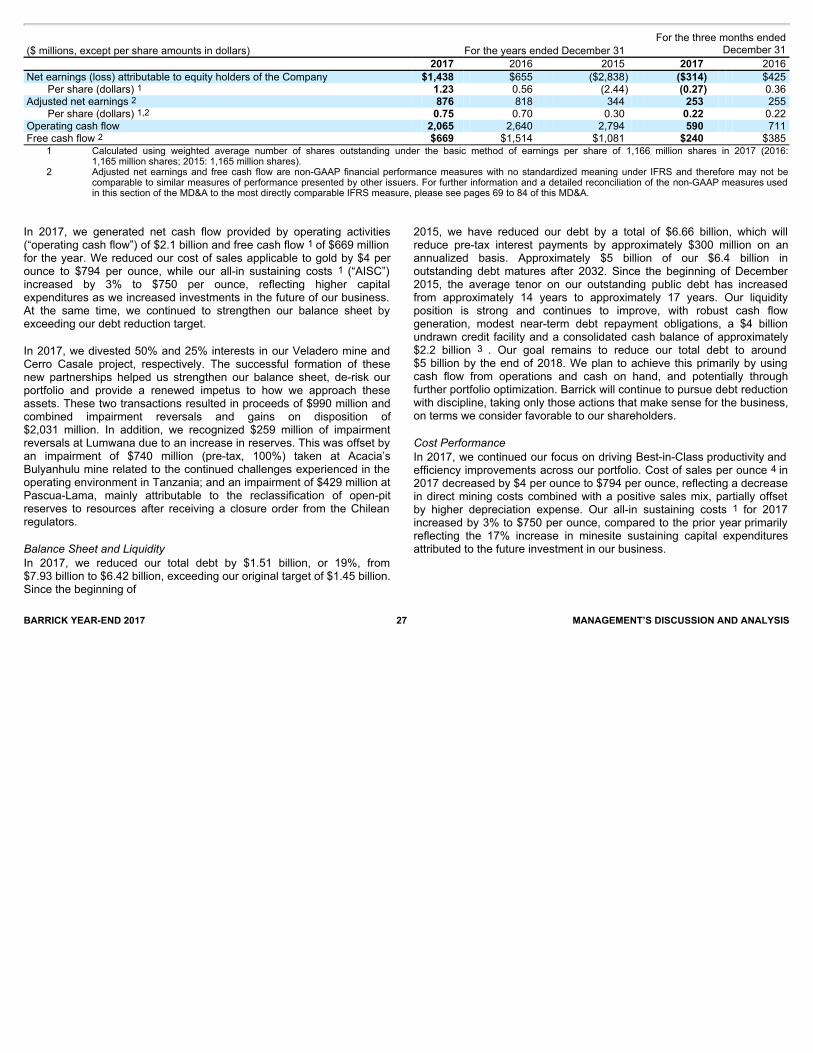
($ millions, except per share amounts in dollars) For the years ended December 31 For the three months ended
December 31 2017 2016 2015 2017 2016 Net earnings (loss) attributable to equity holders of the Company $1,438 $655 ($2,838) ($314) $425
Per share (dollars) 1 1.23 0.56 (2.44) (0.27) 0.36 Adjusted net earnings 2 876 818 344 253 255
Per share (dollars) 1,2 0.75 0.70 0.30 0.22 0.22 Operating cash flow 2,065 2,640 2,794 590 711 Free cash flow 2 $669 $1,514 $1,081 $240 $385 1 Calculated using weighted average number of shares outstanding under the basic method of earnings per share of 1,166 million shares in 2017 (2016:
1,165 million shares; 2015: 1,165 million shares).
2 Adjusted net earnings and free cash flow are non-GAAP financial performance measures with no standardized meaning under IFRS and therefore may not be
comparable to similar measures of performance presented by other issuers. For further information and a detailed reconciliation of the non-GAAP measures usedin this section of the MD&A to the most directly comparable IFRS measure, please see pages 69 to 84 of this MD&A.
BARRICK YEAR-END 2017 27 MANAGEMENT’S DISCUSSION AND ANALYSIS
In 2017, we generated net cash flow provided by operating activities(“operating cash flow”) of $2.1 billion and free cash flow 1 of $669 millionfor the year. We reduced our cost of sales applicable to gold by $4 perounce to $794 per ounce, while our all-in sustaining costs 1 (“AISC”)increased by 3% to $750 per ounce, reflecting higher capitalexpenditures as we increased investments in the future of our business.At the same time, we continued to strengthen our balance sheet byexceeding our debt reduction target.
In 2017, we divested 50% and 25% interests in our Veladero mine andCerro Casale project, respectively. The successful formation of thesenew partnerships helped us strengthen our balance sheet, de-risk ourportfolio and provide a renewed impetus to how we approach theseassets. These two transactions resulted in proceeds of $990 million andcombined impairment reversals and gains on disposition of$2,031 million. In addition, we recognized $259 million of impairmentreversals at Lumwana due to an increase in reserves. This was offset byan impairment of $740 million (pre-tax, 100%) taken at Acacia’sBulyanhulu mine related to the continued challenges experienced in theoperating environment in Tanzania; and an impairment of $429 million atPascua-Lama, mainly attributable to the reclassification of open-pitreserves to resources after receiving a closure order from the Chileanregulators.
Balance Sheet and LiquidityIn 2017, we reduced our total debt by $1.51 billion, or 19%, from$7.93 billion to $6.42 billion, exceeding our original target of $1.45 billion.Since the beginning of
2015, we have reduced our debt by a total of $6.66 billion, which willreduce pre-tax interest payments by approximately $300 million on anannualized basis. Approximately $5 billion of our $6.4 billion inoutstanding debt matures after 2032. Since the beginning of December2015, the average tenor on our outstanding public debt has increasedfrom approximately 14 years to approximately 17 years. Our liquidityposition is strong and continues to improve, with robust cash flowgeneration, modest near-term debt repayment obligations, a $4 billionundrawn credit facility and a consolidated cash balance of approximately$2.2 billion 3 . Our goal remains to reduce our total debt to around$5 billion by the end of 2018. We plan to achieve this primarily by usingcash flow from operations and cash on hand, and potentially throughfurther portfolio optimization. Barrick will continue to pursue debt reductionwith discipline, taking only those actions that make sense for the business,on terms we consider favorable to our shareholders.
Cost PerformanceIn 2017, we continued our focus on driving Best-in-Class productivity andefficiency improvements across our portfolio. Cost of sales per ounce 4 in2017 decreased by $4 per ounce to $794 per ounce, reflecting a decreasein direct mining costs combined with a positive sales mix, partially offsetby higher depreciation expense. Our all-in sustaining costs 1 for 2017increased by 3% to $750 per ounce, compared to the prior year primarilyreflecting the 17% increase in minesite sustaining capital expendituresattributed to the future investment in our business.
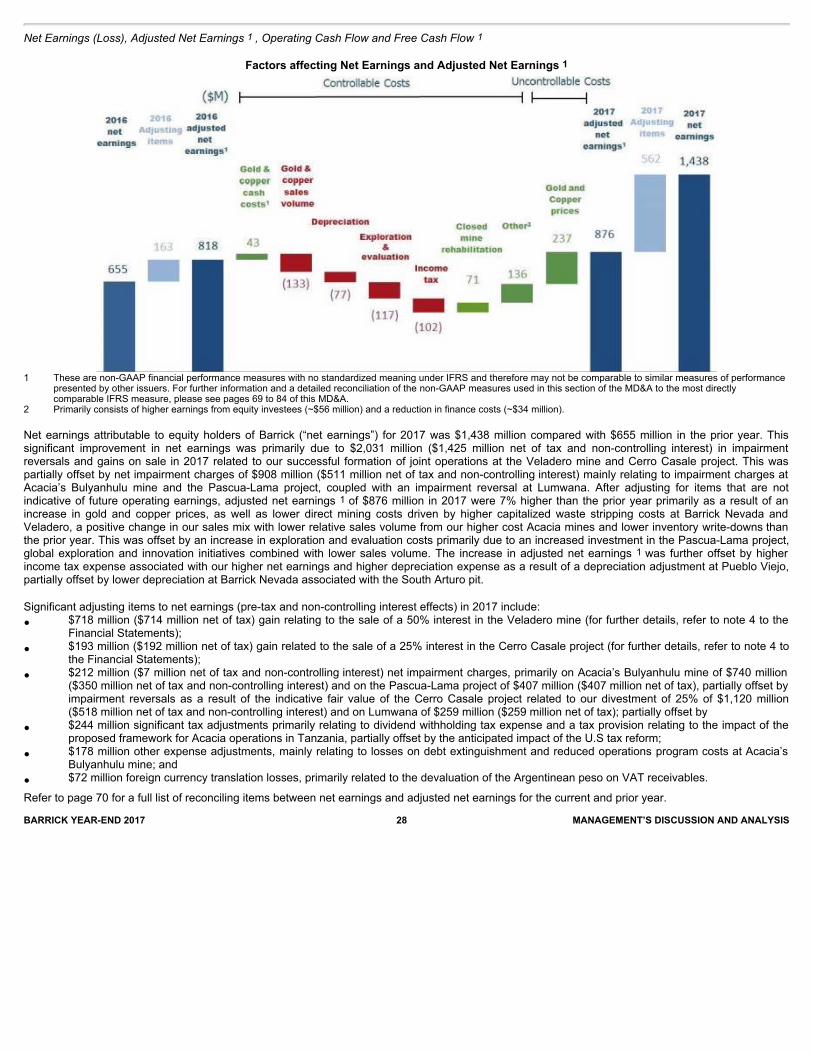
Net Earnings (Loss), Adjusted Net Earnings 1 , Operating Cash Flow and Free Cash Flow 1
Factors affecting Net Earnings and Adjusted Net Earnings 1
1 These are non-GAAP financial performance measures with no standardized meaning under IFRS and therefore may not be comparable to similar measures of performancepresented by other issuers. For further information and a detailed reconciliation of the non-GAAP measures used in this section of the MD&A to the most directlycomparable IFRS measure, please see pages 69 to 84 of this MD&A.
2 Primarily consists of higher earnings from equity investees (~$56 million) and a reduction in finance costs (~$34 million).
Net earnings attributable to equity holders of Barrick (“net earnings”) for 2017 was $1,438 million compared with $655 million in the prior year. Thissignificant improvement in net earnings was primarily due to $2,031 million ($1,425 million net of tax and non-controlling interest) in impairmentreversals and gains on sale in 2017 related to our successful formation of joint operations at the Veladero mine and Cerro Casale project. This waspartially offset by net impairment charges of $908 million ($511 million net of tax and non-controlling interest) mainly relating to impairment charges atAcacia’s Bulyanhulu mine and the Pascua-Lama project, coupled with an impairment reversal at Lumwana. After adjusting for items that are notindicative of future operating earnings, adjusted net earnings 1 of $876 million in 2017 were 7% higher than the prior year primarily as a result of anincrease in gold and copper prices, as well as lower direct mining costs driven by higher capitalized waste stripping costs at Barrick Nevada andVeladero, a positive change in our sales mix with lower relative sales volume from our higher cost Acacia mines and lower inventory write-downs thanthe prior year. This was offset by an increase in exploration and evaluation costs primarily due to an increased investment in the Pascua-Lama project,global exploration and innovation initiatives combined with lower sales volume. The increase in adjusted net earnings 1 was further offset by higherincome tax expense associated with our higher net earnings and higher depreciation expense as a result of a depreciation adjustment at Pueblo Viejo,partially offset by lower depreciation at Barrick Nevada associated with the South Arturo pit.
Significant adjusting items to net earnings (pre-tax and non-controlling interest effects) in 2017 include:• $718 million ($714 million net of tax) gain relating to the sale of a 50% interest in the Veladero mine (for further details, refer to note 4 to the
Financial Statements);• $193 million ($192 million net of tax) gain related to the sale of a 25% interest in the Cerro Casale project (for further details, refer to note 4 to
the Financial Statements);• $212 million ($7 million net of tax and non-controlling interest) net impairment charges, primarily on Acacia’s Bulyanhulu mine of $740 million
($350 million net of tax and non-controlling interest) and on the Pascua-Lama project of $407 million ($407 million net of tax), partially offset byimpairment reversals as a result of the indicative fair value of the Cerro Casale project related to our divestment of 25% of $1,120 million($518 million net of tax and non-controlling interest) and on Lumwana of $259 million ($259 million net of tax); partially offset by
• $244 million significant tax adjustments primarily relating to dividend withholding tax expense and a tax provision relating to the impact of theproposed framework for Acacia operations in Tanzania, partially offset by the anticipated impact of the U.S tax reform;
• $178 million other expense adjustments, mainly relating to losses on debt extinguishment and reduced operations program costs at Acacia’sBulyanhulu mine; and
• $72 million foreign currency translation losses, primarily related to the devaluation of the Argentinean peso on VAT receivables.
Refer to page 70 for a full list of reconciling items between net earnings and adjusted net earnings for the current and prior year.BARRICK YEAR-END 2017 28 MANAGEMENT’S DISCUSSION AND ANALYSIS
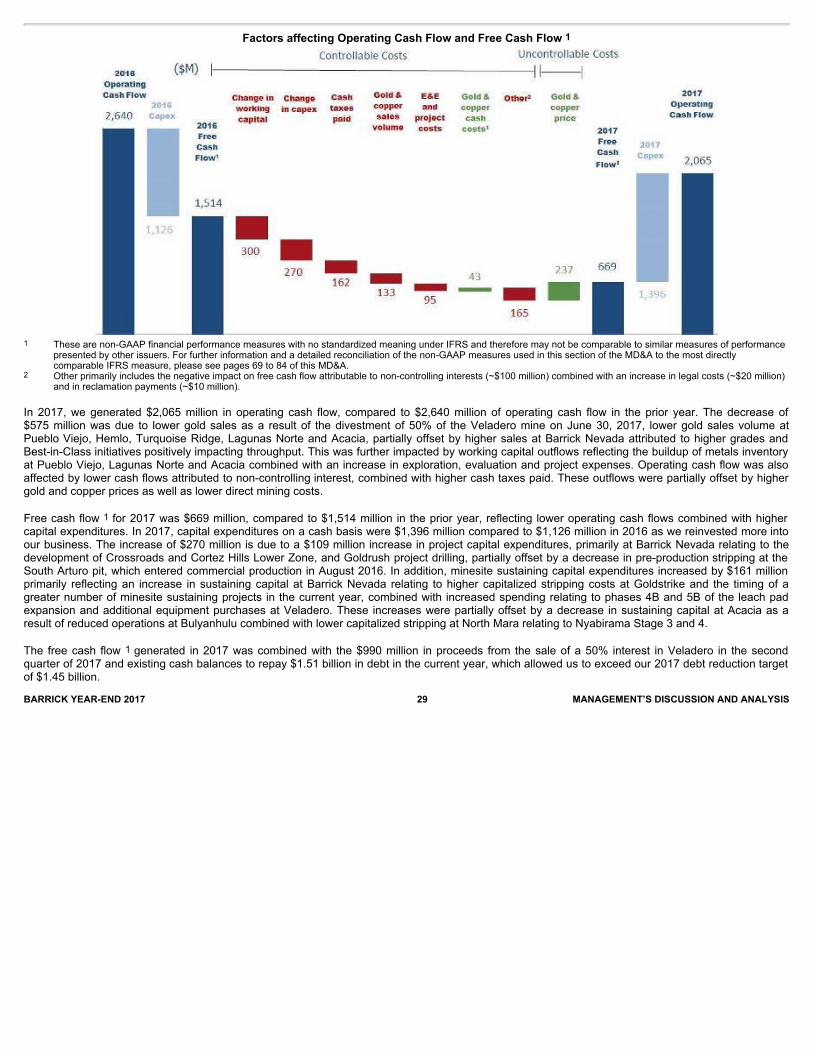
Factors affecting Operating Cash Flow and Free Cash Flow 1
1 These are non-GAAP financial performance measures with no standardized meaning under IFRS and therefore may not be comparable to similar measures of performancepresented by other issuers. For further information and a detailed reconciliation of the non-GAAP measures used in this section of the MD&A to the most directlycomparable IFRS measure, please see pages 69 to 84 of this MD&A.
2 Other primarily includes the negative impact on free cash flow attributable to non-controlling interests (~$100 million) combined with an increase in legal costs (~$20 million)and in reclamation payments (~$10 million).
In 2017, we generated $2,065 million in operating cash flow, compared to $2,640 million of operating cash flow in the prior year. The decrease of$575 million was due to lower gold sales as a result of the divestment of 50% of the Veladero mine on June 30, 2017, lower gold sales volume atPueblo Viejo, Hemlo, Turquoise Ridge, Lagunas Norte and Acacia, partially offset by higher sales at Barrick Nevada attributed to higher grades andBest-in-Class initiatives positively impacting throughput. This was further impacted by working capital outflows reflecting the buildup of metals inventoryat Pueblo Viejo, Lagunas Norte and Acacia combined with an increase in exploration, evaluation and project expenses. Operating cash flow was alsoaffected by lower cash flows attributed to non-controlling interest, combined with higher cash taxes paid. These outflows were partially offset by highergold and copper prices as well as lower direct mining costs.
Free cash flow 1 for 2017 was $669 million, compared to $1,514 million in the prior year, reflecting lower operating cash flows combined with highercapital expenditures. In 2017, capital expenditures on a cash basis were $1,396 million compared to $1,126 million in 2016 as we reinvested more intoour business. The increase of $270 million is due to a $109 million increase in project capital expenditures, primarily at Barrick Nevada relating to thedevelopment of Crossroads and Cortez Hills Lower Zone, and Goldrush project drilling, partially offset by a decrease in pre-production stripping at theSouth Arturo pit, which entered commercial production in August 2016. In addition, minesite sustaining capital expenditures increased by $161 millionprimarily reflecting an increase in sustaining capital at Barrick Nevada relating to higher capitalized stripping costs at Goldstrike and the timing of agreater number of minesite sustaining projects in the current year, combined with increased spending relating to phases 4B and 5B of the leach padexpansion and additional equipment purchases at Veladero. These increases were partially offset by a decrease in sustaining capital at Acacia as aresult of reduced operations at Bulyanhulu combined with lower capitalized stripping at North Mara relating to Nyabirama Stage 3 and 4.
The free cash flow 1 generated in 2017 was combined with the $990 million in proceeds from the sale of a 50% interest in Veladero in the secondquarter of 2017 and existing cash balances to repay $1.51 billion in debt in the current year, which allowed us to exceed our 2017 debt reduction targetof $1.45 billion.BARRICK YEAR-END 2017 29 MANAGEMENT’S DISCUSSION AND ANALYSIS
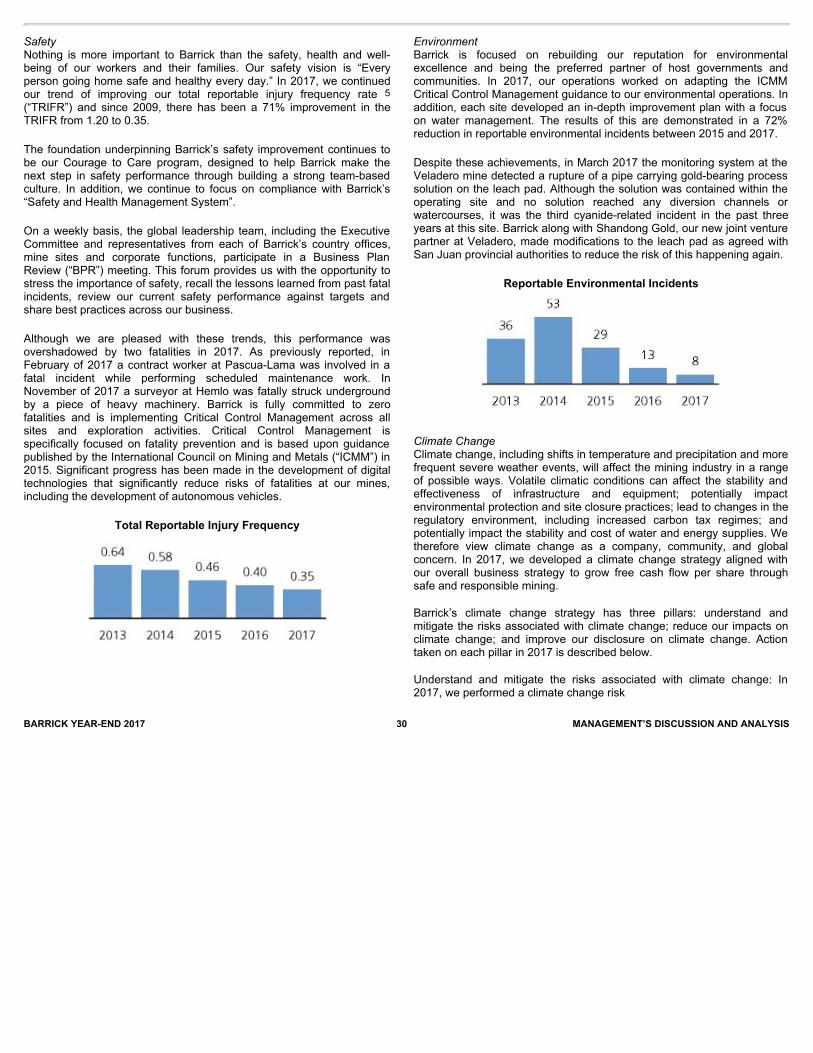
BARRICK YEAR-END 2017 30 MANAGEMENT’S DISCUSSION AND ANALYSIS
SafetyNothing is more important to Barrick than the safety, health and well-being of our workers and their families. Our safety vision is “Everyperson going home safe and healthy every day.” In 2017, we continuedour trend of improving our total reportable injury frequency rate 5(“TRIFR”) and since 2009, there has been a 71% improvement in theTRIFR from 1.20 to 0.35.
The foundation underpinning Barrick’s safety improvement continues tobe our Courage to Care program, designed to help Barrick make thenext step in safety performance through building a strong team-basedculture. In addition, we continue to focus on compliance with Barrick’s“Safety and Health Management System”.
On a weekly basis, the global leadership team, including the ExecutiveCommittee and representatives from each of Barrick’s country offices,mine sites and corporate functions, participate in a Business PlanReview (“BPR”) meeting. This forum provides us with the opportunity tostress the importance of safety, recall the lessons learned from past fatalincidents, review our current safety performance against targets andshare best practices across our business.
Although we are pleased with these trends, this performance wasovershadowed by two fatalities in 2017. As previously reported, inFebruary of 2017 a contract worker at Pascua-Lama was involved in afatal incident while performing scheduled maintenance work. InNovember of 2017 a surveyor at Hemlo was fatally struck undergroundby a piece of heavy machinery. Barrick is fully committed to zerofatalities and is implementing Critical Control Management across allsites and exploration activities. Critical Control Management isspecifically focused on fatality prevention and is based upon guidancepublished by the International Council on Mining and Metals (“ICMM”) in2015. Significant progress has been made in the development of digitaltechnologies that significantly reduce risks of fatalities at our mines,including the development of autonomous vehicles.
Total Reportable Injury Frequency
EnvironmentBarrick is focused on rebuilding our reputation for environmentalexcellence and being the preferred partner of host governments andcommunities. In 2017, our operations worked on adapting the ICMMCritical Control Management guidance to our environmental operations. Inaddition, each site developed an in-depth improvement plan with a focuson water management. The results of this are demonstrated in a 72%reduction in reportable environmental incidents between 2015 and 2017.
Despite these achievements, in March 2017 the monitoring system at theVeladero mine detected a rupture of a pipe carrying gold-bearing processsolution on the leach pad. Although the solution was contained within theoperating site and no solution reached any diversion channels orwatercourses, it was the third cyanide-related incident in the past threeyears at this site. Barrick along with Shandong Gold, our new joint venturepartner at Veladero, made modifications to the leach pad as agreed withSan Juan provincial authorities to reduce the risk of this happening again.
Reportable Environmental Incidents
Climate ChangeClimate change, including shifts in temperature and precipitation and morefrequent severe weather events, will affect the mining industry in a rangeof possible ways. Volatile climatic conditions can affect the stability andeffectiveness of infrastructure and equipment; potentially impactenvironmental protection and site closure practices; lead to changes in theregulatory environment, including increased carbon tax regimes; andpotentially impact the stability and cost of water and energy supplies. Wetherefore view climate change as a company, community, and globalconcern. In 2017, we developed a climate change strategy aligned withour overall business strategy to grow free cash flow per share throughsafe and responsible mining.
Barrick’s climate change strategy has three pillars: understand andmitigate the risks associated with climate change; reduce our impacts onclimate change; and improve our disclosure on climate change. Actiontaken on each pillar in 2017 is described below.
Understand and mitigate the risks associated with climate change: In2017, we performed a climate change risk

BARRICK YEAR-END 2017 31 MANAGEMENT’S DISCUSSION AND ANALYSIS
assessment, using our standard risk management framework. Weassessed risks and opportunities across both potential transition (e.g.,regulatory, policy, reputational) and physical (e.g., extreme climateevents) aspects of climate change. We have identified the top threeclimate-related risks and opportunities for our business: an increase inextended duration extreme precipitation events; an increase in climatechange regulations to limit greenhouse gas (“GHG”) emissions; andincreased global investment in innovation and low carbon technologies.The assessment also included a review of the current mitigation andcontrols associated with each risk and identified areas which may needfurther strengthening to reduce risk.
Reduce the Company’s impact on climate change: Over the course of2017, we analyzed our current and forecasted GHG emissions todevelop an ambitious but realistic goal to reduce Barrick’s GHGemissions. Mining is an energy-intensive business, and we understandthe important link between energy use and GHG emissions. Byeffectively managing our energy use, we can reduce our draw from localenergy grids, reduce our GHG emissions, achieve more efficientproduction, and save direct mining costs. Barrick has set a goal to keepits current GHG emissions flat in the short term and is targeting a30 percent reduction in GHG emissions by 2030, from a 2016 baselineof 3.5 MT CO2e emitted. This target is also closely aligned with thenational targets set by many of our host governments.
Improve our disclosure on climate change: In 2017, we committed tosupporting the voluntary recommendations of the industry-led FinancialStability Board Task Force on Climate-related Financial Disclosures(“TCFD”). The TCFD recommendations are considered the newbenchmark for disclosure of climate-related risks and opportunities, andBarrick was the only Canadian mining company to make this publiccommitment. We will implement the full recommendations over the nexttwo years.
Governance over climate-related risks and opportunities is provided atboth the Board and management level. The Board’s CorporateResponsibility Committee meets at least quarterly and is responsible foroverseeing Barrick’s policies, programs, and performance relating to theenvironment, including climate change. The Risk Committee assists theBoard in overseeing the Company’s management of enterprise risks aswell as the implementation of policies and standards for monitoring andmitigating such risks. Climate change is built into our formal riskmanagement process, outputs of which are reviewed by the RiskCommittee. The Audit Committee reviews the Company’s approach toclimate change in the context of Barrick’s disclosures.
At the management level, our Climate Change Committee, comprised ofsenior members of our
management team, provides strategic oversight and governance over keydecisions related to Barrick’s Climate Change Strategy, such asoverseeing climate change risk and opportunity assessments, monitoringprogress against GHG emissions targets, and providing guidance onexternal disclosures.
Further to the specific focus of the Climate Change Committee, the weeklyBPR allows for the discussion of opportunities and risks that may help orhinder the Company from achieving its objectives, including climate-related risks (e.g., spring snow melts, hurricanes, flooding, and mudslides).
Climate change activities initiated in 2017 will continue into 2018 andbeyond. Site-level climate-related risks and mitigation plans will bereviewed in the context of the company-wide risk assessment, and site-level plans to reduce energy and GHG emissions will be strengthened.We will continue to enhance our climate-related disclosure according tothe TCFD recommendations. Overall, based on the groundworkcompleted in 2017, Barrick is building resilience to withstand the potentialimpacts of climate change and leverage potential opportunities as theglobal economy transitions to a low-carbon future.
Reserves and ResourcesOur 2017 reserves were calculated using a gold price assumption of$1,200 per ounce. As of December 31, 2017, Barrick’s proven andprobable gold reserves were 64.4 million ounces 6 , compared to86.0 million ounces at the end of 2016. This decline primarily reflects thedivestment of approximately 9.2 million ounces associated with Veladeroand Cerro Casale, and the reclassification of approximately 14.0 millionounces of Pascua-Lama proven and probable gold reserves as measuredand indicated resources.
Barrick added 8.0 million ounces of proven and probable gold reserves atexisting operations (as well as the Goldrush project) through drilling, morethan replacing the 6.2 million ounces depleted through processing lastyear. This success reflects increased investment in mine explorationdrilling in 2017. Significant additions included 2.1 million ounces atTurquoise Ridge, 1.4 million ounces at Cortez, 1.3 million ounces atGoldstrike, 397,000 ounces at Hemlo, and 392,000 ounces at LagunasNorte. We also declared an initial reserve of 1.5 million ounces at theGoldrush project. In addition, Barrick’s 63.9 percent share of reserves atAcacia’s North Mara mine increased by 504,000 ounces. The averagegrade of Barrick’s reserves also increased by 17 percent, from 1.33 gramsper tonne, to 1.55 grams per tonne.
In 2017, measured, indicated, and inferred gold resources were calculatedusing a gold price assumption of $1,500 per ounce, consistent with 2016.Measured and indicated
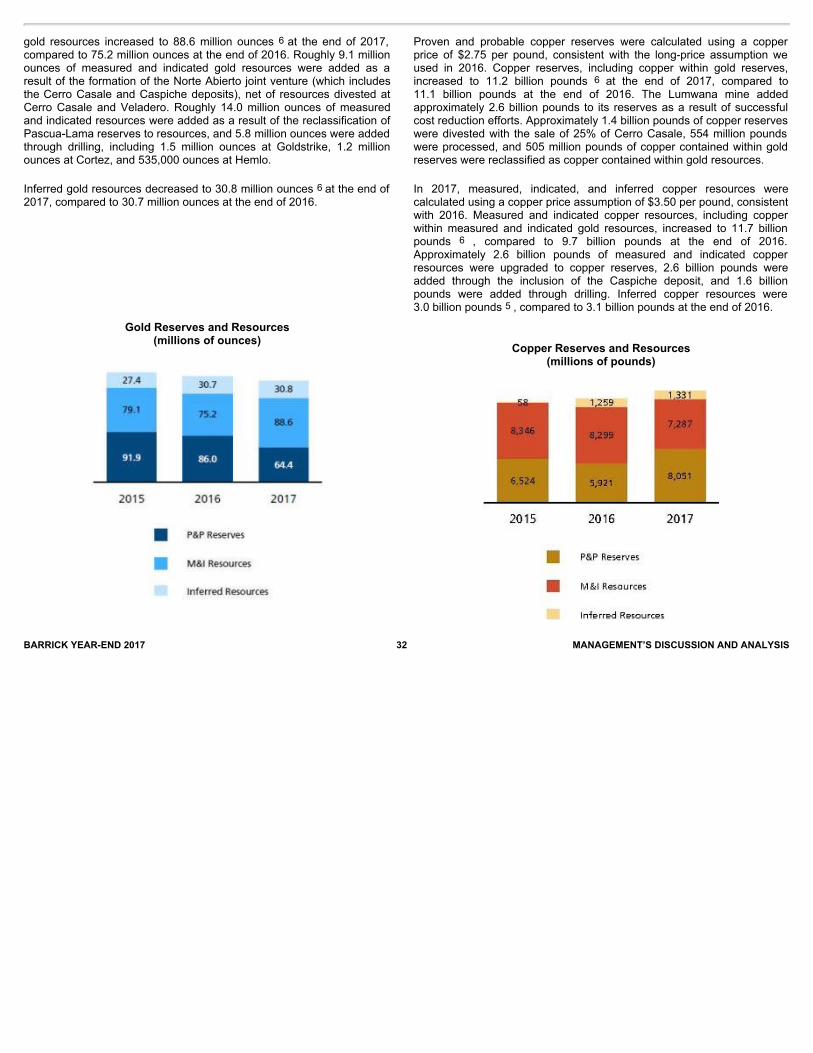
BARRICK YEAR-END 2017 32 MANAGEMENT’S DISCUSSION AND ANALYSIS
gold resources increased to 88.6 million ounces 6 at the end of 2017,compared to 75.2 million ounces at the end of 2016. Roughly 9.1 millionounces of measured and indicated gold resources were added as aresult of the formation of the Norte Abierto joint venture (which includesthe Cerro Casale and Caspiche deposits), net of resources divested atCerro Casale and Veladero. Roughly 14.0 million ounces of measuredand indicated resources were added as a result of the reclassification ofPascua-Lama reserves to resources, and 5.8 million ounces were addedthrough drilling, including 1.5 million ounces at Goldstrike, 1.2 millionounces at Cortez, and 535,000 ounces at Hemlo.
Inferred gold resources decreased to 30.8 million ounces 6 at the end of2017, compared to 30.7 million ounces at the end of 2016.
Gold Reserves and Resources(millions of ounces)
Proven and probable copper reserves were calculated using a copperprice of $2.75 per pound, consistent with the long-price assumption weused in 2016. Copper reserves, including copper within gold reserves,increased to 11.2 billion pounds 6 at the end of 2017, compared to11.1 billion pounds at the end of 2016. The Lumwana mine addedapproximately 2.6 billion pounds to its reserves as a result of successfulcost reduction efforts. Approximately 1.4 billion pounds of copper reserveswere divested with the sale of 25% of Cerro Casale, 554 million poundswere processed, and 505 million pounds of copper contained within goldreserves were reclassified as copper contained within gold resources.
In 2017, measured, indicated, and inferred copper resources werecalculated using a copper price assumption of $3.50 per pound, consistentwith 2016. Measured and indicated copper resources, including copperwithin measured and indicated gold resources, increased to 11.7 billionpounds 6 , compared to 9.7 billion pounds at the end of 2016.Approximately 2.6 billion pounds of measured and indicated copperresources were upgraded to copper reserves, 2.6 billion pounds wereadded through the inclusion of the Caspiche deposit, and 1.6 billionpounds were added through drilling. Inferred copper resources were3.0 billion pounds 5 , compared to 3.1 billion pounds at the end of 2016.
Copper Reserves and Resources(millions of pounds)
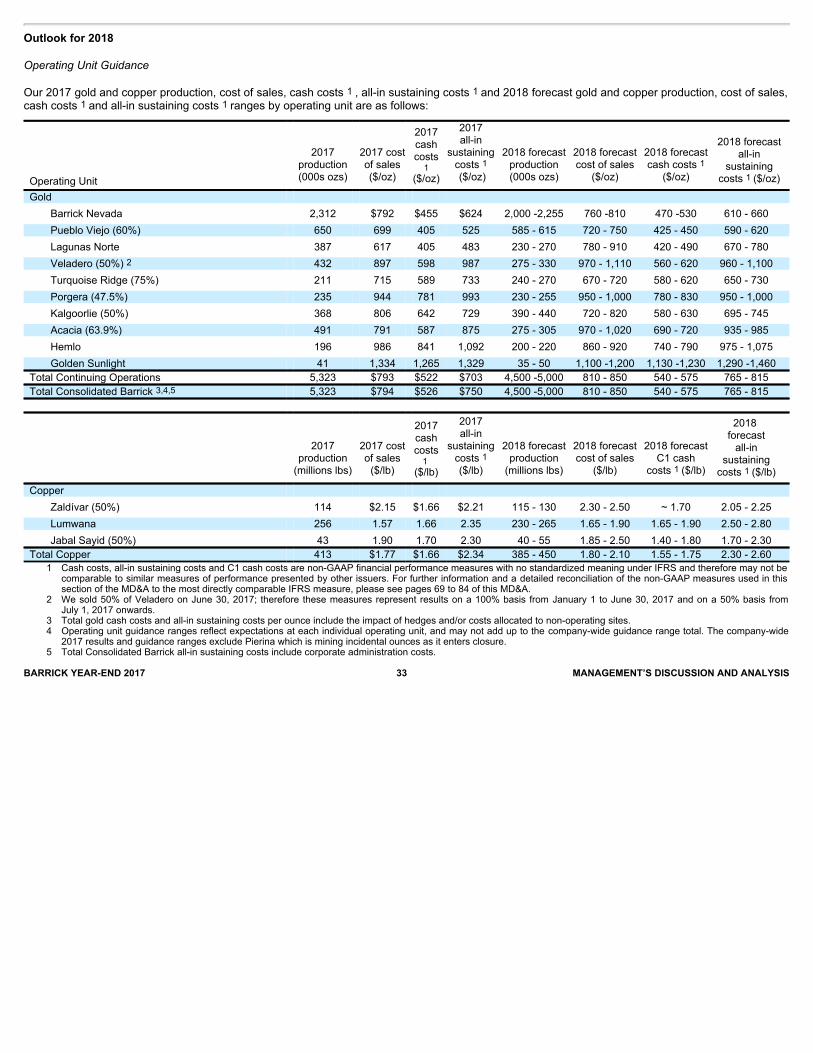
Outlook for 2018
Operating Unit Guidance
Our 2017 gold and copper production, cost of sales, cash costs 1 , all-in sustaining costs 1 and 2018 forecast gold and copper production, cost of sales,cash costs 1 and all-in sustaining costs 1 ranges by operating unit are as follows:
Operating Unit
2017production(000s ozs)
2017 costof sales($/oz)
2017cashcosts1
($/oz)
2017all-in
sustainingcosts 1 ($/oz)
2018 forecastproduction(000s ozs)
2018 forecastcost of sales
($/oz)
2018 forecastcash costs 1
($/oz)
2018 forecast all-in
sustaining costs 1 ($/oz)
Gold Barrick Nevada 2,312 $792 $455 $624 2,000 -2,255 760 -810 470 -530 610 - 660 Pueblo Viejo (60%) 650 699 405 525 585 - 615 720 - 750 425 - 450 590 - 620 Lagunas Norte 387 617 405 483 230 - 270 780 - 910 420 - 490 670 - 780 Veladero (50%) 2 432 897 598 987 275 - 330 970 - 1,110 560 - 620 960 - 1,100 Turquoise Ridge (75%) 211 715 589 733 240 - 270 670 - 720 580 - 620 650 - 730 Porgera (47.5%) 235 944 781 993 230 - 255 950 - 1,000 780 - 830 950 - 1,000 Kalgoorlie (50%) 368 806 642 729 390 - 440 720 - 820 580 - 630 695 - 745 Acacia (63.9%) 491 791 587 875 275 - 305 970 - 1,020 690 - 720 935 - 985 Hemlo 196 986 841 1,092 200 - 220 860 - 920 740 - 790 975 - 1,075 Golden Sunlight 41 1,334 1,265 1,329 35 - 50 1,100 -1,200 1,130 -1,230 1,290 -1,460
Total Continuing Operations 5,323 $793 $522 $703 4,500 -5,000 810 - 850 540 - 575 765 - 815 Total Consolidated Barrick 3,4,5 5,323 $794 $526 $750 4,500 -5,000 810 - 850 540 - 575 765 - 815
2017production(millions lbs)
2017 costof sales($/lb)
2017cashcosts1
($/lb)
2017all-in
sustainingcosts 1($/lb)
2018 forecastproduction(millions lbs)
2018 forecastcost of sales
($/lb)
2018 forecastC1 cash
costs 1 ($/lb)
2018 forecast all-in
sustaining costs 1 ($/lb)
Copper Zaldívar (50%) 114 $2.15 $1.66 $2.21 115 - 130 2.30 - 2.50 ~ 1.70 2.05 - 2.25 Lumwana 256 1.57 1.66 2.35 230 - 265 1.65 - 1.90 1.65 - 1.90 2.50 - 2.80 Jabal Sayid (50%) 43 1.90 1.70 2.30 40 - 55 1.85 - 2.50 1.40 - 1.80 1.70 - 2.30
Total Copper 413 $1.77 $1.66 $2.34 385 - 450 1.80 - 2.10 1.55 - 1.75 2.30 - 2.60
1 Cash costs, all-in sustaining costs and C1 cash costs are non-GAAP financial performance measures with no standardized meaning under IFRS and therefore may not be
comparable to similar measures of performance presented by other issuers. For further information and a detailed reconciliation of the non-GAAP measures used in thissection of the MD&A to the most directly comparable IFRS measure, please see pages 69 to 84 of this MD&A.
2 We sold 50% of Veladero on June 30, 2017; therefore these measures represent results on a 100% basis from January 1 to June 30, 2017 and on a 50% basis fromJuly 1, 2017 onwards.
3 Total gold cash costs and all-in sustaining costs per ounce include the impact of hedges and/or costs allocated to non-operating sites. 4 Operating unit guidance ranges reflect expectations at each individual operating unit, and may not add up to the company-wide guidance range total. The company-wide
2017 results and guidance ranges exclude Pierina which is mining incidental ounces as it enters closure. 5 Total Consolidated Barrick all-in sustaining costs include corporate administration costs.BARRICK YEAR-END 2017 33 MANAGEMENT’S DISCUSSION AND ANALYSIS
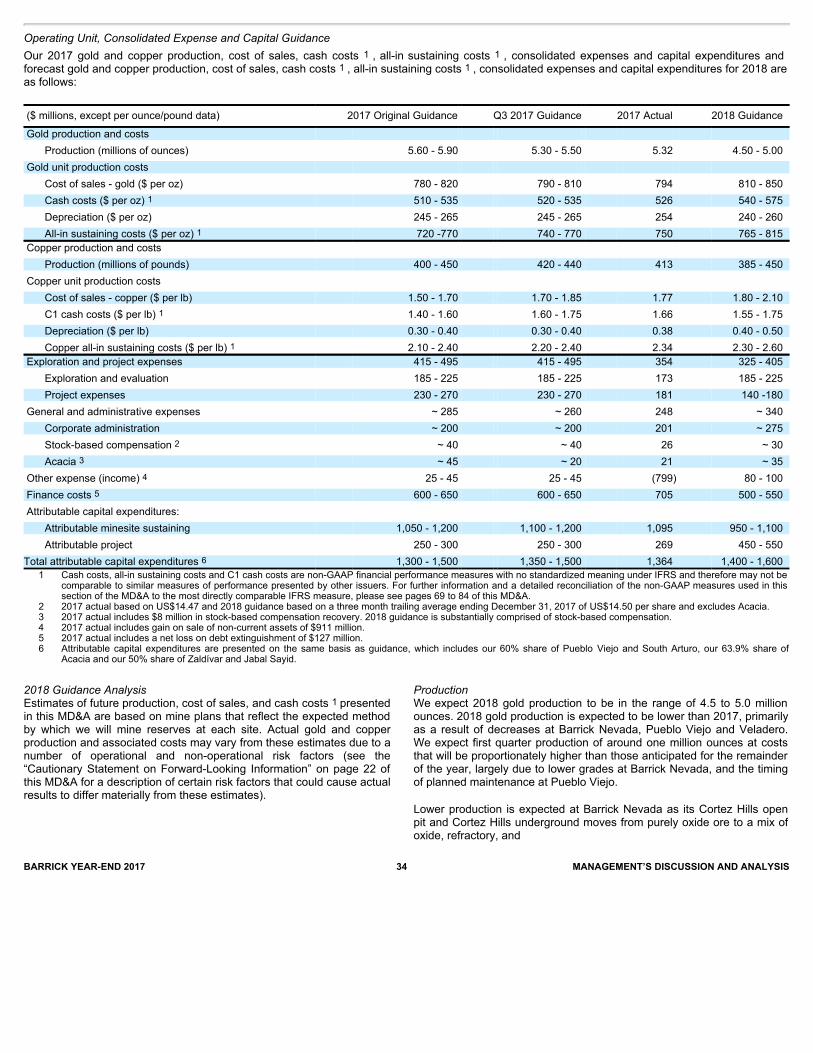
Operating Unit, Consolidated Expense and Capital GuidanceOur 2017 gold and copper production, cost of sales, cash costs 1 , all-in sustaining costs 1 , consolidated expenses and capital expenditures andforecast gold and copper production, cost of sales, cash costs 1 , all-in sustaining costs 1 , consolidated expenses and capital expenditures for 2018 areas follows: ($ millions, except per ounce/pound data)
2017 Original Guidance
Q3 2017 Guidance
2017 Actual
2018 Guidance
Gold production and costs Production (millions of ounces) 5.60 - 5.90 5.30 - 5.50 5.32 4.50 - 5.00
Gold unit production costs Cost of sales - gold ($ per oz) 780 - 820 790 - 810 794 810 - 850 Cash costs ($ per oz) 1 510 - 535 520 - 535 526 540 - 575 Depreciation ($ per oz) 245 - 265 245 - 265 254 240 - 260 All-in sustaining costs ($ per oz) 1 720 -770 740 - 770 750 765 - 815
Copper production and costs Production (millions of pounds) 400 - 450 420 - 440 413 385 - 450
Copper unit production costs Cost of sales - copper ($ per lb) 1.50 - 1.70 1.70 - 1.85 1.77 1.80 - 2.10 C1 cash costs ($ per lb) 1 1.40 - 1.60 1.60 - 1.75 1.66 1.55 - 1.75 Depreciation ($ per lb) 0.30 - 0.40 0.30 - 0.40 0.38 0.40 - 0.50 Copper all-in sustaining costs ($ per lb) 1 2.10 - 2.40 2.20 - 2.40 2.34 2.30 - 2.60
Exploration and project expenses 415 - 495 415 - 495 354 325 - 405 Exploration and evaluation 185 - 225 185 - 225 173 185 - 225 Project expenses 230 - 270 230 - 270 181 140 -180
General and administrative expenses ~ 285 ~ 260 248 ~ 340 Corporate administration ~ 200 ~ 200 201 ~ 275 Stock-based compensation 2 ~ 40 ~ 40 26 ~ 30 Acacia 3 ~ 45 ~ 20 21 ~ 35
Other expense (income) 4 25 - 45 25 - 45 (799) 80 - 100 Finance costs 5 600 - 650 600 - 650 705 500 - 550 Attributable capital expenditures:
Attributable minesite sustaining 1,050 - 1,200 1,100 - 1,200 1,095 950 - 1,100 Attributable project 250 - 300 250 - 300 269 450 - 550
Total attributable capital expenditures 6 1,300 - 1,500 1,350 - 1,500 1,364 1,400 - 1,600
1 Cash costs, all-in sustaining costs and C1 cash costs are non-GAAP financial performance measures with no standardized meaning under IFRS and therefore may not be
comparable to similar measures of performance presented by other issuers. For further information and a detailed reconciliation of the non-GAAP measures used in thissection of the MD&A to the most directly comparable IFRS measure, please see pages 69 to 84 of this MD&A.
2 2017 actual based on US$14.47 and 2018 guidance based on a three month trailing average ending December 31, 2017 of US$14.50 per share and excludes Acacia. 3 2017 actual includes $8 million in stock-based compensation recovery. 2018 guidance is substantially comprised of stock-based compensation. 4 2017 actual includes gain on sale of non-current assets of $911 million. 5 2017 actual includes a net loss on debt extinguishment of $127 million. 6 Attributable capital expenditures are presented on the same basis as guidance, which includes our 60% share of Pueblo Viejo and South Arturo, our 63.9% share of
Acacia and our 50% share of Zaldívar and Jabal Sayid.
BARRICK YEAR-END 2017 34 MANAGEMENT’S DISCUSSION AND ANALYSIS
2018 Guidance AnalysisEstimates of future production, cost of sales, and cash costs 1 presentedin this MD&A are based on mine plans that reflect the expected methodby which we will mine reserves at each site. Actual gold and copperproduction and associated costs may vary from these estimates due to anumber of operational and non-operational risk factors (see the“Cautionary Statement on Forward-Looking Information” on page 22 ofthis MD&A for a description of certain risk factors that could cause actualresults to differ materially from these estimates).
ProductionWe expect 2018 gold production to be in the range of 4.5 to 5.0 millionounces. 2018 gold production is expected to be lower than 2017, primarilyas a result of decreases at Barrick Nevada, Pueblo Viejo and Veladero.We expect first quarter production of around one million ounces at coststhat will be proportionately higher than those anticipated for the remainderof the year, largely due to lower grades at Barrick Nevada, and the timingof planned maintenance at Pueblo Viejo.
Lower production is expected at Barrick Nevada as its Cortez Hills openpit and Cortez Hills underground moves from purely oxide ore to a mix ofoxide, refractory, and
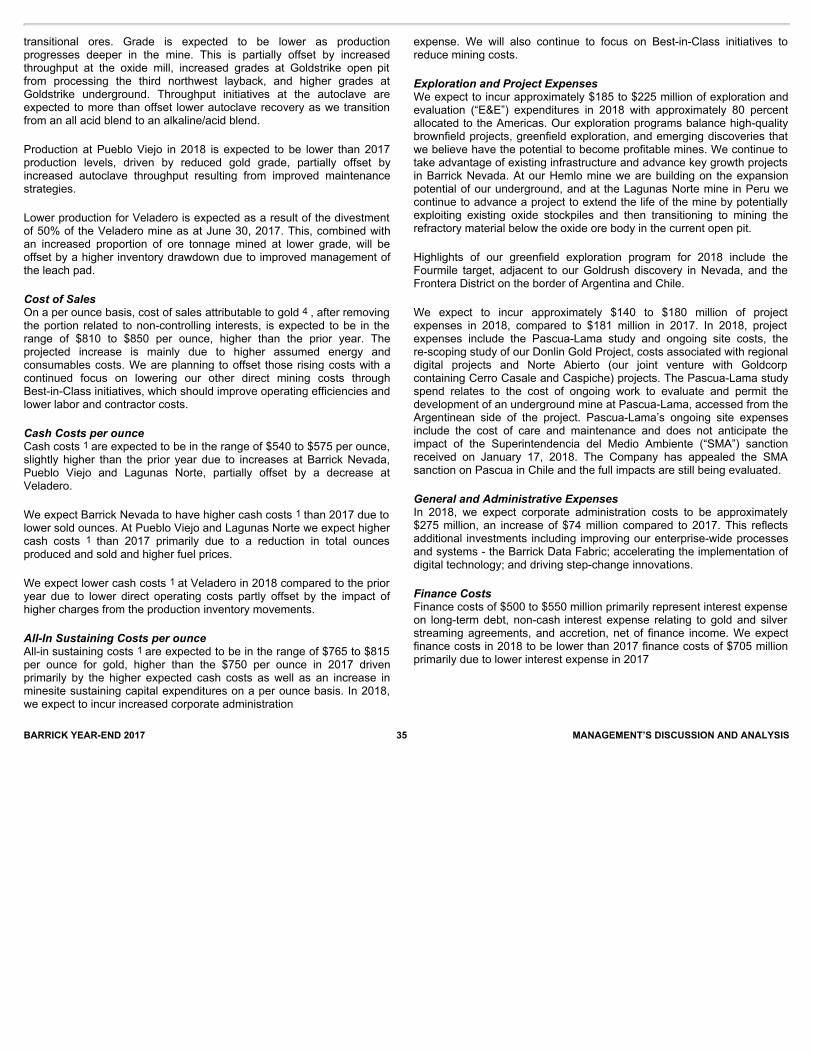
BARRICK YEAR-END 2017 35 MANAGEMENT’S DISCUSSION AND ANALYSIS
transitional ores. Grade is expected to be lower as productionprogresses deeper in the mine. This is partially offset by increasedthroughput at the oxide mill, increased grades at Goldstrike open pitfrom processing the third northwest layback, and higher grades atGoldstrike underground. Throughput initiatives at the autoclave areexpected to more than offset lower autoclave recovery as we transitionfrom an all acid blend to an alkaline/acid blend.
Production at Pueblo Viejo in 2018 is expected to be lower than 2017production levels, driven by reduced gold grade, partially offset byincreased autoclave throughput resulting from improved maintenancestrategies.
Lower production for Veladero is expected as a result of the divestmentof 50% of the Veladero mine as at June 30, 2017. This, combined withan increased proportion of ore tonnage mined at lower grade, will beoffset by a higher inventory drawdown due to improved management ofthe leach pad.
CostofSalesOn a per ounce basis, cost of sales attributable to gold 4 , after removingthe portion related to non-controlling interests, is expected to be in therange of $810 to $850 per ounce, higher than the prior year. Theprojected increase is mainly due to higher assumed energy andconsumables costs. We are planning to offset those rising costs with acontinued focus on lowering our other direct mining costs throughBest-in-Class initiatives, which should improve operating efficiencies andlower labor and contractor costs.
CashCostsperounceCash costs 1 are expected to be in the range of $540 to $575 per ounce,slightly higher than the prior year due to increases at Barrick Nevada,Pueblo Viejo and Lagunas Norte, partially offset by a decrease atVeladero.
We expect Barrick Nevada to have higher cash costs 1 than 2017 due tolower sold ounces. At Pueblo Viejo and Lagunas Norte we expect highercash costs 1 than 2017 primarily due to a reduction in total ouncesproduced and sold and higher fuel prices.
We expect lower cash costs 1 at Veladero in 2018 compared to the prioryear due to lower direct operating costs partly offset by the impact ofhigher charges from the production inventory movements.
All-InSustainingCostsperounceAll-in sustaining costs 1 are expected to be in the range of $765 to $815per ounce for gold, higher than the $750 per ounce in 2017 drivenprimarily by the higher expected cash costs as well as an increase inminesite sustaining capital expenditures on a per ounce basis. In 2018,we expect to incur increased corporate administration
expense. We will also continue to focus on Best-in-Class initiatives toreduce mining costs.
ExplorationandProjectExpensesWe expect to incur approximately $185 to $225 million of exploration andevaluation (“E&E”) expenditures in 2018 with approximately 80 percentallocated to the Americas. Our exploration programs balance high-qualitybrownfield projects, greenfield exploration, and emerging discoveries thatwe believe have the potential to become profitable mines. We continue totake advantage of existing infrastructure and advance key growth projectsin Barrick Nevada. At our Hemlo mine we are building on the expansionpotential of our underground, and at the Lagunas Norte mine in Peru wecontinue to advance a project to extend the life of the mine by potentiallyexploiting existing oxide stockpiles and then transitioning to mining therefractory material below the oxide ore body in the current open pit.
Highlights of our greenfield exploration program for 2018 include theFourmile target, adjacent to our Goldrush discovery in Nevada, and theFrontera District on the border of Argentina and Chile.
We expect to incur approximately $140 to $180 million of projectexpenses in 2018, compared to $181 million in 2017. In 2018, projectexpenses include the Pascua-Lama study and ongoing site costs, there-scoping study of our Donlin Gold Project, costs associated with regionaldigital projects and Norte Abierto (our joint venture with Goldcorpcontaining Cerro Casale and Caspiche) projects. The Pascua-Lama studyspend relates to the cost of ongoing work to evaluate and permit thedevelopment of an underground mine at Pascua-Lama, accessed from theArgentinean side of the project. Pascua-Lama’s ongoing site expensesinclude the cost of care and maintenance and does not anticipate theimpact of the Superintendencia del Medio Ambiente (“SMA”) sanctionreceived on January 17, 2018. The Company has appealed the SMAsanction on Pascua in Chile and the full impacts are still being evaluated.
GeneralandAdministrativeExpensesIn 2018, we expect corporate administration costs to be approximately$275 million, an increase of $74 million compared to 2017. This reflectsadditional investments including improving our enterprise-wide processesand systems - the Barrick Data Fabric; accelerating the implementation ofdigital technology; and driving step-change innovations.
FinanceCostsFinance costs of $500 to $550 million primarily represent interest expenseon long-term debt, non-cash interest expense relating to gold and silverstreaming agreements, and accretion, net of finance income. We expectfinance costs in 2018 to be lower than 2017 finance costs of $705 millionprimarily due to lower interest expense in 2017
BARRICK YEAR-END 2017 36 MANAGEMENT’S DISCUSSION AND ANALYSIS
following $1.5 billion of debt repayments in 2017. The impact of anyfurther debt reductions accomplished in 2018 has not been reflected inour guidance on interest expense or extinguishment losses. 2017finance costs included a $127 million net loss on the extinguishment ofdebt, and further debt repurchases could lead to additional losses onextinguishment that could cause an increase to forecasted finance costs.
CapitalExpendituresTotal attributable capital expenditures for 2018 are expected to be in therange of $1.40 to $1.60 billion. Investing in project capital is a priority in2018 for Barrick, and we expect attributable project capital expendituresto increase to a range of $450 to $550 million, an increase over our 2017project capital expenditure of $269 million. In contrast, attributableminesite sustaining capital expenditures are expected to be in the rangeof $950 to $1,100 million, compared to our 2017 minesite sustainingcapital expenditure of $1,095 million.
Project capital expenditures reflect capital expenditures at new projectsand existing operations that are related to discrete expansion projectsintended to increase production and will not benefit production for atleast 12 months. Project capital expenditures also include capitalexpenditures related to the initial construction of a project and include allof the expenditures required to bring the project into operation andachieve commercial production levels.
The budgeted increase in project capital expenditures in 2018 isprimarily due to increased spending on the Lower Zone undergroundexpansion and Crossroads project at Cortez, associated with theunderground declines at Cortez Hills underground and Goldrush, anincrease at Zaldívar associated with a planned plant expansion, andincreases at Norte Abierto and Pascua-Lama.
Minesite sustaining capital expenditures reflect the capital spendingrequired to support current planned production levels and those whichdo not meet our definition of project capital. This includes capitalizedproduction phase stripping costs at our open pit mines, undergroundmine development, minesite E&E expenditures, and routine plant,equipment and maintenance spend that meet our criteria forcapitalization.
Attributable minesite sustaining capital expenditures are expected to bein the range of $950 to $1,100 million compared to $1,095 in 2017. Weexpect reduced capitalized stripping at Barrick Nevada, Porgera and
Acacia, in addition to a reduction in processing and minesite sustainingcapital at Barrick Nevada and Veladero. These are partially offset by anincrease in capitalized stripping and equipment rebuilds at Lumwana, anincrease in tailings and process facility upgrades at Pueblo Viejo and anincrease in capital associated with environmental obligations at LagunasNorte. These decreases in sustaining capital are the result of ourcontinued focus on our asset optimization and capital disciplineprocesses.
At Barrick Nevada in 2018, sustaining capital expenditures are expectedto decrease primarily due to a reduction in capitalized stripping as theGoldstrike open pit transitions from stripping both the 3rd and 4thnorthwest laybacks to only stripping the 4th northwest layback until thefourth quarter of 2018. In addition, Goldstrike’s cooling and ventilation anddewatering projects to allow mining below a 3,600-foot elevation will nearcompletion mid-2018. The autoclave thiosulfate water treatment plantconversion was completed in 2017, which significantly improved waterbalances and the consumption of fresh reagent.
At Porgera, sustaining capital expenditures are expected to decrease in2018 primarily due to a planned reduction in capitalized stripping as thesite focuses on an underground expansion plan.
At Veladero, a reduction in sustaining capital is expected in 2018, mainlyassociated with the completion of the Phase 6 VFLF leach pad expansionand process facility upgrades along with a reduction in overall attributablecapital spend due to 2018 being our first full year at our 50/50 equityownership with our joint venture partner, Shandong Gold.
At Lumwana, the 2018 increase in sustaining capital is related toincreased stripping of the Chimi deposit and purchase of majormaintenance components and the electric conversion of the PC8000shovel.
At Pueblo Viejo, the increase in sustaining capital in 2018 is related toinitiatives to improve the plant’s operational efficiency, process facilityupgrades and continued tailings expansion capital.
EffectiveIncomeTaxRateAt current spot gold prices, our expected effective tax rate range for 2018is 41% to 43%.
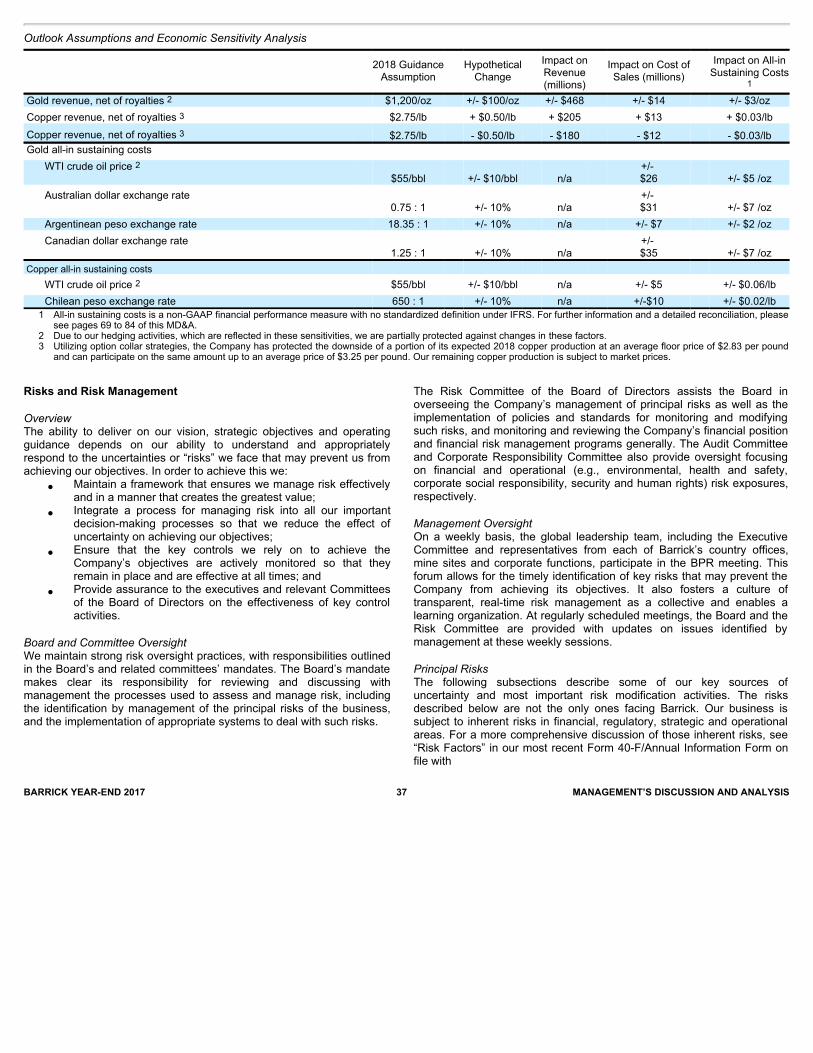
Outlook Assumptions and Economic Sensitivity Analysis
2018 GuidanceAssumption
HypotheticalChange
Impact onRevenue(millions)
Impact on Cost ofSales (millions)
Impact on All-inSustaining Costs
1
Gold revenue, net of royalties 2 $1,200/oz +/- $100/oz +/- $468 +/- $14 +/- $3/oz Copper revenue, net of royalties 3 $2.75/lb + $0.50/lb + $205 + $13 + $0.03/lb
Copper revenue, net of royalties 3 $2.75/lb - $0.50/lb - $180 - $12 - $0.03/lb Gold all-in sustaining costs
WTI crude oil price 2 $55/bbl +/- $10/bbl n/a
+/- $26 +/- $5 /oz
Australian dollar exchange rate 0.75 : 1 +/- 10% n/a
+/- $31 +/- $7 /oz
Argentinean peso exchange rate 18.35 : 1 +/- 10% n/a +/- $7 +/- $2 /ozCanadian dollar exchange rate
1.25 : 1 +/- 10% n/a +/- $35 +/- $7 /oz
Copper all-in sustaining costs WTI crude oil price 2 $55/bbl +/- $10/bbl n/a +/- $5 +/- $0.06/lbChilean peso exchange rate 650 : 1 +/- 10% n/a +/-$10 +/- $0.02/lb
1 All-in sustaining costs is a non-GAAP financial performance measure with no standardized definition under IFRS. For further information and a detailed reconciliation, pleasesee pages 69 to 84 of this MD&A.
2 Due to our hedging activities, which are reflected in these sensitivities, we are partially protected against changes in these factors. 3 Utilizing option collar strategies, the Company has protected the downside of a portion of its expected 2018 copper production at an average floor price of $2.83 per pound
and can participate on the same amount up to an average price of $3.25 per pound. Our remaining copper production is subject to market prices.
BARRICK YEAR-END 2017 37 MANAGEMENT’S DISCUSSION AND ANALYSIS
Risks and Risk Management
OverviewThe ability to deliver on our vision, strategic objectives and operatingguidance depends on our ability to understand and appropriatelyrespond to the uncertainties or “risks” we face that may prevent us fromachieving our objectives. In order to achieve this we: • Maintain a framework that ensures we manage risk effectively
and in a manner that creates the greatest value;
• Integrate a process for managing risk into all our important
decision-making processes so that we reduce the effect ofuncertainty on achieving our objectives;
• Ensure that the key controls we rely on to achieve the
Company’s objectives are actively monitored so that theyremain in place and are effective at all times; and
• Provide assurance to the executives and relevant Committees
of the Board of Directors on the effectiveness of key controlactivities.
Board and Committee OversightWe maintain strong risk oversight practices, with responsibilities outlinedin the Board’s and related committees’ mandates. The Board’s mandatemakes clear its responsibility for reviewing and discussing withmanagement the processes used to assess and manage risk, includingthe identification by management of the principal risks of the business,and the implementation of appropriate systems to deal with such risks.
The Risk Committee of the Board of Directors assists the Board inoverseeing the Company’s management of principal risks as well as theimplementation of policies and standards for monitoring and modifyingsuch risks, and monitoring and reviewing the Company’s financial positionand financial risk management programs generally. The Audit Committeeand Corporate Responsibility Committee also provide oversight focusingon financial and operational (e.g., environmental, health and safety,corporate social responsibility, security and human rights) risk exposures,respectively.
Management OversightOn a weekly basis, the global leadership team, including the ExecutiveCommittee and representatives from each of Barrick’s country offices,mine sites and corporate functions, participate in the BPR meeting. Thisforum allows for the timely identification of key risks that may prevent theCompany from achieving its objectives. It also fosters a culture oftransparent, real-time risk management as a collective and enables alearning organization. At regularly scheduled meetings, the Board and theRisk Committee are provided with updates on issues identified bymanagement at these weekly sessions.
Principal RisksThe following subsections describe some of our key sources ofuncertainty and most important risk modification activities. The risksdescribed below are not the only ones facing Barrick. Our business issubject to inherent risks in financial, regulatory, strategic and operationalareas. For a more comprehensive discussion of those inherent risks, see“Risk Factors” in our most recent Form 40-F/Annual Information Form onfile with
BARRICK YEAR-END 2017 38 MANAGEMENT’S DISCUSSION AND ANALYSIS
the SEC and Canadian provincial securities regulatory authorities. Alsosee the “Cautionary Statement on Forward-Looking Information” on page22 of this MD&A.
Financial position and liquidityOur liquidity profile, level of indebtedness and credit ratings are allfactors in our ability to meet short- and long-term financial demands.Barrick’s outstanding debt balances impact liquidity through scheduledinterest and principal repayments and the results of leverage ratiocalculations, which could influence our investment grade credit ratingsand ability to access capital markets. In addition, the Company’s abilityto draw on our credit facility is subject to meeting its covenants. Ourprimary source of liquidity is our operating cash flow, which is dependenton the ability of our operations to deliver projected future cash flows. Theability of our operations to deliver projected future cash flows, as well asfuture changes in gold and copper market prices, either favorable orunfavorable, will continue to have a material impact on our cash flow andliquidity.
Key risk modification activities:
• Reduced notional and lengthened average tenor of ouroutstanding debt through liability management activities;
• Continued focus on generating positive free cash flow by
improving the underlying cost structures of our operations in asustainable manner;
• Disciplined capital allocation criteria for all investments, andregular Investment Committee meetings to ensure a highdegree of consistency and rigor is applied to all capitalallocation decisions based on a comprehensive understandingof risk and reward;
• Preparation of budgets and forecasts to understand the impact
of different price scenarios on liquidity, and formulateappropriate strategies; and
• Other options available to the Company to enhance liquidity
include drawing on our $4.0 billion undrawn credit facility,asset sales, joint ventures, or issuance of debt or equitysecurities.
Improving free cash flow 1 and costsOur ability to improve productivity, drive down operating costs andreduce working capital remains a focus in 2018 and is subject to severalsources of uncertainty. This includes our ability to achieve and maintainindustry-leading margins by improving the productivity and efficiency ofour operations through our Best-in-Class, Asset Integrity and digitaltransformation programs.
Key risk modification activities:
• Formal project management protocols are established around
these business transformation programs. The status of theseprojects is reviewed on a weekly basis during the
BPR meetings to ensure the timely identification of key riskexposures that may affect their successful delivery;
• Ongoing implementation of a digitization program including aCisco partnership to unlock the potential of digital mining; and
• Ongoing implementation of a Best-in-Class program to unleashthe full potential of our mines and encompassing:
° A standardized, performance-oriented measurementscorecard linking top operational and economic measures;
° Monthly optimization forums as a way to communicate andreview the Best-in-Class projects and performance to targets;
° Innovation and digitization program focused on driving valueacross the business; and
° Asset Integrity program to improve availability of criticalinfrastructure.
Social license to operateAt Barrick, we are committed to building, operating, and closing our minesin a safe and responsible manner. To do this, we seek to develop long-term and mutually-beneficial relationships with host governments andcommunities while working to minimize the social and environmentalimpacts of our activities. Geopolitical risks such as resource nationalismand incidents of corruption are inherent for a company operating globally.Past environmental incidents in the extractive industry highlight thehazards (e.g., water management, tailings storage facilities, etc.) and thepotential consequences to both the environment and community healthand safety. Barrick also recognizes climate change as an area of riskrequiring specific focus. Our ability to maintain compliance with regulatoryand community obligations in order to protect the environment and ourhost communities alike remains one of our top priorities.
Key risk modification activities:
• Our external Corporate Social Responsibility Advisory Boardwas formed in 2012 and provides expert advice to the Companyon a range of corporate social responsibility matters, includingcommunity relations, sustainable development, water, energy,climate change, security and human rights;
• Our obligations, expectations and intentions are codified in our
Vision and Values and the Code of Business Conduct andEthics, and they are reinforced regularly at all levels of theCompany;
• Barrick’s community relations, environment, safety and health,
security and compliance management systems setexpectations, define performance standards and provide thenecessary tools to modify the related risks;
• We take a partnership approach with our home and hostgovernments. This means we work to
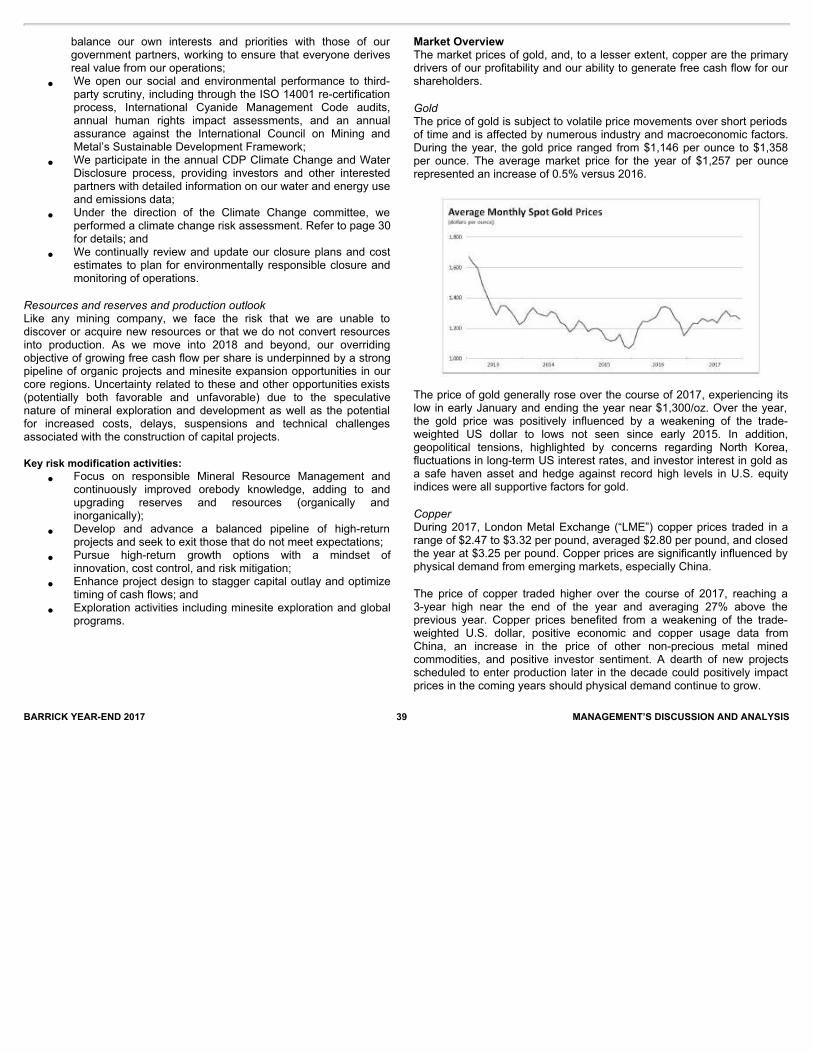
BARRICK YEAR-END 2017 39 MANAGEMENT’S DISCUSSION AND ANALYSIS
balance our own interests and priorities with those of ourgovernment partners, working to ensure that everyone derivesreal value from our operations;
• We open our social and environmental performance to third-party scrutiny, including through the ISO 14001 re-certificationprocess, International Cyanide Management Code audits,annual human rights impact assessments, and an annualassurance against the International Council on Mining andMetal’s Sustainable Development Framework;
• We participate in the annual CDP Climate Change and Water
Disclosure process, providing investors and other interestedpartners with detailed information on our water and energy useand emissions data;
• Under the direction of the Climate Change committee, we
performed a climate change risk assessment. Refer to page 30for details; and
• We continually review and update our closure plans and cost
estimates to plan for environmentally responsible closure andmonitoring of operations.
Resources and reserves and production outlookLike any mining company, we face the risk that we are unable todiscover or acquire new resources or that we do not convert resourcesinto production. As we move into 2018 and beyond, our overridingobjective of growing free cash flow per share is underpinned by a strongpipeline of organic projects and minesite expansion opportunities in ourcore regions. Uncertainty related to these and other opportunities exists(potentially both favorable and unfavorable) due to the speculativenature of mineral exploration and development as well as the potentialfor increased costs, delays, suspensions and technical challengesassociated with the construction of capital projects.
Key risk modification activities:
• Focus on responsible Mineral Resource Management and
continuously improved orebody knowledge, adding to andupgrading reserves and resources (organically andinorganically);
• Develop and advance a balanced pipeline of high-returnprojects and seek to exit those that do not meet expectations;
• Pursue high-return growth options with a mindset ofinnovation, cost control, and risk mitigation;
• Enhance project design to stagger capital outlay and optimizetiming of cash flows; and
• Exploration activities including minesite exploration and globalprograms.
Market OverviewThe market prices of gold, and, to a lesser extent, copper are the primarydrivers of our profitability and our ability to generate free cash flow for ourshareholders.
GoldThe price of gold is subject to volatile price movements over short periodsof time and is affected by numerous industry and macroeconomic factors.During the year, the gold price ranged from $1,146 per ounce to $1,358per ounce. The average market price for the year of $1,257 per ouncerepresented an increase of 0.5% versus 2016.
The price of gold generally rose over the course of 2017, experiencing itslow in early January and ending the year near $1,300/oz. Over the year,the gold price was positively influenced by a weakening of the trade-weighted US dollar to lows not seen since early 2015. In addition,geopolitical tensions, highlighted by concerns regarding North Korea,fluctuations in long-term US interest rates, and investor interest in gold asa safe haven asset and hedge against record high levels in U.S. equityindices were all supportive factors for gold.
CopperDuring 2017, London Metal Exchange (“LME”) copper prices traded in arange of $2.47 to $3.32 per pound, averaged $2.80 per pound, and closedthe year at $3.25 per pound. Copper prices are significantly influenced byphysical demand from emerging markets, especially China.
The price of copper traded higher over the course of 2017, reaching a3-year high near the end of the year and averaging 27% above theprevious year. Copper prices benefited from a weakening of the trade-weighted U.S. dollar, positive economic and copper usage data fromChina, an increase in the price of other non-precious metal minedcommodities, and positive investor sentiment. A dearth of new projectsscheduled to enter production later in the decade could positively impactprices in the coming years should physical demand continue to grow.
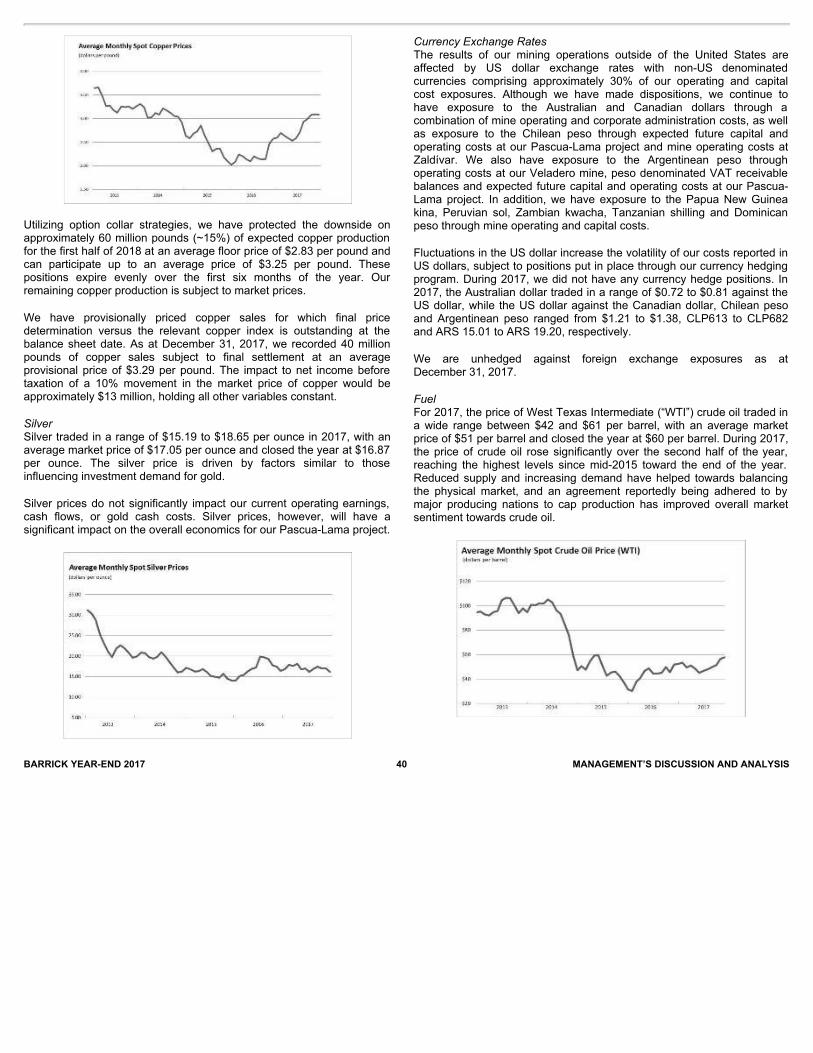
BARRICK YEAR-END 2017 40 MANAGEMENT’S DISCUSSION AND ANALYSIS
Utilizing option collar strategies, we have protected the downside onapproximately 60 million pounds (~15%) of expected copper productionfor the first half of 2018 at an average floor price of $2.83 per pound andcan participate up to an average price of $3.25 per pound. Thesepositions expire evenly over the first six months of the year. Ourremaining copper production is subject to market prices.
We have provisionally priced copper sales for which final pricedetermination versus the relevant copper index is outstanding at thebalance sheet date. As at December 31, 2017, we recorded 40 millionpounds of copper sales subject to final settlement at an averageprovisional price of $3.29 per pound. The impact to net income beforetaxation of a 10% movement in the market price of copper would beapproximately $13 million, holding all other variables constant.
SilverSilver traded in a range of $15.19 to $18.65 per ounce in 2017, with anaverage market price of $17.05 per ounce and closed the year at $16.87per ounce. The silver price is driven by factors similar to thoseinfluencing investment demand for gold.
Silver prices do not significantly impact our current operating earnings,cash flows, or gold cash costs. Silver prices, however, will have asignificant impact on the overall economics for our Pascua-Lama project.
Currency Exchange RatesThe results of our mining operations outside of the United States areaffected by US dollar exchange rates with non-US denominatedcurrencies comprising approximately 30% of our operating and capitalcost exposures. Although we have made dispositions, we continue tohave exposure to the Australian and Canadian dollars through acombination of mine operating and corporate administration costs, as wellas exposure to the Chilean peso through expected future capital andoperating costs at our Pascua-Lama project and mine operating costs atZaldívar. We also have exposure to the Argentinean peso throughoperating costs at our Veladero mine, peso denominated VAT receivablebalances and expected future capital and operating costs at our Pascua-Lama project. In addition, we have exposure to the Papua New Guineakina, Peruvian sol, Zambian kwacha, Tanzanian shilling and Dominicanpeso through mine operating and capital costs.
Fluctuations in the US dollar increase the volatility of our costs reported inUS dollars, subject to positions put in place through our currency hedgingprogram. During 2017, we did not have any currency hedge positions. In2017, the Australian dollar traded in a range of $0.72 to $0.81 against theUS dollar, while the US dollar against the Canadian dollar, Chilean pesoand Argentinean peso ranged from $1.21 to $1.38, CLP613 to CLP682and ARS 15.01 to ARS 19.20, respectively.
We are unhedged against foreign exchange exposures as atDecember 31, 2017.
FuelFor 2017, the price of West Texas Intermediate (“WTI”) crude oil traded ina wide range between $42 and $61 per barrel, with an average marketprice of $51 per barrel and closed the year at $60 per barrel. During 2017,the price of crude oil rose significantly over the second half of the year,reaching the highest levels since mid-2015 toward the end of the year.Reduced supply and increasing demand have helped towards balancingthe physical market, and an agreement reportedly being adhered to bymajor producing nations to cap production has improved overall marketsentiment towards crude oil.
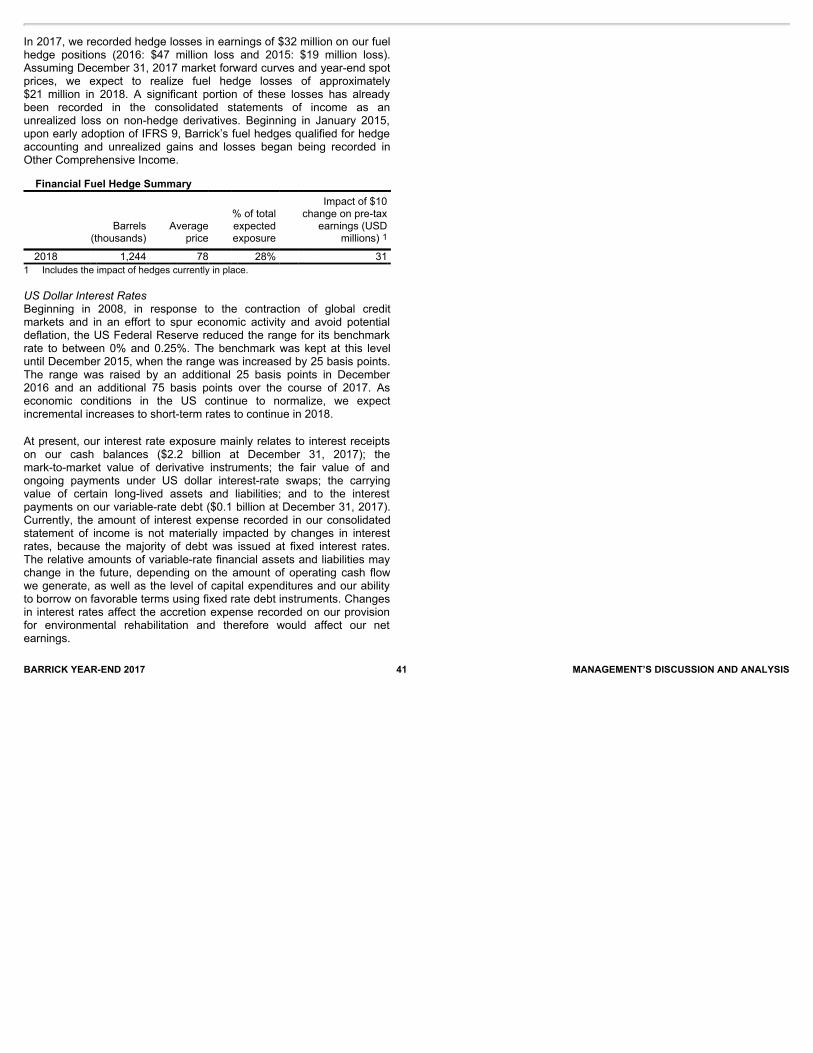
BARRICK YEAR-END 2017 41 MANAGEMENT’S DISCUSSION AND ANALYSIS
In 2017, we recorded hedge losses in earnings of $32 million on our fuelhedge positions (2016: $47 million loss and 2015: $19 million loss).Assuming December 31, 2017 market forward curves and year-end spotprices, we expect to realize fuel hedge losses of approximately$21 million in 2018. A significant portion of these losses has alreadybeen recorded in the consolidated statements of income as anunrealized loss on non-hedge derivatives. Beginning in January 2015,upon early adoption of IFRS 9, Barrick’s fuel hedges qualified for hedgeaccounting and unrealized gains and losses began being recorded inOther Comprehensive Income.
Financial Fuel Hedge Summary
Barrels
(thousands)
Averageprice
% of totalexpectedexposure
Impact of $10change on pre-tax
earnings (USDmillions) 1
2018 1,244 78 28% 31
1 Includes the impact of hedges currently in place.
US Dollar Interest RatesBeginning in 2008, in response to the contraction of global creditmarkets and in an effort to spur economic activity and avoid potentialdeflation, the US Federal Reserve reduced the range for its benchmarkrate to between 0% and 0.25%. The benchmark was kept at this leveluntil December 2015, when the range was increased by 25 basis points.The range was raised by an additional 25 basis points in December2016 and an additional 75 basis points over the course of 2017. Aseconomic conditions in the US continue to normalize, we expectincremental increases to short-term rates to continue in 2018.
At present, our interest rate exposure mainly relates to interest receiptson our cash balances ($2.2 billion at December 31, 2017); themark-to-market value of derivative instruments; the fair value of andongoing payments under US dollar interest-rate swaps; the carryingvalue of certain long-lived assets and liabilities; and to the interestpayments on our variable-rate debt ($0.1 billion at December 31, 2017).Currently, the amount of interest expense recorded in our consolidatedstatement of income is not materially impacted by changes in interestrates, because the majority of debt was issued at fixed interest rates.The relative amounts of variable-rate financial assets and liabilities maychange in the future, depending on the amount of operating cash flowwe generate, as well as the level of capital expenditures and our abilityto borrow on favorable terms using fixed rate debt instruments. Changesin interest rates affect the accretion expense recorded on our provisionfor environmental rehabilitation and therefore would affect our netearnings.

BARRICK YEAR-END 2017 42 MANAGEMENT’S DISCUSSION AND ANALYSIS
REVIEW OF ANNUAL FINANCIAL RESULTS
Revenue ($ millions, except per ounce/pound data in dollars)
For the years ended
December 31
2017 2016 2015 Gold
000s oz sold 1 5,302 5,503 6,083 000s oz produced 1 5,323 5,517 6,117 Revenue $7,631 $7,908 $7,813 Market price 2 1,257 1,251 1,160 Realized price 2,3 $1,258 $1,248 $1,157
Copper millions lbs sold 1 405 405 510 millions lbs produced 1 413 415 511 Revenue $608 $466 $1,002 Market price 2 2.80 2.21 2.49 Realized price 2,3 2.95 2.29 2.37
Other sales $135 $184 $214 Total revenue $8,374 $8,558 $9,029
1 Includes our equity share of gold ounces from Acacia and Pueblo Viejo andcopper pounds from Zaldívar and Jabal Sayid.
2 Per ounce/pound weighted average.
3 Realized price is a non-GAAP financial performance measure with nostandardized meaning under IFRS and therefore may not be comparable tosimilar measures of performance presented by other issuers. For furtherinformation and a detailed reconciliation of each non-GAAP measure used inthis section of the MD&A to the most directly comparable IFRS measure,please see pages 69 to 84 of this MD&A.
In 2017, gold revenues were down 4% compared to the prior yearprimarily due to a decrease in gold sales volume, partially offset byhigher realized gold prices 1 . The average realized gold price 1 for 2017was up $10 per ounce compared to the prior year reflecting the highermarket gold prices in 2017, which averaged $6 per ounce higher than2016.
In 2017, gold production was 194 thousand ounces or 4% lower than theprior year, primarily as a result of the divestment of 50% of the Veladeromine on June 30, 2017. Excluding the impact of the Veladerodivestment, gold production decreased by 1% or 48 thousand ouncesdue to lower grade and recovery at Turquoise Ridge, lower grade atPueblo Viejo and Hemlo, lower recovery at Lagunas Norte and lowerthroughput at Acacia as a result of reduced operations at Bulyanhulu.These decreases were partially offset by higher production at BarrickNevada and Veladero attributed to higher throughput and grade.
Copper revenues for 2017 were up 30% compared to the prior year dueto a higher realized copper price 1 . In 2017, the realized copper pricewas up $0.66 per pound compared to 2016, due to the 27% increase inmarket copper prices over the prior year.
Copper production for 2017 was 2 million pounds lower than the prior yearas lower production at Lumwana by 15 million pounds due to lower gradesand recoveries was partially offset by increased production at Jabal Sayidof 13 million pounds, related to a full year of production in 2017 after itachieved of commercial production in July 2016.
Production Costs($ millions, except per ounce/pound datain dollars)
For the years ended December 31 2017 2016 2015 Gold
Direct mining costs $3,063 $3,215 $4,006 Depreciation 1,529 1,504 1,615 Royalty expense 206 224 235 Community relations 38 37 50 Cost of sales $4,836 $4,980 $5,906 Cost of sales (per oz) 1 794 798 859 Cash costs 2,3 526 546 596 All-in sustaining costs 2,3 750 730 831
Copper Cost of sales $399 $319 $814 Cost of sales (per lb) 1 1.77 1.41 1.65 C1 cash costs 2,3 1.66 1.49 1.73 All-in sustaining costs 2,3 $2.34 $2.05 $2.33
1 Cost of sales related to gold per ounce is calculated using cost of sales related togold on an attributable basis (removing the non-controlling interest of 40%Pueblo Viejo and 36.1% Acacia from cost of sales), divided by attributable goldounces. Cost of sales related to copper per pound is calculated using cost ofsales related to copper including our proportionate share of cost of salesattributable to equity method investments (Zaldívar and Jabal Sayid), divided byconsolidated copper pounds (including our proportionate share of copper poundsfrom our equity method investments).
2 Per ounce/pound weighted average.
3 Cash costs, all-in sustaining costs and C1 cash costs are non-GAAP financialperformance measures with no standardized meaning under IFRS and thereforemay not be comparable to similar measures of performance presented by otherissuers. For further information and a detailed reconciliation of each non-GAAPmeasure used in this section of the MD&A to the most directly comparable IFRSmeasure, please see pages 69 to 84 of this MD&A.
In 2017, cost of sales applicable to gold was 3% lower than the prior yearprimarily due to lower sales volume, which has contributed to a decreasein direct mining costs and royalty expense. This was partially offset by anincrease in depreciation expense, as discussed below. On a per ouncebasis, cost of sales applicable to gold 4 after removing the portion relatedto non-controlling interests, was 1% lower than the prior year primarily dueto a decrease in direct mining costs combined with a positive change inour sales mix with lower relative sales volume from our higher cost Acaciamines. Direct mining costs expense also decreased as a result of highercapitalized waste stripping activity at Barrick Nevada and Veladero
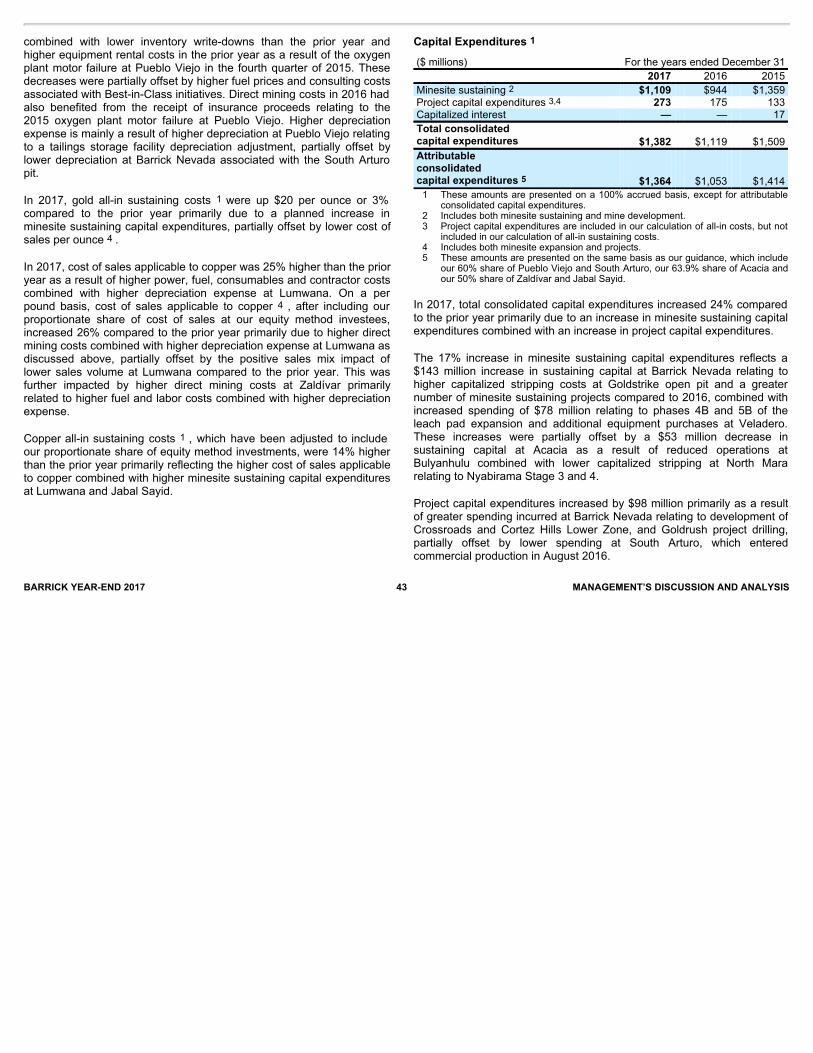
BARRICK YEAR-END 2017 43 MANAGEMENT’S DISCUSSION AND ANALYSIS
combined with lower inventory write-downs than the prior year andhigher equipment rental costs in the prior year as a result of the oxygenplant motor failure at Pueblo Viejo in the fourth quarter of 2015. Thesedecreases were partially offset by higher fuel prices and consulting costsassociated with Best-in-Class initiatives. Direct mining costs in 2016 hadalso benefited from the receipt of insurance proceeds relating to the2015 oxygen plant motor failure at Pueblo Viejo. Higher depreciationexpense is mainly a result of higher depreciation at Pueblo Viejo relatingto a tailings storage facility depreciation adjustment, partially offset bylower depreciation at Barrick Nevada associated with the South Arturopit.
In 2017, gold all-in sustaining costs 1 were up $20 per ounce or 3%compared to the prior year primarily due to a planned increase inminesite sustaining capital expenditures, partially offset by lower cost ofsales per ounce 4 .
In 2017, cost of sales applicable to copper was 25% higher than the prioryear as a result of higher power, fuel, consumables and contractor costscombined with higher depreciation expense at Lumwana. On a perpound basis, cost of sales applicable to copper 4 , after including ourproportionate share of cost of sales at our equity method investees,increased 26% compared to the prior year primarily due to higher directmining costs combined with higher depreciation expense at Lumwana asdiscussed above, partially offset by the positive sales mix impact oflower sales volume at Lumwana compared to the prior year. This wasfurther impacted by higher direct mining costs at Zaldívar primarilyrelated to higher fuel and labor costs combined with higher depreciationexpense.
Copper all-in sustaining costs 1 , which have been adjusted to includeour proportionate share of equity method investments, were 14% higherthan the prior year primarily reflecting the higher cost of sales applicableto copper combined with higher minesite sustaining capital expendituresat Lumwana and Jabal Sayid.
Capital Expenditures 1 ($ millions) For the years ended December 31 2017 2016 2015 Minesite sustaining 2 $1,109 $944 $1,359 Project capital expenditures 3,4 273 175 133 Capitalized interest — — 17 Total consolidated capital expenditures $1,382 $1,119 $1,509 Attributable consolidated capital expenditures 5 $1,364 $1,053 $1,414
1 These amounts are presented on a 100% accrued basis, except for attributableconsolidated capital expenditures.
2 Includes both minesite sustaining and mine development. 3 Project capital expenditures are included in our calculation of all-in costs, but not
included in our calculation of all-in sustaining costs. 4 Includes both minesite expansion and projects.
5 These amounts are presented on the same basis as our guidance, which include
our 60% share of Pueblo Viejo and South Arturo, our 63.9% share of Acacia andour 50% share of Zaldívar and Jabal Sayid.
In 2017, total consolidated capital expenditures increased 24% comparedto the prior year primarily due to an increase in minesite sustaining capitalexpenditures combined with an increase in project capital expenditures.
The 17% increase in minesite sustaining capital expenditures reflects a$143 million increase in sustaining capital at Barrick Nevada relating tohigher capitalized stripping costs at Goldstrike open pit and a greaternumber of minesite sustaining projects compared to 2016, combined withincreased spending of $78 million relating to phases 4B and 5B of theleach pad expansion and additional equipment purchases at Veladero.These increases were partially offset by a $53 million decrease insustaining capital at Acacia as a result of reduced operations atBulyanhulu combined with lower capitalized stripping at North Mararelating to Nyabirama Stage 3 and 4.
Project capital expenditures increased by $98 million primarily as a resultof greater spending incurred at Barrick Nevada relating to development ofCrossroads and Cortez Hills Lower Zone, and Goldrush project drilling,partially offset by lower spending at South Arturo, which enteredcommercial production in August 2016.
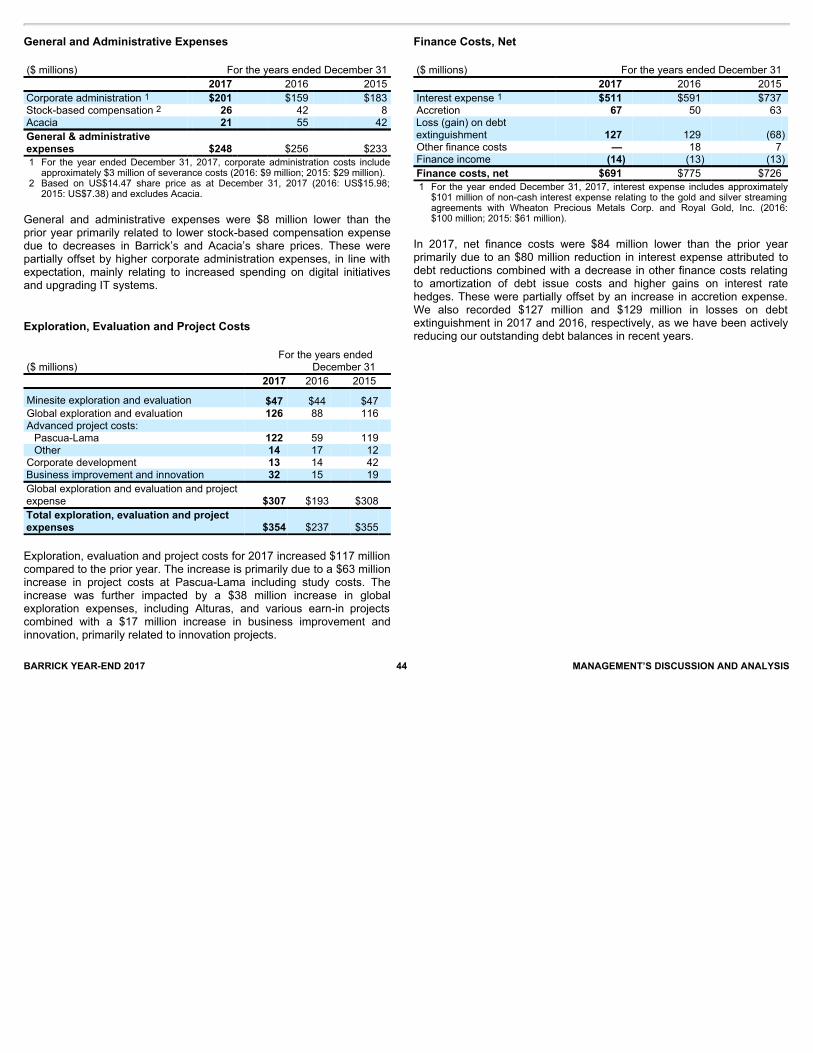
BARRICK YEAR-END 2017 44 MANAGEMENT’S DISCUSSION AND ANALYSIS
General and Administrative Expenses ($ millions) For the years ended December 31 2017 2016 2015 Corporate administration 1 $201 $159 $183 Stock-based compensation 2 26 42 8 Acacia 21 55 42 General & administrativeexpenses $248 $256 $233
1 For the year ended December 31, 2017, corporate administration costs includeapproximately $3 million of severance costs (2016: $9 million; 2015: $29 million).
2 Based on US$14.47 share price as at December 31, 2017 (2016: US$15.98;2015: US$7.38) and excludes Acacia.
General and administrative expenses were $8 million lower than theprior year primarily related to lower stock-based compensation expensedue to decreases in Barrick’s and Acacia’s share prices. These werepartially offset by higher corporate administration expenses, in line withexpectation, mainly relating to increased spending on digital initiativesand upgrading IT systems.
Exploration, Evaluation and Project Costs
($ millions) For the years ended
December 31 2017 2016 2015
Minesite exploration and evaluation $47 $44 $47 Global exploration and evaluation 126 88 116 Advanced project costs: Pascua-Lama 122 59 119 Other 14 17 12
Corporate development 13 14 42 Business improvement and innovation 32 15 19 Global exploration and evaluation and projectexpense $307 $193 $308 Total exploration, evaluation and projectexpenses $354 $237 $355
Exploration, evaluation and project costs for 2017 increased $117 millioncompared to the prior year. The increase is primarily due to a $63 millionincrease in project costs at Pascua-Lama including study costs. Theincrease was further impacted by a $38 million increase in globalexploration expenses, including Alturas, and various earn-in projectscombined with a $17 million increase in business improvement andinnovation, primarily related to innovation projects.
Finance Costs, Net ($ millions) For the years ended December 31 2017 2016 2015 Interest expense 1 $511 $591 $737 Accretion 67 50 63 Loss (gain) on debtextinguishment 127 129 (68) Other finance costs — 18 7 Finance income (14) (13) (13) Finance costs, net $691 $775 $726
1 For the year ended December 31, 2017, interest expense includes approximately
$101 million of non-cash interest expense relating to the gold and silver streamingagreements with Wheaton Precious Metals Corp. and Royal Gold, Inc. (2016:$100 million; 2015: $61 million).
In 2017, net finance costs were $84 million lower than the prior yearprimarily due to an $80 million reduction in interest expense attributed todebt reductions combined with a decrease in other finance costs relatingto amortization of debt issue costs and higher gains on interest ratehedges. These were partially offset by an increase in accretion expense.We also recorded $127 million and $129 million in losses on debtextinguishment in 2017 and 2016, respectively, as we have been activelyreducing our outstanding debt balances in recent years.

BARRICK YEAR-END 2017 45 MANAGEMENT’S DISCUSSION AND ANALYSIS
Additional Significant Statement of Income Items ($ millions) For the years ended December 31 2017 2016 2015 Impairment charges(reversals) ($212) ($250) $3,897 Loss (income) oncurrency translation $72 $ 199 $120 Other expense/(income)
($799
)
$60
($113
)
ImpairmentCharges(Reversals)
($ millions) For the years ended December 31
2017
2016
2015
Post-tax
(ourshare)
Post-tax(our
share)
Post-tax (our
share) Asset impairments (reversals) Cerro Casale $ (518) $ — $ — Bulyanhulu 350 — — Lumwana (259) — — Pascua-Lama 407 1 399 Lagunas Norte 2 (20) 26 Golden Sunlight 2 — — Veladero — (179) — Equity methodinvestments — 49 —
Pueblo Viejo — — 386 Buzwagi — — 30 Round Mountain/BaldMountain — — 53 Exploration sites 8 — — Other 1 3 53
Total asset impairmentcharges (reversals) $ (7) $ (146) $ 947 Goodwill Goldstrike $ — $ — $730 Zaldívar — — 427 Pueblo Viejo — — 412 Cortez — — 355 Lagunas Norte — — 247
Total goodwill impairmentcharges $ — $ — $ 2,171 Tax effects and NCI (205) (104) 779 Total impairment charges(reversals) (100%) $ (212) $ (250) $ 3,897
In 2017, we recognized $7 million (net of tax and non-controllinginterests) of net impairment reversals for non-current assets. This wasprimarily as a result of impairment reversals at the Cerro Casale projectupon reclassification of the project’s net assets as held-for-sale as atMarch 31, 2017, combined with impairment reversals at Lumwana due toan increase in reserves. These were partially offset by an impairmenttaken at Acacia’s Bulyanhulu mine related to the continued challengesexperienced in the operating environment in Tanzania and netimpairments taken at Pascua-Lama, mainly attributable to the
reclassification of open-pit reserves to resources after receiving a closureorder from the Chilean regulators. This compares to non-current assetimpairment reversals of $146 million (net of tax and non-controllinginterests) in the prior year primarily relating to net impairment reversals atVeladero and Lagunas Norte as a result of improvements in the coststructure, partially offset by a $49 million write-down of our equity methodinvestment in Zaldívar due to the final purchase price adjustments. Referto note 21 to the Financial Statements for a full description of impairmentcharges, including pre-tax amounts and sensitivity analysis.
Loss(Income)onCurrencyTranslationLoss on currency translation for 2017 decreased $127 million compared tothe prior year primarily due to $81 million of currency translation lossesrecognized during the first quarter of 2016 as a result of the disposal andreorganization of certain Australian entities. This was further impacted bylower unrealized foreign currency translation losses relating to theArgentinean peso, which did not depreciate as quickly in the current year.
OtherExpense(Income)Other income was $799 million in 2017 compared to an expense of$60 million in the prior year. The increase primarily relates to 2017 gainsof $718 million connected to the sale of a 50% interest in the Veladeromine and $193 million on the gain related to the sale of a 25% interest inthe Cerro Casale project. This was partially offset by an increase atAcacia relating to Bulyanhulu reduced operations program costscombined with higher litigation expense. This compares to a $42 millionloss, primarily relating to Zaldívar, as a result of the final purchase priceadjustments recorded in 2016. For a further breakdown of other expense(income), refer to note 9 to the Financial Statements.
IncomeTaxExpenseIncome tax expense was $1,231 million in 2017. The underlying effectivetax rate for ordinary income in 2017 was 44% after adjusting for the netimpact of foreign currency translation losses on deferred tax balances; theimpact of impairment (reversals) charges; the impact of debtextinguishment costs; the impact of asset sales and non-hedgederivatives; the impact of non-deductible foreign exchange losses; theimpact of United States tax reform; the impact of the proposed frameworkfor Acacia operations; and the impact of US withholding taxes. Theunadjusted tax rate for income in 2017 was 45% of the income beforeincome taxes.
We record deferred tax charges or credits if changes in facts orcircumstances affect the estimated tax basis of assets and therefore theamount of deferred tax assets or liabilities to reflect changing expectationsin our ability to realize deferred tax assets. The interpretation of taxregulations and legislation and their application to our business is complexand subject to change. We have
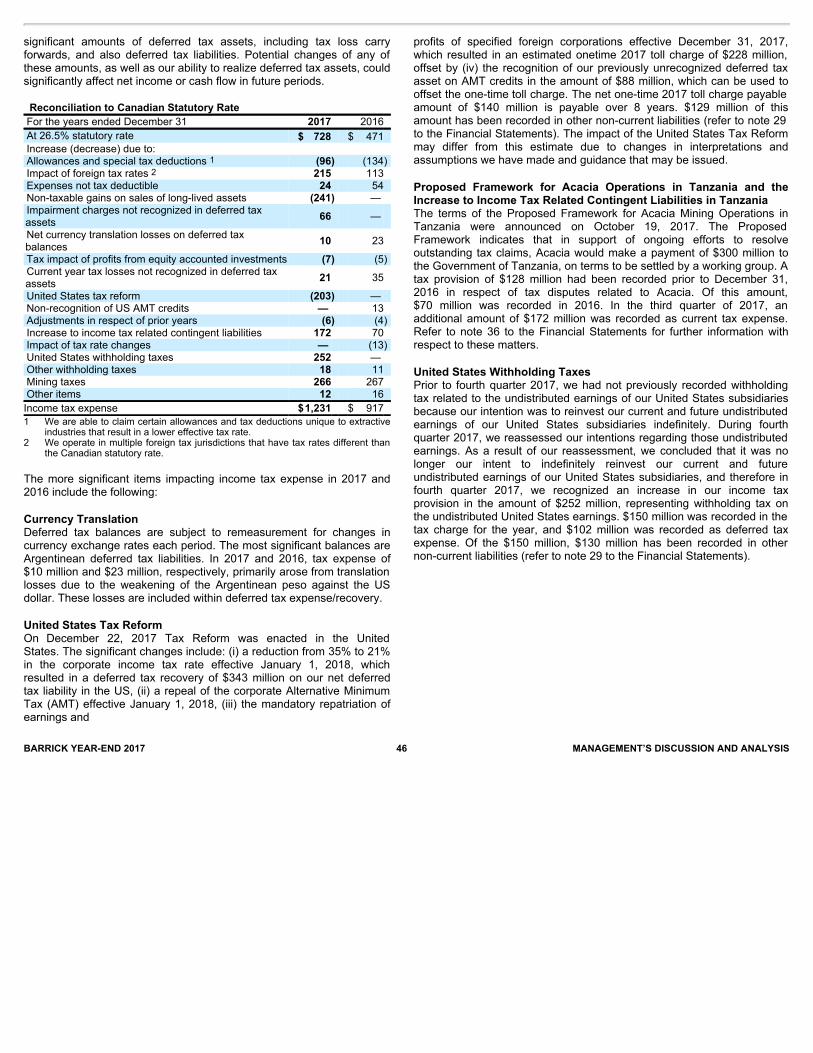
BARRICK YEAR-END 2017 46 MANAGEMENT’S DISCUSSION AND ANALYSIS
significant amounts of deferred tax assets, including tax loss carryforwards, and also deferred tax liabilities. Potential changes of any ofthese amounts, as well as our ability to realize deferred tax assets, couldsignificantly affect net income or cash flow in future periods. Reconciliation to Canadian Statutory Rate For the years ended December 31 2017 2016 At 26.5% statutory rate $ 728 $ 471 Increase (decrease) due to: Allowances and special tax deductions 1 (96) (134) Impact of foreign tax rates 2 215 113 Expenses not tax deductible 24 54 Non-taxable gains on sales of long-lived assets (241) — Impairment charges not recognized in deferred taxassets 66 —
Net currency translation losses on deferred taxbalances 10 23
Tax impact of profits from equity accounted investments (7) (5) Current year tax losses not recognized in deferred taxassets 21 35
United States tax reform (203) — Non-recognition of US AMT credits — 13 Adjustments in respect of prior years (6) (4) Increase to income tax related contingent liabilities 172 70 Impact of tax rate changes — (13) United States withholding taxes 252 — Other withholding taxes 18 11 Mining taxes 266 267 Other items 12 16 Income tax expense $1,231 $ 917 1 We are able to claim certain allowances and tax deductions unique to extractive
industries that result in a lower effective tax rate.2 We operate in multiple foreign tax jurisdictions that have tax rates different than
the Canadian statutory rate.
The more significant items impacting income tax expense in 2017 and2016 include the following:
Currency TranslationDeferred tax balances are subject to remeasurement for changes incurrency exchange rates each period. The most significant balances areArgentinean deferred tax liabilities. In 2017 and 2016, tax expense of$10 million and $23 million, respectively, primarily arose from translationlosses due to the weakening of the Argentinean peso against the USdollar. These losses are included within deferred tax expense/recovery.
United States Tax ReformOn December 22, 2017 Tax Reform was enacted in the UnitedStates. The significant changes include: (i) a reduction from 35% to 21%in the corporate income tax rate effective January 1, 2018, whichresulted in a deferred tax recovery of $343 million on our net deferredtax liability in the US, (ii) a repeal of the corporate Alternative MinimumTax (AMT) effective January 1, 2018, (iii) the mandatory repatriation ofearnings and
profits of specified foreign corporations effective December 31, 2017,which resulted in an estimated onetime 2017 toll charge of $228 million,offset by (iv) the recognition of our previously unrecognized deferred taxasset on AMT credits in the amount of $88 million, which can be used tooffset the one-time toll charge. The net one-time 2017 toll charge payableamount of $140 million is payable over 8 years. $129 million of thisamount has been recorded in other non-current liabilities (refer to note 29to the Financial Statements). The impact of the United States Tax Reformmay differ from this estimate due to changes in interpretations andassumptions we have made and guidance that may be issued.
Proposed Framework for Acacia Operations in Tanzania and theIncrease to Income Tax Related Contingent Liabilities in TanzaniaThe terms of the Proposed Framework for Acacia Mining Operations inTanzania were announced on October 19, 2017. The ProposedFramework indicates that in support of ongoing efforts to resolveoutstanding tax claims, Acacia would make a payment of $300 million tothe Government of Tanzania, on terms to be settled by a working group. Atax provision of $128 million had been recorded prior to December 31,2016 in respect of tax disputes related to Acacia. Of this amount,$70 million was recorded in 2016. In the third quarter of 2017, anadditional amount of $172 million was recorded as current tax expense.Refer to note 36 to the Financial Statements for further information withrespect to these matters.
United States Withholding TaxesPrior to fourth quarter 2017, we had not previously recorded withholdingtax related to the undistributed earnings of our United States subsidiariesbecause our intention was to reinvest our current and future undistributedearnings of our United States subsidiaries indefinitely. During fourthquarter 2017, we reassessed our intentions regarding those undistributedearnings. As a result of our reassessment, we concluded that it was nolonger our intent to indefinitely reinvest our current and futureundistributed earnings of our United States subsidiaries, and therefore infourth quarter 2017, we recognized an increase in our income taxprovision in the amount of $252 million, representing withholding tax onthe undistributed United States earnings. $150 million was recorded in thetax charge for the year, and $102 million was recorded as deferred taxexpense. Of the $150 million, $130 million has been recorded in othernon-current liabilities (refer to note 29 to the Financial Statements).
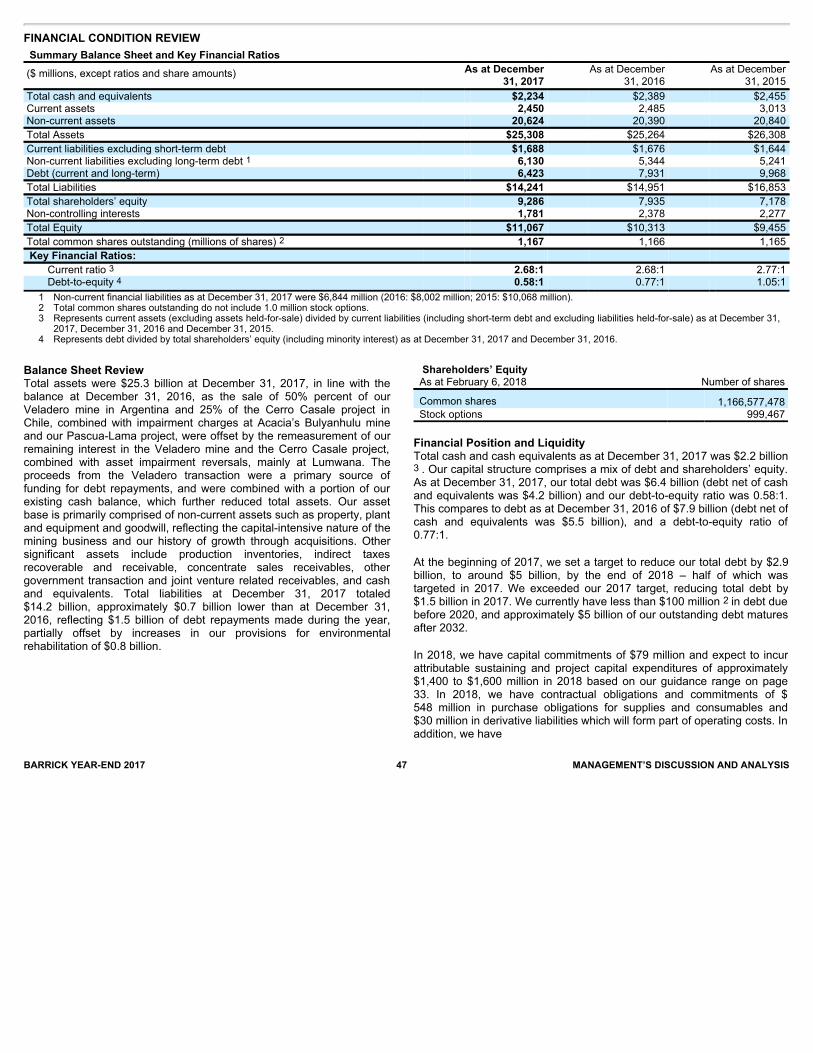
FINANCIAL CONDITION REVIEW
Summary Balance Sheet and Key Financial Ratios
($ millions, except ratios and share amounts)
As at December31, 2017
As at December31, 2016
As at December31, 2015
Total cash and equivalents $2,234 $2,389 $2,455 Current assets 2,450 2,485 3,013 Non-current assets 20,624 20,390 20,840 Total Assets $25,308 $25,264 $26,308 Current liabilities excluding short-term debt $1,688 $1,676 $1,644 Non-current liabilities excluding long-term debt 1 6,130 5,344 5,241 Debt (current and long-term) 6,423 7,931 9,968 Total Liabilities $14,241 $14,951 $16,853 Total shareholders’ equity 9,286 7,935 7,178 Non-controlling interests 1,781 2,378 2,277 Total Equity $11,067 $10,313 $9,455 Total common shares outstanding (millions of shares) 2 1,167 1,166 1,165 Key Financial Ratios:
Current ratio 3 2.68:1 2.68:1 2.77:1 Debt-to-equity 4
0.58:1
0.77:1
1.05:1
1 Non-current financial liabilities as at December 31, 2017 were $6,844 million (2016: $8,002 million; 2015: $10,068 million). 2 Total common shares outstanding do not include 1.0 million stock options. 3 Represents current assets (excluding assets held-for-sale) divided by current liabilities (including short-term debt and excluding liabilities held-for-sale) as at December 31,
2017, December 31, 2016 and December 31, 2015. 4 Represents debt divided by total shareholders’ equity (including minority interest) as at December 31, 2017 and December 31, 2016.
BARRICK YEAR-END 2017 47 MANAGEMENT’S DISCUSSION AND ANALYSIS
Balance Sheet ReviewTotal assets were $25.3 billion at December 31, 2017, in line with thebalance at December 31, 2016, as the sale of 50% percent of ourVeladero mine in Argentina and 25% of the Cerro Casale project inChile, combined with impairment charges at Acacia’s Bulyanhulu mineand our Pascua-Lama project, were offset by the remeasurement of ourremaining interest in the Veladero mine and the Cerro Casale project,combined with asset impairment reversals, mainly at Lumwana. Theproceeds from the Veladero transaction were a primary source offunding for debt repayments, and were combined with a portion of ourexisting cash balance, which further reduced total assets. Our assetbase is primarily comprised of non-current assets such as property, plantand equipment and goodwill, reflecting the capital-intensive nature of themining business and our history of growth through acquisitions. Othersignificant assets include production inventories, indirect taxesrecoverable and receivable, concentrate sales receivables, othergovernment transaction and joint venture related receivables, and cashand equivalents. Total liabilities at December 31, 2017 totaled$14.2 billion, approximately $0.7 billion lower than at December 31,2016, reflecting $1.5 billion of debt repayments made during the year,partially offset by increases in our provisions for environmentalrehabilitation of $0.8 billion.
Shareholders’ Equity As at February 6, 2018 Number of shares
Common shares 1,166,577,478 Stock options 999,467
Financial Position and LiquidityTotal cash and cash equivalents as at December 31, 2017 was $2.2 billion3 . Our capital structure comprises a mix of debt and shareholders’ equity.As at December 31, 2017, our total debt was $6.4 billion (debt net of cashand equivalents was $4.2 billion) and our debt-to-equity ratio was 0.58:1.This compares to debt as at December 31, 2016 of $7.9 billion (debt net ofcash and equivalents was $5.5 billion), and a debt-to-equity ratio of0.77:1.
At the beginning of 2017, we set a target to reduce our total debt by $2.9billion, to around $5 billion, by the end of 2018 – half of which wastargeted in 2017. We exceeded our 2017 target, reducing total debt by$1.5 billion in 2017. We currently have less than $100 million 2 in debt duebefore 2020, and approximately $5 billion of our outstanding debt maturesafter 2032.
In 2018, we have capital commitments of $79 million and expect to incurattributable sustaining and project capital expenditures of approximately$1,400 to $1,600 million in 2018 based on our guidance range on page33. In 2018, we have contractual obligations and commitments of $548 million in purchase obligations for supplies and consumables and$30 million in derivative liabilities which will form part of operating costs. Inaddition, we have

BARRICK YEAR-END 2017 48 MANAGEMENT’S DISCUSSION AND ANALYSIS
$362 million in interest payments and other amounts as detailed in thetable on page 66. We expect to fund these commitments throughoperating cash flow, which is our primary source of liquidity, as well asexisting cash balances.
Our operating cash flow is dependent on the ability of our operations todeliver projected future cash flows. The market prices of gold and, to alesser extent, copper are the primary drivers of our operating cash flow.Other options to enhance liquidity include further portfolio optimizationand the creation of new joint ventures and partnerships; issuance of debtor equity securities in the public markets or to private investors, whichcould be undertaken for liquidity enhancement and/or in connection withestablishing a strategic partnership; and drawing the $4.0 billionavailable under our undrawn credit facility (subject to compliance withcovenants and the making of certain representations and warranties, thisfacility is available for drawdown as a source of financing).
Many factors, including but not limited to general market conditions andthen prevailing metals prices, could impact our ability to issue securitieson acceptable terms, as could our credit ratings. Moody’s and S&Pcurrently rate our long-term debt as investment grade, with ratings ofBaa3 and BBB-, respectively. In August 2016, S&P affirmed theCompany’s BBB- rating and raised its outlook to positive from stable.Also in August 2016, Moody’s affirmed the Company’s Baa3 rating andrevised its outlook to stable from negative. In September 2017, Moody’sand S&P each released reports affirming their existing ratings andoutlooks. Further changes in our ratings could affect the trading prices ofour securities and our cost of capital. If we were to borrow under ourcredit facility, the applicable interest rate on the amounts borrowedwould be based, in part, on our credit ratings at the time. The keyfinancial covenant in our undrawn credit facility requires Barrick tomaintain a net debt to total capitalization ratio of less than 0.60:1.Barrick’s net debt to total capitalization ratio was 0.27:1 as atDecember 31, 2017 (0.35:1 as at December 31, 2016).
Summary of Cash Inflow (Outflow)
($ millions) For the years ended
December 31 2017 2016
Net cash provided by operating activities $2,065 $2,640 Investing activities Capital expenditures ($1,396) ($1,126) Divestitures 990 588 Other 69 126 Total investing inflows/(outflows) ($337) ($412) Financing activities Net change in debt 1 ($1,533) ($2,057) Dividends 2 (125) (86) Other (228) (154) Total financing inflows/(outflows) ($1,886) ($2,297) Effect of exchange rate 3 3 Increase/(decrease) in cash and equivalents ($155) ($66) 1 The difference between the net change in debt on a cash basis and the net
change on the balance sheet is due to changes in non-cash charges, specificallythe unwinding of discounts and amortization of debt issue costs.
2 In 2017 we declared and paid dividends in US dollars totaling $0.12 per share(2016: $0.08 per share; 2015: $0.14 per share).
In 2017, we generated $2,065 million in operating cash flow, compared to$2,640 million of operating cash flow in the prior year. The decrease of$575 million was due to lower gold sales as a result of the divestment of50% of the Veladero mine on June 30, 2017, lower gold sales volume atPueblo Viejo, Hemlo, Turquoise Ridge, Lagunas Norte and Acacia,partially offset by higher sales at Barrick Nevada attributed to highergrades and Best-in-Class initiatives positively impacting throughput. Thiswas further impacted by working capital outflows reflecting the buildup ofmetals inventory at Pueblo Viejo, Lagunas Norte and Acacia combinedwith an increase in exploration, evaluation and project expenses.Operating cash flow was also affected by lower cash flows attributed tonon-controlling interest, combined with higher cash taxes paid. Theseoutflows were partially offset by higher gold and copper prices as well aslower direct mining costs.
The ability of our operations to deliver projected future cash flows withinthe parameters of a reduced production profile, as well as future changesin gold and copper market prices, either favorable or unfavorable, willcontinue to have a material impact on our cash flow and liquidity.
Cash outflows from investing activities in 2017 amounted to $337 millioncompared to $412 million of cash inflows in the prior year. The decreaseof $75 million compared to 2016 is primarily due to $402 million ofadditional proceeds from the divestitures in the current year relating to$990 million from the divestiture of a 50% interest in Veladero in 2017compared to $588 million of proceeds
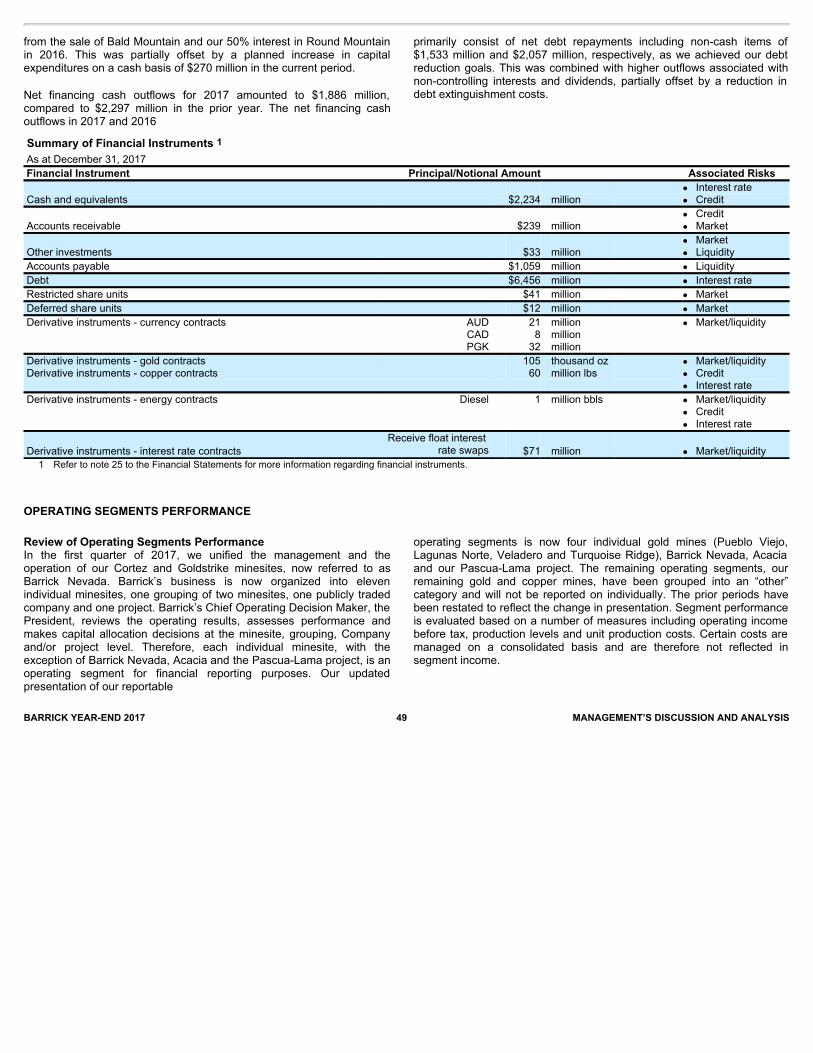
Summary of Financial Instruments 1 As at December 31, 2017 Financial Instrument Principal/Notional Amount Associated Risks
● Interest rate Cash and equivalents $2,234 million ● Credit
● Credit Accounts receivable $239 million ● Market
● Market Other investments $33 million ● Liquidity Accounts payable $1,059 million ● Liquidity Debt $6,456 million ● Interest rate Restricted share units $41 million ● Market Deferred share units $12 million ● Market Derivative instruments - currency contracts AUD 21 million ● Market/liquidity
CAD 8 million PGK 32 million Derivative instruments - gold contracts 105 thousand oz ● Market/liquidity Derivative instruments - copper contracts 60 million lbs ● Credit ● Interest rate Derivative instruments - energy contracts Diesel 1 million bbls ● Market/liquidity
● Credit ● Interest rate
Derivative instruments - interest rate contracts Receive float interest
rate swaps $71 million ● Market/liquidity
1 Refer to note 25 to the Financial Statements for more information regarding financial instruments.
OPERATING SEGMENTS PERFORMANCE
BARRICK YEAR-END 2017 49 MANAGEMENT’S DISCUSSION AND ANALYSIS
from the sale of Bald Mountain and our 50% interest in Round Mountainin 2016. This was partially offset by a planned increase in capitalexpenditures on a cash basis of $270 million in the current period.
Net financing cash outflows for 2017 amounted to $1,886 million,compared to $2,297 million in the prior year. The net financing cashoutflows in 2017 and 2016
primarily consist of net debt repayments including non-cash items of$1,533 million and $2,057 million, respectively, as we achieved our debtreduction goals. This was combined with higher outflows associated withnon-controlling interests and dividends, partially offset by a reduction indebt extinguishment costs.
Review of Operating Segments PerformanceIn the first quarter of 2017, we unified the management and theoperation of our Cortez and Goldstrike minesites, now referred to asBarrick Nevada. Barrick’s business is now organized into elevenindividual minesites, one grouping of two minesites, one publicly tradedcompany and one project. Barrick’s Chief Operating Decision Maker, thePresident, reviews the operating results, assesses performance andmakes capital allocation decisions at the minesite, grouping, Companyand/or project level. Therefore, each individual minesite, with theexception of Barrick Nevada, Acacia and the Pascua-Lama project, is anoperating segment for financial reporting purposes. Our updatedpresentation of our reportable
operating segments is now four individual gold mines (Pueblo Viejo,Lagunas Norte, Veladero and Turquoise Ridge), Barrick Nevada, Acaciaand our Pascua-Lama project. The remaining operating segments, ourremaining gold and copper mines, have been grouped into an “other”category and will not be reported on individually. The prior periods havebeen restated to reflect the change in presentation. Segment performanceis evaluated based on a number of measures including operating incomebefore tax, production levels and unit production costs. Certain costs aremanaged on a consolidated basis and are therefore not reflected insegment income.
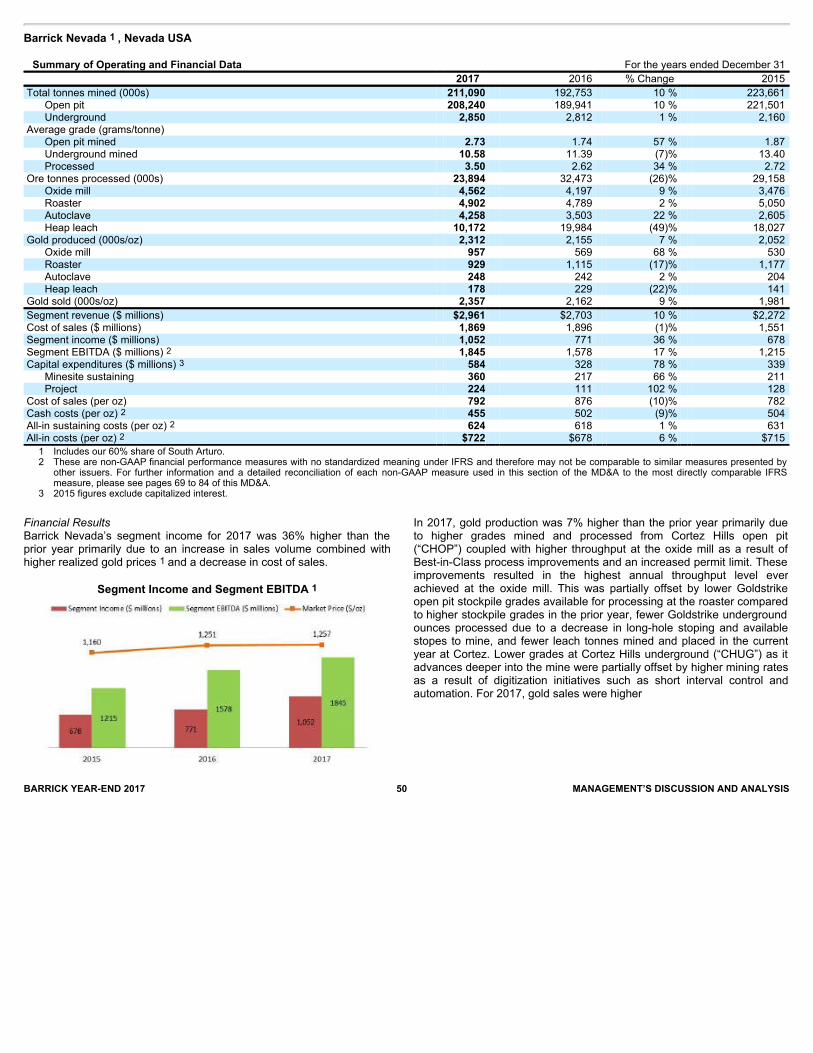
Barrick Nevada 1 , Nevada USA Summary of Operating and Financial Data For the years ended December 31 2017 2016 % Change 2015 Total tonnes mined (000s) 211,090 192,753 10 % 223,661
Open pit 208,240 189,941 10 % 221,501 Underground 2,850 2,812 1 % 2,160
Average grade (grams/tonne) Open pit mined 2.73 1.74 57 % 1.87 Underground mined 10.58 11.39 (7)% 13.40 Processed 3.50 2.62 34 % 2.72
Ore tonnes processed (000s) 23,894 32,473 (26)% 29,158 Oxide mill 4,562 4,197 9 % 3,476 Roaster 4,902 4,789 2 % 5,050 Autoclave 4,258 3,503 22 % 2,605 Heap leach 10,172 19,984 (49)% 18,027
Gold produced (000s/oz) 2,312 2,155 7 % 2,052 Oxide mill 957 569 68 % 530 Roaster 929 1,115 (17)% 1,177 Autoclave 248 242 2 % 204 Heap leach 178 229 (22)% 141
Gold sold (000s/oz) 2,357 2,162 9 % 1,981 Segment revenue ($ millions) $2,961 $2,703 10 % $2,272 Cost of sales ($ millions) 1,869 1,896 (1)% 1,551 Segment income ($ millions) 1,052 771 36 % 678 Segment EBITDA ($ millions) 2 1,845 1,578 17 % 1,215 Capital expenditures ($ millions) 3 584 328 78 % 339
Minesite sustaining 360 217 66 % 211 Project 224 111 102 % 128
Cost of sales (per oz) 792 876 (10)% 782 Cash costs (per oz) 2 455 502 (9)% 504 All-in sustaining costs (per oz) 2 624 618 1 % 631 All-in costs (per oz) 2 $722 $678 6 % $715 1 Includes our 60% share of South Arturo.
2 These are non-GAAP financial performance measures with no standardized meaning under IFRS and therefore may not be comparable to similar measures presented by
other issuers. For further information and a detailed reconciliation of each non-GAAP measure used in this section of the MD&A to the most directly comparable IFRSmeasure, please see pages 69 to 84 of this MD&A.
3 2015 figures exclude capitalized interest.
BARRICK YEAR-END 2017 50 MANAGEMENT’S DISCUSSION AND ANALYSIS
Financial ResultsBarrick Nevada’s segment income for 2017 was 36% higher than theprior year primarily due to an increase in sales volume combined withhigher realized gold prices 1 and a decrease in cost of sales.
Segment Income and Segment EBITDA 1
In 2017, gold production was 7% higher than the prior year primarily dueto higher grades mined and processed from Cortez Hills open pit(“CHOP”) coupled with higher throughput at the oxide mill as a result ofBest-in-Class process improvements and an increased permit limit. Theseimprovements resulted in the highest annual throughput level everachieved at the oxide mill. This was partially offset by lower Goldstrikeopen pit stockpile grades available for processing at the roaster comparedto higher stockpile grades in the prior year, fewer Goldstrike undergroundounces processed due to a decrease in long-hole stoping and availablestopes to mine, and fewer leach tonnes mined and placed in the currentyear at Cortez. Lower grades at Cortez Hills underground (“CHUG”) as itadvances deeper into the mine were partially offset by higher mining ratesas a result of digitization initiatives such as short interval control andautomation. For 2017, gold sales were higher

BARRICK YEAR-END 2017 51 MANAGEMENT’S DISCUSSION AND ANALYSIS
than production due to a drawdown of work in process inventory in thecurrent year as a result of Best-in-Class process improvements.
Production(000s ounces)
Cost of sales per ounce 4 for 2017 was $84 per ounce lower than theprior year primarily due to the impact of higher sales volume on unitproduction costs combined with higher capitalized waste strippingactivity at Crossroads and lower depreciation associated with SouthArturo as mining ended in July 2017 and which had a high depreciationper ounce impact due to the short mine life. These decreases in cost ofsales per ounce 4 were partially offset by lower grades mined andprocessed from CHUG, Goldstrike underground and Goldstrike open pit,as well as higher autoclave production in the current year, which is thehighest cost per tonne processing facility for Barrick Nevada. This wasfurther impacted by inventory write-downs in the prior year which werenot experienced in the current year.
All-in sustaining costs 1 increased by $6 per ounce from the prior yearprimarily due to higher minesite sustaining capital expenditures, partiallyoffset by lower direct mining costs combined with a higher sales volume.Lower direct mining costs were mainly due to higher capitalized wastestripping at Crossroads, which is classified as project capitalexpenditures.
Cost of Sales, Cash Costs 1 and AISC 1($ per ounce)
In 2017, capital expenditures increased by 78% from the prior year dueto higher minesite sustaining capital combined with higher projectexpenditures. Higher minesite sustaining capital is attributed to highercapitalized stripping relating to the 3rd and 4th northwest laybacks at theGoldstrike open pit; underground cooling and ventilation project to allowmining below 3,600 feet at the Goldstrike underground; tailingsexpansions; the
autoclave thiosulfate water treatment plant conversion which significantlyimproved water balances and the consumption of fresh reagent; theroaster oxygen plant upgrade to increase plant availability; and digitizationinitiatives to enhance productivity and efficiency. Investment in digitizationinitiatives resulted in a significant increase in mining rates at CHUG andincreased oxide mill performance. Project capital expenditures in 2017increased compared to the prior year as a result of capitalized strippingand dewatering at Crossroads combined with underground developmentat Cortez Hills Lower Zone, the range front declines, and Goldrush projectdrilling. These were partially offset by a decrease in pre-productionstripping at the South Arturo pit, which entered commercial production inAugust 2016.
OutlookAt Barrick Nevada we expect gold production to be in the range of 2,000to 2,255 thousand ounces, which is lower than 2017 production levels.Lower production is expected at CHOP and CHUG. At Cortez Hills openpit, mining will transition from purely oxide ore to a mix of oxide, refractory,and transitional ores. Grade mined from Cortez Hills underground isexpected to be lower as we progress deeper in the mine. This is partiallyoffset by increased throughput at the oxide mill, increased grades atGoldstrike open pit from processing the 3rd northwest layback comparedto stockpile processing in the prior year, and higher grades at Goldstrikeunderground. Throughput initiatives at the autoclave are expected to morethan offset lower autoclave recovery as we transition primarily from an allacid blend to an alkaline/acid blend.
In 2018, we expect cost of sales per ounce 4 to remain in the range of$760 to $810 per ounce as lower production is offset by lower CHOPdepreciation. We expect cash costs 1 to be in the range of $470 to $530,which is higher than 2017 due to lower ounces sold. CHUG is expected toexceed its increased mining rates achieved in the fourth quarter of 2017driven by digital initiatives such as short interval control and automation,and continued transition to bulk mining, which is significantly lowering itsoverall expected cost per tonne in 2018. This is offset by an increase inGoldstrike open pit’s expected cost per tonne as we mine ore at thebottom of the pit and continue to strip the 4th northwest layback,increased CHOP dewatering costs, and major roaster maintenanceplanned mid-2018. All-in sustaining costs 1 are expected to remain in therange of $610 to $660 per ounce as lower production is offset by lowersustaining capital expenditures for tailings expansions, processimprovements, and Goldstrike underground projects to enable miningdeeper in the mine.
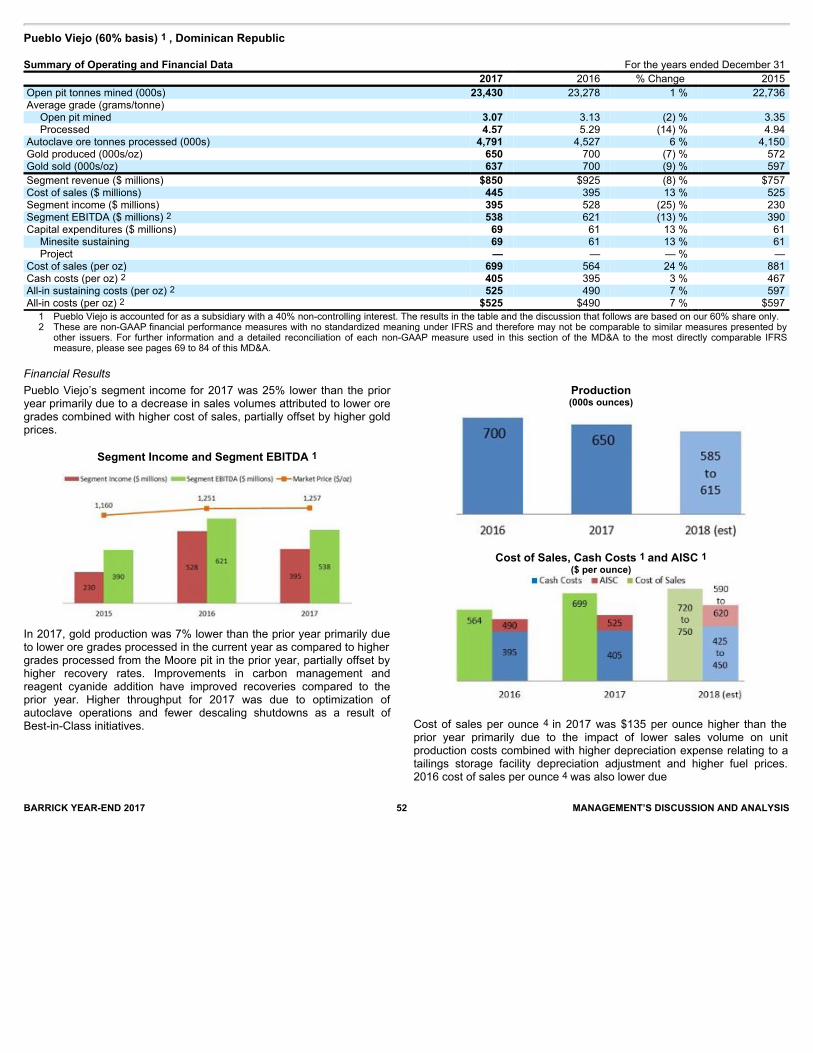
Pueblo Viejo (60% basis) 1 , Dominican RepublicSummary of Operating and Financial Data For the years ended December 31 2017 2016 % Change 2015 Open pit tonnes mined (000s) 23,430 23,278 1 % 22,736 Average grade (grams/tonne) Open pit mined 3.07 3.13 (2) % 3.35 Processed 4.57 5.29 (14) % 4.94
Autoclave ore tonnes processed (000s) 4,791 4,527 6 % 4,150 Gold produced (000s/oz) 650 700 (7) % 572 Gold sold (000s/oz) 637 700 (9) % 597 Segment revenue ($ millions) $850 $925 (8) % $757 Cost of sales ($ millions) 445 395 13 % 525 Segment income ($ millions) 395 528 (25) % 230 Segment EBITDA ($ millions) 2 538 621 (13) % 390 Capital expenditures ($ millions) 69 61 13 % 61 Minesite sustaining 69 61 13 % 61 Project — — — % —
Cost of sales (per oz) 699 564 24 % 881 Cash costs (per oz) 2 405 395 3 % 467 All-in sustaining costs (per oz) 2 525 490 7 % 597 All-in costs (per oz) 2 $525 $490 7 % $597 1 Pueblo Viejo is accounted for as a subsidiary with a 40% non-controlling interest. The results in the table and the discussion that follows are based on our 60% share only.
2 These are non-GAAP financial performance measures with no standardized meaning under IFRS and therefore may not be comparable to similar measures presented by
other issuers. For further information and a detailed reconciliation of each non-GAAP measure used in this section of the MD&A to the most directly comparable IFRSmeasure, please see pages 69 to 84 of this MD&A.
Financial Results
BARRICK YEAR-END 2017 52 MANAGEMENT’S DISCUSSION AND ANALYSIS
Pueblo Viejo’s segment income for 2017 was 25% lower than the prioryear primarily due to a decrease in sales volumes attributed to lower oregrades combined with higher cost of sales, partially offset by higher goldprices.
Segment Income and Segment EBITDA 1
In 2017, gold production was 7% lower than the prior year primarily dueto lower ore grades processed in the current year as compared to highergrades processed from the Moore pit in the prior year, partially offset byhigher recovery rates. Improvements in carbon management andreagent cyanide addition have improved recoveries compared to theprior year. Higher throughput for 2017 was due to optimization ofautoclave operations and fewer descaling shutdowns as a result ofBest-in-Class initiatives.
Production(000s ounces)
Cost of Sales, Cash Costs 1 and AISC 1($ per ounce)
Cost of sales per ounce 4 in 2017 was $135 per ounce higher than theprior year primarily due to the impact of lower sales volume on unitproduction costs combined with higher depreciation expense relating to atailings storage facility depreciation adjustment and higher fuel prices.2016 cost of sales per ounce 4 was also lower due
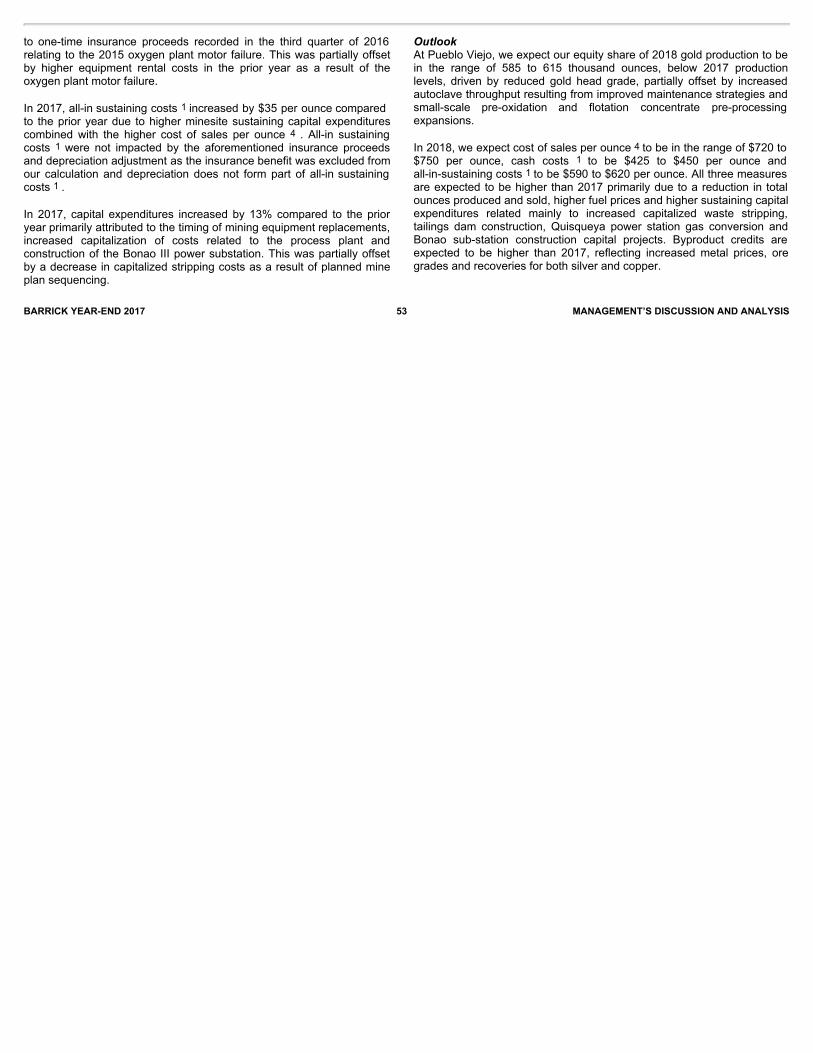
BARRICK YEAR-END 2017 53 MANAGEMENT’S DISCUSSION AND ANALYSIS
to one-time insurance proceeds recorded in the third quarter of 2016relating to the 2015 oxygen plant motor failure. This was partially offsetby higher equipment rental costs in the prior year as a result of theoxygen plant motor failure.
In 2017, all-in sustaining costs 1 increased by $35 per ounce comparedto the prior year due to higher minesite sustaining capital expenditurescombined with the higher cost of sales per ounce 4 . All-in sustainingcosts 1 were not impacted by the aforementioned insurance proceedsand depreciation adjustment as the insurance benefit was excluded fromour calculation and depreciation does not form part of all-in sustainingcosts 1 .
In 2017, capital expenditures increased by 13% compared to the prioryear primarily attributed to the timing of mining equipment replacements,increased capitalization of costs related to the process plant andconstruction of the Bonao III power substation. This was partially offsetby a decrease in capitalized stripping costs as a result of planned mineplan sequencing.
OutlookAt Pueblo Viejo, we expect our equity share of 2018 gold production to bein the range of 585 to 615 thousand ounces, below 2017 productionlevels, driven by reduced gold head grade, partially offset by increasedautoclave throughput resulting from improved maintenance strategies andsmall-scale pre-oxidation and flotation concentrate pre-processingexpansions.
In 2018, we expect cost of sales per ounce 4 to be in the range of $720 to$750 per ounce, cash costs 1 to be $425 to $450 per ounce andall-in-sustaining costs 1 to be $590 to $620 per ounce. All three measuresare expected to be higher than 2017 primarily due to a reduction in totalounces produced and sold, higher fuel prices and higher sustaining capitalexpenditures related mainly to increased capitalized waste stripping,tailings dam construction, Quisqueya power station gas conversion andBonao sub-station construction capital projects. Byproduct credits areexpected to be higher than 2017, reflecting increased metal prices, oregrades and recoveries for both silver and copper.

Lagunas Norte, Peru Summary of Operating and Financial Data For the years ended December 31 2017 2016 % Change 2015 Open pit tonnes mined (000s) 32,859 40,847 (20)% 49,126 Average grade (grams/tonne)
Open pit mined 1.41 1.18 19% 1.10 Processed 1.05 1.12 (6)% 1.02
Heap leach ore tonnes processed (000s) 17,874 17,253 4% 21,880 Gold produced (000s/oz) 387 435 (11)% 560 Gold sold (000s/oz) 397 425 (7)% 565 Segment revenue ($ millions) $514 $548 (6)% $673 Cost of sales ($ millions) 245 276 (11)% 378 Segment income ($ millions) 259 260 — % 285 Segment EBITDA ($ millions) 1 327 356 (8)% 454 Capital expenditures ($ millions) 25 56 (55)% 67
Minesite sustaining 20 51 (61)% 67 Project 5 5 — % —
Cost of sales (per oz) 617 651 (5)% 669 Cash costs (per oz) 1 405 383 6 % 329 All-in sustaining costs (per oz) 1 483 529 (9)% 509 All-in costs (per oz) 1 $497 $540 (8)% $509
1 These are non-GAAP financial performance measures with no standardized meaning under IFRS and therefore may not be comparable to similar measures presented by
other issuers. For further information and a detailed reconciliation of each non-GAAP measure used in this section of the MD&A to the most directly comparable IFRSmeasure, please see pages 69 to 84 of this MD&A.
Financial Results
BARRICK YEAR-END 2017 54 MANAGEMENT’S DISCUSSION AND ANALYSIS
Lagunas Norte’s segment income for 2017 was in line with the prior yearprimarily due to lower sales volumes, offset by higher realized goldprices 1 combined with lower depreciation expense.
Segment Income and Segment EBITDA 1
In 2017, gold production was 11% lower than the prior year as a result ofprocessing harder material with lower grades and slower recovery ratescombined with a higher percentage of older stock material, in line withexpectations as the mine matures. Productivity for 2017 was furtherimpacted by heavy rains causing road closures and power outages earlyin the year combined with lower efficiency with the loading and haulingequipment.
Production(000s ounces)
Cost of Sales, Cash Costs 1 and AISC 1($ per ounce)
Cost of sales per ounce 4 for 2017 was $34 per ounce lower than the prioryear mainly due to lower depreciation expense and realized cost savingsfrom the Best-in-Class program, such as initiatives to improve efficienciesin the carbon in column circuit, implementation of short interval control andimprovements in planned maintenance. These were partially offset by theimpact of lower sales
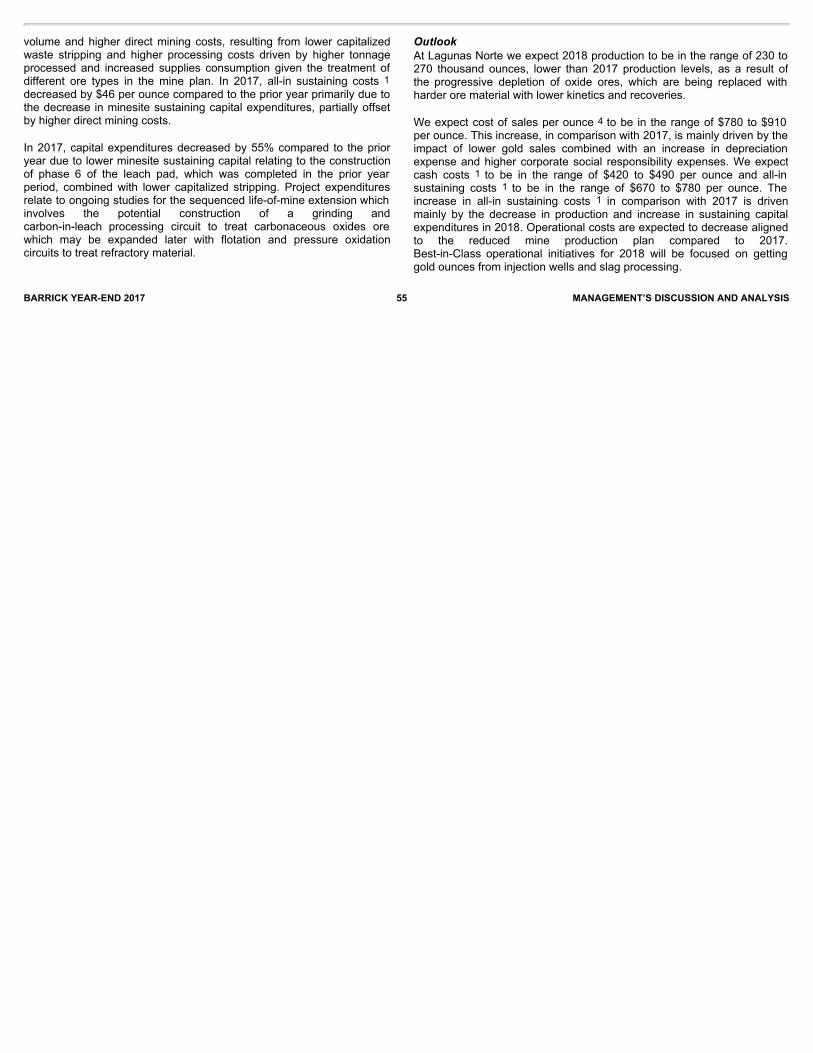
BARRICK YEAR-END 2017 55 MANAGEMENT’S DISCUSSION AND ANALYSIS
volume and higher direct mining costs, resulting from lower capitalizedwaste stripping and higher processing costs driven by higher tonnageprocessed and increased supplies consumption given the treatment ofdifferent ore types in the mine plan. In 2017, all-in sustaining costs 1decreased by $46 per ounce compared to the prior year primarily due tothe decrease in minesite sustaining capital expenditures, partially offsetby higher direct mining costs.
In 2017, capital expenditures decreased by 55% compared to the prioryear due to lower minesite sustaining capital relating to the constructionof phase 6 of the leach pad, which was completed in the prior yearperiod, combined with lower capitalized stripping. Project expendituresrelate to ongoing studies for the sequenced life-of-mine extension whichinvolves the potential construction of a grinding andcarbon-in-leach processing circuit to treat carbonaceous oxides orewhich may be expanded later with flotation and pressure oxidationcircuits to treat refractory material.
OutlookAt Lagunas Norte we expect 2018 production to be in the range of 230 to270 thousand ounces, lower than 2017 production levels, as a result ofthe progressive depletion of oxide ores, which are being replaced withharder ore material with lower kinetics and recoveries.
We expect cost of sales per ounce 4 to be in the range of $780 to $910per ounce. This increase, in comparison with 2017, is mainly driven by theimpact of lower gold sales combined with an increase in depreciationexpense and higher corporate social responsibility expenses. We expectcash costs 1 to be in the range of $420 to $490 per ounce and all-insustaining costs 1 to be in the range of $670 to $780 per ounce. Theincrease in all-in sustaining costs 1 in comparison with 2017 is drivenmainly by the decrease in production and increase in sustaining capitalexpenditures in 2018. Operational costs are expected to decrease alignedto the reduced mine production plan compared to 2017.Best-in-Class operational initiatives for 2018 will be focused on gettinggold ounces from injection wells and slag processing.
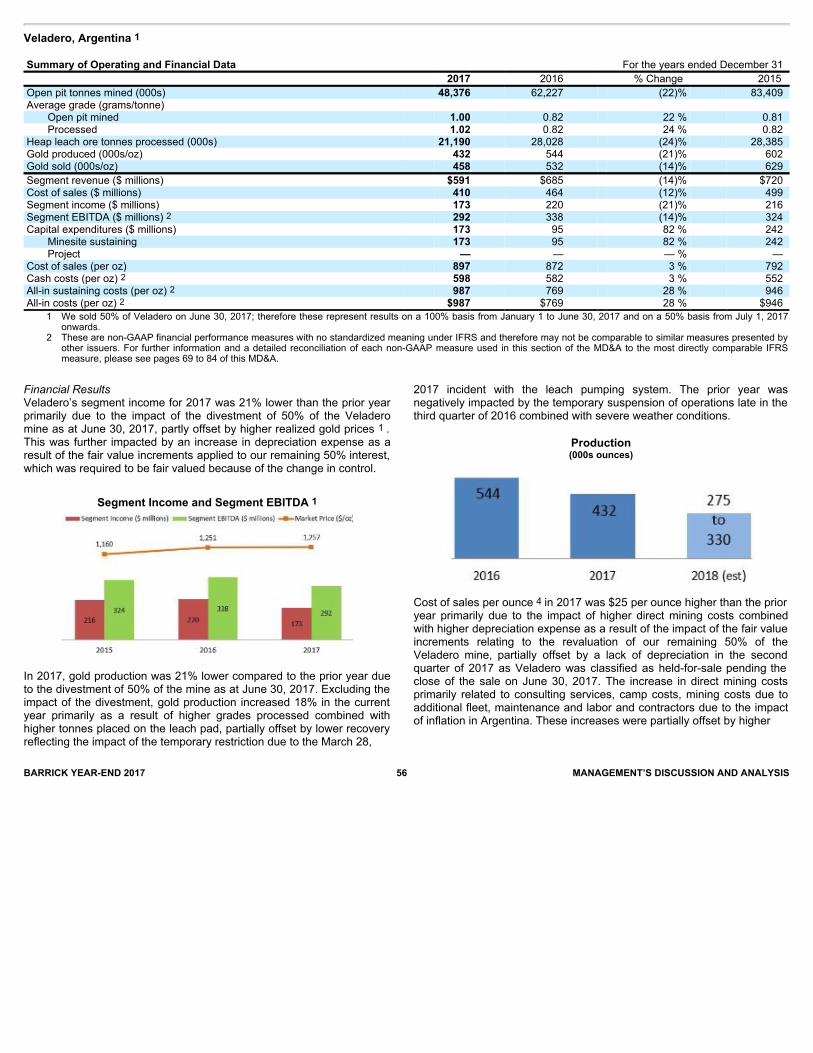
Veladero, Argentina 1 Summary of Operating and Financial Data For the years ended December 31 2017 2016 % Change 2015 Open pit tonnes mined (000s) 48,376 62,227 (22)% 83,409 Average grade (grams/tonne)
Open pit mined 1.00 0.82 22 % 0.81 Processed 1.02 0.82 24 % 0.82
Heap leach ore tonnes processed (000s) 21,190 28,028 (24)% 28,385 Gold produced (000s/oz) 432 544 (21)% 602 Gold sold (000s/oz) 458 532 (14)% 629 Segment revenue ($ millions) $591 $685 (14)% $720 Cost of sales ($ millions) 410 464 (12)% 499 Segment income ($ millions) 173 220 (21)% 216 Segment EBITDA ($ millions) 2 292 338 (14)% 324 Capital expenditures ($ millions) 173 95 82 % 242
Minesite sustaining 173 95 82 % 242 Project — — — % —
Cost of sales (per oz) 897 872 3 % 792 Cash costs (per oz) 2 598 582 3 % 552 All-in sustaining costs (per oz) 2 987 769 28 % 946 All-in costs (per oz) 2 $987 $769 28 % $946
1 We sold 50% of Veladero on June 30, 2017; therefore these represent results on a 100% basis from January 1 to June 30, 2017 and on a 50% basis from July 1, 2017onwards.
2 These are non-GAAP financial performance measures with no standardized meaning under IFRS and therefore may not be comparable to similar measures presented by
other issuers. For further information and a detailed reconciliation of each non-GAAP measure used in this section of the MD&A to the most directly comparable IFRSmeasure, please see pages 69 to 84 of this MD&A.
BARRICK YEAR-END 2017 56 MANAGEMENT’S DISCUSSION AND ANALYSIS
Financial ResultsVeladero’s segment income for 2017 was 21% lower than the prior yearprimarily due to the impact of the divestment of 50% of the Veladeromine as at June 30, 2017, partly offset by higher realized gold prices 1 .This was further impacted by an increase in depreciation expense as aresult of the fair value increments applied to our remaining 50% interest,which was required to be fair valued because of the change in control.
Segment Income and Segment EBITDA 1
In 2017, gold production was 21% lower compared to the prior year dueto the divestment of 50% of the mine as at June 30, 2017. Excluding theimpact of the divestment, gold production increased 18% in the currentyear primarily as a result of higher grades processed combined withhigher tonnes placed on the leach pad, partially offset by lower recoveryreflecting the impact of the temporary restriction due to the March 28,
2017 incident with the leach pumping system. The prior year wasnegatively impacted by the temporary suspension of operations late in thethird quarter of 2016 combined with severe weather conditions.
Production(000s ounces)
Cost of sales per ounce 4 in 2017 was $25 per ounce higher than the prioryear primarily due to the impact of higher direct mining costs combinedwith higher depreciation expense as a result of the impact of the fair valueincrements relating to the revaluation of our remaining 50% of theVeladero mine, partially offset by a lack of depreciation in the secondquarter of 2017 as Veladero was classified as held-for-sale pending theclose of the sale on June 30, 2017. The increase in direct mining costsprimarily related to consulting services, camp costs, mining costs due toadditional fleet, maintenance and labor and contractors due to the impactof inflation in Argentina. These increases were partially offset by higher
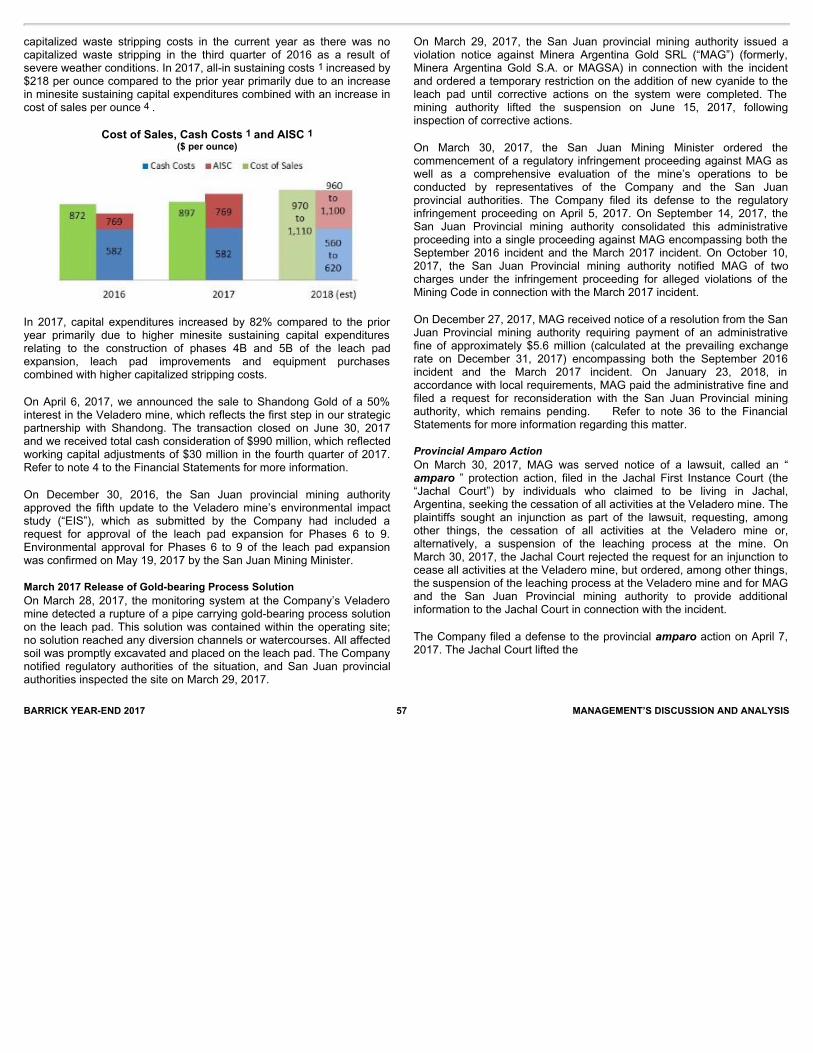
BARRICK YEAR-END 2017 57 MANAGEMENT’S DISCUSSION AND ANALYSIS
capitalized waste stripping costs in the current year as there was nocapitalized waste stripping in the third quarter of 2016 as a result ofsevere weather conditions. In 2017, all-in sustaining costs 1 increased by$218 per ounce compared to the prior year primarily due to an increasein minesite sustaining capital expenditures combined with an increase incost of sales per ounce 4 .
Cost of Sales, Cash Costs 1 and AISC 1($ per ounce)
In 2017, capital expenditures increased by 82% compared to the prioryear primarily due to higher minesite sustaining capital expendituresrelating to the construction of phases 4B and 5B of the leach padexpansion, leach pad improvements and equipment purchasescombined with higher capitalized stripping costs.
On April 6, 2017, we announced the sale to Shandong Gold of a 50%interest in the Veladero mine, which reflects the first step in our strategicpartnership with Shandong. The transaction closed on June 30, 2017and we received total cash consideration of $990 million, which reflectedworking capital adjustments of $30 million in the fourth quarter of 2017.Refer to note 4 to the Financial Statements for more information.
On December 30, 2016, the San Juan provincial mining authorityapproved the fifth update to the Veladero mine’s environmental impactstudy (“EIS”), which as submitted by the Company had included arequest for approval of the leach pad expansion for Phases 6 to 9.Environmental approval for Phases 6 to 9 of the leach pad expansionwas confirmed on May 19, 2017 by the San Juan Mining Minister.
March 2017 Release of Gold-bearing Process SolutionOn March 28, 2017, the monitoring system at the Company’s Veladeromine detected a rupture of a pipe carrying gold-bearing process solutionon the leach pad. This solution was contained within the operating site;no solution reached any diversion channels or watercourses. All affectedsoil was promptly excavated and placed on the leach pad. The Companynotified regulatory authorities of the situation, and San Juan provincialauthorities inspected the site on March 29, 2017.
On March 29, 2017, the San Juan provincial mining authority issued aviolation notice against Minera Argentina Gold SRL (“MAG”) (formerly,Minera Argentina Gold S.A. or MAGSA) in connection with the incidentand ordered a temporary restriction on the addition of new cyanide to theleach pad until corrective actions on the system were completed. Themining authority lifted the suspension on June 15, 2017, followinginspection of corrective actions.
On March 30, 2017, the San Juan Mining Minister ordered thecommencement of a regulatory infringement proceeding against MAG aswell as a comprehensive evaluation of the mine’s operations to beconducted by representatives of the Company and the San Juanprovincial authorities. The Company filed its defense to the regulatoryinfringement proceeding on April 5, 2017. On September 14, 2017, theSan Juan Provincial mining authority consolidated this administrativeproceeding into a single proceeding against MAG encompassing both theSeptember 2016 incident and the March 2017 incident. On October 10,2017, the San Juan Provincial mining authority notified MAG of twocharges under the infringement proceeding for alleged violations of theMining Code in connection with the March 2017 incident.
On December 27, 2017, MAG received notice of a resolution from the SanJuan Provincial mining authority requiring payment of an administrativefine of approximately $5.6 million (calculated at the prevailing exchangerate on December 31, 2017) encompassing both the September 2016incident and the March 2017 incident. On January 23, 2018, inaccordance with local requirements, MAG paid the administrative fine andfiled a request for reconsideration with the San Juan Provincial miningauthority, which remains pending. Refer to note 36 to the FinancialStatements for more information regarding this matter.
ProvincialAmparoActionOn March 30, 2017, MAG was served notice of a lawsuit, called an “amparo ” protection action, filed in the Jachal First Instance Court (the“Jachal Court”) by individuals who claimed to be living in Jachal,Argentina, seeking the cessation of all activities at the Veladero mine. Theplaintiffs sought an injunction as part of the lawsuit, requesting, amongother things, the cessation of all activities at the Veladero mine or,alternatively, a suspension of the leaching process at the mine. OnMarch 30, 2017, the Jachal Court rejected the request for an injunction tocease all activities at the Veladero mine, but ordered, among other things,the suspension of the leaching process at the Veladero mine and for MAGand the San Juan Provincial mining authority to provide additionalinformation to the Jachal Court in connection with the incident.
The Company filed a defense to the provincial amparoaction on April 7,2017. The Jachal Court lifted the
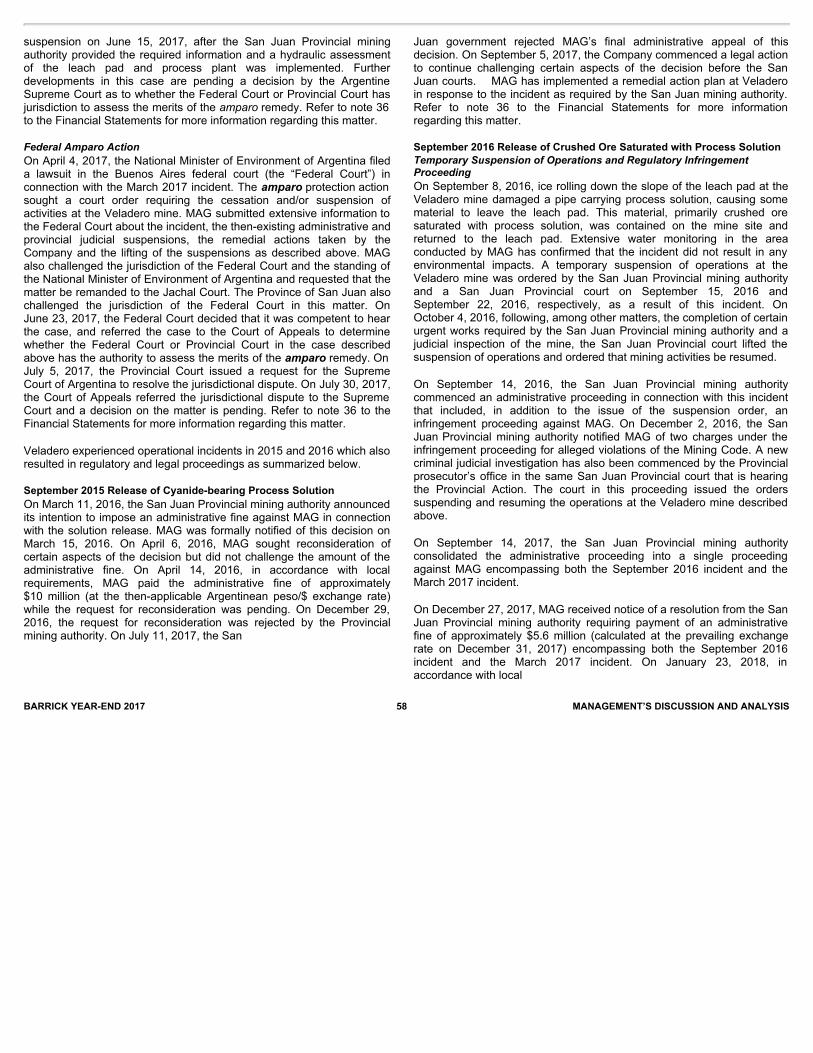
BARRICK YEAR-END 2017 58 MANAGEMENT’S DISCUSSION AND ANALYSIS
suspension on June 15, 2017, after the San Juan Provincial miningauthority provided the required information and a hydraulic assessmentof the leach pad and process plant was implemented. Furtherdevelopments in this case are pending a decision by the ArgentineSupreme Court as to whether the Federal Court or Provincial Court hasjurisdiction to assess the merits of the amparo remedy. Refer to note 36to the Financial Statements for more information regarding this matter.
FederalAmparoActionOn April 4, 2017, the National Minister of Environment of Argentina fileda lawsuit in the Buenos Aires federal court (the “Federal Court”) inconnection with the March 2017 incident. The amparoprotection actionsought a court order requiring the cessation and/or suspension ofactivities at the Veladero mine. MAG submitted extensive information tothe Federal Court about the incident, the then-existing administrative andprovincial judicial suspensions, the remedial actions taken by theCompany and the lifting of the suspensions as described above. MAGalso challenged the jurisdiction of the Federal Court and the standing ofthe National Minister of Environment of Argentina and requested that thematter be remanded to the Jachal Court. The Province of San Juan alsochallenged the jurisdiction of the Federal Court in this matter. OnJune 23, 2017, the Federal Court decided that it was competent to hearthe case, and referred the case to the Court of Appeals to determinewhether the Federal Court or Provincial Court in the case describedabove has the authority to assess the merits of the amparoremedy. OnJuly 5, 2017, the Provincial Court issued a request for the SupremeCourt of Argentina to resolve the jurisdictional dispute. On July 30, 2017,the Court of Appeals referred the jurisdictional dispute to the SupremeCourt and a decision on the matter is pending. Refer to note 36 to theFinancial Statements for more information regarding this matter.
Veladero experienced operational incidents in 2015 and 2016 which alsoresulted in regulatory and legal proceedings as summarized below.
September 2015 Release of Cyanide-bearing Process SolutionOn March 11, 2016, the San Juan Provincial mining authority announcedits intention to impose an administrative fine against MAG in connectionwith the solution release. MAG was formally notified of this decision onMarch 15, 2016. On April 6, 2016, MAG sought reconsideration ofcertain aspects of the decision but did not challenge the amount of theadministrative fine. On April 14, 2016, in accordance with localrequirements, MAG paid the administrative fine of approximately$10 million (at the then-applicable Argentinean peso/$ exchange rate)while the request for reconsideration was pending. On December 29,2016, the request for reconsideration was rejected by the Provincialmining authority. On July 11, 2017, the San
Juan government rejected MAG’s final administrative appeal of thisdecision. On September 5, 2017, the Company commenced a legal actionto continue challenging certain aspects of the decision before the SanJuan courts. MAG has implemented a remedial action plan at Veladeroin response to the incident as required by the San Juan mining authority.Refer to note 36 to the Financial Statements for more informationregarding this matter.
September 2016 Release of Crushed Ore Saturated with Process SolutionTemporarySuspensionofOperationsandRegulatoryInfringementProceedingOn September 8, 2016, ice rolling down the slope of the leach pad at theVeladero mine damaged a pipe carrying process solution, causing somematerial to leave the leach pad. This material, primarily crushed oresaturated with process solution, was contained on the mine site andreturned to the leach pad. Extensive water monitoring in the areaconducted by MAG has confirmed that the incident did not result in anyenvironmental impacts. A temporary suspension of operations at theVeladero mine was ordered by the San Juan Provincial mining authorityand a San Juan Provincial court on September 15, 2016 andSeptember 22, 2016, respectively, as a result of this incident. OnOctober 4, 2016, following, among other matters, the completion of certainurgent works required by the San Juan Provincial mining authority and ajudicial inspection of the mine, the San Juan Provincial court lifted thesuspension of operations and ordered that mining activities be resumed.
On September 14, 2016, the San Juan Provincial mining authoritycommenced an administrative proceeding in connection with this incidentthat included, in addition to the issue of the suspension order, aninfringement proceeding against MAG. On December 2, 2016, the SanJuan Provincial mining authority notified MAG of two charges under theinfringement proceeding for alleged violations of the Mining Code. A newcriminal judicial investigation has also been commenced by the Provincialprosecutor’s office in the same San Juan Provincial court that is hearingthe Provincial Action. The court in this proceeding issued the orderssuspending and resuming the operations at the Veladero mine describedabove.
On September 14, 2017, the San Juan Provincial mining authorityconsolidated the administrative proceeding into a single proceedingagainst MAG encompassing both the September 2016 incident and theMarch 2017 incident.
On December 27, 2017, MAG received notice of a resolution from the SanJuan Provincial mining authority requiring payment of an administrativefine of approximately $5.6 million (calculated at the prevailing exchangerate on December 31, 2017) encompassing both the September 2016incident and the March 2017 incident. On January 23, 2018, inaccordance with local

BARRICK YEAR-END 2017 59 MANAGEMENT’S DISCUSSION AND ANALYSIS
requirements, MAG paid the administrative fine and filed a request forreconsideration with the San Juan Provincial mining authority, whichremains pending. Refer to note 36 to the Financial Statements for moreinformation regarding this matter.
Cyanide Leaching Process – Civil ActionOn December 15, 2016, MAG was served notice of a lawsuit by certainpersons who claim to be living in Jachal, Argentina and to be affected bythe Veladero mine and, in particular, the valley leach facility (“VLF”). Inthe lawsuit, which was filed in the San Juan Provincial court, the plaintiffshave requested a court order that MAG cease leaching metals withcyanide solutions, mercury and other similar substances at the Veladeromine and replace that process with one that is free of hazardoussubstances, that MAG implement a closure and remediation plan for theVLF and surrounding areas, and create a committee to monitor thisprocess. The lawsuit is proceeding as an ordinary civil action. MAGreplied to the lawsuit on February 20, 2017. On March 31, 2017, theplaintiffs supplemented their original complaint to allege that the risk ofenvironmental damage had increased as a result of the March 28, 2017release of gold-bearing process solution incident described above. TheCompany responded to the new allegations and intends to continuedefending this matter vigorously. Refer to note 36 to the FinancialStatements for more information regarding this matter.
OutlookAt Veladero we expect 2018 production to be in the range of 275 to330 thousand ounces (Barrick’s share), lower than 2017 production levels.The decrease is a result of the divestment of 50% of the Veladero mine asat June 30, 2017. This is combined with slightly lower ore grade to theleach pad in 2018, offset by ongoing soluble inventory drawdown withimproved solution management.
Cost of sales per ounce 4 is expected to be in the range of $970 to $1,110per ounce which is higher than 2017, mainly due to higher depreciationexpense reflecting the effect of the fair value increments applied to ourremaining 50% interest. We expect cash costs 1 in 2018 to be in the rangeof $560 to $620 per ounce, lower than 2017 levels mainly due to lowerdirect operating costs, partly offset by the impact of higher charges fromthe production inventory movements. All-in sustaining costs 1 areexpected to be between $960 and $1,100 per ounce, aligned with 2017 aslower cash costs 1 are offset by higher capitalized waste stripping.Operating costs at Veladero are also highly sensitive to local inflation andfluctuations in foreign exchange rates. We have assumed an averageARS:USD exchange rate of ARS18.3: $1.00 and a local inflation rate of15% for the purposes of preparing our cash costs 1 and all-in sustainingcosts 1 guidance for 2018.
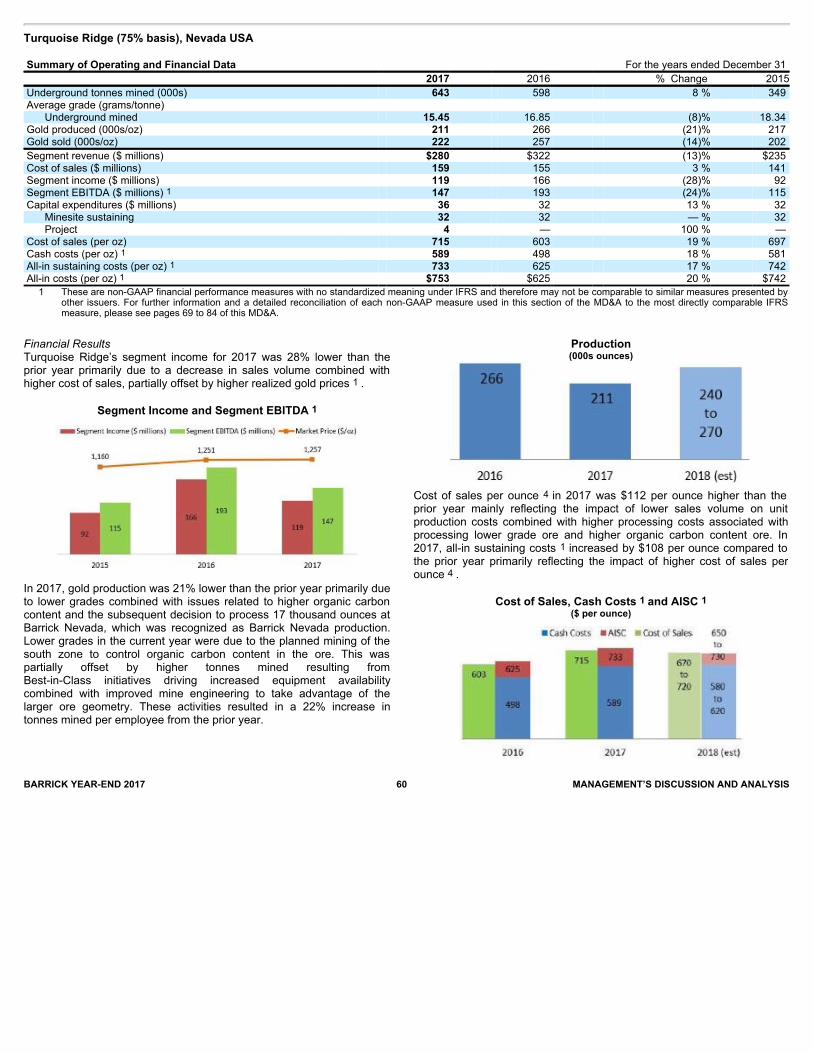
Turquoise Ridge (75% basis), Nevada USA Summary of Operating and Financial Data For the years ended December 31 2017 2016 % Change 2015 Underground tonnes mined (000s) 643 598 8 % 349 Average grade (grams/tonne)
Underground mined 15.45 16.85 (8)% 18.34 Gold produced (000s/oz) 211 266 (21)% 217 Gold sold (000s/oz) 222 257 (14)% 202 Segment revenue ($ millions) $280 $322 (13)% $235 Cost of sales ($ millions) 159 155 3 % 141 Segment income ($ millions) 119 166 (28)% 92 Segment EBITDA ($ millions) 1 147 193 (24)% 115 Capital expenditures ($ millions) 36 32 13 % 32
Minesite sustaining 32 32 — % 32 Project 4 — 100 % —
Cost of sales (per oz) 715 603 19 % 697 Cash costs (per oz) 1 589 498 18 % 581 All-in sustaining costs (per oz) 1 733 625 17 % 742 All-in costs (per oz) 1 $753 $625 20 % $742
1 These are non-GAAP financial performance measures with no standardized meaning under IFRS and therefore may not be comparable to similar measures presented by
other issuers. For further information and a detailed reconciliation of each non-GAAP measure used in this section of the MD&A to the most directly comparable IFRSmeasure, please see pages 69 to 84 of this MD&A.
BARRICK YEAR-END 2017 60 MANAGEMENT’S DISCUSSION AND ANALYSIS
Financial ResultsTurquoise Ridge’s segment income for 2017 was 28% lower than theprior year primarily due to a decrease in sales volume combined withhigher cost of sales, partially offset by higher realized gold prices 1 .
Segment Income and Segment EBITDA 1
In 2017, gold production was 21% lower than the prior year primarily dueto lower grades combined with issues related to higher organic carboncontent and the subsequent decision to process 17 thousand ounces atBarrick Nevada, which was recognized as Barrick Nevada production.Lower grades in the current year were due to the planned mining of thesouth zone to control organic carbon content in the ore. This waspartially offset by higher tonnes mined resulting fromBest-in-Class initiatives driving increased equipment availabilitycombined with improved mine engineering to take advantage of thelarger ore geometry. These activities resulted in a 22% increase intonnes mined per employee from the prior year.
Production(000s ounces)
Cost of sales per ounce 4 in 2017 was $112 per ounce higher than theprior year mainly reflecting the impact of lower sales volume on unitproduction costs combined with higher processing costs associated withprocessing lower grade ore and higher organic carbon content ore. In2017, all-in sustaining costs 1 increased by $108 per ounce compared tothe prior year primarily reflecting the impact of higher cost of sales perounce 4 .
Cost of Sales, Cash Costs 1 and AISC 1($ per ounce)
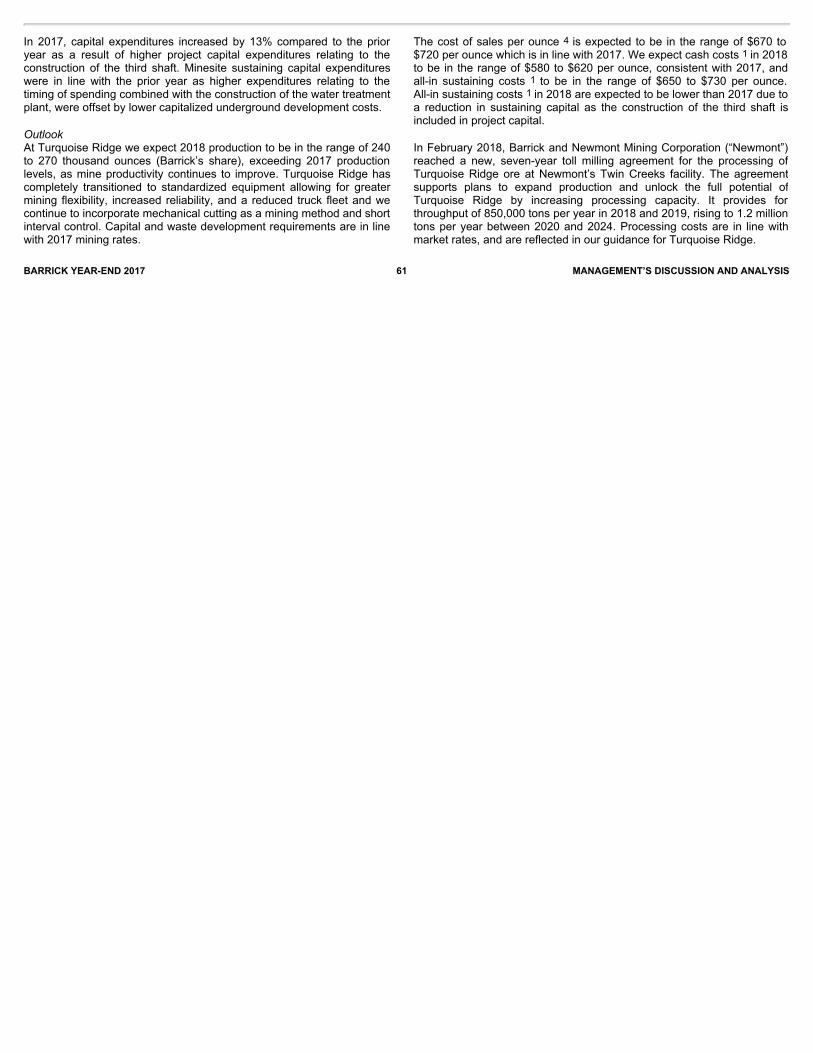
BARRICK YEAR-END 2017 61 MANAGEMENT’S DISCUSSION AND ANALYSIS
In 2017, capital expenditures increased by 13% compared to the prioryear as a result of higher project capital expenditures relating to theconstruction of the third shaft. Minesite sustaining capital expenditureswere in line with the prior year as higher expenditures relating to thetiming of spending combined with the construction of the water treatmentplant, were offset by lower capitalized underground development costs.
OutlookAt Turquoise Ridge we expect 2018 production to be in the range of 240to 270 thousand ounces (Barrick’s share), exceeding 2017 productionlevels, as mine productivity continues to improve. Turquoise Ridge hascompletely transitioned to standardized equipment allowing for greatermining flexibility, increased reliability, and a reduced truck fleet and wecontinue to incorporate mechanical cutting as a mining method and shortinterval control. Capital and waste development requirements are in linewith 2017 mining rates.
The cost of sales per ounce 4 is expected to be in the range of $670 to$720 per ounce which is in line with 2017. We expect cash costs 1 in 2018to be in the range of $580 to $620 per ounce, consistent with 2017, andall-in sustaining costs 1 to be in the range of $650 to $730 per ounce.All-in sustaining costs 1 in 2018 are expected to be lower than 2017 due toa reduction in sustaining capital as the construction of the third shaft isincluded in project capital.
In February 2018, Barrick and Newmont Mining Corporation (“Newmont”)reached a new, seven-year toll milling agreement for the processing ofTurquoise Ridge ore at Newmont’s Twin Creeks facility. The agreementsupports plans to expand production and unlock the full potential ofTurquoise Ridge by increasing processing capacity. It provides forthroughput of 850,000 tons per year in 2018 and 2019, rising to 1.2 milliontons per year between 2020 and 2024. Processing costs are in line withmarket rates, and are reflected in our guidance for Turquoise Ridge.
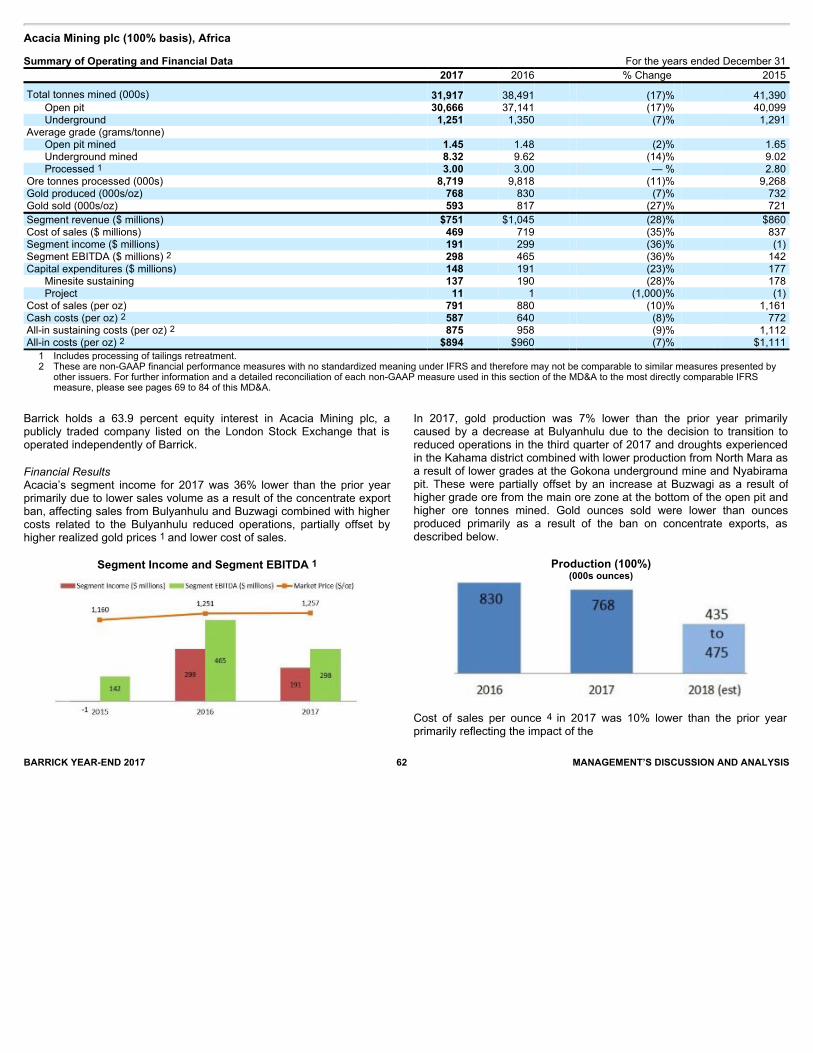
Acacia Mining plc (100% basis), AfricaSummary of Operating and Financial Data For the years ended December 31 2017 2016 % Change 2015
Total tonnes mined (000s) 31,917 38,491 (17)% 41,390 Open pit 30,666 37,141 (17)% 40,099 Underground 1,251 1,350 (7)% 1,291
Average grade (grams/tonne) Open pit mined 1.45 1.48 (2)% 1.65 Underground mined 8.32 9.62 (14)% 9.02 Processed 1 3.00 3.00 — % 2.80
Ore tonnes processed (000s) 8,719 9,818 (11)% 9,268 Gold produced (000s/oz) 768 830 (7)% 732 Gold sold (000s/oz) 593 817 (27)% 721 Segment revenue ($ millions) $751 $1,045 (28)% $860 Cost of sales ($ millions) 469 719 (35)% 837 Segment income ($ millions) 191 299 (36)% (1) Segment EBITDA ($ millions) 2 298 465 (36)% 142 Capital expenditures ($ millions) 148 191 (23)% 177
Minesite sustaining 137 190 (28)% 178 Project 11 1 (1,000)% (1)
Cost of sales (per oz) 791 880 (10)% 1,161 Cash costs (per oz) 2 587 640 (8)% 772 All-in sustaining costs (per oz) 2 875 958 (9)% 1,112 All-in costs (per oz) 2 $894 $960 (7)% $1,111 1 Includes processing of tailings retreatment.
2 These are non-GAAP financial performance measures with no standardized meaning under IFRS and therefore may not be comparable to similar measures presented by
other issuers. For further information and a detailed reconciliation of each non-GAAP measure used in this section of the MD&A to the most directly comparable IFRSmeasure, please see pages 69 to 84 of this MD&A.
BARRICK YEAR-END 2017 62 MANAGEMENT’S DISCUSSION AND ANALYSIS
Barrick holds a 63.9 percent equity interest in Acacia Mining plc, apublicly traded company listed on the London Stock Exchange that isoperated independently of Barrick.
Financial ResultsAcacia’s segment income for 2017 was 36% lower than the prior yearprimarily due to lower sales volume as a result of the concentrate exportban, affecting sales from Bulyanhulu and Buzwagi combined with highercosts related to the Bulyanhulu reduced operations, partially offset byhigher realized gold prices 1 and lower cost of sales.
Segment Income and Segment EBITDA 1
In 2017, gold production was 7% lower than the prior year primarilycaused by a decrease at Bulyanhulu due to the decision to transition toreduced operations in the third quarter of 2017 and droughts experiencedin the Kahama district combined with lower production from North Mara asa result of lower grades at the Gokona underground mine and Nyabiramapit. These were partially offset by an increase at Buzwagi as a result ofhigher grade ore from the main ore zone at the bottom of the open pit andhigher ore tonnes mined. Gold ounces sold were lower than ouncesproduced primarily as a result of the ban on concentrate exports, asdescribed below.
Production (100%)(000s ounces)
Cost of sales per ounce 4 in 2017 was 10% lower than the prior yearprimarily reflecting the impact of the
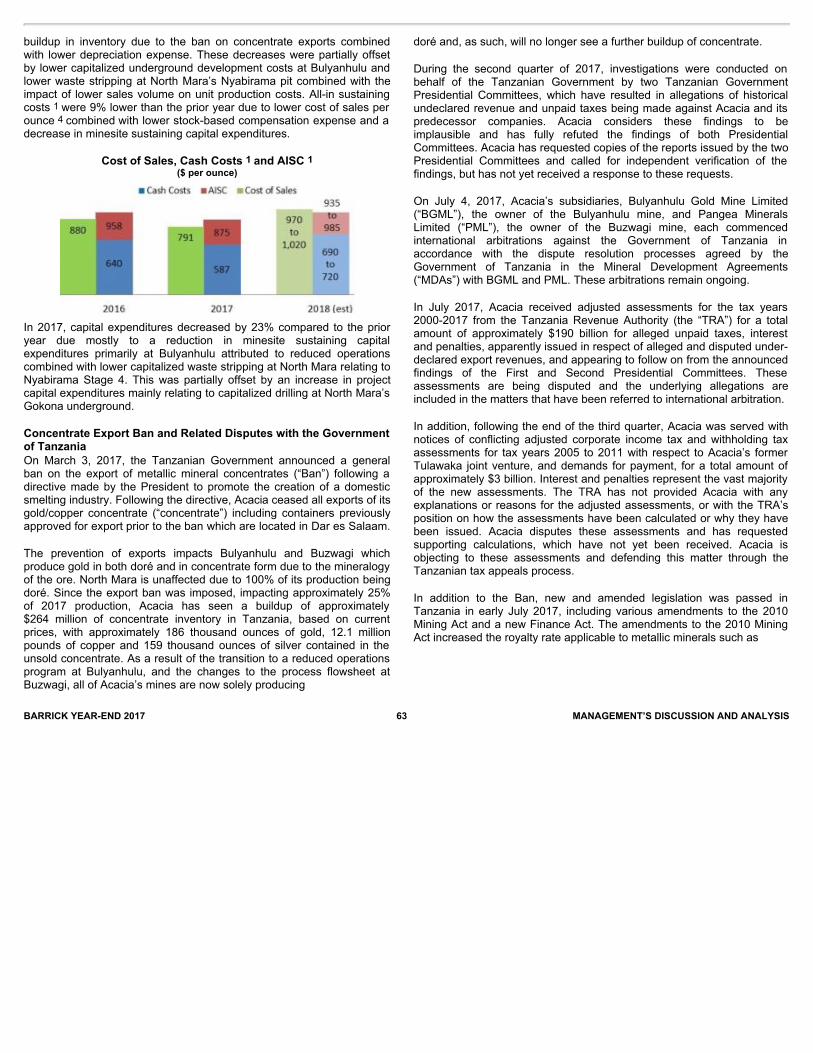
BARRICK YEAR-END 2017 63 MANAGEMENT’S DISCUSSION AND ANALYSIS
buildup in inventory due to the ban on concentrate exports combinedwith lower depreciation expense. These decreases were partially offsetby lower capitalized underground development costs at Bulyanhulu andlower waste stripping at North Mara’s Nyabirama pit combined with theimpact of lower sales volume on unit production costs. All-in sustainingcosts 1 were 9% lower than the prior year due to lower cost of sales perounce 4 combined with lower stock-based compensation expense and adecrease in minesite sustaining capital expenditures.
Cost of Sales, Cash Costs 1 and AISC 1($ per ounce)
In 2017, capital expenditures decreased by 23% compared to the prioryear due mostly to a reduction in minesite sustaining capitalexpenditures primarily at Bulyanhulu attributed to reduced operationscombined with lower capitalized waste stripping at North Mara relating toNyabirama Stage 4. This was partially offset by an increase in projectcapital expenditures mainly relating to capitalized drilling at North Mara’sGokona underground.
Concentrate Export Ban and Related Disputes with the Governmentof TanzaniaOn March 3, 2017, the Tanzanian Government announced a generalban on the export of metallic mineral concentrates (“Ban”) following adirective made by the President to promote the creation of a domesticsmelting industry. Following the directive, Acacia ceased all exports of itsgold/copper concentrate (“concentrate”) including containers previouslyapproved for export prior to the ban which are located in Dar es Salaam.
The prevention of exports impacts Bulyanhulu and Buzwagi whichproduce gold in both doré and in concentrate form due to the mineralogyof the ore. North Mara is unaffected due to 100% of its production beingdoré. Since the export ban was imposed, impacting approximately 25%of 2017 production, Acacia has seen a buildup of approximately$264 million of concentrate inventory in Tanzania, based on currentprices, with approximately 186 thousand ounces of gold, 12.1 millionpounds of copper and 159 thousand ounces of silver contained in theunsold concentrate. As a result of the transition to a reduced operationsprogram at Bulyanhulu, and the changes to the process flowsheet atBuzwagi, all of Acacia’s mines are now solely producing
doré and, as such, will no longer see a further buildup of concentrate.
During the second quarter of 2017, investigations were conducted onbehalf of the Tanzanian Government by two Tanzanian GovernmentPresidential Committees, which have resulted in allegations of historicalundeclared revenue and unpaid taxes being made against Acacia and itspredecessor companies. Acacia considers these findings to beimplausible and has fully refuted the findings of both PresidentialCommittees. Acacia has requested copies of the reports issued by the twoPresidential Committees and called for independent verification of thefindings, but has not yet received a response to these requests.
On July 4, 2017, Acacia’s subsidiaries, Bulyanhulu Gold Mine Limited(“BGML”), the owner of the Bulyanhulu mine, and Pangea MineralsLimited (“PML”), the owner of the Buzwagi mine, each commencedinternational arbitrations against the Government of Tanzania inaccordance with the dispute resolution processes agreed by theGovernment of Tanzania in the Mineral Development Agreements(“MDAs”) with BGML and PML. These arbitrations remain ongoing.
In July 2017, Acacia received adjusted assessments for the tax years2000-2017 from the Tanzania Revenue Authority (the “TRA”) for a totalamount of approximately $190 billion for alleged unpaid taxes, interestand penalties, apparently issued in respect of alleged and disputed under-declared export revenues, and appearing to follow on from the announcedfindings of the First and Second Presidential Committees. Theseassessments are being disputed and the underlying allegations areincluded in the matters that have been referred to international arbitration.
In addition, following the end of the third quarter, Acacia was served withnotices of conflicting adjusted corporate income tax and withholding taxassessments for tax years 2005 to 2011 with respect to Acacia’s formerTulawaka joint venture, and demands for payment, for a total amount ofapproximately $3 billion. Interest and penalties represent the vast majorityof the new assessments. The TRA has not provided Acacia with anyexplanations or reasons for the adjusted assessments, or with the TRA’sposition on how the assessments have been calculated or why they havebeen issued. Acacia disputes these assessments and has requestedsupporting calculations, which have not yet been received. Acacia isobjecting to these assessments and defending this matter through theTanzanian tax appeals process.
In addition to the Ban, new and amended legislation was passed inTanzania in early July 2017, including various amendments to the 2010Mining Act and a new Finance Act. The amendments to the 2010 MiningAct increased the royalty rate applicable to metallic minerals such as
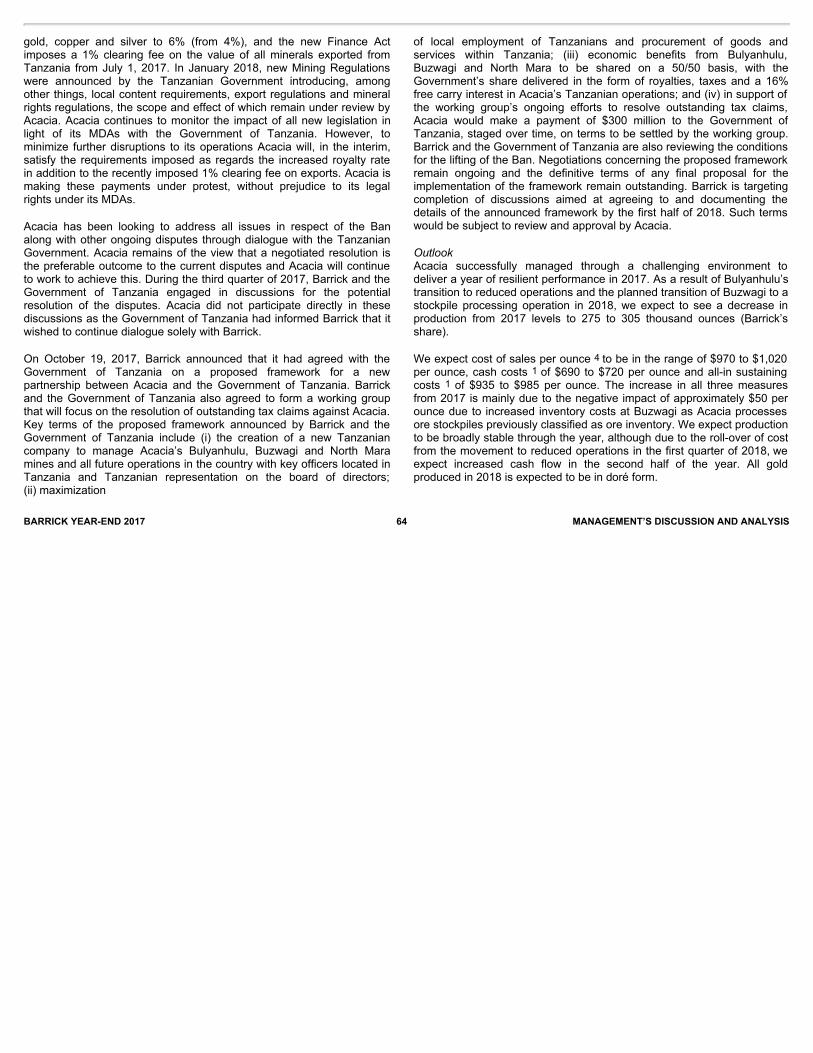
BARRICK YEAR-END 2017 64 MANAGEMENT’S DISCUSSION AND ANALYSIS
gold, copper and silver to 6% (from 4%), and the new Finance Actimposes a 1% clearing fee on the value of all minerals exported fromTanzania from July 1, 2017. In January 2018, new Mining Regulationswere announced by the Tanzanian Government introducing, amongother things, local content requirements, export regulations and mineralrights regulations, the scope and effect of which remain under review byAcacia. Acacia continues to monitor the impact of all new legislation inlight of its MDAs with the Government of Tanzania. However, tominimize further disruptions to its operations Acacia will, in the interim,satisfy the requirements imposed as regards the increased royalty ratein addition to the recently imposed 1% clearing fee on exports. Acacia ismaking these payments under protest, without prejudice to its legalrights under its MDAs.
Acacia has been looking to address all issues in respect of the Banalong with other ongoing disputes through dialogue with the TanzanianGovernment. Acacia remains of the view that a negotiated resolution isthe preferable outcome to the current disputes and Acacia will continueto work to achieve this. During the third quarter of 2017, Barrick and theGovernment of Tanzania engaged in discussions for the potentialresolution of the disputes. Acacia did not participate directly in thesediscussions as the Government of Tanzania had informed Barrick that itwished to continue dialogue solely with Barrick.
On October 19, 2017, Barrick announced that it had agreed with theGovernment of Tanzania on a proposed framework for a newpartnership between Acacia and the Government of Tanzania. Barrickand the Government of Tanzania also agreed to form a working groupthat will focus on the resolution of outstanding tax claims against Acacia.Key terms of the proposed framework announced by Barrick and theGovernment of Tanzania include (i) the creation of a new Tanzaniancompany to manage Acacia’s Bulyanhulu, Buzwagi and North Maramines and all future operations in the country with key officers located inTanzania and Tanzanian representation on the board of directors;(ii) maximization
of local employment of Tanzanians and procurement of goods andservices within Tanzania; (iii) economic benefits from Bulyanhulu,Buzwagi and North Mara to be shared on a 50/50 basis, with theGovernment’s share delivered in the form of royalties, taxes and a 16%free carry interest in Acacia’s Tanzanian operations; and (iv) in support ofthe working group’s ongoing efforts to resolve outstanding tax claims,Acacia would make a payment of $300 million to the Government ofTanzania, staged over time, on terms to be settled by the working group.Barrick and the Government of Tanzania are also reviewing the conditionsfor the lifting of the Ban. Negotiations concerning the proposed frameworkremain ongoing and the definitive terms of any final proposal for theimplementation of the framework remain outstanding. Barrick is targetingcompletion of discussions aimed at agreeing to and documenting thedetails of the announced framework by the first half of 2018. Such termswould be subject to review and approval by Acacia.
OutlookAcacia successfully managed through a challenging environment todeliver a year of resilient performance in 2017. As a result of Bulyanhulu’stransition to reduced operations and the planned transition of Buzwagi to astockpile processing operation in 2018, we expect to see a decrease inproduction from 2017 levels to 275 to 305 thousand ounces (Barrick’sshare).
We expect cost of sales per ounce 4 to be in the range of $970 to $1,020per ounce, cash costs 1 of $690 to $720 per ounce and all-in sustainingcosts 1 of $935 to $985 per ounce. The increase in all three measuresfrom 2017 is mainly due to the negative impact of approximately $50 perounce due to increased inventory costs at Buzwagi as Acacia processesore stockpiles previously classified as ore inventory. We expect productionto be broadly stable through the year, although due to the roll-over of costfrom the movement to reduced operations in the first quarter of 2018, weexpect increased cash flow in the second half of the year. All goldproduced in 2018 is expected to be in doré form.
BARRICK YEAR-END 2017 65 MANAGEMENT’S DISCUSSION AND ANALYSIS
Pascua-Lama, Argentina/Chile
The Pascua-Lama project, located on the border between Chile andArgentina, contains 21.3 million ounces of measured and indicated goldresources.
As described below, in January 2018 we received a resolution of closureof existing infrastructure on the Chilean side of the Pascua-Lama projectfrom Chile’s environmental regulator (the Superintendencia del MedioAmbiente, or “SMA”). The resolution does not affect the Company’songoing evaluation of an underground, block-caving operation atPascua-Lama, which would require additional permitting and regulatoryapprovals in both Argentina and Chile, unconnected to the recent SMAdecision. In any underground scenario, Barrick would also close sitefacilities and surface disturbance in Chile not necessary for anunderground mine. As a result, we have increased our provision forenvironmental remediation at Pascua-Lama by $644 million in the fourthquarter of 2017.
In light of the order to close surface facilities in Chile, and current plansto evaluate an underground mine, Barrick is reclassifying Pascua-Lama’s proven and probable gold reserves of approximately 14 millionounces 6 , which are based on an open pit mine plan, as measured andindicated resources. As a result, we have recorded an impairment of$429 million at Pascua-Lama in the fourth quarter of 2017.
We have formed a working group with Shandong Gold to study apotential partnership at Pascua-Lama, building on our existing jointventure at the nearby Veladero mine. Our Investment Committee willcontinue to scrutinize the project as it advances, applying a high degreeof consistency and rigor — as we do for all capital allocation decisions atthe Company — before further review by the Executive Committee andthe Board at each stage of advancement.
SMA Regulatory SanctionsOn June 8, 2016, the SMA consolidated the two administrativeproceedings against Compańía Minera Nevada (“CMN”) into a singleproceeding encompassing both the reconsideration of the originalresolution issued by the SMA in May 2013 in accordance with thedecision of the Environmental Court and the alleged deviations from theProject’s environmental approval notified by the SMA in April 2015.
On January 17, 2018, CMN received the revised resolution (the “RevisedResolution”) from the SMA, in which the environmental regulatorreduced the original administrative fine from approximately $16 million to$11.5 million and ordered the closure of existing surface facilities on theChilean side of the Project in addition to certain monitoring activities. TheRevised Resolution does not revoke the Project’s environmentalapproval. CMN filed an appeal of the Revised Resolution on February 3,
2018. Refer to note 36 to the Financial Statements for more informationregarding this matter.
Constitutional Protection ActionOn August 12, 2016, the court ruled in favor of CMN and Sernageomin,rejecting the plaintiffs’ challenges to the Temporary Closure Plan for thePascua-Lama project. The plaintiffs appealed the court’s decision to theChilean Supreme Court and on March 13, 2017, the Supreme Courtvacated the Temporary Closure Plan, ruling that additional informationregarding the SMA regulatory sanction process was required from theenvironmental regulator, and ordering Sernageomin to issue a newresolution on the Temporary Closure Plan after receiving suchinformation. On August 29, 2017, Sernageomin issued a new resolution inwhich it reapproved the Temporary Closure Plan as originally issued. Thisapproval is valid through September 2019. Refer to note 36 to theFinancial Statements for more information regarding this matter.
Water Quality ReviewCMN initiated a review of the baseline water quality of the Rio Estrecho inAugust 2013 as required by a July 15, 2013 decision of the Court ofAppeals of Copiapo, Chile. The purpose of the review was to establishwhether the water quality baseline has changed since the Pascua-Lamaproject received its environmental approval in February 2006 and, if so, torequire CMN to adopt the appropriate corrective measures. As a result ofthat study, CMN requested certain modifications to its environmentalpermit water quality requirements. On June 6, 2016, the responsibleagency approved a partial amendment of the environmental permit tobetter reflect the water quality baseline from 2009. That approval wasappealed by certain water users and indigenous residents of the HuascoValley. On October 19, 2016, the Chilean Committee of Ministers for theEnvironment, which has jurisdiction over claims of this nature, voted touphold the permit amendments. On January 27, 2017, the EnvironmentalCourt agreed to consider an appeal of the Chilean Committee’s decisionbrought by CMN and the water users and indigenous residents. A hearingtook place on July 25, 2017. On December 12, 2017, the water userswithdrew their appeal. The Environmental Court dismissed that appeal onJanuary 5, 2018. A decision of the Environmental Court on the remainingappeals is still pending. Refer to note 36 to the Financial Statements formore information regarding this matter.
Water Treatment PlantThe water treatment plant on the Chilean side of the Pascua-Lama projectwas damaged during the second quarter of 2016 as a result of heavysnowfall. The water treatment plant consists of two main components, thehigh density sludge unit followed by the reverse osmosis unit. In June2017, repairs were completed and the water treatment plant resumednormal operations. CMN has reviewed its contingency plan with Chileanregulatory authorities.
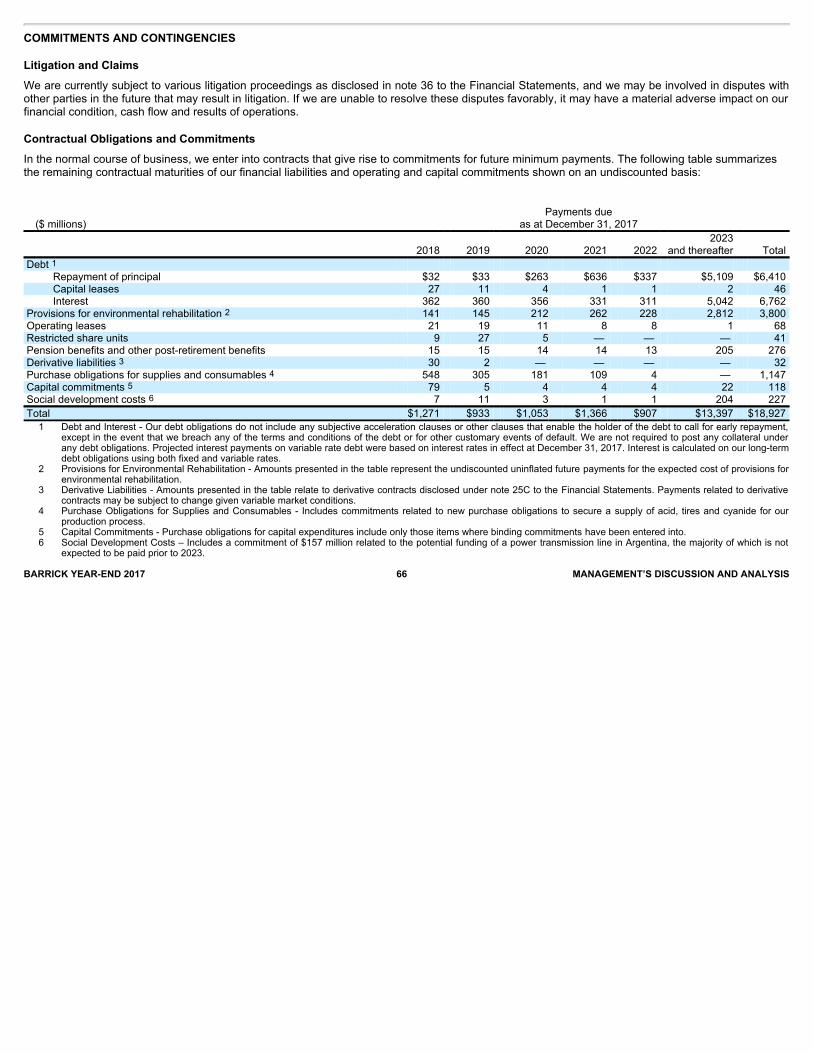
COMMITMENTS AND CONTINGENCIES
Litigation and ClaimsWe are currently subject to various litigation proceedings as disclosed in note 36 to the Financial Statements, and we may be involved in disputes withother parties in the future that may result in litigation. If we are unable to resolve these disputes favorably, it may have a material adverse impact on ourfinancial condition, cash flow and results of operations.
Contractual Obligations and CommitmentsIn the normal course of business, we enter into contracts that give rise to commitments for future minimum payments. The following table summarizesthe remaining contractual maturities of our financial liabilities and operating and capital commitments shown on an undiscounted basis:
Payments due ($ millions) as at December 31, 2017 2023 2018 2019 2020 2021 2022 and thereafter Total Debt 1 Repayment of principal $32 $33 $263 $636 $337 $5,109 $6,410 Capital leases 27 11 4 1 1 2 46 Interest 362 360 356 331 311 5,042 6,762 Provisions for environmental rehabilitation 2 141 145 212 262 228 2,812 3,800 Operating leases 21 19 11 8 8 1 68 Restricted share units 9 27 5 — — — 41 Pension benefits and other post-retirement benefits 15 15 14 14 13 205 276 Derivative liabilities 3 30 2 — — — — 32 Purchase obligations for supplies and consumables 4 548 305 181 109 4 — 1,147 Capital commitments 5 79 5 4 4 4 22 118 Social development costs 6 7 11 3 1 1 204 227 Total $1,271 $933 $1,053 $1,366 $907 $13,397 $18,927
1 Debt and Interest - Our debt obligations do not include any subjective acceleration clauses or other clauses that enable the holder of the debt to call for early repayment,
except in the event that we breach any of the terms and conditions of the debt or for other customary events of default. We are not required to post any collateral underany debt obligations. Projected interest payments on variable rate debt were based on interest rates in effect at December 31, 2017. Interest is calculated on our long-termdebt obligations using both fixed and variable rates.
2 Provisions for Environmental Rehabilitation - Amounts presented in the table represent the undiscounted uninflated future payments for the expected cost of provisions forenvironmental rehabilitation.
3 Derivative Liabilities - Amounts presented in the table relate to derivative contracts disclosed under note 25C to the Financial Statements. Payments related to derivativecontracts may be subject to change given variable market conditions.
4 Purchase Obligations for Supplies and Consumables - Includes commitments related to new purchase obligations to secure a supply of acid, tires and cyanide for ourproduction process.
5 Capital Commitments - Purchase obligations for capital expenditures include only those items where binding commitments have been entered into. 6 Social Development Costs – Includes a commitment of $157 million related to the potential funding of a power transmission line in Argentina, the majority of which is not
expected to be paid prior to 2023.BARRICK YEAR-END 2017 66 MANAGEMENT’S DISCUSSION AND ANALYSIS

REVIEW OF QUARTERLY RESULTS
Quarterly Information 1 2017 2016
($ millions, except where indicated) Q4 Q3 Q2 Q1 Q4 Q3 Q2 Q1 Revenues $2,228 $1,993 $2,160 $1,993 $2,319 $2,297 $2,012 $1,930 Realized price per ounce – gold 2 1,280 1,274 1,258 1,220 1,217 1,333 1,259 1,181 Realized price per pound – copper 2 3.34 3.05 2.60 2.76 2.62 2.18 2.14 2.18 Cost of sales 1,411 1,270 1,277 1,342 1,454 1,291 1,336 1,324 Net earnings (loss) (314) (11) 1,084 679 425 175 138 (83) Per share (dollars) 3 (0.27) (0.01) 0.93 0.58 0.36 0.15 0.12 (0.07) Adjusted net earnings 2 253 200 261 162 255 278 158 127 Per share (dollars) 2,3 0.22 0.17 0.22 0.14 0.22 0.24 0.14 0.11 Operating cash flow 590 532 448 495 711 951 527 451 Cash capital expenditures 350 307 405 334 326 277 253 270 Free cash flow 2 $240 $225 $43 $161 $385 $674 $274 $181 1 Sum of all the quarters may not add up to the annual total due to rounding.
2 Realized price, adjusted net earnings, adjusted net earnings per share and free cash flow are non-GAAP financial performance measures with no standardized meaning
under IFRS and therefore may not be comparable to similar measures of performance presented by other issuers. For further information and a detailed reconciliation ofeach non-GAAP measure used in this section of the MD&A to the most directly comparable IFRS measure, please see pages 69 to 84 of this MD&A.
3 Calculated using weighted average number of shares outstanding under the basic method of earnings per share.
BARRICK YEAR-END 2017 67 MANAGEMENT’S DISCUSSION AND ANALYSIS
Our recent financial results reflect our emphasis on cost control andgrowing operating cash flow and free cash flow. While gold prices havefluctuated around $1,200 per ounce, we are consistently generatingpositive free cash flow 1 . This free cash flow, combined with theproceeds from various divestitures, have allowed us to strengthen ourbalance sheet over the past two years. In the fourth quarter of 2017, werecorded $521 million (net of tax effects and non-controlling interest) ofnet asset impairments primarily relating to impairments at the Pascua-Lama project and Acacia’s Bulyanhulu mine, partially offset by animpairment reversal at Lumwana. In the third quarter of 2017, werecognized a $172 million tax provision relating to the impact of theproposed framework for Acacia operations in Tanzania. In the secondquarter of 2017, we recorded $858 million (net of tax effects) of gains onthe disposition of 50% of the Veladero mine and a 25% interest in theCerro Casale project. In the first quarter of 2017, we recorded a netasset impairment reversal of $522 million (net of tax effects andnon-controlling interest) primarily relating to impairment reversals at theCerro Casale project. In the fourth quarter of 2016, we recorded a netasset impairment reversal of $199 million (net of tax effects) primarilyrelating to impairment reversals at Veladero and Lagunas Norte.
Fourth Quarter ResultsIn the fourth quarter of 2017, we reported a net loss of $314 million andadjusted net earnings 1 of $253 million, compared to net earnings of$425 million and adjusted net earnings 1 of $255 million in the fourthquarter of 2016. The net loss in the fourth quarter of 2017 reflects therecording of $521 million (net of tax effects and non-controlling interests)in net impairment charges
compared to net impairment reversals of $199 million (net of tax effects)recorded in the fourth quarter of 2016. The lower net earnings in the fourthquarter of 2017 primarily reflects the recognition of impairment chargesrather than impairment reversals in the prior year period combined withlower gold sales volumes, partially offset by an increase in realized goldand copper prices 1 . The decrease in adjusted net earnings 1 primarilyreflects higher income tax expense combined with a decrease in goldsales volume, partially offset by higher realized gold and copper prices 1compared to the fourth quarter of 2016.
In the fourth quarter of 2017, gold and copper sales were 1.37 millionounces and 107 million pounds, respectively, compared to 1.52 millionounces (1.42 million ounces excluding the impact of divestments) and107 million pounds, respectively, in the fourth quarter of 2016. Thedecrease in gold sales was primarily due to lower grades at BarrickNevada combined with lower sales at Acacia due to reduced operations atAcacia’s Bulyanhulu mine, partially offset by higher sales at Porgera andLagunas Norte. Revenues in the fourth quarter of 2017 were lower thanthe same prior year period, reflecting lower gold sales volumes, partiallyoffset by higher market prices for gold and copper.
In the fourth quarter of 2017, cost of sales was $1.4 billion, a decrease of$43 million compared to the same prior year period, primarily due to lowersales volume, which have contributed to a decrease in direct mining costsand royalty expense. This was partially offset by an increase indepreciation expense, as discussed below. Cost of sales per ounce 4 was$801 per ounce, an increase of $17 per ounce, primarily due to higherdirect mining

INTERNAL CONTROL OVER FINANCIAL REPORTING AND DISCLOSURE CONTROLS AND PROCEDURES
BARRICK YEAR-END 2017 68 MANAGEMENT’S DISCUSSION AND ANALYSIS
costs mainly due to higher consumables and power at Pueblo Viejo,partially offset by higher capitalized waste stripping activity at BarrickNevada and higher depreciation expense mainly as a result of higherdepreciation at Pueblo Viejo relating to a tailings storage facilitydepreciation adjustment, partially offset by lower depreciation at BarrickNevada associated with the South Arturo pit. The increase was furtherpartially offset by a positive change in our sales mix with lower relativesales volume from the higher cost Bulyanhulu mine at Acacia. Cost ofsales per pound 4 was $1.79, an increase of $0.36 per pound from thesame prior year period due to higher direct mining costs combined withhigher depreciation expense at Lumwana, partially offset by a positivesales mix impact of lower sales volume at Lumwana compared to thesame prior year period. This was further impacted by higher directmining costs at Zaldívar primarily related to higher fuel and labor costs.
In the fourth quarter of 2017, operating cash flow was $590 million,compared to $711 million in the same prior year period. The decrease inoperating cash flow primarily
reflects lower gold sales volume combined with unfavorable workingcapital movements mainly related to the timing of accounts receivablebalances, partially offset by higher realized gold and copper prices, adecrease in income tax payments and a decrease in interest paid.
In the fourth quarter of 2017, free cash flow 1 was $240 million, lower thanthe $385 million in the same prior year period. The decrease was causedby lower operating cash flow generated in the fourth quarter of 2017compared to the same prior year period combined with slightly highercash capital expenditures of $350 million, compared to $326 million in thefourth quarter of 2016. The higher cash capital expenditures wereprimarily a result of higher project capital expenditures, partially offset by areduction in capitalized development primarily at Acacia’s Bulyanhulu andNorth Mara mines.
Management is responsible for establishing and maintaining adequateinternal control over financial reporting and disclosure controls andprocedures. Internal control over financial reporting is a frameworkdesigned to provide reasonable assurance regarding the reliability offinancial reporting and the preparation of financial statements forexternal purposes in accordance with IFRS. The Company’s internalcontrol over financial reporting framework includes those policies andprocedures that (i) pertain to the maintenance of records that, inreasonable detail, accurately and fairly reflect the transactions anddispositions of the assets of the Company; (ii) provide reasonableassurance that transactions are recorded as necessary to permitpreparation of financial statements in accordance with IFRS, and thatreceipts and expenditures of the Company are being made only inaccordance with authorizations of management and directors of theCompany; and (iii) provide reasonable assurance regarding preventionor timely detection of unauthorized acquisition, use or disposition of theCompany’s assets that could have a material effect on the Company’sconsolidated financial statements.
Disclosure controls and procedures form a broader framework designedto provide reasonable assurance that other financial informationdisclosed publicly fairly presents in all material respects the financialcondition, results of operations and cash flows of the Company for theperiods presented in this MD&A and Barrick’s Annual Report. TheCompany’s disclosure controls and procedures framework includesprocesses designed to ensure that material information relating to theCompany, including its consolidated subsidiaries, is made known tomanagement by others within those entities to allow timely decisionsregarding required disclosure.
Together, the internal control over financial reporting and disclosurecontrols and procedures frameworks provide internal control over financialreporting and disclosure. Due to its inherent limitations, internal controlover financial reporting and disclosure may not prevent or detect allmisstatements. Further, the effectiveness of internal control is subject tothe risk that controls may become inadequate because of changes inconditions, or that the degree of compliance with policies or proceduresmay change.
The management of Barrick, at the direction of our President and ChiefFinancial Officer, evaluated the effectiveness of the design and operationof internal control over financial reporting as of the end of the periodcovered by this report based on the framework and criteria established inInternal Control – Integrated Framework (2013) as issued by theCommittee of Sponsoring Organizations of the Treadway Commission(COSO). Based on that evaluation, management concluded that theCompany’s internal control over financial reporting was effective as atDecember 31, 2017.
There were no changes in the Company’s internal control over financialreporting during the fourth quarter of 2017 that have materially affected, orare reasonably likely to materially affect, the Company’s internal controlover financial reporting.
Barrick’s annual management report on internal control over financialreporting and the integrated audit report of Barrick’s auditors for the yearended December 31, 2017 will be included in Barrick’s 2017 AnnualReport and its 2017 Form 40-F/Annual Information Form on file with theUS Securities and Exchange Commission and Canadian provincialsecurities regulatory authorities.
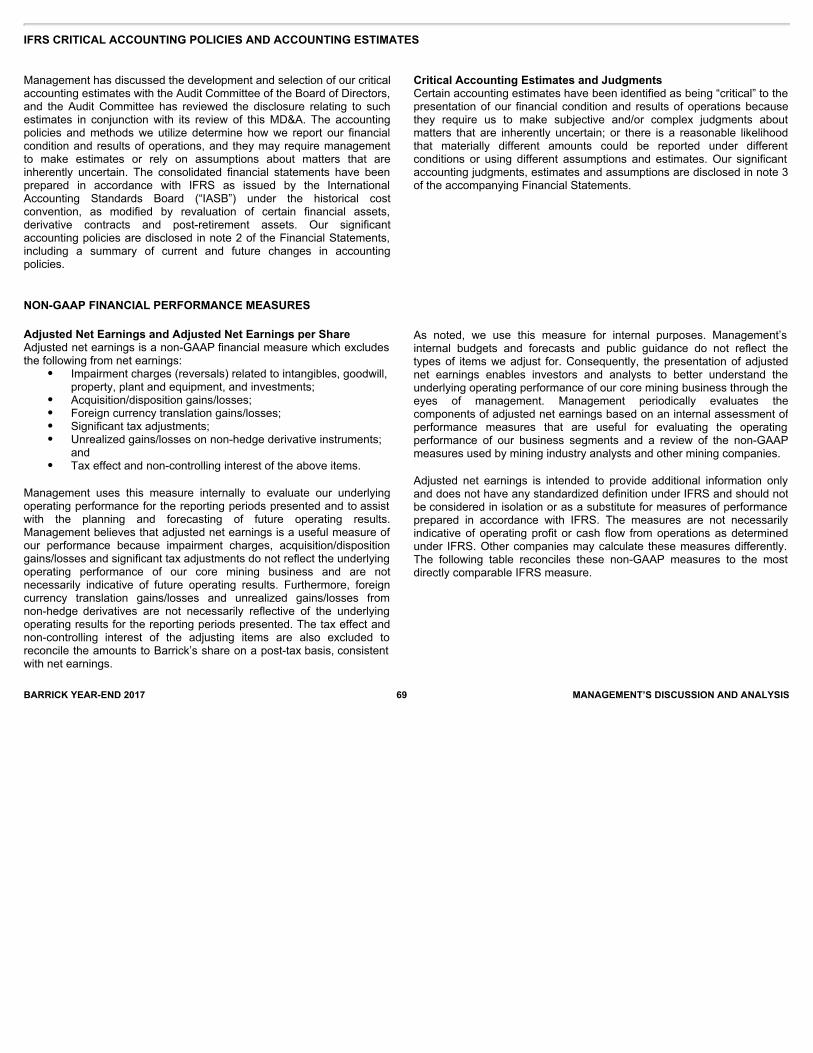
IFRS CRITICAL ACCOUNTING POLICIES AND ACCOUNTING ESTIMATES
BARRICK YEAR-END 2017 69 MANAGEMENT’S DISCUSSION AND ANALYSIS
Management has discussed the development and selection of our criticalaccounting estimates with the Audit Committee of the Board of Directors,and the Audit Committee has reviewed the disclosure relating to suchestimates in conjunction with its review of this MD&A. The accountingpolicies and methods we utilize determine how we report our financialcondition and results of operations, and they may require managementto make estimates or rely on assumptions about matters that areinherently uncertain. The consolidated financial statements have beenprepared in accordance with IFRS as issued by the InternationalAccounting Standards Board (“IASB”) under the historical costconvention, as modified by revaluation of certain financial assets,derivative contracts and post-retirement assets. Our significantaccounting policies are disclosed in note 2 of the Financial Statements,including a summary of current and future changes in accountingpolicies.
Critical Accounting Estimates and JudgmentsCertain accounting estimates have been identified as being “critical” to thepresentation of our financial condition and results of operations becausethey require us to make subjective and/or complex judgments aboutmatters that are inherently uncertain; or there is a reasonable likelihoodthat materially different amounts could be reported under differentconditions or using different assumptions and estimates. Our significantaccounting judgments, estimates and assumptions are disclosed in note 3of the accompanying Financial Statements.
NON-GAAP FINANCIAL PERFORMANCE MEASURES
Adjusted Net Earnings and Adjusted Net Earnings per ShareAdjusted net earnings is a non-GAAP financial measure which excludesthe following from net earnings:
● Impairment charges (reversals) related to intangibles, goodwill,property, plant and equipment, and investments;
● Acquisition/disposition gains/losses; ● Foreign currency translation gains/losses; ● Significant tax adjustments;
● Unrealized gains/losses on non-hedge derivative instruments;and
● Tax effect and non-controlling interest of the above items.
Management uses this measure internally to evaluate our underlyingoperating performance for the reporting periods presented and to assistwith the planning and forecasting of future operating results.Management believes that adjusted net earnings is a useful measure ofour performance because impairment charges, acquisition/dispositiongains/losses and significant tax adjustments do not reflect the underlyingoperating performance of our core mining business and are notnecessarily indicative of future operating results. Furthermore, foreigncurrency translation gains/losses and unrealized gains/losses fromnon-hedge derivatives are not necessarily reflective of the underlyingoperating results for the reporting periods presented. The tax effect andnon-controlling interest of the adjusting items are also excluded toreconcile the amounts to Barrick’s share on a post-tax basis, consistentwith net earnings.
As noted, we use this measure for internal purposes. Management’sinternal budgets and forecasts and public guidance do not reflect thetypes of items we adjust for. Consequently, the presentation of adjustednet earnings enables investors and analysts to better understand theunderlying operating performance of our core mining business through theeyes of management. Management periodically evaluates thecomponents of adjusted net earnings based on an internal assessment ofperformance measures that are useful for evaluating the operatingperformance of our business segments and a review of the non-GAAPmeasures used by mining industry analysts and other mining companies.
Adjusted net earnings is intended to provide additional information onlyand does not have any standardized definition under IFRS and should notbe considered in isolation or as a substitute for measures of performanceprepared in accordance with IFRS. The measures are not necessarilyindicative of operating profit or cash flow from operations as determinedunder IFRS. Other companies may calculate these measures differently.The following table reconciles these non-GAAP measures to the mostdirectly comparable IFRS measure.
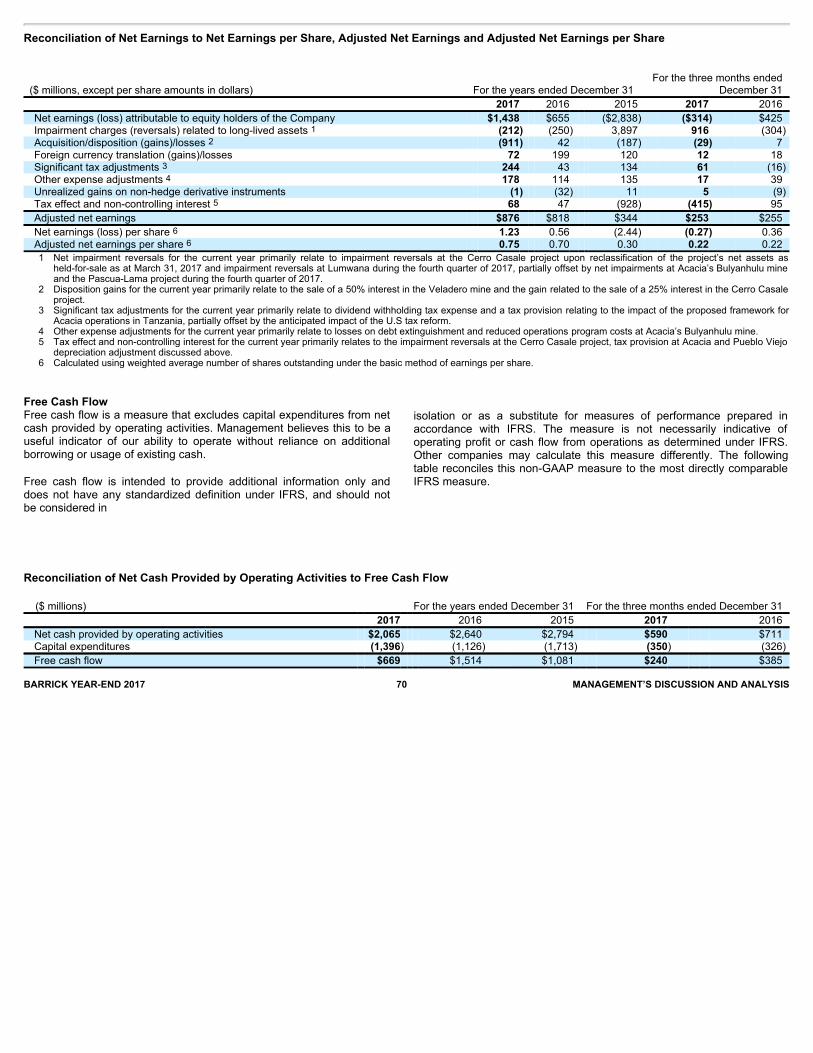
Reconciliation of Net Earnings to Net Earnings per Share, Adjusted Net Earnings and Adjusted Net Earnings per Share
For the three months ended ($ millions, except per share amounts in dollars) For the years ended December 31 December 31 2017 2016 2015 2017 2016 Net earnings (loss) attributable to equity holders of the Company $1,438 $655 ($2,838) ($314) $425 Impairment charges (reversals) related to long-lived assets 1 (212) (250) 3,897 916 (304) Acquisition/disposition (gains)/losses 2 (911) 42 (187) (29) 7 Foreign currency translation (gains)/losses 72 199 120 12 18 Significant tax adjustments 3 244 43 134 61 (16) Other expense adjustments 4 178 114 135 17 39 Unrealized gains on non-hedge derivative instruments (1) (32) 11 5 (9) Tax effect and non-controlling interest 5 68 47 (928) (415) 95 Adjusted net earnings $876 $818 $344 $253 $255 Net earnings (loss) per share 6 1.23 0.56 (2.44) (0.27) 0.36 Adjusted net earnings per share 6 0.75 0.70 0.30 0.22 0.22
1 Net impairment reversals for the current year primarily relate to impairment reversals at the Cerro Casale project upon reclassification of the project’s net assets as
held-for-sale as at March 31, 2017 and impairment reversals at Lumwana during the fourth quarter of 2017, partially offset by net impairments at Acacia’s Bulyanhulu mineand the Pascua-Lama project during the fourth quarter of 2017.
2 Disposition gains for the current year primarily relate to the sale of a 50% interest in the Veladero mine and the gain related to the sale of a 25% interest in the Cerro Casaleproject.
3 Significant tax adjustments for the current year primarily relate to dividend withholding tax expense and a tax provision relating to the impact of the proposed framework forAcacia operations in Tanzania, partially offset by the anticipated impact of the U.S tax reform.
4 Other expense adjustments for the current year primarily relate to losses on debt extinguishment and reduced operations program costs at Acacia’s Bulyanhulu mine. 5 Tax effect and non-controlling interest for the current year primarily relates to the impairment reversals at the Cerro Casale project, tax provision at Acacia and Pueblo Viejo
depreciation adjustment discussed above. 6 Calculated using weighted average number of shares outstanding under the basic method of earnings per share.
Reconciliation of Net Cash Provided by Operating Activities to Free Cash Flow ($ millions) For the years ended December 31 For the three months ended December 31 2017 2016 2015 2017 2016 Net cash provided by operating activities $2,065 $2,640 $2,794 $590 $711 Capital expenditures (1,396) (1,126) (1,713) (350) (326) Free cash flow $669 $1,514 $1,081 $240 $385
BARRICK YEAR-END 2017 70 MANAGEMENT’S DISCUSSION AND ANALYSIS
Free Cash FlowFree cash flow is a measure that excludes capital expenditures from netcash provided by operating activities. Management believes this to be auseful indicator of our ability to operate without reliance on additionalborrowing or usage of existing cash.
Free cash flow is intended to provide additional information only anddoes not have any standardized definition under IFRS, and should notbe considered in
isolation or as a substitute for measures of performance prepared inaccordance with IFRS. The measure is not necessarily indicative ofoperating profit or cash flow from operations as determined under IFRS.Other companies may calculate this measure differently. The followingtable reconciles this non-GAAP measure to the most directly comparableIFRS measure.
BARRICK YEAR-END 2017 71 MANAGEMENT’S DISCUSSION AND ANALYSIS
Cash costs per ounce, All-in sustaining costs per ounce, All-incosts per ounce, C1 cash costs per pound and All-in sustainingcosts per pound
Cash costs per ounce, all-in sustaining costs per ounce and all-in costsper ounce are non-GAAP financial measures which are calculated basedon the definition published by the World Gold Council (“WGC”) (a marketdevelopment organization for the gold industry comprised of and fundedby 23 gold mining companies from around the world, including Barrick).The WGC is not a regulatory organization. Management uses thesemeasures to monitor the performance of our gold mining operations andits ability to generate positive cash flow, both on an individual site basisand an overall company basis.
Cash costs start with our cost of sales related to gold production andremoves depreciation, the non-controlling interest of cost of sales andincludes byproduct credits. All-in sustaining costs start with cash costsand include sustaining capital expenditures, general and administrativecosts, minesite exploration and evaluation costs and reclamation costaccretion and amortization. These additional costs reflect theexpenditures made to maintain current production levels.
All-in costs starts with all-in sustaining costs and adds additional coststhat reflect the varying costs of producing gold over the life-cycle of amine, including: project capital expenditures (capital expenditures at newprojects and discrete projects at existing operations intended to increaseproduction capacity and will not benefit production for at least 12months) and other non-sustaining costs (primarily exploration andevaluation costs, community relations costs and general andadministrative costs that are not associated with current operations).These definitions recognize that there are different costs associated withthe life-cycle of a mine, and that it is therefore appropriate to distinguishbetween sustaining and non-sustaining costs.
We believe that our use of cash costs, all-in sustaining costs and all-incosts will assist analysts, investors and other stakeholders of Barrick inunderstanding the costs associated with producing gold, understandingthe economics of gold mining, assessing our operating performance andalso our ability to generate free cash flow from current operations and togenerate free cash flow on an overall company basis. Due to the capital-intensive nature of the industry and the long useful lives over whichthese items are depreciated, there can be a significant timing differencebetween net earnings calculated in accordance with IFRS and theamount of free cash flow that is being generated by a mine and thereforewe believe these measures are useful non-
GAAP operating metrics and supplement our IFRS disclosures. Thesemeasures are not representative of all of our cash expenditures as they donot include income tax payments, interest costs or dividend payments.These measures do not include depreciation or amortization.
Cash costs per ounce, all-in sustaining costs and all-in costs are intendedto provide additional information only and do not have standardizeddefinitions under IFRS, and should not be considered in isolation or as asubstitute for measures of performance prepared in accordance withIFRS. These measures are not equivalent to net income or cash flow fromoperations as determined under IFRS. Although the WGC has published astandardized definition, other companies may calculate these measuresdifferently.
In addition to presenting these metrics on a by-product basis, we havecalculated these metrics on a co-product basis. Our co-product metricsremove the impact of other metal sales that are produced as a by-productof our gold production from cost per ounce calculations, but does notreflect a reduction in costs for costs associated with other metal sales.
C1 cash costs per pound and all-in sustaining costs per pound arenon-GAAP financial measures related to our copper mine operations. Webelieve that C1 cash costs per pound enables investors to betterunderstand the performance of our copper operations in comparison toother copper producers who present results on a similar basis. C1 cashcosts per pound excludes royalties and non-routine charges as they arenot direct production costs. All-in sustaining costs per pound is similar tothe gold all-in sustaining costs metric and management uses this to betterevaluate the costs of copper production. We believe this measure enablesinvestors to better understand the operating performance of our coppermines as this measure reflects all of the sustaining expenditures incurredin order to produce copper. All-in sustaining costs per pound includes C1cash costs, corporate general and administrative costs, minesiteexploration and evaluation costs, royalties, environmental rehabilitationcosts and write-downs taken on inventory to net realizable value.

Reconciliation of Gold Cost of Sales to Cash costs, All-in sustaining costs and All-in costs, including on a per ounce basis
($ millions, except per ounce information in dollars) For the years ended December 31 For the three months ended December 31
Footnote 2017 2016 2015 2017 2016 Cost of sales related to gold production $4,836 $4,980 $5,906 $1,292 $1,347 Depreciation (1,529) (1,504) (1,615) (404) (396) By-product credits 1 (135) (184) (214) (30) (41) Realized (gains)/losses on hedge and non-hedge derivatives 2 23 89 128 4 18 Non-recurring items 3 — 24 (210) — — Other 4 (106) (44) 25 (35) (20) Non-controlling interests (Pueblo Viejo and Acacia) 5 (299) (358) (394) (81) (91)
Cash costs $2,790 $3,003 $3,626 $746 $817 General & administrative costs 248 256 233 62 39 Minesite exploration and evaluation costs 6 47 44 47 8 18 Minesite sustaining capital expenditures 7 1,109 944 1,359 279 298 Rehabilitation - accretion and amortization (operating sites) 8 64 59 145 13 18 Non-controlling interest, copper operations and other 9 (273) (287) (362) (74) (78)
All-in sustaining costs $3,985 $4,019 $5,048 $1,034 $1,112 Project exploration and evaluation and project costs 6 307 193 308 90 64 Community relations costs not related to current operations 4 8 12 1 2 Project capital expenditures 7 273 175 133 81 51 Rehabilitation - accretion and amortization (non-operating sites) 8 20 11 12 4 4 Non-controlling interest and copper operations 9 (21) (42) (43) (9) (4)
All-in costs $4,568 $4,364 $5,470 $1,201 $1,229 Ounces sold - equity basis (000s ounces) 10 5,302 5,503 6,083 1,372 1,519 Cost of sales per ounce 11,12 $794 $798 $859 $801 $784 Cash costs per ounce 12 $526 $546 $596 $545 $540 Cash costs per ounce (on a co-product basis) 12,13 $544 $569 $619 $561 $557 All-in sustaining costs per ounce 12 $750 $730 $831 $756 $732 All-in sustaining costs per ounce (on a co-product basis) 12,13 $768 $753 $854 $772 $749 All-in costs per ounce 12 $860 $792 $900 $882 $809 All-in costs per ounce (on a co-product basis) 12,13 $878 $815 $923 $898 $826
1 By-product credits
Revenues include the sale of by-products for our gold and copper mines for the three months ended December 31, 2017 of $30 million (2016: $41 million) and the yearended December 31, 2017 of $135 million (2016: $151 million; 2015: $140 million) and energy sales from the Monte Rio power plant at our Pueblo Viejo mine for thethree months ended December 31, 2017 of $nil (2016: $nil) and the year ended December 31, 2017 of $nil (2016: $33 million; 2015: $74 million) up until its dispositionon August 18, 2016.
2 Realized (gains)/losses on hedge and non-hedge derivatives
Includes realized hedge losses of $5 million and $27 million for the three months and year ended December 31, 2017, respectively (2016: $14 million and $73 million,respectively; 2015: $106 million), and realized non-hedge gains of $1 million and $4 million for the three months and year ended December 31, 2017, respectively(2016: $4 million and $16 million losses, respectively; 2015: $22 million losses). Refer to Note 5 of the Financial Statements for further information.
3 Non-recurring items
These gains/costs are not indicative of our cost of production and have been excluded from the calculation of cash costs. 4 Other
Other adjustments include adding the net margins related to power sales at Pueblo Viejo of $nil and $nil, respectively, for the three months and year endedDecember 31, 2017 (2016: $nil and $5 million, respectively; 2015: $12 million) and adding the cost of treatment and refining charges of $nil and $1 million,respectively, for the three months and year ended December 31, 2017 (2016: $4 million and $16 million, respectively; 2015: $14 million). 2016 and 2017 includes theremoval of cash costs associated with our Pierina mine, which is mining incidental ounces as it enters closure, of $35 million and $108 million for the three months andyear ended December 31, 2017, respectively (2016: $24 million and $66 million, respectively).
BARRICK YEAR-END 2017 72 MANAGEMENT’S DISCUSSION AND ANALYSIS
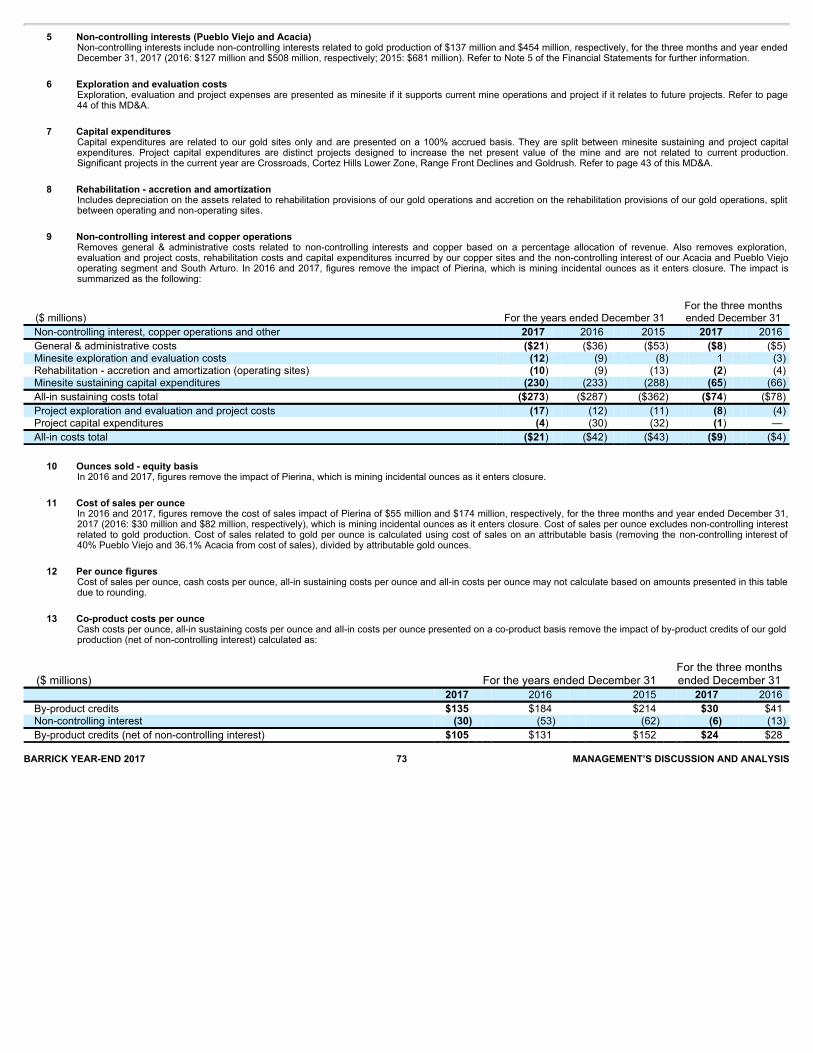
5 Non-controlling interests (Pueblo Viejo and Acacia)Non-controlling interests include non-controlling interests related to gold production of $137 million and $454 million, respectively, for the three months and year endedDecember 31, 2017 (2016: $127 million and $508 million, respectively; 2015: $681 million). Refer to Note 5 of the Financial Statements for further information.
6 Exploration and evaluation costs
Exploration, evaluation and project expenses are presented as minesite if it supports current mine operations and project if it relates to future projects. Refer to page44 of this MD&A.
7 Capital expenditures
Capital expenditures are related to our gold sites only and are presented on a 100% accrued basis. They are split between minesite sustaining and project capitalexpenditures. Project capital expenditures are distinct projects designed to increase the net present value of the mine and are not related to current production.Significant projects in the current year are Crossroads, Cortez Hills Lower Zone, Range Front Declines and Goldrush. Refer to page 43 of this MD&A.
8 Rehabilitation - accretion and amortization
Includes depreciation on the assets related to rehabilitation provisions of our gold operations and accretion on the rehabilitation provisions of our gold operations, splitbetween operating and non-operating sites.
9 Non-controlling interest and copper operations
Removes general & administrative costs related to non-controlling interests and copper based on a percentage allocation of revenue. Also removes exploration,evaluation and project costs, rehabilitation costs and capital expenditures incurred by our copper sites and the non-controlling interest of our Acacia and Pueblo Viejooperating segment and South Arturo. In 2016 and 2017, figures remove the impact of Pierina, which is mining incidental ounces as it enters closure. The impact issummarized as the following:
($ millions) For the years ended December 31 For the three monthsended December 31
Non-controlling interest, copper operations and other 2017 2016 2015 2017 2016 General & administrative costs ($21) ($36) ($53) ($8) ($5) Minesite exploration and evaluation costs (12) (9) (8) 1 (3) Rehabilitation - accretion and amortization (operating sites) (10) (9) (13) (2) (4) Minesite sustaining capital expenditures (230) (233) (288) (65) (66) All-in sustaining costs total ($273) ($287) ($362) ($74) ($78) Project exploration and evaluation and project costs (17) (12) (11) (8) (4) Project capital expenditures (4) (30) (32) (1) — All-in costs total ($21) ($42) ($43) ($9) ($4)
10 Ounces sold - equity basis
In 2016 and 2017, figures remove the impact of Pierina, which is mining incidental ounces as it enters closure. 11 Cost of sales per ounce
In 2016 and 2017, figures remove the cost of sales impact of Pierina of $55 million and $174 million, respectively, for the three months and year ended December 31,2017 (2016: $30 million and $82 million, respectively), which is mining incidental ounces as it enters closure. Cost of sales per ounce excludes non-controlling interestrelated to gold production. Cost of sales related to gold per ounce is calculated using cost of sales on an attributable basis (removing the non-controlling interest of40% Pueblo Viejo and 36.1% Acacia from cost of sales), divided by attributable gold ounces.
12 Per ounce figures
Cost of sales per ounce, cash costs per ounce, all-in sustaining costs per ounce and all-in costs per ounce may not calculate based on amounts presented in this tabledue to rounding.
13 Co-product costs per ounce
Cash costs per ounce, all-in sustaining costs per ounce and all-in costs per ounce presented on a co-product basis remove the impact of by-product credits of our goldproduction (net of non-controlling interest) calculated as:
($ millions) For the years ended December 31 For the three monthsended December 31
2017 2016 2015 2017 2016 By-product credits $135 $184 $214 $30 $41 Non-controlling interest (30) (53) (62) (6) (13) By-product credits (net of non-controlling interest) $105 $131 $152 $24 $28
BARRICK YEAR-END 2017 73 MANAGEMENT’S DISCUSSION AND ANALYSIS
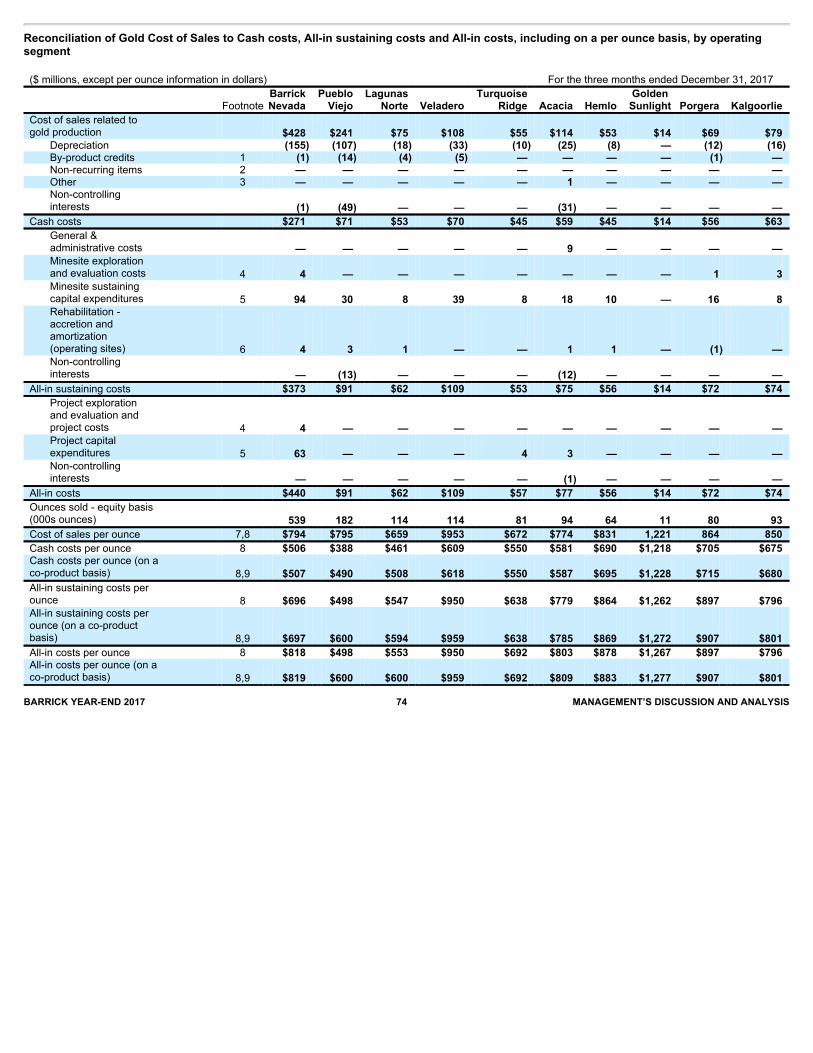
Reconciliation of Gold Cost of Sales to Cash costs, All-in sustaining costs and All-in costs, including on a per ounce basis, by operatingsegment ($ millions, except per ounce information in dollars) For the three months ended December 31, 2017
Footnote BarrickNevada
Pueblo Viejo
LagunasNorte Veladero
TurquoiseRidge Acacia Hemlo
Golden Sunlight Porgera Kalgoorlie
Cost of sales related to gold production $428 $241 $75 $108 $55 $114 $53 $14 $69 $79
Depreciation (155) (107) (18) (33) (10) (25) (8) — (12) (16) By-product credits 1 (1) (14) (4) (5) — — — — (1) — Non-recurring items 2 — — — — — — — — — — Other 3 — — — — — 1 — — — — Non-controllinginterests (1) (49) — — — (31) — — — —
Cash costs $271 $71 $53 $70 $45 $59 $45 $14 $56 $63 General &administrative costs — — — — — 9 — — — — Minesite explorationand evaluation costs 4 4 — — — — — — — 1 3 Minesite sustainingcapital expenditures 5 94 30 8 39 8 18 10 — 16 8 Rehabilitation -accretion andamortization(operating sites) 6 4 3 1 — — 1 1 — (1) — Non-controllinginterests — (13) — — — (12) — — — —
All-in sustaining costs $373 $91 $62 $109 $53 $75 $56 $14 $72 $74 Project explorationand evaluation andproject costs 4 4 — — — — — — — — — Project capitalexpenditures 5 63 — — — 4 3 — — — — Non-controllinginterests — — — — — (1) — — — —
All-in costs $440 $91 $62 $109 $57 $77 $56 $14 $72 $74 Ounces sold - equity basis (000s ounces) 539 182 114 114 81 94 64 11 80 93 Cost of sales per ounce 7,8 $794 $795 $659 $953 $672 $774 $831 1,221 864 850 Cash costs per ounce 8 $506 $388 $461 $609 $550 $581 $690 $1,218 $705 $675 Cash costs per ounce (on a co-product basis) 8,9 $507 $490 $508 $618 $550 $587 $695 $1,228 $715 $680 All-in sustaining costs per ounce 8 $696 $498 $547 $950 $638 $779 $864 $1,262 $897 $796 All-in sustaining costs per ounce (on a co-product basis) 8,9 $697 $600 $594 $959 $638 $785 $869 $1,272 $907 $801 All-in costs per ounce 8 $818 $498 $553 $950 $692 $803 $878 $1,267 $897 $796 All-in costs per ounce (on a co-product basis) 8,9 $819 $600 $600 $959 $692 $809 $883 $1,277 $907 $801 BARRICK YEAR-END 2017 74 MANAGEMENT’S DISCUSSION AND ANALYSIS
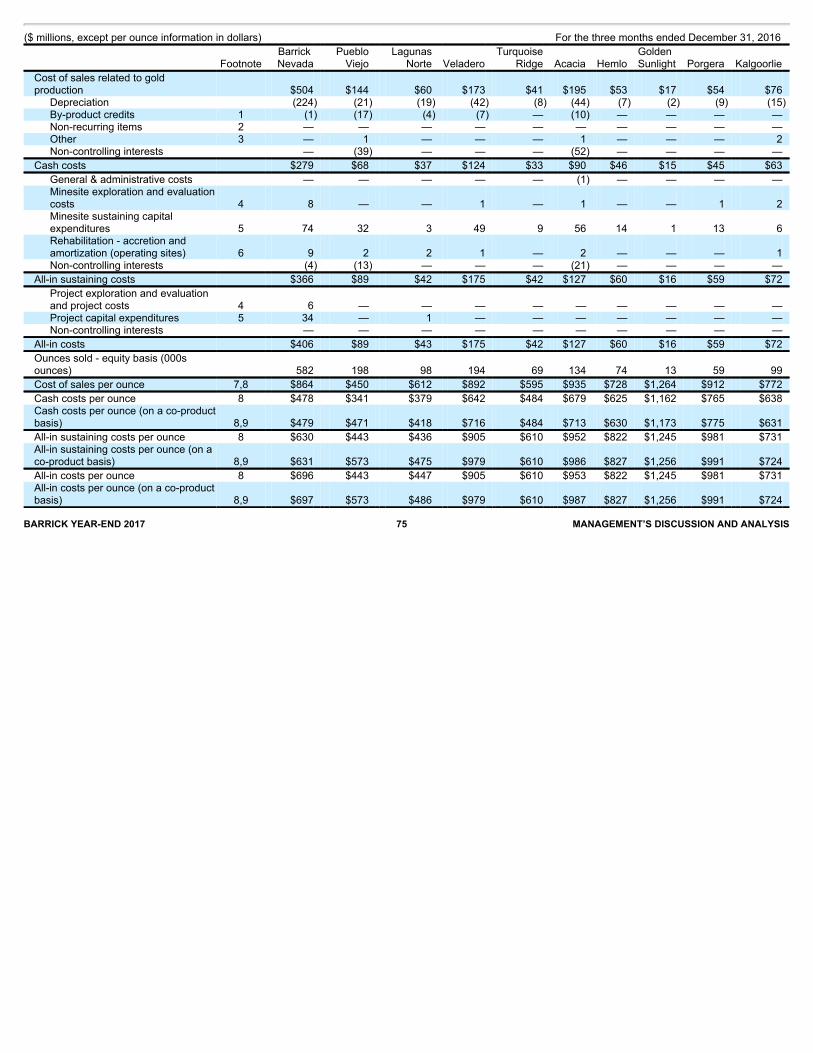
($ millions, except per ounce information in dollars) For the three months ended December 31, 2016
Footnote Barrick
Nevada Pueblo
Viejo Lagunas
Norte Veladero Turquoise
Ridge Acacia Hemlo Golden Sunlight Porgera Kalgoorlie
Cost of sales related to goldproduction $504 $144 $60 $173 $41 $195 $53 $17 $54 $76
Depreciation (224) (21) (19) (42) (8) (44) (7) (2) (9) (15) By-product credits 1 (1) (17) (4) (7) — (10) — — — — Non-recurring items 2 — — — — — — — — — — Other 3 — 1 — — — 1 — — — 2 Non-controlling interests — (39) — — — (52) — — — —
Cash costs $279 $68 $37 $124 $33 $90 $46 $15 $45 $63 General & administrative costs — — — — — (1) — — — — Minesite exploration and evaluationcosts 4 8 — — 1 — 1 — — 1 2 Minesite sustaining capitalexpenditures 5 74 32 3 49 9 56 14 1 13 6 Rehabilitation - accretion andamortization (operating sites) 6 9 2 2 1 — 2 — — — 1 Non-controlling interests (4) (13) — — — (21) — — — —
All-in sustaining costs $366 $89 $42 $175 $42 $127 $60 $16 $59 $72 Project exploration and evaluationand project costs 4 6 — — — — — — — — — Project capital expenditures 5 34 — 1 — — — — — — — Non-controlling interests — — — — — — — — — —
All-in costs $406 $89 $43 $175 $42 $127 $60 $16 $59 $72 Ounces sold - equity basis (000sounces) 582 198 98 194 69 134 74 13 59 99 Cost of sales per ounce 7,8 $864 $450 $612 $892 $595 $935 $728 $1,264 $912 $772 Cash costs per ounce 8 $478 $341 $379 $642 $484 $679 $625 $1,162 $765 $638 Cash costs per ounce (on a co-productbasis) 8,9 $479 $471 $418 $716 $484 $713 $630 $1,173 $775 $631 All-in sustaining costs per ounce 8 $630 $443 $436 $905 $610 $952 $822 $1,245 $981 $731 All-in sustaining costs per ounce (on aco-product basis) 8,9 $631 $573 $475 $979 $610 $986 $827 $1,256 $991 $724 All-in costs per ounce 8 $696 $443 $447 $905 $610 $953 $822 $1,245 $981 $731 All-in costs per ounce (on a co-productbasis) 8,9 $697 $573 $486 $979 $610 $987 $827 $1,256 $991 $724
BARRICK YEAR-END 2017 75 MANAGEMENT’S DISCUSSION AND ANALYSIS
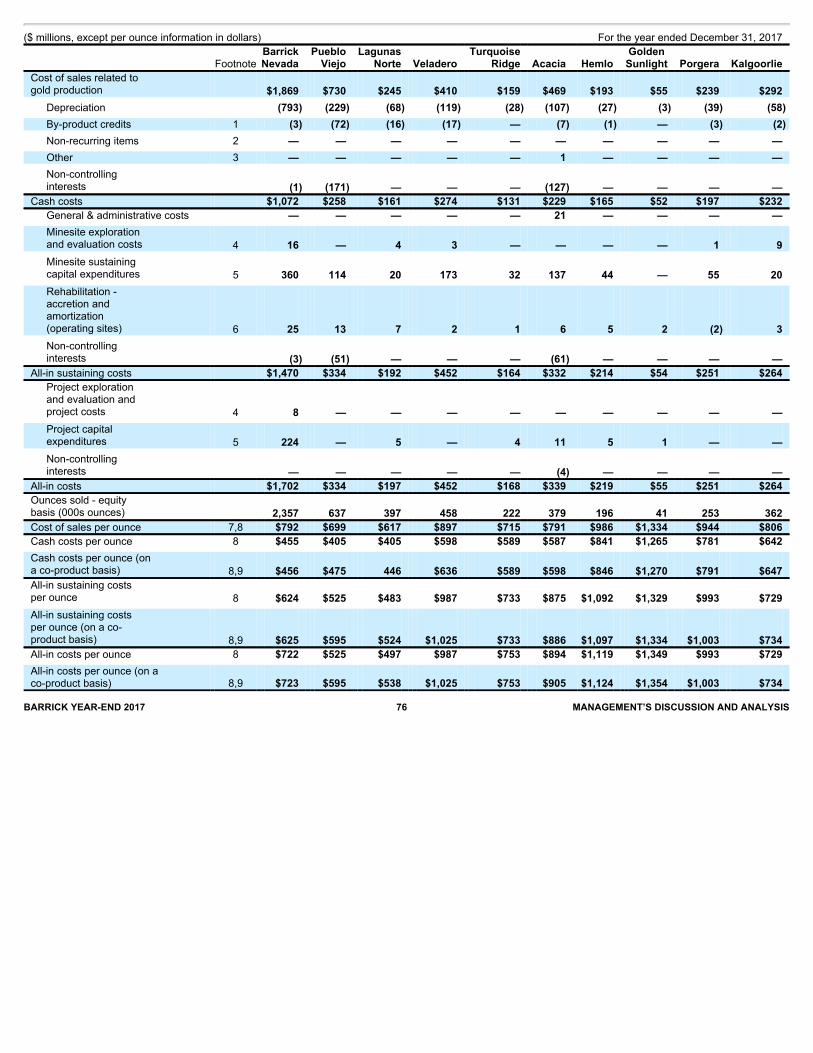
($ millions, except per ounce information in dollars) For the year ended December 31, 2017
Footnote BarrickNevada
PuebloViejo
LagunasNorte Veladero
TurquoiseRidge Acacia Hemlo
Golden Sunlight Porgera Kalgoorlie
Cost of sales related togold production $1,869 $730 $245 $410 $159 $469 $193 $55 $239 $292
Depreciation (793) (229) (68) (119) (28) (107) (27) (3) (39) (58) By-product credits 1 (3) (72) (16) (17) — (7) (1) — (3) (2) Non-recurring items 2 — — — — — — — — — — Other 3 — — — — — 1 — — — — Non-controllinginterests (1) (171) — — — (127) — — — —
Cash costs $1,072 $258 $161 $274 $131 $229 $165 $52 $197 $232 General & administrative costs — — — — — 21 — — — — Minesite explorationand evaluation costs 4 16 — 4 3 — — — — 1 9 Minesite sustainingcapital expenditures 5 360 114 20 173 32 137 44 — 55 20 Rehabilitation -accretion andamortization(operating sites) 6 25 13 7 2 1 6 5 2 (2) 3 Non-controllinginterests (3) (51) — — — (61) — — — —
All-in sustaining costs $1,470 $334 $192 $452 $164 $332 $214 $54 $251 $264 Project explorationand evaluation andproject costs 4 8 — — — — — — — — — Project capitalexpenditures 5 224 — 5 — 4 11 5 1 — — Non-controllinginterests — — — — — (4) — — — —
All-in costs $1,702 $334 $197 $452 $168 $339 $219 $55 $251 $264 Ounces sold - equitybasis (000s ounces) 2,357 637 397 458 222 379 196 41 253 362 Cost of sales per ounce 7,8 $792 $699 $617 $897 $715 $791 $986 $1,334 $944 $806 Cash costs per ounce 8 $455 $405 $405 $598 $589 $587 $841 $1,265 $781 $642 Cash costs per ounce (ona co-product basis) 8,9 $456 $475 446 $636 $589 $598 $846 $1,270 $791 $647 All-in sustaining costsper ounce 8 $624 $525 $483 $987 $733 $875 $1,092 $1,329 $993 $729 All-in sustaining costsper ounce (on a co-product basis) 8,9 $625 $595 $524 $1,025 $733 $886 $1,097 $1,334 $1,003 $734 All-in costs per ounce 8 $722 $525 $497 $987 $753 $894 $1,119 $1,349 $993 $729 All-in costs per ounce (on aco-product basis) 8,9 $723 $595 $538 $1,025 $753 $905 $1,124 $1,354 $1,003 $734
BARRICK YEAR-END 2017 76 MANAGEMENT’S DISCUSSION AND ANALYSIS
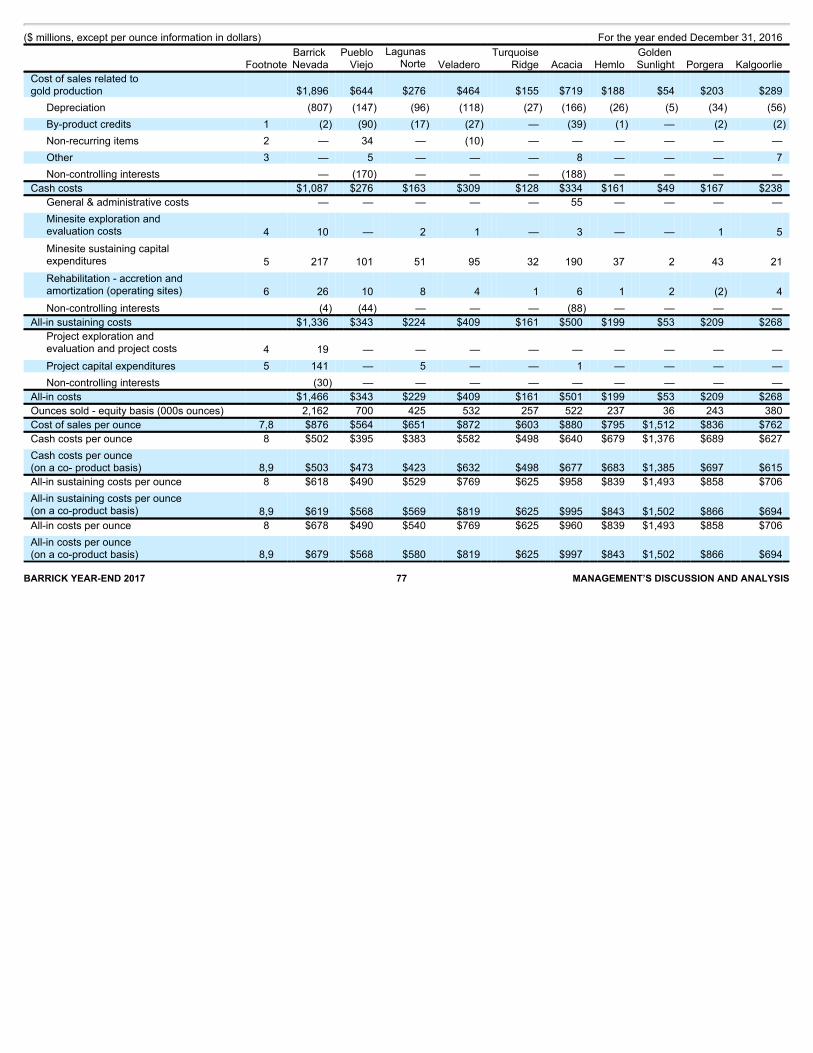
($ millions, except per ounce information in dollars) For the year ended December 31, 2016
Footnote Barrick Nevada
PuebloViejo
LagunasNorte Veladero
TurquoiseRidge Acacia Hemlo
Golden Sunlight Porgera Kalgoorlie
Cost of sales related to gold production $1,896 $644 $276 $464 $155 $719 $188 $54 $203 $289
Depreciation (807) (147) (96) (118) (27) (166) (26) (5) (34) (56) By-product credits 1 (2) (90) (17) (27) — (39) (1) — (2) (2) Non-recurring items 2 — 34 — (10) — — — — — — Other 3 — 5 — — — 8 — — — 7 Non-controlling interests — (170) — — — (188) — — — —
Cash costs $1,087 $276 $163 $309 $128 $334 $161 $49 $167 $238 General & administrative costs — — — — — 55 — — — — Minesite exploration andevaluation costs 4 10 — 2 1 — 3 — — 1 5 Minesite sustaining capitalexpenditures 5 217 101 51 95 32 190 37 2 43 21 Rehabilitation - accretion andamortization (operating sites) 6 26 10 8 4 1 6 1 2 (2) 4 Non-controlling interests (4) (44) — — — (88) — — — —
All-in sustaining costs $1,336 $343 $224 $409 $161 $500 $199 $53 $209 $268 Project exploration andevaluation and project costs 4 19 — — — — — — — — — Project capital expenditures 5 141 — 5 — — 1 — — — — Non-controlling interests (30) — — — — — — — — —
All-in costs $1,466 $343 $229 $409 $161 $501 $199 $53 $209 $268 Ounces sold - equity basis (000s ounces) 2,162 700 425 532 257 522 237 36 243 380 Cost of sales per ounce 7,8 $876 $564 $651 $872 $603 $880 $795 $1,512 $836 $762 Cash costs per ounce 8 $502 $395 $383 $582 $498 $640 $679 $1,376 $689 $627 Cash costs per ounce (on a co- product basis) 8,9 $503 $473 $423 $632 $498 $677 $683 $1,385 $697 $615 All-in sustaining costs per ounce 8 $618 $490 $529 $769 $625 $958 $839 $1,493 $858 $706 All-in sustaining costs per ounce(on a co-product basis) 8,9 $619 $568 $569 $819 $625 $995 $843 $1,502 $866 $694 All-in costs per ounce 8 $678 $490 $540 $769 $625 $960 $839 $1,493 $858 $706 All-in costs per ounce (on a co-product basis) 8,9 $679 $568 $580 $819 $625 $997 $843 $1,502 $866 $694
BARRICK YEAR-END 2017 77 MANAGEMENT’S DISCUSSION AND ANALYSIS
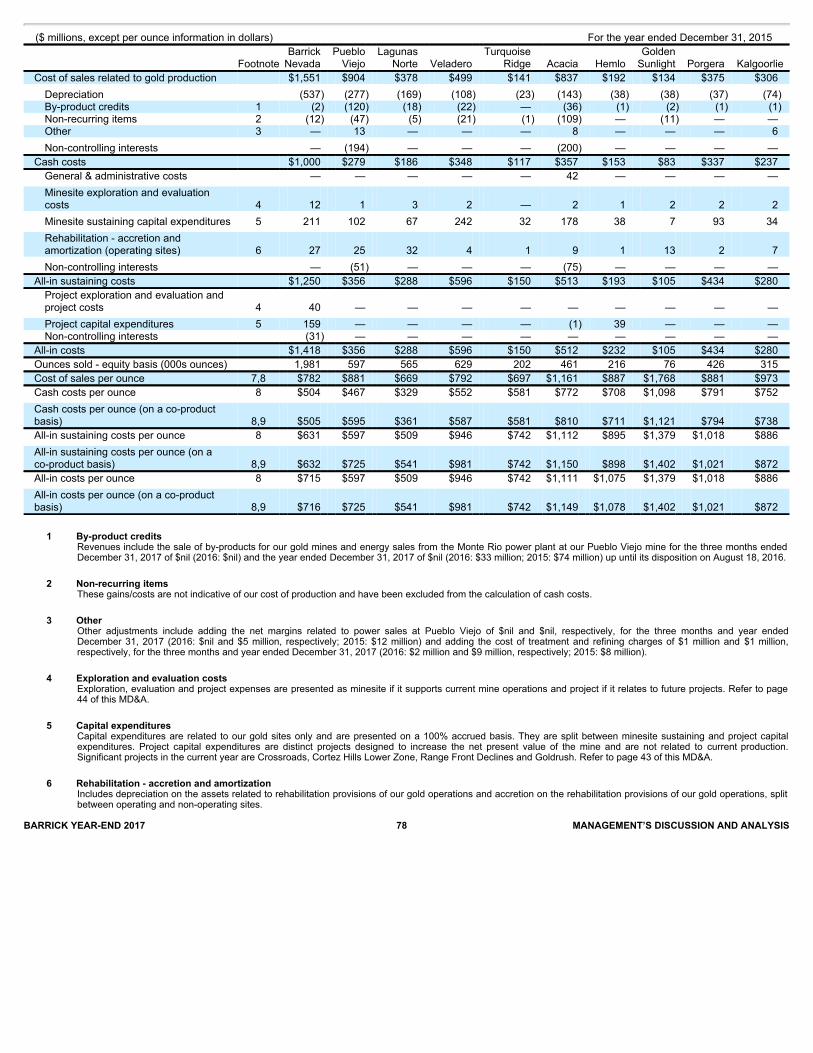
($ millions, except per ounce information in dollars) For the year ended December 31, 2015 Barrick Pueblo Lagunas Turquoise Golden Footnote Nevada Viejo Norte Veladero Ridge Acacia Hemlo Sunlight Porgera Kalgoorlie Cost of sales related to gold production $1,551 $904 $378 $499 $141 $837 $192 $134 $375 $306 Depreciation (537) (277) (169) (108) (23) (143) (38) (38) (37) (74) By-product credits 1 (2) (120) (18) (22) — (36) (1) (2) (1) (1) Non-recurring items 2 (12) (47) (5) (21) (1) (109) — (11) — — Other 3 — 13 — — — 8 — — — 6 Non-controlling interests — (194) — — — (200) — — — —
Cash costs $1,000 $279 $186 $348 $117 $357 $153 $83 $337 $237 General & administrative costs — — — — — 42 — — — — Minesite exploration and evaluationcosts 4 12 1 3 2 — 2 1 2 2 2 Minesite sustaining capital expenditures 5 211 102 67 242 32 178 38 7 93 34 Rehabilitation - accretion andamortization (operating sites) 6 27 25 32 4 1 9 1 13 2 7 Non-controlling interests — (51) — — — (75) — — — —
All-in sustaining costs $1,250 $356 $288 $596 $150 $513 $193 $105 $434 $280 Project exploration and evaluation andproject costs 4 40 — — — — — — — — — Project capital expenditures 5 159 — — — — (1) 39 — — — Non-controlling interests (31) — — — — — — — — —
All-in costs $1,418 $356 $288 $596 $150 $512 $232 $105 $434 $280 Ounces sold - equity basis (000s ounces) 1,981 597 565 629 202 461 216 76 426 315 Cost of sales per ounce 7,8 $782 $881 $669 $792 $697 $1,161 $887 $1,768 $881 $973 Cash costs per ounce 8 $504 $467 $329 $552 $581 $772 $708 $1,098 $791 $752 Cash costs per ounce (on a co-productbasis) 8,9 $505 $595 $361 $587 $581 $810 $711 $1,121 $794 $738 All-in sustaining costs per ounce 8 $631 $597 $509 $946 $742 $1,112 $895 $1,379 $1,018 $886 All-in sustaining costs per ounce (on aco-product basis) 8,9 $632 $725 $541 $981 $742 $1,150 $898 $1,402 $1,021 $872 All-in costs per ounce 8 $715 $597 $509 $946 $742 $1,111 $1,075 $1,379 $1,018 $886 All-in costs per ounce (on a co-productbasis) 8,9 $716 $725 $541 $981 $742 $1,149 $1,078 $1,402 $1,021 $872
1 By-product credits
Revenues include the sale of by-products for our gold mines and energy sales from the Monte Rio power plant at our Pueblo Viejo mine for the three months endedDecember 31, 2017 of $nil (2016: $nil) and the year ended December 31, 2017 of $nil (2016: $33 million; 2015: $74 million) up until its disposition on August 18, 2016.
2 Non-recurring items
These gains/costs are not indicative of our cost of production and have been excluded from the calculation of cash costs. 3 Other
Other adjustments include adding the net margins related to power sales at Pueblo Viejo of $nil and $nil, respectively, for the three months and year endedDecember 31, 2017 (2016: $nil and $5 million, respectively; 2015: $12 million) and adding the cost of treatment and refining charges of $1 million and $1 million,respectively, for the three months and year ended December 31, 2017 (2016: $2 million and $9 million, respectively; 2015: $8 million).
4 Exploration and evaluation costs
Exploration, evaluation and project expenses are presented as minesite if it supports current mine operations and project if it relates to future projects. Refer to page44 of this MD&A.
5 Capital expenditures
Capital expenditures are related to our gold sites only and are presented on a 100% accrued basis. They are split between minesite sustaining and project capitalexpenditures. Project capital expenditures are distinct projects designed to increase the net present value of the mine and are not related to current production.Significant projects in the current year are Crossroads, Cortez Hills Lower Zone, Range Front Declines and Goldrush. Refer to page 43 of this MD&A.
6 Rehabilitation - accretion and amortization
Includes depreciation on the assets related to rehabilitation provisions of our gold operations and accretion on the rehabilitation provisions of our gold operations, splitbetween operating and non-operating sites.
BARRICK YEAR-END 2017 78 MANAGEMENT’S DISCUSSION AND ANALYSIS
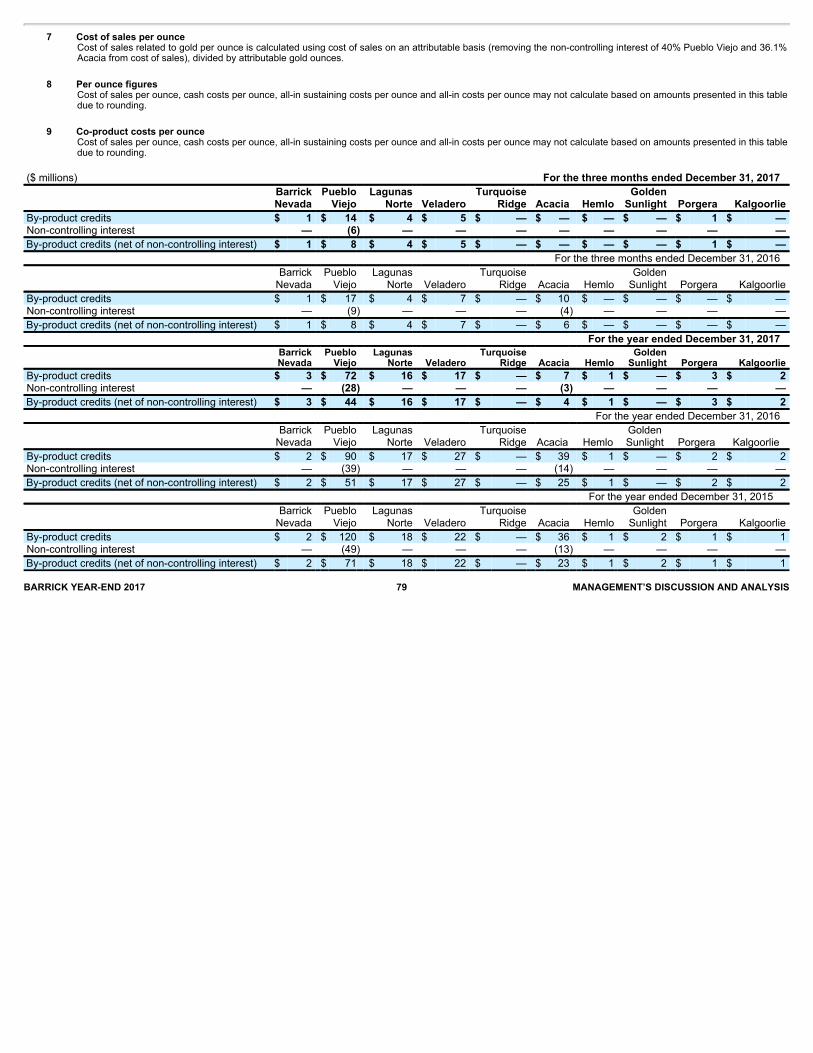
7 Cost of sales per ounceCost of sales related to gold per ounce is calculated using cost of sales on an attributable basis (removing the non-controlling interest of 40% Pueblo Viejo and 36.1%Acacia from cost of sales), divided by attributable gold ounces.
8 Per ounce figures
Cost of sales per ounce, cash costs per ounce, all-in sustaining costs per ounce and all-in costs per ounce may not calculate based on amounts presented in this tabledue to rounding.
9 Co-product costs per ounce
Cost of sales per ounce, cash costs per ounce, all-in sustaining costs per ounce and all-in costs per ounce may not calculate based on amounts presented in this tabledue to rounding.
($ millions) For the three months ended December 31, 2017 Barrick Pueblo Lagunas Turquoise Golden Nevada Viejo Norte Veladero Ridge Acacia Hemlo Sunlight Porgera Kalgoorlie By-product credits $ 1 $ 14 $ 4 $ 5 $ — $ — $ — $ — $ 1 $ — Non-controlling interest — (6) — — — — — — — — By-product credits (net of non-controlling interest) $ 1 $ 8 $ 4 $ 5 $ — $ — $ — $ — $ 1 $ — For the three months ended December 31, 2016 Barrick Pueblo Lagunas Turquoise Golden Nevada Viejo Norte Veladero Ridge Acacia Hemlo Sunlight Porgera Kalgoorlie By-product credits $ 1 $ 17 $ 4 $ 7 $ — $ 10 $ — $ — $ — $ — Non-controlling interest — (9) — — — (4) — — — — By-product credits (net of non-controlling interest) $ 1 $ 8 $ 4 $ 7 $ — $ 6 $ — $ — $ — $ — For the year ended December 31, 2017 Barrick Pueblo Lagunas Turquoise Golden Nevada Viejo Norte Veladero Ridge Acacia Hemlo Sunlight Porgera Kalgoorlie By-product credits $ 3 $ 72 $ 16 $ 17 $ — $ 7 $ 1 $ — $ 3 $ 2 Non-controlling interest — (28) — — — (3) — — — — By-product credits (net of non-controlling interest) $ 3 $ 44 $ 16 $ 17 $ — $ 4 $ 1 $ — $ 3 $ 2 For the year ended December 31, 2016 Barrick Pueblo Lagunas Turquoise Golden Nevada Viejo Norte Veladero Ridge Acacia Hemlo Sunlight Porgera Kalgoorlie By-product credits $ 2 $ 90 $ 17 $ 27 $ — $ 39 $ 1 $ — $ 2 $ 2 Non-controlling interest — (39) — — — (14) — — — — By-product credits (net of non-controlling interest) $ 2 $ 51 $ 17 $ 27 $ — $ 25 $ 1 $ — $ 2 $ 2 For the year ended December 31, 2015 Barrick Pueblo Lagunas Turquoise Golden Nevada Viejo Norte Veladero Ridge Acacia Hemlo Sunlight Porgera Kalgoorlie By-product credits $ 2 $ 120 $ 18 $ 22 $ — $ 36 $ 1 $ 2 $ 1 $ 1 Non-controlling interest — (49) — — — (13) — — — — By-product credits (net of non-controlling interest) $ 2 $ 71 $ 18 $ 22 $ — $ 23 $ 1 $ 2 $ 1 $ 1 BARRICK YEAR-END 2017 79 MANAGEMENT’S DISCUSSION AND ANALYSIS
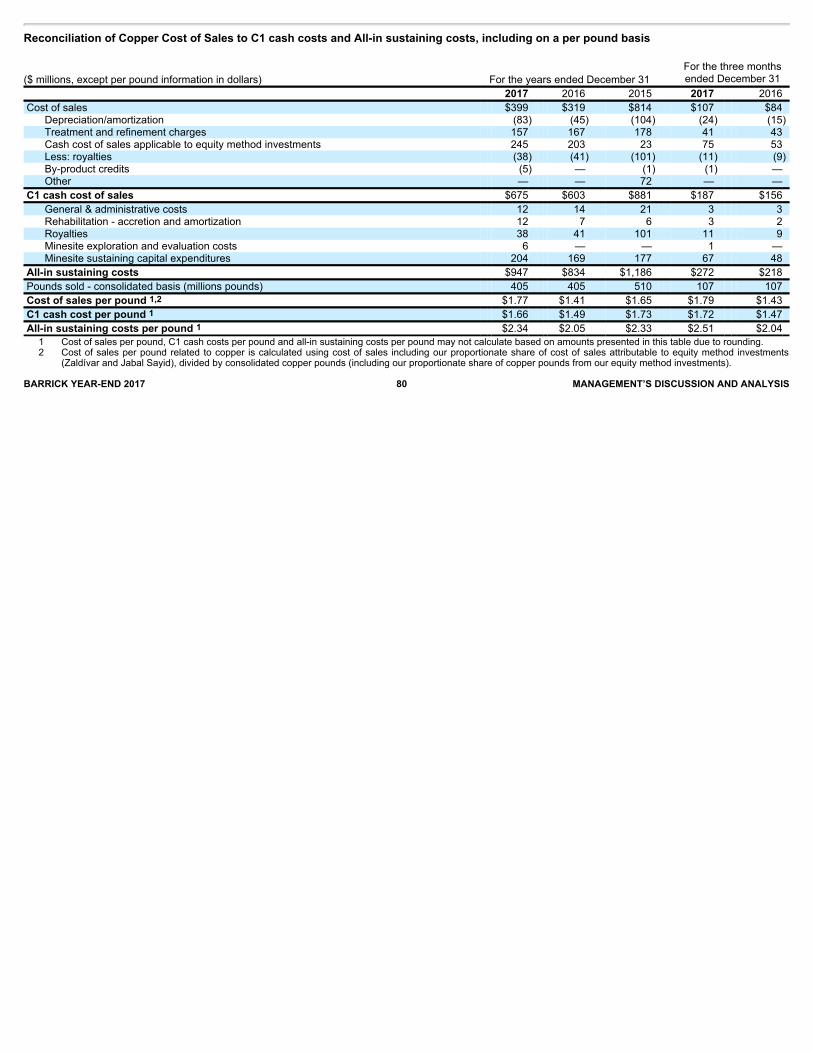
Reconciliation of Copper Cost of Sales to C1 cash costs and All-in sustaining costs, including on a per pound basis
($ millions, except per pound information in dollars) For the years ended December 31 For the three months ended December 31
2017 2016 2015 2017 2016 Cost of sales $399 $319 $814 $107 $84
Depreciation/amortization (83) (45) (104) (24) (15) Treatment and refinement charges 157 167 178 41 43 Cash cost of sales applicable to equity method investments 245 203 23 75 53 Less: royalties (38) (41) (101) (11) (9) By-product credits (5) — (1) (1) — Other — — 72 — —
C1 cash cost of sales $675 $603 $881 $187 $156 General & administrative costs 12 14 21 3 3 Rehabilitation - accretion and amortization 12 7 6 3 2 Royalties 38 41 101 11 9 Minesite exploration and evaluation costs 6 — — 1 — Minesite sustaining capital expenditures 204 169 177 67 48
All-in sustaining costs $947 $834 $1,186 $272 $218 Pounds sold - consolidated basis (millions pounds) 405 405 510 107 107 Cost of sales per pound 1,2 $1.77 $1.41 $1.65 $1.79 $1.43 C1 cash cost per pound 1 $1.66 $1.49 $1.73 $1.72 $1.47 All-in sustaining costs per pound 1 $2.34 $2.05 $2.33 $2.51 $2.04 1 Cost of sales per pound, C1 cash costs per pound and all-in sustaining costs per pound may not calculate based on amounts presented in this table due to rounding. 2 Cost of sales per pound related to copper is calculated using cost of sales including our proportionate share of cost of sales attributable to equity method investments
(Zaldívar and Jabal Sayid), divided by consolidated copper pounds (including our proportionate share of copper pounds from our equity method investments).BARRICK YEAR-END 2017 80 MANAGEMENT’S DISCUSSION AND ANALYSIS

Reconciliation of Copper Cost of Sales to C1 cash costs and All-in sustaining costs, including on a per pound basis, by operating site ($ millions, except per pound information in dollars) For the three months ended December 31 2017 2016 Zaldívar Lumwana Jabal Sayid Zaldívar Lumwana Jabal Sayid Cost of sales 73 104 23 59 84 11 Depreciation/amortization (16) (24) (5) (13) (15) (3) Treatment and refinement charges — 37 4 — 41 2 Less: royalties — (11) — — (9) — By-product credits — — — — — —
C1 cash cost of sales 57 106 22 46 101 10 Rehabilitation - accretion and amortization — 3 — — 3 — Royalties — 11 — — 9 — Minesite exploration and evaluation costs 1 — — — — — Minesite sustaining capital expenditures 21 43 3 16 27 6
All-in sustaining costs 79 163 25 62 140 16 Pounds sold - consolidated basis (millions pounds) 32 65 10 31 70 6 Cost of sales per pound 1,2 2.29 1.60 2.15 1.87 1.20 1.89 C1 cash cost per pound 1 1.78 1.63 2.05 1.46 1.45 1.79 All-in sustaining costs per pound 1 2.45 2.52 2.41 1.97 1.99 2.73
($ millions, except per pound information in dollars) For the years ended December 31 2017 2016 2015
Zaldívar Lumwana Jabal Sayid Zaldívar Lumwana
Jabal Sayid Zaldívar Lumwana
Jabal Sayid
Cost of sales $ 243 $ 396 $ 75 $ 221 $ 319 $ 33 $ 424 $ 418 $ — Depreciation/amortization (55) (83) (17) (44) (45) (6) (50) (59) — Treatment and refinementcharges — 144 14 — 161 6 — 178 — Less: royalties — (38) — — (41) — — (101) — By-product credits — — (5) — — — (1) — — Other — — — — — — — 72 —
C1 cash cost of sales $ 188 $ 419 $ 67 $ 177 $ 394 $ 33 $ 373 $ 508 $ — Rehabilitation - accretion andamortization — 12 — — 7 — 1 5 — Royalties — 38 — — 41 — — 101 — Minesite exploration andevaluation costs 4 2 — — — — — — — Minesite sustaining capitalexpenditures 58 123 23 56 96 17 78 99 —
All-in sustaining costs $ 250 $ 594 $ 90 $ 233 $ 538 $ 50 $ 452 $ 713 $ — Pounds sold - consolidated basis (millions pounds) 113 253 39 114 274 17 215 295 — Cost of sales per pound 1,2 $ 2.15 $ 1.57 $ 1.90 $ 1.93 $ 1.16 $ 1.98 $ 1.97 $ 1.42 $ — C1 cash cost per pound 1 $ 1.66 $ 1.66 $ 1.70 $ 1.55 $ 1.44 $ 1.97 $ 1.74 $ 1.72 $ — All-in sustaining costs per pound 1 $ 2.21 $ 2.35 $ 2.30 $ 2.05 $ 1.97 $ 2.98 $ 2.11 $ 2.42 $ — 1 Cost of sales per pound, C1 cash costs per pound and all-in sustaining costs per pound may not calculate based on amounts presented in this table due to rounding.2 Cost of sales per pound applicable to copper is calculated using cost of sales including our proportionate share of cost of sales attributable to equity method investments
(Zaldívar and Jabal Sayid), divided by consolidated copper pounds (including our proportionate share of copper pounds from our equity method investments).BARRICK YEAR-END 2017 81 MANAGEMENT’S DISCUSSION AND ANALYSIS

Reconciliation of Net Earnings to EBITDA and Adjusted EBITDA ($ millions) For the years ended December 31 For the three months ended December 31 2017 2016 2015 2017 2016 Net earnings (loss) $1,516 $861 ($3,113) ($467) $512 Income tax expense 1,231 917 (31) 51 223 Finance costs, net 1 624 725 663 115 200 Depreciation 1,647 1,574 1,771 434 418
EBITDA $5,018 $4,077 ($710) $133 $1,353 Impairment charges (reversals) of long-lived assets 2 (212) (250) 3,897 916 (304) Acquisition/disposition (gains)/losses 3 (911) 42 (187) (29) 7 Foreign currency translation (gains)/losses 72 199 120 12 18 Other expense adjustments 4 51 (15) 203 17 (20) Unrealized gains on non-hedge derivative instruments (1) (32) 11 5 (9) Adjusted EBITDA $4,017 $4,021 $3,334 $1,054 $1,045 1 Finance costs exclude accretion.
2 Net impairment reversals for the current year primarily relate to impairment reversals at the Cerro Casale project upon reclassification of the project’s net assets as
held-for-sale as at March 31, 2017 and impairment reversals at Lumwana during the fourth quarter of 2017, partially offset by net impairments at Acacia’s Bulyanhulu mineand the Pascua-Lama project during the fourth quarter of 2017.
3 Disposition gains for the current year primarily relate to the sale of a 50% interest in the Veladero mine and the gain related to the sale of a 25% interest in the Cerro Casaleproject.
4 Other expense adjustments primarily consist of reduced operations program costs at Acacia’s Bulyanhulu mine.BARRICK YEAR-END 2017 82 MANAGEMENT’S DISCUSSION AND ANALYSIS
EBITDA and Adjusted EBITDA
EBITDA is a non-GAAP financial measure, which excludes the followingfrom net earnings: ● Income tax expense; ● Finance costs; ● Finance income; and ● Depreciation.
Management believes that EBITDA is a valuable indicator of our abilityto generate liquidity by producing operating cash flow to fund workingcapital needs, service debt obligations, and fund capital expenditures.Management uses EBITDA for this purpose. EBITDA is also frequentlyused by investors and analysts for valuation purposes whereby EBITDAis multiplied by a factor or “EBITDA multiple” that is based on anobserved or inferred relationship between EBITDA and market values todetermine the approximate total enterprise value of a company.
Adjusted EBITDA removes the effect of “impairment charges” andstarting in the second quarter 2017 MD&A, we began includingadditional adjusting items in the Adjusted EBITDA reconciliation toprovide a greater level of consistency with the adjusting items included inour Adjusted Net Earnings reconciliation. These new items include:acquisition/disposition gains/losses; foreign
currency translation gains/losses; other expense adjustments; andunrealized gains on non-hedge derivative instruments. These amounts areadjusted to remove any impact on finance costs/income, income taxexpense and/or depreciation as they do not affect EBITDA. The priorperiods have been restated to reflect the change in presentation. Webelieve this additional information will assist analysts, investors and otherstakeholders of Barrick in better understanding our ability to generateliquidity from operating cash flow, by excluding these amounts from thecalculation as they are not indicative of the performance of our coremining business and not necessarily reflective of the underlying operatingresults for the periods presented.
EBITDA and adjusted EBITDA are intended to provide additionalinformation to investors and analysts and do not have any standardizeddefinition under IFRS, and should not be considered in isolation or as asubstitute for measures of performance prepared in accordance withIFRS. EBITDA and adjusted EBITDA exclude the impact of cash costs offinancing activities and taxes, and the effects of changes in operatingworking capital balances, and therefore are not necessarily indicative ofoperating profit or cash flow from operations as determined under IFRS.Other companies may calculate EBITDA and adjusted EBITDA differently.
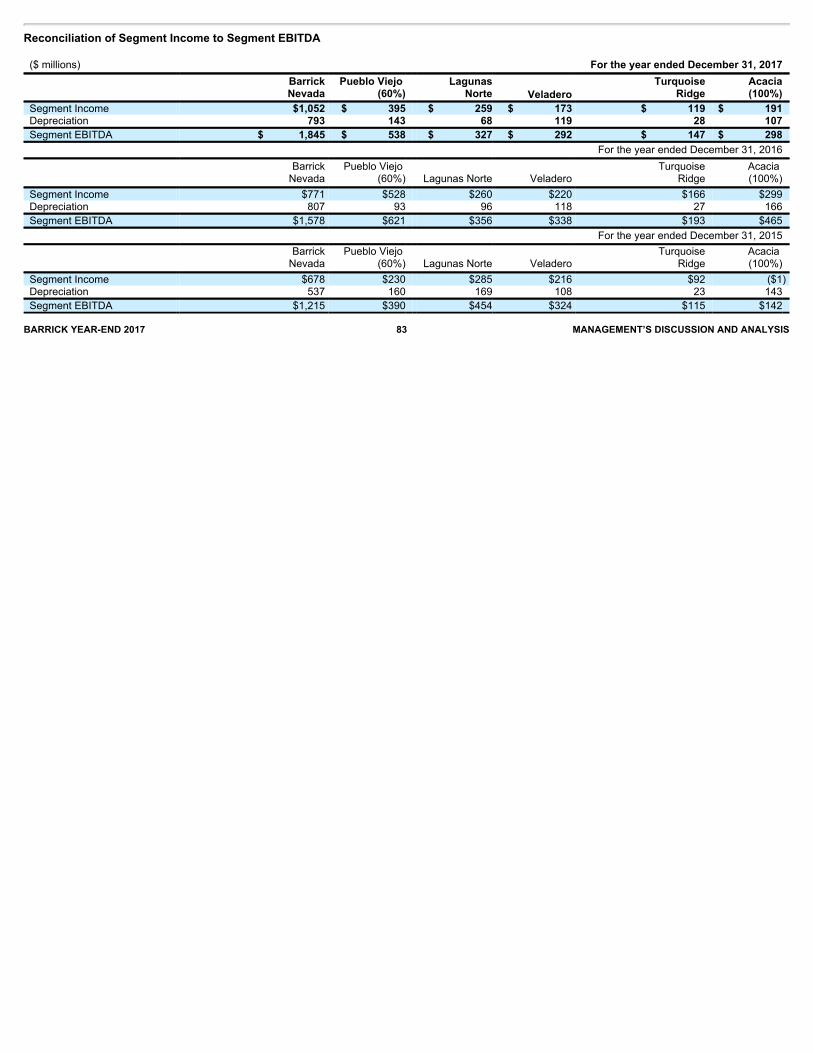
Reconciliation of Segment Income to Segment EBITDA ($ millions) For the year ended December 31, 2017
BarrickNevada
Pueblo Viejo (60%)
LagunasNorte Veladero
TurquoiseRidge
Acacia(100%)
Segment Income $1,052 $ 395 $ 259 $ 173 $ 119 $ 191 Depreciation 793 143 68 119 28 107 Segment EBITDA $ 1,845 $ 538 $ 327 $ 292 $ 147 $ 298
For the year ended December 31, 2016
BarrickNevada
Pueblo Viejo (60%)
Lagunas Norte
Veladero
Turquoise
Ridge
Acacia (100%)
Segment Income $771 $528 $260 $220 $166 $299 Depreciation 807 93 96 118 27 166 Segment EBITDA $1,578 $621 $356 $338 $193 $465
For the year ended December 31, 2015
BarrickNevada
Pueblo Viejo
(60%)
Lagunas Norte
Veladero
Turquoise
Ridge
Acacia (100%)
Segment Income $678 $230 $285 $216 $92 ($1) Depreciation 537 160 169 108 23 143 Segment EBITDA $1,215 $390 $454 $324 $115 $142 BARRICK YEAR-END 2017 83 MANAGEMENT’S DISCUSSION AND ANALYSIS

Reconciliation of Sales to Realized Price per ounce/pound
For the years ended December 31 ($ millions, except per ounce/pound information in dollars) Gold Copper 2017 2016 2015 2017 2016 2015 Sales $7,631 $7,908 $7,813 $608 $466 $1,002 Sales applicable to non-controlling interests (810) (948) (826) — — — Sales applicable to equity method investments 1,2 — — — 427 293 26 Realized non-hedge gold/copper derivative (losses) gains 3 (2) — — — — Sales applicable to Pierina 3 (153) (112) — — — — Treatment and refinement charges 1 16 14 157 167 178 Export duties — 2 34 — — — Revenues - as adjusted $6,672 $6,864 $7,035 $1,192 $926 $1,206 Ounces/pounds sold (000s ounces/millions pounds) 3 5,302 5,503 6,083 405 405 510 Realized gold/copper price per ounce/pound 4 $1,258 $1,248 $1,157 $2.95 $2.29 $2.37
1 Represents sales of $325 million for the year ended December 31, 2017 (2016: $259 million; 2015: $26 million) applicable to our 50% equity method investment inZaldívar and $116 million (2016: $40 million; 2015: $nil) applicable to our 50% equity method investment in Jabal Sayid.
2 Sales applicable to equity method investments are net of treatment and refinement charges. 3 Figures exclude Pierina from the calculation of realized price per ounce, which is mining incidental ounces as it enters closure. 4 Realized price per ounce/pound may not calculate based on amounts presented in this table due to rounding.BARRICK YEAR-END 2017 84 MANAGEMENT’S DISCUSSION AND ANALYSIS
Realized Price
Realized price is a non-GAAP financial measure which excludes fromsales:
● Unrealized gains and losses on non-hedge derivativecontracts;
● Unrealized mark-to-market gains and losses on provisional
pricing from copper and gold sales contracts; ● Sales attributable to ore purchase arrangements; ● Treatment and refining charges; and ● Export duties.
This measure is intended to enable Management to better understandthe price realized in each reporting period for gold and copper salesbecause unrealized mark-to-market values of non-hedge gold andcopper derivatives are subject to change each period due to changes inmarket factors such as market and forward gold and copper prices, sothat prices ultimately realized may differ from those recorded. Theexclusion of such unrealized mark-to-market gains and losses from thepresentation of this performance measure enables investors tounderstand performance based on the realized proceeds of selling goldand copper production.
The gains and losses on non-hedge derivatives and receivable balancesrelate to instruments/balances that
mature in future periods, at which time the gains and losses will becomerealized. The amounts of these gains and losses reflect fair values basedon market valuation assumptions at the end of each period and do notnecessarily represent the amounts that will become realized on maturity.We also exclude export duties that are paid upon sale and netted againstrevenues as well as treatment and refining charges that are paid to therefiner on gold and copper concentrate sales that are netted againstrevenues. We believe this provides investors and analysts with a moreaccurate measure with which to compare to market gold prices and toassess our gold sales performance. For those reasons, managementbelieves that this measure provides a more accurate reflection of ourCompany’s past performance and is a better indicator of its expectedperformance in future periods.
The realized price measure is intended to provide additional information,and does not have any standardized definition under IFRS and should notbe considered in isolation or as a substitute for measures of performanceprepared in accordance with IFRS. The measure is not necessarilyindicative of sales as determined under IFRS. Other companies maycalculate this measure differently. The following table reconciles realizedprices to the most directly comparable IFRS measure.
TECHNICAL INFORMATION
The scientific and technical information contained in this MD&A has been reviewed and approved by Steven Haggarty, P. Eng., Senior Director,Metallurgy of Barrick; Rick Sims, Registered Member SME, Vice President, Reserves and Resources of Barrick; and Patrick Garretson, RegisteredMember SME, Senior Director, Life of Mine Planning of Barrick who are each a “Qualified Person” as defined in National Instrument 43-101 - Standardsof Disclosure for Mineral Projects.
ENDNOTES1 These are non-GAAP financial performance measures with no standardized meaning under IFRS and therefore may not be comparable to
similar measures presented by other issuers. For further information and a detailed reconciliation of each non-GAAP measure to the mostdirectly comparable IFRS measure, please see pages 69 to 84 of this MD&A.
2 Amount excludes capital leases and includes Acacia (100% basis).
3 Includes $87 million cash primarily held at Acacia, which may not be readily deployed.
4 Cost of sales related to gold per ounce is calculated using cost of sales related to gold on an attributable basis (removing the non-controllinginterest of 40% Pueblo Viejo and 36.1% Acacia from cost of sales), divided by attributable gold ounces. Cost of sales related to copper perpound is calculated using cost of sales related to copper including our proportionate share of cost of sales attributable to equity methodinvestments (Zaldívar and Jabal Sayid), divided by consolidated copper pounds (including our proportionate share of copper pounds from ourequity method investments).
5 Total reportable incident frequency rate (TRIFR) is a ratio calculated as follows: number of reportable injuries x 200,000 hours divided by thetotal number of hours worked. Reportable injuries include fatalities, lost time injuries, restricted duty injuries, and medically treated injuries.
6 Estimated in accordance with National Instrument 43-101 as required by Canadian securities regulatory authorities. Estimates are as ofDecember 31, 2017, unless otherwise noted. Proven reserves of 398.2 million tonnes grading 1.91 g/t, representing 24.4 million ounces of gold,and 170.7 million tonnes grading 0.556%, representing 2.095 billion pounds of copper. Probable reserves of 0.9 billion tonnes grading 1.39 g/t,representing 40.0 million ounces of gold, and 456.7 million tonnes grading 0.592%, representing 5.956 billion pounds of copper. Measuredresources of 400.0 million tonnes grading 0.92 g/t, representing 11.8 million ounces of gold, and 90.9 million tonnes grading 0.401%,representing 803.1 million pounds of copper. Indicated resources of 1.6 billion tonnes grading 1.54 g/t, representing 76.8 million ounces of gold,and 581.2 million tonnes grading 0.506%, representing 6.484 billion pounds of copper. Inferred resources of 795.4 million tonnes grading 1.21g/t, representing 30.8 million ounces of gold, and 125.4 million tonnes grading 0.482%, representing 1.331 billion pounds of copper. Pascua-Lama measured resources of 42.8 million tonnes grading 1.86 g/t representing 2.6 ounces of gold, and indicated resources of 391.7 tonnesgrading 1.49 g/t, representing 18.8 ounces of gold. Goldrush probable reserves of 5.7 tonnes grading 8.12 g/t, representing 1.5 ounces of gold.Norte Abierto (formerly known as the Cerro Casale project, comprised of the Cerro Casale, Caspiche and Luciano deposits) proven reserves of114.9 million tonnes grading 0.65 g/t (50 percent basis) representing 2.4 million ounces of gold (50 percent basis), and probable reserves of484.0 million tonnes grading 0.59 g/t (50 percent basis), representing 9.2 million ounces of gold (50 percent basis). Norte Abierto measuredresources of 310.1 million tonnes grading 0.57 g/t (50 percent basis) representing 5.7 million ounces of gold (50 percent basis, indicatedresources of 391.8 million tonnes grading 0.47 g/t (50 percent basis) representing 6.0 million ounces of gold (50 percent basis), and inferredresources of 99.1 million tonnes grading 0.29 g/t (50 percent basis) representing 0.9 million ounces of gold (50 percent basis). Complete mineralreserve and mineral resource data for all mines and projects referenced in this MD&A, including tonnes, grades, and ounces, can be found onpages 87-92 of Barrick’s Fourth Quarter and Year-End 2017 Report.
BARRICK YEAR-END 2017 85 MANAGEMENT’S DISCUSSION AND ANALYSIS
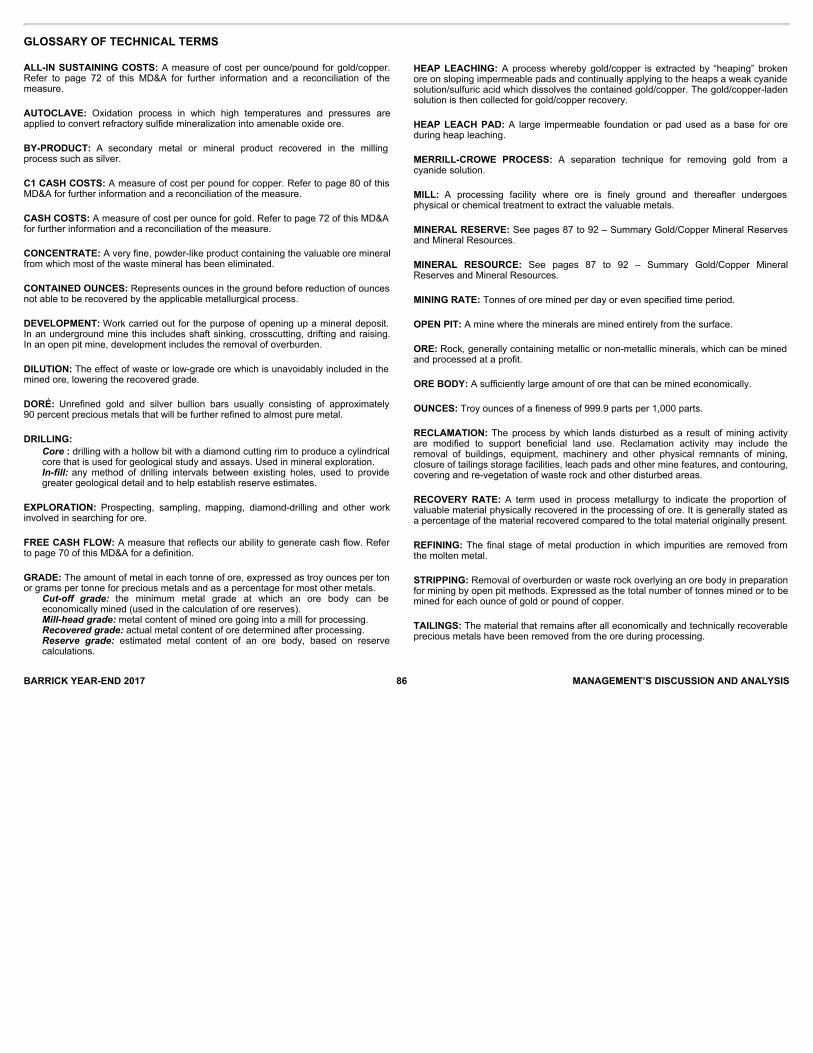
BARRICK YEAR-END 2017 86 MANAGEMENT’S DISCUSSION AND ANALYSIS
GLOSSARY OF TECHNICAL TERMS
ALL-IN SUSTAINING COSTS: A measure of cost per ounce/pound for gold/copper.Refer to page 72 of this MD&A for further information and a reconciliation of themeasure.
AUTOCLAVE: Oxidation process in which high temperatures and pressures areapplied to convert refractory sulfide mineralization into amenable oxide ore.
BY-PRODUCT: A secondary metal or mineral product recovered in the millingprocess such as silver.
C1 CASH COSTS: A measure of cost per pound for copper. Refer to page 80 of thisMD&A for further information and a reconciliation of the measure.
CASH COSTS: A measure of cost per ounce for gold. Refer to page 72 of this MD&Afor further information and a reconciliation of the measure.
CONCENTRATE: A very fine, powder-like product containing the valuable ore mineralfrom which most of the waste mineral has been eliminated.
CONTAINED OUNCES: Represents ounces in the ground before reduction of ouncesnot able to be recovered by the applicable metallurgical process.
DEVELOPMENT: Work carried out for the purpose of opening up a mineral deposit.In an underground mine this includes shaft sinking, crosscutting, drifting and raising.In an open pit mine, development includes the removal of overburden.
DILUTION: The effect of waste or low-grade ore which is unavoidably included in themined ore, lowering the recovered grade.
DORÉ: Unrefined gold and silver bullion bars usually consisting of approximately90 percent precious metals that will be further refined to almost pure metal.
DRILLING:Core: drilling with a hollow bit with a diamond cutting rim to produce a cylindricalcore that is used for geological study and assays. Used in mineral exploration.In-fill:any method of drilling intervals between existing holes, used to providegreater geological detail and to help establish reserve estimates.
EXPLORATION: Prospecting, sampling, mapping, diamond-drilling and other workinvolved in searching for ore.
FREE CASH FLOW: A measure that reflects our ability to generate cash flow. Referto page 70 of this MD&A for a definition.
GRADE: The amount of metal in each tonne of ore, expressed as troy ounces per tonor grams per tonne for precious metals and as a percentage for most other metals.
Cut-off grade: the minimum metal grade at which an ore body can beeconomically mined (used in the calculation of ore reserves).Mill-headgrade:metal content of mined ore going into a mill for processing.Recoveredgrade:actual metal content of ore determined after processing.Reserve grade: estimated metal content of an ore body, based on reservecalculations.
HEAP LEACHING: A process whereby gold/copper is extracted by “heaping” brokenore on sloping impermeable pads and continually applying to the heaps a weak cyanidesolution/sulfuric acid which dissolves the contained gold/copper. The gold/copper-ladensolution is then collected for gold/copper recovery.
HEAP LEACH PAD: A large impermeable foundation or pad used as a base for oreduring heap leaching.
MERRILL-CROWE PROCESS: A separation technique for removing gold from acyanide solution.
MILL: A processing facility where ore is finely ground and thereafter undergoesphysical or chemical treatment to extract the valuable metals.
MINERAL RESERVE: See pages 87 to 92 – Summary Gold/Copper Mineral Reservesand Mineral Resources.
MINERAL RESOURCE: See pages 87 to 92 – Summary Gold/Copper MineralReserves and Mineral Resources.
MINING RATE: Tonnes of ore mined per day or even specified time period.
OPEN PIT: A mine where the minerals are mined entirely from the surface.
ORE: Rock, generally containing metallic or non-metallic minerals, which can be minedand processed at a profit.
ORE BODY: A sufficiently large amount of ore that can be mined economically.
OUNCES: Troy ounces of a fineness of 999.9 parts per 1,000 parts.
RECLAMATION: The process by which lands disturbed as a result of mining activityare modified to support beneficial land use. Reclamation activity may include theremoval of buildings, equipment, machinery and other physical remnants of mining,closure of tailings storage facilities, leach pads and other mine features, and contouring,covering and re-vegetation of waste rock and other disturbed areas.
RECOVERY RATE: A term used in process metallurgy to indicate the proportion ofvaluable material physically recovered in the processing of ore. It is generally stated asa percentage of the material recovered compared to the total material originally present.
REFINING: The final stage of metal production in which impurities are removed fromthe molten metal.
STRIPPING: Removal of overburden or waste rock overlying an ore body in preparationfor mining by open pit methods. Expressed as the total number of tonnes mined or to bemined for each ounce of gold or pound of copper.
TAILINGS: The material that remains after all economically and technically recoverableprecious metals have been removed from the ore during processing.

Mineral Reserves and Mineral ResourcesGOLD MINERAL RESERVES (1,2)As at December 31, 2017 PROVEN PROBABLE TOTAL
Tonnes Grade Contained ozs Tonnes Grade Contained ozs Tonnes Grade Contained ozs Based on attributable ounces (000’s) (gm/t) (000’s) (000’s) (gm/t) (000’s) (000’s) (gm/t) (000’s) NORTH AMERICA
Goldstrike Open Pit 50,013 2.82 4,537 9,198 3.78 1,117 59,211 2.97 5,654 Goldstrike Underground 3,982 11.49 1,471 4,599 8.75 1,294 8,581 10.02 2,765
Goldstrike Property Total 53,995 3.46 6,008 13,797 5.44 2,411 67,792 3.86 8,419 Pueblo Viejo (60.00%) 62,137 2.67 5,335 19,222 3.06 1,889 81,359 2.76 7,224 Cortez 19,145 1.46 898 148,775 1.92 9,188 167,920 1.87 10,086 Goldrush — — — 5,671 8.12 1,481 5,671 8.12 1,481 Turquoise Ridge (75.00%) 7,082 15.56 3,544 4,689 15.48 2,334 11,771 15.53 5,878 South Arturo (60.00%) 2,267 3.28 239 1,557 2.52 126 3,824 2.97 365 Hemlo 935 3.66 110 23,993 2.16 1,664 24,928 2.21 1,774 Golden Sunlight 270 1.15 10 182 3.42 20 452 2.06 30
SOUTH AMERICA Cerro Casale (50.00%) (3) 114,851 0.65 2,391 483,950 0.59 9,232 598,801 0.60 11,623 Veladero (50.00%) (4) 14,198 0.72 330 99,716 0.78 2,486 113,914 0.77 2,816 Lagunas Norte 25,719 2.23 1,840 29,711 2.27 2,165 55,430 2.25 4,005
AUSTRALIA PACIFIC Porgera (47.50%) 635 9.21 188 12,620 4.56 1,850 13,255 4.78 2,038 Kalgoorlie (50.00%) 75,145 0.89 2,161 23,915 2.21 1,697 99,060 1.21 3,858
AFRICA Bulyanhulu (63.90%) 1,864 10.66 639 10,716 6.86 2,362 12,580 7.42 3,001 North Mara (63.90%) 5,298 2.40 408 11,628 2.89 1,080 16,926 2.73 1,488 Buzwagi (63.90%) 9,108 0.92 269 — — — 9,108 0.92 269
OTHER 5,556 0.21 38 6,282 0.25 51 11,838 0.23 89 TOTAL 398,205 1.91 24,408 896,424 1.39 40,036 1,294,629 1.55 64,444
COPPER MINERAL RESERVES (1)
As at December 31, 2017 PROVEN PROBABLE TOTAL
Tonnes Grade Contained lbs Tonnes Grade Contained lbs Tonnes Grade Contained lbs Based on attributable pounds (000’s) (%) (millions) (000’s) (%) (millions) (000’s) (%) (millions) Zaldívar (50.00%) 132,477 0.493 1,440.3 81,757 0.538 970.4 214,234 0.510 2,410.7 Lumwana 32,711 0.503 362.9 368,685 0.572 4,651.1 401,396 0.567 5,014.0 Jabal Sayid (50.00%) 5,556 2.380 291.5 6,282 2.418 334.9 11,838 2.400 626.4
TOTAL 170,744 0.556 2,094.7 456,724 0.592 5,956.4 627,468 0.582 8,051.1 (1) See accompanying endnote #1.(2) See accompanying endnote #2.(3) See accompanying endnote #3.(4) See accompanying endnote #4.BARRICK YEAR-END 2017 87 RESERVES AND RESOURCES
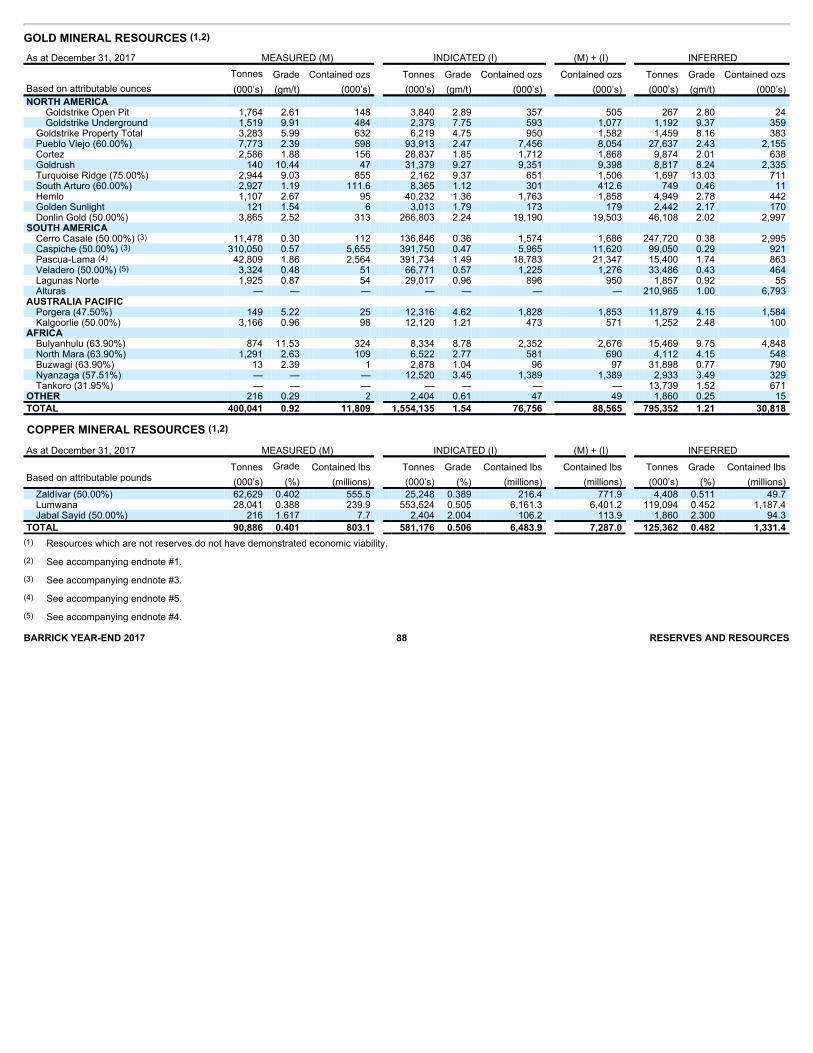
GOLD MINERAL RESOURCES (1,2) As at December 31, 2017 MEASURED (M) INDICATED (I) (M) + (I) INFERRED
Tonnes Grade Contained ozs Tonnes Grade Contained ozs Contained ozs Tonnes Grade Contained ozs Based on attributable ounces (000’s) (gm/t) (000’s) (000’s) (gm/t) (000’s) (000’s) (000’s) (gm/t) (000’s) NORTH AMERICA
Goldstrike Open Pit 1,764 2.61 148 3,840 2.89 357 505 267 2.80 24 Goldstrike Underground 1,519 9.91 484 2,379 7.75 593 1,077 1,192 9.37 359
Goldstrike Property Total 3,283 5.99 632 6,219 4.75 950 1,582 1,459 8.16 383 Pueblo Viejo (60.00%) 7,773 2.39 598 93,913 2.47 7,456 8,054 27,637 2.43 2,155 Cortez 2,586 1.88 156 28,837 1.85 1,712 1,868 9,874 2.01 638 Goldrush 140 10.44 47 31,379 9.27 9,351 9,398 8,817 8.24 2,335 Turquoise Ridge (75.00%) 2,944 9.03 855 2,162 9.37 651 1,506 1,697 13.03 711 South Arturo (60.00%) 2,927 1.19 111.6 8,365 1.12 301 412.6 749 0.46 11 Hemlo 1,107 2.67 95 40,232 1.36 1,763 1,858 4,949 2.78 442 Golden Sunlight 121 1.54 6 3,013 1.79 173 179 2,442 2.17 170 Donlin Gold (50.00%) 3,865 2.52 313 266,803 2.24 19,190 19,503 46,108 2.02 2,997
SOUTH AMERICA Cerro Casale (50.00%) (3) 11,478 0.30 112 136,846 0.36 1,574 1,686 247,720 0.38 2,995 Caspiche (50.00%) (3) 310,050 0.57 5,655 391,750 0.47 5,965 11,620 99,050 0.29 921 Pascua-Lama (4) 42,809 1.86 2,564 391,734 1.49 18,783 21,347 15,400 1.74 863 Veladero (50.00%) (5) 3,324 0.48 51 66,771 0.57 1,225 1,276 33,486 0.43 464 Lagunas Norte 1,925 0.87 54 29,017 0.96 896 950 1,857 0.92 55 Alturas — — — — — — — 210,965 1.00 6,793
AUSTRALIA PACIFIC Porgera (47.50%) 149 5.22 25 12,316 4.62 1,828 1,853 11,879 4.15 1,584 Kalgoorlie (50.00%) 3,166 0.96 98 12,120 1.21 473 571 1,252 2.48 100
AFRICA Bulyanhulu (63.90%) 874 11.53 324 8,334 8.78 2,352 2,676 15,469 9.75 4,848 North Mara (63.90%) 1,291 2.63 109 6,522 2.77 581 690 4,112 4.15 548 Buzwagi (63.90%) 13 2.39 1 2,878 1.04 96 97 31,898 0.77 790 Nyanzaga (57.51%) — — — 12,520 3.45 1,389 1,389 2,933 3.49 329 Tankoro (31.95%) — — — — — — — 13,739 1.52 671
OTHER 216 0.29 2 2,404 0.61 47 49 1,860 0.25 15 TOTAL 400,041 0.92 11,809 1,554,135 1.54 76,756 88,565 795,352 1.21 30,818
COPPER MINERAL RESOURCES (1,2) As at December 31, 2017 MEASURED (M) INDICATED (I) (M) + (I) INFERRED
Tonnes
Grade Contained lbs Tonnes Grade Contained lbs Contained lbs Tonnes Grade Contained lbs Based on attributable pounds (000’s) (%) (millions) (000’s) (%) (millions) (millions) (000’s) (%) (millions) Zaldívar (50.00%) 62,629 0.402 555.5 25,248 0.389 216.4 771.9 4,408 0.511 49.7 Lumwana 28,041 0.388 239.9 553,524 0.505 6,161.3 6,401.2 119,094 0.452 1,187.4 Jabal Sayid (50.00%) 216 1.617 7.7 2,404 2.004 106.2 113.9 1,860 2.300 94.3
TOTAL 90,886 0.401 803.1 581,176 0.506 6,483.9 7,287.0 125,362 0.482 1,331.4 (1) Resources which are not reserves do not have demonstrated economic viability.(2) See accompanying endnote #1.(3) See accompanying endnote #3.(4) See accompanying endnote #5.(5) See accompanying endnote #4.BARRICK YEAR-END 2017 88 RESERVES AND RESOURCES
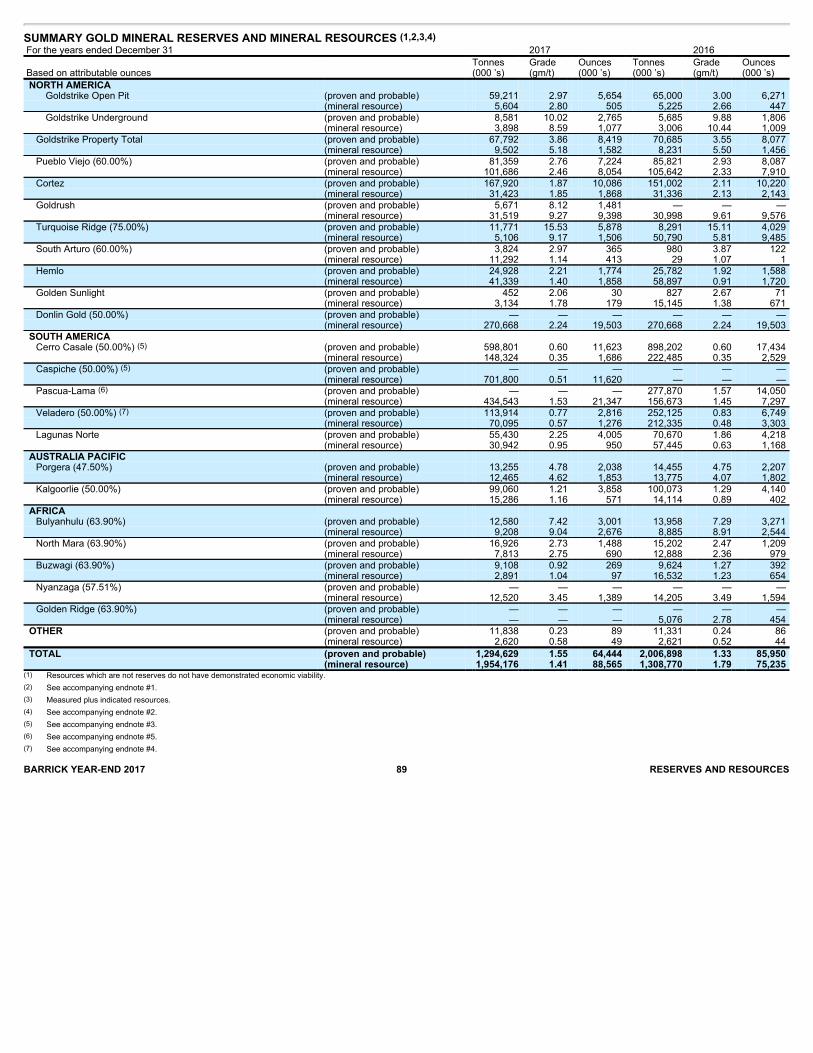
SUMMARY GOLD MINERAL RESERVES AND MINERAL RESOURCES (1,2,3,4) For the years ended December 31 2017 2016
Based on attributable ounces Tonnes (000 ’s)
Grade (gm/t)
Ounces (000 ’s)
Tonnes (000 ’s)
Grade (gm/t)
Ounces (000 ’s)
NORTH AMERICA Goldstrike Open Pit (proven and probable) 59,211 2.97 5,654 65,000 3.00 6,271
(mineral resource) 5,604 2.80 505 5,225 2.66 447 Goldstrike Underground (proven and probable) 8,581 10.02 2,765 5,685 9.88 1,806
(mineral resource) 3,898 8.59 1,077 3,006 10.44 1,009 Goldstrike Property Total (proven and probable) 67,792 3.86 8,419 70,685 3.55 8,077
(mineral resource) 9,502 5.18 1,582 8,231 5.50 1,456 Pueblo Viejo (60.00%) (proven and probable) 81,359 2.76 7,224 85,821 2.93 8,087
(mineral resource) 101,686 2.46 8,054 105,642 2.33 7,910 Cortez (proven and probable) 167,920 1.87 10,086 151,002 2.11 10,220
(mineral resource) 31,423 1.85 1,868 31,336 2.13 2,143 Goldrush (proven and probable) 5,671 8.12 1,481 — — —
(mineral resource) 31,519 9.27 9,398 30,998 9.61 9,576 Turquoise Ridge (75.00%) (proven and probable) 11,771 15.53 5,878 8,291 15.11 4,029
(mineral resource) 5,106 9.17 1,506 50,790 5.81 9,485 South Arturo (60.00%) (proven and probable) 3,824 2.97 365 980 3.87 122
(mineral resource) 11,292 1.14 413 29 1.07 1 Hemlo (proven and probable) 24,928 2.21 1,774 25,782 1.92 1,588
(mineral resource) 41,339 1.40 1,858 58,897 0.91 1,720 Golden Sunlight (proven and probable) 452 2.06 30 827 2.67 71
(mineral resource) 3,134 1.78 179 15,145 1.38 671 Donlin Gold (50.00%) (proven and probable) — — — — — —
(mineral resource) 270,668 2.24 19,503 270,668 2.24 19,503 SOUTH AMERICA Cerro Casale (50.00%) (5) (proven and probable) 598,801 0.60 11,623 898,202 0.60 17,434
(mineral resource) 148,324 0.35 1,686 222,485 0.35 2,529 Caspiche (50.00%) (5) (proven and probable) — — — — — —
(mineral resource) 701,800 0.51 11,620 — — — Pascua-Lama (6) (proven and probable) — — — 277,870 1.57 14,050
(mineral resource) 434,543 1.53 21,347 156,673 1.45 7,297 Veladero (50.00%) (7) (proven and probable) 113,914 0.77 2,816 252,125 0.83 6,749
(mineral resource) 70,095 0.57 1,276 212,335 0.48 3,303 Lagunas Norte (proven and probable) 55,430 2.25 4,005 70,670 1.86 4,218
(mineral resource) 30,942 0.95 950 57,445 0.63 1,168 AUSTRALIA PACIFIC Porgera (47.50%) (proven and probable) 13,255 4.78 2,038 14,455 4.75 2,207
(mineral resource) 12,465 4.62 1,853 13,775 4.07 1,802 Kalgoorlie (50.00%) (proven and probable) 99,060 1.21 3,858 100,073 1.29 4,140
(mineral resource) 15,286 1.16 571 14,114 0.89 402 AFRICA Bulyanhulu (63.90%) (proven and probable) 12,580 7.42 3,001 13,958 7.29 3,271
(mineral resource) 9,208 9.04 2,676 8,885 8.91 2,544 North Mara (63.90%) (proven and probable) 16,926 2.73 1,488 15,202 2.47 1,209
(mineral resource) 7,813 2.75 690 12,888 2.36 979 Buzwagi (63.90%) (proven and probable) 9,108 0.92 269 9,624 1.27 392
(mineral resource) 2,891 1.04 97 16,532 1.23 654 Nyanzaga (57.51%) (proven and probable) — — — — — —
(mineral resource) 12,520 3.45 1,389 14,205 3.49 1,594 Golden Ridge (63.90%) (proven and probable) — — — — — —
(mineral resource) — — — 5,076 2.78 454 OTHER (proven and probable) 11,838 0.23 89 11,331 0.24 86 (mineral resource) 2,620 0.58 49 2,621 0.52 44 TOTAL (proven and probable) 1,294,629 1.55 64,444 2,006,898 1.33 85,950 (mineral resource) 1,954,176 1.41 88,565 1,308,770 1.79 75,235 (1) Resources which are not reserves do not have demonstrated economic viability.(2) See accompanying endnote #1.(3) Measured plus indicated resources.(4) See accompanying endnote #2.(5) See accompanying endnote #3.(6) See accompanying endnote #5.(7) See accompanying endnote #4.BARRICK YEAR-END 2017 89 RESERVES AND RESOURCES
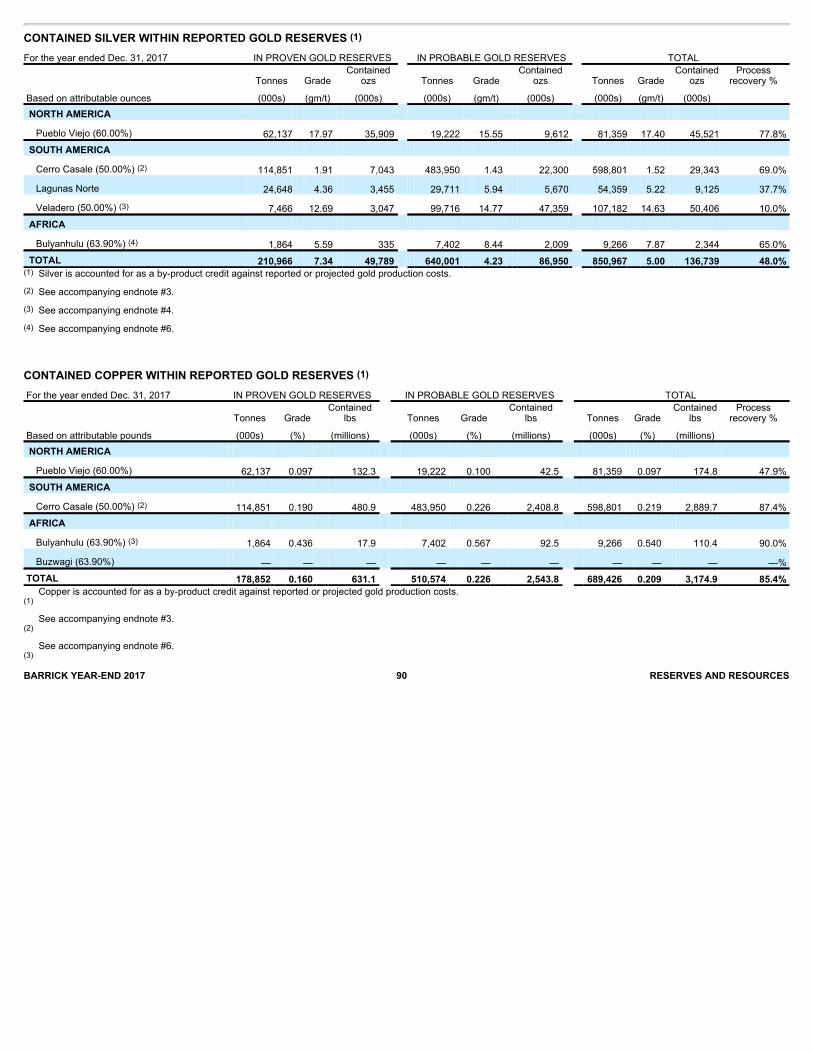
CONTAINED SILVER WITHIN REPORTED GOLD RESERVES (1)For the year ended Dec. 31, 2017 IN PROVEN GOLD RESERVES IN PROBABLE GOLD RESERVES TOTAL Contained Contained Contained Process Tonnes Grade ozs Tonnes Grade ozs Tonnes Grade ozs recovery %
Based on attributable ounces (000s) (gm/t) (000s) (000s) (gm/t) (000s) (000s) (gm/t) (000s) NORTH AMERICA Pueblo Viejo (60.00%) 62,137 17.97 35,909 19,222 15.55 9,612 81,359 17.40 45,521 77.8%
SOUTH AMERICA Cerro Casale (50.00%) (2) 114,851 1.91 7,043 483,950 1.43 22,300 598,801 1.52 29,343 69.0%
Lagunas Norte 24,648 4.36 3,455 29,711 5.94 5,670 54,359 5.22 9,125 37.7%
Veladero (50.00%) (3) 7,466 12.69 3,047 99,716 14.77 47,359 107,182 14.63 50,406 10.0%
AFRICA Bulyanhulu (63.90%) (4) 1,864 5.59 335 7,402 8.44 2,009 9,266 7.87 2,344 65.0%
TOTAL 210,966 7.34 49,789 640,001 4.23 86,950 850,967 5.00 136,739 48.0% (1) Silver is accounted for as a by-product credit against reported or projected gold production costs.(2) See accompanying endnote #3.(3) See accompanying endnote #4.(4) See accompanying endnote #6.
CONTAINED COPPER WITHIN REPORTED GOLD RESERVES (1) For the year ended Dec. 31, 2017 IN PROVEN GOLD RESERVES IN PROBABLE GOLD RESERVES TOTAL Contained Contained Contained Process Tonnes Grade lbs Tonnes Grade lbs Tonnes Grade lbs recovery %
Based on attributable pounds (000s) (%) (millions) (000s) (%) (millions) (000s) (%) (millions) NORTH AMERICA Pueblo Viejo (60.00%) 62,137 0.097 132.3 19,222 0.100 42.5 81,359 0.097 174.8 47.9%
SOUTH AMERICA Cerro Casale (50.00%) (2) 114,851 0.190 480.9 483,950 0.226 2,408.8 598,801 0.219 2,889.7 87.4%
AFRICA Bulyanhulu (63.90%) (3) 1,864 0.436 17.9 7,402 0.567 92.5 9,266 0.540 110.4 90.0%
Buzwagi (63.90%) — — — — — — — — — —%
TOTAL 178,852 0.160 631.1 510,574 0.226 2,543.8 689,426 0.209 3,174.9 85.4% (1)
Copper is accounted for as a by-product credit against reported or projected gold production costs.
(2)
See accompanying endnote #3.
(3)
See accompanying endnote #6.
BARRICK YEAR-END 2017 90 RESERVES AND RESOURCES

CONTAINED SILVER WITHIN REPORTED GOLD RESOURCES (1)
For the year ended Dec. 31, 2017 MEASURED (M) INDICATED (I) (M) + (I) INFERRED
Based on attributable ounces
Tonnes
(000 ’s)
Grade
(gm/t)
Contained ozs
(000 ’s)
Tonnes
(000 ’s)
Grade
(gm/t)
Contained ozs
(000 ’s)
Ounces
(000 ’s)
Tonnes
(000 ’s)
Grade
(gm/t)
Containedozs
(000 ’s) NORTH AMERICA Pueblo Viejo (60.00%) 7,773 14.25 3,561 93,913 13.61 41,095 44,656 27,637 10.81 9,605
SOUTH AMERICA Cerro Casale (50.00%) (2) 11,478 1.20 441 136,846 1.06 4,656 5,097 247,720 1.04 8,253 Caspiche (50.00%) (2) 310,050 1.20 11,976 391,750 1.20 15,147 27,123 99,050 0.91 2,909 Pascua-Lama (3) 42,809 57.21 78,747 391,734 52.22 657,718 736,465 15,400 17.83 8,830 Lagunas Norte 1,925 2.71 168 29,017 2.83 2,642 2,810 1,857 3.35 200 Veladero (50.00%) (4) 3,324 8.95 956 66,771 12.25 26,287 27,243 33,486 10.99 11,830
AFRICA Bulyanhulu (63.90%) 874 7.15 201 8,334 6.55 1,755 1,956 15,469 6.96 3,461
TOTAL 378,233 7.90 96,050 1,118,365 20.84 749,300 845,350 440,619 3.18 45,088 (1) Resources which are not reserves do not have demonstrated economic viability.(2) See accompanying endnote #3.(3) See accompanying endnote #5.(4) See accompanying endnote #4.
CONTAINED COPPER WITHIN REPORTED GOLD RESOURCES (1)
For the year ended Dec. 31, 2017 IN MEASURED (M) GOLD
RESOURCES IN INDICATED (I) GOLD
RESOURCES (M) + (I) INFERRED
Based on attributable pounds
Tonnes
(000 ’s)
Grade
(%)
Containedlbs
(millions)
Tonnes
(000 ’s)
Grade
(%)
Containedlbs
(millions)
Containedlbs
(millions)
Tonnes
(000 ’s)
Grade
(%)
Containedlbs
(millions) NORTH AMERICA Pueblo Viejo (60.00%) 7,773 0.067 11.5 93,913 0.081 167.6 179.1 27,637 0.086 52.3
SOUTH AMERICA Cerro Casale (50.00%) (2) 11,478 0.132 33.4 136,846 0.164 495.9 529.3 247,720 0.192 1,046.8 Caspiche (50.00%) (2) 277,100 0.230 1,405.1 363,950 0.180 1,444.3 2,849.4 97,800 0.120 258.7 Pascua-Lama (3) 42,809 0.101 95.7 391,734 0.082 704.6 800.3 15,400 0.049 16.5
AFRICA Bulyanhulu (63.90%) 874 0.405 7.8 8,334 0.441 81.0 88.8 15,469 0.632 215.5 Buzwagi (63.90%) 13 0.349 0.1 2,878 0.109 6.9 7.0 31,898 0.081 56.9
TOTAL 340,047 0.207 1,553.6 997,655 0.132 2,900.3 4,453.9 435,924 0.171 1,646.7 (1) Resources which are not reserves do not have demonstrated economic viability.(2) See accompanying endnote #3.(3) See accompanying endnote #5.
NICKEL MINERAL RESOURCES (1)For the year ended Dec. 31, 2017 MEASURED (M) INDICATED (I) (M) + (I) INFERRED
Based on attributable pounds
Tonnes
(000 ’s)
Grade
(%)
Containedlbs
(millions)
Tonnes
(000 ’s)
Grade
(%)
Containedlbs
(millions)
Containedlbs
(millions)
Tonnes
(000 ’s)
Grade
(%)
Containedlbs
(millions) AFRICA Kabanga (50.00%) 6,905 2.490 379.0 11,705 2.720 701.9 1,080.9 10,400 2.600 596.1 (1) Resources which are not reserves do not have demonstrated economic viability.
BARRICK YEAR-END 2017 91 RESERVES AND RESOURCES

Mineral Reserves and Resources Endnotes
1. Mineral reserves (“reserves”) and mineral resources (“resources”) have been estimated as at December 31, 2017 in accordance withNational Instrument 43-101 as required by Canadian securities regulatory authorities. For United States reporting purposes, Industry Guide7 under the Securities and Exchange Act of 1934 (as interpreted by Staff of the SEC), applies different standards in order to classifymineralization as a reserve. In addition, while the terms “measured”, “indicated” and “inferred” mineral resources are required pursuant toNational Instrument 43-101, the U.S. Securities and Exchange Commission does not recognize such terms. Canadian standards differsignificantly from the requirements of the U.S. Securities and Exchange Commission, and mineral resource information contained herein isnot comparable to similar information regarding mineral reserves disclosed in accordance with the requirements of the U.S. Securities andExchange Commission. U.S. investors should understand that “inferred” mineral resources have a great amount of uncertainty as to theirexistence and great uncertainty as to their economic and legal feasibility. In addition, U.S. investors are cautioned not to assume that anypart or all of Barrick’s mineral resources constitute or will be converted into reserves. Calculations have been prepared by employees ofBarrick, its joint venture partners or its joint venture operating companies, as applicable, under the supervision of Rick Sims, Vice President,Resources and Reserves, of Barrick, Steven Haggarty, Senior Director, Metallurgy, of Barrick and Patrick Garretson, Senior Director, Life ofMine Planning, of Barrick. Except as noted below, reserves have been estimated based on an assumed gold price of US$1,200 per ounce,an assumed silver price of US$16.50 per ounce, and an assumed copper price of US$2.75 per pound and long-term average exchangerates of 1.25 CAD/US$ and 0.75 US$/AUD. Reserves at Kalgoorlie assumed a gold price of AUD$1,600 and Bulyanhulu, North Mara andBuzwagi assumed a gold price of US$1,100. Reserve estimates incorporate current and/or expected mine plans and cost levels at eachproperty. Varying cut-off grades have been used depending on the mine and type of ore contained in the reserves. Barrick’s normal dataverification procedures have been employed in connection with the calculations. Verification procedures include industry-standard qualitycontrol practices. Resources as at December 31, 2017 have been estimated using varying cut-off grades, depending on both the type ofmine or project, its maturity and ore types at each property. For a breakdown of reserves and resources by category and for a more detaileddescription of the key assumptions, parameters, and methods used in estimating Barrick’s reserves and resources, see Barrick’s mostrecent Annual Information Form/Form 40-F on file with Canadian provincial securities regulatory authorities and the U.S. Securities andExchange Commission.
2. In confirming our annual reserves for each of our mineral properties, projects, and operations, we conduct a reserve test on December 31 of
each year to verify that the future undiscounted cash flow from reserves is positive. The cash flow ignores all sunk costs and only considersfuture operating and closure expenses as well as any future capital costs.
3. On June 9, 2017, the Company sold 25% of its interest in Cerro Casale to Goldcorp Inc. (“Goldcorp”). Goldcorp concurrently purchasedKinross Gold Corporation’s 25% interest in Cerro Casale, resulting in Barrick and Goldcorp each holding a 50% interest in the jointoperation. In connection with this transaction, Goldcorp also acquired the Caspiche Project from Exeter Resource Corporation, which wasalso contributed to the joint operation. Moving forward, the joint venture will be referred to as Norte Abierto, which includes the CerroCasale, Caspiche and Luciano deposits. For additional information, see page 116 of Barrick’s Fourth Quarter and Year-End Report 2017.
4. On June 30, 2017, the Company sold 50 percent of its interest in the Veladero mine to Shandong Gold Group Co., Ltd. For additional
information regarding this matter, see page 116 of Barrick’s Fourth Quarter and Year-End Report 2017.
5. On January 17, 2018, Chile’s Superintendencia del Medio Ambiente (SMA) ordered the closure of existing infrastructure on the Chilean side
of the Pascua-Lama project. As a result, the Company has reclassified Pascua- Lama’s proven and probable gold reserves as measuredand indicated resources. For additional information, see page 158 of Barrick’s Fourth Quarter and Year-End Report 2017.
6. Silver and copper probable reserve tonnage at the Bulyanhulu mine is less than the gold probable reserve tonnage because the gold
reserve includes 3.3 million tonnes of tailings material which are being separately reprocessed for recovery of gold only.BARRICK YEAR-END 2017 92 RESERVES AND RESOURCES

Exhibit99.5
CONSENTOFINDEPENDENTAUDITOR
WeherebyconsenttotheinclusionintheAnnualReportonForm40-FofBarrickGoldCorporation(thecompany),andtotheincorporationbyreferenceonFormS-8(FileNos.333-121500,333-131715,333-135769),FormF-3(FileNo.333-206417)andFormF-10(FileNo.333-216099)ofthecompany,ofourreportdatedFebruary14,2018relatingtothecompany’s2017and2016consolidatedfinancialstatementsandtheeffectivenessofinternalcontroloverfinancialreportingasatDecember31,2017.
/s/PricewaterhouseCoopersLLPCharteredProfessionalAccountants,LicensedPublicAccountantsToronto,CanadaMarch23,2018

Exhibit99.6
CONSENTOFEXPERT
I,RickSims,herebyconsenttotheuseofmynameinconnectionwiththereferencestoscientificandtechnicalinformationrelatingtomineralpropertiesofBarrickGoldCorporation(the“Company”)intheAnnualInformationFormfortheyearendedDecember31,2017(the“AIF”)andtherelatedAnnualReportonForm40-FoftheCompany.
IdoalsoherebyconsenttotheuseofmynameandtheincorporationbyreferenceoftheinformationcontainedintheAIFandAnnualReportonForm40-FintotheRegistrationStatementsoftheCompanyonFormS-8(FileNos.333-121500,333-131715,333-135769),FormF-3(FileNo.333-206417)andFormF-10(FileNo.333-216099).Yoursverytruly,
/s/RickSimsName: RickSimsTitle: VicePresident,ReservesandResourcesDated: March23,2018
Exhibit99.7
CONSENTOFEXPERT
I,StevenHaggarty,herebyconsenttotheuseofmynameinconnectionwiththereferencestoscientificandtechnicalinformationrelatingtomineralpropertiesofBarrickGoldCorporation(the“Company”)intheAnnualInformationFormfortheyearendedDecember31,2017(the“AIF”)andtherelatedAnnualReportonForm40-FoftheCompany.
IdoalsoherebyconsenttotheuseofmynameandtheincorporationbyreferenceoftheinformationcontainedintheAIFandAnnualReportonForm40-FintotheRegistrationStatementsoftheCompanyonFormS-8(FileNos.333-121500,333-131715,333-135769),FormF-3(FileNo.333-206417)andFormF-10(FileNo.333-216099).Yoursverytruly,
/s/StevenHaggartyName: StevenHaggartyTitle: SeniorDirector,MetallurgyDated: March23,2018

Exhibit99.8
CONSENTOFEXPERT
I,PatrickGarretson,herebyconsenttotheuseofmynameinconnectionwiththereferencestoscientificandtechnicalinformationrelatingtomineralpropertiesofBarrickGoldCorporation(the“Company”)intheAnnualInformationFormfortheyearendedDecember31,2017(the“AIF”)andtherelatedAnnualReportonForm40-FoftheCompany.
IdoalsoherebyconsenttotheuseofmynameandtheincorporationbyreferenceoftheinformationcontainedintheAIFandAnnualReportonForm40-FintotheRegistrationStatementsoftheCompanyonFormS-8(FileNos.333-121500,333-131715,333-135769),FormF-3(FileNo.333-206417)andFormF-10(FileNo.333-216099).Yoursverytruly,
/s/PatrickGarretsonName: PatrickGarretsonTitle: SeniorDirector,LifeofMinePlanningDated: March23,2018
Exhibit99.9
CONSENTOFEXPERT
I,RobertKrcmarov,herebyconsenttotheuseofmynameinconnectionwiththereferencestoscientificandtechnicalinformationrelatingtomineralpropertiesofBarrickGoldCorporation(the“Company”)intheAnnualInformationFormfortheyearendedDecember31,2017(the“AIF”)andtherelatedAnnualReportonForm40-FoftheCompany.
IdoalsoherebyconsenttotheuseofmynameandtheincorporationbyreferenceoftheinformationcontainedintheAIFandAnnualReportonForm40-FintotheRegistrationStatementsoftheCompanyonFormS-8(FileNos.333-121500,333-131715,333-135769),FormF-3(FileNo.333-206417)andFormF-10(FileNo.333-216099).Yoursverytruly,
/s/RobertKrcmarovName: RobertKrcmarovTitle: ExecutiveVicePresident,ExplorationandGrowthDated: March23,2018
Exhibit99.10
CERTIFICATIONREQUIREDBYRULE13a-14(a)ORRULE15d-14(a),PURSUANTTOSECTION302OFTHESARBANES-OXLEYACTOF2002
I,KelvinP.M.Dushnisky,certifythat:
1. IhavereviewedthisannualreportonForm40-FofBarrickGoldCorporation;
2. Basedonmyknowledge,thisreportdoesnotcontainanyuntruestatementofamaterialfactoromittostateamaterialfactnecessarytomakethestatementsmade,inlightofthecircumstancesunderwhichsuchstatementsweremade,notmisleadingwithrespecttotheperiodcoveredbythisreport;
3. Basedonmyknowledge,thefinancialstatements,andotherfinancialinformationincludedinthisreport,fairlypresentinallmaterialrespectsthefinancialcondition,resultsofoperationsandcashflowsoftheissuerasof,andfor,theperiodspresentedinthisreport;
4. Theissuer’sothercertifyingofficerandIareresponsibleforestablishingandmaintainingdisclosurecontrolsandprocedures(asdefinedinExchangeActRules13a-15(e)and15d-15(e))andinternalcontroloverfinancialreporting(asdefinedinExchangeActRules13a-15(f)and15d-15(f))fortheissuerandhave:
(a) Designedsuchdisclosurecontrolsandprocedures,orcausedsuchdisclosurecontrolsandprocedurestobedesignedunderoursupervision,toensurethat
materialinformationrelatingtotheissuer,includingitsconsolidatedsubsidiaries,ismadeknowntousbyotherswithinthoseentities,particularlyduringtheperiodinwhichthisreportisbeingprepared;
(b) Designedsuchinternalcontroloverfinancialreporting,orcausedsuchinternalcontroloverfinancialreportingtobedesignedunderoursupervision,to
providereasonableassuranceregardingthereliabilityoffinancialreportingandthepreparationoffinancialstatementsforexternalpurposesinaccordancewithgenerallyacceptedaccountingprinciples;
(c) Evaluatedtheeffectivenessoftheissuer’sdisclosurecontrolsandproceduresandpresentedinthisreportourconclusionsabouttheeffectivenessofthedisclosurecontrolsandprocedures,asoftheendoftheperiodcoveredbythisreportbasedonsuchevaluation;and
(d) Disclosedinthisreportanychangeintheissuer’sinternalcontroloverfinancialreportingthatoccurredduringtheperiodcoveredbytheannualreportthathasmateriallyaffected,orisreasonablylikelytomateriallyaffect,theissuer’sinternalcontroloverfinancialreporting;and
5. Theissuer’sothercertifyingofficerandIhavedisclosed,basedonourmostrecentevaluationofinternalcontroloverfinancialreporting,totheissuer’sauditorsandtheauditcommitteeoftheissuer’sboardofdirectors(orpersonsperformingtheequivalentfunctions):
(a) Allsignificantdeficienciesandmaterialweaknessesinthedesignoroperationofinternalcontroloverfinancialreportingwhicharereasonablylikelytoadverselyaffecttheissuer’sabilitytorecord,process,summarizeandreportfinancialinformation;and
(b) Anyfraud,whetherornotmaterial,thatinvolvesmanagementorotheremployeeswhohaveasignificantroleintheissuer’sinternalcontroloverfinancialreporting.
Date:March23,2018
/s/KelvinP.M.DushniskyName: KelvinP.M.DushniskyTitle: President

Exhibit99.11
CERTIFICATIONREQUIREDBYRULE13a-14(a)ORRULE15d-14(a),PURSUANTTOSECTION302OFTHESARBANES-OXLEYACTOF2002
I,CatherineP.Raw,certifythat:
1. IhavereviewedthisannualreportonForm40-FofBarrickGoldCorporation;
2. Basedonmyknowledge,thisreportdoesnotcontainanyuntruestatementofamaterialfactoromittostateamaterialfactnecessarytomakethestatementsmade,inlightofthecircumstancesunderwhichsuchstatementsweremade,notmisleadingwithrespecttotheperiodcoveredbythisreport;
3. Basedonmyknowledge,thefinancialstatements,andotherfinancialinformationincludedinthisreport,fairlypresentinallmaterialrespectsthefinancialcondition,resultsofoperationsandcashflowsoftheissuerasof,andfor,theperiodspresentedinthisreport;
4. Theissuer’sothercertifyingofficerandIareresponsibleforestablishingandmaintainingdisclosurecontrolsandprocedures(asdefinedinExchangeActRules13a-15(e)and15d-15(e))andinternalcontroloverfinancialreporting(asdefinedinExchangeActRules13a-15(f)and15d-15(f))fortheissuerandhave:
(a) Designedsuchdisclosurecontrolsandprocedures,orcausedsuchdisclosurecontrolsandprocedurestobedesignedunderoursupervision,toensurethat
materialinformationrelatingtotheissuer,includingitsconsolidatedsubsidiaries,ismadeknowntousbyotherswithinthoseentities,particularlyduringtheperiodinwhichthisreportisbeingprepared;
(b) Designedsuchinternalcontroloverfinancialreporting,orcausedsuchinternalcontroloverfinancialreportingtobedesignedunderoursupervision,to
providereasonableassuranceregardingthereliabilityoffinancialreportingandthepreparationoffinancialstatementsforexternalpurposesinaccordancewithgenerallyacceptedaccountingprinciples;
(c) Evaluatedtheeffectivenessoftheissuer’sdisclosurecontrolsandproceduresandpresentedinthisreportourconclusionsabouttheeffectivenessofthedisclosurecontrolsandprocedures,asoftheendoftheperiodcoveredbythisreportbasedonsuchevaluation;and
(d) Disclosedinthisreportanychangeintheissuer’sinternalcontroloverfinancialreportingthatoccurredduringtheperiodcoveredbytheannualreportthathasmateriallyaffected,orisreasonablylikelytomateriallyaffect,theissuer’sinternalcontroloverfinancialreporting;and
5. Theissuer’sothercertifyingofficerandIhavedisclosed,basedonourmostrecentevaluationofinternalcontroloverfinancialreporting,totheissuer’sauditorsandtheauditcommitteeoftheissuer’sboardofdirectors(orpersonsperformingtheequivalentfunctions):
(a) Allsignificantdeficienciesandmaterialweaknessesinthedesignoroperationofinternalcontroloverfinancialreportingwhicharereasonablylikelytoadverselyaffecttheissuer’sabilitytorecord,process,summarizeandreportfinancialinformation;and
(b) Anyfraud,whetherornotmaterial,thatinvolvesmanagementorotheremployeeswhohaveasignificantroleintheissuer’sinternalcontroloverfinancialreporting.
Date:March23,2018
/s/CatherineP.RawName: CatherineP.RawTitle: ExecutiveVicePresidentandChiefFinancialOfficer

Exhibit99.12
CERTIFICATIONPURSUANTTO18U.S.C.SECTION1350,ASENACTEDPURSUANTTO
SECTION906OFTHEU.S.SARBANES-OXLEYACTOF2002
BarrickGoldCorporation(the“Company”)isfilingwiththeU.S.SecuritiesandExchangeCommissiononthedatehereof,itsannualreportonForm40-FforthefiscalyearendedDecember31,2017(the“Report”).
I,KelvinP.M.Dushnisky,PresidentoftheCompany,certify,pursuantto18U.S.C.section1350,asenactedpursuanttosection906oftheU.S.Sarbanes-OxleyActof2002,that,tothebestofmyknowledge:
a) theReportfullycomplieswiththerequirementsofsection13(a)or15(d)oftheU.S.SecuritiesExchangeActof1934;and
b) theinformationcontainedintheReportfairlypresents,inallmaterialrespects,thefinancialconditionandresultsofoperationsoftheCompany.Date:March23,2018
/s/KelvinP.M.DushniskyName: KelvinP.M.DushniskyTitle: President
Exhibit99.13
CERTIFICATIONPURSUANTTO18U.S.C.SECTION1350,ASENACTEDPURSUANTTO
SECTION906OFTHEU.S.SARBANES-OXLEYACTOF2002
BarrickGoldCorporation(the“Company”)isfilingwiththeU.S.SecuritiesandExchangeCommissiononthedatehereof,itsannualreportonForm40-FforthefiscalyearendedDecember31,2017(the“Report”).
I,CatherineP.Raw,ExecutiveVicePresidentandChiefFinancialOfficeroftheCompany,certify,pursuantto18U.S.C.section1350,asenactedpursuanttosection906oftheU.S.Sarbanes-OxleyActof2002,that,tothebestofmyknowledge:
a) theReportfullycomplieswiththerequirementsofsection13(a)or15(d)oftheU.S.SecuritiesExchangeActof1934;and
b) theinformationcontainedintheReportfairlypresents,inallmaterialrespects,thefinancialconditionandresultsofoperationsoftheCompany.Date:March23,2018
/s/CatherineP.RawName: CatherineP.RawTitle: ExecutiveVicePresidentandChiefFinancialOfficer
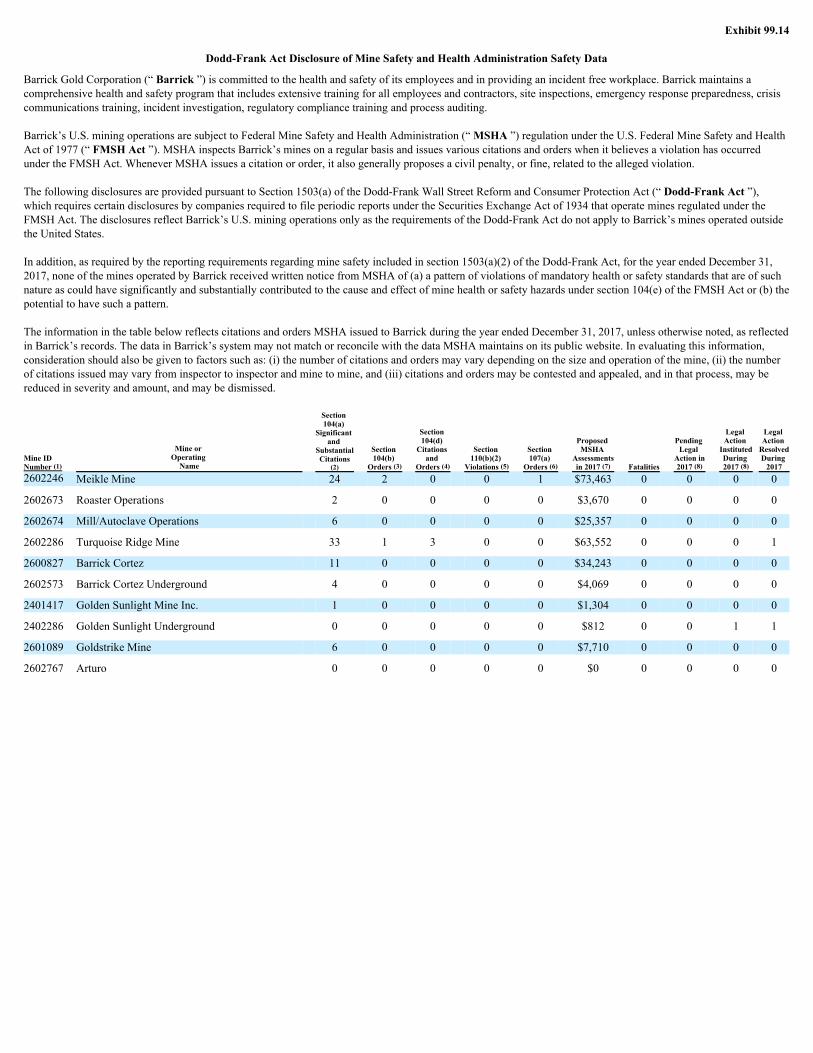
Exhibit99.14
Dodd-FrankActDisclosureofMineSafetyandHealthAdministrationSafetyData
BarrickGoldCorporation(“Barrick”)iscommittedtothehealthandsafetyofitsemployeesandinprovidinganincidentfreeworkplace.Barrickmaintainsacomprehensivehealthandsafetyprogramthatincludesextensivetrainingforallemployeesandcontractors,siteinspections,emergencyresponsepreparedness,crisiscommunicationstraining,incidentinvestigation,regulatorycompliancetrainingandprocessauditing.
Barrick’sU.S.miningoperationsaresubjecttoFederalMineSafetyandHealthAdministration(“MSHA”)regulationundertheU.S.FederalMineSafetyandHealthActof1977(“FMSHAct”).MSHAinspectsBarrick’sminesonaregularbasisandissuesvariouscitationsandorderswhenitbelievesaviolationhasoccurredundertheFMSHAct.WheneverMSHAissuesacitationororder,italsogenerallyproposesacivilpenalty,orfine,relatedtotheallegedviolation.
ThefollowingdisclosuresareprovidedpursuanttoSection1503(a)oftheDodd-FrankWallStreetReformandConsumerProtectionAct(“Dodd-FrankAct”),whichrequirescertaindisclosuresbycompaniesrequiredtofileperiodicreportsundertheSecuritiesExchangeActof1934thatoperateminesregulatedundertheFMSHAct.ThedisclosuresreflectBarrick’sU.S.miningoperationsonlyastherequirementsoftheDodd-FrankActdonotapplytoBarrick’sminesoperatedoutsidetheUnitedStates.
Inaddition,asrequiredbythereportingrequirementsregardingminesafetyincludedinsection1503(a)(2)oftheDodd-FrankAct,fortheyearendedDecember31,2017,noneoftheminesoperatedbyBarrickreceivedwrittennoticefromMSHAof(a)apatternofviolationsofmandatoryhealthorsafetystandardsthatareofsuchnatureascouldhavesignificantlyandsubstantiallycontributedtothecauseandeffectofminehealthorsafetyhazardsundersection104(e)oftheFMSHActor(b)thepotentialtohavesuchapattern.
TheinformationinthetablebelowreflectscitationsandordersMSHAissuedtoBarrickduringtheyearendedDecember31,2017,unlessotherwisenoted,asreflectedinBarrick’srecords.ThedatainBarrick’ssystemmaynotmatchorreconcilewiththedataMSHAmaintainsonitspublicwebsite.Inevaluatingthisinformation,considerationshouldalsobegiventofactorssuchas:(i)thenumberofcitationsandordersmayvarydependingonthesizeandoperationofthemine,(ii)thenumberofcitationsissuedmayvaryfrominspectortoinspectorandminetomine,and(iii)citationsandordersmaybecontestedandappealed,andinthatprocess,maybereducedinseverityandamount,andmaybedismissed.
MineIDNumber(1)
MineorOperatingName
Section104(a)
Significantand
SubstantialCitations
(2)
Section104(b)
Orders(3)
Section104(d)
Citationsand
Orders(4)
Section110(b)(2)
Violations(5)
Section107(a)
Orders(6)
ProposedMSHA
Assessmentsin2017(7) Fatalities
PendingLegal
Actionin2017(8)
LegalActionInstitutedDuring2017(8)
LegalActionResolvedDuring2017
2602246 MeikleMine 24 2 0 0 1 $73,463 0 0 0 0
2602673 RoasterOperations 2 0 0 0 0 $3,670 0 0 0 0
2602674 Mill/AutoclaveOperations 6 0 0 0 0 $25,357 0 0 0 0
2602286 TurquoiseRidgeMine 33 1 3 0 0 $63,552 0 0 0 1
2600827 BarrickCortez 11 0 0 0 0 $34,243 0 0 0 0
2602573 BarrickCortezUnderground 4 0 0 0 0 $4,069 0 0 0 0
2401417 GoldenSunlightMineInc. 1 0 0 0 0 $1,304 0 0 0 0
2402286 GoldenSunlightUnderground 0 0 0 0 0 $812 0 0 1 1
2601089 GoldstrikeMine 6 0 0 0 0 $7,710 0 0 0 0
2602767 Arturo 0 0 0 0 0 $0 0 0 0 0
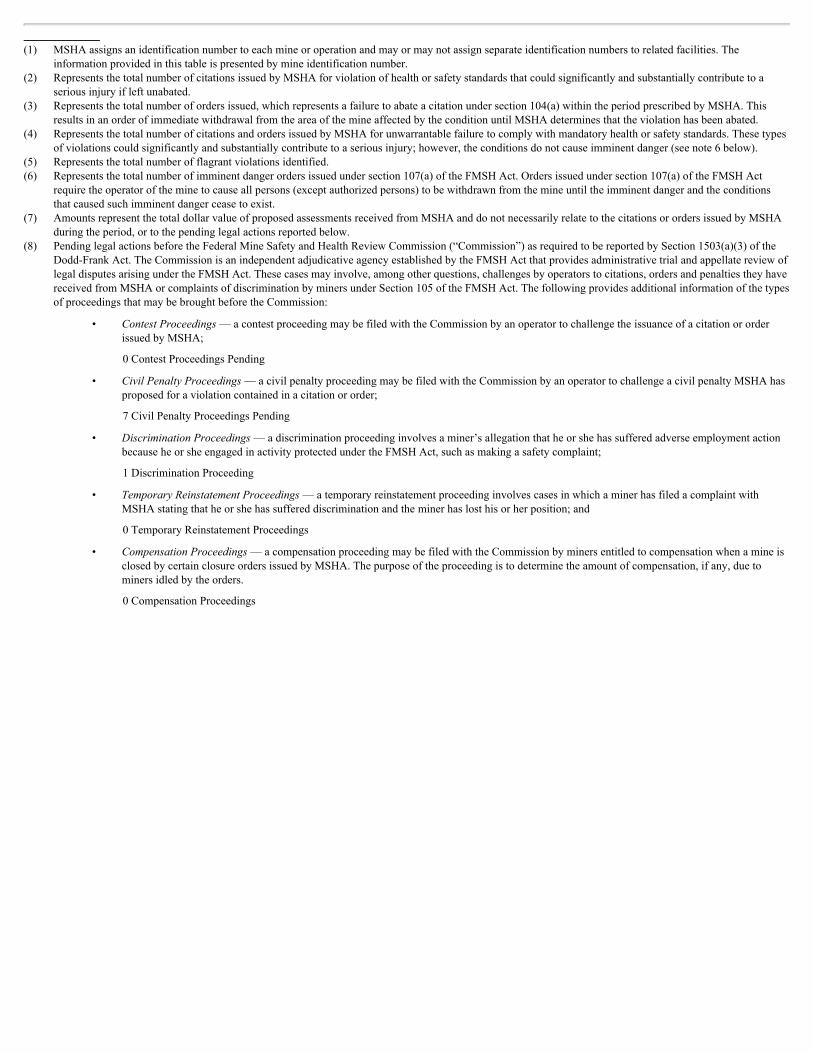
(1) MSHAassignsanidentificationnumbertoeachmineoroperationandmayormaynotassignseparateidentificationnumberstorelatedfacilities.The
informationprovidedinthistableispresentedbymineidentificationnumber.(2) RepresentsthetotalnumberofcitationsissuedbyMSHAforviolationofhealthorsafetystandardsthatcouldsignificantlyandsubstantiallycontributetoa
seriousinjuryifleftunabated.(3) Representsthetotalnumberofordersissued,whichrepresentsafailuretoabateacitationundersection104(a)withintheperiodprescribedbyMSHA.This
resultsinanorderofimmediatewithdrawalfromtheareaofthemineaffectedbytheconditionuntilMSHAdeterminesthattheviolationhasbeenabated.(4) RepresentsthetotalnumberofcitationsandordersissuedbyMSHAforunwarrantablefailuretocomplywithmandatoryhealthorsafetystandards.Thesetypes
ofviolationscouldsignificantlyandsubstantiallycontributetoaseriousinjury;however,theconditionsdonotcauseimminentdanger(seenote6below).(5) Representsthetotalnumberofflagrantviolationsidentified.(6) Representsthetotalnumberofimminentdangerordersissuedundersection107(a)oftheFMSHAct.Ordersissuedundersection107(a)oftheFMSHAct
requiretheoperatoroftheminetocauseallpersons(exceptauthorizedpersons)tobewithdrawnfromthemineuntiltheimminentdangerandtheconditionsthatcausedsuchimminentdangerceasetoexist.
(7) AmountsrepresentthetotaldollarvalueofproposedassessmentsreceivedfromMSHAanddonotnecessarilyrelatetothecitationsorordersissuedbyMSHAduringtheperiod,ortothependinglegalactionsreportedbelow.
(8) PendinglegalactionsbeforetheFederalMineSafetyandHealthReviewCommission(“Commission”)asrequiredtobereportedbySection1503(a)(3)oftheDodd-FrankAct.TheCommissionisanindependentadjudicativeagencyestablishedbytheFMSHActthatprovidesadministrativetrialandappellatereviewoflegaldisputesarisingundertheFMSHAct.Thesecasesmayinvolve,amongotherquestions,challengesbyoperatorstocitations,ordersandpenaltiestheyhavereceivedfromMSHAorcomplaintsofdiscriminationbyminersunderSection105oftheFMSHAct.ThefollowingprovidesadditionalinformationofthetypesofproceedingsthatmaybebroughtbeforetheCommission:
• ContestProceedings—acontestproceedingmaybefiledwiththeCommissionbyanoperatortochallengetheissuanceofacitationororderissuedbyMSHA;
0ContestProceedingsPending
• CivilPenaltyProceedings—acivilpenaltyproceedingmaybefiledwiththeCommissionbyanoperatortochallengeacivilpenaltyMSHAhasproposedforaviolationcontainedinacitationororder;
7CivilPenaltyProceedingsPending
• DiscriminationProceedings—adiscriminationproceedinginvolvesaminer’sallegationthatheorshehassufferedadverseemploymentactionbecauseheorsheengagedinactivityprotectedundertheFMSHAct,suchasmakingasafetycomplaint;
1DiscriminationProceeding
• TemporaryReinstatementProceedings—atemporaryreinstatementproceedinginvolvescasesinwhichaminerhasfiledacomplaintwithMSHAstatingthatheorshehassuffereddiscriminationandtheminerhaslosthisorherposition;and
0TemporaryReinstatementProceedings
• CompensationProceedings—acompensationproceedingmaybefiledwiththeCommissionbyminersentitledtocompensationwhenamineis
closedbycertainclosureordersissuedbyMSHA.Thepurposeoftheproceedingistodeterminetheamountofcompensation,ifany,duetominersidledbytheorders.
0CompensationProceedings