barrick gold corporation -...
TRANSCRIPT

UNITED STATESSECURITIES AND EXCHANGE COMMISSION
WASHINGTON, D.C. 20549
Form 6-K
REPORT OF FOREIGN PRIVATE ISSUERPURSUANT TO RULE 13a-16 OR 15d-16 UNDER THE
SECURITIES EXCHANGE ACT OF 1934
For the month of October 2017
Commission File Number: 1-9059
Barrick Gold Corporation(Registrant’s name)
Brookfield Place, TD Canada Trust Tower, Suite 3700161 Bay Street, P.O. Box 212
Toronto, Ontario M5J 2S1 Canada(Address of principal executive offices)
Indicate by check mark whether the registrant files or will file annual reports under cover of Form 20-F or Form 40-F.
Form 20-F ☐ Form 40-F ☒
Indicate by check mark if the registrant is submitting the Form 6-K in paper as permitted by Regulation S-T Rule 101(b)(1): ☐
Indicate by check mark if the registrant is submitting the Form 6-K in paper as permitted by Regulation S-T Rule 101(b)(7): ☐

INCORPORATION BY REFERENCE
This report on Form 6-K is hereby incorporated by reference into the Registration Statements on Form F-3 (File No. 333-206417) filed with the SEC on August 14, 2015 andForm F-10 (File No. 333-216099) filed with the SEC on February 15, 2017.

SIGNATURES
Pursuant to the requirements of the Securities Exchange Act of 1934, the registrant has duly caused this report to be signed on its behalf by the undersigned, thereunto dulyauthorized.
BARRICK GOLD CORPORATION
Date: October 26, 2017 By: /s/ Richie Haddock Name: Richie Haddock Title: Senior Vice-President and General Counsel

EXHIBIT Exhibit
Description ofExhibit
99.1
Barrick Gold Corporation Third Quarter Report for 2017, including the Comparative Unaudited Financial Statements prepared in accordance with InternationalFinancial Reporting Standards and the notes thereto for the three months ended September 30, 2017 and Management’s Discussion and Analysis for the same period.

Exhibit 99.1
THIRD QUARTER REPORT 2017All amounts expressed in U.S. dollars unless otherwise indicated
Barrick Reports Third Quarter 2017 Results
● Barrick reported a net loss attributable to equity holders (“net loss”) of $11 million ($0.01 per share), and adjusted net earnings 1 of $186 million ($0.16 pershare) for the third quarter.
● The Company generated third quarter revenues of $1.993 billion, net cash provided by operating activities (“operating cash flow”) of $532 million, and freecash flow 2 of $225 million.
● Gold production in the third quarter was 1.243 million ounces, at a cost of sales applicable to gold3 of $820 per ounce, and all-in sustaining costs 4 of $772per ounce.
● We have reduced our total debt by nearly $1.5 billion year to date, exceeding our target for 2017.
● We have narrowed full-year gold production guidance to 5.3-5.5 million ounces, at a cost of sales 3 of $790-$810 per ounce, and all-in sustaining costs4 of$740-$770 per ounce.
● Feasibility level projects at Cortez Deep South, Goldrush, Turquoise Ridge, and Lagunas Norte continue to advance on schedule and within budget. Aprefeasibility study for Pascua-Lama remains underway.
● Barrick and the Government of Tanzania have reached an agreement on a proposed framework that would redefine Acacia’s relationship with theGovernment, creating a path for the resolution of outstanding matters impacting Acacia’s operations.
TORONTO, October 25, 2017 — Barrick Gold Corporation (NYSE:ABX)(TSX:ABX) (“Barrick” or the “Company”) today reported third quarterresults for the period ending September 30, 2017. Lower revenues, earnings, and cash flow for the quarter reflect lower gold productioncompared to the prior-year period, as well as the impact of lower sales from Acacia. Despite these factors, a stronger balance sheet and robustcash flow generation allowed us to increase investments in the future of our business, with the ultimate objective of growing free cash flow pershare over the long term.
We allocated more capital to our pipeline of low risk, organic projects, located at or near Barrick’s core operations. These projects have thepotential to contribute more than one million ounces of annual production to Barrick, beginning in 2020. In addition to organic growth andexploration, the impact of our ongoing investments in digital transformation and innovation, including improvements in safety, productivity,efficiency, and transparency, are expected to accelerate as we broaden the implementation of these projects across our operations.
FINANCIAL HIGHLIGHTS
The Company reported a net loss of $11 million ($0.01 per share) for the third quarter, compared to net earnings of $175 million ($0.15 pershare) in the prior-year period. The decrease in net earnings primarily reflects lower gold production and lower gold prices, as well as the impactof Tanzania’s concentrate export ban on Acacia.

Net earnings were also impacted by a tax provision of $172 million related to the proposed framework for Acacia’s operations in Tanzania (seepage 4 for more details).
In addition, debt extinguishment costs, direct mining costs, exploration and evaluation costs, and depreciation expenses were higher than theprior-year period. These increases were partially offset by higher earnings from equity investees, lower interest costs as a result of debtrepayments, and lower tax expense.
Adjusted net earnings 1 for the third quarter were $186 million ($0.16 per share), compared to $278 million ($0.24 per share) in the prior-yearperiod. Significant adjusting items (pre-tax and non-controlling interest effects) in the third quarter include:
● $101 million in losses on debt extinguishment; and
● $172 million in a tax provision relating to the proposed framework for Acacia operations in Tanzania; partially offset by
● $93 million in tax effects and non-controlling interest impacts, primarily in relation to the two adjustments discussed above.
Refer to page 50 of Barrick’s third quarter MD&A for a full list of reconciling items between net earnings and adjusted net earnings for thecurrent and prior-year periods.
Operating cash flow was $532 million, compared to $951 million in the third quarter of 2016. Lower operating cash flow primarily reflects lowergold sales, combined with higher cash taxes paid, and higher direct mining costs. Operating cash flow was also impacted by lower cash flowsattributable to non-controlling interests, an increase in exploration, evaluation and project expenses, and lower gold prices.
Free cash flow 2 for the third quarter was $225 million, compared to $674 million in the third quarter of 2016. Lower free cash flow primarilyreflects higher capital expenditures combined with lower operating cash flows. In the third quarter of 2017, capital expenditures on a cash basiswere $307 million, compared to $277 million in the third quarter of 2016. This includes a $27 million increase in project capital expenditures,primarily at Barrick Nevada, relating to the development of Crossroads, the Cortez Hills Lower Zone, and the Goldrush project. Minesitesustaining capital expenditures were also higher at Barrick Nevada and Veladero, in line with plans.
RESTORING A STRONG BALANCE SHEET
Achieving and maintaining a strong balance sheet remains a top priority. So far this year, we have reduced our total debt by nearly $1.5 billion,exceeding our target of $1.45 billion for 2017. During the third quarter, we completed the redemption of approximately $731 million of May 2023notes, and fully repaid the amounts outstanding on our Pueblo Viejo project financing agreement.
Our goal is to reduce our total debt to $5 billion by the end of 2018, using cash flow from operations, and through further portfolio optimization,including potential divestments and the creation of new joint ventures and partnerships. The Company will continue to pursue debt reductionwith discipline, taking only those actions that make sense for the business, on terms we consider favorable to our shareholders.
At the end of the third quarter, Barrick had a consolidated cash balance of approximately $2.0 billion5. The Company has less than $100million6 in debt due before 2020. Three-quarters of our outstanding total debt of $6.4 billion does not mature until after 2032. BARRICK THIRD QUARTER 2017 2 PRESS RELEASE

OPERATING HIGHLIGHTS AND OUTLOOK
Barrick produced 1.243 million ounces of gold in the third quarter, at a cost of sales 3 of $820 per ounce. This compares to 1.381 million ounces,at a cost of sales 3 of $766 per ounce in the prior-year period. Production levels were expected to be lower in the third quarter, with higher goldproduction and lower costs expected in the fourth quarter. On a per ounce basis, cost of sales applicable to gold was higher due to the impact offewer ounces sold, combined with higher direct mining costs, and depreciation expense.
All-in sustaining costs 4 in the third quarter were $772 per ounce, compared to $704 per ounce in the third quarter of 2016. Higher all-insustaining costs primarily reflect a planned increase in minesite sustaining capital expenditures at Barrick Nevada and Veladero, and highercost of sales on a per ounce basis.
Cash costs 3 increased from $518 per ounce in the third quarter of 2016, to $546 per ounce in the third quarter of 2017, primarily driven byhigher direct mining costs. Cash costs have decreased by five percent over the first nine months of 2017, compared to the same period in 2016.
We have narrowed our full-year gold production and cost guidance ranges. We expect full-year gold production to be 5.3-5.5 million ounces, ata cost of sales 3 of $790-$810 per ounce, and all-in sustaining costs 4 of $740-$770 per ounce. This compares to our most recent productionguidance of 5.3-5.6 million ounces, at a cost of sales 3 of $780-$820 per ounce, and all-in sustaining costs 4 of $720-$770 per ounce.
The Company produced 115 million pounds of copper in the third quarter, at a cost of sales 3 of $1.67 per pound, and all-in sustaining costs 7 of$2.24 per pound. This compares to 100 million pounds, at a cost of sales 3 of $1.43 per pound, and all-in sustaining costs7 of $2.02 per pound,in the third quarter of 2016.
Our full-year copper production guidance range has narrowed to 420-440 million pounds. We have increased our copper cost of sales 3
guidance to $1.70-$1.85 per pound, primarily as a result of higher costs in Zambia. Our copper all-in sustaining cost 7 guidance range hasnarrowed to $2.20-$2.40 per pound.
Please see page 34 of Barrick’s third quarter MD&A for individual operating segment performance details. Detailed mine site guidanceinformation can be found in Appendix 1 of this press release.
Gold Third Quarter
2017 Current 2017
Guidance Original 2017
Guidance Production 8 (000s of ounces) 1.243 5.300-5.500 5.600-5.900* Cost of sales applicable to gold 3 ($ per ounce) 820 790-810 780-820 All-in sustaining costs 4 ($ per ounce) 772 740-770 720-770 Copper Production 8 (millions of pounds) 115 420-440 400-450 Cost of sales applicable to copper 3 ($ per pound) 1.67 1.70-1.85 1.50-1.70 All-in sustaining costs 7 ($ per pound)
2.24
2.20-2.40
2.10-2.40
Total Attributable Capital Expenditures 9 ($ millions) 296 1,350-1,500 1,300-1,500
*Original 2017 gold production guidance was adjusted to 5.3-5.6 million ounces to reflect the sale of 50 percent of Veladero to Shandong Gold Mining Co., Ltd effective June 30,2017. BARRICK THIRD QUARTER 2017 3 PRESS RELEASE

APPOINTMENT OF CHIEF DIGITAL OFFICER
Digital transformation is helping Barrick generate more value from its assets by leveraging data, analytics, and deep machine learning to makeour business more safe, productive, and transparent.
In August, we appointed Sham Chotai as Barrick’s first Chief Digital Officer. Under Mr. Chotai’s leadership, Barrick will accelerate its digitaltransformation by bringing together the Company’s Information Technology, Digital, and Operating Technology groups. This will ensure anintegrated approach to developing and adopting digital solutions across the Company, and will build on the success of our pilot implementationsthis year.
Those pilots have demonstrated the ability to capture productivity gains and cost reductions at the Cortez mine by optimizing mining cycletimes, digitizing maintenance work, and introducing autonomous operations. As we scale up the use of these products across Cortez and otherBarrick operations, we expect to see a corresponding acceleration of the benefits we have achieved thus far.
Mr. Chotai comes to Barrick with 25 years of experience in digital technology, business intelligence, and software development. Prior to joiningBarrick, he was Chief Technology Officer and Head of Software for GE’s Power business. Mr. Chotai also served as Vice President, CloudComputing for Hewlett-Packard.
PROPOSAL FOR A NEW PARTNERSHIP BETWEEN ACACIA AND TANZANIA
Following three months of discussions, the Government of Tanzania and Barrick have agreed on a proposed framework, which, if adopted,would redefine Acacia’s relationship with Tanzania for the long term, moving to a partnership characterized by trust and transparency. Thisproposal is subject to review and approval by Acacia.
We believe the proposed framework represents the optimal path for the resolution of outstanding disputes between Acacia and the Governmentof Tanzania, and for the resumption of normal operations. Such a partnership has the potential to provide greater near-term certainty to Acaciaand Barrick shareholders, and mitigate risk of future business disruptions; thereby improving the long-term stability and sustainability of Acacia’soperations in Tanzania.
Under the proposed framework, economic benefits from Acacia’s operations would be split on a 50/50 basis with the Government of Tanzania.The Government’s portion will be delivered in the form of royalties, taxes, and a 16 percent free carried interest in Acacia’s Tanzanianoperations, in line with the country’s new mining law.
A new Tanzanian operating company will be created to manage Bulyanhulu, Buzwagi, and North Mara. The principle of transparency betweenpartners will define how this company operates. The Government of Tanzania will participate in decisions related to operations, investment,planning, procurement, and marketing. This operating company will maximize employment of Tanzanians, building local capacity at all levels ofthe business, from board membership to operations. It will also increase procurement of goods and services within Tanzania.
Having agreed on a proposed partnership framework, the Government of Tanzania and Barrick have created a working group to resolveoutstanding tax matters relating to Acacia. In support of the working group’s ongoing efforts, the proposed framework agreed between Barrickand the Government of Tanzania provides for the payment of $300 million to the Government of Tanzania by Acacia, on terms to be settled bythe working group. Given Acacia’s current financial position, these payments would be made over time, using Acacia’s ongoing cash flows. Assuch, payment would be also conditional on Acacia’s ability to sell doré and concentrate. BARRICK THIRD QUARTER 2017 4 PRESS RELEASE

Barrick will also be working with the Government of Tanzania to establish the basis upon which the concentrate export ban can be lifted asexpediently as possible, including protocols for joint oversight and verification of concentrate shipments.
Barrick and the Government of Tanzania will now work to complete detailed documentation and final agreements for review and approval byAcacia. We expect this work to be completed in the first half of 2018. Barrick has engaged with independent directors of Acacia during thisprocess, and will continue to do so.
PROJECTS UPDATE
Our four most advanced projects continue to progress according to schedule and in line with initial capital estimates, with the potential tocontribute more than one million ounces of annual gold production to Barrick beginning in 2020, at costs well below our current portfolioaverage.
This includes three significant projects in Nevada: the Cortez Deep South underground expansion; the development of an underground mine atGoldrush; and the construction of a third shaft at the Turquoise Ridge mine. At Lagunas Norte in Peru, we are advancing a phased approach toextending the life of the mine by optimizing the recovery of carbonaceous oxide ores, followed by mining and processing of refractory material.
In addition, we continue to advance a prefeasibility study for underground mining at the Pascua-Lama project on the border between Argentinaand Chile.
Cortez Hills Deep South Underground Project, Nevada, USA 10
The Deep South project, located within the Lower Zone of the Cortez Hills underground mine, is expected to contribute average undergroundproduction of more than 300,000 ounces per year. The prefeasibility study anticipated a cost of sales3 of $840 per ounce, and average all-insustaining costs4 of $580 per ounce, for mining in the Deep South area. The project remains on schedule and within budget, with initial capitalcosts estimated to be $153 million.
The Deep South project will utilize infrastructure which has already been approved under current plans to expand mining in the Lower Zone.This includes construction of new twin declines, a conveyor haulage system, fuel and lubrication system, shotcrete and cemented rock fillplants, and an underground maintenance shop.
At the end of the third quarter, the twin declines had advanced a total of 6,581 feet, or 44 percent of the total distance, in line with schedule.Mass excavations for key underground infrastructure have also begun, and contracts for underground construction works have been awarded.Activities in the fourth quarter will include mobilizing contractors, advancing the twin declines, and completing temporary warehouses, inaddition to continued procurement for construction activities.
Permitting for Deep South was initiated in 2016 with the submission of an amendment to the current Mine Plan of Operations to the Bureau ofLand Management. Permitting is expected to take approximately three to four years, including the preparation of an Environmental ImpactStatement. A record of decision is expected by 2020. On this basis, initial production from Deep South could commence by 2023.
Goldrush Project, Cortez District, Nevada, USA
Goldrush has the potential to become Barrick’s newest underground operation in Nevada, with first production expected as early as 2021, andsustained production by 2023. The mine is expected to produce approximately BARRICK THIRD QUARTER 2017 5 PRESS RELEASE

450,000 ounces of gold per year during its first full five years in operation. Cost of sales3 is expected to be $800 per ounce, with average all-insustaining costs4 of $665 per ounce. We continue to anticipate initial capital costs of approximately $1 billion.
The first phase of the project involves the construction of an exploration twin decline to provide access to the orebody at depth, which willenable further exploration drilling, as well as the conversion of existing resources to reserves. The exploration declines can be converted intofull production declines in the future.
Initial site preparation works for the portal have been completed, and construction on the portal pad is now under way. We have also completeda surface drilling program in the Red Hill zone of the deposit, which is expected to support additional resource conversion.
Work during the fourth quarter will focus on advancing portal pad construction, and the selection of an underground contractor for declinedevelopment, which is expected to begin in early 2018. Permitting is expected to commence in 2018, initiating a three- to four-yearEnvironmental Impact Statement process.
Turquoise Ridge Third Shaft Project, Nevada, USA
Through the development of a third shaft, combined with improvements in mining productivity, Turquoise Ridge has the potential to increaseoutput to an average of 500,000 ounces per year (100 percent basis) at a cost of sales3 of $750-$800 per ounce, and all-in sustaining costs4 ofabout $625-$675 per ounce. The project is expected to require capital expenditures of approximately $300-$325 million (100 percent basis) foradditional underground development and shaft construction. All necessary permits for a third shaft are already in place.
Surface preparation works began in the third quarter, and included moving 95,000 cubic yards of earth, setting up storm water diversioninfrastructure, and extending utilities to the shaft site. This work is expected to be complete by the end of 2017. Contracts and materials tosupport medium and high voltage electrical distribution, water handling and sewage treatment have been purchased, and a tender process isnow open for the shaft sinking contract.
In keeping with our phased approach, construction on a ventilation shaft could begin in the second half of 2018, at roughly half the total capitalexpenditure of a full production shaft. This ventilation shaft would allow for expanded underground mining using existing infrastructure, andcould be equipped and converted to a full production shaft to increase the mine’s output to approximately 500,000 ounces per year.
During the quarter, Turquoise Ridge also took delivery of its first road header. Building on the successful use of this technology at Cortez, theroad header will enable the mine to transition to mechanical cutting, rather than traditional drilling and blasting, improving overall productivityand throughput at the operation, and supporting the increased hoisting capacity that a third shaft will support.
Lagunas Norte Life Extension Project, La Libertad, Peru11
In 2016, the Company completed a prefeasibility study for a 6,000 tonne per day grinding-flotation-autoclave and carbon-in-leach processingcircuit. The project has the potential to extend the life of the Lagunas Norte mine by approximately 10 years by treating refractory materiallocated under the mine’s existing oxide ore body. By employing strategies to optimize and increase the recovery of carbonaceous oxide orefrom existing stockpiles at the mine, we have been able to re-sequence this project in two parts, deferring the capital expenditures necessary forrefractory ore processing. BARRICK THIRD QUARTER 2017 6 PRESS RELEASE

The first component of the project would involve the construction of a grinding and carbon-in-leach processing circuit that would treat remainingcarbonaceous oxide material at Lagunas Norte. Environmental permits for these facilities are already in hand. Pending completion of thefeasibility study, a positive investment decision, and receipt of construction permits, work on these facilities could begin in late 2018, with firstproduction in 2020. Construction of the flotation and pressure oxidation circuits would follow this, subject to Environmental Impact Assessmentapproval and a positive investment decision by the Company.
Work in 2017 has focused on completing a feasibility study, including additional drilling to improve orebody knowledge, and further metallurgicaltesting.
Pascua-Lama Project, San Juan, Argentina/Atacama Region, Chile
We have made significant progress on a prefeasibility study for the development of an underground, block caving operation at Pascua-Lama.The project would utilize the existing process plant and tailings facility on the Argentinean side of the border, construction of which is alreadywell advanced.
In order to complete the prefeasibility study, de-risk the project and improve economics, we are undertaking a number of optimization studies,along with a focused drilling campaign during the 2017/2018 summer season in the southern hemisphere. Previous drilling on the deposit wasprimarily undertaken in support of open pit mining plans. This campaign will focus on improving ore body knowledge on the Argentinean side ofthe deposit where further data is needed to validate underground development plans and metallurgy.
A switch to underground mining addresses a number of stakeholder concerns by significantly reducing surface land disturbance and thereforethe overall environmental footprint of the project, as compared to an open pit operation. In addition, an underground mine would be lesssusceptible to weather-related production interruptions during the winter season.
In keeping with Barrick’s strategic cooperation agreement with Shandong Gold, representatives from Shandong will also work with the projectteam to exchange knowledge, experience and technologies that have the potential to further optimize Pascua-Lama.
TECHNICAL INFORMATION
The scientific and technical information contained in this press release has been reviewed and approved by Steven Haggarty, P. Eng., SeniorDirector, Metallurgy of Barrick, Rick Sims, Registered Member SME, Senior Director, Resources and Reserves of Barrick, and PatrickGarretson, Registered Member SME, Senior Director, Life of Mine Planning of Barrick, each a “Qualified Person” as defined in NationalInstrument 43-101 Standards of Disclosure for Mineral Projects. BARRICK THIRD QUARTER 2017 7 PRESS RELEASE
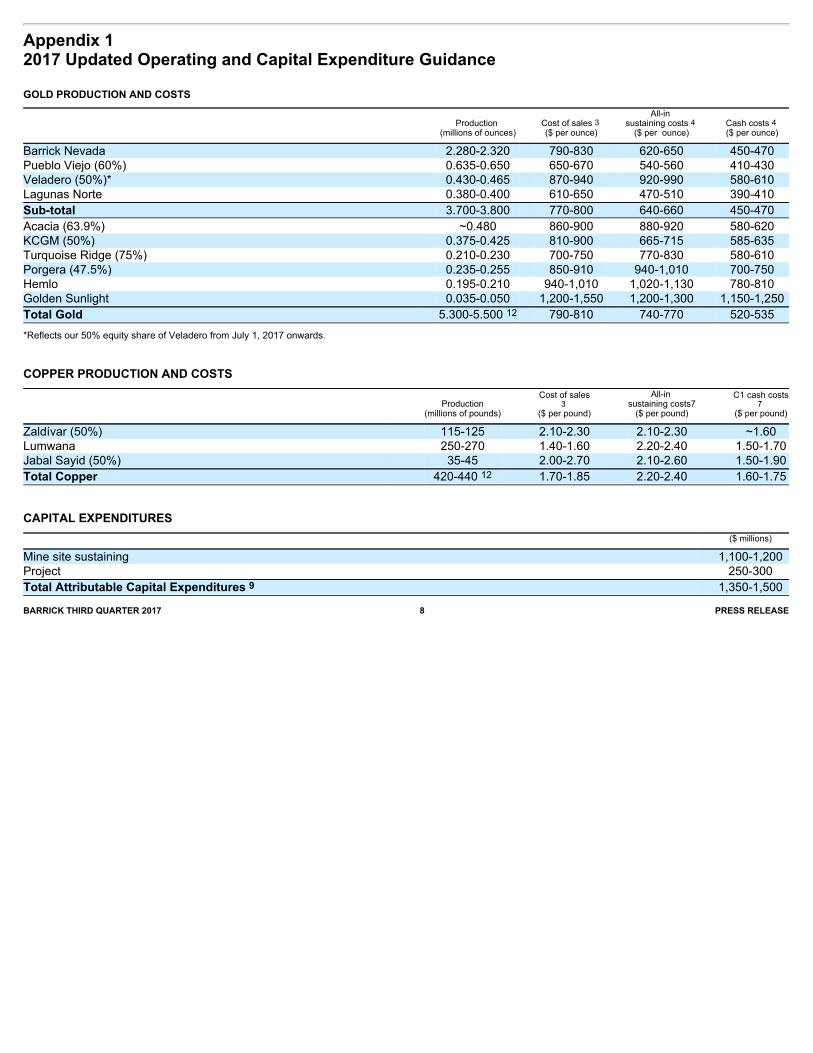
Appendix 12017 Updated Operating and Capital Expenditure Guidance
GOLD PRODUCTION AND COSTS
Production (millions of ounces)
Cost of sales 3 ($ per ounce)
All-in sustaining costs 4
($ per ounce)
Cash costs 4 ($ per ounce)
Barrick Nevada 2.280-2.320 790-830 620-650 450-470Pueblo Viejo (60%) 0.635-0.650 650-670 540-560 410-430Veladero (50%)* 0.430-0.465 870-940 920-990 580-610Lagunas Norte 0.380-0.400 610-650 470-510 390-410
Sub-total 3.700-3.800 770-800 640-660 450-470Acacia (63.9%) ~0.480 860-900 880-920 580-620KCGM (50%) 0.375-0.425 810-900 665-715 585-635Turquoise Ridge (75%) 0.210-0.230 700-750 770-830 580-610Porgera (47.5%) 0.235-0.255 850-910 940-1,010 700-750Hemlo 0.195-0.210 940-1,010 1,020-1,130 780-810Golden Sunlight 0.035-0.050 1,200-1,550 1,200-1,300 1,150-1,250
Total Gold 5.300-5.500 12 790-810 740-770 520-535
*Reflects our 50% equity share of Veladero from July 1, 2017 onwards.
COPPER PRODUCTION AND COSTS
Production(millions of pounds)
Cost of sales3
($ per pound)
All-in sustaining costs7
($ per pound)
C1 cash costs7
($ per pound)
Zaldívar (50%) 115-125 2.10-2.30 2.10-2.30 ~1.60Lumwana 250-270 1.40-1.60 2.20-2.40 1.50-1.70Jabal Sayid (50%) 35-45 2.00-2.70 2.10-2.60 1.50-1.90
Total Copper 420-440 12 1.70-1.85 2.20-2.40 1.60-1.75
CAPITAL EXPENDITURES
($ millions)
Mine site sustaining 1,100-1,200Project 250-300
Total Attributable Capital Expenditures 9 1,350-1,500
BARRICK THIRD QUARTER 2017 8 PRESS RELEASE

Appendix 22017 Outlook Assumptions and Economic Sensitivity Analysis
2017 Guidance Assumption
Hypothetical Change
Impact on Revenue (millions)
Impact on Cost of sales 3
(millions)
Impact on All-in sustaining
costs 4,7
Gold revenue, net of royalties $1,050/oz +/- $100/oz +/- $142 +/- $4 +/- $3/ozCopper revenue, net of royalties 13 $2.25/lb + $0.50/lb + $58 + $4 + $0.03/lbCopper revenue, net of royalties 13 $2.25/lb - $0.50/ lb - $46 - $3 - $0.03/ lbGold all-in sustaining costs 4
WTI crude oil price 14 $55/bbl +/- $10/bbl n/a +/- $5 +/- $3/ozAustralian dollar exchange rate 0.75 :1 +/- 10% n/a +/- $8 +/- $5/ozArgentine peso exchange rate 16.50 : 1 +/- 10% n/a +/- $2 +/- $1/ozCanadian dollar exchange rate 1.32 : 1 +/- 10% n/a +/- $8 +/- $6/oz
Copper all-in sustaining costs 7 WTI crude oil price 14 $55/bbl +/- $10/bbl n/a +/- $1 +/- $0.01/lbChilean peso exchange rate 675 : 1 +/- 10% n/a +/- $1 +/- $0.01/lb
BARRICK THIRD QUARTER 2017 9 PRESS RELEASE

EndnotesENDNOTE 1
“Adjusted net earnings” and “adjusted net earnings per share” are non-GAAP financial performance measures. Adjusted net earnings excludes the following from net earnings:certain impairment charges (reversals) related to intangibles, goodwill, property, plant and equipment, and investments; gains (losses) and other one-time costs relating toacquisitions or dispositions; foreign currency translation gains (losses); significant tax adjustments not related to current period earnings; unrealized gains (losses) on non-hedgederivative instruments; and the tax effect and non-controlling interest of these items. The Company uses this measure internally to evaluate our underlying operating performancefor the reporting periods presented and to assist with the planning and forecasting of future operating results. Barrick believes that adjusted net earnings is a useful measure of ourperformance because these adjusting items do not reflect the underlying operating performance of our core mining business and are not necessarily indicative of future operatingresults. Adjusted net earnings and adjusted net earnings per share are intended to provide additional information only and do not have any standardized meaning under IFRS andmay not be comparable to similar measures of performance presented by other companies. They should not be considered in isolation or as a substitute for measures ofperformance prepared in accordance with IFRS. Further details on these non-GAAP measures are provided in the MD&A accompanying Barrick’s financial statements filed fromtime to time on SEDAR at www.sedar.com and on EDGAR at www.sec.gov.
Reconciliation of Net Earnings to Net Earnings per Share, Adjusted Net Earnings and Adjusted Net Earnings per Share ($ millions, except per share amounts in dollars) For the three months ended September 30 For the nine months ended September 30 2017 2016 2017 2016 Net earnings (loss) attributable to equity holders of the
Company $ (11) $ 175 $ 1,752 $ 230 Impairment charges (reversals) related to intangibles,
goodwill, property, plant and equipment, and investments1 2 49 (1,128) 54
Acquisition/disposition (gains)/losses 2 (5) 37 (882) 35 Foreign currency translation (gains)/losses 25 19 60 181 Significant tax adjustments 3 174 5 183 59 Other expense adjustments 4 103 1 130 75 Unrealized gains on non-hedge derivative instruments (9) (12) (6) (23) Tax effect and non-controlling interest 5 (93) 4 500 (48)
Adjusted net earnings $ 186 $ 278 $ 609 $ 563
Net earnings (loss) per share 6 (0.01) 0.15 1.50 0.20 Adjusted net earnings per share 6 0.16 0.24 0.52 0.48
1 Net impairment reversals for the nine month period ended September 30, 2017 primarily relate to impairment reversals at the Cerro Casale project upon reclassification of the project’s netassets as held-for-sale as at March 31, 2017.
2 Disposition gains for the three and nine month periods ended September 30, 2017 primarily relate to the sale of a 50% interest in the Veladero mine and the gain related to the sale of a 25%interest in the Cerro Casale project.
3 Significant tax adjustments for the three and nine month periods ended September 30, 2017 primarily relate to a tax provision relating to the impact of the proposed framework for Acaciaoperations in Tanzania.
4 Other expense adjustments for the three and nine month periods ended September 30, 2017 primarily relate to debt extinguishment costs.5 Tax effect and non-controlling interest for the nine month period ended September 30, 2017 primarily relates to the impairment reversals at the Cerro Casale project discussed above.6 Calculated using weighted average number of shares outstanding under the basic method of earnings per share.
ENDNOTE 2
“Free cash flow” is a non-GAAP financial performance measure which excludes capital expenditures from net cash provided by operating activities. Barrick believes this to be auseful indicator of our ability to operate without reliance on additional borrowing or usage of existing cash. Free cash flow is intended to provide additional information only anddoes not have any standardized meaning under IFRS and may not be comparable to similar measures of performance presented by other companies. Free cash flow should not beconsidered in isolation or as a substitute for measures of performance prepared in accordance with IFRS. Further details on these non-GAAP measures are provided in the MD&Aaccompanying Barrick’s financial statements filed from time to time on SEDAR at www.sedar.com and on EDGAR at www.sec.gov. BARRICK THIRD QUARTER 2017 10 PRESS RELEASE

Reconciliation of Net Cash Provided by Operating Activities to Free Cash Flow ($ millions) For the three months ended September 30 For the nine months ended September 30 2017 2016 2017 2016 Net cash provided by operating activities $ 532 $ 951 $ 1,475 $ 1,929 Capital expenditures (307) (277) (1,046) (800)
Free cash flow $ 225 $ 674 $ 429 $ 1,129
ENDNOTE 3Cost of sales applicable to gold per ounce is calculated using cost of sales applicable to gold on an attributable basis (removing the non-controlling interest of 40% Pueblo Viejoand 36.1% Acacia from cost of sales), divided by attributable gold ounces. Cost of sales applicable to copper per pound is calculated using cost of sales applicable to copperincluding our proportionate share of cost of sales attributable to equity method investments (Zaldívar and Jabal Sayid), divided by consolidated copper pounds (including ourproportionate share of copper pounds from our equity method investments).
ENDNOTE 4“Cash costs” per ounce and “All-in sustaining costs” per ounce are non-GAAP financial performance measures. “Cash costs” per ounce starts with cost of sales applicable to goldproduction, but excludes the impact of depreciation, the non-controlling interest of cost of sales, and includes by-product credits. “All-in sustaining costs” per ounce begin with“Cash costs” per ounce and add further costs which reflect the additional costs of operating a mine, primarily sustaining capital expenditures, general & administrative costs,minesite exploration and evaluation costs, and reclamation cost accretion and amortization. Barrick believes that the use of “cash costs” per ounce and “all-in sustaining costs” perounce will assist investors, analysts and other stakeholders in understanding the costs associated with producing gold, understanding the economics of gold mining, assessing ouroperating performance and also our ability to generate free cash flow from current operations and to generate free cash flow on an overall Company basis. “Cash costs” per ounceand “All-in sustaining costs” per ounce are intended to provide additional information only and do not have any standardized meaning under IFRS. Although a standardizeddefinition of all-in sustaining costs was published in 2013 by the World Gold Council (a market development organization for the gold industry comprised of and funded by 18 goldmining companies from around the world, including Barrick), it is not a regulatory organization, and other companies may calculate this measure differently. These measures shouldnot be considered in isolation or as a substitute for measures prepared in accordance with IFRS. Further details on these non-GAAP measures are provided in the MD&Aaccompanying Barrick’s financial statements filed from time to time on SEDAR at www.sedar.com and on EDGAR at www.sec.gov. BARRICK THIRD QUARTER 2017 11 PRESS RELEASE

Reconciliation of Gold Cost of Sales to Cash costs, All-in sustaining costs and All-in costs, including on a per ounce basis ($ millions, except per ounce information in dollars)
For the three months ended September 30
For the nine monthsended September 30
Footnote 2017 2016 2017 2016 Cost of sales applicable to gold production $ 1,147 $ 1,202 $ 3,544 $ 3,633
Depreciation (357) (373) (1,125) (1,108) By-product credits 1 (32) (59) (105) (143) Realized (gains)/losses on hedge and non-hedge derivatives 2 9 15 19 71 Non-recurring items 3 — 34 — 24 Other 4 (24) (9) (71) (24) Non-controlling interests (Pueblo Viejo and Acacia) 5 (73) (92) (218) (267)
Cash costs $ 670 $ 718 $ 2,044 $ 2,186
General & administrative costs 69 71 186 217 Minesite exploration and evaluation costs 6 16 10 39 26 Minesite sustaining capital expenditures 7 248 236 830 646 Rehabilitation - accretion and amortization (operating sites) 8 14 16 51 41 Non-controlling interest, copper operations and other 9 (67) (75) (199) (209)
All-in sustaining costs $ 950 $ 976 $ 2,951 $ 2,907
Project exploration and evaluation and project costs 6 84 34 217 129 Community relations costs not related to current operations 1 1 3 6 Project capital expenditures 7 53 35 192 124 Rehabilitation - accretion and amortization (non-operating sites) 8 3 2 16 7 Non-controlling interest and copper operations 9 (6) (7) (12) (38)
All-in costs $ 1,085 $ 1,041 $ 3,367 $ 3,135
Ounces sold - equity basis (000s ounces) 11 1,227 1,386 3,930 3,984
Cost of sales per ounce 10 $ 820 $ 766 $ 791 $ 803
Cash costs per ounce 12 $ 546 $ 518 $ 520 $ 549 Cash costs per ounce (on a co-product basis) 11,12 $ 565 $ 550 $ 539 $ 575
All-in sustaining costs per ounce 12 $ 772 $ 704 $ 750 $ 730 All-in sustaining costs per ounce (on a co-product basis) 12,13 $ 791 $ 736 $ 769 $ 756
All-in costs per ounce 12 $ 884 $ 751 $ 856 $ 787 All-in costs per ounce (on a co-product basis) 12,13 $ 903 $ 783 $ 875 $ 813
1 By-product credits Revenues include the sale of by-products for our gold and copper mines for the three and nine months ended September 30, 2017 of $32 million and $105 million, respectively, (2016:
$50 million and $110 million, respectively) and energy sales from the Monte Rio power plant at our Pueblo Viejo mine for the three and nine months ended September 30, 2017 of $niland $nil, respectively, (2016: $9 million and $33 million, respectively) up until its disposition on August 18, 2016.
2 Realized (gains)/losses on hedge and non-hedge derivatives Includes realized hedge losses of $8 million and $22 million, respectively, for the three and nine month periods ended September 30, 2017 (2016: $15 million and $59 million,
respectively), and realized non-hedge losses of $1 million and gains of $3 million, respectively, for the three and nine month periods ended September 30, 2017 (2016: losses of $niland $12 million, respectively). Refer to Note 5 to the Financial Statements for further information.
3 Non-recurring items Non-recurring items in 2016 consist of $34 million in a reduction in cost of sales attributed to insurance proceeds recorded in the third quarter of 2016 related to the 2015 oxygen plant
motor failure at Pueblo Viejo and $10 million in abnormal costs at Veladero. These costs are not indicative of our cost of production and have been excluded from the calculation ofcash costs.
4 Other Other adjustments for the three and nine month periods ended September 30, 2017 include adding the net margins related to power sales at Pueblo Viejo of $nil and $nil,
respectively, (2016: $1 million and $5 million, respectively), adding the cost of treatment and refining charges of $nil and $1 million, respectively, (2016: $3 million and $12 million,respectively) and the removal of cash costs and by-product credits associated with our Pierina mine, which is mining incidental ounces as it enters closure, of $25 million and$73 million, respectively (2016: $14 million and $42 million, respectively).
5 Non-controlling interests (Pueblo Viejo and Acacia) Non-controlling interests include non-controlling interests related to gold production of $103 million and $317 million, respectively, for the three and nine month periods ended
September 30, 2017 (2016: $124 million and $381 million, respectively). Refer to Note 5 to the Financial Statements for further information. BARRICK THIRD QUARTER 2017 12 PRESS RELEASE

6 Exploration and evaluation costs Exploration, evaluation and project expenses are presented as minesite sustaining if it supports current mine operations and project if it relates to future projects. Refer to page 30 of
Barrick’s third quarter MD&A.7 Capital expenditures Capital expenditures are related to our gold sites only and are presented on a 100% accrued basis. They are split between minesite sustaining and project capital expenditures.
Project capital expenditures are distinct projects designed to increase the net present value of the mine and are not related to current production. Significant projects in the currentyear are stripping at Cortez Crossroads, underground development at Cortez Hills Lower Zone and the range front declines, Lagunas Norte Refractory Ore Project and Goldrush.Refer to page 29 of Barrick’s third quarter MD&A.
8 Rehabilitation—accretion and amortization Includes depreciation on the assets related to rehabilitation provisions of our gold operations and accretion on the rehabilitation provision of our gold operations, split between
operating and non-operating sites.9 Non-controlling interest and copper operations Removes general & administrative costs related to non-controlling interests and copper based on a percentage allocation of revenue. Also removes exploration, evaluation and project
expenses, rehabilitation costs and capital expenditures incurred by our copper sites and the non-controlling interest of our Acacia and Pueblo Viejo operating segments and SouthArturo. Figures remove the impact of Pierina. The impact is summarized as the following:
($ millions)
For the three months ended September30
For the nine months ended September30
Non-controlling interest, copper operations and other 2017 2016 2017 2016
General & administrative costs $ (5) $ (8) $ (13) $ (31) Minesite exploration and evaluation expenses (6) (2) (13) (6) Rehabilitation - accretion and amortization (operating sites) (2) (2) (8) (5) Minesite sustaining capital expenditures (54) (63) (165) (167)
All-in sustaining costs total $ (67) $ (75) $ (199) $ (209)
Project exploration and evaluation and project costs (3) (3) (9) (8) Project capital expenditures (3) (4) (3) (30)
All-in costs total $ (6) $ (7) $ (12) $ (38)
10 Ounces sold - equity basis Figures remove the impact of Pierina as the mine is currently going through closure.11 Cost of sales per ounce Figures remove the cost of sales impact of Pierina of $38 million and $119 million, respectively, for the three and nine month periods ended September 30, 2017 (2016: $17 million
and $52 million, respectively), as the mine is currently going through closure. Cost of sales per ounce excludes non-controlling interest related to gold production. Cost of salesapplicable to gold per ounce is calculated using cost of sales on an attributable basis (removing the non-controlling interest of 40% Pueblo Viejo and 36.1% Acacia from cost of sales),divided by attributable gold ounces.
12 Per ounce figures Cost of sales per ounce, cash costs per ounce, all-in sustaining costs per ounce and all-in costs per ounce may not calculate based on amounts presented in this table due to
rounding.13 Co-product costs per ounce Cash costs per ounce, all-in sustaining costs per ounce and all-in costs per ounce presented on a co-product basis removes the impact of by-product credits of our gold production
(net of non-controlling interest) calculated as:
($millions) For the three months ended
September 30 For the nine months ended
September 30 2017 2016 2017 2016
By-product credits $ 32 $ 59 $ 105 $ 143 Non-controlling interest (7) (14) (24) (40)
By-product credits (net of non-controlling interest) $ 25 $ 45 $ 81 $ 103
ENDNOTE 5Includes $105 million of cash, primarily held at Acacia, which may not be readily deployed.
ENDNOTE 6Amount excludes capital leases and includes Acacia (100% basis).
ENDNOTE 7“C1 cash costs” per pound and “All-in sustaining costs” per pound are non-GAAP financial performance measures. “C1 cash costs” per pound is based on cost of sales butexcludes the impact of depreciation and royalties and includes treatment and refinement charges. “All-in sustaining costs” per pound begins with “C1 cash costs” per pound andadds further costs which reflect the additional costs of operating a mine, primarily sustaining capital expenditures, general & administrative costs and royalties. Barrick believes thatthe use of “C1 cash costs” per pound and “all-in sustaining costs” per pound will assist investors, analysts, and other stakeholders in understanding the costs associated withproducing copper, understanding the economics of copper mining, assessing our operating performance, and also our ability to generate free cash flow from current operations andto generate free cash flow on an overall Company basis. “C1 cash costs” per pound and “All-in sustaining costs” per pound are intended to provide additional information only, donot have any BARRICK THIRD QUARTER 2017 13 PRESS RELEASE

standardized meaning under IFRS, and may not be comparable to similar measures of performance presented by other companies. These measures should not be considered inisolation or as a substitute for measures of performance prepared in accordance with IFRS. Further details on these non-GAAP measures are provided in the MD&A accompanyingBarrick’s financial statements filed from time to time on SEDAR at www.sedar.com and on EDGAR at www.sec.gov.
Reconciliation of Copper Cost of Sales to C1 cash costs and All-in sustaining costs, including on a per pound basis ($ millions, except per pound information in dollars) For the three months ended September 30 For the nine months ended September 30 2017 2016 2017 2016
Cost of sales $108 $66 $292 $235 Depreciation/amortization (26) (10) (59) (30) Treatment and refinement charges 44 40 116 124 Cash cost of sales applicable to equity method investments 53 64 170 150 Less: royalties (12) (7) (27) (32) By-product credits (1) — (4) —
C1 cash cost of sales $166 $153 $488 $447
General & administrative costs 3 — 9 11 Rehabilitation - accretion and amortization 4 1 9 5 Royalties 12 7 27 32 Minesite exploration and evaluation costs 4 — 5 — Minesite sustaining capital expenditures 50 44 137 121
All-in sustaining costs $239 $205 $675 $616
Pounds sold - consolidated basis (millions pounds) 107 102 298 298
Cost of sales per pound 1,2 $1.67 $1.43 $1.72 $1.41
C1 cash cost per pound 1 $1.56 $1.50 $1.64 $1.50
All-in sustaining costs per pound 1 $2.24 $2.02 $2.27 $2.08
1 Cost of sales per pound, C1 cash costs per pound and all-in sustaining costs per pound may not calculate based on amounts presented in this table due to rounding.2 Cost of sales applicable to copper per pound is calculated using cost of sales including our proportionate share of cost of sales attributable to equity method investments (Zaldívar and Jabal
Sayid), divided by consolidated copper pounds (including our proportionate share of copper pounds from our equity method investments).
ENDNOTE 8
Barrick’s share.
ENDNOTE 9
Includes our 60% share of Pueblo Viejo and South Arturo, our 63.9% share of Acacia, our 50% share of Zaldívar and Jabal Sayid and our share of joint operations, including our50% sale of Veladero from July 1, 2017 onwards.
ENDNOTE 10
For additional detail, see the Technical Report on the Cortez Joint Venture Operations, Lander and Eureka Counties, State of Nevada, USA, dated March 21, 2016, and filed onSEDAR and EDGAR on March 28, 2016.
ENDNOTE 11
For addition detail, see the Technical Report on the Lagunas Norte Mine, La Libertad Region, Peru, dated March 21, 2016, and filed on SEDAR and EDGAR on March 28, 2016.
ENDNOTE 12
Operating unit guidance ranges for production reflect expectations at each individual operating unit, but do not necessarily add up to the corporate-wide guidance range total.
ENDNOTE 13
As at September 30, 2017, utilizing option collar strategies, the Company has protected the downside on approximately 33 million pounds of expected remaining 2017 copperproduction at an average floor price of $2.39 per pound and can participate in the upside on the same amount up to an average of $2.97 per pound. In addition, the Company hasprotected the downside on approximately 60 million pounds of expected copper production for the first half of 2018 at an average floor price of $2.83 per pound and can participatein the upside on the same amount up to an average of $3.25 per pound. Our remaining copper production is subject to market prices.
ENDNOTE 14
Due to our hedging activities, which are reflected in these sensitivities, we are partially protected against changes in these factors. BARRICK THIRD QUARTER 2017 14 PRESS RELEASE

Key Statistics Barrick Gold Corporation (in United States dollars) Three months ended September 30, Nine months ended September 30, 2017 2016 2017 2016 Financial Results (millions) Revenues $1,993 $2,297 $6,146 $6,239 Cost of sales 1,270 1,291 3,889 3,951 Net earnings 1 (11) 175 1,752 230 Adjusted net earnings 2 186 278 609 563 Adjusted EBITDA 2 899 1,211 2,932 2,976 Total capital expenditures - sustaining 3 248 236 830 646 Total project capital expenditures 3 53 35 192 124 Net cash provided by operating activities 532 951 1,475 1,929 Free cash flow 2 225 674 429 1,129 Per share data (dollars)
Net earnings (basic and diluted) (0.01) 0.15 1.50 0.20 Adjusted net earnings (basic) 2 $0.16 $0.24 $0.52 $0.48
Weighted average diluted common shares (millions) 1,166 1,165 1,166 1,165
Operating Results Gold production (thousands of ounces) 4 1,243 1,381 3,984 4,001 Gold sold (thousands of ounces) 4 1,227 1,386 3,930 3,984 Per ounce data
Average spot gold price $1,278 $1,335 $1,251 $1,260 Average realized gold price 2,4 1,274 1,333 1,250 1,259 Cost of sales (Barrick’s share) 4,5 820 766 791 803 All-in sustaining costs 2,4 $772 $704 $750 $730
Copper production (millions of pounds) 6 115 100 314 314 Copper sold (millions of pounds) 6 107 102 298 298 Per pound data
Average spot copper price $2.88 $2.16 $2.70 $2.14 Average realized copper price 2,6 3.05 2.18 2.81 2.17 Cost of sales (Barrick’s share) 6,7 1.67 1.43 1.72 1.41 C1 cash costs 2,6 1.56 1.50 1.64 1.50 All-in sustaining costs 2,6 $2.24 $2.02 $2.27 $2.08
As at September 30,
As at December 31,
2017 2016 Financial Position (millions) Cash and equivalents $2,025 $2,389 Working capital (excluding cash) $1,346 $1,155
1 Net earnings represents net earnings attributable to the equity holders of the Company.2 Adjusted net earnings, adjusted EBITDA, free cash flow, adjusted net earnings per share, realized gold price, all-in sustaining costs and realized copper price are non-GAAP financial
performance measures with no standardized meaning under IFRS and therefore may not be comparable to similar measures presented by other issuers. For further information and adetailed reconciliation of each non-GAAP measure to the most directly comparable IFRS measure, please see pages 49 to 63 of this MD&A.
3 Amounts presented on a consolidated accrued basis. Project capital expenditures are included in our calculation of all-in costs, but not included in our calculation of all-in sustainingcosts.
4 Includes Acacia on a 63.9% basis, Pueblo Viejo on a 60% basis, South Arturo on a 60% basis, and Veladero on a 100% basis up to June 30, 2017 and a 50% basis thereafter, whichreflects our equity share of production and sales. 2016 includes production and sales from Bald Mountain and Round Mountain up to January 11, 2016, the effective date of sale of theassets.
5 Cost of sales per ounce (Barrick’s share) is calculated as cost of sales - gold on an attributable basis excluding Pierina divided by gold ounces sold.6 Amounts reflect production and sales from Jabal Sayid and Zaldívar on a 50% basis, which reflects our equity share of production, and Lumwana.7 Cost of sales per pound (Barrick’s share) is calculated as cost of sales - copper plus our equity share of cost of sales attributable to Zaldívar and Jabal Sayid divided by copper
pounds sold. BARRICK THIRD QUARTER 2017 15 SUMMARY INFORMATION

Production and Cost Summary Production Three months ended September 30, Nine months ended September 30, 2017 2016 2017 2016
Gold (equity ounces (000s)) Barrick Nevada 1 520 547 1,782 1,554 Pueblo Viejo 2 154 189 468 511 Lagunas Norte 96 101 274 325 Veladero 3 99 116 322 367 Turquoise Ridge 68 72 147 201 Acacia 4 122 131 396 394 Other Mines - Gold 5 184 225 595 649
Total 1,243 1,381 3,984 4,001 Copper (equity pounds (millions)) 6 115 100 314 314 Cost of Sales per unit (Barrick’s share) Three months ended September 30, Nine months ended September 30, 2017 2016 2017 2016
Gold Cost of Sales per ounce ($/oz) 7 Barrick Nevada $ 762 $ 838 $ 791 $ 881 Pueblo Viejo 717 514 661 609 Lagunas Norte 612 658 601 662 Veladero 1,187 912 878 860 Turquoise Ridge 755 558 740 605 Acacia 808 840 796 861
Total $ 820 $ 766 $ 791 $ 803
Copper Cost of Sales per pound ($/lb) 8 $ 1.67 $ 1.43 $ 1.72 $ 1.41
All-in sustaining costs 9 Three months ended September 30, Nine months ended September 30, 2017 2016 2017 2016
Gold All-in Sustaining Costs ($/oz) Barrick Nevada 1 $ 597 $ 611 $ 603 $ 613 Pueblo Viejo 2 604 425 536 509 Lagunas Norte 470 530 457 557 Veladero 3 890 651 1,000 693 Turquoise Ridge 793 583 788 631 Acacia 4 939 998 907 961
Total $ 772 $ 704 $ 750 $ 730
Copper All-in Sustaining Costs ($/lb) 6 $ 2.24 $ 2.02 $ 2.27 $ 2.08
1 Reflects production and sales from Goldstrike, Cortez, and South Arturo on a 60% basis, which reflects our equity share.2 Reflects production and sales from Pueblo Viejo on a 60% basis, which reflects our equity share.3 Reflects production and sales from Veladero on a 100% basis up to June 30, 2017 and a 50% basis thereafter, which reflects our equity share.4 Reflects production and sales from Acacia on a 63.9% basis, which reflects our equity share.5 In 2017, Other Mines - Gold includes Golden Sunlight, Hemlo, Porgera on a 47.5% basis and Kalgoorlie on a 50% basis. In 2016, Other Mines - Gold includes Golden Sunlight, Hemlo,
Porgera on a 47.5% basis, Kalgoorlie on a 50% basis and production from Bald Mountain and Round Mountain up to January 11, 2016, the effective date of sale of the assets.6 Reflects production and sales from Lumwana, Jabal Sayid and Zaldívar on a 50% basis, which reflects our equity share.7 Cost of sales per ounce (Barrick’s share) is calculated as cost of sales - gold on an attributable basis excluding Pierina divided by gold equity ounces sold.8 Cost of sales per pound (Barrick’s share) is calculated as cost of sales - copper plus our equity share of cost of sales attributable to Zaldívar and Jabal Sayid divided by copper pounds
sold.9 All-in sustaining costs is a non-GAAP financial performance measure with no standardized meaning under IFRS and therefore may not be comparable to similar measures presented by
other issuers. For further information and a detailed reconciliation of this non-GAAP measure to the most directly comparable IFRS measure, please see pages 49 to 63 of our thirdquarter MD&A.
BARRICK THIRD QUARTER 2017 16 SUMMARY INFORMATION

MANAGEMENT’S DISCUSSION AND ANALYSIS (“MD&A”)
CAUTIONARY STATEMENT ON FORWARD-LOOKING INFORMATION
BARRICK THIRD QUARTER 2017 17 MANAGEMENT’S DISCUSSION AND ANALYSIS
This portion of the Quarterly Report provides management’s discussion andanalysis (“MD&A”) of the financial condition and results of operations, to enablea reader to assess material changes in financial condition and results ofoperations as at, and for the three and nine month periods endedSeptember 30, 2017, in comparison to the corresponding prior-year periods.The MD&A is intended to help the reader understand Barrick Gold Corporation(“Barrick”, “we”, “our” or the “Company”), our operations, financial performanceand present and future business environment. This MD&A, which has beenprepared as of October 25, 2017, is intended to supplement and complementthe condensed unaudited interim consolidated financial statements and notesthereto, prepared in accordance with International Accounting Standard 34Interim Financial Reporting (“IAS 34”) as issued by the International AccountingStandards Board (“IASB”), for the three and nine month periods endedSeptember 30, 2017 (collectively, the “Financial Statements”), which areincluded in this Quarterly Report on pages 65 to 85. You are encouraged toreview the Financial Statements in conjunction with your review of this MD&A.This MD&A should be read in conjunction with both the annual auditedconsolidated financial statements for the two years ended December 31, 2016,the related annual MD&A included in the 2016 Annual
Report, and the most recent Form 40–F/Annual Information Form on file with theU.S. Securities and Exchange Commission (“SEC”) and Canadian provincialsecurities regulatory authorities. These documents and additional informationrelating to the Company are available on SEDAR at www.sedar.com andEDGAR at www.sec.gov. Certain notes to the Financial Statements arespecifically referred to in this MD&A and such notes are incorporated byreference herein. All dollar amounts in this MD&A are in millions of United Statesdollars (“$” or “US$”), unless otherwise specified.
For the purposes of preparing our MD&A, we consider the materiality ofinformation. Information is considered material if: (i) such information results in,or would reasonably be expected to result in, a significant change in the marketprice or value of our shares; or (ii) there is a substantial likelihood that areasonable investor would consider it important in making an investmentdecision; or (iii) it would significantly alter the total mix of information available toinvestors. We evaluate materiality with reference to all relevant circumstances,including potential market sensitivity.
Certain information contained or incorporated by reference in this MD&A,including any information as to our strategy, projects, plans or future financial oroperating performance, constitutes “forward-looking statements”. Allstatements, other than statements of historical fact, are forward-lookingstatements. The words “believe”, “expect”, “anticipate”, “target”, “plan”,“objective”, “assume”, “intend”, “project”, “goal”, “continue”, “budget”, “estimate”,“potential”, “may”, “will”, “can”, “could”, “would” and similar expressions identifyforward-looking statements. In particular, this MD&A contains forward-lookingstatements including, without limitation, with respect to: (i) Barrick’s forward-looking production guidance; (ii) estimates of future cost of sales per ounce forgold and per pound for copper, cash costs per ounce and C1 cash costs perpound, and all-in-sustaining costs per ounce/pound; (iii) cash flow forecasts;(iv) projected capital, operating and exploration expenditures; (v) Barrick’sexpectations regarding the potential benefits resulting from a new partnershipbetween Acacia Mining plc (“Acacia”) and the Government of Tanzania;(vi) targeted debt and cost reductions; (vii) mine life and production rates;(viii) potential mineralization and metal or mineral
recoveries; (ix) savings from our improved capital management program;(x) Barrick’s Best-in-Class program (including potential improvements to financialand operating performance that may result from certain Best-in-Class initiatives);(xi) the timing and results of the prefeasibility study at Pascua-Lama; (xii) ourpipeline of high confidence projects at or near existing operations; (xiii) thebenefits of unifying the Cortez and Goldstrike operations; (xiv) our ability toconvert resources into reserves (xv) asset sales, joint ventures and partnerships;and (xvi) expectations regarding future price assumptions, financial performanceand other outlook or guidance.
Forward-looking statements are necessarily based upon a number of estimatesand assumptions including material estimates and assumptions related to thefactors set forth below that, while considered reasonable by the Company as atthe date of this MD&A in light of management’s experience and perception ofcurrent conditions and expected developments, are inherently subject tosignificant business, economic and competitive uncertainties and contingencies.Known and unknown factors could cause actual results to differ materially from
BARRICK THIRD QUARTER 2017 18 MANAGEMENT’S DISCUSSION AND ANALYSIS
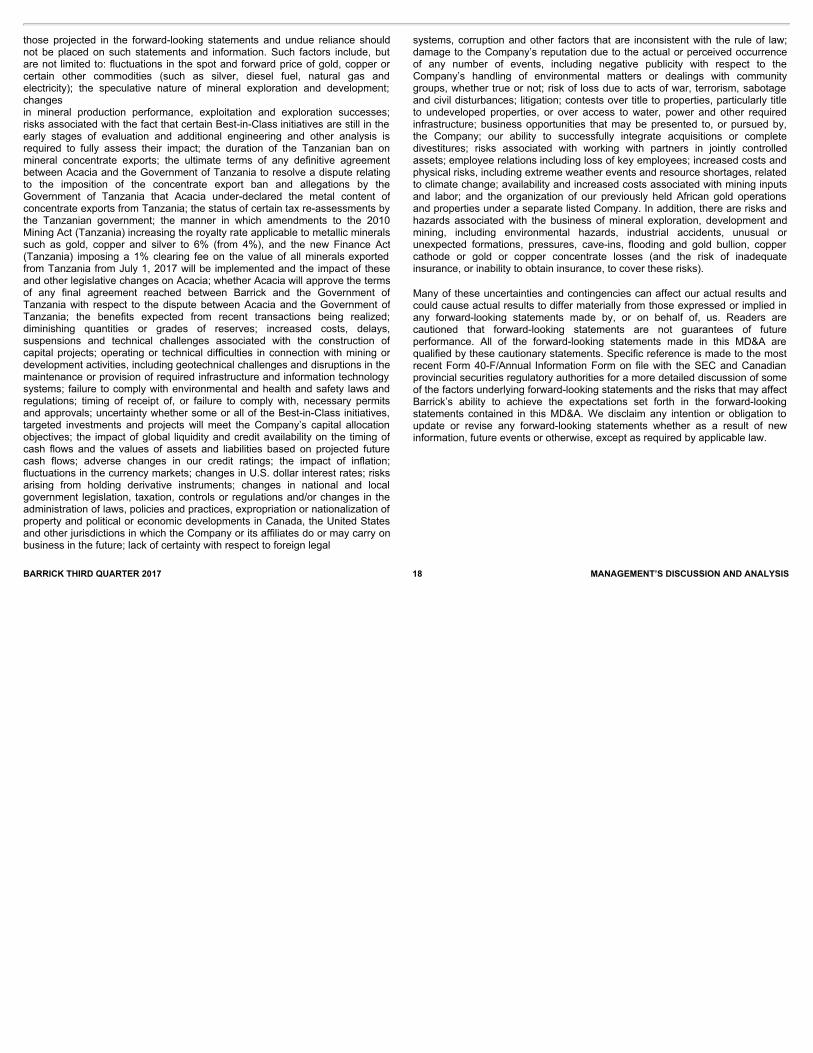
those projected in the forward-looking statements and undue reliance shouldnot be placed on such statements and information. Such factors include, butare not limited to: fluctuations in the spot and forward price of gold, copper orcertain other commodities (such as silver, diesel fuel, natural gas andelectricity); the speculative nature of mineral exploration and development;changesin mineral production performance, exploitation and exploration successes;risks associated with the fact that certain Best-in-Class initiatives are still in theearly stages of evaluation and additional engineering and other analysis isrequired to fully assess their impact; the duration of the Tanzanian ban onmineral concentrate exports; the ultimate terms of any definitive agreementbetween Acacia and the Government of Tanzania to resolve a dispute relatingto the imposition of the concentrate export ban and allegations by theGovernment of Tanzania that Acacia under-declared the metal content ofconcentrate exports from Tanzania; the status of certain tax re-assessments bythe Tanzanian government; the manner in which amendments to the 2010Mining Act (Tanzania) increasing the royalty rate applicable to metallic mineralssuch as gold, copper and silver to 6% (from 4%), and the new Finance Act(Tanzania) imposing a 1% clearing fee on the value of all minerals exportedfrom Tanzania from July 1, 2017 will be implemented and the impact of theseand other legislative changes on Acacia; whether Acacia will approve the termsof any final agreement reached between Barrick and the Government ofTanzania with respect to the dispute between Acacia and the Government ofTanzania; the benefits expected from recent transactions being realized;diminishing quantities or grades of reserves; increased costs, delays,suspensions and technical challenges associated with the construction ofcapital projects; operating or technical difficulties in connection with mining ordevelopment activities, including geotechnical challenges and disruptions in themaintenance or provision of required infrastructure and information technologysystems; failure to comply with environmental and health and safety laws andregulations; timing of receipt of, or failure to comply with, necessary permitsand approvals; uncertainty whether some or all of the Best-in-Class initiatives,targeted investments and projects will meet the Company’s capital allocationobjectives; the impact of global liquidity and credit availability on the timing ofcash flows and the values of assets and liabilities based on projected futurecash flows; adverse changes in our credit ratings; the impact of inflation;fluctuations in the currency markets; changes in U.S. dollar interest rates; risksarising from holding derivative instruments; changes in national and localgovernment legislation, taxation, controls or regulations and/or changes in theadministration of laws, policies and practices, expropriation or nationalization ofproperty and political or economic developments in Canada, the United Statesand other jurisdictions in which the Company or its affiliates do or may carry onbusiness in the future; lack of certainty with respect to foreign legal
systems, corruption and other factors that are inconsistent with the rule of law;damage to the Company’s reputation due to the actual or perceived occurrenceof any number of events, including negative publicity with respect to theCompany’s handling of environmental matters or dealings with communitygroups, whether true or not; risk of loss due to acts of war, terrorism, sabotageand civil disturbances; litigation; contests over title to properties, particularly titleto undeveloped properties, or over access to water, power and other requiredinfrastructure; business opportunities that may be presented to, or pursued by,the Company; our ability to successfully integrate acquisitions or completedivestitures; risks associated with working with partners in jointly controlledassets; employee relations including loss of key employees; increased costs andphysical risks, including extreme weather events and resource shortages, relatedto climate change; availability and increased costs associated with mining inputsand labor; and the organization of our previously held African gold operationsand properties under a separate listed Company. In addition, there are risks andhazards associated with the business of mineral exploration, development andmining, including environmental hazards, industrial accidents, unusual orunexpected formations, pressures, cave-ins, flooding and gold bullion, coppercathode or gold or copper concentrate losses (and the risk of inadequateinsurance, or inability to obtain insurance, to cover these risks).
Many of these uncertainties and contingencies can affect our actual results andcould cause actual results to differ materially from those expressed or implied inany forward-looking statements made by, or on behalf of, us. Readers arecautioned that forward-looking statements are not guarantees of futureperformance. All of the forward-looking statements made in this MD&A arequalified by these cautionary statements. Specific reference is made to the mostrecent Form 40-F/Annual Information Form on file with the SEC and Canadianprovincial securities regulatory authorities for a more detailed discussion of someof the factors underlying forward-looking statements and the risks that may affectBarrick’s ability to achieve the expectations set forth in the forward-lookingstatements contained in this MD&A. We disclaim any intention or obligation toupdate or revise any forward-looking statements whether as a result of newinformation, future events or otherwise, except as required by applicable law.

BARRICK THIRD QUARTER 2017 19 MANAGEMENT’S DISCUSSION AND ANALYSIS
USE OF NON-GAAP FINANCIAL PERFORMANCE MEASURES
We use the following non-GAAP financial performance measures in our MD&A: ● “adjusted net earnings” ● “free cash flow” ● “EBITDA” ● “adjusted EBITDA” ● “cash costs per ounce” ● “C1 cash costs per pound” ● “all-in sustaining costs per ounce/pound” ● “all-in costs per ounce” and ● “realized price”
For a detailed description of each of the non-GAAP measures used in thisMD&A and a detailed reconciliation to the most directly comparable measureunder International Financial Reporting Standards (“IFRS”), please refer to theNon-GAAP Financial Performance Measures section of this MD&A on pages 49to 63. Each non-GAAP financial performance measure has been annotatedwith a reference to an endnote on page 64. The non-GAAP financialperformance measures set out in this MD&A are intended to provide additionalinformation to investors and do not have any standardized meaning underIFRS, and therefore may not be comparable to other issuers, and should not beconsidered in isolation or as a substitute for measures of performance preparedin accordance with IFRS.
Changes in presentation of non-GAAP financial performance measures
Adjusted EBITDAStarting in the second quarter 2017 MD&A, we began including additionaladjusting items in the Adjusted EBITDA reconciliation to provide a greater levelof consistency with the adjusting items included in our Adjusted Net Earningsreconciliation. These new items include: acquisition/disposition gains/losses;foreign currency translation gains/losses; other expense adjustments; andunrealized gains on non-hedge derivative instruments. These amounts areadjusted to remove any impact on finance costs/income, income tax expenseand/or depreciation as they do not affect EBITDA. The prior periods have beenrestated to reflect the change in presentation. We believe this additionalinformation will assist analysts, investors and other stakeholders of Barrick inbetter understanding our ability to generate liquidity from operating cash flow,by excluding these amounts from the calculation as they are not indicative ofthe performance of our core mining business and not necessarily reflective ofthe underlying operating results for the periods presented.
INDEX
page
Overview
Financial and Operating Highlights 20 Key Business Developments 25
Full Year 2017 Outlook
26
Review of Financial Results
27
Revenue 27 Production Costs 28 Capital Expenditures 29 General and Administrative Expenses 29 Exploration, Evaluation and Project Expenses 30 Finance Costs, Net 30 Additional Significant Statement of Income Items 30
Income Tax Expense
31
Financial Condition Review
32
Balance Sheet Review 32 Shareholders’ Equity 32 Financial Position and Liquidity 32
Summary of Cash Inflow (Outflow)
33
Operating Segments Performance
34
Barrick Nevada 35 Pueblo Viejo 37 Lagunas Norte 38 Veladero 39 Turquoise Ridge 42 Acacia Mining plc 43
Pascua-Lama
46
Commitments and Contingencies
47
Review of Quarterly Results
48
Internal Control over Financial Reporting and Disclosure Controls andProcedures
48
IFRS Critical Accounting Policies and Accounting Estimates
49
Non-GAAP Financial Performance Measures
49
Technical Information
64
Endnotes
64

OVERVIEWFinancial and Operating Highlights
($ millions, except per share amounts in dollars) For the three months ended
September 30 For the nine months ended
September 30 2017 2016 2017 2016
Net earnings (loss) attributable to equity holders of the Company $ (11) $ 175 $ 1,752 $ 230 Per share (dollars) 1 (0.01) 0.15 1.50 0.20
Adjusted net earnings 2 186 278 609 563 Per share (dollars) 1,2 0.16 0.24 0.52 0.48
Operating cash flow 532 951 1,475 1,929 Free cash flow 2 $ 225 $ 674 $ 429 $ 1,129
1 Calculated using weighted average number of shares outstanding under the basic method of earnings per share of 1,166 million shares for the three and nine months ended September 30,2017 (2016: 1,165 million shares).
2 Adjusted net earnings and free cash flow are non-GAAP financial performance measures with no standardized meaning under IFRS and therefore may not be comparable to similar measuresof performance presented by other issuers. For further information and a detailed reconciliation of the non-GAAP measures used in this section of the MD&A to the most directly comparableIFRS measure, please see pages 49 to 63 of this MD&A.
BARRICK THIRD QUARTER 2017 20 MANAGEMENT’S DISCUSSION AND ANALYSIS

Net Earnings, Adjusted Net Earnings, Operating Cash Flow and Free Cash Flow
Factors affecting net earnings and adjusted net earnings 1 - three months ended September 30, 2017
1 These are non-GAAP financial performance measures with no standardized meaning under IFRS and therefore may not be comparable to similar measures of performance presented by
other issuers. For further information and a detailed reconciliation of the non-GAAP measures used in this section of the MD&A to the most directly comparable IFRS measure, please seepages 49 to 63 of this MD&A.
2 Primarily consists of earnings from equity investees (~$28 million) and finance costs (~$20 million).3 Estimated impact of foreign exchange.
Net earnings attributable to equity holders of Barrick (“net earnings”) for the third quarter of 2017 were a net loss of $11 million compared with net earnings of$175 million in the same prior year period. The decrease was due to lower revenues attributed to the decrease in gold sales volume, mainly due to lower grades atPueblo Viejo, Hemlo and Lagunas Norte and the Tanzanian concentrate export ban, and market gold prices which were $57 per ounce lower compared to the prioryear period. We had higher debt extinguishment costs associated with our $1 billion of debt repayments in the third quarter of 2017 combined with higher direct miningcosts, higher exploration and evaluation costs and higher depreciation expense. We also recognized a $172 million tax provision relating to the impact of the proposedframework for Acacia operations in Tanzania. These decreases in net earnings were partially offset by higher earnings from equity investees and a decrease ininterest expense associated with debt repayments. After adjusting for items that are not indicative of future operating earnings, adjusted net earnings1 were$186 million in the third quarter of 2017, 33% lower than the same prior year period.
Significant adjusting items (pre-tax and non-controlling interest effects) in the third quarter of 2017 include: ● $101 million in losses on debt extinguishment; and ● $172 million in a tax provision relating to the impact of the proposed framework for Acacia operations in Tanzania; partially offset by; ● $93 million in tax effects and non-controlling interest impact mainly in relation to the two adjustments discussed above.
Refer to page 50 for a full list of reconciling items between net earnings and adjusted net earnings for the current and prior year periods. BARRICK THIRD QUARTER 2017 21 MANAGEMENT’S DISCUSSION AND ANALYSIS

Factors affecting net earnings and adjusted net earnings 1 - nine months ended September 30, 2017
1 These are non-GAAP financial performance measures with no standardized meaning under IFRS and therefore may not be comparable to similar measures of performance presented by
other issuers. For further information and a detailed reconciliation of the non-GAAP measures used in this section of the MD&A to the most directly comparable IFRS measure, please seepages 49 to 63 of this MD&A.
2 Primarily consists of earnings from equity investees (~$45 million) and finance costs (~$27 million).3 Estimated impact of foreign exchange.
Net earnings for the nine months ended September 30, 2017 were $1,752 million compared with $230 million in the same prior year period. The significant increasewas primarily due to a $1,120 million impairment reversal ($518 million net of tax and non-controlling interest) recorded in the first quarter of 2017 as a result of theindicative fair value of the Cerro Casale project related to our divestment of 25% of the project. This was combined with a $689 million ($686 million net of tax andnon-controlling interest) gain on the sale of a 50% interest in the Veladero mine and a $193 million ($192 million net of tax and non-controlling interest) gain on thesale of a 25% interest in the Cerro Casale project during the second quarter of 2017. Partially offsetting these increases in net earnings was an increase in income taxexpense. After adjusting for items that are not indicative of future operating earnings, adjusted net earnings1 of $609 million in the nine months ended September 30,2017 were 8% higher than the same prior year period. The increase in adjusted net earnings was primarily due to an increase in copper prices, combined withreduced interest expense associated with debt repayments, as well as lower direct mining costs driven by sales mix with higher sales volume from the lower costBarrick Nevada and lower relative sales volume from Hemlo and Acacia. This was further positively impacted by higher capitalized waste stripping costs at BarrickNevada, and negatively impacted by an increase in exploration and evaluation costs and higher depreciation expense.
Significant adjusting items (pre-tax and non-controlling interest effects) in the nine months ended September 30, 2017 include: ● $1,128 million in net impairment reversals primarily as a result of the indicative fair value of the Cerro Casale project related to our divestment of 25%; ● $689 million in a gain relating to the sale of a 50% interest in the Veladero mine; ● $193 million in a gain related to the sale of a 25% interest in the Cerro Casale project; partially offset by ● $500 million in tax effects and non-controlling interest impact mainly in relation to the Cerro Casale impairment reversal discussed above; ● $172 million in a tax provision relating to the impact of the proposed framework for Acacia operations in Tanzania; ● $127 million in losses on debt extinguishment; and ● $60 million in foreign currency translation losses primarily related to the devaluation of the Argentine Peso on VAT receivables.
Refer to page 50 for a full list of reconciling items between net earnings and adjusted net earnings for the current and prior year periods. BARRICK THIRD QUARTER 2017 22 MANAGEMENT’S DISCUSSION AND ANALYSIS

Factors affecting Operating Cash Flow and Free Cash Flow 1 - three months ended September 30, 2017
1 These are non-GAAP financial performance measures with no standardized meaning under IFRS and therefore may not be comparable to similar measures of performance presented by
other issuers. For further information and a detailed reconciliation of the non-GAAP measures used in this section of the MD&A to the most directly comparable IFRS measure, please seepages 49 to 63 of this MD&A.
2 Other primarily includes the negative impacts on free cash flow attributable to non-controlling interest (~$95 million) combined with an increase in legal costs (~$10 million) and in reclamationpayments (~$5 million).
In the third quarter of 2017, we generated $532 million in operating cash flow, compared to $951 million in the same prior year period. The decrease of $419 millionwas primarily due to lower gold sales resulting from lower grades at Pueblo Viejo, Hemlo and Lagunas Norte, and the Tanzanian concentrate export ban and relatedbuildup of inventory at Acacia. This was combined with higher cash taxes paid mainly related to income tax refunds received in the third quarter of 2016, as well ashigher direct mining costs as discussed previously. Operating cash flow was further negatively impacted by cash flows attributable to non-controlling interest,combined with an increase in exploration, evaluation and project expenses and the impact of lower gold prices.
Free cash flow 1 for the third quarter of 2017 was $225 million compared to $674 million in the same prior year period. The decrease primarily reflects lower operatingcash flows combined with higher capital expenditures. In the third quarter of 2017 capital expenditures on a cash basis were $307 million compared to $277 million inthe third quarter of 2016. The increase in capital expenditures of $30 million is primarily due to a planned $27 million increase in project capital expenditures primarilyat Barrick Nevada relating to the development of Crossroads and Cortez Hills Lower Zone, and the Goldrush project, partially offset by a decrease in pre-productionstripping at the South Arturo pit, which entered commercial production in August 2016. The increase in capital expenditures was also impacted by an increase inminesite sustaining capital expenditures at Barrick Nevada relating to higher capitalized stripping costs and the timing of a greater number of minesite sustainingprojects, as well as greater spending at Veladero relating to phases 4B and 5B of the leach pad expansion and additional equipment purchases.
The free cash flow 1 generated in the third quarter of 2017 was combined with existing cash balances, including the $960 million proceeds from the sale of a 50%interest in Veladero in the second quarter of 2017, to repay approximately $1 billion in debt in the third quarter of 2017. This allowed us to fully achieve our 2017 debtreduction target, reducing total debt by $1.5 billion for the year to date. BARRICK THIRD QUARTER 2017 23 MANAGEMENT’S DISCUSSION AND ANALYSIS

Factors affecting Operating Cash Flow and Free Cash Flow 1 - nine months ended September 30, 2017
1 These are non-GAAP financial performance measures with no standardized meaning under IFRS and therefore may not be comparable to similar measures of performance presented by
other issuers. For further information and a detailed reconciliation of the non-GAAP measures used in this section of the MD&A to the most directly comparable IFRS measure, please seepages 49 to 63 of this MD&A.
2 Other primarily includes the negative impacts on free cash flow attributable to non-controlling interest (~$100 million) combined with an increase in legal costs (~$20 million) and the change inVAT balances (~$25 million).
In the nine months ended September 30, 2017, we generated $1,475 million in operating cash flow, compared to $1,929 million in the same prior year period. Thedecrease of $454 million was primarily due to higher cash taxes paid during the second quarter of 2017 at Pueblo Viejo compared to the same prior year period as wemade our final 2016 tax payment and our first tax payment for 2017. This decrease in operating cash flows was combined with the buildup of working capital,specifically inventory balances at Acacia resulting from the Tanzania concentrate export ban, as well as an increase in exploration, evaluation and project expenses.This decrease was partially offset by higher copper prices and lower direct mining costs, as discussed in the above discussion of net earnings.
Free cash flow 1 for the nine months ended September 30, 2017 was $429 million compared to $1,129 million in the same prior year period. The decrease primarilyreflects lower operating cash flows combined with higher capital expenditures. In the nine months ended September 30, 2017, capital expenditures on a cash basiswere $1,046 million compared to $800 million in the nine months ended September 30, 2016. The increase in capital expenditures of $246 million is primarily due to aplanned increase in minesite sustaining capital expenditures at Barrick Nevada relating to higher capitalized stripping costs and the timing of a greater number ofminesite sustaining projects in the current period, as well as greater spending at Veladero relating to phase 4B and 5B of the leach pad expansion and equipmentpurchases. The increase in capital expenditures was also impacted by a $69 million increase in project capital expenditures primarily at Barrick Nevada relating to thedevelopment of Crossroads and Cortez Hills Lower Zone, and the Goldrush project, partially offset by a decrease in pre-production stripping at the South Arturo pit,which entered commercial production in August 2016.
The free cash flow 1 generated in the first nine months of 2017 was combined with existing cash balances, including the $960 million proceeds from the sale of a 50%interest in Veladero in the second quarter of 2017, to repay approximately $1.5 billion in debt in the first nine months of 2017. This allowed us to fully achieve our 2017debt reduction target in the third quarter of 2017. BARRICK THIRD QUARTER 2017 24 MANAGEMENT’S DISCUSSION AND ANALYSIS

BARRICK THIRD QUARTER 2017 25 MANAGEMENT’S DISCUSSION AND ANALYSIS
Key Business DevelopmentsSaleof50%ofVeladeroOn April 6, 2017, we announced a strategic cooperation agreement withShandong Gold Group Co., Ltd. (“Shandong”) where Shandong agreed toacquire 50 percent of Barrick’s Veladero mine in Argentina for $960 million. Thetransaction closed on June 30, 2017 and in the second quarter we recognized atotal gain of $689 million, partially on the sale of 50 percent to Shandong andpartially upon remeasurement of our remaining interest in Veladero. We haveaccounted for our remaining 50 percent interest as a joint operation andconsolidated our proportionate share of the assets and liabilities. We haverecognized our share of the revenue and expenses of Veladero starting July 1,2017. The transaction remains subject to net working capital adjustments.
In accordance with the acquisition method of accounting, the acquisition costhas been allocated on a preliminary basis to the underlying assets acquiredand liabilities assumed. In the third quarter of 2017, we progressed thepreliminary purchase price allocation and allocated fair values to inventory,PP&E and mining interest. We recognized a deferred tax liability for thedifference between the preliminary fair values and the tax base of those assetsand now have an updated goodwill balance of $110 million, which is notdeductible for tax purposes. This allocation is preliminary as we have not hadsufficient time to complete the valuation process, including the net workingcapital adjustment. In the final purchase price allocation, which we now expectto complete in the fourth quarter, there may be reallocations between theindividual assets and liabilities.
Saleof25%ofCerroCasaleOn March 28, 2017, we announced an agreement with Goldcorp Inc.(“Goldcorp”) to form a new partnership at the Cerro Casale Project in Chile.The transaction closed on June 9, 2017. Under the terms of the agreement,Goldcorp agreed to purchase a 25 percent interest in Cerro Casale fromBarrick. This transaction, coupled with the concurrent purchase by Goldcorp ofKinross Gold Corporation’s (“Kinross”) 25 percent interest in Cerro Casale,resulted in Barrick and Goldcorp each holding a 50 percent interest in the jointoperation.
The total consideration received by Barrick and Kinross implies a fair value of$1.2 billion for 100% of Cerro Casale, which resulted in a reversal ofimpairment of $1.12 billion in the first quarter of 2017. Refer to note 13 to theFinancial Statements for further details of the impairment reversal. We areaccounting for our remaining 50 percent interest as a joint operation andconsolidate our proportionate share of the assets, liabilities, revenue andexpenses of Cerro Casale. We recognized a gain of $193 million due to thedeconsolidation of the non-controlling interest in Cerro Casale in the secondquarter of 2017.
As consideration for the 25 percent interest acquired from Barrick, Goldcorp willfund Barrick’s first $260 million of expenditures on the project and will spend anequivalent amount on its own behalf for a total project investment commitment of$520 million. Under the agreement, Goldcorp must spend a minimum of$60 million in the two-year period following closing, and then $80 million in eachsuccessive two-year period. The outstanding funding commitment will accrueinterest at an annual rate of 4.75 percent. In the event that Goldcorp does notspend the minimum amount in any two-year period, 50 percent of any shortfallwill be paid directly to Barrick in cash.
In addition, Goldcorp also funded Cerro Casale’s acquisition of a 100 percentinterest in the adjacent Quebrada Seca property from Kinross upon closing.Upon a construction decision Goldcorp will pay Barrick $40 million in cash andBarrick will receive a 1.25 percent royalty on 25 percent of the gross revenuesderived from metal production from both Cerro Casale and Quebrada Seca. Thecontingent consideration payable to Barrick has been recorded at their estimatedfair value in other long-term assets.
Goldcorp entered into a separate agreement for the acquisition of ExeterResource Corporation, whose sole asset is the Caspiche Project, locatedapproximately 10 kilometers north of Cerro Casale. The acquisition of 100% ofExeter was completed in the third quarter and Goldcorp contributed the CaspicheProject into the Cerro Casale Joint Venture at a total acquisition cost ofapproximately $157 million. The acquisition costs incurred by Goldcorp havebeen deducted from the $520 million total project investment commitment, butwill not count towards the minimum expenditures for the initial two-year period.We have recorded a receivable of $181 million, split $15 million as short-termand $166 million as long-term, in other current assets and other long-termassets, respectively.
RobertsonPropertyOn June 7, 2017, we completed the acquisition of the Robertson property inNevada from Coral Gold Resources (“Coral”). Consideration paid by Barrickconsisted of $16 million, the return of 4.15 million Coral common shares(approximate value of $1 million) held by Barrick and a sliding scale royalty onany future production from the Robertson property.
BarrickNevadaIn the first quarter of 2017, we combined the management and operation of ourCortez and Goldstrike minesites, now referred to as Barrick Nevada. By fullyunifying the management of their assets, infrastructure, and expertise, we expectto further accelerate improvements in efficiency and productivity. The informationpresented in this MD&A is on a combined basis.

BARRICK THIRD QUARTER 2017 26 MANAGEMENT’S DISCUSSION AND ANALYSIS
Full Year 2017 OutlookWe have narrowed a number of our guidance ranges as our expected 2017performance becomes clearer and we factor in the impact of the Tanzanianconcentrate export ban on Acacia’s production. This includes gold production of5.3 to 5.5 million ounces, gold all-in sustaining costs1 of $740 to $770 perounce and total attributable capital expenditures of $1,350 to $1,500 million,compared to previous ranges of 5.3 to 5.6 million ounces, $720 to $770 perounce and $1,300 to $1,500 million, respectively.
We have also made a number of changes to our individual mine site guidancefor production, cost of sales per ounce, cash costs per ounce and all-insustaining costs per ounce. Refer to pages 35 to 45 for further details.
Our full-year copper production guidance range has narrowed to 420 to440 million pounds. We have increased our copper cost of sales guidance to$1.70 to $1.85 per pound, primarily as a result of higher costs in Zambia. Ourcopper all-in sustaining cost 1 guidance range has narrowed to $2.20 to $2.40per pound.
We have lowered our general and administrative cost guidance related toAcacia to $20 million from $40 million as a result of lower stock-basedcompensation estimates.
Financial Fuel Hedge Summary
Barrels
(thousands) Average
price
% of totalexpectedexposure
Impact of $10 change in fuel price on
pre-tax earnings(USD millions) 1
2017 554 79 48% 6 2018 1,244 78 28% 31
1 Includes the impact of hedges currently in place.
Copper Contracts
Pounds
(millions) Averagefloor rate
Averagecap rate
% of total expectedexposure
2017 33 2.39 2.97 26% 2018 60 2.83 3.25 13%
Outlook($ millions, except per ounce/pound data)
2017Estimate
Gold production (millions of ounces) 5.30 - 5.50 Gold unit production costs
Cost of sales - gold ($ per oz) 790 - 810 Cash costs ($ per oz) 1 520 - 535 All-in sustaining costs ($ per oz) 1 740 - 770 Depreciation ($ per oz) 245 - 265
Copper production (millions of pounds) 420 - 440 Copper unit production costs
Cost of sales - copper ($ per lb) 1.70 - 1.85 C1 cash costs ($ per lb) 1 1.60 - 1.75 Depreciation ($ per lb) 0.30 - 0.40 Copper all-in sustaining costs ($ per lb) 1 2.20 - 2.40
Exploration and project expenses 415 - 495 Exploration and evaluation 185 - 225 Project expenses 230 - 270
General and administrative expenses ~260 Corporate administration ~200 Stock-based compensation 2 ~40 Acacia 3 ~20
Other expense 25 - 45 Finance costs 600 - 650 Attributable capital expenditures:
Attributable minesite sustaining 1,100 -1,200 Attributable project 250 -300
Total attributable capital expenditures 4 1,350 - 1,500 Effective income tax rate 5 42% - 45%
Key Assumptions Gold Price ($/ounce) $1,050 Copper Price ($/pound) $2.25 Oil Price ($/barrel) $55 AUD Exchange Rate $0.75 ARS Exchange Rate 16.50 CAD Exchange Rate $1.32 CLP Exchange Rate 675
1 Cash costs, C1 cash costs and all-in sustaining costs are non-GAAP financial performancemeasures with no standardized meaning under IFRS and therefore may not be comparableto similar measures of performance presented by other issuers. For further information anda detailed reconciliation of the non-GAAP measures used in this section of the MD&A to themost directly comparable IFRS measure, please see pages 49 to 63 of this MD&A.
2 Based on US$16.92 share price and excludes Acacia.3 Includes stock-based compensation based on £1.90 share price or ~US$2.50 share price.4 2017 Guidance includes our 60% share of Pueblo Viejo and South Arturo, our 63.9% share
of Acacia, our 50% share of Zaldívar and Jabal Sayid and our share of joint operations,including our 50% sale of Veladero from July 1, 2017 onwards.
5 Based on spot gold price as at September 30, 2017.

BARRICK THIRD QUARTER 2017 27 MANAGEMENT’S DISCUSSION AND ANALYSIS
REVIEW OF FINANCIAL RESULTS
Revenue ($ millions, except per ounce/pound data in dollars)
For the three months ended September 30
For the nine months ended September 30
2017 2016 2017 2016 Gold
000s oz sold 1 1,227 1,386 3,930 3,984 000s oz produced 1 1,243 1,381 3,984 4,001 Revenue $ 1,784 $ 2,134 $ 5,614 $ 5,774 Market price 2 1,278 1,335 1,251 1,260 Realized price 2,3 $ 1,274 $ 1,333 $ 1,250 $ 1,259
Copper millions lbs sold 1 107 102 298 298 millions lbs produced 1 115 100 314 314 Revenue $ 177 $ 104 $ 427 $ 322 Market price 2 2.88 2.16 2.70 2.14 Realized price 2,3 3.05 2.18 2.81 2.17
Other sales 32 59 105 143 Total revenue $ 1,993 $ 2,297 $ 6,146 $ 6,239
1 Includes our equity share of gold ounces from Acacia and Pueblo Viejo and copperpounds from Zaldívar and Jabal Sayid.
2 Per ounce/pound weighted average.3 Realized price is a non-GAAP financial performance measure with no standardized
meaning under IFRS and therefore may not be comparable to similar measures ofperformance presented by other issuers. For further information and a detailedreconciliation of each non-GAAP measure used in this section of the MD&A to the mostdirectly comparable IFRS measure, please see pages 49 to 63 of this MD&A.
For the three and nine month periods ended September 30, 2017, goldrevenues were down 16% and 3%, respectively, compared to the same prioryear periods primarily due to lower gold sales combined with lower realizedgold prices1. The average market price for the three and nine month periodsended September 30, 2017 was $1,278 and $1,251 per ounce, respectively,versus $1,335 and $1,260 per ounce, respectively, for the same prior yearperiods. During the third quarter of 2017, the gold price ranged from $1,205 perounce to $1,358 per ounce and closed at $1,283 per ounce on September 30,2017. Gold prices in the quarter were influenced by global political uncertainty,including concerns regarding North Korea, a weakening of the trade-weightedUS dollar to lows since early 2015 before a modest recovery, fluctuations in USlong term interest rates, and investor interest in gold as a safe haven asset anda hedge against record high levels in US equity indices.
For the three and nine month periods ended September 30, 2017, goldproduction was 138 thousand and 17 thousand ounces lower, respectively,than the same prior year periods. Excluding the impact of the 50% divestmentin the Veladero mine, gold production for the three and nine month periodsended September 30, 2017 decreased by 81 thousand and increased by40 thousand ounces, respectively. For the three month period, this was
primarily as a result of lower grades at Pueblo Viejo, Barrick Nevada, Hemlo,Kalgoorlie, Acacia, Porgera and Lagunas Norte. These were partially offset byhigher production at Veladero as a result of higher grades processed. For thenine month period, the increase (excluding divested sites) was primarily due tohigher production at Barrick Nevada from higher open pit grades and throughputcombined with higher production at Veladero due to higher tonnes mined andhigher grades processed. For the three month period ended September 30,2017, gold sales were lower than gold production as a result of the export ban onconcentrates at Acacia combined with lower sales than produced at Veladerodue to timing. These were partially offset by higher gold ounces sold thanproduced at Barrick Nevada due to a draw down of work in process inventory inthe third quarter of 2017. For the nine month period ended September 30, 2017,gold sales were lower than gold production due to the export ban on Acacia’sconcentrates, partially offset by higher gold sales than production at Nevada asdiscussed above and Veladero due to the timing of sales of ounces produced atthe end of 2016.
Copper revenues for the three and nine month periods ended September 30,2017, were up 70% and 33%, respectively, compared to the same prior yearperiods primarily due to a higher average market copper price. For the threemonths ended September 30, 2017, this was further positively impacted byprovisional pricing adjustments and higher copper sales volume, primarilyattributed to Lumwana as a result of improved truck availability, partially offset bylower grades. For the three and nine month periods ended September 30, 2017,the average market price of $2.88 and $2.70, respectively, represented anincrease of 33% and 26%, versus the same prior year periods. During the thirdquarter of 2017, the copper price ranged from $2.63 per pound to $3.16 perpound and closed at $2.94 per pound on September 30, 2017. As atSeptember 30, 2017, using option collar strategies, the Company has protectedthe downside on approximately 33 million pounds of expected remaining 2017copper production at an average floor price of $2.39 per pound and canparticipate in the upside on the same amount up to an average of $2.97 perpound. In addition, the Company has protected the downside on approximately60 million pounds of expected copper production for the first half of 2018 at anaverage floor price of $2.83 per pound and can participate in the upside on thesame amount up to an average of $3.25 per pound. Our remaining copperproduction is subject to market prices.
Copper production for the three and nine month periods ended September 30,2017 increased by 15 million pounds and was in line with prior year, compared tothe same prior year periods. For the three month period ended September 30,2017, the increase was due to higher

BARRICK THIRD QUARTER 2017 28 MANAGEMENT’S DISCUSSION AND ANALYSIS
production at Lumwana as a result of operational initiatives to reduce downtimecombined with higher production at Jabal Sayid as the site was ramping upproduction in the comparative prior year period. For the nine month periodended September 30, 2017, lower production at Lumwana as a result of lowergrades was offset by higher pounds produced at Jabal Sayid, which enteredcommercial production on July 1, 2016, as well as at Zaldívar due to highergrades.
Production Costs ($ millions, except per ounce/pound data in dollars)
For the three months ended September 30
For the nine months ended September 30
2017 2016 2017 2016 Gold
Direct mining costs $ 729 $ 761 $2,241 $2,344 Depreciation 357 373 1,125 1,108 Royalty expense 50 57 150 156 Community relations 11 11 28 25
Cost of sales $1,147 $1,202 $3,544 $3,633 Cost of sales
(per oz) 1 820 766 791 803 Cash costs 2,3 546 518 520 549 All-in sustaining costs 2,3 772 704 750 730
Copper Cost of sales $ 108 $ 66 $ 292 $ 235 Cost of sales
(per lb) 1 1.67 1.43 1.72 1.41 C1 cash costs 2,3 1.56 1.50 1.64 1.50 All-in sustaining costs 2,3 $ 2.24 $ 2.02 $ 2.27 $ 2.08
1 Cost of sales applicable to gold per ounce is calculated using cost of sales applicable togold on an attributable basis (removing the non-controlling interest of 40% Pueblo Viejoand 36.1% Acacia from cost of sales), divided by attributable gold ounces. Cost of salesapplicable to copper per pound is calculated using cost of sales applicable to copperincluding our proportionate share of cost of sales attributable to equity methodinvestments (Zaldívar and Jabal Sayid), divided by consolidated copper pounds (includingour proportionate share of copper pounds from our equity method investments).
2 Per ounce/pound weighted average.3 Cash costs, C1 cash costs and all-in sustaining costs are non-GAAP financial
performance measures with no standardized meaning under IFRS and therefore may notbe comparable to similar measures of performance presented by other issuers. Forfurther information and a detailed reconciliation of each non-GAAP measure used in thissection of the MD&A to the most directly comparable IFRS measure, please see pages49 to 63 of this MD&A.
For the three and nine month periods ended September 30, 2017, cost of salesapplicable to gold was 5% and 2% lower, respectively, than the same prior yearperiods. For the three month period, the decrease was due to lower salesvolumes driving lower direct mining costs, depreciation expense and royaltyexpense. For the nine month period, the slight decrease was primarily due tolower direct mining costs and royalty expense, partially offset by higherdepreciation expense. On a per ounce basis, cost of sales applicable to gold4was 7% higher and 1% lower, respectively, than the same prior year periods.For the three month period, the increase was attributed to the impact of fewerounces sold and the resulting
impact on direct mining costs on a per ounce basis and depreciation expense. Itwas also impacted by the higher direct mining costs primarily related to higherexternal services costs mainly in relation to Best-in-Class at Veladero combinedwith higher fuel prices. Prior year cost of sales were positively impacted by thereceipt of insurance proceeds recorded relating to the 2015 oxygen plant motorfailure at Pueblo Viejo. The increase in depreciation expense mainly related tothe impact of the purchase price allocation relating to the divestment of 50% ofthe Veladero mine. These increases were partially offset by a change in salesmix with the higher sales volume from the lower cost Barrick Nevada and lowerrelative sales volume from Hemlo. For the nine month period, the slight decreasein cost of sales per ounce applicable to gold4 was primarily due to fewer hedgelosses combined with a change in sales mix with higher sales volume from lowercost Barrick Nevada and lower relative sales volume from Hemlo and Acacia.This was further positively impacted by higher capitalized waste stripping activityat Barrick Nevada, partially offset by higher fuel prices and external servicescosts, as discussed above, combined with higher depreciation expense mainlyattributed to Barrick Nevada from an increase in ounces mined at Cortez Hillsopen pit, as well as a reduction in cost of sales attributed to insurance proceedsrecorded in the same prior year period as discussed above.
For the three and nine month periods ended September 30, 2017, gold all-insustaining costs1 were up $68 and $20 per ounce, respectively, or 10% and 3%,compared to the same prior year periods primarily due to an increase in minesitesustaining capital expenditures. For the three month period this was combinedwith higher cost of sales per ounce 4 .
For the three and nine month periods ended September 30, 2017, cost of salesapplicable to copper was 64% and 24% higher, respectively, than the same prioryear periods primarily due to higher depreciation expense combined with higherpower, freight and maintenance costs at Lumwana. Our 50% interests in Zaldívarand Jabal Sayid are equity accounted for and therefore we do not include theircost of sales in our consolidated copper cost of sales. On a per pound basis, costof sales applicable to copper 4 , after including our proportionate share of cost ofsales at our equity method investees, increased 17% and 22%, respectively,compared to the same prior year periods primarily due to higher depreciationexpense combined with higher power, freight and maintenance costs mainlyrelating to repairs at Lumwana, partially offset by Jabal Sayid, which enteredcommercial production on July 1, 2016 and had higher costs in the prior year asit ramped up to full production.
For the three and nine month periods ended September 30, 2017, copper all-insustaining costs 1 ,

BARRICK THIRD QUARTER 2017 29 MANAGEMENT’S DISCUSSION AND ANALYSIS
which have been adjusted to include our proportionate share of equity methodinvestments, were 11% and 9% higher, respectively, than the same prior yearperiods primarily reflecting the higher cost of sales applicable to coppercombined with higher minesite sustaining capital expenditures at Zaldívar forthe three month period as well as at Lumwana and Jabal Sayid for the ninemonth period.
Capital Expenditures 1
($ millions)
For the three months ended September 30
For the nine months ended September 30
2017 2016 2017 2016 Minesite sustaining 2 $ 248 $ 236 $ 830 $ 646 Project capital expenditures 3 53 35 192 124
Total consolidatedcapital expenditures $ 301 $ 271 $ 1,022 $ 770
Attributableconsolidated capitalexpenditures 4 $ 296 $ 284 $ 999 $ 746
1 These amounts are presented on a 100% accrued basis, except for attributableconsolidated capital expenditures.
2 Includes both minesite sustaining and mine development.3 Project capital expenditures are included in our calculation of all-in costs, but not included
in our calculation of all-in sustaining costs.4 These amounts are presented on the same basis as our guidance and include our 60%
share of Pueblo Viejo and South Arturo, our 63.9% share of Acacia and our 50% share ofZaldívar and Jabal Sayid.
For the three and nine month periods ended September 30, 2017, totalconsolidated capital expenditures on an accrued basis increased 11% and33%, respectively, compared to the same prior year periods. The increases areprimarily due to an 5% and 28% increase, in minesite sustaining capitalexpenditures for the three and nine month periods ended September 30, 2017.The increase in minesite sustaining capital expenditures reflects a $16 millionand $123 million increase, respectively, in sustaining capital at Barrick Nevadarelating to higher capitalized stripping costs at Goldstrike and the timing of agreater number of minesite sustaining projects in the current periods, combinedwith increased spending of $16 million and $88 million, respectively, atVeladero relating to phases 4B and 5B of the leach pad expansion andadditional equipment purchases at Veladero. Project capital expendituresincreased by $18 million and $68 million, respectively, primarily as a result ofgreater spending incurred at Barrick Nevada relating to development ofCrossroads and Cortez Hills Lower Zone, and the Goldrush project, partiallyoffset by lower spending at South Arturo, which entered commercial productionin August 2016.
General and Administrative Expenses
($ millions)
For the threemonths endedSeptember 30
For the ninemonths endedSeptember 30
2017 2016 2017 2016 Corporate administration 1 $ 56 $ 44 $ 147 $ 119 Stock-based compensation 2 6 1 27 42 Acacia 7 26 12 56
General & administrativeexpenses $ 69 $ 71 $ 186 $ 217
1 For the three and nine months ended September 30, 2017, corporate administration costsinclude approximately $2 million reversal and $nil, respectively, of severance costs (2016:$4 million and $6 million, respectively).
2 Based on US$16.09 share price as at September 30, 2017 (2016: US $17.72) andexcludes Acacia.
For the three and nine month periods ended September 30, 2017, general andadministrative expenses were $2 million and $31 million lower, respectively, thanthe same prior year periods primarily due to lower expenses at Acacia, mainlyrelating to their stock-based compensation due to decreases in their share priceduring the year, partly offset by higher corporate administration expenses mainlyrelating to consulting and corporate project costs such as those relating toBarrick’s digital transformation. For the three month period the decrease wasfurther offset by an increase in stock-based compensation primarily as a result ofBarrick’s relative share price performance. For the nine month period, thedecrease in stock-based compensation mainly related to the decrease inBarrick’s share price as at September 30, 2017.
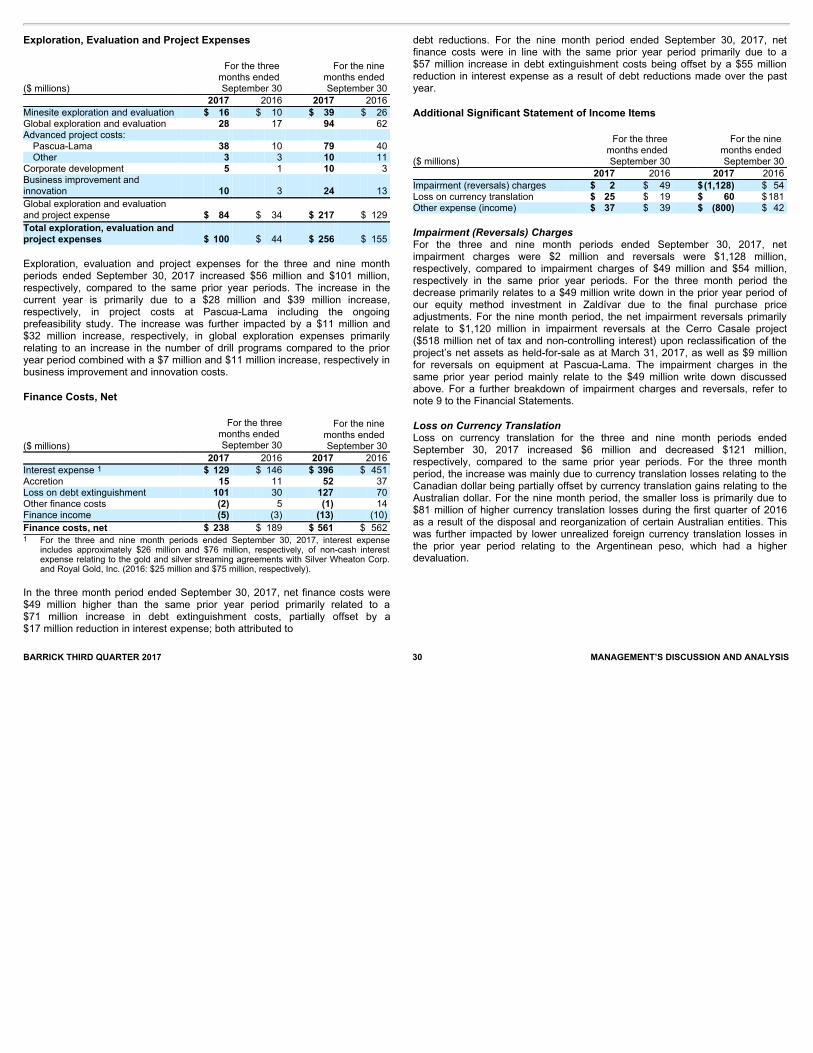
BARRICK THIRD QUARTER 2017 30 MANAGEMENT’S DISCUSSION AND ANALYSIS
Exploration, Evaluation and Project Expenses
($ millions)
For the three months ended September 30
For the nine months ended September 30
2017 2016 2017 2016 Minesite exploration and evaluation $ 16 $ 10 $ 39 $ 26 Global exploration and evaluation 28 17 94 62 Advanced project costs:
Pascua-Lama 38 10 79 40 Other 3 3 10 11
Corporate development 5 1 10 3 Business improvement andinnovation 10 3 24 13
Global exploration and evaluationand project expense $ 84 $ 34 $ 217 $ 129
Total exploration, evaluation andproject expenses $ 100 $ 44 $ 256 $ 155
Exploration, evaluation and project expenses for the three and nine monthperiods ended September 30, 2017 increased $56 million and $101 million,respectively, compared to the same prior year periods. The increase in thecurrent year is primarily due to a $28 million and $39 million increase,respectively, in project costs at Pascua-Lama including the ongoingprefeasibility study. The increase was further impacted by a $11 million and$32 million increase, respectively, in global exploration expenses primarilyrelating to an increase in the number of drill programs compared to the prioryear period combined with a $7 million and $11 million increase, respectively inbusiness improvement and innovation costs.
Finance Costs, Net
($ millions)
For the threemonths ended September 30
For the nine months ended September 30
2017 2016 2017 2016 Interest expense 1 $ 129 $ 146 $ 396 $ 451 Accretion 15 11 52 37 Loss on debt extinguishment 101 30 127 70 Other finance costs (2) 5 (1) 14 Finance income (5) (3) (13) (10)
Finance costs, net $ 238 $ 189 $ 561 $ 562
1 For the three and nine month periods ended September 30, 2017, interest expenseincludes approximately $26 million and $76 million, respectively, of non-cash interestexpense relating to the gold and silver streaming agreements with Silver Wheaton Corp.and Royal Gold, Inc. (2016: $25 million and $75 million, respectively).
In the three month period ended September 30, 2017, net finance costs were$49 million higher than the same prior year period primarily related to a$71 million increase in debt extinguishment costs, partially offset by a$17 million reduction in interest expense; both attributed to
debt reductions. For the nine month period ended September 30, 2017, netfinance costs were in line with the same prior year period primarily due to a$57 million increase in debt extinguishment costs being offset by a $55 millionreduction in interest expense as a result of debt reductions made over the pastyear.
Additional Significant Statement of Income Items
($ millions)
For the three months ended September 30
For the nine months ended September 30
2017 2016 2017 2016 Impairment (reversals) charges $ 2 $ 49 $(1,128) $ 54 Loss on currency translation $ 25 $ 19 $ 60 $181 Other expense (income) $ 37 $ 39 $ (800) $ 42
Impairment(Reversals)ChargesFor the three and nine month periods ended September 30, 2017, netimpairment charges were $2 million and reversals were $1,128 million,respectively, compared to impairment charges of $49 million and $54 million,respectively in the same prior year periods. For the three month period thedecrease primarily relates to a $49 million write down in the prior year period ofour equity method investment in Zaldívar due to the final purchase priceadjustments. For the nine month period, the net impairment reversals primarilyrelate to $1,120 million in impairment reversals at the Cerro Casale project($518 million net of tax and non-controlling interest) upon reclassification of theproject’s net assets as held-for-sale as at March 31, 2017, as well as $9 millionfor reversals on equipment at Pascua-Lama. The impairment charges in thesame prior year period mainly relate to the $49 million write down discussedabove. For a further breakdown of impairment charges and reversals, refer tonote 9 to the Financial Statements.
LossonCurrencyTranslationLoss on currency translation for the three and nine month periods endedSeptember 30, 2017 increased $6 million and decreased $121 million,respectively, compared to the same prior year periods. For the three monthperiod, the increase was mainly due to currency translation losses relating to theCanadian dollar being partially offset by currency translation gains relating to theAustralian dollar. For the nine month period, the smaller loss is primarily due to$81 million of higher currency translation losses during the first quarter of 2016as a result of the disposal and reorganization of certain Australian entities. Thiswas further impacted by lower unrealized foreign currency translation losses inthe prior year period relating to the Argentinean peso, which had a higherdevaluation.

BARRICK THIRD QUARTER 2017 31 MANAGEMENT’S DISCUSSION AND ANALYSIS
OtherExpense(Income)For the three and nine month periods ended September 30, 2017, other incomewas $2 million and $842 million higher, respectively, than the same prior yearperiods. The slight increase for the three month period relates in large part to aloss on sale of long-lived assets recorded in the same prior year period mainlyrelated to the disposition relating to Zaldívar, partially offset by additionalexpenses in the current year mainly attributed to severance costs at Acaciaincurred as part of the Bulyanhulu reduced operations program, as well ashigher litigation expense. Refer to Acacia’s review of operating segmentperformance for additional details. For the nine month period, the increaseprimarily relates to gains of $689 million connected to the sale of a 50% interestin the Veladero mine and $193 million on the gain related to the sale of a 25%interest in the Cerro Casale project in the second quarter of 2017. Theseincreases in other income were partially offset by an increase in severancecosts at Acacia combined with higher litigation expense. For a furtherbreakdown of other expense (income), refer to note 9 to the FinancialStatements.
Income Tax ExpenseIncome tax expense was $314 million in the third quarter of 2017. The underlyingeffective tax rate for ordinary income in the third quarter of 2017 was 43% afteradjusting for the net impact of foreign currency translation losses on deferred taxbalances; the impact of impairment (reversals) charges; the impact of debtextinguishment costs; the impact of asset sales and non-hedge derivatives; theimpact of the proposed framework for Acacia operations; and the impact ofnon-deductible foreign exchange losses. The unadjusted tax rate for income inthe third quarter of 2017 was 116% of the income before income taxes.
We record deferred tax charges or credits if changes in facts or circumstancesaffect the estimated tax basis of assets and therefore the amount of deferred taxassets or liabilities to reflect changing expectations in our ability to realizedeferred tax assets. The interpretation of tax regulations and legislation and theirapplication to our business is complex and subject to change. We havesignificant amounts of deferred tax assets, including tax loss carry forwards, andalso deferred tax liabilities. Potential changes of any of these amounts, as well asour ability to realize deferred tax assets, could significantly affect net income orcash flow in future periods.

FINANCIAL CONDITION REVIEW
Summary Balance Sheet and Key Financial Ratios ($ millions, except ratios and share amounts) As at September 30, 2017 As at December 31, 2016 Total cash and equivalents $ 2,025 $ 2,389 Current assets 2,717 2,485 Non-current assets 20,330 20,390
Total Assets $ 25,072 $ 25,264
Current liabilities excluding short-term debt $ 1,675 $ 1,676 Non-current liabilities excluding long-term debt 1 5,328 5,344 Debt (current and long-term) 6,447 7,931
Total Liabilities $ 13,450 $ 14,951
Total shareholders’ equity 9,614 7,935 Non-controlling interests 2,008 2,378
Total Equity $ 11,622 $ 10,313
Total common shares outstanding (millions of shares) 2 1,166 1,166 Key Financial Ratios:
Current ratio 3 2.73:1 2.68:1 Debt-to-equity 4 0.55:1 0.77:1
1 Non-current financial liabilities as at September 30, 2017 were $6,608 million (December 31, 2016: $8,002 million). 2 Total common shares outstanding do not include 1.2 million stock options. 3 Represents current assets divided by current liabilities (including short-term debt) as at September 30, 2017 and December 31, 2016. 4 Represents debt divided by total shareholders’ equity (including minority interest) as at September 30, 2017 and December 31, 2016.
BARRICK THIRD QUARTER 2017 32 MANAGEMENT’S DISCUSSION AND ANALYSIS
Balance Sheet ReviewTotal assets were $25.1 billion at September 30, 2017, approximately$0.2 billion lower than at December 31, 2016, primarily reflecting the sale of50 percent of our Veladero mine in Argentina and 25% of the Cerro Casaleproject in Chile, partially offset by the remeasurement of our remaining interestin those properties. The proceeds from these transactions were the primarysource of funding debt repayments, but a portion of our existing cash balancewas also used, which further reduced total assets. Our asset base is primarilycomprised of non-current assets such as property, plant and equipment andgoodwill, reflecting the capital-intensive nature of the mining business and ourhistory of growing through acquisitions. Other significant assets includeproduction inventories, indirect taxes recoverable and receivable, concentratesales receivable and other government transaction and joint venture relatedreceivables, and cash and equivalents. Total liabilities at September 30, 2017totaled $13.5 billion; approximately $1.5 billion lower than at December 31,2016, mainly reflecting the $1.5 billion debt repayments made during the firstnine months of the year combined with lower deferred and current income taxliabilities.
Shareholders’ Equity As at October 17, 2017 Number of shares Common shares 1,166,263,347 Stock options 1,232,774
Financial Position and LiquidityTotal cash and cash equivalents as at September 30, 2017 were $2.0 billion3.Our capital structure comprises a mix of debt and shareholders’ equity. As atSeptember 30, 2017, our total debt was $6.4 billion (debt net of cash andequivalents was $4.4 billion) and our debt-to-equity ratio was 0.55:1. Thiscompares to debt as at December 31, 2016 of $7.9 billion (debt net of cash andequivalents was $5.5 billion), and a debt-to-equity ratio of 0.77:1.
At the beginning of 2017, we set a target to reduce our total debt by $2.9 billion,to $5 billion, by the end of 2018 – half of which was targeted in 2017. As a resultof debt repayments made in the third quarter of 2017, we have now fullyachieved our 2017 target, reducing total debt by $1.5 billion for the year to date.In addition to $487 million of debt reduction made in the first half of 2017, duringthe third quarter of 2017 Barrick executed the make-whole provision for the fullredemption of approximately $731 million of outstanding May 2023 notes andfully repaid the $267 million outstanding on the Pueblo Viejo Project FinancingAgreement. We currently have less than $100 million2 in debt due before 2020,and approximately $5 billion of our outstanding debt matures after 2032.
Uses of cash for the remainder of 2017 includes capital commitments of$58 million and we expect to incur attributable sustaining and project capitalexpenditures between $351 to $501 million based on our guidance range onpage 26. For the remainder of 2017 we have

BARRICK THIRD QUARTER 2017 33 MANAGEMENT’S DISCUSSION AND ANALYSIS
contractual obligations and commitments of $322 million in purchaseobligations for supplies and consumables and $16 million in derivative liabilitieswhich will form part of operating costs. In addition, we have $156 million ininterest payments and other amounts as detailed in the table on page 47. Weexpect to fund these commitments through operating cash flow, which is ourprimary source of liquidity, as well as existing cash balances.
Our operating cash flow is dependent on the ability of our operations to deliverprojected future cash flows. The market prices of gold, and to a lesser extentcopper, are the primary drivers of our operating cash flow. Other options toenhance liquidity include further portfolio optimization and the creation of newjoint ventures and partnerships; issuance of debt or equity securities in thepublic markets or to private investors, which could be undertaken for liquidityenhancement and/or in connection with establishing a strategic partnership;and drawing the $4.0 billion available under our undrawn credit facility (subjectto compliance with covenants and the making of certain representations andwarranties, this facility is available for drawdown as a source of financing).
Many factors, including but not limited to general market conditions and thenprevailing metals prices, could impact our ability to issue securities onacceptable terms, as could our credit ratings. Moody’s and S&P currently rateour long-term debt as investment grade, with ratings of Baa3 and BBB-,respectively. In August 2016, S&P affirmed the Company’s BBB- rating andraised its outlook to positive from stable. Also in August 2016, Moody’s affirmedthe Company’s Baa3 rating and revised its outlook to stable from negative. InSeptember 2017, Moody’s and S&P each released reports affirming theirexisting ratings and outlooks. Further changes in our ratings could affect thetrading prices of our securities and our cost of capital. If we were to borrowunder our credit facility, the applicable interest rate on the amounts borrowedwould be based, in part, on our credit ratings at the time. The key financialcovenant in our undrawn credit facility requires Barrick to maintain a net debt tototal capitalization ratio of less than 0.60:1. Barrick’s net debt to totalcapitalization ratio was 0.27:1 as at September 30, 2017 (0.35:1 as atDecember 31, 2016).
Summary of Cash Inflow (Outflow)
($ millions)
For the three months ended September 30
For the ninemonths ended September 30
2017 2016 2017 2016 Net cash provided byoperating activities $ 532 $ 951 $ 1,475 $ 1,929
Investing activities Capital expenditures $ (307) $ (277) $ (1,046) $ (800) Divestitures — — 960 588 Other 1 84 5 88
Total investinginflows/(outflows) $ (306) $ (193) $ (81) $ (124)
Financing activities Net change in debt $ (1,023) $ (465) $ (1,508) $ (1,442) Dividends (31) (21) (94) (64) Other (73) (66) (158) (110)
Total financinginflows/(outflows) $ (1,127) $ (552) $ (1,760) $ (1,616)
Effect of exchange rate — 1 2 4
Increase/(decrease) in cashand equivalents $ (901) $ 207 $ (364) $ 193
In the third quarter of 2017, we generated $532 million in operating cash flow,compared to $951 million in the same prior year period. The decrease of$419 million was primarily due to lower gold sales resulting from lower grades atPueblo Viejo, Hemlo and Lagunas Norte and the Tanzanian concentrate exportban and related buildup of inventory at Acacia. This was combined with highercash taxes paid mainly related to income tax refunds received in the third quarterof 2016, as well as higher direct mining costs as a result of higher power and fuelprices and external services costs in relation to Best-in-Class initiatives atVeladero and increased mining activity at Lumwana. Operating cash flow wasfurther negatively impacted by cash flows attributable to non-controlling interest,combined with an increase in exploration, evaluation and project expenses andthe impact of lower gold prices.
The ability of our operations to deliver projected future cash flows within theparameters of a reduced production profile, as well as future changes in gold andcopper market prices, either favorable or unfavorable, will continue to have amaterial impact on our cash flow and liquidity.

OPERATING SEGMENTS PERFORMANCE
Review of Operating Segments Performance
BARRICK THIRD QUARTER 2017 34 MANAGEMENT’S DISCUSSION AND ANALYSIS
Cash outflows from investing activities in the third quarter of 2017 were$306 million compared to cash outflows of $193 million in the same prior yearperiod. The increase of $113 million is primarily due to $86 million of saleproceeds in the prior year period, mainly relating to trucks at Pascua-Lama andthe Monte Rio power plant at Pueblo Viejo, which offset capital expenditures.This was combined with a planned increase in capital expenditures on a cashbasis of $30 million in this current period primarily due to a $27 million increasein project capital expenditures primarily at Barrick Nevada relating to thedevelopment of Crossroads and Cortez Hills Lower Zone, and the Goldrushproject, partially offset by a decrease in pre-production stripping at the SouthArturo pit, which entered commercial production in August 2016. The increasein capital expenditures was also impacted by an increase in minesite sustainingcapital expenditures at Barrick Nevada relating to higher capitalized strippingcosts and the timing of a greater number of minesite sustaining projects, aswell as greater spending at Veladero relating to phases 4B and 5B of the leachpad expansion and additional equipment purchases.
Net financing cash outflows for the third quarter of 2017 amounted to$1,127 million, compared to $552 million of cash outflows in the same prior yearperiod. The higher outflows primarily relate to higher debt repayments in the thirdquarter of 2017 of $1,023 million compared to $465 million in the same prior yearperiod. This was combined with an increase in other financing outflows in thecurrent quarter, mainly relating to debt extinguishment costs arising from theaforementioned debt repayments and higher dividend payments.
In the first quarter of 2017, we unified the management and the operation of ourCortez and Goldstrike minesites, now referred to as Barrick Nevada. Barrick’sbusiness is now organized into eleven individual minesites, one grouping of twominesites, one publicly traded company and one project. Barrick’s ChiefOperating Decision Maker, the President, reviews the operating results,assesses performance and makes capital allocation decisions at the minesite,grouping, Company and/or project level. Therefore, each individual minesite,with the exception of Barrick Nevada, Acacia and the Pascua-Lama project areoperating segments for financial reporting purposes. Our updated presentationof our reportable
operating segments is now four individual gold mines (Pueblo Viejo, LagunasNorte, Veladero and Turquoise Ridge), Barrick Nevada, Acacia and our Pascua-Lama project. The remaining operating segments, our remaining gold and coppermines, have been grouped into an “other” category and will not be reported onindividually. The prior periods have been restated to reflect the change inpresentation. Segment performance is evaluated based on a number ofmeasures including operating income before tax, production levels and unitproduction costs. Certain costs are managed on a consolidated basis and aretherefore not reflected in segment income.

Barrick Nevada 1 , Nevada USA Summary of Operating and Financial Data For the three months ended September 30 For the nine months ended September 30 2017 2016 % Change 2017 2016 % Change Total tonnes mined (000s) 52,650 48,414 9% 158,304 148,071 7%
Open pit 51,950 47,697 9% 156,168 145,967 7% Underground 700 717 (2)% 2,136 2,104 2%
Average grade (grams/tonne) Open pit mined 2.61 1.59 64% 2.82 1.54 83% Underground mined 11.04 11.26 (2)% 10.67 11.81 (10)% Processed 3.47 2.48 40% 3.47 2.59 34%
Ore tonnes processed (000s) 5,747 8,677 (34)% 18,550 24,520 (24)% Oxide mill 1,175 1,103 7% 3,472 3,071 13% Roaster 1,217 1,264 (4)% 3,560 3,580 (1)% Autoclave 993 937 6% 3,173 2,502 27% Heap leach 2,362 5,373 (56)% 8,345 15,367 (46)%
Gold produced (000s/oz) 520 547 (5)% 1,782 1,554 15% Oxide mill 206 118 75% 786 384 105% Roaster 235 302 (22)% 682 833 (18)% Autoclave 52 65 (20)% 191 174 10% Heap leach 27 62 (56)% 123 163 (25)%
Gold sold (000s/oz) 556 560 (1)% 1,818 1,580 15%
Segment revenue ($ millions) $ 706 $ 749 (6)% $ 2,273 $ 1,989 14% Cost of sales ($ millions) 425 469 (9)% 1,441 1,392 4% Segment income ($ millions) 268 269 —% 794 575 38% Segment EBITDA ($ millions) 2 447 465 (4)% 1,432 1,158 24% Capital expenditures ($ millions) 114 84 36% 427 221 93%
Minesite sustaining 78 62 26% 266 143 86% Project 36 22 64% 161 78 106%
Cost of sales (per oz) 762 838 (9)% 791 881 (10)% Cash costs (per oz) 2 441 486 (9)% 440 511 (14)% All-in sustaining costs (per oz) 2 597 611 (2)% 603 613 (2)% All-in costs (per oz) 2 $ 665 $ 664 —% $ 694 $ 670 4%
1 Includes our 60% share of South Arturo.
2 These are non-GAAP financial performance measures with no standardized meaning under IFRS and therefore may not be comparable to similar measures presented by other
issuers. For further information and a detailed reconciliation of each non-GAAP measure used in this section of the MD&A to the most directly comparable IFRS measure, please seepages 49 to 63 of this MD&A.
BARRICK THIRD QUARTER 2017 35 MANAGEMENT’S DISCUSSION AND ANALYSIS
FinancialResultsBarrick Nevada’s segment income for the three and nine months endedSeptember 30, 2017 was in line with and 38% higher, respectively, than thesame prior year periods. For the three month period, the slight decrease insales volume combined with a lower realized gold price 1 were offset by adecrease in cost of sales. For the nine month period, the increase was primarilydue to an increase in sales volume, partially offset by an increase in cost ofsales combined with lower realized gold prices 1 .
Gold production for the three and nine month periods ended September 30,2017, were 5% lower and 15% higher, respectively, compared to the sameprior year periods. For the three month period the decrease was primarily dueto processing lower grade Goldstrike open pit stockpiles at the roastercompared to processing higher grades from the Goldstrike open pit North Betze
layback in the same prior year period. Digitization initiatives such as shortinternal control and automation are resulting in higher mining rates at Cortez Hillsunderground (“CHUG”), but these additional tons were not fully processed in thethird quarter as we optimized ore chemistry blends for the roaster. In addition,fewer Goldstrike underground ounces were processed through the autoclave dueto a decrease in long-hole stoping and available stopes to mine and as a resultthe autoclave processed lower grades with lower recoveries. Fewer tonnes weremined and placed on the leach pad in the current year. This was partially offsetby higher grades mined and processed from Cortez Hills open pit (“CHOP”)combined with higher throughput at the oxide mill as a result ofBest-in-Class process improvements and an increased permit limit. For the ninemonth period, the increase in production was primarily due to higher gradesmined and processed from CHOP combined with higher

BARRICK THIRD QUARTER 2017 36 MANAGEMENT’S DISCUSSION AND ANALYSIS
throughput at the oxide mill and an increase in autoclave production due tothroughput improvements driven by Best-in-Class initiatives. This was partiallyoffset by lower Goldstrike open pit grades mined and processed at the roaster,combined with lower Goldstrike underground ounces processed due to lowermining rates, and fewer leach tonnes having been mined and placed onto theleach pad in the current year. Production from higher mining rates at CHUG areoffset due to a larger volume of CHUG ore routed to the roaster compared tothe oxide mill combined with lower grades as CHUG advances deeper into themine. For the three and nine month periods ended September 30, 2017, goldsales were higher than production due to the timing of sales.
Cost of sales per ounce4 for the three and nine month periods endedSeptember 30, 2017 were $76 and $90 per ounce lower, respectively, than thesame prior year periods. For the three month period, the decrease was mainlydue to higher capitalized waste stripping at Crossroads and lower depreciationassociated with South Arturo phase 2 as mining ended in July 2017. For thenine month period, the decrease was primarily due to the impact of higher salesvolume on unit production costs combined with higher capitalized wastestripping activity, and lower inventory write-downs compared to the same prioryear periods. These decreases in cost of sales per ounce4 were partially offsetby lower grades mined and processed from CHUG and Goldstrike open pit, aswell as higher autoclave production in the current year, which is the highestcost per tonne processing facility for Barrick Nevada. This was further impactedby higher depreciation from an increase in ounces mined at CHOP.
For the three and nine month periods ended September 30, 2017, all-insustaining costs 1 decreased by $14 and $10 per ounce, respectively,compared to the same prior year periods mainly due to lower direct miningcosts as we had higher project capital expenditures relating to capitalized wastestripping at Crossroads, partially offset by higher mine-site sustaining capitalexpenditures. For the nine month period, this was further impacted by highersales volume on unit production costs.
Capital expenditures for the three and nine month periods endedSeptember 30, 2017, increased by 36% and 93%, respectively, from the sameprior year periods due to higher minesite sustaining capital combined withhigher project expenditures. Higher sustaining capital is attributed to $4 millionand $65 million, respectively, of higher capitalized stripping relating to theGoldstrike open pit 3rd and 4th northwest laybacks, combined with increasedspending relative to the same prior year periods on minesite sustaining projectssuch as the Goldstrike underground cooling and ventilation project to allowmining below a 3,600 foot elevation, tailings expansions and digitizationinitiatives at Cortez to enhance productivity and efficiency. For the nine monthperiod,
this was further impacted by the autoclave thiosulfate water treatment plantupgrade to improve water balances and consumption of fresh reagent. Projectcapital expenditures in the three and nine month periods ended September 30,2017 increased compared to the same prior year periods as a result ofcapitalized stripping and dewatering at Crossroads combined with undergrounddevelopment at Cortez Hills Lower Zone, the range front declines and Goldrushproject capital. These were partially offset by a decrease in pre-productionstripping at the South Arturo pit, which entered commercial production in August2016.
OutlookWe now expect Barrick Nevada gold production to be in the narrowed range of2,280 to 2,320 thousand ounces. We expect cost of sales per ounce4 to remainin the range of $790 to $830 per ounce. We now expect cash costs 1 per ounceto be in the range of $450 to $470 and all-in sustaining costs1 to be in the rangeof $620 to $650 per ounce compared to our previous ranges of $440 to $480 perounce and $630 to $680 per ounce, respectively, reflecting lower administrationcosts.

Pueblo Viejo (60% basis) 1 , Dominican Republic Summary of Operating and Financial Data For the three months ended September 30 For the nine months ended September 30 2017 2016 % Change 2017 2016 % Change Open pit tonnes mined (000s) 6,172 6,025 2% 17,139 18,158 (6)% Average grade (grams/tonne)
Open pit mined 3.19 3.57 (11)% 3.06 3.10 (1)% Processed 4.77 5.79 (18)% 4.60 5.36 (14)%
Autoclave ore tonnes processed (000s) 1,068 1,093 (2)% 3,419 3,288 4% Gold produced (000s/oz) 154 189 (19)% 468 511 (8)% Gold sold (000s/oz) 142 190 (25)% 455 502 (9)%
Segment revenue ($ millions) $ 201 $ 269 (25)% $ 613 $ 678 (10)% Cost of sales ($ millions) 101 99 2% 300 307 (2)% Segment income ($ millions) 98 170 (42)% 307 370 (17)% Segment EBITDA ($ millions) 2 122 199 (39)% 384 449 (14)% Capital expenditures ($ millions) 21 13 62% 50 41 22%
Minesite sustaining 21 13 62% 50 41 22% Project — — —% — — —%
Cost of sales (per oz) 717 514 39% 661 609 9% Cash costs (per oz) 2 442 345 28% 412 416 (1)% All-in sustaining costs (per oz) 2 604 425 42% 536 509 5% All-in costs (per oz) 2 $ 604 $ 425 42% $ 536 $ 509 5%
1 Pueblo Viejo is accounted for as a subsidiary with a 40% non-controlling interest. The results in the table and the discussion that follows are based on our 60% share only.2 These are non-GAAP financial performance measures with no standardized meaning under IFRS and therefore may not be comparable to similar measures presented by other issuers. For
further information and a detailed reconciliation of each non-GAAP measure used in this section of the MD&A to the most directly comparable IFRS measure, please see pages 49 to 63 ofthis MD&A.
BARRICK THIRD QUARTER 2017 37 MANAGEMENT’S DISCUSSION AND ANALYSIS
FinancialResultsPueblo Viejo’s segment income for the three and nine month periods endedSeptember 30, 2017 was 42% and 17% lower, respectively, than the sameprior year periods primarily due to a decrease in sales volume combined withlower realized gold prices 1 .
Gold production for the three and nine month periods ended September 30,2017 was 19% and 8% lower, respectively, than the same prior year periodsprimarily due to lower ore grades processed in the current year as compared tohigher grades mined and processed from the Moore pit in the same prior yearperiods, partially offset by higher recovery rates. For the three month period,there was a decrease in throughput as a result of higher sulfur content in theore. Higher throughput for the nine month period was due to fewer plannedautoclave maintenance shutdowns compared to the same prior year period asa result of Best-in-Class initiatives.
Cost of sales per ounce4 for the three and nine month periods endedSeptember 30, 2017, were $203 and $52 per ounce higher, respectively, thanthe same prior year periods due to the impact of lower sales volume on unitproduction costs combined with a reduction in cost of sales attributed toinsurance proceeds recorded in the same prior year period relating to the 2015oxygen plant motor failure. This was partially offset by lower direct mining costsassociated with fewer planned autoclave maintenance shutdowns in the currentyear combined with higher equipment rental costs in the prior year
periods as a result of the oxygen plant motor failure. These lower costs werepartially offset by higher fuel prices. For the three and nine month periods endedJune 30, 2017, all-in sustaining costs 1 increased by $179 and $27 per ounce,respectively, compared to the same prior year periods primarily due to theincrease in minesite capital expenditures combined with the higher cost of salesper ounce4. All-in sustaining costs 1 in the prior year periods did not benefit fromthe insurance proceeds mentioned above as they were excluded from ourcalculation.
Capital expenditures for the three and nine month periods ended September 30,2017, increased by 62% and 22%, respectively, primarily related to theconstruction of the El Llagal tailings storage facility and capitalized equipmentcosts relating to haul trucks. For the nine month period, this was partially offsetby a decrease in capitalized stripping costs as a result of mine plan sequencing.
OutlookWe now expect our equity share of 2017 gold production to be in the narrowedrange of 635 to 650 thousand ounces. We also now expect cost of sales perounce 4 to be in the range of $650 to $670 per ounce, cash costs 1 per ounce tobe in the range of $410 to $430 and all-in sustaining costs 1 to be in the range of$540 to $560 per ounce compared to our previous ranges of $650 to $680 perounce, $420 to $440 per ounce and $540 to $570 per ounce, respectively.

Lagunas Norte, Peru Summary of Operating and Financial Data For the three months ended September 30 For the nine months ended September 30 2017 2016 % Change 2017 2016 % Change Open pit tonnes mined (000s) 8,503 10,381 (18)% 25,884 30,749 (16)% Average grade (grams/tonne)
Open pit mined 1.57 1.12 40% 1.30 1.15 13% Processed 1.01 1.05 (4)% 1.03 1.07 (4)%
Heap leach ore tonnes processed (000s) 5,013 4,195 19% 13,753 12,722 8% Gold produced (000s/oz) 96 101 (5)% 274 325 (16)% Gold sold (000s/oz) 93 109 (15)% 283 327 (13)%
Segment revenue ($ millions) $ 124 $ 150 (17)% $ 365 $ 425 (14)% Cost of sales ($ millions) 58 71 (18)% 170 216 (21)% Segment income ($ millions) 66 75 (12)% 186 199 (7)% Segment EBITDA ($ millions) 1 83 97 (14)% 236 276 (14)% Capital expenditures ($ millions) 8 14 (43)% 17 52 (67)%
Minesite sustaining 5 10 (50)% 12 48 (75)% Project 3 4 (25)% 5 4 25%
Cost of sales (per oz) 612 658 (7)% 601 662 (9)% Cash costs (per oz) 1 390 410 (5)% 382 385 (1)% All-in sustaining costs (per oz) 1 470 530 (11)% 457 557 (18)% All-in costs (per oz) 1 $ 501 $ 564 (11)% $ 474 $ 568 (17)%
1 These are non-GAAP financial performance measures with no standardized meaning under IFRS and therefore may not be comparable to similar measures presented by other issuers. For
further information and a detailed reconciliation of each non-GAAP measure used in this section of the MD&A to the most directly comparable IFRS measure, please see pages 49 to 63 ofthis MD&A.
FinancialResults
BARRICK THIRD QUARTER 2017 38 MANAGEMENT’S DISCUSSION AND ANALYSIS
Lagunas Norte’s segment income for the three and nine months endedSeptember 30, 2017 was 12% and 7% lower, respectively, than the same prioryear periods primarily due the decrease in sales volume combined with lowerrealized gold prices 1 , partially offset by lower cost of sales.
Gold production for the three and nine month periods ended September 30,2017, was 5% and 16% lower, respectively, than the same prior year periodsprimarily as a result of processing harder material with lower grades and slowerrecovery rates combined with a higher percentage of older stock material, inline with expectations as the mine matures. Productivity for the nine monthperiod was further impacted by heavy rains causing road closures and poweroutages earlier in 2017. For the three month period, the decrease in gold salesvolume was higher than the gold production decrease primarily due to thetiming of sales.
Cost of sales per ounce 4 for the three and nine month periods endedSeptember 30, 2017, was $46 and $61 per ounce lower, respectively, than thesame prior year periods mainly due to lower depreciation expense and realizedcost savings from the Best-in-Class program, such as the initiatives to improveefficiencies in the carbon in column circuit, implementation of short intervalcontrol and improvements in planned maintenance. These were partially offsetby the impact of lower sales volume combined with higher direct mining costsresulting from higher tonnage processed due to changes in the ore type in themine plan. For the three and nine month periods ended September 30, 2017,all-in sustaining costs 1 decreased by $60 and $100 per ounce, respectively,
compared to the same prior year periods primarily reflecting the decrease inminesite sustaining capital expenditures.
Capital expenditures for the three and nine month periods ended September 30,2017, decreased by 43% and 67%, respectively, compared to the same prioryear periods due to lower minesite sustaining capital expenditures relating to theconstruction of phase 6 of the leach pad, which was completed in the prior year,combined with lower capitalized stripping. Project expenditures relate to ongoingstudies for the sequenced life-of-mine extension which involves the potentialconstruction of a grinding and carbon-in-leach processing circuit to treatcarbonaceous oxide ore which may be expanded later with flotation and pressureoxidation circuits to treat refractory material.
OutlookWe now expect 2017 production to be in the narrowed range of 380 to400 thousand ounces compared to the previous range of 380 to 420 thousandounces. We also now expect cost of sales per ounce 4 to be in the range of $610to $650 per ounce, cash costs 1 per ounce to be in the range of $390 to $410and all-in sustaining costs 1 to be in the range of $470 to $510 per ouncecompared to our previous ranges of $660 to $730 per ounce, $430 to $470 perounce and $490 to $550 per ounce, respectively. The updates reflect changes inthe ore type mined and processed that differs from what was originally planned,which results in lower cash costs 1 to optimize the treatment of different orematerials and some capital expenditures being delayed until 2018.

Veladero, Argentina 1 Summary of Operating and Financial Data For the three months ended September 30 For the nine months ended September 30 2017 2016 % Change 2017 2016 % Change Open pit tonnes mined (000s) 7,205 7,087 2% 39,326 43,402 (9)% Average grade (grams/tonne)
Open pit mined 0.94 0.75 25% 1.00 0.77 30% Processed 0.92 0.65 42% 1.01 0.73 38%
Heap leach ore tonnes processed (000s) 3,666 7,856 (53)% 17,196 20,672 (17)% Gold produced (000s/oz) 99 116 (15)% 322 367 (12)% Gold sold (000s/oz) 90 95 (5)% 344 338 2%
Segment revenue ($ millions) $ 114 $ 134 (15)% $ 439 $ 445 (1)% Cost of sales ($ millions) 106 86 23% 302 291 4% Segment income ($ millions) 9 48 (81)% 134 155 (14)% Segment EBITDA ($ millions) 2 57 72 (21)% 220 231 (5)% Capital expenditures ($ millions) 21 5 320% 134 46 191%
Minesite sustaining 21 5 320% 134 46 191% Project — — —% — — —%
Cost of sales (per oz) 1,187 912 30% 878 860 2% Cash costs (per oz) 2 637 586 9% 595 547 9% All-in sustaining costs (per oz) 2 890 651 37% 1,000 693 44% All-in costs (per oz) 2 $ 890 $ 651 37% $ 1,000 $ 693 44%
1 We sold 50% of Veladero on June 30, 2017; therefore these represent results on a 100% basis from January 1 to June 30, 2017 and on a 50% basis from July 1, 2017 onwards.2 These are non-GAAP financial performance measures with no standardized meaning under IFRS and therefore may not be comparable to similar measures presented by other issuers. For
further information and a detailed reconciliation of each non-GAAP measure used in this section of the MD&A to the most directly comparable IFRS measure, please see pages 49 to 63 ofthis MD&A.
FinancialResults
BARRICK THIRD QUARTER 2017 39 MANAGEMENT’S DISCUSSION AND ANALYSIS
Veladero’s segment income for the three and nine month periods endedSeptember 30, 2017 was 81% and 14% lower, respectively, than the sameprior year periods. The decrease was due to lower revenues primarily as aresult of lower realized gold prices 1 combined with the impact of thedivestment of 50% of the Veladero mine as at June 30, 2017. This was furtherimpacted by an increase in depreciation expense as a result of the fair valueincrements applied to our remaining 50% interest, which was required to be fairvalued as a result of the transaction.
Gold production for the three and nine month periods ended September 30,2017, were 15% and 12% lower, respectively, than the same prior year periodsdue to the divestment of 50% of the Veladero mine as at June 30, 2017.Excluding the impact of the divestment, gold production increased 71% and15%, respectively, for the three and nine month periods ended September 30,2017. For the three month period, the increase in the gold production wasmainly due to the resumption of normal leaching operations following thetemporary restriction resulting from the March 28, 2017 incident as Veladerocontinued to add ore tonnes to the leach pad throughout the second quarter of2017 but only commenced the addition of cyanide at the end of June 2017.Also benefiting production in the current year were higher grades processed.The nine month period was partly impacted by lower recovery reflecting theimpact of the
temporary restriction on the March 28, 2017 incident with the leach pumpingsystem. The prior year periods were negatively impacted by the temporarysuspension of operations late in the third quarter of 2016 combined with severewinter weather conditions.
Cost of sales per ounce 4 for the three and nine month periods endedSeptember 30, 2017, were $275 and $18 per ounce higher, respectively, thanthe same prior year periods primarily due to higher depreciation expense as aresult of the impact of the fair value increments relating to the revaluation of ourremaining 50% of the Veladero mine. For the nine month period, this waspartially offset by lower depreciation expense as a result of the cessation ofdepreciation as Veladero was classified as held-for-sale for the second quarter of2017. The increase in cost of sales per ounce 4 was further impacted by anincrease in direct mining costs primarily related to costs incurred in relation toBest-in-Class initiatives combined with camp costs, mining costs due toadditional fleet and maintenance, labor and contractor costs due to the impact ofinflation in Argentina. These increases were partially offset by higher capitalizedwaste stripping costs as there was no capitalized waste stripping in the thirdquarter of 2016 as a result of severe weather conditions. For the three and ninemonth periods ended September 30, 2017, all-in sustaining costs 1 increased by$239 and $307 per ounce, respectively, compared to the same prior year periodsprimarily due to an increase in

BARRICK THIRD QUARTER 2017 40 MANAGEMENT’S DISCUSSION AND ANALYSIS
minesite sustaining capital expenditures combined with an increase in cost ofsales per ounce 4 .
Capital expenditures for the three and nine month periods endedSeptember 30, 2017, increased by 320% and 191%, respectively, compared tothe same prior year periods due to higher minesite sustaining capitalexpenditures relating to the construction of phases 4B and 5B of the leach padexpansion, leach pad improvement and equipment purchases combined withhigher capitalized stripping costs.
On April 6, 2017, we announced the sale to Shandong Gold of a 50 percentinterest in the Veladero mine for $960 million. The transaction closed onJune 30, 2017, and reflects the first step in our strategic partnership withShandong. The transaction remains subject to net working capital adjustments.Refer to note 4 to the Financial Statements for more information.
On December 30, 2016, the San Juan provincial mining authority approved thefifth update to the Veladero mine’s environmental impact study (“EIS”), whichas submitted by the Company had included a request for approval of the leachpad expansion for Phases 6 to 9. Environmental approval for Phases 6 to 9 ofthe leach pad expansion was confirmed on May 19, 2017 by the San JuanMining Minister.
Release of gold-bearing process solutionOn March 28, 2017, the monitoring system at the Veladero mine detected arupture of a pipe carrying gold-bearing process solution on the leach pad. Thissolution was contained within the operating site; no solution reached anydiversion channels or watercourses. All affected soil was promptly excavatedand placed on the leach pad. The Company notified regulatory authorities ofthe situation, and San Juan provincial authorities inspected the site onMarch 29, 2017.
On March 29, 2017, the San Juan provincial mining authority issued a violationnotice against Minera Argentina Gold SRL (“MAG”), the Argentine joint ventureentity that operates the Veladero mine, in connection with this incident andordered a temporary restriction on the addition of new cyanide to the leach paduntil corrective actions on the system were completed. The mining authoritylifted the suspension on June 15, 2017, following inspection of correctiveactions.
On March 30, 2017, the San Juan Mining Minister ordered the commencementof a regulatory infringement proceeding against MAG as well as acomprehensive evaluation of the mine’s operations to be conducted byrepresentatives of the Company and the San Juan provincial authorities. TheCompany filed its defense to the regulatory infringement proceeding on April 5,2017. On September 14, 2017, the San Juan Provincial mining authorityconsolidated this administrative proceeding into
a single proceeding against MAG encompassing both the September 2016incident described below and the March 2017 incident. On October 10, 2017, theSan Juan Provincial mining authority notified MAG of the two charges under theinfringement proceeding for alleged violations of the Mining Code in connectionwith the March 2017 incident. MAG will request additional detail regarding thecharges and then submit its response in the administrative proceeding. Refer tonote 18 to the Financial Statements for more information regarding this matter.
Provincial amparoactionOn March 30, 2017, MAG was served notice of a lawsuit, called an “amparo”protection action, filed in the Jachal First Instance Court (the “Jachal Court”) byindividuals who claim to be living in Jachal, Argentina and who are seekingamong other things, the cessation of all activities at the Veladero mine or,alternatively, a suspension of the leaching process at the mine. On March 30,2017, the Jachal Court rejected the request for an injunction to cease allactivities at the Veladero mine, but ordered, among other things, the suspensionof the leaching process at the Veladero mine and for MAG and the San Juanprovincial mining authority to provide additional information to the Jachal Court inconnection with the incident.
The Company filed a defense to the provincial amparo action on April 7, 2017.The Jachal Court lifted the suspension on June 15, 2017, after the San Juanprovincial mining authority provided the required information and a hydraulicassessment of the leach pad and process plant was implemented. Refer to note18 to the Financial Statements for more information regarding this matter.
Following the resumption of the addition of cyanide, Barrick is continuing toimplement modifications to the leach pad under Barrick’s work plan agreed withSan Juan provincial authorities. In addition, Barrick also continues to implementits enhanced community investment and engagement plan.
Federal amparoactionOn April 4, 2017, the National Minister of Environment of Argentina filed anamparo protection action in the Buenos Aires federal court (the “Federal Court”)in connection with the March 2017 incident. This second amparo protectionaction is seeking a court order requiring the cessation and/or suspension ofactivities at the Veladero mine. MAG submitted extensive information to theFederal Court about the incident, the then-existing administrative and provincialjudicial suspensions, the remedial actions taken by the Company and the liftingof the suspensions as described above. MAG also challenged the jurisdiction ofthe Federal Court and the standing of the National Minister of Environment ofArgentina and requested that the matter be remanded to the Jachal Court. TheProvince of San Juan also challenged the

BARRICK THIRD QUARTER 2017 41 MANAGEMENT’S DISCUSSION AND ANALYSIS
jurisdiction of the Federal Court in this matter. On June 23, 2017, the FederalCourt decided that it is competent to hear the case, and referred the case to theCourt of Appeals to determine whether the Federal Court or Provincial Court inthe case described above has the authority to assess the merits of the amparoremedy. On July 5, 2017, the Jachal Court issued a request for the SupremeCourt of Argentina to resolve the jurisdictional dispute. On July 30, 2017, theCourt of Appeals referred the jurisdictional dispute to the Supreme Court and adecision on the matter is pending. Refer to note 18 to the Financial Statementsfor more information regarding this matter.
Veladero experienced operational incidents in 2016 and 2015 which alsoresulted in regulatory and legal proceedings as summarized below.
Release of cyanide-bearing process solutionOn October 9, 2015, the San Juan mining authority initiated an administrativesanction process against MAG for alleged violations of the mining code relatingto a valve failure and release of cyanide-bearing process solution in September2015. On March 11, 2016, the San Juan Provincial mining authority announcedits intention to impose an administrative fine against MAG in connection withthe solution release. MAG was formally notified of this decision on March 15,2016. On April 6, 2016, MAG sought reconsideration of certain aspects of thedecision but did not challenge the amount of the administrative fine. OnApril 14, 2016, in accordance with local requirements, MAG paid theadministrative fine of approximately $10 million (at the then-applicableArgentinean peso/$ exchange rate) while the request for reconsideration waspending. On July 11, 2017, the San Juan government rejected MAG’s finaladministrative appeal of this decision. On September 5, 2017, the Companycommenced a legal action to continue challenging certain aspects of thedecision before the San Juan courts. MAG has implemented a remedial actionplan at Veladero in response to the incident as required by the San Juan miningauthority. Refer to note 18 to the Financial Statements for more informationregarding this matter.
Release of crushed ore saturated with process solutionOn September 8, 2016, ice rolling down the slope of the leach pad at theVeladero mine damaged a pipe carrying process solution, causing somematerial to leave the leach pad. This material, primarily crushed ore saturatedwith process solution, was contained on the mine site and returned to the leachpad. Extensive water monitoring in the area conducted by MAG has confirmedthat the incident did not result in any environmental impact. A temporarysuspension of operations at the Veladero mine was ordered by the San JuanProvincial mining authority and a San Juan Provincial court on September 15,2016 and September 22, 2016, respectively, as a result of this incident. OnOctober 4, 2016, following, among other
matters, the completion of certain urgent works required by the San JuanProvincial mining authority and a judicial inspection of the mine, the San JuanProvincial court lifted the suspension of operations and ordered that miningactivities be resumed.
On September 14, 2016, the San Juan Provincial mining authority commencedan administrative proceeding in connection with this incident that included, inaddition to the issue of the suspension order, an infringement proceeding againstMAG. On December 2, 2016, the San Juan Provincial mining authority notifiedMAG of two charges under the infringement proceeding for alleged violations ofthe Mining Code. On September 14, 2017, the San Juan Provincial miningauthority consolidated the administrative proceeding into a single proceedingagainst MAG encompassing both the September 2016 incident and the March2017 incident described above. Refer to note 18 to the Financial Statements formore information regarding this matter.
Cyanide leaching process – civil actionOn December 15, 2016, MAG was served notice of a lawsuit by certain personswho claim to be living in Jachal, Argentina and to be affected by the Veladeromine and, in particular, the valley heap leach facility (“VLF”). In the lawsuit, whichwas filed in the San Juan Provincial court, the plaintiffs have requested a courtorder that MAG cease leaching metals with cyanide solutions, mercury and othersimilar substances at the Veladero mine and replace that process with one that isfree of hazardous substances, that MAG implement a closure and remediationplan for the VLF and surrounding areas, and create a committee to monitor thisprocess. The lawsuit is proceeding as an ordinary civil action. The Companyreplied to the lawsuit on February 20, 2017, and the case will now proceed to theevidentiary stage. On March 31, 2017, the plaintiffs supplemented their originalcomplaint to allege that the risk of environment damage had increased as aresult of the March 28, 2017 release of gold-bearing process solution incidentdescribed above. Refer to note 18 to the Financial Statements for moreinformation regarding this matter.
OutlookWe now expect Barrick’s share (50 percent basis from July 1, 2017) of goldproduction to be in the narrowed range of 430 to 465 thousand ounces. We alsonow expect cost of sales per ounce4 to be in the range of $870 to $940 perounce, cash costs1 per ounce to be in the range of $580 to $610 and all-insustaining costs1 to be in the range of $920 to $990 per ounce compared to ourprevious ranges of $740 to $790 per ounce, $550 to $590 per ounce and $890 to$990 per ounce, respectively. The updates primarily reflect the effect of the fairvalue increments applied to our remaining 50% interest.

Turquoise Ridge (75% basis), Nevada USA Summary of Operating and Financial Data For the three months ended September 30 For the nine months ended September 30 2017 2016 % Change 2017 2016 % Change Underground tonnes mined (000s) 170 155 10% 473 442 7% Average grade (grams/tonne)
Underground mined 15.21 17.10 (11)% 15.50 17.20 (10)% Gold produced (000s/oz) 68 72 (6)% 147 201 (27)% Gold sold (000s/oz) 66 80 (18)% 141 188 (25)%
Segment revenue ($ millions) $ 84 $ 107 (21)% $ 177 $ 238 (26)% Cost of sales ($ millions) 49 45 9% 104 114 (9)% Segment income ($ millions) 34 62 (45)% 71 123 (42)% Segment EBITDA ($ millions) 1 43 70 (39)% 89 142 (37)% Capital expenditures ($ millions) 11 9 22% 24 23 4%
Minesite sustaining 11 9 22% 24 23 4% Project — — —% — — —%
Cost of sales (per oz) 755 558 35% 740 605 22% Cash costs (per oz) 1 617 460 34% 612 504 21% All-in sustaining costs (per oz) 1 793 583 36% 788 631 25% All-in costs (per oz) 1 $ 793 $ 583 36% $ 788 $ 631 25%
1 These are non-GAAP financial performance measures with no standardized meaning under IFRS and therefore may not be comparable to similar measures presented by other issuers. Forfurther information and a detailed reconciliation of each non-GAAP measure used in this section of the MD&A to the most directly comparable IFRS measure, please see pages 49 to 63 ofthis MD&A.
BARRICK THIRD QUARTER 2017 42 MANAGEMENT’S DISCUSSION AND ANALYSIS
Financial ResultsTurquoise Ridge’s segment income for the three and nine month periods endedSeptember 30, 2017 was 45% and 42% lower, respectively, than the sameprior year periods. The decreases were primarily due to a decrease in salesvolume combined with lower realized gold prices 1 .
Gold production for the three and nine month periods ended September 30,2017 were 6% and 27% lower, respectively, than the same prior year periods,due to lower grades, partially offset by higher tonnes mined. Lower grades inthe current year were due to the planned mining of the south zone. Theincrease in tonnes mined resulted from increased mining productivity becauseof improved equipment availability combined with improved mine engineering totake advantage of the larger ore geometry as well as otherBest-in-Class activities to increase the effective operating time on shift in themine. Production for the nine months ended September 30, 2017 was alsoimpacted by the issues related to higher organic carbon content experiencedearlier this year and the related decision to process 17 thousand ounces atBarrick Nevada, which will be recognized as Barrick Nevada production beforethe end of the year.
Cost of sales per ounce 4 for the three and nine month periods endedSeptember 30, 2017, were $197 and $135 per ounce higher, respectively, thanthe same prior year periods mainly reflecting the impact of lower sales volumeon unit production costs combined with higher processing costs associated withprocessing lower grade ore and higher organic carbon content. For the threeand nine month periods ended September 30, 2017, all-in
sustaining costs 1 increased by $210 and $157 per ounce, respectively,compared to the same prior year periods primarily reflecting the higher cost ofsales per ounce4 combined with the increase in minesite sustaining capitalexpenditures.
Capital expenditures for the three and nine month periods ended September 30,2017, increased by 22% and 4%, respectively, compared to the same prior yearperiods. The increase was primarily due to the timing of minesite sustainingcapital expenditures combined with the construction of the third shaft, partiallyoffset by a decrease in capitalized underground development costs.
OutlookWe continue to expect 2017 production to be in the range of 210 to 230 thousandounces at cost of sales per ounce 4 to be in the range of $700 to $750 per ounce.We now expect cash costs 1 per ounce to be in the range of $580 to $610 andall-in sustaining costs 1 to be in the range of $770 to $830 per ounce comparedto our previous ranges of $570 to $600 per ounce and $750 to $830 per ounce,respectively. The increase in costs is primarily due to higher tonnage mined at alower grade and higher tonnage backfilled, as well as the reduction in ounces.

Acacia Mining plc (100% basis), Africa Summary of Operating and Financial Data For the three months ended September 30 For the nine months ended September 30 2017 2016 % Change 2017 2016 % Change Total tonnes mined (000s) 8,608 9,501 (9)% 26,647 28,847 (8)%
Open pit 8,236 9,212 (11)% 25,550 27,869 (8)% Underground 372 289 29% 1,097 978 12%
Average grade (grams/tonne) Open pit mined 1.35 1.56 (13)% 1.40 1.46 (4)% Underground mined 8.08 10.17 (21)% 8.56 10.22 (16)% Processed 1 3.30 3.10 6% 3.10 3.00 3%
Ore tonnes processed (000s) 2,004 2,351 (15)% 6,864 7,251 (5)% Gold produced (000s/oz) 191 205 (7)% 619 617 —% Gold sold (000s/oz) 133 206 (35)% 445 607 (27)%
Segment revenue ($ millions) $ 170 $ 283 (40)% $ 561 $ 783 (28)% Cost of sales ($ millions) 107 175 (39)% 355 524 (32)% Segment income ($ millions) 30 109 (72)% 159 240 (34)% Segment EBITDA ($ millions) 2 53 152 (65)% 241 362 (33)% Capital expenditures ($ millions) 36 53 (32)% 127 135 (6)%
Minesite sustaining 29 53 (45)% 119 134 (11)% Project 7 — — 8 1 —
Cost of sales (per oz) 808 840 (4)% 796 861 (8)% Cash costs (per oz) 2 616 598 3% 588 626 (6)% All-in sustaining costs (per oz) 2 939 998 (6)% 907 961 (6)% All-in costs (per oz) 2 $ 992 $ 1,000 (1)% $ 925 $ 963 (4)%
1 Includes processing of tailings retreatment.2 These are non-GAAP financial performance measures with no standardized meaning under IFRS and therefore may not be comparable to similar measures presented by other issuers. For
further information and a detailed reconciliation of each non-GAAP measure used in this section of the MD&A to the most directly comparable IFRS measure, please see pages 49 to 63 ofthis MD&A.
BARRICK THIRD QUARTER 2017 43 MANAGEMENT’S DISCUSSION AND ANALYSIS
Barrick holds a 63.9 percent equity interest in Acacia Mining plc, a publiclytraded company listed on the London Stock Exchange that is operatedindependently of Barrick.
Financial ResultsAcacia’s segment income for the three and nine month periods endedSeptember 30, 2017 was 72% and 34% lower, respectively, than the sameprior year periods primarily due to lower sales volume as a result of theconcentrate export ban, affecting sales from Bulyanhulu and Buzwagicombined with lower realized gold prices 1 and higher restructuring costsmainly consisting of severance costs incurred as part of the Bulyanhulureduced operations program. The decrease was partially offset by lower cost ofsales.
For the three and nine month periods ended September 30, 2017, goldproduction was 7% lower then and in line with, respectively, the same prior yearperiods. For the three month period, the decrease was mainly attributed tolower production at North Mara as a result of lower grades at the Gokonaunderground mine and Nyabirama pit combined with a slight decrease atBulyanhulu due to reduced operations in the second half of the third quarterand continued droughts in the Kahama district. These were partially offset byan increase
at Buzwagi as a result of higher grade ore from the main ore zone at the bottomof the open pit compared to delays in accessing the main ore zone in the sameprior year period. For the nine month period the higher production at Buzwagiwas almost entirely offset by lower production at Bulyanhulu and North Mara.Gold ounces sold were lower than ounces produced primarily as a result of theban on concentrate exports, as described below.
Cost of sales per ounce 4 in the three and nine month periods endedSeptember 30, 2017 was 4% and 8% lower, respectively, than the same prioryear periods primarily reflecting the impact of the build-up in inventory due to theban on concentrate exports combined with lower depreciation expense. Thesedecreases were partially offset by lower capitalized underground developmentcosts at Bulyanhulu and lower waste stripping at North Mara’s Nyabirama pitcombined with the impact of lower sales volume on unit production costs. All-insustaining costs 1 for the three and nine month periods ended September 30,2017 were 6% and 6% lower, respectively, than the same prior year periods dueto lower cost of sales per ounce 4 combined with lower stock-basedcompensation expense and a decrease in minesite sustaining capitalexpenditures.

BARRICK THIRD QUARTER 2017 44 MANAGEMENT’S DISCUSSION AND ANALYSIS
For the three and nine month periods ended September 30, 2017, capitalexpenditures decreased by 32% and 6%, respectively, compared to the sameprior year periods. The decrease was primarily due to lower capitalizedstripping costs attributed to lower underground development at Bulyanhulucombined with lower waste stripping at North Mara relating to Nyabirama Stage4. These were partially offset by an increase in capitalized drilling at NorthMara’s Gokona underground.
Concentrate Export Ban and Related Disputes with the Government ofTanzania
On March 3, 2017, the Tanzanian Government announced a general ban onthe export of metallic mineral concentrates following a directive made by thePresident to promote the creation of a domestic smelting industry. Following thedirective, Acacia ceased all exports of its gold/copper concentrate(“concentrate”) including containers previously approved for export prior to theban which are located in Dar es Salaam.
The prevention of exports impacts Bulyanhulu and Buzwagi which produce goldin both doré and in concentrate form due to the mineralogy of the ore. NorthMara is unaffected due to 100% of its production being doré. Since the exportban was imposed, impacting approximately 35% of year-to-date groupproduction, Acacia has seen a build-up of approximately US$270 million ofconcentrate inventory in Tanzania, based on current prices, with approximately186,000 ounces of gold, 12.1 million pounds of copper and 159,000 ounces ofsilver contained in the unsold concentrate. As a result of the transition to areduced operations program at Bulyanhulu, and the changes to the processflowsheet at Buzwagi, all of Acacia’s mines are now solely producing doré, andas such will no longer see a further build up of concentrate.
During the second quarter, two Presidential Committees reported their findings,following investigations, that Acacia and its predecessor companies havehistorically under-declared the contents of the exports of concentrate, resultingin a significant under-declaration of taxes. Acacia has received adjustedassessments for the tax years 2000-2017 from the Tanzania Revenue Authorityfor a total amount of approximately $190 billion. Acacia has refuted the findingsof these committees, affirming that it has declared everything of commercialvalue that it has produced since it started operating in Tanzania and has paidall appropriate royalties and taxes on all of the payable minerals that it hasproduced.
Following the end of the third quarter, Acacia received further notices ofadjusted corporate income tax and withholding tax assessments from theTanzania Revenue
Authority for the tax years 2005 to 2011 with respect to Acacia’s formerTulawaka joint venture for a total amount of approximately $3 billion.
In addition, new and amended legislation was passed in Tanzania in early July2017, including various amendments to the 2010 Mining Act and a new FinanceAct. The amendments to the 2010 Mining Act increased the royalty rateapplicable to metallic minerals such as gold, copper and silver to 6% from 4%,and the new Finance Act imposes a 1% clearing fee on the value of all mineralsexported from Tanzania from July 1, 2017. Acacia continues to monitor theimpact of the new legislation in light of its Mineral Development Agreements withthe Government of Tanzania which set out and preserve the legal and regulatoryframework under which its mines operate. However, to minimize furtherdisruptions to its operations Acacia will, in the interim, satisfy the requirementsimposed as regards the increased royalty rate in addition to the recently imposed1% clearing fee on exports without prejudice to its legal rights.
In July 2017, Acacia announced that it had served Notices of Arbitration inTanzania in respect of the current disputes with the Government of Tanzania inaccordance with the dispute resolution processes agreed by the Government inthe relevant Mineral Development Agreements. The serving of the Notices wasnecessary to protect Acacia’s legal rights, but Acacia remains of the view that anegotiated resolution is the preferable outcome to the current disputes andAcacia will continue to work to achieve this.
On October 19, 2017, Barrick announced that it had agreed with the Governmentof Tanzania a proposed framework for a new partnership between Acacia andthe Government of Tanzania. Barrick and the Government of the Tanzania alsoagreed to form a working group that will focus on the resolution of outstandingtax claims against Acacia. Key terms of the proposal include (i) the creation of anew Tanzanian operating company to manage Acacia’s Bulyanhulu, Buzwagiand North Mara mines and all future operations in the country with key officerslocated in Tanzania and Tanzanian representation on the board of directors,(ii) maximization of local employment of Tanzanians and procurement of goodsand services within Tanzania, (iii) economic benefits from Bulyanhulu, Buzwagiand North Mara would be distributed on a 50/50 basis, with the Government’sshare delivered in the form of royalties, taxes and a 16% free carry interest inAcacia’s Tanzanian operations; and (iv) in support of the working group’songoing efforts to resolve outstanding tax claims, Acacia would make a paymentof $300 million to the Government of Tanzania, on terms to be settled by theworking group. Barrick and the Government of Tanzania are also reviewing theconditions for the lifting of the

BARRICK THIRD QUARTER 2017 45 MANAGEMENT’S DISCUSSION AND ANALYSIS
concentrate export ban. The proposal is subject to review and approval byAcacia.
OutlookAs a result of reduced operating activity at Bulyanhulu, Acacia expects annualproduction to be 100 thousand ounces lower than the bottom of the previousrange of 850 to 900 thousand ounces. Acacia has stated that the revisedguidance is based on limited production occurring beyond August at Bulyanhuluand marginally lower production at North Mara than previously planned due tounderground development delays as a result of work permit issues for keycontractors.
We continue to monitor this situation and have revised guidance for Acacia2017 gold production to approximately 480 thousand ounces (Barrick’s share)in line with the reduction set out above from our previous range of 545 to575 thousand ounces (Barrick’s share). We continue to expect cost of sales perounce 4 , cash costs 1 and all-in sustaining costs 1 to be in the range of $860 to$910 per ounce, $580 to $620 per ounce and $880 to $920 per ounce,respectively. Acacia operations impacted by the current ban on concentrateexports (Bulyanhulu and Buzwagi) account for approximately five per cent ofBarrick’s 2017 gold production guidance. In total, Acacia accounts forapproximately nine percent of Barrick’s 2017 gold production guidance.
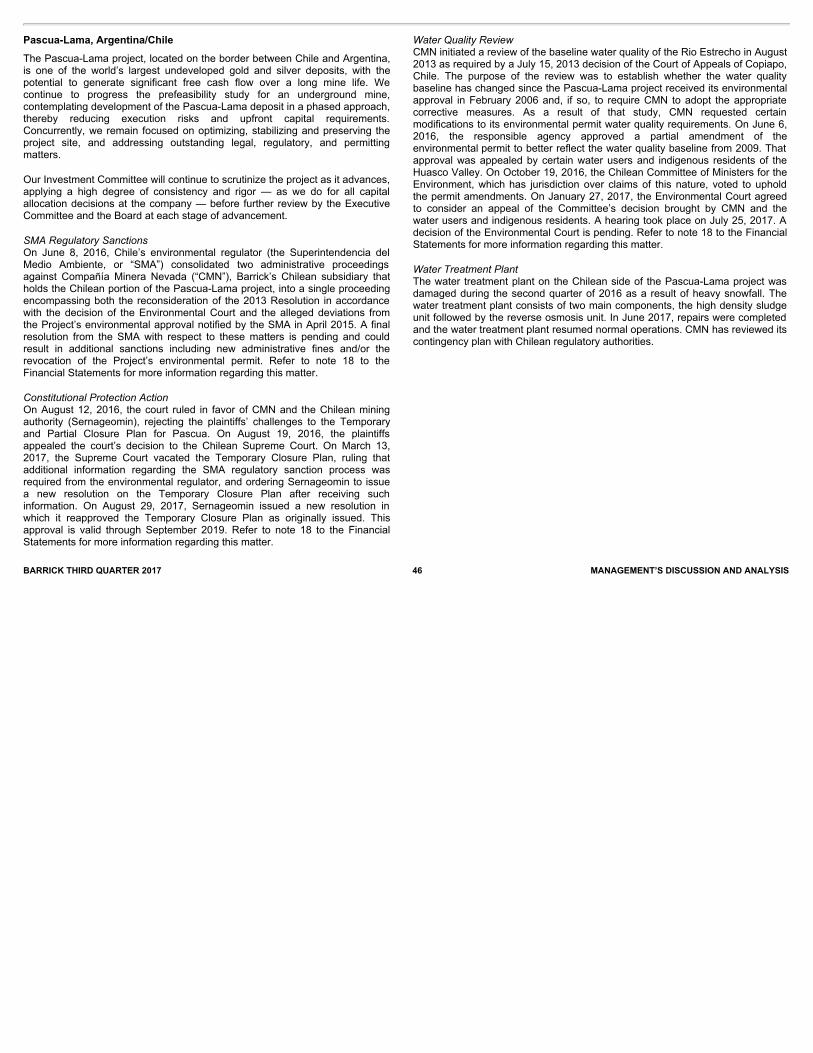
BARRICK THIRD QUARTER 2017 46 MANAGEMENT’S DISCUSSION AND ANALYSIS
Pascua-Lama, Argentina/ChileThe Pascua-Lama project, located on the border between Chile and Argentina,is one of the world’s largest undeveloped gold and silver deposits, with thepotential to generate significant free cash flow over a long mine life. Wecontinue to progress the prefeasibility study for an underground mine,contemplating development of the Pascua-Lama deposit in a phased approach,thereby reducing execution risks and upfront capital requirements.Concurrently, we remain focused on optimizing, stabilizing and preserving theproject site, and addressing outstanding legal, regulatory, and permittingmatters.
Our Investment Committee will continue to scrutinize the project as it advances,applying a high degree of consistency and rigor — as we do for all capitalallocation decisions at the company — before further review by the ExecutiveCommittee and the Board at each stage of advancement.
SMA Regulatory SanctionsOn June 8, 2016, Chile’s environmental regulator (the Superintendencia delMedio Ambiente, or “SMA”) consolidated two administrative proceedingsagainst Compañía Minera Nevada (“CMN”), Barrick’s Chilean subsidiary thatholds the Chilean portion of the Pascua-Lama project, into a single proceedingencompassing both the reconsideration of the 2013 Resolution in accordancewith the decision of the Environmental Court and the alleged deviations fromthe Project’s environmental approval notified by the SMA in April 2015. A finalresolution from the SMA with respect to these matters is pending and couldresult in additional sanctions including new administrative fines and/or therevocation of the Project’s environmental permit. Refer to note 18 to theFinancial Statements for more information regarding this matter.
Constitutional Protection ActionOn August 12, 2016, the court ruled in favor of CMN and the Chilean miningauthority (Sernageomin), rejecting the plaintiffs’ challenges to the Temporaryand Partial Closure Plan for Pascua. On August 19, 2016, the plaintiffsappealed the court’s decision to the Chilean Supreme Court. On March 13,2017, the Supreme Court vacated the Temporary Closure Plan, ruling thatadditional information regarding the SMA regulatory sanction process wasrequired from the environmental regulator, and ordering Sernageomin to issuea new resolution on the Temporary Closure Plan after receiving suchinformation. On August 29, 2017, Sernageomin issued a new resolution inwhich it reapproved the Temporary Closure Plan as originally issued. Thisapproval is valid through September 2019. Refer to note 18 to the FinancialStatements for more information regarding this matter.
Water Quality ReviewCMN initiated a review of the baseline water quality of the Rio Estrecho in August2013 as required by a July 15, 2013 decision of the Court of Appeals of Copiapo,Chile. The purpose of the review was to establish whether the water qualitybaseline has changed since the Pascua-Lama project received its environmentalapproval in February 2006 and, if so, to require CMN to adopt the appropriatecorrective measures. As a result of that study, CMN requested certainmodifications to its environmental permit water quality requirements. On June 6,2016, the responsible agency approved a partial amendment of theenvironmental permit to better reflect the water quality baseline from 2009. Thatapproval was appealed by certain water users and indigenous residents of theHuasco Valley. On October 19, 2016, the Chilean Committee of Ministers for theEnvironment, which has jurisdiction over claims of this nature, voted to upholdthe permit amendments. On January 27, 2017, the Environmental Court agreedto consider an appeal of the Committee’s decision brought by CMN and thewater users and indigenous residents. A hearing took place on July 25, 2017. Adecision of the Environmental Court is pending. Refer to note 18 to the FinancialStatements for more information regarding this matter.
Water Treatment PlantThe water treatment plant on the Chilean side of the Pascua-Lama project wasdamaged during the second quarter of 2016 as a result of heavy snowfall. Thewater treatment plant consists of two main components, the high density sludgeunit followed by the reverse osmosis unit. In June 2017, repairs were completedand the water treatment plant resumed normal operations. CMN has reviewed itscontingency plan with Chilean regulatory authorities.

COMMITMENTS AND CONTINGENCIES
Litigation and ClaimsWe are currently subject to various litigation proceedings as disclosed in note 18 to the Financial Statements, and we may be involved in disputes with other parties inthe future that may result in litigation. If we are unable to resolve these disputes favorably, it may have a material adverse impact on our financial condition, cash flowand results of operations.
Contractual Obligations and CommitmentsIn the normal course of business, we enter into contracts that give rise to commitments for future minimum payments. The following table summarizes the remainingcontractual maturities of our financial liabilities and operating and capital commitments shown on an undiscounted basis:
($ millions) Payments due as at September 30, 2017
2017 2018 2019 2020 2021 2022 and thereafter Total
Debt 1 Repayment of principal $ 1 $ 33 $ 32 $ 263 $ 636 $ 5,446 $ 6,411 Capital leases 8 36 7 7 3 8 69 Interest 156 362 361 356 332 5,353 6,920
Provisions for environmental rehabilitation2 31 81 64 100 93 1,844 2,213 Operating leases 12 21 13 11 9 10 76 Restricted share units 29 26 4 4 — — 63 Pension benefits and other post-retirement benefits 5 20 20 20 20 408 493 Derivative liabilities 3 16 33 2 — — — 51 Purchase obligations for supplies andconsumables 4 322 253 196 145 90 5 1,011 Capital commitments 5 58 18 4 4 4 27 115 Social development costs 6 4 4 5 2 1 201 217
Total $ 642 $ 887 $ 708 $ 912 $ 1,188 $ 13,302 $ 17,639
1 Debt and Interest - Our debt obligations do not include any subjective acceleration clauses or other clauses that enable the holder of the debt to call for early repayment, except in the eventthat we breach any of the terms and conditions of the debt or for other customary events of default. We are not required to post any collateral under any debt obligations. Projected interestpayments on variable rate debt were based on interest rates in effect at September 30, 2017. Interest is calculated on our long-term debt obligations using both fixed and variable rates.
2 Provisions for Environmental Rehabilitation - Amounts presented in the table represent the undiscounted uninflated future payments for the expected cost of provisions for environmentalrehabilitation.
3 Derivative Liabilities - Amounts presented in the table relate to derivative contracts disclosed under note 25C to the 2016 Annual Report. Payments related to derivative contracts may besubject to change given variable market conditions.
4 Purchase Obligations for Supplies and Consumables - Includes commitments related to new purchase obligations to secure a supply of acid, tires and cyanide for our production process.5 Capital Commitments - Purchase obligations for capital expenditures include only those items where binding commitments have been entered into.6 Social Development Costs - Includes a commitment of $153 million related to the potential funding of a power transmission line in Argentina, the majority of which is not expected to be paid
prior to 2022. BARRICK THIRD QUARTER 2017 47 MANAGEMENT’S DISCUSSION AND ANALYSIS

REVIEW OF QUARTERLY RESULTSQuarterly Information 1 2017 2016 2015 ($ millions, except where indicated) Q3 Q2 Q1 Q4 Q3 Q2 Q1 Q4 Revenues $ 1,993 $ 2,160 $ 1,993 $ 2,319 $ 2,297 $ 2,012 $ 1,930 $ 2,238 Realized price per ounce – gold 2 1,274 1,258 1,220 1,217 1,333 1,259 1,181 1,105 Realized price per pound – copper 2 3.05 2.60 2.76 2.62 2.18 2.14 2.18 2.16 Cost of sales 1,270 1,277 1,342 1,454 1,291 1,336 1,324 1,768 Net earnings (loss) (11) 1,084 679 425 175 138 (83) (2,622)
Per share (dollars) 3 (0.01) 0.93 0.58 0.36 0.15 0.12 (0.07) (2.25) Adjusted net earnings 2 186 261 162 255 278 158 127 91
Per share (dollars) 2,3 0.16 0.22 0.14 0.22 0.24 0.14 0.11 0.08 Operating cash flow 532 448 495 711 951 527 451 698 Cash capital expenditures 307 405 334 326 277 253 270 311 Free cash flow 2 $ 225 $ 43 $ 161 $ 385 $ 674 $ 274 $ 181 $ 387
1 Sum of all the quarters may not add up to the annual total due to rounding.2 Realized price, adjusted net earnings, adjusted net earnings per share and free cash flow are non-GAAP financial performance measures with no standardized meaning under IFRS and
therefore may not be comparable to similar measures of performance presented by other issuers. For further information and a detailed reconciliation of each non-GAAP measure used in thissection of the MD&A to the most directly comparable IFRS measure, please see pages 49 to 63 of this MD&A.
3 Calculated using weighted average number of shares outstanding under the basic method of earnings per share.
INTERNAL CONTROL OVER FINANCIAL REPORTING AND DISCLOSURE CONTROLS AND PROCEDURES
BARRICK THIRD QUARTER 2017 48 MANAGEMENT’S DISCUSSION AND ANALYSIS
Our recent financial results reflect our emphasis on cost control and growingoperating cash flow and free cash flow. While gold prices have fluctuatedaround $1,200 per ounce, we are consistently generating positive free cashflow 1 . This free cash flow, combined with the proceeds from variousdivestitures, have allowed us to strengthen our balance sheet over the past twoyears. In the second quarter of 2017, we recorded $858 million (net of taxeffects) of gains on the disposition of 50% of Veladero mine and a 25% interestin the Cerro Casale project. In the first quarter of 2017, we recorded a net assetimpairment reversal of $522 million (net of tax
effects and non-controlling interest) primarily relating to impairment reversals atthe Cerro Casale project. In the fourth quarter of 2016, we recorded a net assetimpairment reversal of $146 million (net of tax effects and non-controllinginterests) primarily relating to impairment reversals at Veladero and LagunasNorte. In the fourth quarter of 2015, we recorded asset and goodwill impairmentsof $2.6 billion (net of tax effects and non-controlling interests), primarily related toour Pueblo Viejo and Goldstrike mines and Pascua-Lama project.
Management is responsible for establishing and maintaining adequate internalcontrol over financial reporting and disclosure controls and procedures asdefined in our 2016 annual MD&A.
Together, the internal control frameworks provide internal control over financialreporting and disclosure. Due to its inherent limitations, internal control overfinancial reporting and disclosure may not prevent or detect all misstatements.Further, the effectiveness of internal control is subject to the risk that controlsmay become inadequate because of changes in conditions, or that the degreeof compliance with policies or procedures may change.
Management will continue to monitor the effectiveness of its internal control overfinancial reporting and disclosure controls and procedures and may makemodifications from time to time as considered necessary.

IFRS CRITICAL ACCOUNTING POLICIES AND ACCOUNTING ESTIMATES
NON-GAAP FINANCIAL PERFORMANCE MEASURES
Adjusted Net Earnings and Adjusted Net Earnings per Share
BARRICK THIRD QUARTER 2017 49 MANAGEMENT’S DISCUSSION AND ANALYSIS
Management has discussed the development and selection of our criticalaccounting estimates with the Audit Committee of the Board of Directors, andthe Audit Committee has reviewed the disclosure relating to such estimates inconjunction with its review of this MD&A. The accounting policies and methodswe utilize determine how we report our financial condition and results ofoperations, and they may require Management to make estimates or rely onassumptions about matters that are inherently uncertain. The consolidatedfinancial statements have been prepared in accordance with InternationalFinancial Reporting Standards (“IFRS”) as issued by the InternationalAccounting Standards Board (“IASB”) under the historical cost convention, asmodified by revaluation of certain financial assets, derivative contracts andpost-retirement assets. Our significant accounting policies are disclosed in note2 of the Financial
Statements, including a summary of current and future changes in accountingpolicies.
Critical Accounting Estimates and JudgmentsCertain accounting estimates have been identified as being “critical” to thepresentation of our financial condition and results of operations because theyrequire us to make subjective and/or complex judgments about matters that areinherently uncertain; or there is a reasonable likelihood that materially differentamounts could be reported under different conditions or using differentassumptions and estimates. Our significant accounting judgments, estimates andassumptions are disclosed in note 3 of the accompanying Financial Statements.
Adjusted net earnings is a non-GAAP financial measure which excludes thefollowing from net earnings: • Impairment charges (reversals) related to intangibles, goodwill, property,
plant and equipment, and investments;• Acquisition/disposition gains/losses;• Foreign currency translation gains/losses;• Significant tax adjustments;• Unrealized gains/losses on non-hedge derivative instruments; and• Tax effect and non-controlling interest of the above items.
Management uses this measure internally to evaluate our underlying operatingperformance for the reporting periods presented and to assist with the planningand forecasting of future operating results. Management believes that adjustednet earnings is a useful measure of our performance because impairmentcharges, acquisition/disposition gains/losses and significant tax adjustments donot reflect the underlying operating performance of our core mining businessand are not necessarily indicative of future operating results. Furthermore,foreign currency translation gains/losses and unrealized gains/losses fromnon-hedge derivatives are not necessarily reflective of the underlying operatingresults for the reporting periods presented. The tax effect and non-controllinginterest of the adjusting items are also excluded to reconcile the amounts toBarrick’s share on a post-tax basis, consistent with net earnings.
As noted, we use this measure for internal purposes. Management’s internalbudgets and forecasts and public guidance do not reflect the types of items weadjust for. Consequently, the presentation of adjusted net earnings enablesinvestors and analysts to better understand the underlying operatingperformance of our core mining business through the eyes of Management.Management periodically evaluates the components of adjusted net earningsbased on an internal assessment of performance measures that are useful forevaluating the operating performance of our business segments and a review ofthe non-GAAP measures used by mining industry analysts and other miningcompanies.
Adjusted net earnings is intended to provide additional information only and doesnot have any standardized definition under IFRS and should not be considered inisolation or as a substitute for measures of performance prepared in accordancewith IFRS. The measures are not necessarily indicative of operating profit orcash flow from operations as determined under IFRS. Other companies maycalculate these measures differently. The following table reconciles thesenon-GAAP measures to the most directly comparable IFRS measure.

Reconciliation of Net Earnings to Net Earnings per Share, Adjusted Net Earnings and Adjusted Net Earnings per Share
($ millions, except per share amounts in dollars) For the three months ended
September 30 For the nine months ended
September 30 2017 2016 2017 2016 Net earnings (loss) attributable to equity holders of the Company $ (11) $ 175 $ 1,752 $ 230
Impairment charges (reversals) related to intangibles, goodwill, property, plant and equipment, andinvestments 1 2 49 (1,128) 54 Acquisition/disposition (gains)/losses 2 (5) 37 (882) 35 Foreign currency translation (gains)/losses 25 19 60 181 Significant tax adjustments 3 174 5 183 59 Other expense adjustments 4 103 1 130 75 Unrealized gains on non-hedge derivative instruments (9) (12) (6) (23) Tax effect and non-controlling interest 5 (93) 4 500 (48) Adjusted net earnings $ 186 $ 278 $ 609 $ 563 Net earnings (loss) per share 6 (0.01) 0.15 1.50 0.20 Adjusted net earnings per share 6 0.16 0.24 0.52 0.48 1 Net impairment reversals for the nine month period ended September 30, 2017 primarily relate to impairment reversals at the Cerro Casale project upon reclassification of the project’s net
assets as held-for-sale as at March 31, 2017.2 Disposition gains for the three and nine month periods ended September 30, 2017 primarily relate to the sale of a 50% interest in the Veladero mine and the gain related to the sale of a
25% interest in the Cerro Casale project.3 Significant tax adjustments for the three and nine month periods ended September 30, 2017 primarily relate to a tax provision relating to the impact of the proposed framework for Acacia
operations in Tanzania.4 Other expense adjustments for the three and nine month periods ended September 30, 2017 primarily relate to debt extinguishment costs.5 Tax effect and non-controlling interest for the nine month period ended September 30, 2017 primarily relates to the impairment reversals at the Cerro Casale project discussed above.6 Calculated using weighted average number of shares outstanding under the basic method of earnings per share.
Free Cash Flow
Reconciliation of Net Cash Provided by Operating Activities to Free Cash Flow
($ millions) For the three months ended
September 30 For the nine months ended
September 30 2017 2016 2017 2016 Net cash provided by operating activities $ 532 $ 951 $ 1,475 $ 1,929 Capital expenditures (307) (277) (1,046) (800) Free cash flow $ 225 $ 674 $ 429 $ 1,129 BARRICK THIRD QUARTER 2017 50 MANAGEMENT’S DISCUSSION AND ANALYSIS
Free cash flow is a measure that excludes capital expenditures from net cashprovided by operating activities. Management believes this to be a usefulindicator of our ability to operate without reliance on additional borrowing orusage of existing cash.
Free cash flow is intended to provide additional information only and does nothave any standardized definition under IFRS, and should not be considered in
isolation or as a substitute for measures of performance prepared in accordancewith IFRS. The measure is not necessarily indicative of operating profit or cashflow from operations as determined under IFRS. Other companies may calculatethis measure differently. The following table reconciles this non-GAAP measureto the most directly comparable IFRS measure.

Cash costs per ounce, All-in sustaining costs per ounce, All-in costs per ounce, C1 cash costs per pound and All-in sustaining costs per pound
BARRICK THIRD QUARTER 2017 51 MANAGEMENT’S DISCUSSION AND ANALYSIS
Cash costs per ounce, all-in sustaining costs per ounce and all-in costs perounce are non-GAAP financial measures which are calculated based on thedefinitions published by the World Gold Council (“WGC”) (a marketdevelopment organization for the gold industry comprised of and funded by 18gold mining companies from around the world, including Barrick). The WGC isnot a regulatory organization. Management uses these measures to monitorthe performance of our gold mining operations and its ability to generatepositive cash flow, both on an individual site basis and an overall companybasis.
Cash costs start with our cost of sales applicable to gold production andremoves depreciation, the non-controlling interest of cost of sales and includesby-product credits. All-in sustaining costs start with cash costs and includesustaining capital expenditures, general & administrative costs, minesiteexploration and evaluation costs and reclamation cost accretion andamortization. These additional costs reflect the expenditures made to maintaincurrent production levels.
All-in costs start with all-in sustaining costs and add additional costs that reflectthe varying costs of producing gold over the life-cycle of a mine, including:non-sustaining capital expenditures (capital expenditures at new projects anddiscrete projects at existing operations intended to increase production capacityand will not benefit production for at least 12 months) and other non-sustainingcosts (primarily exploration and evaluation costs, community relations costsand general and administrative costs that are not associated with currentoperations). These definitions recognize that there are different costsassociated with the life-cycle of a mine, and that it is therefore appropriate todistinguish between sustaining and non-sustaining costs.
We believe that our use of cash costs, all-in sustaining costs and all-in costswill assist analysts, investors and other stakeholders of Barrick inunderstanding the costs associated with producing gold, understanding theeconomics of gold mining, assessing our operating performance and also ourability to generate free cash flow from current operations and to generate freecash flow on an overall company basis. Due to the capital-intensive nature ofthe industry and the long useful lives over which these items are depreciated,there can be a significant timing difference between net earnings calculated inaccordance with IFRS and the amount of free cash flow that is being generatedby a mine and therefore we believe these measures are useful non-
GAAP operating metrics and supplement our IFRS disclosures. These measuresare not representative of all of our cash expenditures as they do not includeincome tax payments, interest costs or dividend payments. These measures donot include depreciation or amortization.
Cash costs per ounce, all-in sustaining costs and all-in costs are intended toprovide additional information only and do not have standardized definitionsunder IFRS, and should not be considered in isolation or as a substitute formeasures of performance prepared in accordance with IFRS. These measuresare not equivalent to net income or cash flow from operations as determinedunder IFRS. Although the WGC has published a standardized definition, othercompanies may calculate these measures differently.
In addition to presenting these metrics on a by-product basis, we have calculatedthese metrics on a co-product basis. Our co-product metrics remove the impactof other metal sales that are produced as a by-product of our gold productionfrom cost per ounce calculations, but do not reflect a reduction in costs for costsassociated with other metal sales.
C1 cash costs per pound and all-in sustaining costs per pound are non-GAAPfinancial measures related to our copper mine operations. We believe that C1cash costs per pound enables investors to better understand the performance ofour copper operations in comparison to other copper producers who presentresults on a similar basis. C1 cash costs per pound excludes royalties andnon-routine charges as they are not direct production costs. All-in sustainingcosts per pound is similar to the gold all-in sustaining costs metric andManagement uses this to better evaluate the costs of copper production. Webelieve this change will enable investors to better understand the operatingperformance of our copper mines as this measure reflects all of the sustainingexpenditures incurred in order to produce copper. All-in sustaining costs perpound includes C1 cash costs, corporate general and administrative costs,minesite exploration and evaluation costs, royalties, environmental rehabilitationcosts and write-downs taken on inventory to net realizable value.
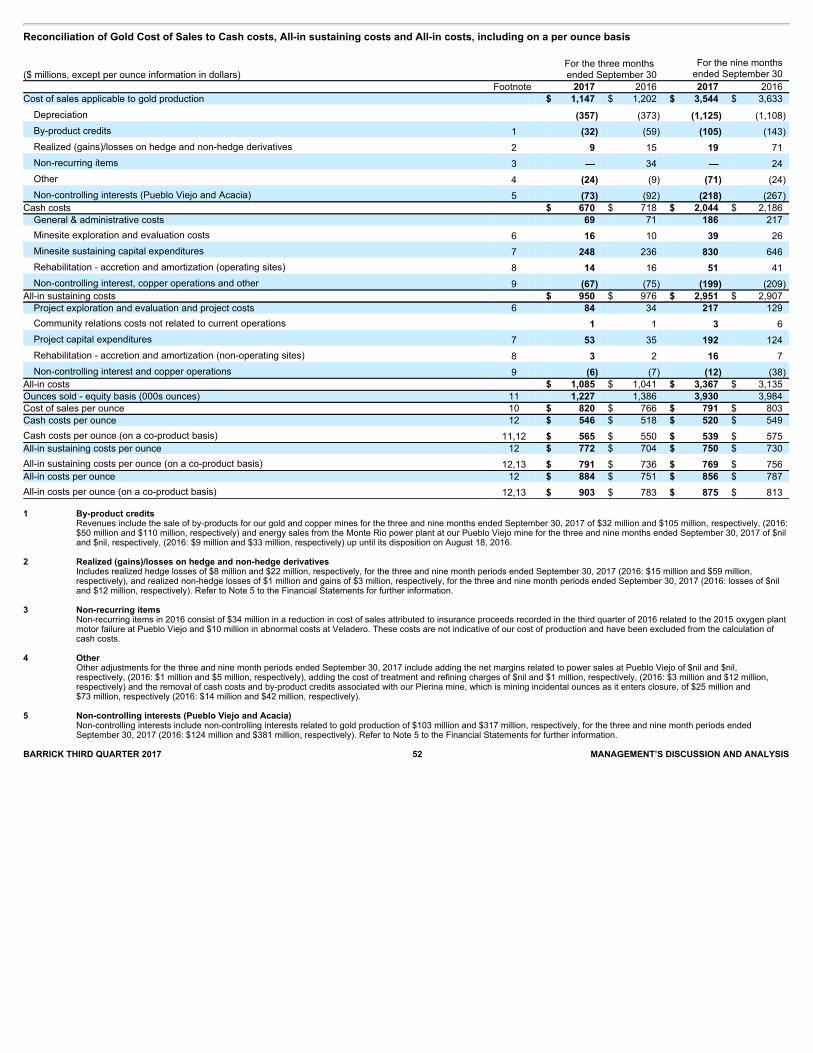
Reconciliation of Gold Cost of Sales to Cash costs, All-in sustaining costs and All-in costs, including on a per ounce basis
($ millions, except per ounce information in dollars) For the three months ended September 30
For the nine monthsended September 30
Footnote 2017 2016 2017 2016 Cost of sales applicable to gold production $ 1,147 $ 1,202 $ 3,544 $ 3,633
Depreciation (357) (373) (1,125) (1,108)
By-product credits 1 (32) (59) (105) (143)
Realized (gains)/losses on hedge and non-hedge derivatives 2 9 15 19 71
Non-recurring items 3 — 34 — 24
Other 4 (24) (9) (71) (24)
Non-controlling interests (Pueblo Viejo and Acacia) 5 (73) (92) (218) (267) Cash costs $ 670 $ 718 $ 2,044 $ 2,186
General & administrative costs 69 71 186 217
Minesite exploration and evaluation costs 6 16 10 39 26
Minesite sustaining capital expenditures 7 248 236 830 646
Rehabilitation - accretion and amortization (operating sites) 8 14 16 51 41
Non-controlling interest, copper operations and other 9 (67) (75) (199) (209) All-in sustaining costs $ 950 $ 976 $ 2,951 $ 2,907
Project exploration and evaluation and project costs 6 84 34 217 129
Community relations costs not related to current operations 1 1 3 6
Project capital expenditures 7 53 35 192 124
Rehabilitation - accretion and amortization (non-operating sites) 8 3 2 16 7
Non-controlling interest and copper operations 9 (6) (7) (12) (38) All-in costs $ 1,085 $ 1,041 $ 3,367 $ 3,135 Ounces sold - equity basis (000s ounces) 11 1,227 1,386 3,930 3,984 Cost of sales per ounce 10 $ 820 $ 766 $ 791 $ 803 Cash costs per ounce 12 $ 546 $ 518 $ 520 $ 549
Cash costs per ounce (on a co-product basis) 11,12 $ 565 $ 550 $ 539 $ 575 All-in sustaining costs per ounce 12 $ 772 $ 704 $ 750 $ 730
All-in sustaining costs per ounce (on a co-product basis) 12,13 $ 791 $ 736 $ 769 $ 756 All-in costs per ounce 12 $ 884 $ 751 $ 856 $ 787
All-in costs per ounce (on a co-product basis) 12,13 $ 903 $ 783 $ 875 $ 813 1 By-product credits Revenues include the sale of by-products for our gold and copper mines for the three and nine months ended September 30, 2017 of $32 million and $105 million, respectively, (2016:
$50 million and $110 million, respectively) and energy sales from the Monte Rio power plant at our Pueblo Viejo mine for the three and nine months ended September 30, 2017 of $niland $nil, respectively, (2016: $9 million and $33 million, respectively) up until its disposition on August 18, 2016.
2 Realized (gains)/losses on hedge and non-hedge derivatives Includes realized hedge losses of $8 million and $22 million, respectively, for the three and nine month periods ended September 30, 2017 (2016: $15 million and $59 million,
respectively), and realized non-hedge losses of $1 million and gains of $3 million, respectively, for the three and nine month periods ended September 30, 2017 (2016: losses of $niland $12 million, respectively). Refer to Note 5 to the Financial Statements for further information.
3 Non-recurring items Non-recurring items in 2016 consist of $34 million in a reduction in cost of sales attributed to insurance proceeds recorded in the third quarter of 2016 related to the 2015 oxygen plant
motor failure at Pueblo Viejo and $10 million in abnormal costs at Veladero. These costs are not indicative of our cost of production and have been excluded from the calculation ofcash costs.
4 Other Other adjustments for the three and nine month periods ended September 30, 2017 include adding the net margins related to power sales at Pueblo Viejo of $nil and $nil,
respectively, (2016: $1 million and $5 million, respectively), adding the cost of treatment and refining charges of $nil and $1 million, respectively, (2016: $3 million and $12 million,respectively) and the removal of cash costs and by-product credits associated with our Pierina mine, which is mining incidental ounces as it enters closure, of $25 million and$73 million, respectively (2016: $14 million and $42 million, respectively).
5 Non-controlling interests (Pueblo Viejo and Acacia) Non-controlling interests include non-controlling interests related to gold production of $103 million and $317 million, respectively, for the three and nine month periods ended
September 30, 2017 (2016: $124 million and $381 million, respectively). Refer to Note 5 to the Financial Statements for further information. BARRICK THIRD QUARTER 2017 52 MANAGEMENT’S DISCUSSION AND ANALYSIS

6 Exploration and evaluation costsExploration, evaluation and project expenses are presented as minesite sustaining if it supports current mine operations and project if it relates to future projects. Refer to page 30 ofthis MD&A.
7 Capital expenditures
Capital expenditures are related to our gold sites only and are presented on a 100% accrued basis. They are split between minesite sustaining and project capital expenditures.Project capital expenditures are distinct projects designed to increase the net present value of the mine and are not related to current production. Significant projects in the currentyear are stripping at Cortez Crossroads, underground development at Cortez Hills Lower Zone and the range front declines, Lagunas Norte Refractory Ore Project and Goldrush.Refer to page 29 of this MD&A.
8 Rehabilitation—accretion and amortization
Includes depreciation on the assets related to rehabilitation provisions of our gold operations and accretion on the rehabilitation provision of our gold operations, split betweenoperating and non-operating sites.
9 Non-controlling interest and copper operations
Removes general & administrative costs related to non-controlling interests and copper based on a percentage allocation of revenue. Also removes exploration, evaluation and projectexpenses, rehabilitation costs and capital expenditures incurred by our copper sites and the non-controlling interest of our Acacia and Pueblo Viejo operating segments and SouthArturo. Figures remove the impact of Pierina. The impact is summarized as the following:
($ millions) For the three months ended
September 30 For the nine months ended
September 30 Non-controlling interest, copper operations and other 2017 2016 2017 2016 General & administrative costs $ (5) $ (8) $ (13) $ (31)
Minesite exploration and evaluation expenses
(6
)
(2
)
(13
)
(6
)
Rehabilitation - accretion and amortization (operating sites)
(2
)
(2
)
(8
)
(5
)
Minesite sustaining capital expenditures
(54
)
(63
)
(165
)
(167
) All-in sustaining costs total $ (67) $ (75) $ (199) $ (209) Project exploration and evaluation and project costs (3) (3) (9) (8)
Project capital expenditures
(3
)
(4
)
(3
)
(30
) All-in costs total $ (6) $ (7) $ (12) $ (38)
10 Ounces sold - equity basis
Figures remove the impact of Pierina as the mine is currently going through closure. 11 Cost of sales per ounce
Figures remove the cost of sales impact of Pierina of $38 million and $119 million, respectively, for the three and nine month periods ended September 30, 2017 (2016: $17 millionand $52 million, respectively), as the mine is currently going through closure. Cost of sales per ounce excludes non-controlling interest related to gold production. Cost of salesapplicable to gold per ounce is calculated using cost of sales on an attributable basis (removing the non-controlling interest of 40% Pueblo Viejo and 36.1% Acacia from cost of sales),divided by attributable gold ounces.
12 Per ounce figures
Cost of sales per ounce, cash costs per ounce, all-in sustaining costs per ounce and all-in costs per ounce may not calculate based on amounts presented in this table due torounding.
13 Co-product costs per ounce
Cash costs per ounce, all-in sustaining costs per ounce and all-in costs per ounce presented on a co-product basis removes the impact of by-product credits of our gold production(net of non-controlling interest) calculated as:
($millions) For the three months ended
September 30 For the nine months ended
September 30 2017 2016 2017 2016 By-product credits $ 32 $ 59 $ 105 $ 143
Non-controlling interest
(7
)
(14
)
(24
)
(40
) By-product credits (net of non-controlling interest) $ 25 $ 45 $ 81 $ 103
BARRICK THIRD QUARTER 2017 53 MANAGEMENT’S DISCUSSION AND ANALYSIS

Reconciliation of Gold Cost of Sales to Cash costs, All-in sustaining costs and All-in costs, including on a per ounce basis, by operating site ($ millions, except per ounce information in dollars) For the three months ended September 30, 2017
Footnote BarrickNevada
Pueblo Viejo
LagunasNorte Veladero
TurquoiseRidge Acacia Hemlo
Golden Sunlight Porgera Kalgoorlie
Cost of sales applicable to gold production $ 425 $ 165 $ 58 $ 106 $ 49 $ 107 $ 46 $ 13 $ 58 $ 81
Depreciation (179) (38) (17) (48) (9) (23) (6) (1) (9) (16)
By-product credits 1 — (21) (5) (1) — (1) — — (1) —
Non-recurring items 2 — — — — — — — — — —
Other 3 — — — — — — — — — —
Non-controlling interests — (43) — — — (30) — — — — Cash costs $ 246 $ 63 $ 36 $ 57 $ 40 $ 53 $ 40 $ 12 $ 48 $ 65
General & administrative costs — — — — — 7 — — — —
Minesite exploration and evaluation costs 4 5 — 2 — — — — — — 3
Minesite sustaining capital expenditures 5 78 35 5 21 11 29 15 — 14 4
Rehabilitation - accretion and amortization(operating sites) 6 5 3 2 1 1 1 1 1 — 1
Non-controlling interests (1) (16) — — — (13) — — — —
All-in sustaining costs $ 333 $ 85 $ 45 $ 79 $ 52 $ 77 $ 56 $ 13 $ 62 $ 73
Project exploration and evaluation andproject costs 4 1 — — — — — — — — —
Project capital expenditures 5 36 — 3 — — 7 1 — — —
Non-controlling interests — — — — — (3) — — — — All-in costs $ 370 $ 85 $ 48 $ 79 $ 52 $ 81 $ 57 $ 13 $ 62 $ 73 Ounces sold - equity basis (000s ounces) 556 142 93 90 66 85 36 10 56 92 Cost of sales per ounce 7,8 $ 762 $ 717 $ 612 $ 1,187 $ 755 $ 808 $ 1,297 $ 1,258 $ 1,023 $ 876 Cash costs per ounce 8 $ 441 $ 442 $ 390 $ 637 $ 617 $ 616 $ 1,130 $ 1,157 $ 853 $ 701
Cash costs per ounce (on a co-product basis) 8,9 $ 442 $ 544 $ 437 $ 658 $ 617 $ 622 $ 1,135 $ 1,167 $ 863 $ 706 All-in sustaining costs per ounce 8 $ 597 $ 604 $ 470 $ 890 $ 793 $ 939 $ 1,570 $ 1,217 $ 1,104 $ 784
All-in sustaining costs per ounce (on aco-product basis) 8,9 $ 598 $ 706 $ 517 $ 911 $ 793 $ 945 $ 1,575 $ 1,227 $ 1,114 $ 789 All-in costs per ounce 8 $ 665 $ 604 $ 501 $ 890 $ 793 $ 992 $ 1,606 $ 1,240 $ 1,104 $ 784
All-in costs per ounce (on a co-product basis) 8,9 $ 666 $ 706 $ 548 $ 911 $ 793 $ 998 $ 1,611 $ 1,250 $ 1,114 $ 789 BARRICK THIRD QUARTER 2017 54 MANAGEMENT’S DISCUSSION AND ANALYSIS

($ millions, except per ounceinformation in dollars) For the three months ended September 30, 2016
Footnote Barrick Nevada
Pueblo Viejo
Lagunas Norte Veladero
Turquoise Ridge Acacia Hemlo
Golden Sunlight Porgera Kalgoorlie
Cost of sales applicable togold production $ 469 $ 160 $ 71 $ 86 $ 45 $ 175 $ 50 $ 13 $ 49 $ 69
Depreciation (196) (46) (22) (24) (8) (43) (7) (1) (8) (14)
By-product credits 1 — (36) (4) (6) — (9) — — (1) (1)
Non-recurring items 2 — 34 — — — — — — — —
Other 3 — — — — — 2 —
Non-controlling interests — (47) — — — (45) — — — — Cash costs $ 273 $ 65 $ 45 $ 56 $ 37 $ 80 $ 43 $ 12 $ 40 $ 54
General & administrativecosts — — — — — 26 — — — —
Minesite exploration andevaluation costs 4 — — 1 — — — — — — 1
Minesite sustaining capitalexpenditures 5 62 22 10 5 9 53 8 — 11 8
Rehabilitation - accretionand amortization(operating sites) 6 8 3 2 1 1 1 — — (1) 1
Non-controlling interests — (10) — — — (28) — — — — All-in sustaining costs $ 343 $ 80 $ 58 $ 62 $ 47 $ 132 $ 51 $ 12 $ 50 $ 64
Project exploration andevaluation and projectcosts 4 7 — — — — — — — — —
Project capitalexpenditures 5 26 — 4 — — — — — — —
Non-controlling interests (4) — — — — — — — — — All-in costs $ 372 $ 80 $ 62 $ 62 $ 47 $ 132 $ 51 $ 12 $ 50 $ 64 Ounces sold - equity basis(000s ounces) 560 190 109 95 80 132 61 9 59 92 Cost of sales per ounce 7,8 $ 838 $ 514 $ 658 $ 912 $ 558 $ 840 $ 825 $ 1,464 $ 831 $ 736 Cash costs per ounce 8 $ 486 $ 345 $ 410 $ 586 $ 460 $ 598 $ 706 $ 1,364 $ 682 $ 591
Cash costs per ounce (on aco-product basis) 8,9 $ 487 $ 481 $ 449 $ 660 $ 460 $ 632 $ 711 $ 1,375 $ 692 $ 584 All-in sustaining costs perounce 8 $ 611 $ 425 $ 530 $ 651 $ 583 $ 998 $ 845 $ 1,476 $ 856 $ 704
All-in sustaining costs perounce (on a co-productbasis) 8,9 $ 612 $ 561 $ 569 $ 725 $ 583 $ 1,032 $ 850 $ 1,487 $ 866 $ 697 All-in costs per ounce 8 $ 664 $ 425 $ 564 $ 651 $ 583 $ 1,000 $ 845 $ 1,476 $ 856 $ 704
All-in costs per ounce (on aco-product basis) 8,9 $ 665 $ 561 $ 603 $ 725 $ 583 $ 1,034 $ 850 $ 1,487 $ 866 $ 697 BARRICK THIRD QUARTER 2017 55 MANAGEMENT’S DISCUSSION AND ANALYSIS

($ millions, except per ounce information in dollars) For the nine months ended September 30, 2017
Footnote Barrick Nevada
Pueblo Viejo
LagunasNorte Veladero
TurquoiseRidge Acacia Hemlo
Golden Sunlight Porgera Kalgoorlie
Cost of sales applicable to goldproduction $ 1,441 $ 489 $ 170 $ 302 $ 104 $ 355 $ 140 $ 41 $ 170 $ 213
Depreciation (638) (122) (50) (86) (18) (82) (19) (3) (27) (42)
By-product credits 1 (2) (58) (12) (12) — (7) (1) — (2) (2)
Non-recurring items 2 — — — — — — — — — —
Other 3 — — — — — — — — — —
Non-controlling interests — (122) — — — (96) — — — — Cash costs $ 801 $ 187 $ 108 $ 204 $ 86 $ 170 $ 120 $ 38 $ 141 $ 169
General & administrative costs — — — — — 12 — — — —
Minesite exploration and evaluationcosts 4 12 — 4 3 — — — — — 6
Minesite sustaining capitalexpenditures 5 266 84 12 134 24 119 34 — 39 12
Rehabilitation - accretion andamortization (operating sites) 6 21 10 6 2 1 5 4 2 (1) 3
Non-controlling interests (3) (38) — — — (49) — — — — All-in sustaining costs $ 1,097 $ 243 $ 130 $ 343 $ 111 $ 257 $ 158 $ 40 $ 179 $ 190
Project exploration and evaluationand project costs 4 4 — — — — — — — — —
Project capital expenditures 5 161 — 5 — — 8 5 1 — —
Non-controlling interests — — — — — (3) — — — — All-in costs $ 1,262 $ 243 $ 135 $ 343 $ 111 $ 262 $ 163 $ 41 $ 179 $ 190 Ounces sold - equity basis (000sounces) 1,818 455 283 344 141 284 132 30 173 269 Cost of sales per ounce 7,8 $ 791 $ 661 $ 601 $ 878 $ 740 $ 796 $ 1,061 $ 1,380 $ 982 $ 791 Cash costs per ounce 8 $ 440 $ 412 $ 382 $ 595 $ 612 $ 588 $ 915 $ 1,284 $ 816 $ 630
Cash costs per ounce (on aco-product basis) 8,9 $ 441 $ 490 $ 425 $ 632 $ 612 $ 601 $ 920 $ 1,290 $ 826 $ 636 All-in sustaining costs per ounce 8 $ 603 $ 536 $ 457 $ 1,000 $ 788 $ 907 $ 1,202 $ 1,355 $ 1,038 $ 705
All-in sustaining costs per ounce (ona co-product basis) 8,9 $ 604 $ 614 $ 500 $ 1,037 $ 788 $ 920 $ 1,207 $ 1,361 $ 1,048 $ 711 All-in costs per ounce 8 $ 694 $ 536 $ 474 $ 1,000 $ 788 $ 925 $ 1,236 $ 1,382 $ 1,038 $ 705
All-in costs per ounce (on aco-product basis) 8,9 $ 695 $ 614 $ 517 $ 1,037 $ 788 $ 938 $ 1,241 $ 1,388 $ 1,048 $ 711 BARRICK THIRD QUARTER 2017 56 MANAGEMENT’S DISCUSSION AND ANALYSIS

($ millions, except per ounceinformation in dollars) For the nine months ended September 30, 2016
Footnote Barrick Nevada
Pueblo Viejo
Lagunas Norte Veladero
TurquoiseRidge Acacia Hemlo
Golden Sunlight Porgera Kalgoorlie
Cost of sales applicable to goldproduction $ 1,392 $ 500 $ 216 $ 291 $ 114 $ 524 $ 135 $ 37 $ 149 $ 213
Depreciation (583) (126) (77) (76) (19) (122) (19) (3) (25) (41)
By-product credits 1 (1) (73) (13) (20) — (29) (1) — (2) (2)
Non-recurring items 2 — 34 — (10) — — — — — —
Other 3 — 4 — — — 7 5
Non-controlling interests — (131) — — — (136) — — — — Cash costs $ 808 $ 208 $ 126 $ 185 $ 95 $ 244 $ 115 $ 34 $ 122 $ 175
General & administrative costs — — — — — 56 — — — —
Minesite exploration andevaluation costs 4 2 — 2 — — 2 — — — 3
Minesite sustaining capitalexpenditures 5 143 69 48 46 23 134 23 1 30 15
Rehabilitation - accretion andamortization (operating sites) 6 17 8 6 3 1 4 1 2 (2) 3
Non-controlling interests — (31) — — — (67) — — — — All-in sustaining costs $ 970 $ 254 $ 182 $ 234 $ 119 $ 373 $ 139 $ 37 $ 150 $ 196
Project exploration and evaluationand project costs 4 13 — — — — — — — — —
Project capital expenditures 5 107 — 4 — — 1 — — — —
Non-controlling interests (30) — — — — — — — — — All-in costs $ 1,060 $ 254 $ 186 $ 234 $ 119 $ 374 $ 139 $ 37 $ 150 $ 196 Ounces sold - equity basis (000sounces) 1,580 502 327 338 188 388 163 23 184 281 Cost of sales per ounce 7,8 $ 881 $ 609 $ 662 $ 860 $ 605 $ 861 $ 826 $ 1,649 $ 812 $ 758 Cash costs per ounce 8 $ 511 $ 416 $ 385 $ 547 $ 504 $ 626 $ 704 $ 1,494 $ 664 $ 623
Cash costs per ounce (on a co-product basis) 8,9 $ 512 $ 507 $ 425 $ 608 $ 504 $ 663 $ 709 $ 1,506 $ 672 $ 631 All-in sustaining costs per ounce 8 $ 613 $ 509 $ 557 $ 693 $ 631 $ 961 $ 847 $ 1,630 $ 817 $ 698
All-in sustaining costs per ounce (ona co-product basis) 8,9 $ 614 $ 600 $ 597 $ 754 $ 631 $ 998 $ 852 $ 1,642 $ 825 $ 706 All-in costs per ounce 8 $ 670 $ 509 $ 568 $ 693 $ 631 $ 963 $ 847 $ 1,630 $ 817 $ 698
All-in costs per ounce (on a co-product basis) 8,9 $ 671 $ 600 $ 608 $ 754 $ 631 $ 1,000 $ 852 $ 1,642 $ 825 $ 706 1 By-product credits Revenues include the sale of by-products for our gold mines and energy sales from the Monte Rio power plant at our Pueblo Viejo Mine for the three and nine months ended
September 30, 2017, of $nil and $nil, respectively, (2016: $9 million and $33 million, respectively) up until its disposition on August 18, 2016. 2 Non-recurring items Non-recurring items in 2016 consist of $34 million in a reduction in cost of sales attributed to insurance proceeds recorded in the third quarter of 2016 related to the 2015 oxygen plant
motor failure at Pueblo Viejo and $10 million in abnormal costs at Veladero. These costs are not indicative of our cost of production and have been excluded from the calculation ofcash costs.
3 Other Other adjustments for the three and nine months ended September 30, 2017 include adding the net margins related to power sales at Pueblo Viejo of $nil and $nil, respectively,
(2016: $1 million and $5 million, respectively) and adding the cost of treatment and refining charges of $nil and $nil, respectively (2016: $2 million and $7 million, respectively). 4 Exploration and evaluation costs Exploration, evaluation and project expenses are presented as minesite sustaining if it supports current mine operations and project if it relates to future projects. Refer to page 30 of
this MD&A. 5 Capital expenditures Capital expenditures are related to our gold sites only and are presented on a 100% accrued basis. They are split between minesite sustaining and project capital expenditures.
Project capital expenditures are distinct projects designed to increase the net present value of the mine and are not related to current production. Significant projects in the currentyear are stripping at Cortez Crossroads, underground development at Cortez Hills Lower Zone and the range front declines, Lagunas Norte Refractory Ore Project and Goldrush.Refer to page 29 of this MD&A.
BARRICK THIRD QUARTER 2017 57 MANAGEMENT’S DISCUSSION AND ANALYSIS

6 Rehabilitation - accretion and amortizationIncludes depreciation on the assets related to rehabilitation provisions of our gold operations and accretion on the rehabilitation provision of our gold operations, split betweenoperating and non-operating sites.
7 Cost of sales per ounce
Cost of sales applicable to gold per ounce is calculated using cost of sales on an attributable basis (removing the non-controlling interest of 40% Pueblo Viejo and 36.1% Acacia fromcost of sales), divided by attributable gold ounces.
8 Per ounce figures
Cost of sales per ounce, cash costs per ounce, all-in sustaining costs per ounce and all-in costs per ounce may not calculate based on amounts presented in this table due torounding.
9 Co-product costs per ounce
Cash costs per ounce, all-in sustaining costs per ounce and all-in costs per ounce presented on a co-product basis removes the impact of by-product credits of our gold production(net of non-controlling interest) calculated as:
($ millions) For the three months ended September 30, 2017
Barrick Nevada
Pueblo Viejo
LagunasNorte Veladero
TurquoiseRidge Acacia Hemlo
Golden Sunlight Porgera Kalgoorlie
By-product credits $ — $ 21 $ 5 $ 1 — $ 1 $ — $ — $ 1 $ —
Non-controlling interest — (7) — — — — — — — — By-product credits (net of non-controlling interest) $ — $ 14 $ 5 $ 1 — $ 1 $ — $ — $ 1 $ — For the three months ended September 30, 2016
Barrick Nevada
Pueblo Viejo
Lagunas Norte Veladero
Turquoise Ridge Acacia Hemlo
Golden Sunlight Porgera Kalgoorlie
By-product credits $ — $ 36 $ 4 $ 6 — $ 9 $ — $ — $ 1 $ 1
Non-controlling interest — (11) — — — (3) — — — — By-product credits (net of non-controlling interest) $ — $ 25 $ 4 $ 6 $ — $ 6 $ — $ — $ 1 $ 1 For the nine months ended September 30, 2017
Barrick Nevada
Pueblo Viejo
LagunasNorte Veladero
TurquoiseRidge Acacia Hemlo
Golden Sunlight Porgera Kalgoorlie
By-product credits $ 2 $ 58 $ 12 $ 12 — $ 7 $ 1 $ — $ 2 $ 2
Non-controlling interest — (22) — — — (2) — — — — By-product credits (net of non-controlling interest) $ 2 $ 36 $ 12 $ 12 — $ 5 $ 1 $ — $ 2 $ 2 For the nine months ended September 30, 2016
Barrick Nevada
Pueblo Viejo
Lagunas Norte Veladero
Turquoise Ridge Acacia Hemlo
Golden Sunlight Porgera Kalgoorlie
By-product credits $ 1 $ 73 $ 13 $ 20 — $ 29 $ 1 $ — $ 2 $ 2
Non-controlling interest — (29) — — — (11) — — — — By-product credits (net of non-controlling interest) $ 1 $ 44 $ 13 $ 20 — $ 18 $ 1 $ — $ 2 $ 2 BARRICK THIRD QUARTER 2017 58 MANAGEMENT’S DISCUSSION AND ANALYSIS

Reconciliation of Copper Cost of Sales to C1 cash costs and All-in sustaining costs, including on a per pound basis
($ millions, except per pound information in dollars) For the three months ended
September 30 For the nine months ended
September 30 2017 2016 2017 2016 Cost of sales $ 108 $ 66 $ 292 $ 235
Depreciation/amortization (26) (10) (59) (30)
Treatment and refinement charges 44 40 116 124
Cash cost of sales applicable to equity method investments 53 64 170 150
Less: royalties (12) (7) (27) (32)
By-product credits (1) — (4) — C1 cash cost of sales $ 166 $ 153 $ 488 $ 447
General & administrative costs 3 — 9 11
Rehabilitation - accretion and amortization 4 1 9 5
Royalties 12 7 27 32
Minesite exploration and evaluation costs 4 — 5 —
Minesite sustaining capital expenditures 50 44 137 121 All-in sustaining costs $ 239 $ 205 $ 675 $ 616 Pounds sold - consolidated basis (millions pounds) 107 102 298 298 Cost of sales per pound 1,2 $ 1.67 $ 1.43 $ 1.72 $ 1.41 C1 cash cost per pound 1 $ 1.56 $ 1.50 $ 1.64 $ 1.50 All-in sustaining costs per pound 1 $ 2.24 $ 2.02 $ 2.27 $ 2.08 1 Cost of sales per pound, C1 cash costs per pound and all-in sustaining costs per pound may not calculate based on amounts presented in this table due to rounding.2 Cost of sales applicable to copper per pound is calculated using cost of sales including our proportionate share of cost of sales attributable to equity method investments (Zaldívar and Jabal
Sayid), divided by consolidated copper pounds (including our proportionate share of copper pounds from our equity method investments). BARRICK THIRD QUARTER 2017 59 MANAGEMENT’S DISCUSSION AND ANALYSIS

Reconciliation of Copper Cost of Sales to C1 cash costs and All-in sustaining costs, including on a per pound basis, by operating site
($ millions, except per pound information in dollars) For the three months ended September 30 2017 2016 Zaldívar Lumwana Jabal Sayid Zaldívar Lumwana Jabal Sayid Cost of sales $ 56 $ 108 $ 14 $ 58 $ 66 $ 22
Depreciation/amortization (13) (26) (3) (12) (10) (3)
Treatment and refinement charges — 40 3 (1) 36 4
Less: royalties — (11) — — (7) —
By-product credits — — (1) — — — C1 cash cost of sales $ 43 $ 111 $ 13 $ 45 $ 85 $ 23
Rehabilitation - accretion and amortization — 4 — — 1 —
Royalties — 11 — — 7 —
Minesite exploration and evaluation costs 3 1 — — — —
Minesite sustaining capital expenditures 18 28 5 11 29 5 All-in sustaining costs $ 64 $ 155 $ 18 $ 56 $ 122 $ 28 Pounds sold - consolidated basis (millions pounds) 28 70 9 27 64 11 Cost of sales per pound 1,2 $ 2.04 $ 1.54 $ 1.62 $ 2.15 $ 1.03 $ 2.03 C1 cash cost per pound 1 $ 1.57 $ 1.57 $ 1.45 $ 1.72 $ 1.32 $ 2.06 All-in sustaining costs per pound 1 $ 2.30 $ 2.20 $ 1.98 $ 2.12 $ 1.92 $ 2.49 ($ millions, except per pound information in dollars) For the nine months ended September 30 2017 2016 Zaldívar Lumwana Jabal Sayid Zaldívar Lumwana Jabal Sayid Cost of sales $ 170 $ 292 $ 52 $ 162 $ 235 $ 22
Depreciation/amortization (39) (59) (12) (31) (30) (3)
Treatment and refinement charges — 107 10 — 120 4
Less: royalties — (27) — — (32) —
By-product credits — — (5) — — — C1 cash cost of sales $ 131 $ 313 $ 45 $ 131 $ 293 $ 23
Rehabilitation - accretion and amortization — 9 — — 4 —
Royalties — 27 — — 32 —
Minesite exploration and evaluation costs 3 2 — — — —
Minesite sustaining capital expenditures 37 80 20 40 69 11 All-in sustaining costs $ 171 $ 431 $ 65 $ 171 $ 398 $ 34 Pounds sold - consolidated basis (millions pounds) 81 188 29 83 204 11 Cost of sales per pound 1,2 $ 2.09 $ 1.56 $ 1.81 $ 1.95 $ 1.15 $ 2.03 C1 cash cost per pound 1 $ 1.61 $ 1.67 $ 1.57 $ 1.58 $ 1.43 $ 2.06 All-in sustaining costs per pound 1 $ 2.12 $ 2.30 $ 2.26 $ 2.07 $ 1.94 $ 3.12 1 Cost of sales per pound, C1 cash costs per pound and all-in sustaining costs per pound may not calculate based on amounts presented in this table due to rounding.2 Cost of sales applicable to copper per pound is calculated using cost of sales including our proportionate share of cost of sales attributable to equity method investments (Zaldívar and Jabal
Sayid), divided by consolidated copper pounds (including our proportionate share of copper pounds from our equity method investments). BARRICK THIRD QUARTER 2017 60 MANAGEMENT’S DISCUSSION AND ANALYSIS

EBITDA and Adjusted EBITDA
Reconciliation of Net Earnings to EBITDA and Adjusted EBITDA ($ millions) For the three months ended September 30 For the nine months ended September 30 2017 2016 2017 2016 Net earnings (loss) $ (43) $ 245 $ 1,983 $ 349
Income tax expense 314 335 1,180 694
Finance costs, net 1 223 178 509 525
Depreciation 390 389 1,213 1,156 EBITDA $ 884 $ 1,147 $ 4,885 $ 2,724
Impairment charges (reversals) related to intangibles, goodwill, property, plant andequipment, and investments 2 2 49 (1,128) 54
Acquisition/disposition (gains)/losses 3 (5) 37 (882) 35
Foreign currency translation (gains)/losses 25 19 60 181
Other expense adjustments 2 (29) 3 5
Unrealized gains on non-hedge derivative instruments (9) (12) (6) (23) Adjusted EBITDA $ 899 $ 1,211 $ 2,932 $ 2,976 1 Finance costs exclude accretion.2 Net impairment reversals for the nine month period ended September 30, 2017 primarily relate to impairment reversals at the Cerro Casale project upon reclassification of the project’s net
assets as held-for-sale as at March 31, 2017.3 Disposition gains for the three and nine month periods ended September 30, 2017 primarily relates to the sale of a 50% interest in the Veladero mine and the gain related to the sale of a
25% interest in the Cerro Casale project. BARRICK THIRD QUARTER 2017 61 MANAGEMENT’S DISCUSSION AND ANALYSIS
EBITDA is a non-GAAP financial measure, which excludes the following fromnet earnings:● Income tax expense;● Finance costs;● Finance income; and● Depreciation.
Management believes that EBITDA is a valuable indicator of our ability togenerate liquidity by producing operating cash flow to fund working capitalneeds, service debt obligations, and fund capital expenditures. Managementuses EBITDA for this purpose. EBITDA is also frequently used by investors andanalysts for valuation purposes whereby EBITDA is multiplied by a factor or“EBITDA multiple” that is based on an observed or inferred relationshipbetween EBITDA and market values to determine the approximate totalenterprise value of a company.
Adjusted EBITDA removes the effect of “impairment charges” and, as of oursecond quarter 2017 MD&A, “acquisition/disposition gains/losses”. Thesecharges are not reflective of our ability to generate liquidity by producingoperating cash flow, and therefore this adjustment will result in a moremeaningful valuation measure for investors and analysts to evaluate ourperformance in the period and assess our future ability to generate liquidity.
Starting in the second quarter 2017 MD&A, we began including additionaladjusting items in the Adjusted
EBITDA reconciliation to provide a greater level of consistency with the adjustingitems included in our Adjusted Net Earnings reconciliation. These new itemsinclude: acquisition/disposition gains/losses; foreign currency translationgains/losses; other expense adjustments; and unrealized gains on non-hedgederivative instruments. These amounts are adjusted to remove any impact onfinance costs/income, income tax expense and/or depreciation as they do notaffect EBITDA. The prior periods have been restated to reflect the change inpresentation. We believe this additional information will assist analysts, investorsand other stakeholders of Barrick in better understanding our ability to generateliquidity from operating cash flow, by excluding these amounts from thecalculation as they are not indicative of the performance of our core miningbusiness and not necessarily reflective of the underlying operating results for theperiods presented.
EBITDA and adjusted EBITDA are intended to provide additional information toinvestors and analysts and do not have any standardized definition under IFRS,and should not be considered in isolation or as a substitute for measures ofperformance prepared in accordance with IFRS. EBITDA and adjusted EBITDAexclude the impact of cash costs of financing activities and taxes, and the effectsof changes in operating working capital balances, and therefore are notnecessarily indicative of operating profit or cash flow from operations asdetermined under IFRS. Other companies may calculate EBITDA and adjustedEBITDA differently.
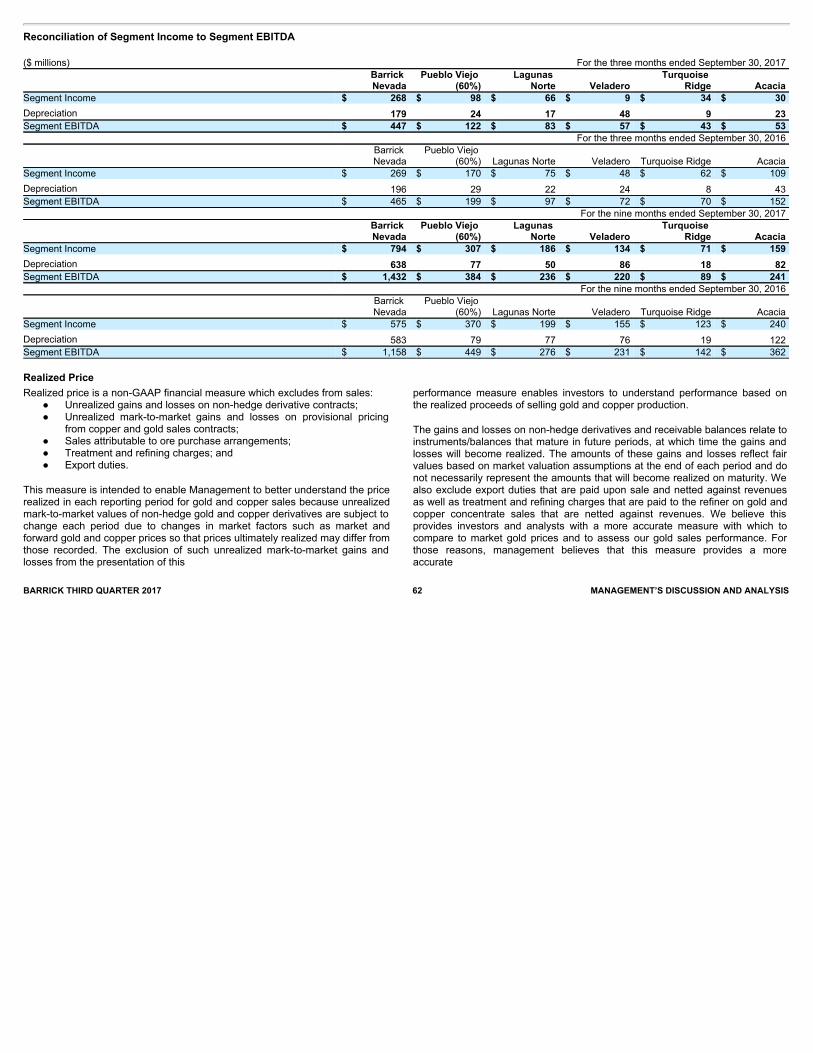
Reconciliation of Segment Income to Segment EBITDA ($ millions) For the three months ended September 30, 2017
Barrick Nevada
Pueblo Viejo (60%)
Lagunas Norte Veladero
Turquoise Ridge Acacia
Segment Income $ 268 $ 98 $ 66 $ 9 $ 34 $ 30
Depreciation 179 24 17 48 9 23 Segment EBITDA $ 447 $ 122 $ 83 $ 57 $ 43 $ 53 For the three months ended September 30, 2016
Barrick Nevada
Pueblo Viejo (60%) Lagunas Norte Veladero Turquoise Ridge Acacia
Segment Income $ 269 $ 170 $ 75 $ 48 $ 62 $ 109
Depreciation 196 29 22 24 8 43 Segment EBITDA $ 465 $ 199 $ 97 $ 72 $ 70 $ 152 For the nine months ended September 30, 2017
Barrick Nevada
Pueblo Viejo (60%)
Lagunas Norte Veladero
Turquoise Ridge Acacia
Segment Income $ 794 $ 307 $ 186 $ 134 $ 71 $ 159
Depreciation 638 77 50 86 18 82 Segment EBITDA $ 1,432 $ 384 $ 236 $ 220 $ 89 $ 241 For the nine months ended September 30, 2016
Barrick Nevada
Pueblo Viejo (60%) Lagunas Norte Veladero Turquoise Ridge Acacia
Segment Income $ 575 $ 370 $ 199 $ 155 $ 123 $ 240
Depreciation 583 79 77 76 19 122 Segment EBITDA $ 1,158 $ 449 $ 276 $ 231 $ 142 $ 362
Realized Price
BARRICK THIRD QUARTER 2017 62 MANAGEMENT’S DISCUSSION AND ANALYSIS
Realized price is a non-GAAP financial measure which excludes from sales: ● Unrealized gains and losses on non-hedge derivative contracts; ● Unrealized mark-to-market gains and losses on provisional pricing
from copper and gold sales contracts; ● Sales attributable to ore purchase arrangements; ● Treatment and refining charges; and ● Export duties.
This measure is intended to enable Management to better understand the pricerealized in each reporting period for gold and copper sales because unrealizedmark-to-market values of non-hedge gold and copper derivatives are subject tochange each period due to changes in market factors such as market andforward gold and copper prices so that prices ultimately realized may differ fromthose recorded. The exclusion of such unrealized mark-to-market gains andlosses from the presentation of this
performance measure enables investors to understand performance based onthe realized proceeds of selling gold and copper production.
The gains and losses on non-hedge derivatives and receivable balances relate toinstruments/balances that mature in future periods, at which time the gains andlosses will become realized. The amounts of these gains and losses reflect fairvalues based on market valuation assumptions at the end of each period and donot necessarily represent the amounts that will become realized on maturity. Wealso exclude export duties that are paid upon sale and netted against revenuesas well as treatment and refining charges that are paid to the refiner on gold andcopper concentrate sales that are netted against revenues. We believe thisprovides investors and analysts with a more accurate measure with which tocompare to market gold prices and to assess our gold sales performance. Forthose reasons, management believes that this measure provides a moreaccurate

Reconciliation of Sales to Realized Price per ounce/pound For the three months ended September 30 For the nine months ended September 30 ($ millions, except per ounce/pound information in dollars) Gold Copper Gold Copper 2017 2016 2017 2016 2017 2016 2017 2016 Sales $ 1,784 $ 2,134 $ 177 $ 104 $ 5,614 $ 5,774 $ 427 $ 322
Sales applicable to non-controlling interests (185) (260) — — (582) (699) — —
Sales applicable to equity method investments 1,2 — — 104 78 — — 293 199
Realized non-hedge gold/copper derivative (losses) gains — (1) — — — (1) — —
Sales applicable to Pierina 3 (36) (28) — — (120) (71) — —
Treatment and refinement charges — 3 44 40 1 12 116 124
Export duties — — — — — 2 — — Revenues – as adjusted $ 1,563 $ 1,848 $ 325 $ 222 $ 4,913 $ 5,017 $ 836 $ 645 Ounces/pounds sold (000s ounces/millions pounds) 3 1,227 1,386 107 102 3,930 3,984 298 298 Realized gold/copper price per ounce/pound 4 $ 1,274 $ 1,333 $ 3.05 $ 2.18 $ 1,250 $ 1,259 $ 2.81 $ 2.17
1 Represents sales of $82 million and $224 million, respectively, for the three and nine months ended September 30, 2017 (2016: $58 million and $180 million, respectively) applicable to our50% equity method investment in Zaldívar and $27 million and $80 million, respectively, (2016: $24 million and $24 million, respectively) applicable to our 50% equity method investment inJabal Sayid.
2 Figures exclude Pierina from the calculation of realized price per ounce as the mine is currently going through closure.3 Sales applicable to equity method investment are net of treatment and refinement charges.4 Realized price per ounce/pound may not calculate based on amounts presented in this table due to rounding. BARRICK THIRD QUARTER 2017 63 MANAGEMENT’S DISCUSSION AND ANALYSIS
reflection of our past performance and is a better indicator of its expectedperformance in future periods.
The realized price measure is intended to provide additional information, anddoes not have any standardized definition under IFRS and should not beconsidered in isolation or as a substitute for measures of
performance prepared in accordance with IFRS. The measure is not necessarilyindicative of sales as determined under IFRS. Other companies may calculatethis measure differently. The following table reconciles realized prices to themost directly comparable IFRS measure.

TECHNICAL INFORMATIONThe scientific and technical information contained in this MD&A has been reviewed and approved by Steven Haggarty, P. Eng., Senior Director, Metallurgy of Barrickwho is a “Qualified Person” as defined in National Instrument 43-101 – Standards of Disclosure for Mineral Projects .
ENDNOTES 1 These are non-GAAP financial performance measures with no standardized meaning under IFRS and therefore may not be comparable to similar measures
presented by other issuers. For further information and a detailed reconciliation of each non-GAAP measure to the most directly comparable IFRS measure,please see pages 49 to 63 of this MD&A.
2 Amount excludes capital leases and includes Acacia (100% basis). 3 Includes $105 million of cash, primarily held at Acacia, which may not be readily deployed. 4 Cost of sales applicable to gold per ounce is calculated using cost of sales applicable to gold on an attributable basis (removing the non-controlling interest of
40% Pueblo Viejo and 36.1% Acacia from cost of sales), divided by attributable gold ounces. Cost of sales applicable to copper per pound is calculated usingcost of sales applicable to copper including our proportionate share of cost of sales attributable to equity method investments (Zaldívar and Jabal Sayid), dividedby consolidated copper pounds (including our proportionate share of copper pounds from our equity method investments).
BARRICK THIRD QUARTER 2017 64 MANAGEMENT’S DISCUSSION AND ANALYSIS

Consolidated Statements of Income Barrick Gold Corporation (in millions of United States dollars, except per share data) (Unaudited)
Three months ended September 30,
Nine months ended September 30,
2017 2016 2017 2016 Revenue (notes 5 and 6) $1,993 $ 2,297 $6,146 $6,239 Costs and expenses (income) Cost of sales (notes 5 and 7) 1,270 1,291 3,889 3,951 General and administrative expenses 69 71 186 217 Exploration, evaluation and project expenses 100 44 256 155 Impairment (reversals) charges (note 9B and 13) 2 49 (1,128) 54 Loss on currency translation (note 9C) 25 19 60 181 Closed mine rehabilitation 14 16 19 46 (Income) loss from equity investees (note 12) (25) 3 (50) (5) Gain on non-hedge derivatives (8) (4) (10) (7) Other expense (income) (note 9A) 37 39 (800) 42 Income before finance costs and income taxes $509 $769 $3,724 $1,605 Finance costs, net (238) (189) (561) (562) Income before income taxes $271 $580 $3,163 $1,043 Income tax expense (note 10) (314) (335) (1,180) (694) Net income (loss) ($43) $245 $1,983 $349 Attributable to: Equity holders of Barrick Gold Corporation ($11) $175 $1,752 $230 Non-controlling interests (note 17) ($32) $70 $231 $119
Earnings per share attributable to the equity holders of Barrick Gold Corporation (note 8) Net income (loss)
Basic ($0.01) $0.15 $1.50 $0.20 Diluted ($0.01) $0.15 $1.50 $0.20
The accompanying notes are an integral part of these condensed interim consolidated financial statements. BARRICK THIRD QUARTER 2017 65 FINANCIAL STATEMENTS (UNAUDITED)

Consolidated Statements of Comprehensive Income Barrick Gold Corporation (in millions of United States dollars) (Unaudited)
Three months ended September 30,
Nine months ended September 30,
2017 2016 2017 2016 Net income (loss) ($43) $245 $1,983 $349 Other comprehensive income (loss), net of taxes Movement in equity investments fair value reserve: Net unrealized change on equity investments, net of tax $nil, $nil, $nil and $nil 5 5 9 16 Items that may be reclassified subsequently to profit or loss: Unrealized gains (losses) on derivatives designated as cash flow hedges, net of tax ($1), $1, $2 and ($6) 8 (4) (12) 8 Realized losses on derivatives designated as cash flow hedges, net of tax ($4), ($2), ($6) and ($6) 4 15 12 51 Currency translation adjustments, net of tax $nil, $nil, $nil and $nil (3) 6 12 99 Total other comprehensive income 14 22 21 174 Total comprehensive income (loss) ($29) $267 $2,004 $523 Attributable to: Equity holders of Barrick Gold Corporation $3 $197 $1,773 $404 Non-controlling interests ($32) $70 $231 $119 The accompanying notes are an integral part of these condensed interim consolidated financial statements. BARRICK THIRD QUARTER 2017 66 FINANCIAL STATEMENTS (UNAUDITED)

Consolidated Statements of Cash Flow Barrick Gold Corporation (in millions of United States dollars) (Unaudited)
Three months ended September 30,
Nine months ended September 30,
2017 2016 2017 2016 OPERATING ACTIVITIES Net income ($43) $245 $1,983 $349 Adjustments for the following items:
Depreciation 390 389 1,213 1,156 Finance costs 243 192 574 572 Impairment (reversals) charges (note 13) 2 49 (1,128) 54 Income tax expense (note 10) 314 335 1,180 694 (Gain) loss on sale of long-lived assets (5) 37 (882) 35 Currency translation losses 25 19 60 181
Change in working capital (note 11) (96) (105) (474) (362) Other operating activities (note 11) (144) (109) (249) (135) Operating cash flows before interest and income taxes 686 1,052 2,277 2,544 Interest paid (47) (45) (270) (313) Income taxes paid (107) (56) (532) (302) Net cash provided by operating activities 532 951 1,475 1,929 INVESTING ACTIVITIES Property, plant and equipment
Capital expenditures (note 5) (307) (277) (1,046) (800) Sales proceeds 1 86 13 96
Divestitures (note 4) — — 960 588 Funding of equity method investments — (2) (8) (8) Net cash used in investing activities (306) (193) (81) (124) FINANCING ACTIVITIES Debt
Proceeds — — — 3 Repayments (1,023) (465) (1,508) (1,445)
Dividends (31) (21) (94) (64) Funding from non-controlling interests 3 28 11 55 Disbursements to non-controlling interests — (64) (67) (95) Debt extinguishment costs (76) (30) (102) (70) Net cash used in financing activities (1,127) (552) (1,760) (1,616) Effect of exchange rate changes on cash and equivalents — 1 2 4 Net increase (decrease) in cash and equivalents (901) 207 (364) 193 Cash and equivalents at the beginning of period 2,926 2,441 2,389 2,455 Cash and equivalents at the end of period $2,025 $2,648 $2,025 $2,648 The accompanying notes are an integral part of these condensed interim consolidated financial statements. BARRICK THIRD QUARTER 2017 67 FINANCIAL STATEMENTS (UNAUDITED)

Consolidated Balance Sheets Barrick Gold Corporation(in millions of United States dollars) (Unaudited)
As at September 30, As at December 31,
2017 2016 ASSETS Current assets
Cash and equivalents (note 14A) $2,025 $2,389 Accounts receivable 224 249 Inventories 2,038 1,930 Other current assets 455 306
Total current assets $4,742 $4,874 Non-current assets
Equity in investees (note 12) 1,243 1,185 Property, plant and equipment 13,961 14,103 Goodwill 1,286 1,371 Intangible assets 270 272 Deferred income tax assets 863 977 Non-current portion of inventory 1,563 1,536 Other assets 1,144 946
Total assets $25,072 $25,264 LIABILITIES AND EQUITY Current liabilities
Accounts payable $1,118 $1,084 Debt (note 14B) 63 143 Current income tax liabilities 266 283 Other current liabilities 291 309
Total current liabilities $1,738 $1,819 Non-current liabilities
Debt (note 14B) 6,384 7,788 Provisions 2,409 2,363 Deferred income tax liabilities 1,447 1,520 Other liabilities 1,472 1,461
Total liabilities $13,450 $14,951 Equity
Capital stock (note 16) $20,889 $20,877 Deficit (11,428) (13,074)Accumulated other comprehensive loss (168) (189)Other 321 321
Total equity attributable to Barrick Gold Corporation shareholders $9,614 $7,935 Non-controlling interests (note 17) 2,008 2,378
Total equity $11,622 $10,313 Contingencies and commitments (notes 5 and 18) Total liabilities and equity $25,072 $25,264 The accompanying notes are an integral part of these condensed interim consolidated financial statements. BARRICK THIRD QUARTER 2017 68 FINANCIAL STATEMENTS (UNAUDITED)

Consolidated Statements of Changes in Equity Barrick Gold Corporation Attributable to equity holders of the company
(in millions of United States dollars) (Unaudited)
Common Shares(in thousands)
Capital stock
Retained deficit
Accumulated other
comprehensiveincome (loss) 1
Other2
Total equity attributable toshareholders
Non- controlling
interests Total equity
At January 1, 2017 1,165,574 $20,877 ($13,074) ($189) $321 $7,935 $2,378 $10,313 Net income — — 1,752 — — 1,752 231 1,983 Total other comprehensive income — — — 21 — 21 — 21 Total comprehensive income — — 1,752 21 — 1,773 231 2,004 Transactions with owners
Dividends — — (94) — — (94) — (94) Decrease in non- controlling interest (note 4B) — — — — — — (493) (493) Funding from non- controlling interests — — — — — — 11 11 Other decrease in non- controlling interest — — — — — — (119) (119) Dividend reinvestment plan (note 16) 689 12 (12) — — — — —
Total transactions with owners 689 12 (106) — — (94) (601) (695) At September 30, 2017 1,166,263 $20,889 ($11,428) ($168) $321 $9,614 $2,008 $11,622 At January 1, 2016 1,165,081 $20,869 ($13,642) ($370) $321 $7,178 $2,277 $9,455
Net income — — 230 — — 230 119 349 Total other comprehensive income — — — 174 — 174 — 174 Total comprehensive income — — 230 174 — 404 119 523 Transactions with owners
Dividends — — (64) — — (64) — (64) Funding from non-controlling interests — — — — — — 55 55 Other decrease in non-controlling interests — — — — — — (127) (127) Dividend reinvestment plan 350 6 (6) — — — — —
Total transactions with owners 350 6 (70) — — (64) (72) (136) At September 30, 2016 1,165,431 $20,875 ($13,482) ($196) $321 $7,518 $2,324 $9,842 1 Includes cumulative translation losses at September 30, 2017: $70 million (September 30, 2016: $78 million).2 Includes additional paid-in capital as at September 30, 2017: $283 million (December 31, 2016: $283 million; September 30, 2016: $283 million) and convertible borrowings - equity component as
at September 30, 2017: $38 million (December 31, 2016: $38 million; September 30, 2016: $38 million).The accompanying notes are an integral part of these condensed interim consolidated financial statements. BARRICK THIRD QUARTER 2017 69 FINANCIAL STATEMENTS (UNAUDITED)

BARRICK THIRD QUARTER 2017 70 FINANCIAL STATEMENTS (UNAUDITED)
NOTES TO CONSOLIDATED FINANCIALSTATEMENTS
Barrick Gold Corporation. Tabular dollar amounts in millions of United Statesdollars, unless otherwise shown.
1 > CORPORATE INFORMATIONBarrick Gold Corporation (“Barrick”, “we” or the “Company”) is a corporationgoverned by the Business Corporations Act (Ontario). The Company’s headand registered office is located at Brookfield Place, TD Canada Trust Tower,161 Bay Street, Suite 3700, Toronto, Ontario, M5J 2S1. We are principallyengaged in the production and sale of gold and copper, as well as relatedactivities such as exploration and mine development. Our producing gold minesare located in Canada, the United States, Peru and the Dominican Republicand our producing copper mine is in Zambia. Following the sale of 50% of ourVeladero gold mine located in Argentina (noted in note 4A), we hold a 50%interest. We hold a 50% interest in KCGM, a gold mine located in Australia andhold a 50% equity interest in Barrick Niugini Limited (“BNL”), which owns a 95%interest in Porgera, a gold mine located in Papua New Guinea. We also hold a63.9% equity interest in Acacia Mining plc (“Acacia”), a company listed on theLondon Stock Exchange that owns gold mines and exploration properties inAfrica. We have a 50% interest in Zaldívar, a copper mine located in Chile anda 50% interest in Jabal Sayid, a copper mine located in Saudi Arabia. We alsohave various gold projects located in South America and North America. Wesell our gold and copper production into the world market.
2 > SIGNIFICANT ACCOUNTING POLICIESA) Statement of ComplianceThese condensed interim consolidated financial statements have beenprepared in accordance with International Accounting Standard 34 InterimFinancial Reporting (“IAS 34”) as issued by the International AccountingStandards Board (“IASB”). These interim financial statements should be read inconjunction with Barrick’s most recently issued Annual Report which includesinformation necessary or useful to understanding the Company’s business andfinancial statement presentation. In particular, the Company’s significantaccounting policies were presented in Note 2 of the consolidated financialstatements for the year ended December 31, 2016, and have been consistentlyapplied in the preparation of these interim financial statements. Thesecondensed interim consolidated financial statements were authorized forissuance by the Board of Directors on October 25, 2017.
B) New Accounting Standards Issued But Not Yet Effective
IFRS 15 RevenueIn May 2014, the IASB issued IFRS 15 Revenue from Contracts with Customers,which covers principles that an entity shall apply to report useful information tousers of financial statements about the nature, amount, timing, and uncertainty ofrevenue and cash flows arising from a contract with a customer. In September2015, the IASB deferred the effective date of the standard to annual reportingperiods beginning on or after January 1, 2018, with earlier application permitted.We will not be early adopting IFRS 15. In 2017 we have advanced ourassessment of the impact on our consolidated financial statements. Our currentassessment is as follows:• Bullion (gold and silver) sales – we do not expect these sales to be affected
by IFRS 15• Concentrate (gold and copper) and cathode (copper) sales – we do not
expect the recognition of these sales to be significantly affected by IFRS 15,but anticipate requiring separate presentation of the provisional pricingadjustments within our revenue note disclosure
• We expect to use the modified retrospective approach of adoption
The application of IFRS 15 may further result in the identification of separateperformance obligations in relation to shipping of concentrate sales which wouldaffect the timing of revenue recognition going forward. We are also evaluatingthe impact of IFRS 15 on our recognition of streaming revenue. We will finalizeour assessment and implementation of the new revenue recognition policy andany related impact on our internal controls in the remainder of 2017 and willprovide further updates in our year-end financial statements.
IFRS 16 LeasesIn January 2016, the IASB issued IFRS 16 Leases, which requires lessees torecognize assets and liabilities for most leases. Application of the standard ismandatory for annual reporting periods beginning on or after January 1, 2019,with earlier application permitted, provided the new revenue standard, IFRS 15Revenue from Contracts with Customers, has been applied or is applied at thesame date as IFRS 16. We are currently assessing the impact on ourconsolidated financial statements along with timing of our adoption of IFRS 16.We expect that IFRS 16 will result in an increase in assets and liabilities as fewerleases will be expensed as payments are made. We expect an increase indepreciation and accretion expenses and also an increase in cash flow fromoperating activities as these lease payments will be recorded as financingoutflows in our cash flow statement. At this time we have not fully assessed theimpact of adopting IFRS 16 but we plan to develop a full implementation plan inthe remainder of 2017 and will provide updates to our assessment in ouryear-end financial statements.

BARRICK THIRD QUARTER 2017 71 FINANCIAL STATEMENTS (UNAUDITED)
3 > SIGNIFICANT JUDGMENTS, ESTIMATES, ASSUMPTIONS AND RISKSThe judgments, estimates, assumptions and risks discussed here reflectupdates from the most recently filed Annual Consolidated Financial Statementsfor the year ended December 31, 2016. For judgments, estimates, assumptionsand risks related to other areas not discussed in these interim consolidatedfinancial statements, please refer to Notes 3 and 28 of the 2016 AnnualConsolidated Financial Statements.
A) Provision for Environmental Rehabilitation (“PER”)Provisions are updated each reporting period for changes to expected cashflows and for the effect of changes in the discount rate and foreign exchangerate, and the change in estimate is added or deducted from the related assetand depreciated over the expected economic life of the operation to which itrelates. We recorded an increase of $23 million (2016: $40 million increase) tothe PER at our minesites for the three months ended September 30, 2017 andan increase of $16 million (2016: $230 million increase) for the nine monthsended September 30, 2017.
Adjustments to the estimated amount and timing of future closure andrehabilitation cash flows are a normal occurrence in light of the significantjudgments and estimates involved. Rehabilitation provisions are adjusted as aresult of changes in estimates and assumptions and are accounted forprospectively. In the fourth quarter of each year, our life of mine plans areupdated and that typically results in an update to the rehabilitation provision.
B) Pascua-LamaThe Pascua-Lama project received $463 million as at September 30, 2017($429 million as at December 31, 2016) in value added tax (“VAT”) refunds inChile relating to the development of the Chilean side of the project. Under thecurrent arrangement this amount plus interest of $287 million (December 31,2016: $236 million) must be repaid if the project does not evidence exports foran amount of $3,538 million within a term that expires on December 31, 2026.We have recorded $234 million in VAT recoverable in Argentina as ofSeptember 30, 2017 ($255 million, December 31, 2016) relating to thedevelopment of the Argentine side of the project. These amounts may not berecoverable if the project does not enter into production and are subject todevaluation risk as the amounts are recoverable in Argentinean pesos.
C) ContingenciesContingencies can be either possible assets or possible liabilities arising frompast events which, by their nature, will be resolved only when one or morefuture events, not
wholly within our control, occur or fail to occur. The assessment of suchcontingencies inherently involves the exercise of significant judgment andestimates of the outcome of future events. Refer to note 18 for further details oncontingencies.
4 > DIVESTITURES
For the three months ended September 30
For the nine months ended September 30
2017 2016 2017 2016 Cash proceeds ondivestiture:
Veladero $ — $ — $ 960 $ — Bald Mountain — — — 423 Round Mountain — — — 165
$ — $ — $ 960 $ 588
A) Sale of 50% of VeladeroOn April 6, 2017, we announced a strategic cooperation agreement withShandong Gold Group Co., Ltd. (“Shandong”) where Shandong agreed toacquire 50 percent of Barrick’s Veladero mine in Argentina for $960 million. Thetransaction closed on June 30, 2017 and in the second quarter we recognized atotal gain of $689 million, partially on the sale of 50 percent to Shandong andpartially upon remeasurement of our remaining interest in Veladero. We haveaccounted for our remaining 50 percent interest as a joint operation andconsolidated our proportionate share of the assets and liabilities. We haverecognized our share of the revenue and expenses of Veladero starting July 1,2017. The transaction remains subject to net working capital adjustments.
In accordance with the acquisition method of accounting, the acquisition cost hasbeen allocated on a preliminary basis to the underlying assets acquired andliabilities assumed. In the third quarter of 2017, we progressed the preliminarypurchase price allocation and allocated fair values to inventory, PP&E andmining interest. We recognized a deferred tax liability for the difference betweenthe preliminary fair values and the tax base of those assets and now have anupdated goodwill balance of $110 million, which is not deductible for taxpurposes. This allocation is preliminary as we have not had sufficient time tocomplete the valuation process, including the net working capital adjustment. Inthe final purchase price allocation, which we now expect to complete in the fourthquarter, there may be reallocations between the individual assets and liabilities.
B) Sale of 25% of Cerro CasaleOn March 28, 2017, we announced an agreement with Goldcorp Inc.(“Goldcorp”) to form a new partnership at the Cerro Casale Project in Chile. Thetransaction closed on June 9, 2017. Under the terms of the agreement, Goldcorpagreed to purchase a 25 percent interest in

BARRICK THIRD QUARTER 2017 72 NOTES TO FINANCIAL STATEMENTS (UNAUDITED)
Cerro Casale from Barrick. This transaction, coupled with the concurrentpurchase by Goldcorp of Kinross Gold Corporation’s (“Kinross”) 25 percentinterest in Cerro Casale, resulted in Barrick and Goldcorp each holding a50 percent interest in the joint operation.
The total consideration received by Barrick and Kinross implies a fair value of$1.2 billion for 100% of Cerro Casale, which resulted in a reversal ofimpairment of $1.12 billion in the first quarter of 2017. Refer to note 13 to theFinancial Statements for further details of the impairment reversal. We areaccounting for our remaining 50 percent interest as a joint operation andconsolidate our proportionate share of the assets, liabilities, revenue andexpenses of Cerro Casale. We recognized a gain of $193 million due to thedeconsolidation of the non-controlling interest in Cerro Casale in the secondquarter of 2017.
As consideration for the 25 percent interest acquired from Barrick, Goldcorp willfund Barrick’s first $260 million of expenditures on the project and will spend anequivalent amount on its own behalf for a total project investment commitmentof $520 million. Under the agreement, Goldcorp must spend a minimum of$60 million in the two-year period following closing, and then $80 million in eachsuccessive two-year period. The outstanding funding commitment will accrueinterest at an annual rate of 4.75 percent. In the event that Goldcorp does notspend the minimum amount in any two-year period, 50 percent of any shortfallwill be paid directly to Barrick in cash.
In addition, Goldcorp also funded Cerro Casale’s acquisition of a 100 percentinterest in the adjacent Quebrada Seca property from Kinross upon closing.Upon a construction decision Goldcorp will pay Barrick $40 million in cash andBarrick will receive a 1.25 percent royalty on 25 percent of the gross revenuesderived from metal production from both Cerro Casale and Quebrada Seca.The contingent consideration payable to Barrick has been recorded at theirestimated fair value in other long-term assets.
Goldcorp entered into a separate agreement for the acquisition of ExeterResource Corporation, whose sole asset is the Caspiche Project, locatedapproximately 10 kilometers north of Cerro Casale. The acquisition of 100% ofExeter was completed in the third quarter and Goldcorp contributed theCaspiche Project into the Cerro Casale Joint Venture at a total acquisition costof approximately $157 million. The acquisition costs incurred by Goldcorp havebeen deducted from the $520 million total project investment commitment, butwill not count towards the minimum expenditures for the initial two-year period.We have recorded a receivable of $181 million, split $15 million as short-termand $166 million as long-term,
in other current assets and other long-term assets, respectively.

5 > SEGMENT INFORMATIONIn the first quarter of 2017, we unified the management and the operation of our Cortez and Goldstrike minesites, now referred to as Barrick Nevada. Barrick’sbusiness is now organized into eleven individual minesites, one grouping of two minesites, one publicly traded company and one project. Barrick’s Chief OperatingDecision Maker (“CODM”), the President, reviews the operating results, assesses performance and makes capital allocation decisions at the minesite, grouping,Company and/or project level. Therefore, each individual minesite, with the exception of Barrick Nevada, Acacia and the Pascua-Lama project are operatingsegments for financial reporting purposes. Our updated presentation of our reportable operating segments will now be four individual gold mines (Pueblo Viejo,Lagunas Norte, Veladero and Turquoise Ridge), Barrick Nevada, Acacia and our Pascua-Lama project. The remaining operating segments, our remaining gold andcopper mines, have been grouped into an “other” category and will not be reported on individually. The prior periods have been restated to reflect the change inpresentation. Segment performance is evaluated based on a number of measures including operating income before tax, production levels and unit production costs.Certain costs are managed on a consolidated basis and are therefore not reflected in segment income.
Consolidated Statement of Income Information Cost of Sales
For the three months ended September 30, 2017 Revenue
Direct mining, royalties and
community relations Depreciation
Exploration, evaluation and
project expenses Other expenses
(income) 1 Segment income
(loss) Barrick Nevada $706 $246 $179 $7 $6 $268 Pueblo Viejo 2 329 127 38 — 3 161 Lagunas Norte 124 41 17 1 (1) 66 Veladero 114 58 48 — (1) 9 Turquoise Ridge 84 40 9 — 1 34 Acacia 2 170 84 23 — 33 30 Pascua-Lama — — 2 42 2 (46) Other Mines 3 466 276 69 4 9 108
$1,993 $872 $385 $54 $52 $630 Consolidated Statement of Income Information
Cost of Sales
For the three months ended September 30, 2016 Revenue
Direct mining, royalties and
community relations Depreciation
Exploration, evaluation and
project expenses Other expenses
(income) 1 Segment income
(loss) Barrick Nevada $749 $273 $196 $5 $6 $269 Pueblo Viejo 2 450 114 46 — 1 289 Lagunas Norte 150 49 22 1 3 75 Veladero 134 62 24 — — 48 Turquoise Ridge 107 37 8 — — 62 Acacia 2 283 132 43 6 (7) 109 Pascua-Lama — — 1 10 2 (13) Other Mines 3 424 218 44 2 45 115
$2,297 $885 $384 $24 $50 $954 BARRICK THIRD QUARTER 2017 73 NOTES TO FINANCIAL STATEMENTS (UNAUDITED)

Consolidated Statement of Income Information Cost of Sales
For the nine months ended September 30, 2017 Revenue
Direct mining,royalties and
community relations Depreciation
Exploration, evaluation and
project expenses Other expenses
(income) 1 Segment income
(loss) Barrick Nevada $2,273 $803 $638 $17 $21 $794 Pueblo Viejo 2 1,015 367 122 — 10 516 Lagunas Norte 365 120 50 4 5 186 Veladero 439 216 86 3 — 134 Turquoise Ridge 177 86 18 — 2 71 Acacia 2 561 273 82 — 47 159 Pascua-Lama — — 6 86 3 (95) Other Mines 3 1,316 787 188 9 26 306 $6,146 $2,652 $1,190 $119 $114 $2,071
Consolidated Statement of Income Information Cost of Sales
For the nine months ended September 30, 2016 Revenue
Direct mining,royalties and
community relations Depreciation
Exploration, evaluation and
project expenses Other expenses
(income) 1 Segment income
(loss) Barrick Nevada $1,989 $809 $583 $9 $13 $575 Pueblo Viejo 2 1,130 374 126 — 2 628 Lagunas Norte 425 139 77 3 7 199 Veladero 445 215 76 — (1) 155 Turquoise Ridge 238 95 19 — 1 123 Acacia 2 783 402 122 18 1 240 Pascua-Lama — — 4 40 (10) (34) Other Mines 3 1,229 696 135 4 52 342 $6,239 $2,730 $1,142 $74 $65 $2,228 1
Includes accretion expense, which is included within finance costs in the consolidated statement of income. For the three months ended September 30, 2017, accretion expense was $12 million(2016: $9 million) and for the nine months ended September 30, 2017, accretion expense was $43 million (2016: $32 million).
2
Includes non-controlling interest portion of revenues, cost of sales and segment income for the three months ended September 30, 2017 for Pueblo Viejo $128 million, $64 million, $63 million(2016: $181 million, $61 million, $119 million) and Acacia $62 million, $39 million, $11 million (2016: $102 million, $63 million, $39 million) and for the nine months ended September 30, 2017 forPueblo Viejo $402 million, $189 million, $209 million (2016: $452 million, $193 million, $258 million) and Acacia $203 million, $128 million, $58 million (2016: $283 million, $188 million, $88million).
3
Includes cost of sales of Pierina for the three months ended September 30, 2017 of $38 million (2016: $17 million) and for the nine months ended September 30, 2017 of $119 million (2016: $52million).
BARRICK THIRD QUARTER 2017 74 NOTES TO FINANCIAL STATEMENTS (UNAUDITED)

Reconciliation of Segment Income to Income Before Income Taxes For the three months ended September 30 For the nine months ended September 30 2017 2016 2017 2016 Segment income $630 $954 $2,071 $2,228 Other cost of sales/amortization 1 (13) (22) (47) (79) Exploration, evaluation and project expenses not attributable to segments (46) (20) (137) (81) General and administrative expenses (69) (71) (186) (217) Other income (expense) not attributable to segments 3 2 871 (9) Impairment reversals (charges) not attributable to segments (2) (49) 1,128 (54) Loss on currency translation (25) (19) (60) (181) Closed mine rehabilitation (14) (16) (19) (46) Income (loss) from equity investees 25 (3) 50 5 Finance costs, net (includes non-segment accretion) (226) (180) (518) (530) Gain on non-hedge derivatives 2 8 4 10 7 Income before income taxes $271 $580 $3,163 $1,043 1
Includes all realized hedge gains and losses for the three months ended September 30, 2017 of $8 million losses (2016: $15 million losses) and for the nine months ended September 30, 2017 of$22 million losses (2016: $59 million losses).
2
Includes unrealized non-hedge gains and losses for the three months ended September 30, 2017 of $9 million gains (2016: $12 million gains) and for the nine months ended September 30, 2017of $6 million gains (2016: $23 million gains).
Capital Expenditures Information Segment capital expenditures 1 For the three months ended September 30 For the nine months ended September 30 2017 2016 2017 2016 Barrick Nevada $115 $88 $428 $251 Pueblo Viejo 35 22 84 69 Lagunas Norte 8 14 17 52 Veladero 21 5 134 46 Turquoise Ridge 11 9 24 23 Acacia 36 53 127 135 Pascua-Lama 1 3 4 6 Other Mines 65 64 180 162 Segment total $292 $258 $998 $744 Other items not allocated to segments 9 13 24 26 Total $301 $271 $1,022 $770 1
Segment capital expenditures are presented for internal management reporting purposes on an accrual basis. Capital expenditures in the Consolidated Statements of Cash Flow are presentedon a cash basis. For the three months ended September 30, 2017, cash expenditures were $307 million (2016: $277 million) and the decrease in accrued expenditures was $6 million (2016:$6 million decrease). For the nine months ended September 30, 2017, cash expenditures were $1,046 million (2016: $800 million) and the decrease in accrued expenditures was $24 million(2016: $30 million decrease).
Purchase CommitmentsAt September 30, 2017, we had purchase obligations for supplies and consumables of $1,011 million (December 31, 2016: $970 million).
Capital CommitmentsIn addition to entering into various operational commitments in the normal course of business, we had capital commitments of $115 million at September 30, 2017(December 31, 2016: $103 million). BARRICK THIRD QUARTER 2017 75 NOTES TO FINANCIAL STATEMENTS (UNAUDITED)

6 > REVENUE For the three months ended September 30 For the nine months ended September 30 2017 2016 2017 2016 Gold bullion sales Spot market sales $1,772 $2,077 $5,543 $5,580 Concentrate sales 12 57 71 194
$1,784 $2,134 $5,614 $5,774 Copper concentrate sales 177 104 427 322 Other sales 1 32 59 105 143
Total $1,993 $2,297 $6,146 $6,239
1 Revenues include the sale of by-products for our gold and copper mines for the three months ended September 30, 2017 of $32 million (2016: $50 million) and the nine months endedSeptember 30, 2017 of $105 million (2016: $110 million), and energy sales from the Monte Rio power plant at our Pueblo Viejo Mine for the three months ended September 30, 2016 of$9 million and the nine months ended September 30, 2016 of $33 million.
7 > COST OF SALES
Gold Copper Pascua-Lama/Other 3 Total For the three months ended September 30 2017 2016 2017 2016 2017 2016 2017 2016 Direct mining cost 1,2 $ 729 $ 761 $ 69 $ 48 $ 8 $ 16 $ 806 $ 825 Depreciation 1 357 373 26 10 7 6 390 389 Royalty expense 50 57 12 7 — — 62 64 Community relations 11 11 1 1 — 1 12 13
$1,147 $1,202 $ 108 $ 66 $ 15 $ 23 $1,270 $1,291
Gold Copper Pascua-Lama/Other 3 Total For the nine months ended September 30 2017 2016 2017 2016 2017 2016 2017 2016 Direct mining cost 1,2 $2,241 $2,344 $ 203 $ 169 $ 23 $ 61 $2,467 $2,574 Depreciation 1 1,125 1,108 59 30 29 18 1,213 1,156 Royalty expense 150 156 27 32 — — 177 188 Community relations 28 25 3 4 1 4 32 33
$3,544 $3,633 $ 292 $ 235 $ 53 $ 83 $3,889 $3,951
1 Direct mining cost includes charges to reduce the cost of inventory to net realizable value as follows: $3 million for the three months ended September 30, 2017 (2016: $4 million) and$9 million for the nine months ended September 30, 2017 (2016: $64 million).
2 Direct mining cost includes the costs of extracting by-products.3 Other includes all realized hedge gains and losses and corporate amortization.
8 > EARNINGS PER SHARE For the three months ended September 30 For the nine months ended September 30 2017 2016 2017 2016 Basic Diluted Basic Diluted Basic Diluted Basic Diluted Net income (loss) ($43) ($43) $245 $245 $1,983 $1,983 $349 $349 Net loss (income) attributable to non-controlling interests 32 32 (70) (70) (231) (231) (119) (119)
Net income (loss) attributable to equity holders of Barrick GoldCorporation ($11) ($11) $175 $175 $1,752 $1,752 $230 $230
Weighted average shares outstanding (millions) 1,166 1,166 1,165 1,165 1,166 1,166 1,165 1,165
Earnings per share attributable to the equity holders of Barrick GoldCorporation Net income (loss) ($0.01) ($0.01) $0.15 $0.15 $1.50 $1.50 $0.20 $0.20
BARRICK THIRD QUARTER 2017 76 NOTES TO FINANCIAL STATEMENTS (UNAUDITED)

BARRICK THIRD QUARTER 2017 77 NOTES TO FINANCIAL STATEMENTS (UNAUDITED)
9 > OTHER EXPENSE A) Other Expense (Income)
For the three months ended September 30
For the nine months ended September 30
2017 2016 2017 2016 Other expense:
Bank charges $ 5 $ 5 $ 16 $ 16 Bulyanhulureduced operationsprogram costs 1
24
—
27
—
Litigation 8 — 18 — Miscellaneous writeoffs — — 10 — Other 14 2 25 9
Total other expense $ 51 $ 7 $ 96 $ 25 Other income:
Gain on sale oflong-lived assets 2 $ (5) $ 37 $ (882) $ 35
Office closure — — — (4) Other (9) (5) (14) (14)
Total other income $ (14) $ 32 $ (896) $ 17
Total $ 37 $ 39 $ (800) $ 42
1 Primarily consists of severance, contractor and inventory writedown costs.2 Primarily represents the 50% sale of Veladero and 25% sale of Cerro Casale. Refer to
note 4.
B) Impairment (Reversals) Charges
For the three months ended September 30
For the nine months ended September 30
2017 2016 2017 2016 Impairment(reversals) of longlived assets
$ 2
$ 49
$ (1,128)
$ 54
Total $ 2 $ 49 $ (1,128) $ 54
C) Loss on Currency Translation
For the three months ended September 30
For the nine months ended September 30
2017 2016 2017 2016 Released ondisposal andreorganization ofentities
$ —
$ —
$ 11
$ 91
Other losses 25 19 49 90
Total $ 25 $ 19 $ 60 $ 181
10 > INCOME TAX EXPENSE
For the three months ended September 30
For the nine months ended September 30
2017 2016 2017 2016 Current $ 319 $ 285 $ 667 $ 678 Deferred (5) 50 513 16
$ 314 $ 335 $ 1,180 $ 694
Income tax expense was $1,180 million for the nine months endedSeptember 30, 2017. The underlying effective tax rate for ordinary income for thenine months ended September 30, 2017 was 45% after adjusting for the impactof net currency translation losses on deferred tax balances, the impact ofimpairment charges (reversals), the impact of asset sales and non-hedgederivatives, the impact of the proposed framework for Acacia operations, theimpact of debt extinguishment losses and the impact of non-deductible foreignexchange losses. The unadjusted tax rate for income for the nine months endedSeptember 30, 2017, was 37% of the income before income taxes.
Currency TranslationDeferred tax balances are subject to remeasurement for changes in currencyexchange rates each period. The most significant balances are Argentine netdeferred tax liabilities. In the nine months ended September 30, 2017 and 2016,tax expense of $6 million and $26 million respectively primarily arose fromtranslation losses on tax balances in Argentina, due to the weakening of theArgentine peso against the U.S. dollar. These translation losses are includedwithin deferred income tax expense/ recovery.
Proposed Framework for Acacia Operations in TanzaniaThe terms of the Proposed Framework for Acacia Mining Operations inTanzania, were announced on October 19, 2017. The Proposed Frameworkindicates that in support of ongoing efforts to resolve outstanding tax claims,Acacia would make a payment of $300 million to the Government of Tanzania,on terms to be settled by a working group. A tax provision of $128 million hadbeen recorded prior to December 31, 2016 in respect of tax disputes related toAcacia. In the third quarter of 2017, an additional amount of $172 million wasrecorded as current tax expense. See note 18 for further information with respectto these matters.

11 > CASH FLOW – OTHER ITEMS Operating Cash Flows – Other Items For the three months ended September 30 For the nine months ended September 30 2017 2016 2017 2016 Adjustments for non-cash income statement items:
(Gain) Loss on non-hedge derivatives ($8) ($4) ($10) ($7) Stock-based compensation expense (recovery) 15 (10) 46 53 (Income) loss from investment in equity investees (25) 3 (50) (5) Change in estimate of rehabilitation costs at closed mines 14 16 19 46 Net inventory impairment charges 3 4 9 64
Change in other assets and liabilities (125) (104) (222) (235) Settlement of rehabilitation obligations (18) (14) (41) (51)
Other operating activities ($144) ($109) ($249) ($135)
Cash flow arising from changes in: Accounts receivable ($35) ($53) $23 ($221) Inventory (127) (67) (358) (178) Other current assets (18) 12 (112) 73 Accounts payable 50 11 (4) (55) Other current liabilities 34 (8) (23) 19
Change in working capital ($96) ($105) ($474) ($362)
12 > EQUITY ACCOUNTING METHOD INVESTMENTCONTINUITY Kabanga Jabal Sayid Zaldívar GNX Total At January 1, 2016 $30 $178 $990 $1 $1,199 Funds invested 1 — — 8 9 Working capital adjustments — — 6 — 6 Income (loss) from equity investees (1) 2 27 (8) 20 Impairment charges — — (49) — (49)
At December 31, 2016 $30 $180 $974 $1 $1,185 Funds invested 1 — — 7 8 Income (loss) from equity investees (1) 21 38 (8) 50
At September 30, 2017 $30 $201 $1,012 $— $1,243
BARRICK THIRD QUARTER 2017 78 NOTES TO FINANCIAL STATEMENTS (UNAUDITED)

BARRICK THIRD QUARTER 2017 79 NOTES TO FINANCIAL STATEMENTS (UNAUDITED)
13 > IMPAIRMENT OF GOODWILL AND OTHERASSETSIn accordance with our accounting policy, goodwill is tested for impairment inthe fourth quarter and also when there is an indicator of impairment.Non-current assets are tested for impairment or impairment reversals whenevents or changes in circumstances suggest that the carrying amount may notbe recoverable. Refer to note 21 of the 2016 annual consolidated financialstatements for further information.
For the nine months ended September 30, 2017, we recorded impairmentreversals of $1,128 million (2016: $54 million impairment) for non-currentassets, as summarized in the following table:
Summary of impairments (reversals)
For the three months ended September 30
For the nine months ended September 30
2017 2016 2017 2016 Cerro Casale $ — $ — $ (1,120) $ — Equity Method Investments — 49 — 49 Pascua-Lama — — (15) 3 Other 2 — 7 2
Total $2 $49 ($1,128) $54
Indicators of impairmentAcaciaOn March 3, 2017, the Tanzanian Government announced a general ban onthe export of metallic mineral concentrates, impacting Acacia’s Bulyanhulu andBuzwagi mines. In the first half of 2017, concentrate accounted for 36% ofAcacia’s production at the group level, with 64% of Buzwagi production and46% of Bulyanhulu production, respectively, being concentrate. Subsequently,during the second quarter 2017 two Presidential Committees reported theirfindings, following investigations, that Acacia and its predecessor companieshave historically under-declared the contents of the exports of concentrate,resulting in a significant under-declaration of taxes. Acacia has refuted thefindings of these committees, affirming that it has declared everything ofcommercial value that it has produced since it started operating in Tanzaniaand has paid all appropriate royalties and taxes on all of the payable mineralsthat it has produced.
The above has had a negative impact on the operating environment of Acaciaand the three mines it operates in Tanzania. These changes, in combinationwith the ban imposed and proposed legislative changes (refer to note 18) wereidentified by management as a potential indicator of impairment in the secondquarter of 2017.
At the beginning of September 2017, as a result of the ongoing concentrateexport ban, Bulyanhulu
commenced a program to reduce operational activity and expenditure in order topreserve the viability of the mine over the long-term. This decision was identifiedby management as a potential indicator of impairment in the third quarter of2017.
As a result of the impairment assessments performed as at June 30, 2017 andSeptember 30, 2017, no impairment charge was recorded.
The key assumptions and estimates used in determining the fair value less costto dispose (“FVLCD”) are short and long-term gold prices ($1,200) and discountrate (5%). FVLCD is most sensitive to changes in these key assumptions,therefore a sensitivity analysis was performed based on a decrease in the long-term gold price of $100 per ounce and an increase in the discount rate of 1%.Neither of these reasonably possible changes in key assumptions would result inan impairment.
On October 19, 2017, Barrick announced that it had agreed with the Governmentof Tanzania on a proposed framework for a new partnership between Acacia andthe Government of Tanzania. Barrick and the Government of the Tanzania alsoagreed to form a working group that will focus on the resolution of outstandingtax claims against Acacia. Barrick and the Government of Tanzania are alsoreviewing the conditions for the lifting of the Ban. The proposal is subject toreview and approval by Acacia. Refer to note 18 for further details of theproposed framework.
The assumptions applied in the impairment assessments performed in thesecond and third quarter of 2017 have assumed that negotiations around thecurrent in-country matters are resolved. Should this not be the case, the resultsof impairment testing may result in the recognition of impairment losses. As atSeptember 30, 2017, the carrying values of Bulyanhulu, North Mara and Buzwagiwere $1,213 million, $306 million and $173 million, respectively, on a 100%basis.
Cerro Casale - First Quarter 2017As noted in note 4, on March 28, 2017, we announced the sale of a 25% interestin the Cerro Casale Project in Chile, which would result in Barrick retaining a50% interest in the Project and this was deemed to be an indicator of impairmentreversal in the first quarter of 2017. As such, in first quarter 2017, we recognizeda partial reversal of the non-current asset impairment recorded in the fourthquarter of 2014 in the amount of$1.12 billion. The recoverable amount, based onthe fair value less cost to dispose as implied by the transaction price, was$1.2 billion.

14 > FINANCIAL INSTRUMENTSFinancial instruments include cash; evidence of ownership in an entity; or a contract that imposes an obligation on one party and conveys a right to a second party todeliver/receive cash or another financial instrument.
A) Cash and EquivalentsCash and equivalents include cash, term deposits, treasury bills and money market funds with original maturities of less than 90 days. Cash and equivalents alsoinclude $359 million cash that is held in subsidiaries that have regulatory regulations or contractual restrictions, or operate in countries where exchange controls andother legal restrictions apply and are therefore not available for general use by the Company.
B) Debt 1 As at September 30, 2017 As at December 31, 20164.4%/5.7% notes 2,9 $1,467 $1,4673.85%/5.25% notes 1,079 1,0785.80% notes 3,9 395 3956.35% notes 4,9 593 593Other fixed-rate notes 5,9 1,326 1,607Project financing — 400Capital leases 6 69 114Other debt obligations 605 6094.10%/5.75% notes 7,9 842 1,569Acacia credit facility 8 71 99
$6,447 $7,931Less: current portion 10 (63) (143)
$6,384 $7,788
1 The agreements that govern our long-term debt each contain various provisions which are not summarized herein. These provisions allow Barrick to, at its option, redeem indebtedness priorto maturity at specified prices and also may permit redemption of debt by Barrick upon the occurrence of certain specified changes in tax legislation.
2 Consists of $1.5 billion in conjunction with our wholly owned subsidiary Barrick North America Finance LLC (“BNAF”). This consists of $629 million of BNAF notes due 2021 and $850 millionof BNAF notes due 2041.
3 Consists of $400 million of 5.80% notes which mature in 2034.4 Consists of $600 million of 6.35% notes which mature in 2036.5 Consists of $1.3 billion in conjunction with our wholly owned subsidiary Barrick North America Finance LLC (“BNAF”) and our wholly-owned subsidiary Barrick (PD) Australia Finance Pty Ltd.
(“BPDAF”). This consists of $248 million of BPDAF notes due 2020, $250 million of BNAF notes due 2038 and $850 million of BPDAF notes due 2039.6 Consists primarily of capital leases at Pascua-Lama, $29 million, and Lagunas Norte, $34 million (2016: $50 million and $56 million, respectively).7 Consists of $850 million in conjunction with our wholly owned subsidiary Barrick North America Finance LLC (“BNAF”). This consists of $850 million of BNAF notes due 2043.8 Consists of an export credit backed term loan facility.9 We provide an unconditional and irrevocable guarantee on all Barrick North America Finance LLC (“BNAF”), Barrick (PD) Australia Finance Pty Ltd. (“BPDAF”), Barrick Gold Finance
Company (“BGFC”) and Barrick (HMC) Mining (“BHMC”) notes and generally provide such guarantees on all BNAF, BPDAF, BGFC and BHMC notes issued, which will rank equally with ourother unsecured and unsubordinated obligations.
10 The current portion of long-term debt consists of project financing ($nil million; 2016: $72 million), other debt obligations ($4 million; 2016: $5 million), capital leases ($31 million; 2016: $38million) and Acacia credit facility ($28 million; 2016: $28 million).
Project financingDuring Q1 2017, $155 million of the Pueblo Viejo Project Financing Agreement was repaid. During Q3 2017, the remaining $267 million of the Pueblo Viejo ProjectFinancing Agreement was repaid in full. The settlement resulted in a debt extinguishment loss of $24 million.
Debt ManagementOn June 20, 2017, we executed the make-whole redemption on $279 million of BGC 6.95 %notes due 2019. The settlement resulted in a debt extinguishment loss of$26 million. On September 21, 2017, we executed the make-whole redemption on the $731 million of BGC 4.10% notes due 2023. The settlement resulted in a debtextinguishment loss of $77 million. BARRICK THIRD QUARTER 2017 80 NOTES TO FINANCIAL STATEMENTS (UNAUDITED)

BARRICK THIRD QUARTER 2017 81 NOTES TO FINANCIAL STATEMENTS (UNAUDITED)
15 > FAIR VALUE MEASUREMENTS
A) Assets and Liabilities Measured at Fair Value on a Recurring Basis
As atSeptember
Quoted prices in
active markets
for identical
assets
Significant other
observableinputs
Significant unobservable
inputs Aggregate
fair value 30, 2017
(Level 1)
(Level 2)
(Level 3) Cash andequivalents $ 2,025 $ — $ — $ 2,025 Otherinvestments 29 — — 29 Derivatives — (39) — (39) Receivables fromprovisionalcopper and goldsales — 116 — 116
$ 2,054 $ 77 $ — $ 2,131
B) Fair Values of Financial Assets and Liabilities
As at September
30, 2017 As at December
31, 2016
Carryingamount
Estimatedfair value
Carryingamount
Estimatedfair value
Financial assets Other receivables $ 570 $ 570 $ 399 $ 399 Other investment 29 29 18 18 Derivative assets 12 12 2 2
$ 611 $ 611 $ 419 $ 419
Financialliabilities Debt 2 $ 6,447 $ 7,616 $ 7,931 $ 8,279 Derivativeliabilities 51 51 78 78 Other liabilities 243 243 216 216
$ 6,741 $ 7,910 $ 8,225 $ 8,573
1 Recorded at fair value. Quoted market prices are used to determine fair value.2 Debt is generally recorded at amortized cost. The fair value of debt is primarily
determined using quoted market prices. Balance includes both current and long-termportions of debt.
We do not offset financial assets with financial liabilities.
C) Assets Measured at Fair Value on a Non-Recurring Basis
As atSeptember
Quoted prices in
active markets
for identical
assets
Significant other
observableinputs
Significant unobservable
inputs Aggregate
fair value 30, 2017
(Level 1)
(Level 2)
(Level 3) Property, plantand equipment 1 $ — $ — $ 1,579 $ 1,579
1 Property, plant and equipment were written up by $1,128 million, which was included inearnings relating to our Cerro Casale property. Refer to note 4B.
The Company’s valuation techniques were presented in Note 26 of theconsolidated financial statements for the year ended December 31, 2016, andhave been consistently applied in these interim financial statements.
16 > CAPITAL STOCK
A) Authorized Capital StockOur authorized capital stock includes an unlimited number of common shares(issued 1,166,263,347 common shares); an unlimited number of first preferredshares issuable in series (the first series is designated as the “First PreferredShares, Series A” and consists of 10,000,000 first preferred shares (issued nil);the second series is designated as the “First Preferred Shares, Series B” andconsists of 10,000,000 first preferred shares (issued nil); and the third series isdesignated as the “ First Preferred Share, Series C Special Voting Share” andconsists of 1 Special Voting Share (issued nil)); and an unlimited number ofsecond preferred shares issuable in series (the first series is designated as the“Second Preferred Shares, Series A” and consists of 15,000,000 secondpreferred shares (issued nil)). Our common shares have no par value.
B) DividendsThe Company’s practice has been to declare dividends after a quarter in theannouncement of the results for the quarter. Dividends declared are paid in thesame quarter.
The Company’s dividend reinvestment plan resulted in 689,276 common sharesissued to shareholders for the nine months ended September 30, 2017.

BARRICK THIRD QUARTER 2017 82 NOTES TO FINANCIAL STATEMENTS (UNAUDITED)
17 > NON-CONTROLLING INTERESTS
PuebloViejo 40%
Acacia36.1%
Cerro Casale
25%
SouthArturo
40% Total At January 1, 2017 $1,311 $ 704 $ 319 $ 44 $2,378
Share of income (loss) 93 (34) 173 (1) 231 Cash contributed — — 1 10 11 Decrease in non-controlling interest 1 — — (493) — (493) Disbursements (67) (12) — (40) (119)
At September 30, 2017 $1,337 $ 658 $ — $ 13 $2,008
1 Represents the sale of a 25% interest in Cerro Casale. Refer to note 4B.
18 > CONTINGENCIESCertain conditions may exist as of the date the financial statements are issuedthat may result in a loss to the Company, but which will only be resolved whenone or more future events occur or fail to occur. The impact of any resultingloss from such matters affecting these financial statements and noted belowmay be material.
Except as noted below, no material changes have occurred with respect to thematters disclosed in Note 36 “Contingencies” to the Company’s auditedconsolidated financial statements for the year ended December 31, 2016 (the“Audited Annual Financial Statements”), and no new contingencies haveoccurred that are material to the Company since the issuance of the AuditedAnnual Consolidated Financial Statements.
The description set out below should be read in conjunction with Note 36“Contingencies” to the Audited Annual Financial Statements.
Litigation and Claims Update
US Shareholder Class ActionOn May 10, 2017, Shepard Broadfoot, a purported shareholder of Barrick GoldCorporation, filed suit in the United States District Court for the SouthernDistrict of New York (“SDNY”) against the Company, Kelvin Dushnisky,Catherine Raw, Richard Williams and Jorge Palmes. The complaint assertsclaims against the defendants arising from allegedly false and misleadingstatements concerning production estimates and environmental risks at theVeladero mine, and seeks unspecified damages and other relief. On May 19,2017, a second and substantially identical purported class action complaint wasfiled in the SDNY. On October 4, 2017, the Court consolidated the action onand appointed the lead plaintiff and lead counsel. A briefing schedule has beenset by the Court, and the plaintiffs’ amended consolidated
complaint is due in December 2017. The Company believes that the claims arewithout merit and intends to defend them vigorously. No amounts have beenaccrued for any potential losses under these matters.
Pascua-Lama – SMA Regulatory SanctionsThe final resolution from Chile’s environmental regulator (SMA) in respect of theadministrative proceedings remains pending and CMN continues to respond toinformation requests from the SMA from time to time.
Pascua-Lama – Constitutional Protection ActionOn March 13, 2017, the Supreme Court vacated the Temporary Closure Plan,ruling that additional information regarding the SMA regulatory sanction processwas required from the environmental regulator, and ordering the mining authority(Sernageomin) to issue a new resolution on the Temporary Closure Plan afterreceiving such information. On August 29, 2017, Sernageomin issued a newresolution in which it reapproved the Temporary Closure Plan as originallyissued. This approval is valid through September 2019.
Pascua-Lama—Water Quality ReviewA hearing took place on July 25, 2017. A decision of the Environmental Court ispending.
Veladero—Release of Cyanide-Bearing Process Solution
San Juan Provincial Regulatory Sanction ProceedingOn July 11, 2017, the San Juan government rejected MAG’s final administrativeappeal of this decision. On September 5, 2017, the Company commenced alegal action to continue challenging certain aspects of the decision before theSan Juan courts. MAG has implemented a remedial action plan at Veladero inresponse to the incident as required by the San Juan mining authority.
Criminal MattersOn August 15, 2017, the Court of Appeals confirmed the indictment against eightof the nine individuals that had been charged with alleged negligence inconnection with the solution release. The individual defendants have appealedthe indictments to the San Juan Supreme Court. The case will proceed in theSan Juan provincial court while this appeal is pending. MAG is not a party to theProvincial Action.
On October 17, 2016, a separate criminal investigation was initiated by thefederal judge overseeing the Federal Investigation based on the alleged failure offederal government officials to regulate the Veladero mine under Argentina’sglacier legislation (see “Argentine Glacier Legislation and ConstitutionalLitigation” in Note 36 “Contingencies” for more information on this legislation). OnJune 16, 2017, MAG submitted a motion to challenge the federal judge’sdecision to assign this investigation to himself. MAG also requested to be

BARRICK THIRD QUARTER 2017 83 NOTES TO FINANCIAL STATEMENTS (UNAUDITED)
admitted as a party to the proceeding in order to present evidence in support ofthe Company. On September 14, 2017, the Court of Appeals consolidated thetwo investigations before the federal judge and allowed MAG to join as a partyto the consolidated Federal Investigation.
No amounts have been recorded for any potential liability arising from thesematters, as the Company cannot reasonably predict any potential losses.
Veladero—Release of Crushed Ore Saturated with Process SolutionOn September 14, 2017, the San Juan Provincial mining authority consolidatedthe administrative proceeding into a single proceeding against MAGencompassing both the September 2016 incident and the March 2017 incidentdescribed below (see “Veladero - Release of Gold-bearing Process Solution”).
Veladero - Cyanide Leaching Process - Civil ActionMAG replied to the lawsuit on February 20, 2017, and the case will nowproceed to the evidentiary stage. On March 31, 2017, the plaintiffssupplemented their original complaint to allege that the risk of environmentaldamage had increased as a result of the March 28, 2017 release of gold-bearing process solution incident described below (see “Veladero - Release ofGold-bearing Process Solution”). The Company responded to the newallegations and intends to continue defending this matter vigorously.
Veladero - Release of Gold-bearing Process Solution
Regulatory Infringement Proceeding and Temporary Suspension ofAddition of CyanideOn March 28, 2017, the monitoring system at the Company’s Veladero minedetected a rupture of a pipe carrying gold-bearing process solution on the leachpad. This solution was contained within the operating site; no solution reachedany diversion channels or watercourses. All affected soil was promptlyexcavated and placed on the leach pad. The Company notified regulatoryauthorities of the situation, and San Juan provincial authorities inspected thesite on March 29, 2017.
On March 29, 2017, the San Juan provincial mining authority issued a violationnotice against MAG in connection with the incident and ordered a temporaryrestriction on the addition of new cyanide to the leach pad until correctiveactions on the system were completed. The mining authority lifted thesuspension on June 15, 2017, following inspection of corrective actions.
On March 30, 2017, the San Juan Mining Minister ordered the commencementof a regulatory infringement proceeding against MAG as well as acomprehensive
evaluation of the mine’s operations to be conducted by representatives of theCompany and the San Juan provincial authorities. The Company filed itsdefense to the regulatory infringement proceeding on April 5, 2017. OnSeptember 14, 2017, the San Juan Provincial mining authority consolidated thisadministrative proceeding into a single proceeding against MAG encompassingboth the September 2016 incident described above and the March 2017 incident.On October 10, 2017, the San Juan Provincial mining authority notified MAG oftwo charges under the infringement proceeding for alleged violations of theMining Code in connection with the March 2017 incident. MAG will requestadditional detail regarding the charges and then submit its response in theadministrative proceeding.
No amounts have been recorded for any potential liability rising from thesematters, as the Company cannot reasonably predict the outcome.
Provincial AmparoActionOn March 30, 2017, MAG was served notice of a lawsuit, called an “ amparo ”protection action, filed in the Jachal First Instance Court (the “Jachal Court”) byindividuals who claim to be living in Jachal, Argentina and who are seeking thecessation of all activities at the Veladero mine. The plaintiffs sought an injunctionas part of the lawsuit, requesting, among other things, the cessation of allactivities at the Veladero mine or, alternatively, a suspension of the leachingprocess at the mine. On March 30, 2017, the Jachal Court rejected the requestfor an injunction to cease all activities at the Veladero mine, but ordered, amongother things, the suspension of the leaching process at the Veladero mine andfor MAG and the San Juan provincial mining authority to provide additionalinformation to the Jachal Court in connection with the incident.
The Company filed a defense to the provincial amparo action on April 7, 2017.The Jachal Court lifted the suspension on June 15, 2017, after the San Juanprovincial mining authority provided the required information and a hydraulicassessment of the leach pad and process plant was implemented. No amountshave been recorded for any potential liability or asset impairment under thismatter, as the Company cannot reasonably predict the outcome.
Federal AmparoActionOn April 4, 2017, the National Minister of Environment of Argentina filed a lawsuitin the Buenos Aires federal court (the “Federal Court”) in connection with theMarch 2017 incident. The amparo protection action is seeking a court orderrequiring the cessation and/or suspension of activities at the Veladero mine.MAG submitted extensive information to the Federal Court about the incident, thethen-existing administrative and provincial judicial suspensions, the remedialactions taken by the Company

BARRICK THIRD QUARTER 2017 84 NOTES TO FINANCIAL STATEMENTS (UNAUDITED)
and the lifting of the suspensions as described above. MAG also challenged thejurisdiction of the Federal Court and the standing of the National Minister ofEnvironment of Argentina and requested that the matter be remanded to theJachal Court. The Province of San Juan also challenged the jurisdiction of theFederal Court in this matter. On June 23, 2017, the Federal Court decided thatit is competent to hear the case, and referred the case to the Court of Appealsto determine whether the Federal Court or Provincial Court in the casedescribed above has the authority to assess the merits of the amparo remedy.On July 5, 2017, the Provincial Court issued a request for the Supreme Court ofArgentina to resolve the jurisdictional dispute. On July 30, 2017, the Court ofAppeals referred the jurisdictional dispute to the Supreme Court and a decisionon the matter is pending. No amounts have been recorded for any potentialliability or asset impairment under this matter, as the Company cannotreasonably predict the outcome.
Writ of KalikasanIn November 2016, the Petitioners notified the Court of Appeals that settlementnegotiations did not resolve the action, which alleges that Placer Dome Inc.violated the Petitioners’ constitutional right to a balanced and healthful ecologyat the Marcopper mine in the Philippines, and that the Company is liable for thealleged actions and omissions of Placer Dome Inc. In March 2017, the Court ofAppeals asked Petitioners whether they intend to pursue the action. TheCompany is awaiting receipt of the Petitioner’s notification of their intentions.
Cerro CasaleOn June 12, 2017, the Environmental Court ordered the Chilean Committee ofMinisters for the Environment to review its January 9, 2015 decision to imposenew limitations on the volume of groundwater that the Cerro Casale projectmay extract for mining operations. The Committee of Ministers for theEnvironment met on September 6, 2017 in accordance with the EnvironmentalCourt order, and a decision in this matter is pending.
Acacia Mining plc - Concentrate Export Ban and Related DisputesIn March 2017, the Tanzanian Ministry of Energy and Minerals imposed a banon the export of metallic concentrates (the “Ban”). This includes gold/copperconcentrate exported by Acacia’s Bulyanhulu and Buzwagi mines. Followingthe imposition of the Ban, various investigations were conducted on behalf ofthe Tanzanian Government, which have resulted in allegations of undeclaredrevenue and unpaid taxes being made against Acacia which Acacia considersto be implausible. Acacia has received adjusted assessments for the tax years2000-2017 from the Tanzania Revenue Authority (the “TRA”) for a total amountof approximately $190 billion. These assessments are being disputed and
the underlying allegations are included in the matters that have been referred tointernational arbitration.
In addition, following the end of the third quarter, Acacia was served with noticesof adjusted corporate income tax and withholding tax assessments for tax years2005 to 2011 with respect to Acacia’s former Tulawaka joint venture, anddemands for payment, for a total amount of approximately $3 billion. Interest andpenalties represent the vast majority of the new assessments. The TRA has notprovided Acacia with any explanations or reasons for the adjusted assessments,or with the TRA’s position on how the assessments have been calculated or whythey have been issued. Acacia disputes these assessments and has requestedsupporting calculations, which have not yet been received.
In addition to the Ban, new and amended legislation was passed in Tanzania inearly July 2017, including various amendments to the 2010 Mining Act and a newFinance Act. The amendments to the 2010 Mining Act increased the royalty rateapplicable to metallic minerals such as gold, copper and silver to 6% (from 4%),and the new Finance Act imposes a 1% clearing fee on the value of all mineralsexported from Tanzania from July 1, 2017. Acacia continues to monitor theimpact of the new legislation in light of its Mineral Development Agreements withthe Government of Tanzania. However, to minimize further disruptions to itsoperations Acacia will, in the interim, satisfy the requirements imposed asregards the increased royalty rate in addition to the recently imposed 1% clearingfee on exports.
Acacia has been looking to address all issues in respect of the Ban along withother ongoing disputes through dialogue with the Tanzanian Government. In thiscontext, on July 4, 2017, Acacia caused arbitration notices to be served inTanzania in accordance with the dispute resolution processes agreed by theGovernment of Tanzania in the relevant Mineral Development Agreements.Acacia remains of the view that a negotiated resolution is the preferable outcometo the current disputes and Acacia will continue to work to achieve this. Duringthe third quarter of 2017, Barrick and the Government of Tanzania engaged indiscussions for the potential resolution of the disputes. Acacia did notparticipate directly in these discussions as the Government of Tanzania hadinformed Barrick that it wished to continue dialogue solely with Barrick.
On October 19, 2017, Barrick announced that it had agreed with the Governmentof Tanzania a proposed framework for a new partnership between Acacia andthe Government of Tanzania. Barrick and the Government of the Tanzania alsoagreed to form a working group that will focus on the resolution of outstandingtax claims against Acacia. Key terms of the proposal include (i) the creation ofa new Tanzanian

BARRICK THIRD QUARTER 2017 85 NOTES TO FINANCIAL STATEMENTS (UNAUDITED)
operating company to manage Acacia’s Bulyanhulu, Buzwagi and North Maramines and all future operations in the country with key officers located inTanzania and Tanzanian representation on the board of directors,(ii) maximization of local employment of Tanzanians and procurement of goodsand services within Tanzania, (iii) economic benefits from Bulyanhulu, Buzwagiand North Mara would be distributed on a 50/50 basis, with the Government’sshare delivered in the form of royalties, taxes and a 16% free carry interest inAcacia’s Tanzanian operations; and (iv) in support of the working group’songoing efforts to resolve outstanding tax claims, Acacia would make apayment of $300 million to the Government of Tanzania, on terms to be settledby the working group. Barrick and the Government of Tanzania are alsoreviewing the conditions for the lifting of the Ban. The proposal is subject toreview and approval by Acacia. Other than as disclosed in note 10, no amountshave been recorded for any potential liability or additional losses arising fromthese matters, as the Company cannot reasonably determine the terms of thefinal arrangements between the Government of Tanzania and Acacia.
See note 10 of these Financial Statements for information related to income taxexpenses recorded with respect to these matters.

HEAD OFFICE
Barrick Gold CorporationBrookfield PlaceTD Canada Trust Tower161 Bay Street, Suite 3700Toronto, Ontario M5J 2S1
Telephone: +1 416 861-9911Toll-free: 1-800-720-7415Fax: +1 416 861-2492Email: [email protected]: www.barrick.com
SHARES LISTEDABX The New York Stock Exchange
The Toronto Stock Exchange
INVESTOR CONTACTDaniel OhSenior Vice PresidentInvestor Engagement and GovernanceTelephone: +1 416 307-7474Email: [email protected]
TRANSFER AGENTS AND REGISTRARS
AST Trust Company (Canada)P.O. Box 700, Postal Station BMontreal, Quebec H3B 3K3orAmerican Stock Transfer & Trust Company, LLC6201 – 15 AvenueBrooklyn, New York 11219
Telephone: 1-800-387-0825Fax: 1-888-249-6189Email: [email protected]: www.astfinancial.com
MEDIA CONTACTAndy LloydSenior Vice PresidentCommunicationsTelephone: +1 416 307-7414Email: [email protected]

Cautionary Statement on Forward-Looking InformationCertain information contained or incorporated by reference in this press release, including any information as to our strategy, projects, plans or future financial oroperating performance, constitutes “forward-looking statements’. All statements, other than statements of historical fact, are forward-looking statements. The words“believe”, “expect”, “anticipate”, “target”, “plan”, “objective”, “assume”, “intend”, “project”, “goal”, “continue”, “budget”, “estimate”, “potential”, “may”, “will”, “can”, “could”,“would” and similar expressions identify forward-looking statements. In particular, this press release contains forward-looking statements including, without limitation,with respect to: (i) Barrick’s forward-looking production guidance; (ii) estimates of future cost of sales per ounce for gold and per pound for copper, cash costs perounce and C1 cash costs per pound, and all-in-sustaining costs per ounce/pound; (iii) cash flow forecasts; (iv) projected capital, operating and explorationexpenditures; (v) Barrick’s expectations regarding the potential benefits resulting from a new partnership between Acacia Mining plc (“Acacia”) and the Government ofTanzania; (vi) potential improvements to operating performance, production and mine life at Barrick’s Cortez, Turquoise Ridge and Lagunas Norte mines;(vii) potential developments at Barrick’s Goldrush project; (viii) targeted debt and cost reductions; (ix) mine life and production rates; (x) potential mineralization andmetal or mineral recoveries; (xi) savings from our improved capital management program; (xii) Barrick’s Best-in-Class program (including potential improvements tofinancial and operating performance that may result from certain Best-in-Class initiatives); (xiii) the timing and results of the prefeasibility study at Pascua-Lama;(xiv) our pipeline of high confidence projects at or near existing operations; (xv) the benefits of unifying the Cortez and Goldstrike operations; (xvi) our ability to convertresources into reserves (xvii) asset sales, joint ventures and partnerships; and (xviii) expectations regarding future price assumptions, financial performance and otheroutlook or guidance.
Forward-looking statements are necessarily based upon a number of estimates and assumptions including material estimates and assumptions related to the factorsset forth below that, while considered reasonable by the Company as at the date of this press release in light of management’s experience and perception of currentconditions and expected developments, are inherently subject to significant business, economic and competitive uncertainties and contingencies. Known andunknown factors could cause actual results to differ materially from those projected in the forward-looking statements and undue reliance should not be placed onsuch statements and information. Such factors include, but are not limited to: fluctuations in the spot and forward price of gold, copper or certain other commodities(such as silver, diesel fuel, natural gas and electricity); the speculative nature of mineral exploration and development; changes in mineral production performance,exploitation and exploration successes; risks associated with the fact that certain Best-in-Class initiatives are still in the early stages of evaluation and additionalengineering and other analysis is required to fully assess their impact; the duration of the Tanzanian ban on mineral concentrate exports; the ultimate terms of anydefinitive agreement between Barrick Acacia and the Government of Tanzania to resolve a dispute relating to the imposition of the concentrate export ban andallegations by the Government of Tanzania that Acacia under-declared the metal content of concentrate exports from Tanzania; the status of certain taxre-assessments by the Tanzanian government; the manner in which amendments to the 2010 Mining Act (Tanzania) increasing the royalty rate applicable to metallicminerals such as gold, copper and silver to 6% (from 4%), and the new Finance Act (Tanzania) imposing a 1% clearing fee on the value of all minerals exported fromTanzania from July 1, 2017 will be implemented and the impact of these and other legislative changes on Acacia; whether Acacia will approve the terms of any finalagreement reached between Barrick and the Government of Tanzania with respect to the dispute between Acacia and the Government of Tanzania; the benefitsexpected from recent transactions being realized; diminishing quantities or grades of reserves; increased costs, delays, suspensions and technical challengesassociated with the construction of capital projects; operating or technical difficulties in connection with mining or development activities, including geotechnicalchallenges and disruptions in the maintenance or provision of required infrastructure and information technology systems; failure to comply with environmental andhealth and safety laws and regulations; timing of receipt of, or failure to comply with,

necessary permits and approvals; uncertainty whether some or all of the Best-in-Class initiatives, targeted investments and projects will meet the Company’s capitalallocation objectives and internal hurdle rate; the impact of global liquidity and credit availability on the timing of cash flows and the values of assets and liabilitiesbased on projected future cash flows; adverse changes in our credit ratings; the impact of inflation; fluctuations in the currency markets; changes in U.S. dollar interestrates; risks arising from holding derivative instruments; changes in national and local government legislation, taxation, controls or regulations and/or changes in theadministration of laws, policies and practices, expropriation or nationalization of property and political or economic developments in Canada, the United States andother jurisdictions in which the Company or its affiliates do or may carry on business in the future; lack of certainty with respect to foreign legal systems, corruptionand other factors that are inconsistent with the rule of law; damage to the Company’s reputation due to the actual or perceived occurrence of any number of events,including negative publicity with respect to the Company’s handling of environmental matters or dealings with community groups, whether true or not; the possibilitythat future exploration results will not be consistent with the Company’s expectations; risks that exploration data may be incomplete and considerable additional workmay be required to complete further evaluation, including but not limited to drilling, engineering and socioeconomic studies and investment; risk of loss due to acts ofwar, terrorism, sabotage and civil disturbances; litigation; contests over title to properties, particularly title to undeveloped properties, or over access to water, powerand other required infrastructure; business opportunities that may be presented to, or pursued by, the Company; our ability to successfully integrate acquisitions orcomplete divestitures; risks associated with working with partners in jointly controlled assets; employee relations including loss of key employees; increased costs andphysical risks, including extreme weather events and resource shortages, related to climate change; availability and increased costs associated with mining inputs andlabor; and the organization of our previously held African gold operations and properties under a separate listed Company. In addition, there are risks and hazardsassociated with the business of mineral exploration, development and mining, including environmental hazards, industrial accidents, unusual or unexpectedformations, pressures, cave-ins, flooding and gold bullion, copper cathode or gold or copper concentrate losses (and the risk of inadequate insurance, or inability toobtain insurance, to cover these risks).
Many of these uncertainties and contingencies can affect our actual results and could cause actual results to differ materially from those expressed or implied in anyforward-looking statements made by, or on behalf of, us. Readers are cautioned that forward-looking statements are not guarantees of future performance. All of theforward-looking statements made in this press release are qualified by these cautionary statements. Specific reference is made to the most recent Form 40-F/AnnualInformation Form on file with the SEC and Canadian provincial securities regulatory authorities for a more detailed discussion of some of the factors underlyingforward-looking statements and the risks that may affect Barrick’s ability to achieve the expectations set forth in the forward-looking statements contained in this pressrelease.
We disclaim any intention or obligation to update or revise any forward-looking statements whether as a result of new information, future events or otherwise, exceptas required by applicable law.