infrastructure 2013: global priorities
TRANSCRIPT
Infrastructure2013
Global Priorities, Global Insights

Infrastructure2013 Global Priorities, Global Insights
ii Infrastructure 2013
Author
Jonathan D. Miller
uLI PrIncIPAL reseArchers And AdvIsers
Rachel MacCleeryVice President
Sarah Jo PetersonResearch Director
Kathleen CareyExecutive Vice President and Chief Content Officer
Maureen McAveySenior Resident Fellow
Tom MurphySenior Resident Fellow
Ed McMahonSenior Resident Fellow
Uwe BrandesSenior Vice President
Brandon SedloffManaging Director
Robert de JongProject Manager
Casey PetersonResearcher
Basil HallbergSenior Associate
ernst & Young AdvIsers
Howard Roth Global Real Estate Leader
Malcolm BairstowGlobal and EMEIA Infrastructure and Construction Leader
Michael ParkerSenior Managing Director and U.S. Infrastructure Advisory LeaderErnst & Young Infrastructure Advisors, LLC
Jeff ParkerSenior Managing DirectorErnst & Young Infrastructure Advisors, LLC
Bill BanksGlobal Infrastructure Leader, Transactions Advisory and Government, and Asia-Pacific Leader
Rick Sinkuler Global Real Estate Markets Leader
Jill MaguireMarketing Manager
ProductIon stAff
James A. MulliganSenior Editor
David James RoseManaging Editor/Manuscript Editor
Betsy VanBuskirkCreative Director
Deanna PinedaGraphic Designer Muse Advertising Design
Craig Chapman Senior Director, Publishing Operations
© 2013 by the Urban Land Institute and Ernst & Young.
Printed in the United States of America. All rights reserved. No part of this book may be reproduced in any form without written permission of the publisher.
Recommended bibliographical listing:Urban Land Institute and Ernst & Young. Infrastructure 2013: Global Priorities, Global Insights. Washington, D.C.: Urban Land Institute, 2013.
ISBN: 978-0-87420-264-9
Cover: The Octavio Frias de Oliveira Bridge, a cable-stayed bridge in São Paulo, Brazil, that spans the Pinheiros River, opened in May 2008.
iii
In a world suffering unprecedented economic and environmental challenges, the
importance of infrastructure is being recognized by populations and politicians
alike. The long-term issue of funding (who pays?) and the shorter-term options
for financing of infrastructure (how do we pay?) are becoming hugely important
questions for policy makers and the government officials responsible for creat-
ing and maintaining the assets that enable 21st-century cities to function. In this
turbulent period of low growth and government deficits, economies need fiscal
stimulus and creation of employment. Spending on infrastructure offers both of
these benefits and, if wisely directed, this investment delivers improved quality
of life to the affected community.
The Urban Land Institute and Ernst & Young
have collaborated again, for the seventh year,
to examine key trends and issues in the major
global markets of the Asia Pacific region,
Europe/Middle East/Africa, and the Americas.
Infrastructure 2013 has drawn upon a broad
range of discussions with public and private
sector procurers, funders, operators, and ad-
visers to report on the critical factors affect-
ing infrastructure in emerging and developed
economies.
In many developed economies such as
Europe and the United States, spending on
infrastructure is predominantly directed at
asset maintenance and repair, with few op-
portunities for brand-new installations. Where
new projects are contemplated, the driver is
often to address urgent climatic impacts or to
provide a differentiated economic benefit to a
municipal government or federal government.
In the connected global economy where cities
are competing for business and investment,
the quality of infrastructure is commonly a
determining factor.
With the increased importance of infrastruc-
ture comes the risk of political interference.
Some cash-rich emerging economies are able
to make swift decisions to invest, but other
countries must guard against political uncer-
tainty over major infrastructure policies and
strategies. Taxation, user charging, environ-
mental impact, and public safety are all poten-
tial vote-losing issues in a democratic society,
but step changes in the quality of infrastruc-
ture usually require bold decision making.
As the world’s population increasingly
chooses to live in large urban centers, there
is an increasing need for improved connectiv-
ity, efficient use of natural resources, and the
creation of sophisticated transport hubs. Now
more than ever, innovation, technology, and
instant communications are enabling improve-
ments in design, installation, and operation of
assets.
The winners, Infrastructure 2013 suggests,
will be those countries and regions that can
meet the rapidly changing needs of the people
by delivering the best facilities in the swiftest
and least disruptive manner.
Patrick PhillipsChief Executive OfficerUrban Land Institute
howard rothGlobal Real Estate LeaderErnst & Young

1
Contents2 Introduction
6 Our Urban Future
7 Factoring Climate Change
9 The Year Ahead and the Way Forward
10 A Spectrum of Approaches
14 Asia Pacific18 Insights about the Asia Pacific Region from Infrastructure 2013 Interviewees
18 China
23 Japan
24 India
28 Australia
28 Indonesia
29 Other Countries in the Asia Pacific Region
30 Europe, Middle East, Africa34 Insights about Europe, the Middle East, and Africa from Infrastructure 2013
Interviewees
34 United Kingdom
38 France
38 Germany
38 Spain
39 Italy
39 Russia
40 Turkey
40 Africa
41 Middle East
42 The Americas45 Insights about the Americas from Infrastructure 2013 Interviewees
45 United States
53 Canada
55 Mexico
56 Brazil
58 Other Countries in the Americas

2 Infrastructure 2013
Introduction
The city of La Paz, Bolivia, lies below the Illimani mountain.
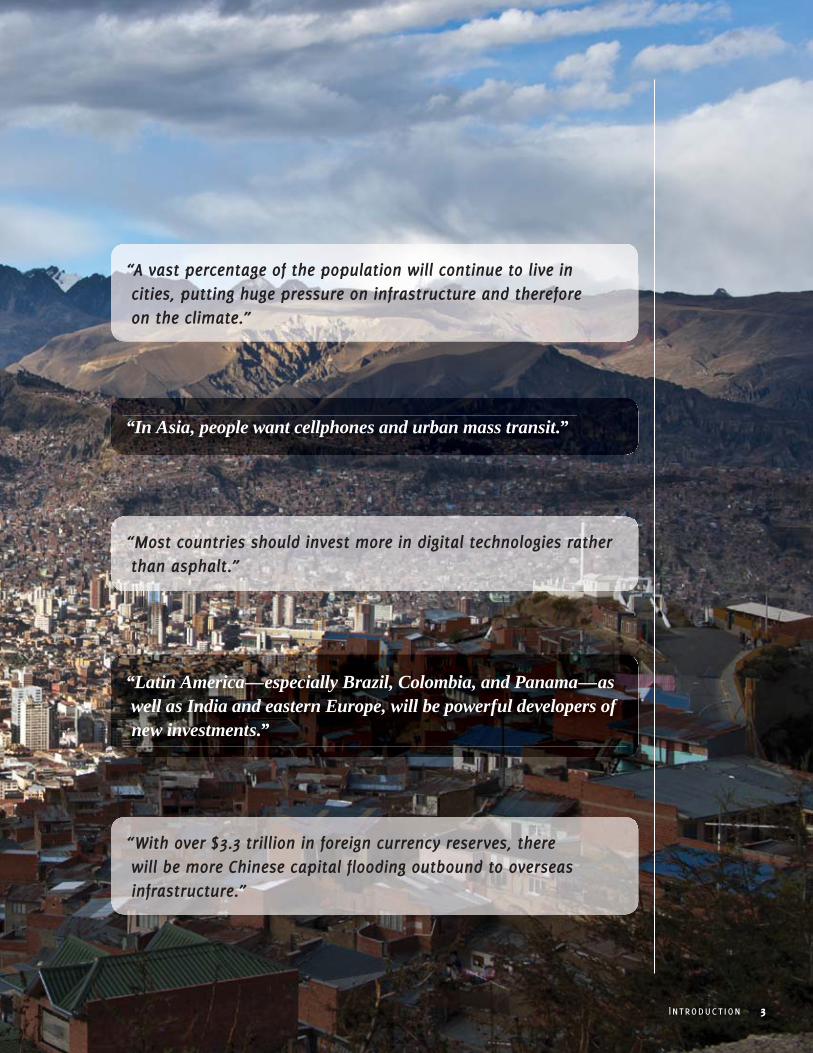
“A vast percentage of the population will continue to live in cities, putting huge pressure on infrastructure and therefore on the climate.”
“With over $3.3 trillion in foreign currency reserves, there will be more Chinese capital flooding outbound to overseas infrastructure.”
“Most countries should invest more in digital technologies rather than asphalt.”
“In Asia, people want cellphones and urban mass transit.”
“Latin America—especially Brazil, Colombia, and Panama—as well as India and eastern Europe, will be powerful developers of new investments.”
Introduction 3
4 Infrastructure 2013
In 2013, the slowly recovering global economy influences widely differing ap-
proaches to setting infrastructure agendas, as nations work to gain competitive
footholds amid ongoing financial distress, political unease, and the challenges of
climate change.
Across the globe, infrastructure is the life-
blood of prosperity and economic confidence
in the 21st century. Well-planned and well-
executed investments offer developing econo-
mies the hope of basic facilities for all and a
chance to compete in a global marketplace.
In developed economies, superior and well-
maintained infrastructure attracts the best
talent as well as dynamic businesses seeking
reliable connectivity and a high quality of life
for workers.
Infrastructure—the structure or underlying
foundation on which the continued growth of
a community depends—is critical for countries
in all stages of development. But adverse
economic and political conditions can make ef-
fective investment in infrastructure difficult to
achieve, and affect how efficient countries are
in realizing anticipated benefits.
Emerging-market players are looking to re-
move transport bottlenecks and upgrade in-
adequate systems for water and power, which
can stunt growth ambitions. At the same time,
many mature countries—particularly the United
States and those in Europe—are grappling with
how to repair or refashion once-advanced, but
now increasingly outmoded, infrastructure in
the face of limited funding capacity. New tech-
nologies and urban planning strategies may
yield improved returns on infrastructure invest-
ment in developed markets, as countries forgo
rebuilding in-kind for transformational changes.
Some governments are reluctantly paring
back 21st-century modernizing schemes—they
must deleverage or reorder their fiscal affairs
before they can launch into backlogs of wish-
list projects. Fiscal constraints may force a fo-
cus on investing in the highest-priority needs.
Other countries in better financial condition
realize they just cannot pay for everything they
need to do and execute strategies in incre-
mental steps. Only China keeps on building—
seemingly without limits—but with growing
questions regarding potentially suboptimal
project selection, quality control, and long-
term sustainability.
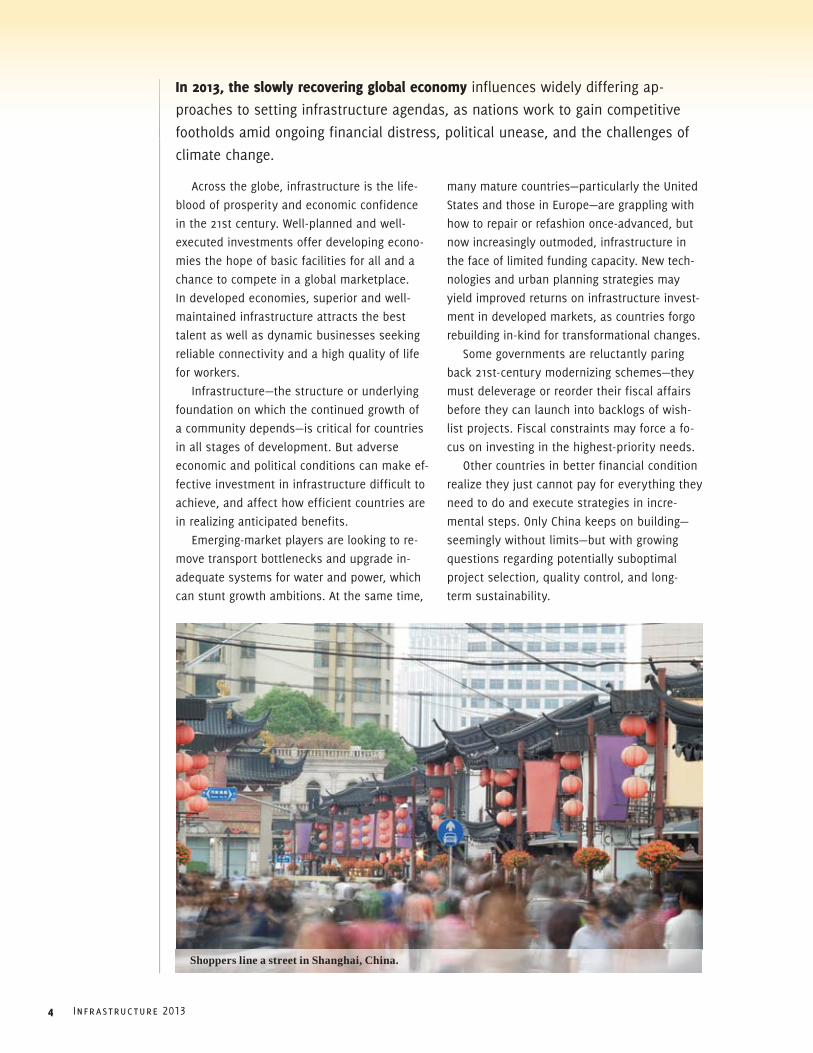
Shoppers line a street in Shanghai, China.
Introduction 5
Governments around the world are increas-
ingly turning to public/private partnership
(PPP) and public concession models to help
build and finance infrastructure initiatives.
Large sovereign wealth funds and institutional
investors are tentatively warming to the poten-
tial for reliable returns from infrastructure that
exceed current bond performance and offer
inflation-hedging potential.
But infrastructure investors still worry about
the reliability of government partners, deal
structures, and the long-term viability of some
investments, as evidenced by recent experi-
ence with toll roads in Spain and the United
Kingdom’s reassessment of its PPP programs
and policies. In the end, PPPs and related ap-
proaches are financing tools—taxpayers and
users must still pay the costs.
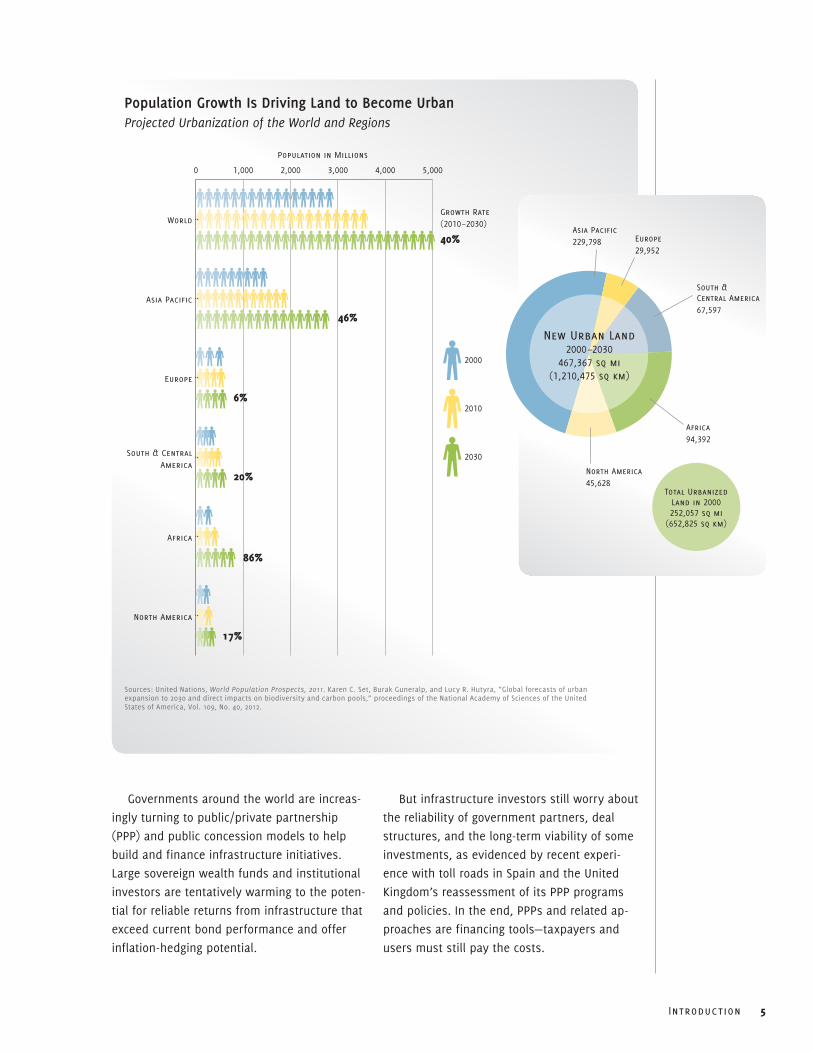
Population Growth Is Driving Land to Become UrbanProjected Urbanization of the World and Regions
0 1,000 2,000 3,000 4,000 5,000
2030
2010
2000
North America
Africa
South & CentralAmerica
Europe
Asia Pacific
World
Population in Millions
Growth Rate (2010–2030)
40%
17%
86%
20%
6%
46%
Sources: United Nations, World Population Prospects, 2011. Karen C. Set, Burak Guneralp, and Lucy R. Hutyra, “Global forecasts of urban expansion to 2030 and direct impacts on biodiversity and carbon pools,” proceedings of the National Academy of Sciences of the United States of America, Vol. 109, No. 40, 2012.
North America45,628
Africa94,392
South & Central America67,597
Europe29,952
Asia Pacific229,798
Total UrbanizedLand in 2000252,057 sq mi
(652,825 sq km)
New Urban Land2000 –2030
467,367 sq mi(1,210,475 sq km)
6 Infrastructure 2013
Our Urban FutureThe need for infrastructure is becoming even
more pressing as more of the world’s popula-
tion crowds into urban centers. The world’s vast
gateway cities—London, New York, Shanghai,
Singapore, Mumbai, São Paulo, and Mexico City,
among others—concentrate commerce, culture,
businesses, government, universities, and medi-
cal centers. Surrounded by rapidly urbanizing
areas, they generate jobs and wealth.
But in order to function and sustain growth
over the decades ahead, urban areas will re-
quire novel, new-age infrastructure and land
use concepts that can foster mobility, limit con-
gestion and pollution, deliver sufficient supplies
of power and potable water, provide “smart”
communications connectivity, and promote
a desirable quality of life for tens of millions
of people living and working there. In turn,
prosperity for secondary and tertiary cities,
agricultural regions, and manufacturing centers
will depend on ever more time-saving links to
nearby gateways, ports, and distribution hubs.
Among the daunting challenges:
■■ Providing the basics. In many developing
economies, including India, parts of Africa,
and elsewhere, meeting basic human needs
for potable water, wastewater treatment,
and electricity remains a challenge. Despite
its considerable progress in modernization,
China also lags in providing clean water and
municipal and industrial sewage treatment
in much of the country. Lack of this basic
infrastructure holds back economic develop-
ment, increases health problems, and re-
duces life expectancies. Even in the United
States, water shortages are leading to large
investments in new technologies such as
desalinization and the use of new tech-
niques to maintain aquifers and preserve
water tables.
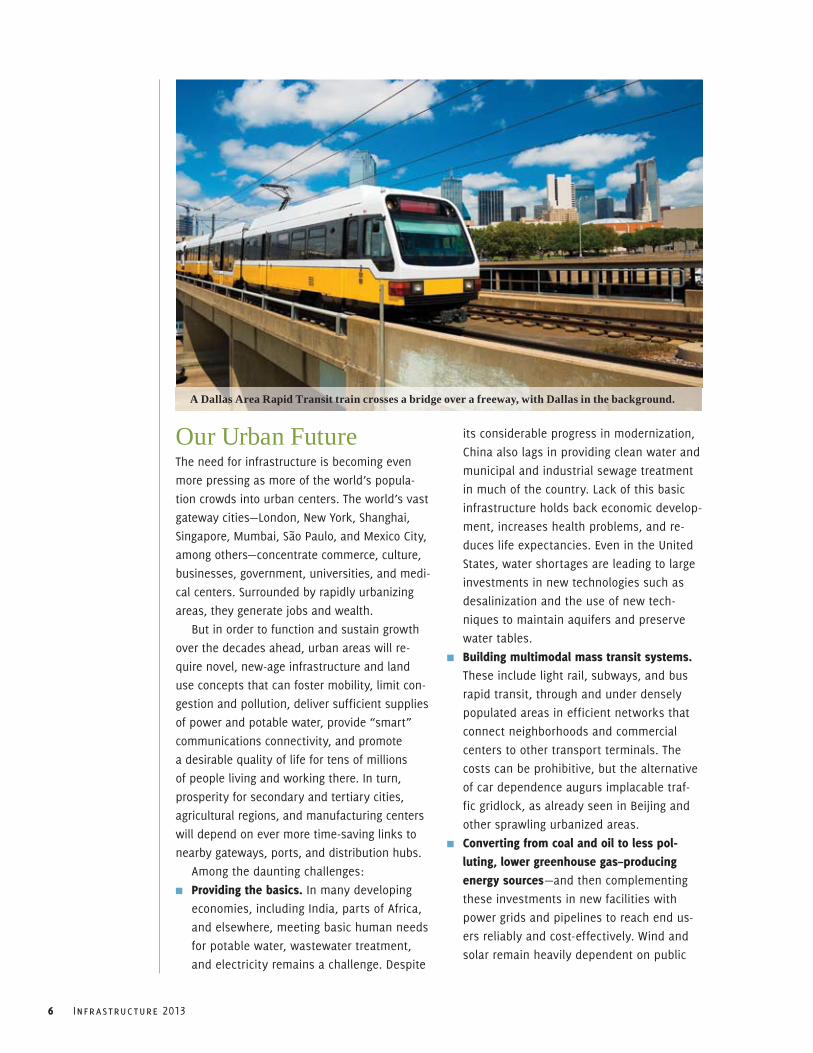
■■ Building multimodal mass transit systems. These include light rail, subways, and bus
rapid transit, through and under densely
populated areas in efficient networks that
connect neighborhoods and commercial
centers to other transport terminals. The
costs can be prohibitive, but the alternative
of car dependence augurs implacable traf-
fic gridlock, as already seen in Beijing and
other sprawling urbanized areas.
■■ converting from coal and oil to less pol-luting, lower greenhouse gas–producing energy sources.—and then complementing
these investments in new facilities with
power grids and pipelines to reach end us-
ers reliably and cost-effectively. Wind and
solar remain heavily dependent on public
A Dallas Area Rapid Transit train crosses a bridge over a freeway, with Dallas in the background.
Introduction 7
subsidies that are subject to uncertainty,
nuclear struggles to overcome its spiraling
costs and less than fail-safe reputation, and
new natural gas hydro-fracturing technolo-
gies raise environmental concerns. Simply
put, no clear choice exists and the policy
debate rages over what to do.
■■ Anticipating the next wave of communica-tions requirements to empower businesses and commerce. Yesterday’s landlines and
cables have been supplemented and may
be supplanted by wireless and broadband.
But what’s next? How can investing in the
wrong technologies be avoided, and how
can service be extended into exurban and
rural areas for a reasonable cost-benefit?
■■ Maintaining and overhauling existing infra-structure. Many once-cutting-edge highways
and sewage treatment plants built 40 and
50 years ago are reaching the end of their
life cycles. Some older bridges and water
tunnels require replacement or risk failure.
And the threat of climate change is chang-
ing the perception of existing infrastructure.
The expense of maintaining and upgrading
these systems may force many agencies
to delay or even sacrifice new initiatives
as they squeeze some additional life from
existing assets. Planning for the next gen-
eration of technologies to meet these basic
needs lags in many cases.
■■ convincing a cash-strapped public and body politic to pay increased taxes and user fees. Public acceptance will undoubtedly
be based on the promise that new projects
will eventually result in a stronger economy,
greater efficiencies, and a healthier envi-
ronment. However, in many cases large
investments have failed to yield promised
outcomes, undermining the trust needed to
authorize new taxes and user fees.
Many forms of infrastructure—particularly
water and transportation—have been heav-
ily subsidized, and the public is reacting
negatively to proposals to either continue to
underwrite escalating subsidy requirements or
pay actual costs through user fees. Extensive
cost-cutting and evolving labor/management
relationships are occurring in response to these
pressures, but long-term capital investment is
still required.
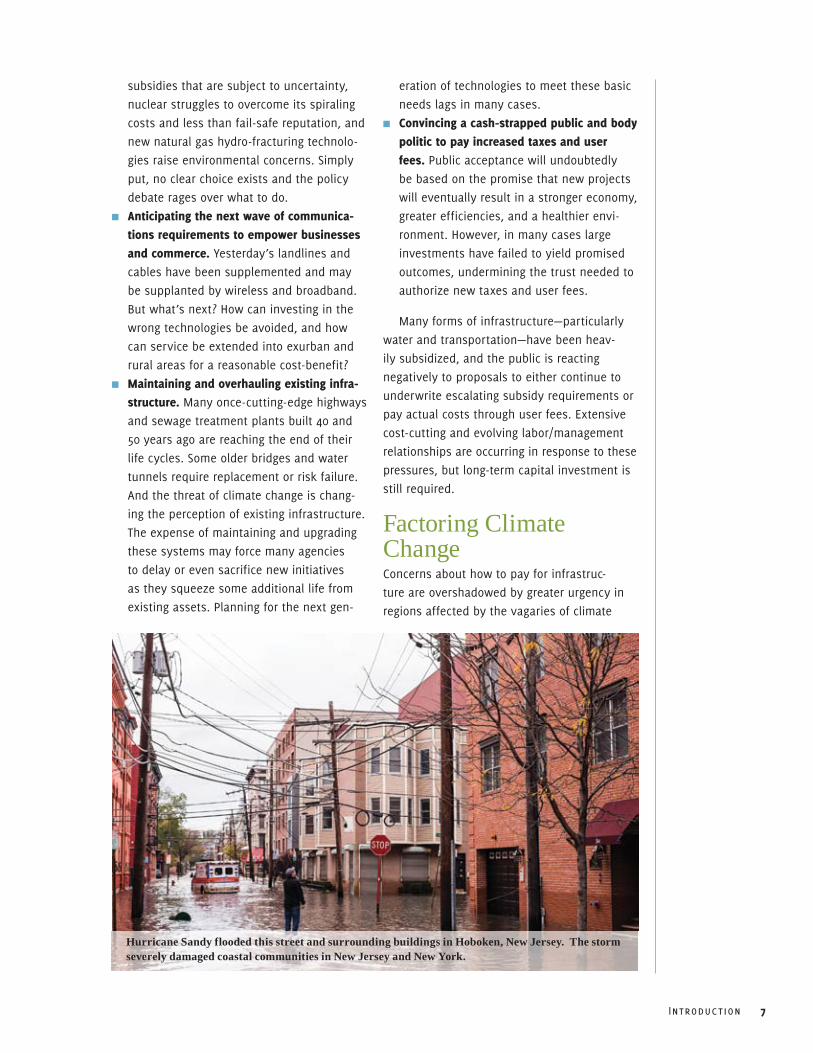
Factoring Climate Change Concerns about how to pay for infrastruc-
ture are overshadowed by greater urgency in
regions affected by the vagaries of climate
Hurricane Sandy flooded this street and surrounding buildings in Hoboken, New Jersey. The storm severely damaged coastal communities in New Jersey and New York.

8 Infrastructure 2013
change—rising sea levels, increasing incidence
of destructive storms, and enduring droughts.
In general, major coastal cities and ports
around the world must reconsider how to deal
with their susceptibility to stormwater surge
and runoff, protecting property values where
possible. With no resulting direct income
stream flowing from these preemptive invest-
ments, funding has been hard to come by. Now
that governments have experienced the costs
of environmental damage from severe weather
events, budgets for resilience measures may
become available.
In 2012, Superstorm Sandy forced New York
suddenly to contemplate multibillion-dollar
schemes like harbor barriers to protect under-
ground transport systems and vulnerable
waterfront development, including Manhattan’s
financial district. The United Kingdom won-
ders whether a second Thames River barrier is
A boy gets water from a well in Afghanistan.
Introduction 9
needed to shield London from increased threats
of flooding while moving forward with a vast
new sewage tunnel to reduce storm-related
overflows of polluting effluent into the river.
And some governments begin to ponder
abandoning development in flood-prone zones
and restoring natural wetland protections—why
keep rebuilding at considerable cost when
these projects have an increasing likelihood
of being swept away? “Resilience turns into
another level of sustainability for many cit-
ies”—they must prepare for how “to get back
in business as quickly as possible and limit
any dislocation.”
At the other end of the climate spectrum,
recent long-term droughts pose equally dif-
ficult conundrums for many regions with
growing populations facing water shortages.
These include Middle East countries, Australia,
and parts of Africa and China as well as a vast
swath in the United States extending from
Texas to California. Conservation, water recy-
cling, and precipitation-capturing technologies
(like the old-fashioned cistern) dovetail with
regional prescriptions for overcoming scarcity.
Wide-open deserts (in the western United
States, China, and northern Africa) hold prom-
ise for renewable power sources from solar
and wind, but nuclear power and natural gas
may provide more tenable energy solutions—at
least in the short term. These approaches,
however, are likely to require new, reformu-
lated, and expensive energy grids.
The Year Ahead and the Way ForwardComing to terms with these realities and re-
thinking how we can live, work, and prosper in
a rapidly evolving global order intensifies the
need for transformational infrastructure change
in many regions. But this report suggests that
countries and cities can outperform their peers
over time if they factor certain trends and strat-
egies into infrastructure decision making.
Here are a few of the report’s key takeaways:
■■ urban mobility. Global population growth,
coupled with urbanization trends, will
continue to spur infrastructure planners to
integrate transport systems in ways that
improve mobility while reducing reliance on
cars and trucks and decreasing pollution.
This often involves investing in mass tran-
sit. In some places, more operational effi-
ciency will be eked out of roads through the
creation of managed lanes, which use pric-
ing and technological innovations. Regions
will have a chance to prosper further only
when mass transit and rail hubs in increas-
ingly dense commercial centers link to air-
ports, ports, and residential neighborhoods
offering convenient access to pedestrian-
friendly shopping districts and parks.
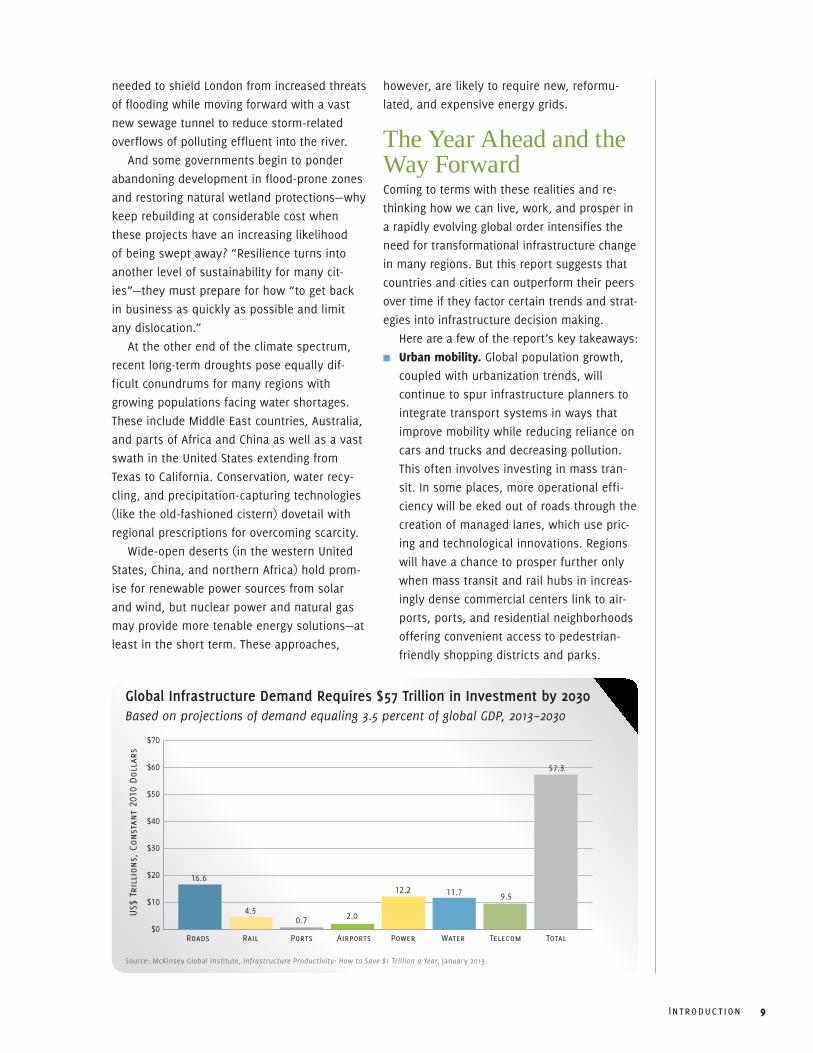
Global Infrastructure Demand Requires $57 Trillion in Investment by 2030Based on projections of demand equaling 3.5 percent of global GDP, 2013–2030
US$
Tri
llio
ns, Co
nsta
nt 2
010
Dol
lars
Roads Rail Ports Airports Power Water Telecom Total$0
$10
$20
$30
$40
$50
$60
$70
16.6
4.50.7 2.0
12.29.5
57.3
11.7
Source: McKinsey Global Institute, Infrastructure Productivity: How to Save $1 Trillion a Year, January 2013.
10 Infrastructure 2013
■■ setting priorities. The gap between available
funding and infrastructure needs should not
impinge on effective prioritizing of projects
based on economic, social, and environmen-
tal benefits. In fact, fiscal exigencies can
help put the focus on top priorities, includ-
ing maintaining existing assets. National
and regional schemes, which affect the
greater good, take precedence over local
one-off projects.
■■ Putting PPPs in context. PPPs are properly
understood as an infrastructure delivery
mechanism, best implemented after the
hard work of planning is done. For PPPs
to work, governments should fine-tune
procurement models and make the process
more efficient, encouraging the adoption
of best practices. As an example, “the
infrastructure sector is moving toward
performance contracting, where payment is
linked to results and milestones achieved
against fixed deadlines.” Successes should
engender greater public acceptance and
willingness among the public to pay for
investments.
■■ Addressing climate change. More nations
are adapting infrastructure policies to recog-
nize the negative effects of climate change.
The European Union (EU) has been a leader
in seeking to decrease carbon emissions
and engaging renewable-energy solutions,
while more recently Australia, Canada, and
Japan are making commitments to tackle
these issues in the planning and execu-
tion of new projects. China and the United
States notably continue to lag, although the
Obama administration shows signs of taking
more forceful action in its second term and
cities across the country are forging ahead
with visionary green building and invest-
ment plans.
Now well into the new century’s second
decade, the world is rethinking how infrastruc-
ture should work in a rapidly transforming
global order.
A Spectrum of ApproachesThe ULI/Ernst & Young infrastructure report re-
views infrastructure trends in the three global
areas of the Asia Pacific region, Europe/Middle
East/Africa, and the Americas for a broad view
of how national policies and approaches will
be shaped in 2013 and the years beyond.
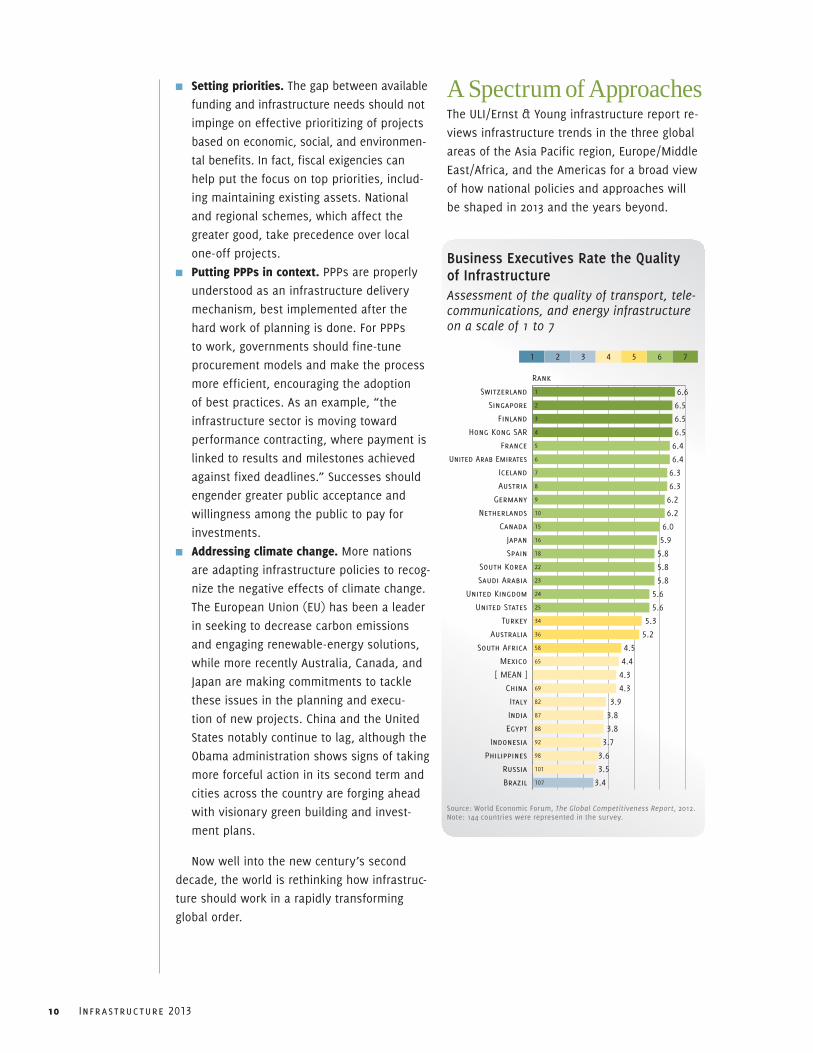
Business Executives Rate the Quality of InfrastructureAssessment of the quality of transport, tele-communications, and energy infrastructure on a scale of 1 to 7
1 2 3 4 5 6 7
Brazil
Russia
Philippines
Indonesia
Egypt
India
Italy
China
[ MEAN ]
Mexico
South Africa
Australia
Turkey
United States
United Kingdom
Saudi Arabia
South Korea
Spain
Japan
Canada
Netherlands
Germany
Austria
Iceland
United Arab Emirates
France
Hong Kong SAR
Finland
Singapore
Switzerland 1
2
3
4
5
6
7
8
9
10
15
16
18
22
23
24
25
34
36
58
65
69
82
87
88
92
98
101
107
6.6
6.5
6.5
6.5
6.4
6.4
6.3
6.3
6.2
6.2
6.0
5.9
5.8
5.8
5.8
5.6
5.6
5.3
5.2
4.5
4.4
4.3
4.3
3.9
3.8
3.8
3.7
3.6
3.5
3.4
Rank
Source: World Economic Forum, The Global Competitiveness Report, 2012. Note: 144 countries were represented in the survey.

Introduction 11
Below is a summary of how various coun-
tries are coping with the daunting infrastruc-
ture obstacles they face.
Emerging-Market Spenders Concerned about maintaining its economic
growth, china is pouring money into an already
unprecedented infrastructure building spree—
constructing high-speed rail and urban mass
transit systems throughout the country. The
high-speed rail program, which faced serious
safety and corruption issues in 2012, appears
to be getting back on track. These investments
have supported dramatic economic expan-
sion, but are adding to the country’s large debt
burdens and creating long-term liabilities for
operating subsidies and ongoing maintenance.
The country has yet to get a handle on serious
air pollution and water quality challenges.
India also recognizes that modernizing its
infrastructure should be a top priority. The
country is striving to keep up with aspirations
to become a global market heavyweight. Even
without widespread corruption, a swelling
population and severe income inequality would
make this job even harder.
Brazil, Mexico, Indonesia, the Philippines, vietnam, south Africa, and even Mongolia,
among other rapidly growing economies, try to
entice foreign investors interested in profiting
from emerging market demand and “possibly
igniting a more robust worldwide recovery” in
the process. These emerging-market forays are
“not for the fainthearted—investors must worry
about sovereign risk” and seek premium returns,
which government partners find hard to muster
in order to nail down commitments. “Operators
want assurance that agreements will be adhered
to”—a high hurdle in places that have real or
perceived political and regulatory issues.
Flush with cash, the Middle east gulf states have the luxury to spend freely in order to
diversify their energy-based economies into
trading hubs. The sustainability of the huge
asset bases being built remains an open ques-
tion. And other regional players caught up in
the Arab Spring face problematic outlooks for
executing needed projects.
This popular Saigon district in Ho Chi Minh City, Vietnam, is full of shops, bars, and guesthouses.
12 Infrastructure 2013
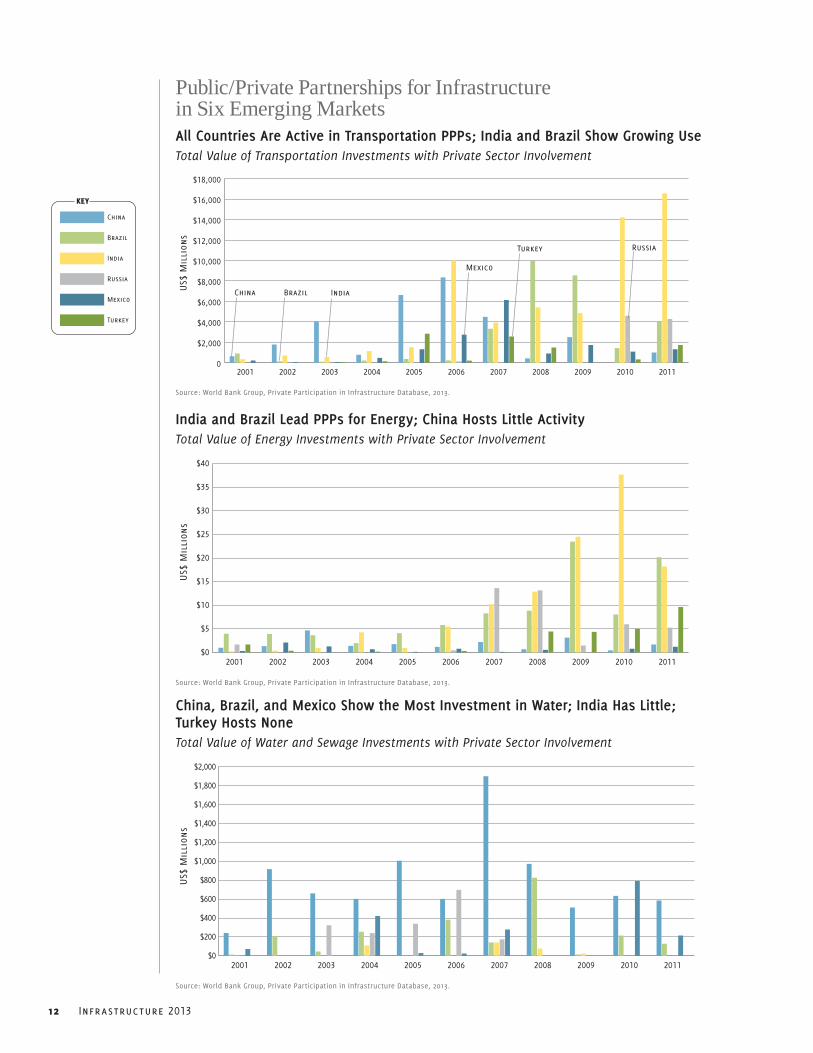
Public/Private Partnerships for Infrastructure in Six Emerging MarketsAll Countries Are Active in Transportation PPPs; India and Brazil Show Growing UseTotal Value of Transportation Investments with Private Sector Involvement
0
$2,000
$4,000
$6,000
$8,000
$10,000
$12,000
$14,000
$16,000
$18,000
20112010200920082007200620052004200320022001
US$
Mil
lion
s
China Brazil India
Russia
Mexico
Turkey
Source: World Bank Group, Private Participation in Infrastructure Database, 2013.
India and Brazil Lead PPPs for Energy; China Hosts Little ActivityTotal Value of Energy Investments with Private Sector Involvement
$0
$5
$10
$15
$20
$25
$30
$35
$40
20112010200920082007200620052004200320022001
US$
Mil
lion
s
Source: World Bank Group, Private Participation in Infrastructure Database, 2013.
China, Brazil, and Mexico Show the Most Investment in Water; India Has Little; Turkey Hosts NoneTotal Value of Water and Sewage Investments with Private Sector Involvement
$0
$200
$400
$600
$800
$1,000
$1,200
$1,400
$1,600
$1,800
$2,000
20112010200920082007200620052004200320022001
US$
Mil
lion
s
Source: World Bank Group, Private Participation in Infrastructure Database, 2013.
Turkey
Mexico
Russia
India
Brazil
China
KEY
Introduction 13
Constrained by Austerity Over the past two decades, Europe has made
significant strides in building out motorways
and laying track for impressive high-speed
passenger rail systems, as the European Union
prioritized connectivity projects and funneled
funds into poorer eastern countries to boost
their prospects. Now, the unsettling aftershocks
of the European credit debacle have short-
circuited many initiatives, as countries rein in
spending and deal with paying down debt.
In the united Kingdom, public support for
infrastructure grows behind a national plan.
The government sets an ambitious agenda to
advance railroad, airport, and energy agendas,
but finding enough money stands in the way
of full execution. Reassessments of prior trans-
actions have led to a stronger public finance
role in “private” undertakings.
Despite fiscal constraints, france continues
to expand its high-speed rail system, improv-
ing connectivity across the country, and makes
investments in roads and canals. The infra-
structure picture in spain is more troubling,
with most major plans grinding to a halt, a
spate of bankruptcy declarations in toll roads,
and rethinking of subsidies provided for alter-
native energy.
Only germany can afford to hold back on
infrastructure investments. Sitting at Europe’s
crossroads, the European mainstay’s modern-
ized transport networks have benefited from
steady investment in maintaining and improv-
ing new and expanded airports and ports.
Digging Deeper In Asia, Japan—bogged down by 20 years of
stagnation and debt—takes the opposite tack.
The new government doubles down on more
infrastructure stimulus to try to pump up the
moribund economy and deal with the damage
wrought by the tsunami.
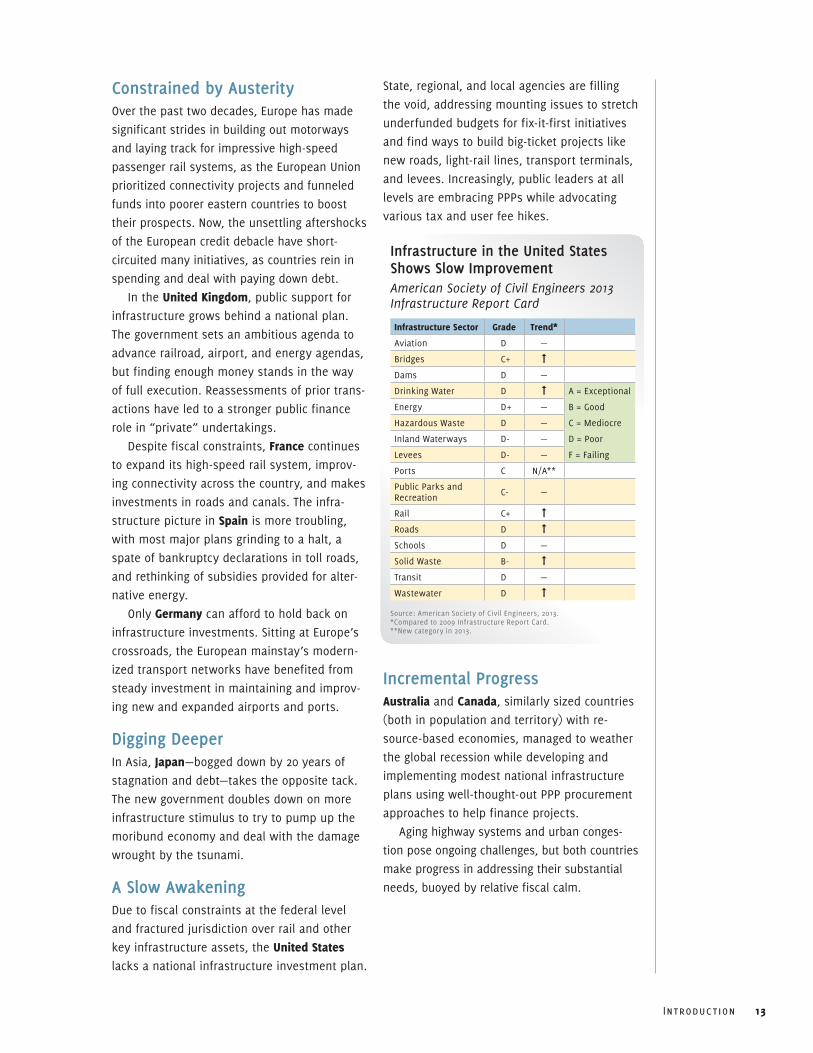
A Slow Awakening Due to fiscal constraints at the federal level
and fractured jurisdiction over rail and other
key infrastructure assets, the united states lacks a national infrastructure investment plan.
State, regional, and local agencies are filling
the void, addressing mounting issues to stretch
underfunded budgets for fix-it-first initiatives
and find ways to build big-ticket projects like
new roads, light-rail lines, transport terminals,
and levees. Increasingly, public leaders at all
levels are embracing PPPs while advocating
various tax and user fee hikes.
Incremental Progress Australia and canada, similarly sized countries
(both in population and territory) with re-
source-based economies, managed to weather
the global recession while developing and
implementing modest national infrastructure
plans using well-thought-out PPP procurement
approaches to help finance projects.
Aging highway systems and urban conges-
tion pose ongoing challenges, but both countries
make progress in addressing their substantial
needs, buoyed by relative fiscal calm.
Infrastructure in the United States Shows Slow ImprovementAmerican Society of Civil Engineers 2013 Infrastructure Report Card
Infrastructure sector grade trend*
Aviation D —
Bridges C+ ➞
Dams D —
Drinking Water D ➞ A = Exceptional
Energy D+ — B = Good
Hazardous Waste D — C = Mediocre
Inland Waterways D- — D = Poor
Levees D- — F = Failing
Ports C N/A**
Public Parks and Recreation C- —
Rail C+ ➞
Roads D ➞Schools D —
Solid Waste B- ➞
Transit D —
Wastewater D ➞
Source: American Society of Civil Engineers, 2013. *Compared to 2009 Infrastructure Report Card. **New category in 2013.
1Part
14 Infrastructure 2013
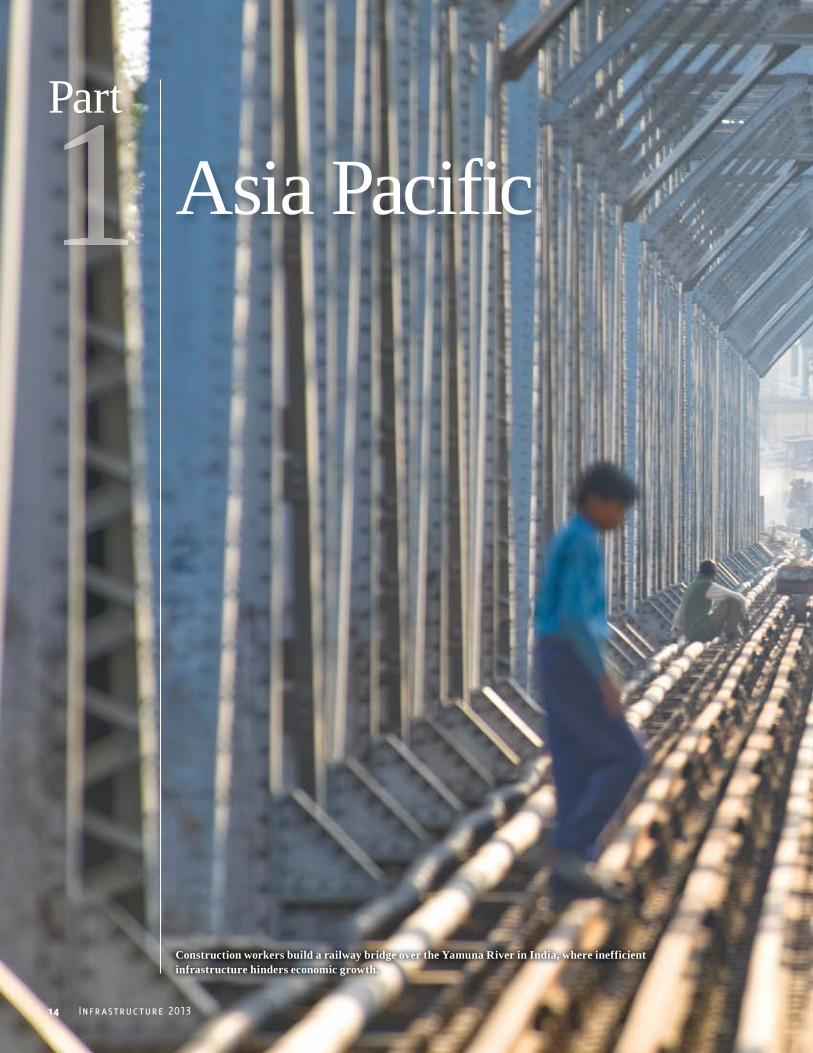
Asia Pacific
Construction workers build a railway bridge over the Yamuna River in India, where inefficient infrastructure hinders economic growth.
Part 1 | Asia Pacific 15
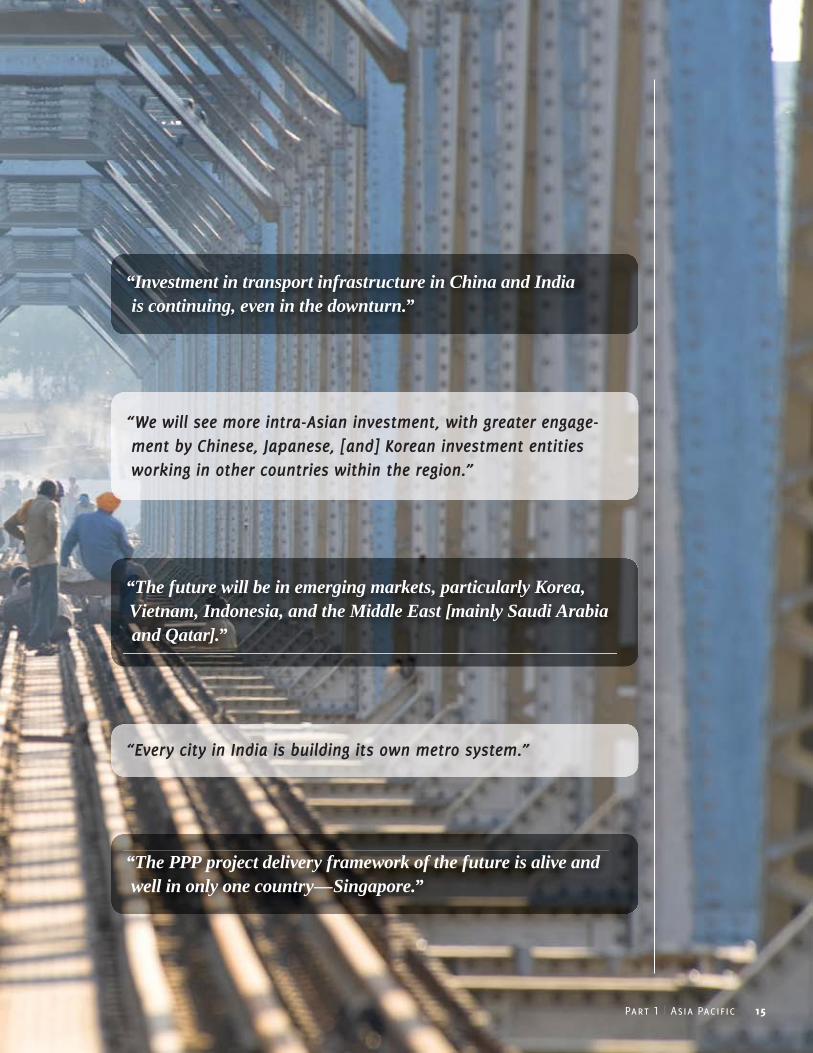
“Every city in India is building its own metro system.”
“We will see more intra-Asian investment, with greater engage-ment by Chinese, Japanese, [and] Korean investment entities working in other countries within the region.”
“Investment in transport infrastructure in China and India is continuing, even in the downturn.”
“The future will be in emerging markets, particularly Korea, Vietnam, Indonesia, and the Middle East [mainly Saudi Arabia and Qatar].”
“The PPP project delivery framework of the future is alive and well in only one country—Singapore.”
16 Infrastructure 2013
Hong KongS.A.R.
CHINA
AUSTRALIA
INDIA
AFGHANISTAN
VIETNAM
JAPAN
CAMBODIA
EAST TIMOR
MALAYSIA
MALAYSIA
BRUNEI
SRILANKA
BANGLADESH
TAJIKISTAN
BHUTAN
KYRGYZSTAN
TAIWAN
SINGAPORE
NORTHKOREA
SOUTHKOREA
LAOS
THAILANDPHILIPPINES
INDONESIA
PAPUANEW GUINEA
MYANMAR(BURMA)
PAKISTAN NEPAL
KAZAKHSTAN
UZBEKISTANTURKMENISTAN
MONGOLIA
05
10152025303540
80%
Suzhou
05
10152025303540
78%
Hefei05
10152025303540
71%
Ürümqi (Wulumqi)
05
10152025303540
70%
Surat
05
10152025303540
68%
Kabul
05
10152025303540
63%
Hangzhou
05
10152025303540
60%
Wuxi
05
10152025303540
59%
Bangalore
05
10152025303540
58%
Zhengzhou
05
10152025303540
58%
Chittagong05
10152025303540
58%
Foshan
05
10152025303540
57%
Thành Pho Ho Chí Minh (Ho Chi Minh City)
05
10152025303540
56%
Chengdu
05
10152025303540
55%
Ahmedabad
05
10152025303540
54%
Hyderabad
53%
Dhaka05
10152025303540
05
10152025303540
52%
Lahore
05
10152025303540
52%
Shenzhen
05
10152025303540
51%
Pune (Poona)
05
10152025303540
51%
Beijing
05
10152025303540
50%
Chennai (Madras)
05
10152025303540
20252010
50%
Nanjing
05
10152025303540
50%
Karachi
05
10152025303540
50%
Delhi
43%
Wuhan05
10152025303540
44%
Shantou05
10152025303540
44%
Changchun05
10152025303540
43%
Xi'an, Shaanxi05
10152025303540
Jinan05
10152025303540
49%
Qingdao05
10152025303540
48%
Yangon05
10152025303540
46%
45%
Shanghai05
10152025303540
Chongqing05
10152025303540
40% Tianjin05
10152025303540
40%
Manila05
10152025303540
40%
37%
Bangkok05
10152025303540
Singapore05
10152025303540
14%
5%
Osaka-Kobe05
10152025303540
1%
Seoul05
10152025303540
5%
Tokyo05
10152025303540
Mumbai (Bombay)05
10152025303540
37%
Shenyang05
10152025303540
36%
05
10152025303540
34%
Dongguan
Jakarta05
10152025303540
33%
Kolkata (Calcutta)05
10152025303540
31%
Sydney05
10152025303540
26%
Hong Kong05
10152025303540
16%
05
10152025303540
48%
Guangzhou
05
10152025303540
49%
Harbin
2025
2010
Popu
lati
on i
n M
illi
ons
2010 –2025 GROWTH %
KEY
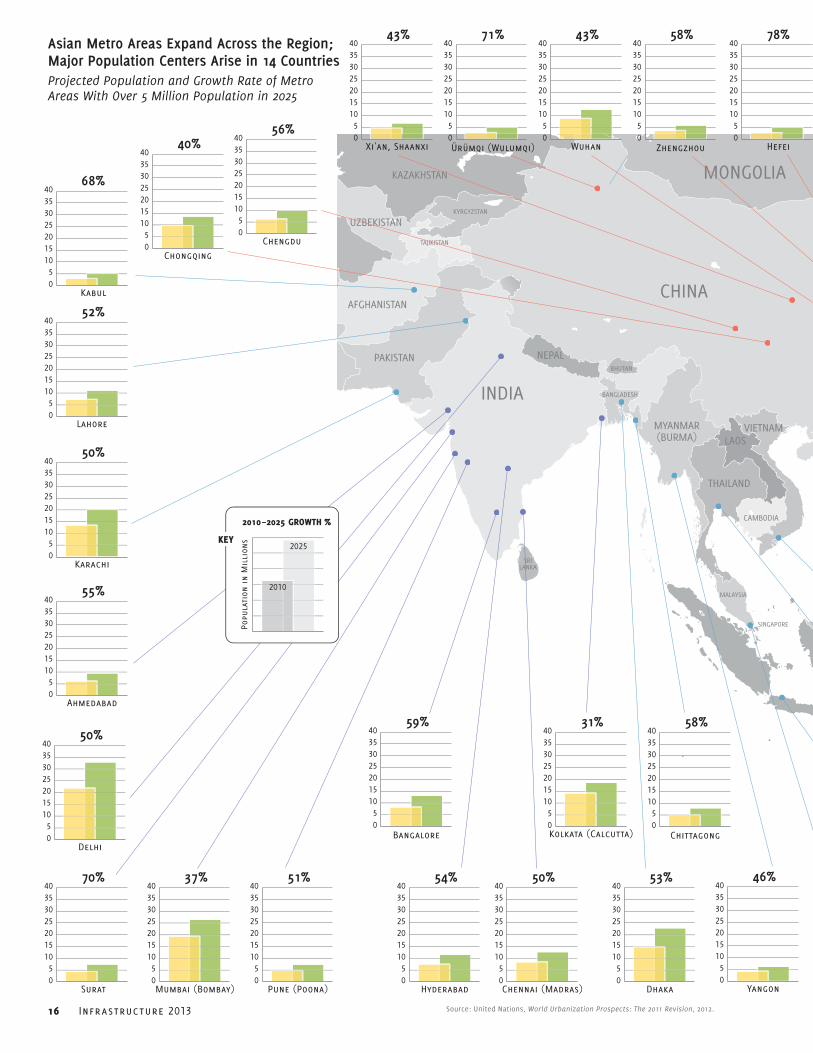
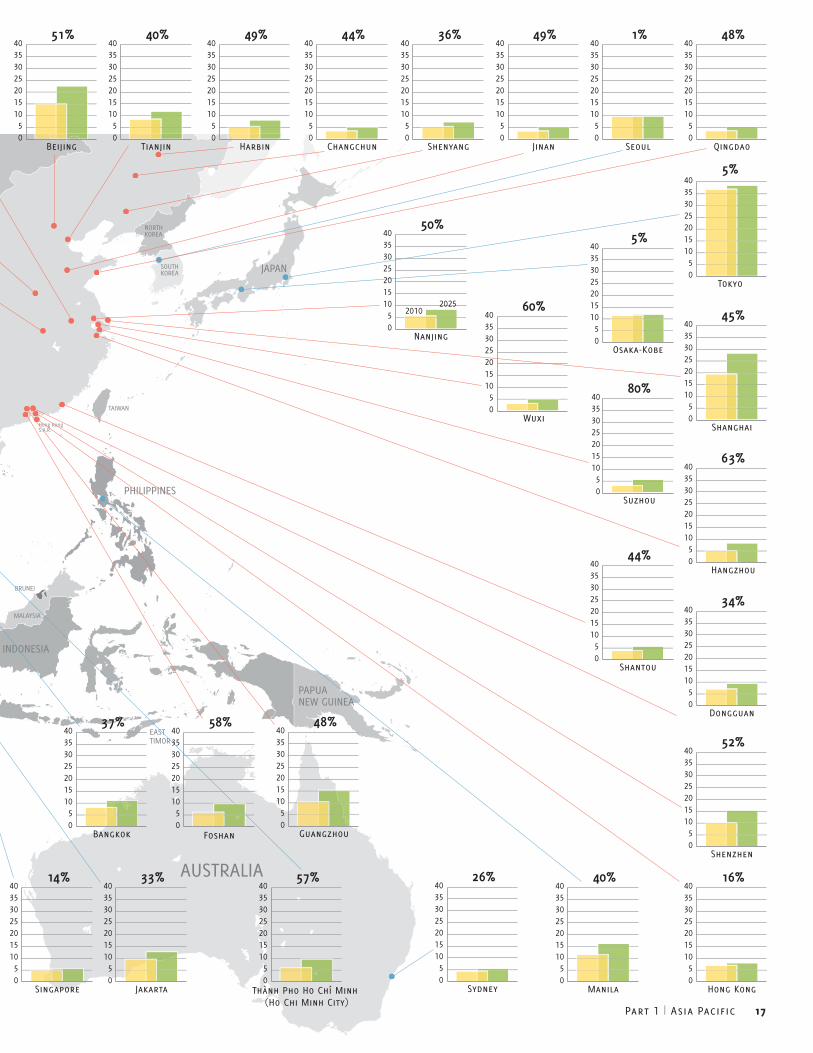
Asian Metro Areas Expand Across the Region; Major Population Centers Arise in 14 CountriesProjected Population and Growth Rate of Metro Areas With Over 5 Million Population in 2025
Source: United Nations, World Urbanization Prospects: The 2011 Revision, 2012.
Hong KongS.A.R.
CHINA
AUSTRALIA
INDIA
AFGHANISTAN
VIETNAM
JAPAN
CAMBODIA
EAST TIMOR
MALAYSIA
MALAYSIA
BRUNEI
SRILANKA
BANGLADESH
TAJIKISTAN
BHUTAN
KYRGYZSTAN
TAIWAN
SINGAPORE
NORTHKOREA
SOUTHKOREA
LAOS
THAILANDPHILIPPINES
INDONESIA
PAPUANEW GUINEA
MYANMAR(BURMA)
PAKISTAN NEPAL
KAZAKHSTAN
UZBEKISTANTURKMENISTAN
MONGOLIA
05
10152025303540
80%
Suzhou
05
10152025303540
78%
Hefei05
10152025303540
71%
Ürümqi (Wulumqi)
05
10152025303540
70%
Surat
05
10152025303540
68%
Kabul
05
10152025303540
63%
Hangzhou
05
10152025303540
60%
Wuxi
05
10152025303540
59%
Bangalore
05
10152025303540
58%
Zhengzhou
05
10152025303540
58%
Chittagong05
10152025303540
58%
Foshan
05
10152025303540
57%
Thành Pho Ho Chí Minh (Ho Chi Minh City)
05
10152025303540
56%
Chengdu
05
10152025303540
55%
Ahmedabad
05
10152025303540
54%
Hyderabad
53%
Dhaka05
10152025303540
05
10152025303540
52%
Lahore
05
10152025303540
52%
Shenzhen
05
10152025303540
51%
Pune (Poona)
05
10152025303540
51%
Beijing
05
10152025303540
50%
Chennai (Madras)
05
10152025303540
20252010
50%
Nanjing
05
10152025303540
50%
Karachi
05
10152025303540
50%
Delhi
43%
Wuhan05
10152025303540
44%
Shantou05
10152025303540
44%
Changchun05
10152025303540
43%
Xi'an, Shaanxi05
10152025303540
Jinan05
10152025303540
49%
Qingdao05
10152025303540
48%
Yangon05
10152025303540
46%
45%
Shanghai05
10152025303540
Chongqing05
10152025303540
40% Tianjin05
10152025303540
40%
Manila05
10152025303540
40%
37%
Bangkok05
10152025303540
Singapore05
10152025303540
14%
5%
Osaka-Kobe05
10152025303540
1%
Seoul05
10152025303540
5%
Tokyo05
10152025303540
Mumbai (Bombay)05
10152025303540
37%
Shenyang05
10152025303540
36%
05
10152025303540
34%
Dongguan
Jakarta05
10152025303540
33%
Kolkata (Calcutta)05
10152025303540
31%
Sydney05
10152025303540
26%
Hong Kong05
10152025303540
16%
05
10152025303540
48%
Guangzhou
05
10152025303540
49%
Harbin
2025
2010
Popu
lati
on i
n M
illi
ons
2010 –2025 GROWTH %
KEY
Part 1 | Asia Pacific 17
18 Infrastructure 2013
Paced by china, many Asian nations continue to make infrastructure development
a high priority, building out some of the most advanced and integrated systems in
the world. From Tokyo to Beijing to Seoul and Singapore, efficient new internation-
al airport terminals connect by high-speed rail to center-city commercial districts
and state-of-the-art mass transit lines link to residential neighborhoods.
Some observers question whether China
has overextended itself by constructing far-
flung intercity high-speed rail lines and ex-
pressways, while still lacking basic water and
sewage treatment systems in many regions.
But China’s infrastructure push is not over,
and continues both inside the country and
outside of it.
India plays catch-up, needing more foreign
investment not only to meet the demands of
an exploding population, but also to realize the
potential for expanding its manufacturing and
service sector industries, which cope with daily
power brownouts and transportation chaos.
Indonesia faces similar emerging-market grow-
ing pains—remedying Jakarta’s traffic gridlock
takes on particular urgency.
Japan, a perennial leader in infrastructure
innovation, is adding to its prodigious govern-
ment debt in rebuilding the region devastated
by the 2011 earthquake and tsunami, and aims
to use fiscal stimulus to jump-start an ailing
economy. And Australia faces challenges more
similar to those faced by Europe and North
America in dealing with how to revamp once-
advanced systems that no longer support its
heavily export-dependent economy.
China Rising labor costs and tepid demand from
China’s primary export markets slacken the
“Middle Kingdom’s” once-torrid economic
growth track from a fairly consistent, govern-
ment-reported 10 percent or more annually to
under 8 percent at year-end 2012—still solid,
but a 13-year low. In response, the central
government of the Asian manufacturing behe-
moth returns to its familiar stimulus playbook,
Insights about the Asia Pacific Region from Infrastructure 2013 Interviewees Across the region, infrastructure is being affected by global forces.
Finances are a major source of worry in India, as inter-national funding is limited.
We are now seeing significant investment from global infrastructure players into the Australian market.
The Eurozone and the U.S. economy are having an impact on the infrastructure sector in India. They directly affect the general economy, and also specific sectors such as railway freight. We are an integrated and globalized coun-try—slowdowns in larger and more developed economies affect our exports and imports and growth rate.
Interviewees are concerned about water in china and India.
In China, water resources are scarce and the quality of the water is seriously affecting the living level of the entire nation.
In India, water will become a major issue in coming years. India is at a very early stage for municipal water and waste treatment.
In China, water-based projects—water treatment, ac-cess to potable water, droughts, and flood control—all deserve more attention and investment.
energy and power are other key areas of need and investment in china and India.
In India, a demand/supply mismatch for energy, with demand in urban areas soaring and inadequate supply, caused in part by inadequate coal supplies, caused the grid to collapse, cutting power to 600 million people for two days. This event is spurring a call for privatized distribution.
The biggest issues for infrastructure delivery in India include fuel supply in the power sector, as well as envi-ronmental clearances.
Part 1 | Asia Pacific 19
fast-tracking 60 infrastructure projects with
cumulative price tags of $158 billion and sig-
naling that more allocations may follow during
the year.
In fact, infrastructure may be one of the
country’s key growth drivers in 2013, employing
hundreds of thousands of laborers who might
otherwise be out of work, supporting myriad
manufacturers including steel companies and
machine makers, and sustaining regional and
local governments in the expansion of various
road, rail, and subway projects. As a result,
“China will continue to outpace everywhere
else” in infrastructure spending and building.
Indeed, over the past 20 years, trillions of
dollars’ worth of infrastructure investment has
transformed China into an exemplar of modern
urban transit, expansive highways, vanguard
high-speed intercity rail, and highly efficient
ocean ports. Late in 2012, the longest high-
Power is and will remain the major sector for investment in India, accounting for one-third of total investment. Major investments in renewables are included in the lat-est five-year plan.
Clean energy will claim the lion’s share of infrastructure investment in China in the future.
Australian infrastructure is challenged by construc-tion costs and planning issues, and approaches are evolving.
In Australia, a major issue is the cost of delivering infrastructure.
In Australia, we are starting to see less focus on politi-cally friendly projects and much greater focus on project selection and prioritization of projects in accordance with proper economic investment guidelines and objectives.
Privatizations and user charging are the two key solutions that we are looking at in Australia.
We are certainly seeing that we have a much better re-sourced and informed government sector, which has hired private sector expertise, has created greater policy har-monization across the country, and is sharing knowledge and experience much more freely.
countries in the region are paying attention to the impacts of urbanization and climate change.
Future infrastructure investment in China needs to be more sustainable, more low-carbon, and more efficient, with higher quality and lower pollution.
With regard to climate change, in Australia we certainly see that it has spurred the emergence of new projects such as desalination and wind farms. However, weather delays here have also played a significant role in cost and time overruns on major projects, which have led to substantial losses being incurred!
Land acquisition and eminent domain are major concerns in India, with population pressures leading to an empha-sis on projects that use less land.
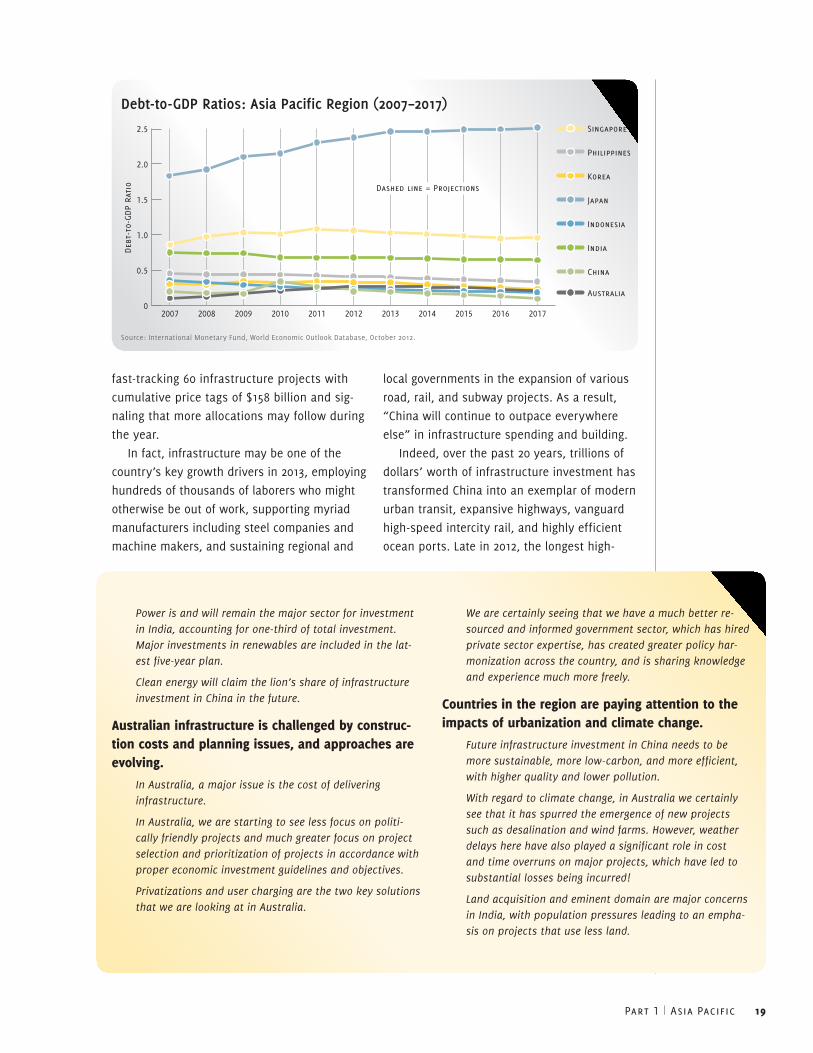
Debt-to-GDP Ratios: Asia Pacific Region (2007–2017)
0
0.5
1.0
1.5
2.0
2.5 Singapore
Philippines
Korea
Japan
Indonesia
India
China
Australia
20172016201520142013201220112010200920082007
Deb
t-to
-GDP
Rati
o Dashed line = Projections
Source: International Monetary Fund, World Economic Outlook Database, October 2012.
20 Infrastructure 2013
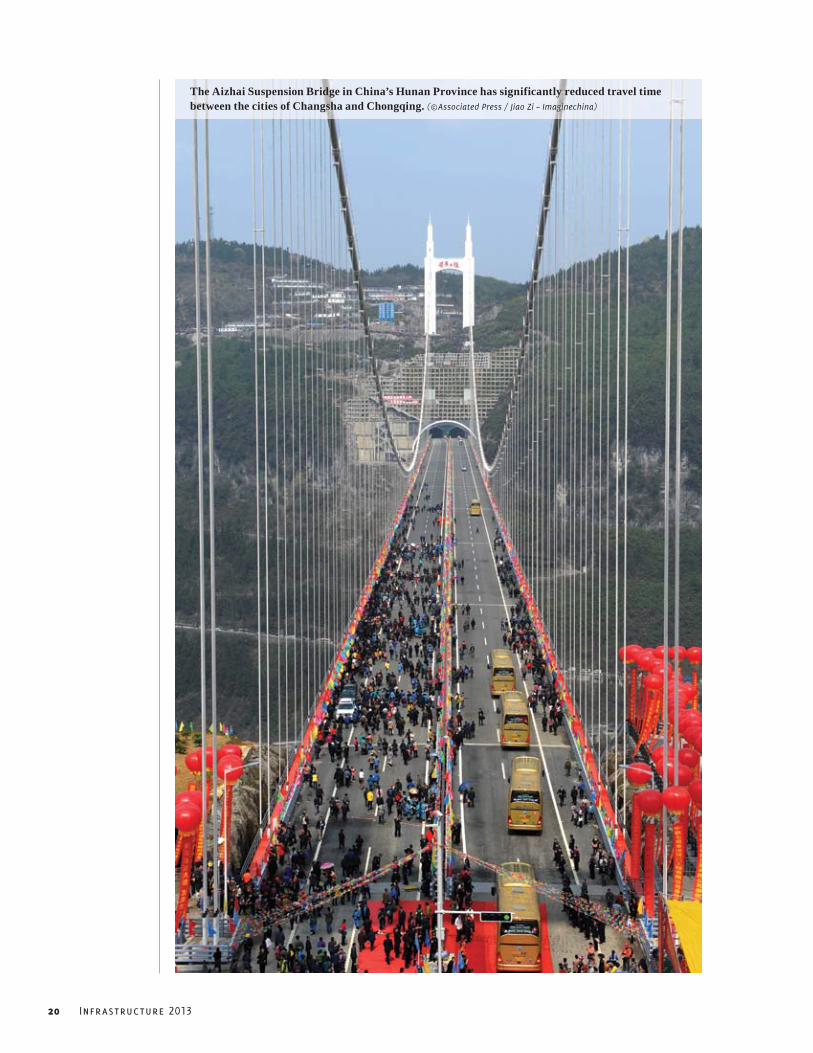
The Aizhai Suspension Bridge in China’s Hunan Province has significantly reduced travel time between the cities of Changsha and Chongqing. (©Associated Press / Jiao Zi – Imaginechina)
Part 1 | Asia Pacific 21
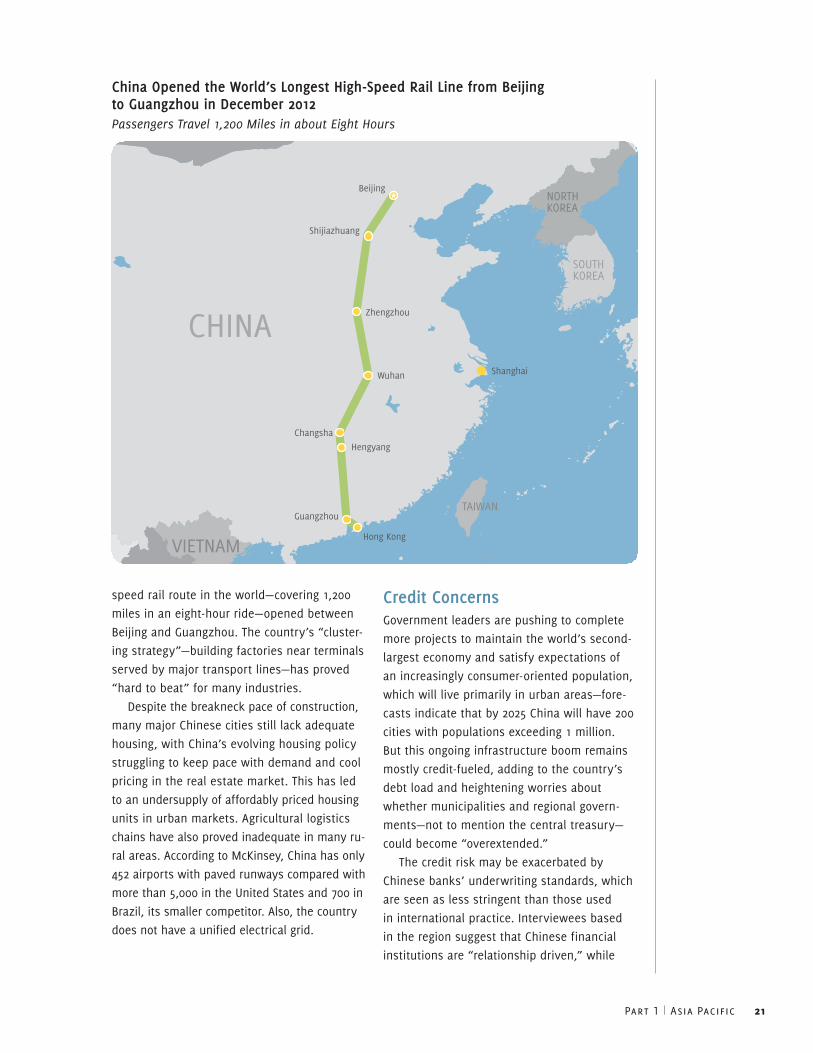
speed rail route in the world—covering 1,200
miles in an eight-hour ride—opened between
Beijing and Guangzhou. The country’s “cluster-
ing strategy”—building factories near terminals
served by major transport lines—has proved
“hard to beat” for many industries.
Despite the breakneck pace of construction,
many major Chinese cities still lack adequate
housing, with China’s evolving housing policy
struggling to keep pace with demand and cool
pricing in the real estate market. This has led
to an undersupply of affordably priced housing
units in urban markets. Agricultural logistics
chains have also proved inadequate in many ru-
ral areas. According to McKinsey, China has only
452 airports with paved runways compared with
more than 5,000 in the United States and 700 in
Brazil, its smaller competitor. Also, the country
does not have a unified electrical grid.
Credit ConcernsGovernment leaders are pushing to complete
more projects to maintain the world’s second-
largest economy and satisfy expectations of
an increasingly consumer-oriented population,
which will live primarily in urban areas—fore-
casts indicate that by 2025 China will have 200
cities with populations exceeding 1 million.
But this ongoing infrastructure boom remains
mostly credit-fueled, adding to the country’s
debt load and heightening worries about
whether municipalities and regional govern-
ments—not to mention the central treasury—
could become “overextended.”
The credit risk may be exacerbated by
Chinese banks’ underwriting standards, which
are seen as less stringent than those used
in international practice. Interviewees based
in the region suggest that Chinese financial
institutions are “relationship driven,” while
China Opened the World’s Longest High-Speed Rail Line from Beijing to Guangzhou in December 2012Passengers Travel 1,200 Miles in about Eight Hours
Hong Kong
Beijing
Zhengzhou
Wuhan Shanghai
Changsha
Hengyang
Guangzhou
Shijiazhuang
CHINA
VIETNAM
JAPAN
CAMBODIA
BANGLADESH
BHUTAN
TAIWAN
NORTHKOREA
SOUTHKOREA
LAOS
THAILANDPHILIPPINES
MYANMAR(BURMA)
NEPAL
MONGOLIA

22 Infrastructure 2013
other bankers appear more stringent—“looking
at projected revenue streams, insurance, and
proper credit.” For Chinese projects, “there’s
also a sense that the debt burdens are greater
than the revenues from toll roads, power
stations, and train lines,” but it is hard to tell
given limited and often inscrutable government
information.
These concerns mount just as some neigh-
bors, including Vietnam and Indonesia, begin
to compete against China at cheaper manu-
facturing price points, and even U.S. factories
regain some favor due to a combination of
lower energy and shipping bills. How long can
China maintain its infrastructure spending
spree in the face of debt burdens and competi-
tive realities?
Big GoalsQuality-control issues and fast-paced con-
struction have also resulted in several notable
examples of construction issues and system
failures, including a handful of high-speed rail
and subway crashes. With nearly 6,000 miles
of high-speed lines beginning operation in just
the last five years, “quantity over quality has
some consequences, but this is part of their
learning process. When you do so much so
fast, there will be bigger issues, but overall,
good results have pushed growth.” A longer-
term sustainability issue will be how well
the challenges of ongoing operations, main-
tenance, and capital asset renewal will be met
for the rapidly expanding infrastructure base.
Among China’s latest high-profile projects:
■■ shanghai commercial and transportation hub. The Hongqiao Transport Hub, a massive
shopping mall and commercial entertain-
ment center connected to major transporta-
tion links, will serve a staggering 75 million
people within its high-speed rail lines’
catchment zone.
■■ Asian rail connections. A web of new rail
lines is taking shape to connect with neigh-
bors—Thailand, Myanmar, Vietnam, Laos,
and Cambodia. The lines are designed to
extend China’s regional economic clout and
provide additional access points for trade,
particularly from nearby ports.
■■ Western train connections. A 107-mile rail
track construction program is proceeding
across three provinces in western China.
■■ urban transit expansions. Twenty-seven
subway-building programs are proceeding,
including expansions of transit systems in
Guangzhou and Shanghai.
A high-speed train speeds by a cluster of residential apartment buildings in Shanghai, China. (©Associated Press / Xu Hede – Imaginechina)
Part 1 | Asia Pacific 23
■■ Airports. Construction is advancing on 82
new airports and the refurbishment of 100
others by 2015.
■■ rural highways. Expansion of rural road net-
works is continuing to connect all cities with
populations exceeding 200,000, bringing the
country’s total highway network to nearly 2
million miles by 2020.
China continues to struggle with industrial-
and car-related air pollution, as well as a lack
of potable water caused in part by inadequate
sewage treatment and runoff of factory- and
agriculture-related contaminants. Recent
droughts and stepped-up industrial demand
are further straining water supplies in many
areas. Political pressure to address these is-
sues will build, requiring greater investment
in water treatment facilities, strategies for
dealing with vehicle congestion, and altering
dependence on dirty carbon fuels like coal and
oil. China may be fertile territory for employing
hydro-fracturing technologies to secure natural
gas reservoirs, and the country is becoming a
world leader in wind power.
Foreign infrastructure companies continue
to face high barriers to entry, often participat-
ing only when domestic players lack expertise
as minority partners with Chinese state-owned
enterprises. Power- and water-related projects
offer the most favorable opportunities, but
many offshore companies are growing wary of
the lack of transparency, and voice concerns
about Chinese partners appropriating their pro-
prietary business practices and technologies.
JapanIn a familiar gambit for Japan, the country’s
new conservative Liberal Democratic govern-
ment is looking to public works spending to
jump-start the economy, which has stagnated
for more than two decades.
An “enormous” $215 billion stimulus pack-
age will focus on creating jobs and reviving
the tsunami-ravaged Fukushima region, which
lies northeast of Tokyo. Thanks to an ongoing
stream of generous government allocations,
Japan already features some of the world’s
most advanced, state-of-the-art transportation
infrastructure including integrated high-speed
rail, subways, and airports.
But infrastructure spending to fund corpo-
rate enterprise and keep people working has
created overcapacity in some regions, as the
country’s population ages dramatically and
promises to shrink over the next generation.
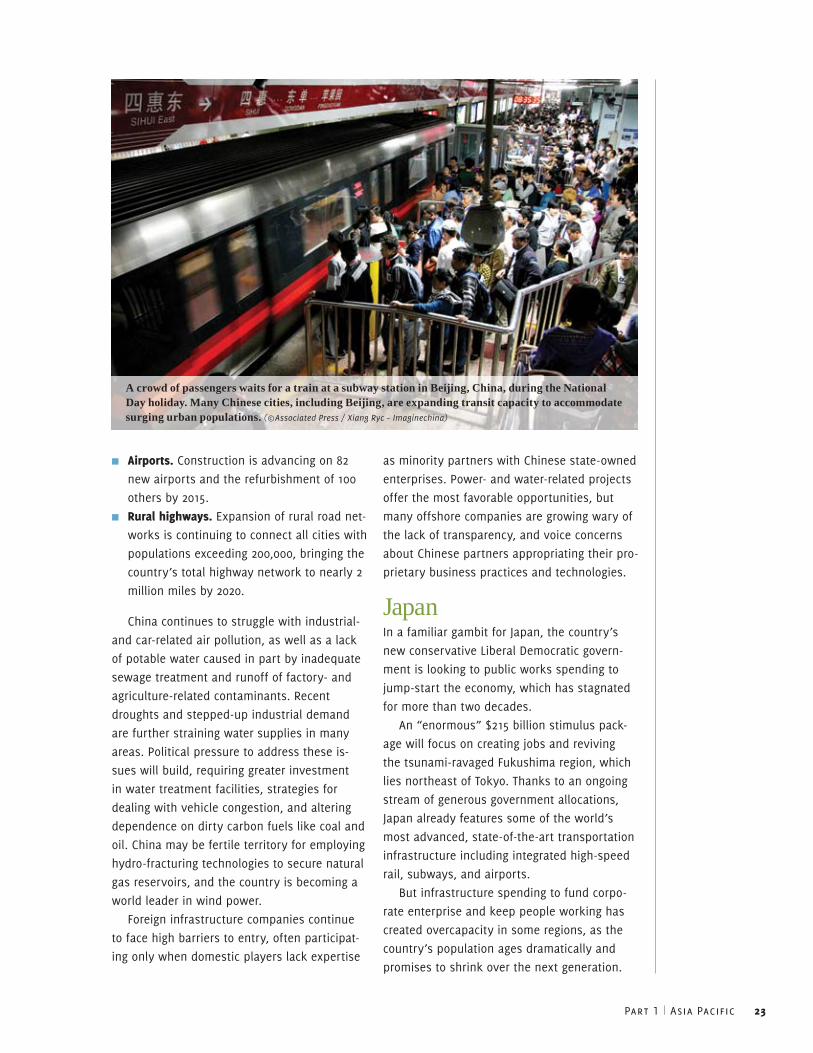
A crowd of passengers waits for a train at a subway station in Beijing, China, during the National Day holiday. Many Chinese cities, including Beijing, are expanding transit capacity to accommodate surging urban populations. (©Associated Press / Xiang Ryc – Imaginechina)
24 Infrastructure 2013
At the same time, population concentrations
in Tokyo and a handful of other major cities
worsen congestion, requiring new ring roads
and upgrading of aging overpasses, bridges,
and tunnels.
Public debt now equals more than two
times national output, and Japan ranked as
the world’s most indebted major economy
even before this new round of spending.
Unquestionably, past highway projects—many
of which offered limited mobility benefits—
have contributed to these ballooning credit
problems.
Substantial public deficits likely will force
the government to privatize more infrastruc-
ture assets to cover costs and deal with
debt-service burdens. The two airports serving
Osaka are looking to raise as much as $15
billion from a private operator to manage the
facilities over the next 40 to 50 years. If a
deal can be reached in Osaka, other airport
privatizations may follow and serve as models
for PPPs on other infrastructure franchises,
including a project for underground tunnels to
replace elevated expressways in Tokyo.
Japan’s dependence on foreign oil, coupled
with growing antinuclear sentiment following
the Fukushima reactor accidents, places new
urgency on finding renewable-energy alterna-
tives. The Japan Renewable Energy Foundation
is working toward creating a high-voltage
supergrid to supply not only Japan, but also
other Asian countries. Its first project is a 300-
MW wind farm in Mongolia’s Gobi Desert set
to become operational next year. Japan is also
putting a lot of resources into tapping deep-
water natural gas resources.
IndiaIn India, “indisputable need” and “significant
potential” collide with inefficiency, corrup-
tion, and unbridled population growth and
urbanization.
For all its high-profile infrastructure projects
in recent years—a national highway system
connecting its four largest cities; modern
airports; subways in New Delhi, Bangalore,
and soon Mumbai as well as Hyderabad; and
a score of major power projects—the country
chronically struggles to meet the needs of an
economy that has been growing at a heady 7
percent annual clip. In fact, analysts suggest
that infrastructure bottlenecks prune gross
domestic product (GDP) by at least 2 percent
annually.
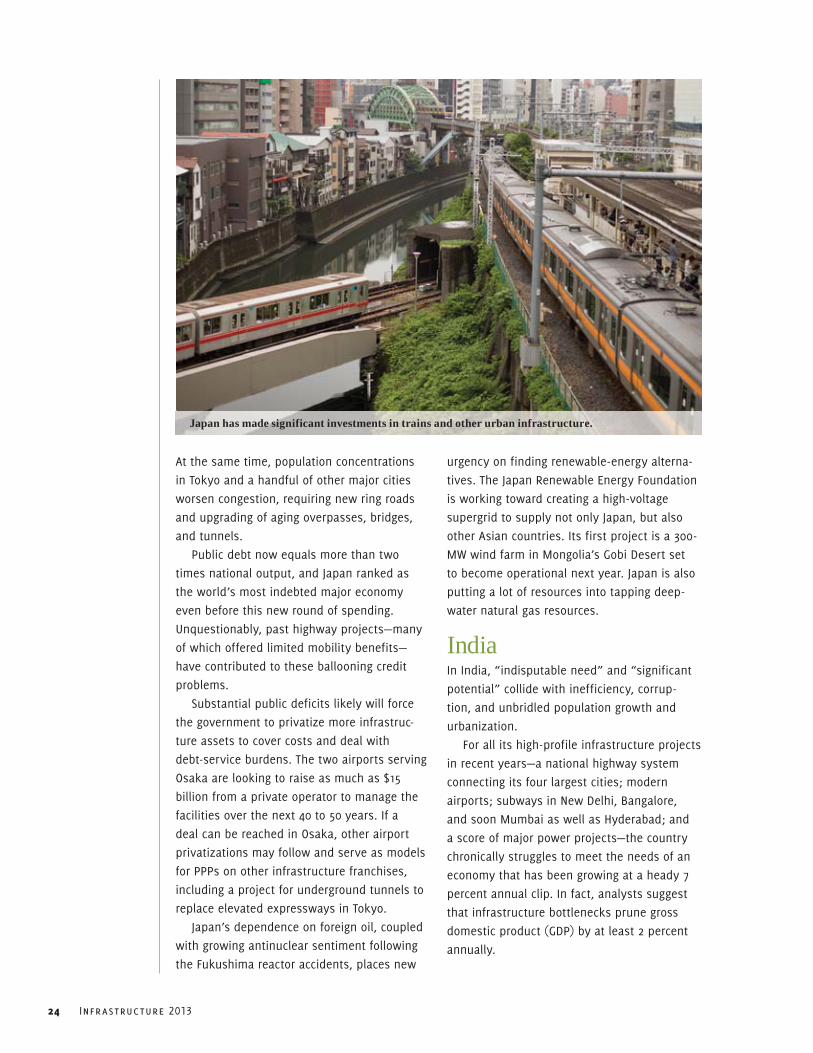
Japan has made significant investments in trains and other urban infrastructure.
Part 1 | Asia Pacific 25
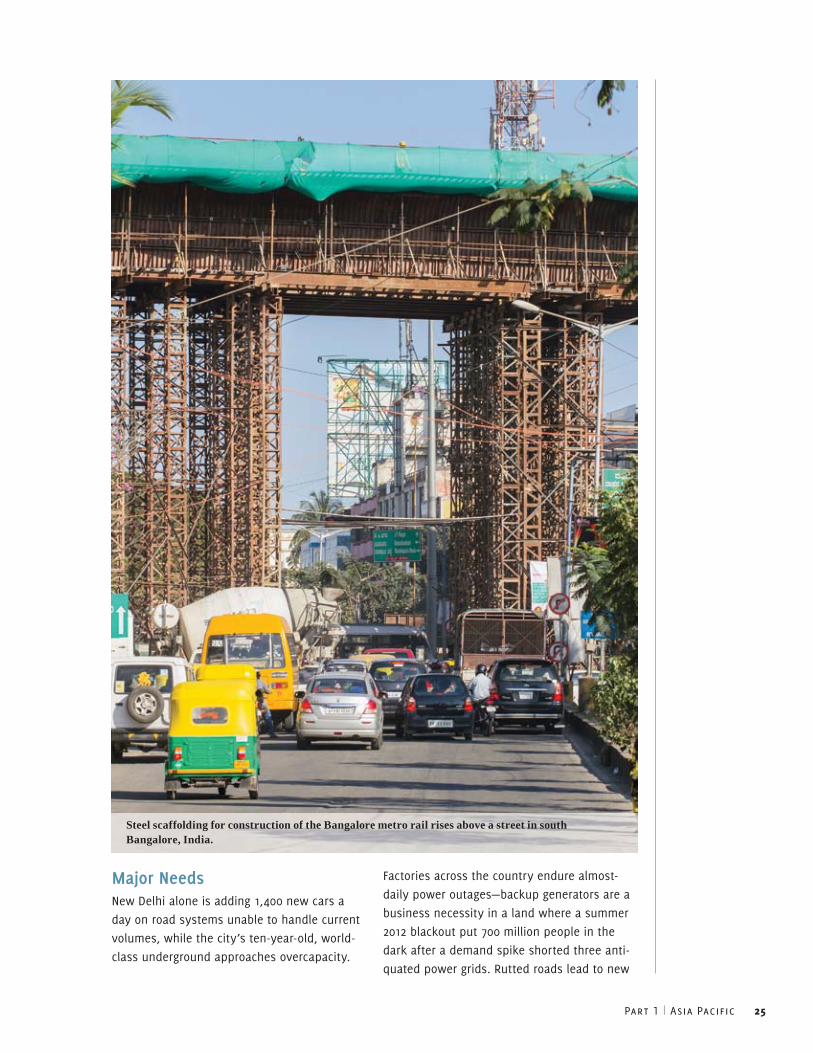
Major NeedsNew Delhi alone is adding 1,400 new cars a
day on road systems unable to handle current
volumes, while the city’s ten-year-old, world-
class underground approaches overcapacity.
Factories across the country endure almost-
daily power outages—backup generators are a
business necessity in a land where a summer
2012 blackout put 700 million people in the
dark after a demand spike shorted three anti-
quated power grids. Rutted roads lead to new
Steel scaffolding for construction of the Bangalore metro rail rises above a street in south Bangalore, India.
26 Infrastructure 2013
office complexes and residential developments
without water lines or power connections,
while oversaturated rail lines clog shipments
of commodities and produce moving between
rural areas, ports, and population centers.
Among its biggest challenges, India needs
to build expansive new urban areas with
adequate municipal services. Tens of millions
of people are moving from the countryside into
informal settlements in cities every year, as
they look for work and a path out of poverty.
By 2030, about 40 percent of the country’s
population—close to 600 million people—will
be living in cities, according to estimates.
The cost to build out roads, transit systems,
power grids, and water/sewage treatment
lines to manage massive population require-
ments and limit squalor will be significant.
“In order to catch up—and then stay ahead
of the curve—we need a long-term plan and
vision to work on all issues in a comprehensive
way, bringing together all public and private
stakeholders,” says an interviewee. “That’s not
happening yet, but it’s working better than it
used to.”
Private Involvement Against undeniable headwinds, including “a
rambunctious” multiparty democratic political
tradition that discourages top-down federal
imposition (in contrast to China’s approach),
the government of India is implementing a
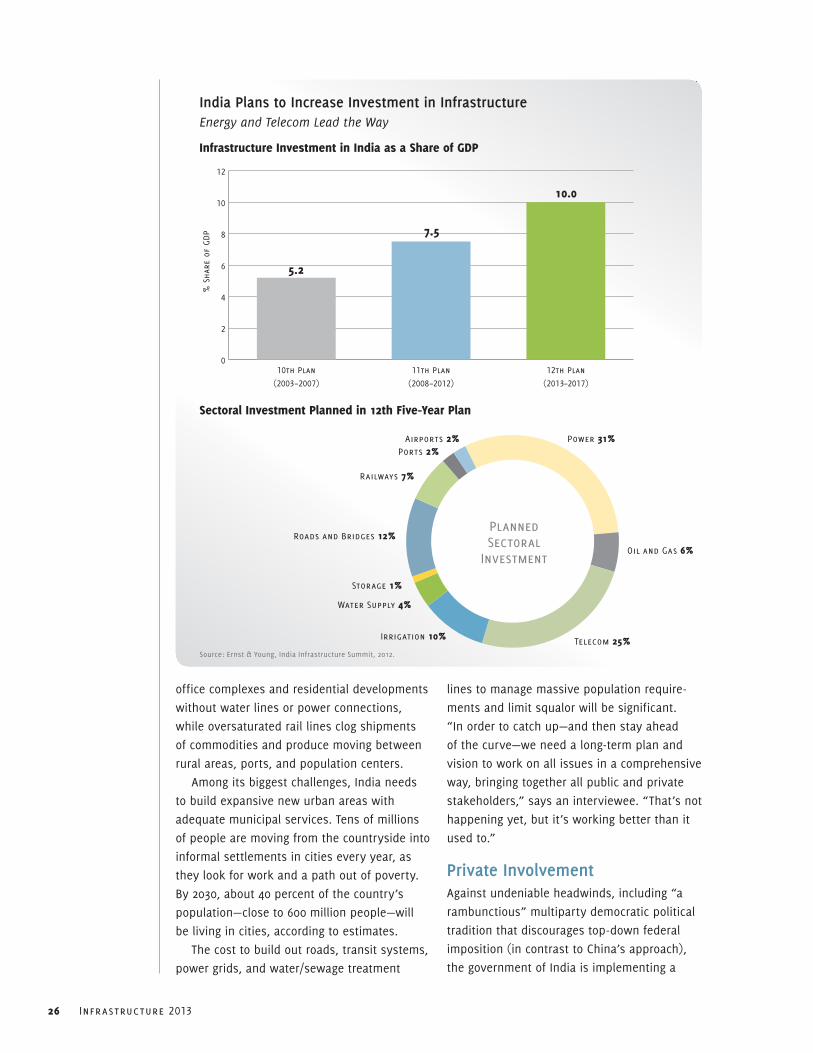
India Plans to Increase Investment in InfrastructureEnergy and Telecom Lead the Way
Infrastructure Investment in India as a share of gdP
% S
hare
of
GDP
0
2
4
6
8
10
12
12th Plan
(2013–2017)
11th Plan
(2008–2012)
10th Plan
(2003–2007)
5.2
7.5
10.0
sectoral Investment Planned in 12th five-Year Plan
Source: Ernst & Young, India Infrastructure Summit, 2012.
Power 31%
Telecom 25%31+6+25+10+4+1+12+7+2+2+NWater Supply 4%
Storage 1%
Roads and Bridges 12%
Railways 7%
Ports 2%Airports 2%
Irrigation 10%
Oil and Gas 6%
PlannedSectoral
Investment
Part 1 | Asia Pacific 27
next-phase, five-year, $1 trillion infrastructure
investment plan targeted at overcoming defi-
ciencies and buttressing continued economic
advances. The policy counts on expanding
the PPP concession model used to build new
roads and significant new investment from
the private sector to upwards of 50 percent of
the cost, including an infusion from offshore
players.
But foreign infrastructure funds are finding
it hard to break through in a system where
“a handful of domestic conglomerates control
the economy.” Policy risk, meanwhile, raises
particular hurdles and creates uncertainty,
hamstringing private initiative—various agen-
cies and authorities vie with state and federal
ministries for control in counterproductive turf
battles. “Land rights, eminent domain, and an
every-man-is-an-island” approach to obtaining
government approvals “can tie things up for
years.” About 42 percent of a total 564 infra-
structure projects have been delayed, and the
average PPP initiative takes about five years to
gain approval.
Since 2007, private companies have pumped
about $225 billion into India infrastructure proj-
ects, with sometimes “disappointing” results.
For example, some publicly listed domestic
infrastructure firms have experienced severe
share-price declines and banks confront a
bevy of workouts. According to the Economist, Chennai’s new airport terminal, Delhi’s smart
airport, an express-rail link in Delhi, and one
of the nation’s biggest power plant construc-
tions in the northwest of India have all gener-
ated unwelcome red ink for private interests.
Bureaucratic snafus, poorly structured con-
tracts, and overbidding based on unrealistic
revenues and expenses have all contributed to
these disappointments.
As part of a recent push to overcome
hurdles and doubts from foreign capital, the
government enacted economic reforms late in
2012 to make it easier for offshore players to
operate and invest, and some interviewees
find the new policy landscape more enticing,
with potentially less red tape. Implementing
transactional safeguards and appropriately
calculating “a [higher] risk profile for PPPs in
India,” investors need to intelligently weigh the
rewards of working in an economy that “will
grow at multiples of any Western country” and
has a more familiar system of law, against
“everything taking a long time,” with reliable,
local partners needed to have any chance at
success.
PrioritiesHigh-profile projects in India include the
following:
■■ new roads. The country is constructing
20,000 kilometers of new and upgraded
roads over the next five years.
■■ Industrial corridor between Mumbai and delhi. The creation of an ambitious indus-
trial corridor between Mumbai and Delhi,
financed in conjunction with Japanese com-
panies, will develop as many as six new
cities in a multidecade undertaking. Initial
projects include power and desalinization
plants and a dedicated freight-rail line.
■■ Mumbai investments. In Mumbai, an el-
evated freight-rail corridor, a new airport,
and a trans-harbor link are in the works.
■■ rapid transport connecting to delhi. Two
rapid-transit corridors are being built to
improve travel between neighboring states
and Delhi.
■■ transport. Construction of 120 bridges and
the completion of other road improvements
will help connect rural areas to Chennai, the
capital of the southern state of Tamil Nadu,
where a subway system is scheduled to
open by 2015.
■■ energy. Investments worth $250 billion in
electric plants and power grids are be-
ing made throughout the power-starved
country.
AustraliaLike most developed countries, Australia is
coping with the costs and inevitable political
hurdles inherent in enhancing and reworking
its aging infrastructure, which is straining to
meet expanding 21st-century industrial and
demographic demands.
28 Infrastructure 2013
Unremitting traffic snarls in major cities like
Sydney, Melbourne, and Brisbane and various
port bottlenecks threaten to sap productiv-
ity, and inadequate transit systems add to the
strain. Ensuring water for a growing population
in a notoriously water-scarce continent raises
increasing challenges. In addressing climate
change concerns, the government appears
determined to push utilities away from reliance
on coal-based power plants to cleaner fuels,
primarily natural gas.
Even with the past 20 years of strong
economic gains and low unemployment, sup-
ported by an export-oriented mining boom,
the country must confront the large gap be-
tween available government funds and costly
infrastructure needs. A recent slowdown,
linked to weaker growth in China, may make
government spending on infrastructure more
difficult—especially at the state level, where
Queensland and New South Wales in particular
suffer from large deficits.
National PriorityTo its credit, the federal government has
taken the initiative over the last half-decade
to prioritize needs through the Infrastructure
Australia authority, fund a $37 billion ($A36
billion) National Building plan, and marshal
private financing through the Infrastructure
Partnerships Australia program. As a result
of this national commitment and a history of
innovation in project finance, interviewees say
that “Australia is one of the best countries for
undertaking PPPs,” having fashioned an “ac-
cepted model” and attained “a comfort level”
in working between the public and private
sectors.
Since 2007, federal infrastructure spending
per capita has increased from $145 (A$141)
to $277 (A$269), and the country’s privately
managed superannuation (pension) funds have
allocated between 5 and 10 percent of total
assets into infrastructure investments—well
above the levels of pension plan sponsors in
other countries, which range from under 2
percent in the Eurozone to below 1 percent
in the United States. However, these invest-
ments have not targeted domestic infrastruc-
ture. Unlocking this funding pool remains
one of Australia’s biggest challenges—and
opportunities.
Infrastructure Australia also has identified
$206 billion (A$200 billion) in government as-
sets—ports, airports, rail terminals, and power
and water utilities—that can be privatized to
help fund infrastructure shortfalls, reduce
debt, and improve operational productivity. So
far, 124 projects, totaling more than $62 billion
(A$60 billion), have been contracted through
PPPs. For example, a recent decision to lease
two ports—Botany and Kembla—to private
operators should improve efficiency in moving
container shipments through the facilities.
Over the near term, high-priority national
transport initiatives focus on augmenting
connectivity between major cities and ports,
concentrating freight on railways, relieving
intracity congestion, and reducing greenhouse
gas emissions.
High-profile projects include:
■■ highways. Dual-carriage highways linking
Brisbane, Sydney, and Melbourne are being
built.
■■ rail improvements. Investments include
rebuilding and modernizing a third of the
national freight-rail network to help reduce
truck traffic, and constructing an under-
ground rail line through Brisbane. The
country’s longest and deepest rail tunnels
are being bored near Sydney.
■■ Investments in Melbourne. Intracity
road chokepoints are being addressed in
Melbourne, and the city’s metro capacity is
also being increased.
■■ sydney airport. Planning for a second
airport to handle expected increases in
jet traffic into Sydney’s global gateway is
continuing.
IndonesiaIndonesia’s burgeoning middle class and ex-
panding economy—now Southeast Asia’s larg-
est—lead the government to address obvious
infrastructure shortcomings to sustain growth.
Clogged roads and bottlenecks plague
Jakarta’s roadways. Like other local govern-
ments in emerging markets, Jakarta relies on
less-capital-intensive bus rapid transit solu-
tions (which cost about $4 million per kilo-
meter to build) to help relieve congestion as
alternatives to expensive light rail or subways
(which cost about $50 million per kilometer).
An attempt to build a monorail system was
aborted five years ago, leaving rusting base
supports in its wake. Since 2004, the city has
built 11 bus rapid transit lines, which now
move 350,000 riders daily—still a small fraction
of the 20 million who live in its environs.
The country wants to finance as much as
$250 billion in new roads, ports, railways, and
power plants over the next five years, and the
central government plans to increase infra-
structure spending by as much as 15 percent
in 2013. Opportunities, meanwhile, have been
attracting PPP investors from Japan, India,
South Korea, and the United States, looking at
power, water, and rail projects.
Other Countries in the Asia Pacific RegionA regulatory framework is taking shape in the
Philippines to finance badly needed infrastruc-
ture improvements through PPP structures that
can attract offshore partners.
Bankrolled by domestic institutions, com-
panies in south Korea are exporting their skill
sets “in road building, power, and civil engi-
neering” to regional neighbors.
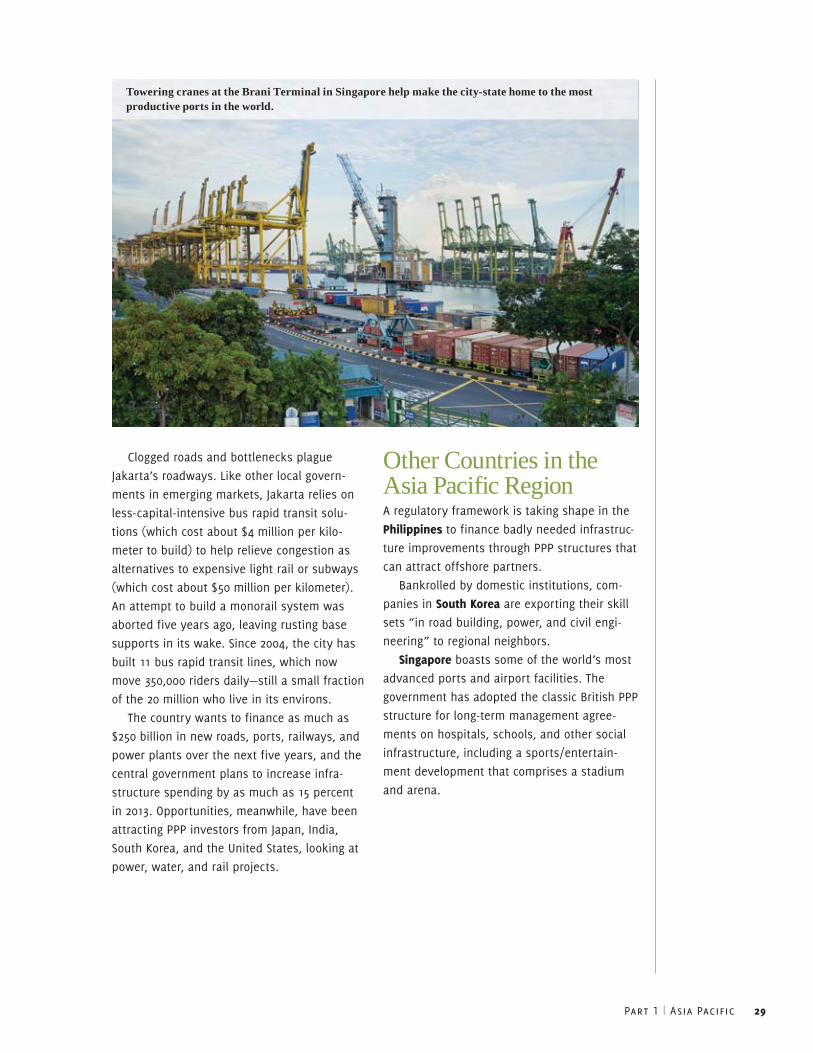
singapore boasts some of the world’s most
advanced ports and airport facilities. The
government has adopted the classic British PPP
structure for long-term management agree-
ments on hospitals, schools, and other social
infrastructure, including a sports/entertain-
ment development that comprises a stadium
and arena.
Part 1 | Asia Pacific 29
Towering cranes at the Brani Terminal in Singapore help make the city-state home to the most productive ports in the world.
30 Infrastructure 2013
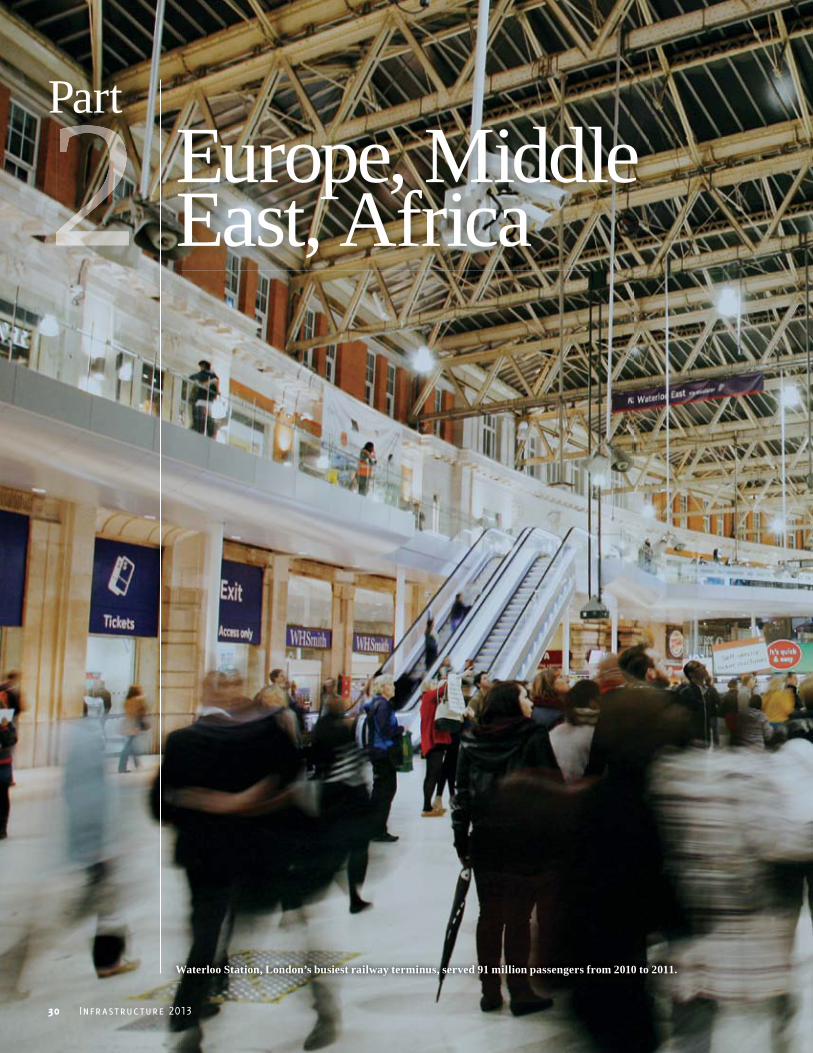
PartEurope, Middle East, Africa2
Waterloo Station, London’s busiest railway terminus, served 91 million passengers from 2010 to 2011.
Part 2 | Europe, Middle East, Africa 31
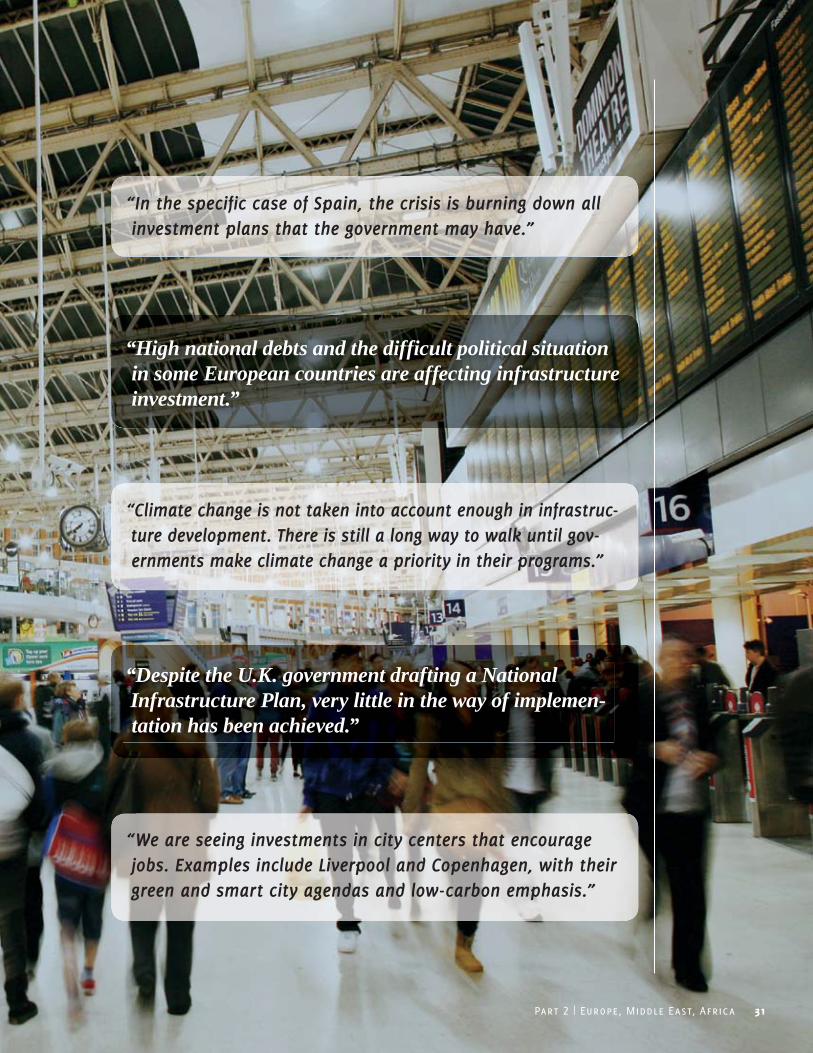
“In the specific case of Spain, the crisis is burning down all investment plans that the government may have.”
“We are seeing investments in city centers that encourage jobs. Examples include Liverpool and Copenhagen, with their green and smart city agendas and low-carbon emphasis.”
“Climate change is not taken into account enough in infrastruc-ture development. There is still a long way to walk until gov-ernments make climate change a priority in their programs.”
“High national debts and the difficult political situation in some European countries are affecting infrastructure investment.”
“Despite the U.K. government drafting a National Infrastructure Plan, very little in the way of implemen-tation has been achieved.”
32 Infrastructure 2013
IRANIRAQ
SYRIA
TURKEY
GEORGIA
AZERBAIJANARMENIA
UKRAINE
ROMANIA
POLANDGERMANY
FRANCE
ITALY
SPAINPORTUGAL
IRELAND
BELGIUM
NETHERLANDS
CZECH REPUBLIC
SLOVAKIA
HUNGARY
BULGARIA
AUSTRIA
LITHUANIA
DENMARK
ESTONIA
LATVIA
GREECE
MOLDOVA
ALBANIA
MACEDONIA
MONTENEGRO KOSOVO
CROATIA
JORDAN
KUWAIT
OMANBAHRAIN
QATAR
DJIBOUTI
UNITEDARAB
EMIRATES
LEBANON
ISRAEL
SWITZERLAND
SERBIABOSNIA ANDHERZEGOVINA
SLOVENIA
UNITEDKINGDOM
BELARUS
FINLAND
SWEDENNORWAY
EGYPTLIBYAALGERIA
MOROCCO
WESTERNSAHARA
TUNISIA
MALI
GHANA
NIGER
CHADSUDAN
ETHIOPIA
SOMALIA
KENYA
TANZANIA
ZAMBIA
ANGOLA
ZIMBABWENAMIBIA
BOTSWANA
SOUTH AFRICA
YEMEN
OMAN
SAUDI ARABIA
NIGERIA
CAMEROON
BENIN
BURKINAFASOGUINEA BISSAU
SIERRALEONE
LIBERIA
GAMBIA
CENTRALAFRICAN REPUBLIC
DEMOCRATICREPUBLIC
OF THE CONGO
GABON
MOZAMBIQUE
MADAGASCAR
MALAWI
SWAZILAND
REP. OFTHE
CONGO
RWANDA
UGANDA
ERITREA
BURUNDI
MAURITANIA
SENEGAL
GUINEA
COTED’IVOIRE
RUSSIA
05
10152025303540
113%
Dar es Salaam05
10152025303540
90%
Nairobi05
10152025303540
86%
Luanda
05
10152025303540
15%
London
05
10152025303540
10%
Moscow05
10152025303540
6%
Saint Petersburg
40%
Ankara05
10152025303540
SWEDENSWEDENSWEDENSWEDENSWEDENSWEDENSWEDENSWEDENSWEDEN
36%
Istanbul05
10152025303540
33%
Cairo05
10152025303540
26%
Madrid05
10152025303540
19%
Barcelona05
10152025303540
18%
Tehran05
10152025303540
16%
Paris05
10152025303540
SOUTH AFRICASOUTH AFRICASOUTH AFRICASOUTH AFRICASOUTH AFRICASOUTH AFRICASOUTH AFRICASOUTH AFRICA
73%
Kinshasa05
10152025303540
68%
Abidjan05
10152025303540
57%
Al-Khartum (Khartoum)05
10152025303540
55%
Baghdad05
10152025303540
55%
Ar-Riyadh (Riyadh)05
10152025303540
51%
Jeddah05
10152025303540
41%
Alexandria05
10152025303540
05
10152025303540
76%
Ibadan
05
10152025303540
75%
Kano
05
10152025303540
75%
Lagos
05
10152025303540
73%
Dakar
2025
2010
Popu
lati
on i
n M
illi
ons
2010 –2025 GROWTH %
KEY
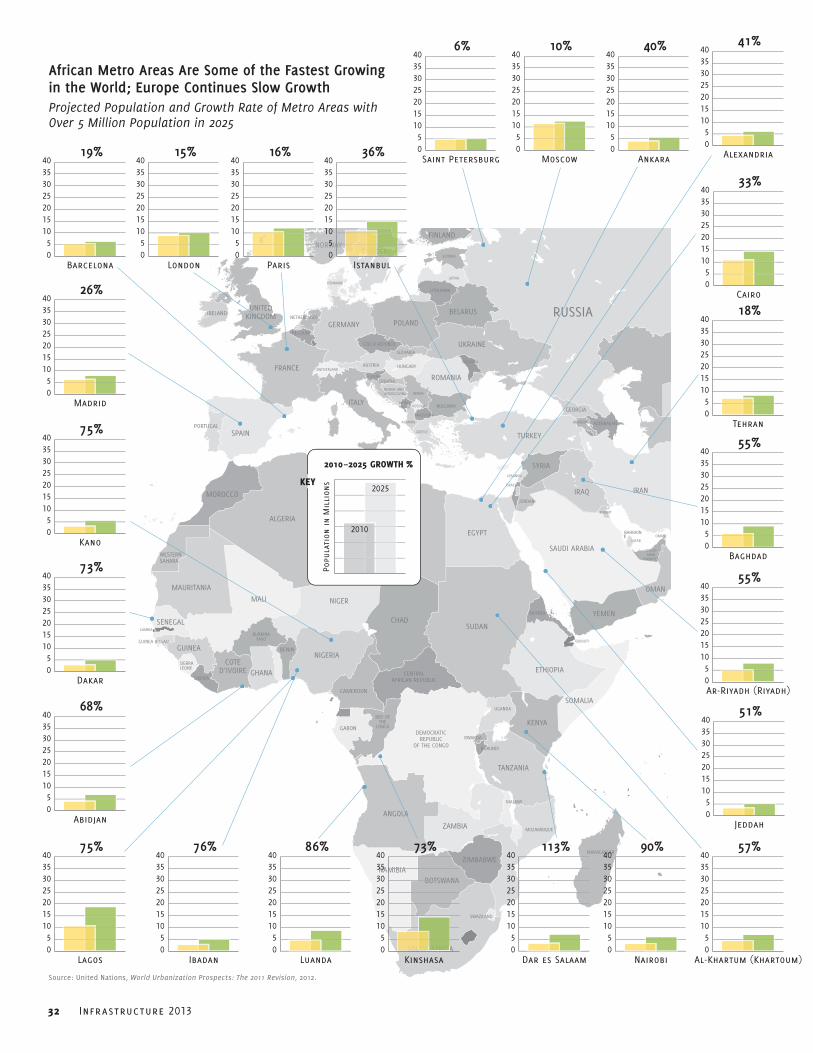
African Metro Areas Are Some of the Fastest Growing in the World; Europe Continues Slow GrowthProjected Population and Growth Rate of Metro Areas with Over 5 Million Population in 2025
Source: United Nations, World Urbanization Prospects: The 2011 Revision, 2012.
Part 2 | Europe, Middle East, Africa 33
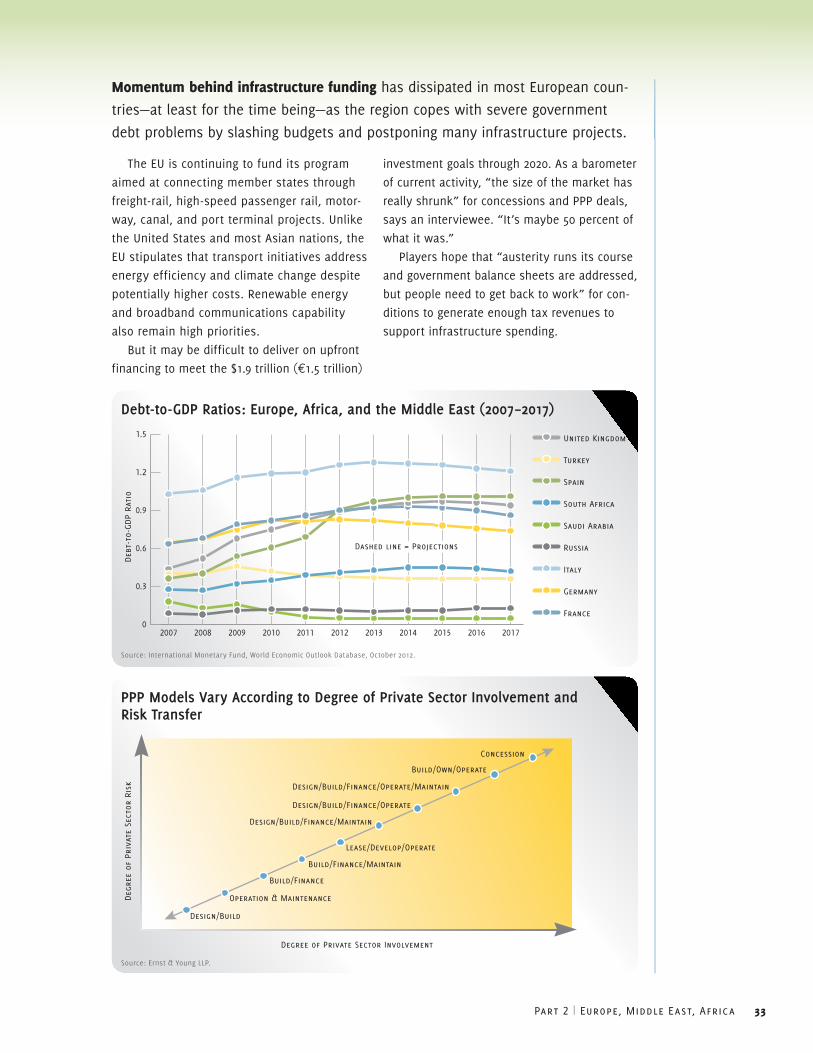
Momentum behind infrastructure funding has dissipated in most European coun-
tries—at least for the time being—as the region copes with severe government
debt problems by slashing budgets and postponing many infrastructure projects.
The EU is continuing to fund its program
aimed at connecting member states through
freight-rail, high-speed passenger rail, motor-
way, canal, and port terminal projects. Unlike
the United States and most Asian nations, the
EU stipulates that transport initiatives address
energy efficiency and climate change despite
potentially higher costs. Renewable energy
and broadband communications capability
also remain high priorities.
But it may be difficult to deliver on upfront
financing to meet the $1.9 trillion (¤1.5 trillion)
investment goals through 2020. As a barometer
of current activity, “the size of the market has
really shrunk” for concessions and PPP deals,
says an interviewee. “It’s maybe 50 percent of
what it was.”
Players hope that “austerity runs its course
and government balance sheets are addressed,
but people need to get back to work” for con-
ditions to generate enough tax revenues to
support infrastructure spending.
Debt-to-GDP Ratios: Europe, Africa, and the Middle East (2007–2017)
Deb
t-to
-GDP
Rati
o
0
0.3
0.6
0.9
1.2
1.5 United Kingdom
Turkey
Spain
South Africa
Saudi Arabia
Russia
Italy
Germany
France
20172016201520142013201220112010200920082007
Dashed line = Projections
Source: International Monetary Fund, World Economic Outlook Database, October 2012.
PPP Models Vary According to Degree of Private Sector Involvement and Risk Transfer
Deg
ree
of P
riva
te S
ecto
r Ri
sk
Degree of Private Sector Involvement
Design/Build
Operation & Maintenance
Build/Finance
Build/Finance/Maintain
Lease/Develop/Operate
Design/Build/Finance/Maintain
Design/Build/Finance/Operate
Design/Build/Finance/Operate/Maintain
Build/Own/Operate
Concession
Source: Ernst & Young LLP.
34 Infrastructure 2013
United KingdomIn the United Kingdom, infrastructure spending
gains favor with the public—“once one of the
first areas slashed in troubled times, it’s now
better protected.” After the success of the 2012
Summer Olympics, the anticipation of London
Crossrail, and the convenience of high-speed
rail connections to Europe, voters have grown
to view major public works expenditures “as a
good way to fix the economy, create jobs, and
inject capital into society,” while adding to the
“nation’s strategic asset base.”
In turn, the government has developed an
extensive, top-down National Infrastructure
Plan (NIP), which “lays out big plans—averag-
ing more than $44 billion [£30 billion] in out-
lays annually and has identified 550 projects
totaling $471 billion [£310 billion] to 2015 and
beyond,” with “a particular focus on transport
and power.” But how to fund the ambitious
plan remains a concern.
High Speed Rail 2, a $45 billion (£30 billion)
project planned to zip riders from London to
Scotland, would take pressure off increasingly
congested motorways and constricted airspace
around Heathrow, but remains in a “talk but
no action” limbo. The $36 billion (£24 billion)
Crossrail, scheduled to open in 2018 and connect
London’s east and west suburbs by underground
commuter trains through the center city, is the
“only big project that has seen any action.”
Housing—“the best way to drive economic
growth”—sees “little activity,” although hos-
Insights about Europe, the Middle East, and Africa from Infrastructure 2013 Interviewees PPPs are a critical part of the infrastructure puzzle, but innovative models and approaches are needed.
A key trend is the chance for governments to refurbish or to build new infrastructure with third-party investments or PPPs.
There is a need for innovative financing, and [for] setting up capital funds to take equity in projects and financing projects where there is a clear potential for a positive return on investment.
New financing models must be designed, and they must reach more regions. New grant structures and more capi-tal market financing must be used so development can be accelerated through PPPs, with their advantages in terms of fast provision of investments.
even with public/private partnerships, government plays an important role.
Getting funding without government guarantees or sup-port is becoming very difficult.
A challenge is long approval processes that hinder invest-ments or raise infrastructure investment costs.
There is a sense in the U.K. that German and French firms have been better supported by their respective govern-ments. These firms appear to have better relationships with their governments, and get a better forward view of the investment pipeline, enabling them to make better long-term plans and investment decisions.
Interviewees from the u.K. vary in their views of the availability of private capital for infrastructure.
Direct infrastructure investment from private investors has slowed considerably, and this has had a negative impact on growth in the industry.
There is plenty of capital in the system, but investors want certainty that schemes will proceed and assurance that risks are manageable.
The main challenge facing the infrastructure industry is being able to raise capital upfront, which is a prerequisite to infrastructure projects commencing.
Pension funds are not proving to be the solution for the funding crisis because they don’t like the uncertainties and risks around procurement and performance.
spain’s infrastructure investment has hit a wall.
In Spain, government spending on infrastructure has been dramatically cut. Few new projects are being introduced, and current works are being delayed.
In Spain, we are suffering from a lack of funding for the big PPP projects we are engaged with. There is just a handful of banks willing to be lenders, but they won’t take on too much risk. Big projects are on standby or are being carried out slowly.
Where will funding come from?
The U.K. government has laid out big plans for infrastruc-ture spending, with a particular focus on transport and power. But it is not clear where the money will come from.
Part 2 | Europe, Middle East, Africa 35
pitals and schools will receive funding from
members of parliament eager to meet local
constituent needs. Many decisions about
power strategies are getting caught up in de-
bates about choices between nuclear, gas, and
wind generation, although parliament pushes a
long-term $152 billion (£100 billion) energy plan
to protect the economy and reduce carbon
emissions.
Public/Private Partnerships Since the public purse is constrained, initia-
tives increasingly must rely on private capital
sources to move ahead. But a parliamentary
review of the PPP program, the Private Finance
Initiative, now called PF2, “has caused a big
pause to many projects.”
Complicating matters, government reluc-
tance to provide guarantees on greenfield
initiatives “adds uncertainty and makes at-
tracting funders more difficult.” Risk-averse
pension funds in particular “are not coming to
the table as hoped.”
Many of the PF2 reforms “make sense” to
control costs and emphasize life-cycle main-
tenance where each stage of development,
construction, and operation is coordinated and
handled by the most appropriate party (wheth-
er government or private sector), with “zero
tolerance” for overruns in budgets and missed
schedules. “The success of the Olympics
demonstrated the skills and capability in the
U.K. when the conditions are right and red-
tape barriers are removed,” but “the tension
There are opportunities for innovation, both in tariff mechanisms and in collection of fees for services provided to users. All of this follows a pay-for-use trend.
Across the region, an understanding of the need for resilience to climate change is growing.
There is much more public awareness and discussion regarding the risk and effects of flooding, and also about where better infrastructure can mitigate risks, and how we can reduce environmental impacts generally.
The energy sector is probably behind the curve on climate change adaptations, compared with the water industry, which has done much more work, such as putting in flood defenses.
energy remains a work in progress.
The price of energy is still not high enough to drive eco-nomic behaviors. Much behavior around the green agenda is still politically driven.
A lot of work needs to be done to adapt to the low-carbon agenda in the U.K.—for example, moving from the grid to the smart grid.
The energy sector is being looked to for growth opportuni-ties—in solar energy, nuclear energy, and liquefied natural gas importation and exportation.
european cities are trying for catalytic infrastructure investments, but some are missing out.
The London Olympics brought a number of transport proj-ects forward by ten years or more.
Urban areas in the U.K. demand the most focus because
that is where most people live. In particular, London de-serves a disproportionate share if it is to be sustainable.
Across Europe, countries are making big investments in airports. For example, Berlin is consolidating its airport capacity to boost city competitiveness.
London needs more hub airport capability, as the United Kingdom is a highly aviation-dependent economy. Aviation capacity remains a major issue.
Investment in third-tier cites, where infrastructure is nec-essary to facilitate development, is problematic.
the united Kingdom faces a critical infrastructure skills gap.
The U.K. has lost all of its manufacturing capability in infrastructure-related industries. Letting this happen was a poor decision—this was an important source of jobs and was exportable.
Successive U.K. governments have presided over a decline in capability and skills.
There is a skills issue for the whole sector in the United Kingdom. Skilled workers can take years to train.
technology and connectivity are key parts of the modern infrastructure story.
Tenants and shoppers now expect information and con-nectivity always, everywhere.
U.K. transit passengers are becoming savvier, particularly in their use of technology. Transit systems anticipate that more transactions will soon be made by mobile technology than by desktop internet.
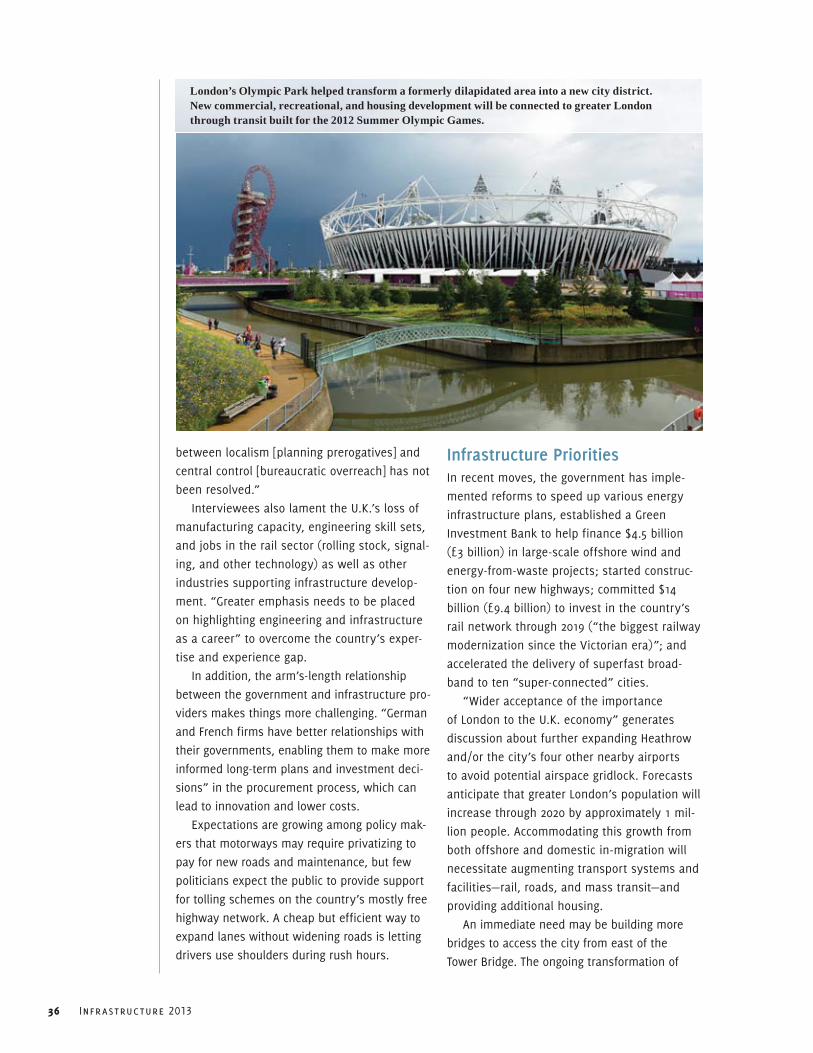
36 Infrastructure 2013
between localism [planning prerogatives] and
central control [bureaucratic overreach] has not
been resolved.”
Interviewees also lament the U.K.’s loss of
manufacturing capacity, engineering skill sets,
and jobs in the rail sector (rolling stock, signal-
ing, and other technology) as well as other
industries supporting infrastructure develop-
ment. “Greater emphasis needs to be placed
on highlighting engineering and infrastructure
as a career” to overcome the country’s exper-
tise and experience gap.
In addition, the arm’s-length relationship
between the government and infrastructure pro-
viders makes things more challenging. “German
and French firms have better relationships with
their governments, enabling them to make more
informed long-term plans and investment deci-
sions” in the procurement process, which can
lead to innovation and lower costs.
Expectations are growing among policy mak-
ers that motorways may require privatizing to
pay for new roads and maintenance, but few
politicians expect the public to provide support
for tolling schemes on the country’s mostly free
highway network. A cheap but efficient way to
expand lanes without widening roads is letting
drivers use shoulders during rush hours.
Infrastructure PrioritiesIn recent moves, the government has imple-
mented reforms to speed up various energy
infrastructure plans, established a Green
Investment Bank to help finance $4.5 billion
(£3 billion) in large-scale offshore wind and
energy-from-waste projects; started construc-
tion on four new highways; committed $14
billion (£9.4 billion) to invest in the country’s
rail network through 2019 (“the biggest railway
modernization since the Victorian era)”; and
accelerated the delivery of superfast broad-
band to ten “super-connected” cities.
“Wider acceptance of the importance
of London to the U.K. economy” generates
discussion about further expanding Heathrow
and/or the city’s four other nearby airports
to avoid potential airspace gridlock. Forecasts
anticipate that greater London’s population will
increase through 2020 by approximately 1 mil-
lion people. Accommodating this growth from
both offshore and domestic in-migration will
necessitate augmenting transport systems and
facilities—rail, roads, and mass transit—and
providing additional housing.
An immediate need may be building more
bridges to access the city from east of the
Tower Bridge. The ongoing transformation of
London’s Olympic Park helped transform a formerly dilapidated area into a new city district. New commercial, recreational, and housing development will be connected to greater London through transit built for the 2012 Summer Olympic Games.
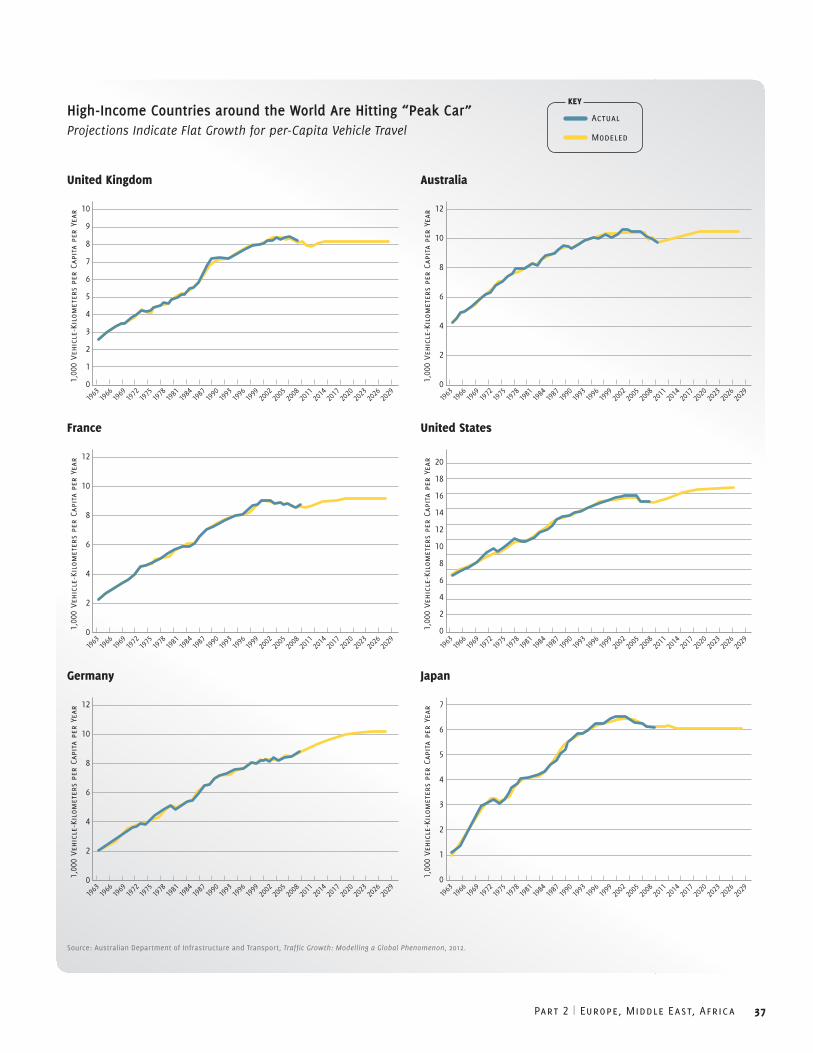
Part 2 | Europe, Middle East, Africa 37
High-Income Countries around the World Are Hitting “Peak Car”Projections Indicate Flat Growth for per-Capita Vehicle Travel
united Kingdom
1963
1966
1969
1972
1975
1978
1981
1984
1987
1990
1993
1996
1999
2002
2005
2008
2011
2014
2017
2020
2023
2026
2029
10
9
8
7
6
5
4
3
2
1
01,00
0 Ve
hicl
e-Ki
lom
eter
s pe
r Ca
pita
per
Yea
r
france
1963
1966
1969
1972
1975
1978
1981
1984
1987
1990
1993
1996
1999
2002
2005
2008
2011
2014
2017
2020
2023
2026
2029
12
10
8
6
4
2
01,00
0 Ve
hicl
e-Ki
lom
eter
s pe
r Ca
pita
per
Yea
r
germany
1963
1966
1969
1972
1975
1978
1981
1984
1987
1990
1993
1996
1999
2002
2005
2008
2011
2014
2017
2020
2023
2026
2029
12
10
8
6
4
2
01,00
0 Ve
hicl
e-Ki
lom
eter
s pe
r Ca
pita
per
Yea
r
Australia
1963
1966
1969
1972
1975
1978
1981
1984
1987
1990
1993
1996
1999
2002
2005
2008
2011
2014
2017
2020
2023
2026
2029
12
10
8
6
4
2
01,00
0 Ve
hicl
e-Ki
lom
eter
s pe
r Ca
pita
per
Yea
runited states
1963
1966
1969
1972
1975
1978
1981
1984
1987
1990
1993
1996
1999
2002
2005
2008
2011
2014
2017
2020
2023
2026
2029
20
18
16
14
12
10
8
6
4
2
01,00
0 Ve
hicl
e-Ki
lom
eter
s pe
r Ca
pita
per
Yea
r
Japan
1963
1966
1969
1972
1975
1978
1981
1984
1987
1990
1993
1996
1999
2002
2005
2008
2011
2014
2017
2020
2023
2026
2029
7
6
5
4
3
2
1
01,00
0 Ve
hicl
e-Ki
lom
eter
s pe
r Ca
pita
per
Yea
r
Source: Australian Department of Infrastructure and Transport, Traffic Growth: Modelling a Global Phenomenon, 2012.
Actual
Modeled
KeY
38 Infrastructure 2013
the Olympic Park site—formerly a dilapidated
area in East London—into a new city district
also takes on added significance. By design,
the $13.4 billion (£9 billion) Olympics site will
evolve into an expanse of recreational areas and
entertainment venues with a commercial center
and housing for 8,000 families in five planned
neighborhoods—all connected to the London rail
and underground system through extensive new
transit lines built for the competition. Olympic
facilities in other boroughs, including athletes’
housing, are also serving to help regenerate
once-downtrodden districts and absorb some
of the city’s expected population increases.
FranceThe cash-strapped government’s limited
capacity to fund major projects outright leads
to some cutbacks and postponements and
greater reliance on PPP funding. Currently, PPP
initiatives priced at $43 billion (¤33 billion) are
in the infrastructure pipeline through 2020,
and a stimulus program provides $13 billion
(¤10 billion) for financing of up to 80 percent
of infrastructure projects.
Despite the fiscal constraints, France is
moving forward with expanding its already
world-renowned high-speed rail lines (building
out routes from Tours to Bordeaux and Bretagne
to Pays de la Loire), constructing a high-speed
airport rail link in Paris, approving a new
motorway concession between Bordeaux and
Bayonne, and awarding contracts on a 60-mile
(96 km) canal project connecting the Rhine-
Scheldt waterway in Germany to the Seine.
The new socialist government is paring
back investment in nuclear power, the nation’s
primary energy source, and looking to gain
efficiencies from energy-saving technologies,
equipment, and systems as well as promoting
green power alternatives.
GermanyEurope’s economic powerhouse, Germany is
one of the few countries in the world that can
afford to back off infrastructure initiatives.
Germany is benefiting from its already
built-out infrastructure systems, which feature
some of the world’s best rail (both freight and
high-speed passenger) and road networks
as well as efficient power grids and modern
water facilities. As a result, the country does
not require significant infrastructure expan-
sions, except for projects to hasten the transi-
tion away from nuclear energy to renewable
sources of power.
Most outlays are directed at upgrading
existing roads—some Autobahns are approach-
ing the end of 50-year life cycles and require
ongoing capital for preservation and enhance-
ment. Others are being directed at closing the
remaining gaps in the intranational Autobahn
infrastructure. Railway projects are also
focused on maintenance, although the $8.4
billion (¤6.5 billion) Stuttgart 21 rail project
will build out 35 miles (56 km) of high-speed
rail track, the latest leg of an intercountry
European Union route connecting Paris to
Bratislava, Slovakia. Major airport expansions
are underway in Munich and Frankfurt, and
the new Berlin-Brandenburg Airport will open
in the fall after cost overruns and delays.
These projects will cement Germany’s place
as the hub of central Europe’s transport net-
work and primary connection point for interna-
tional travel as well as freight delivery.
SpainSpain’s big-budget infrastructure building binge
is hitting the wall—EU bailouts are keeping
the government afloat but require significant
spending reductions, including the mothballing
of many road and rail projects. Interviewees
call for a “more proactive role from the govern-
ment in developing infrastructure,” lamenting
that “last year was an empty and lost year for
the sector.”
On the bright side, recent work by the
country has upgraded transport systems dra-
matically. Spain now features 8,750 miles of
motorways and dual carriageways—more than
any other European country. Its rail network
has expanded to more than 9,000 miles. The
government remains determined to complete
buildout of the longest high-speed passenger-
rail system in Europe (second only to China’s
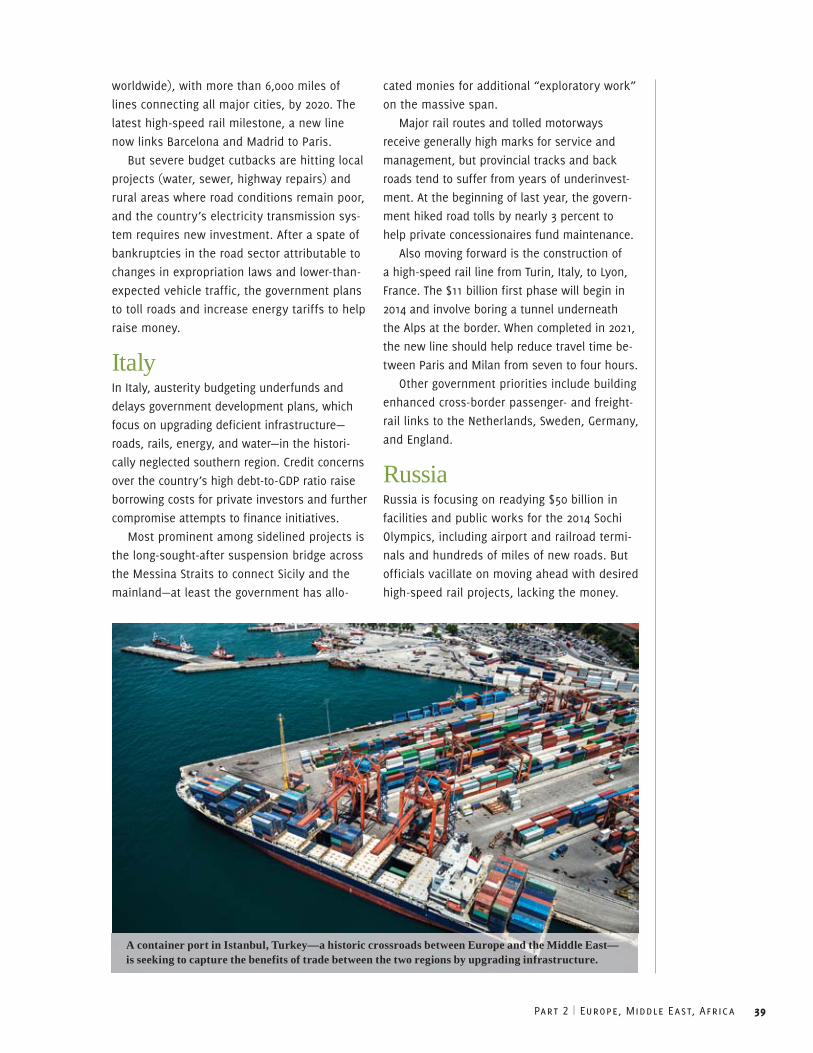
Part 2 | Europe, Middle East, Africa 39
worldwide), with more than 6,000 miles of
lines connecting all major cities, by 2020. The
latest high-speed rail milestone, a new line
now links Barcelona and Madrid to Paris.
But severe budget cutbacks are hitting local
projects (water, sewer, highway repairs) and
rural areas where road conditions remain poor,
and the country’s electricity transmission sys-
tem requires new investment. After a spate of
bankruptcies in the road sector attributable to
changes in expropriation laws and lower-than-
expected vehicle traffic, the government plans
to toll roads and increase energy tariffs to help
raise money.
ItalyIn Italy, austerity budgeting underfunds and
delays government development plans, which
focus on upgrading deficient infrastructure—
roads, rails, energy, and water—in the histori-
cally neglected southern region. Credit concerns
over the country’s high debt-to-GDP ratio raise
borrowing costs for private investors and further
compromise attempts to finance initiatives.
Most prominent among sidelined projects is
the long-sought-after suspension bridge across
the Messina Straits to connect Sicily and the
mainland—at least the government has allo-
cated monies for additional “exploratory work”
on the massive span.
Major rail routes and tolled motorways
receive generally high marks for service and
management, but provincial tracks and back
roads tend to suffer from years of underinvest-
ment. At the beginning of last year, the govern-
ment hiked road tolls by nearly 3 percent to
help private concessionaires fund maintenance.
Also moving forward is the construction of
a high-speed rail line from Turin, Italy, to Lyon,
France. The $11 billion first phase will begin in
2014 and involve boring a tunnel underneath
the Alps at the border. When completed in 2021,
the new line should help reduce travel time be-
tween Paris and Milan from seven to four hours.
Other government priorities include building
enhanced cross-border passenger- and freight-
rail links to the Netherlands, Sweden, Germany,
and England.
RussiaRussia is focusing on readying $50 billion in
facilities and public works for the 2014 Sochi
Olympics, including airport and railroad termi-
nals and hundreds of miles of new roads. But
officials vacillate on moving ahead with desired
high-speed rail projects, lacking the money.
A container port in Istanbul, Turkey—a historic crossroads between Europe and the Middle East—is seeking to capture the benefits of trade between the two regions by upgrading infrastructure.
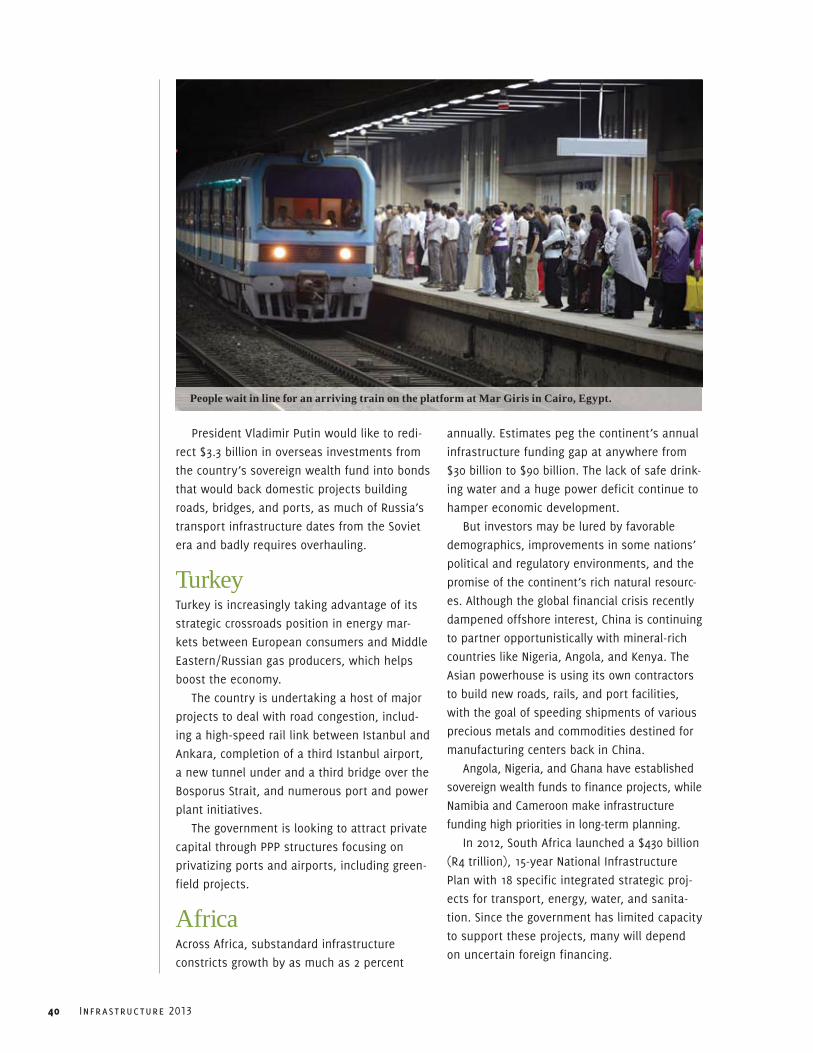
40 Infrastructure 2013
President Vladimir Putin would like to redi-
rect $3.3 billion in overseas investments from
the country’s sovereign wealth fund into bonds
that would back domestic projects building
roads, bridges, and ports, as much of Russia’s
transport infrastructure dates from the Soviet
era and badly requires overhauling.
TurkeyTurkey is increasingly taking advantage of its
strategic crossroads position in energy mar-
kets between European consumers and Middle
Eastern/Russian gas producers, which helps
boost the economy.
The country is undertaking a host of major
projects to deal with road congestion, includ-
ing a high-speed rail link between Istanbul and
Ankara, completion of a third Istanbul airport,
a new tunnel under and a third bridge over the
Bosporus Strait, and numerous port and power
plant initiatives.
The government is looking to attract private
capital through PPP structures focusing on
privatizing ports and airports, including green-
field projects.
AfricaAcross Africa, substandard infrastructure
constricts growth by as much as 2 percent
annually. Estimates peg the continent’s annual
infrastructure funding gap at anywhere from
$30 billion to $90 billion. The lack of safe drink-
ing water and a huge power deficit continue to
hamper economic development.
But investors may be lured by favorable
demographics, improvements in some nations’
political and regulatory environments, and the
promise of the continent’s rich natural resourc-
es. Although the global financial crisis recently
dampened offshore interest, China is continuing
to partner opportunistically with mineral-rich
countries like Nigeria, Angola, and Kenya. The
Asian powerhouse is using its own contractors
to build new roads, rails, and port facilities,
with the goal of speeding shipments of various
precious metals and commodities destined for
manufacturing centers back in China.
Angola, Nigeria, and Ghana have established
sovereign wealth funds to finance projects, while
Namibia and Cameroon make infrastructure
funding high priorities in long-term planning.
In 2012, South Africa launched a $430 billion
(R4 trillion), 15-year National Infrastructure
Plan with 18 specific integrated strategic proj-
ects for transport, energy, water, and sanita-
tion. Since the government has limited capacity
to support these projects, many will depend
on uncertain foreign financing.
People wait in line for an arriving train on the platform at Mar Giris in Cairo, Egypt.
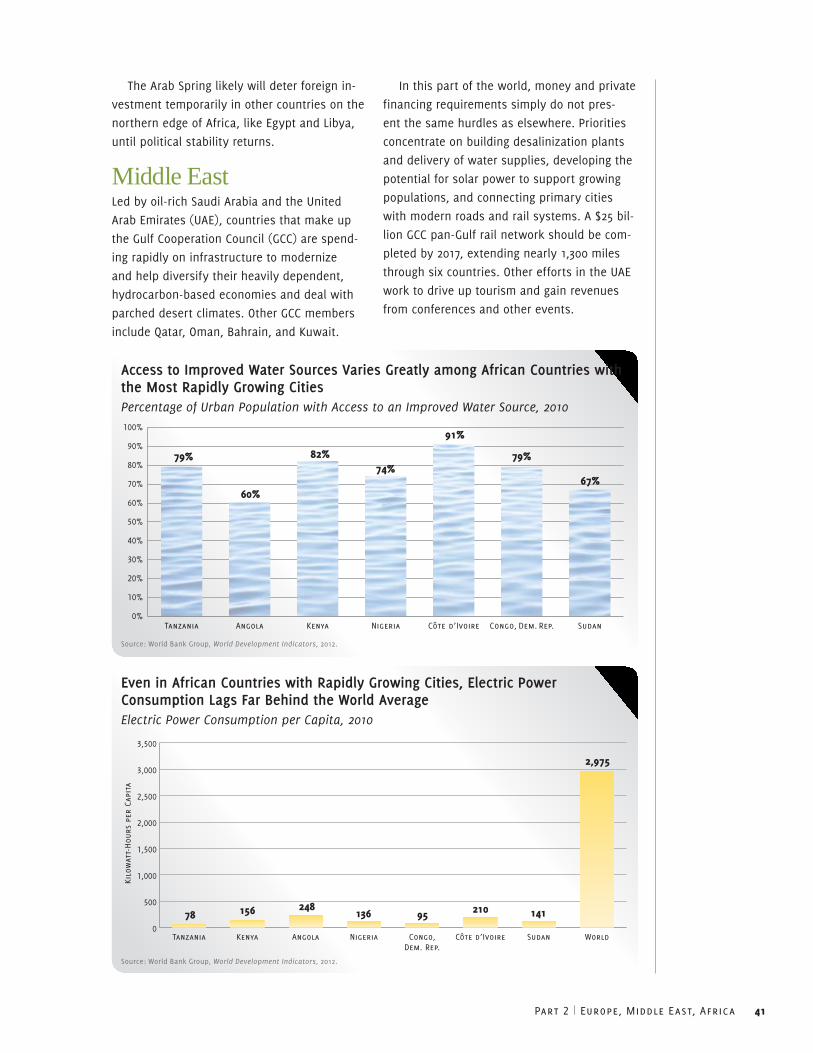
Part 2 | Europe, Middle East, Africa 41
The Arab Spring likely will deter foreign in-
vestment temporarily in other countries on the
northern edge of Africa, like Egypt and Libya,
until political stability returns.
Middle EastLed by oil-rich Saudi Arabia and the United
Arab Emirates (UAE), countries that make up
the Gulf Cooperation Council (GCC) are spend-
ing rapidly on infrastructure to modernize
and help diversify their heavily dependent,
hydrocarbon-based economies and deal with
parched desert climates. Other GCC members
include Qatar, Oman, Bahrain, and Kuwait.
In this part of the world, money and private
financing requirements simply do not pres-
ent the same hurdles as elsewhere. Priorities
concentrate on building desalinization plants
and delivery of water supplies, developing the
potential for solar power to support growing
populations, and connecting primary cities
with modern roads and rail systems. A $25 bil-
lion GCC pan-Gulf rail network should be com-
pleted by 2017, extending nearly 1,300 miles
through six countries. Other efforts in the UAE
work to drive up tourism and gain revenues
from conferences and other events.
Access to Improved Water Sources Varies Greatly among African Countries with the Most Rapidly Growing CitiesPercentage of Urban Population with Access to an Improved Water Source, 2010
0%
10%
20%
30%
40%
50%
60%
70%
80%
90%
100%
SudanCongo, Dem. Rep.Cote d’IvoireNigeriaKenyaAngolaTanzania
79%
60%
82%74%
91%
79%
67%
Source: World Bank Group, World Development Indicators, 2012.
Even in African Countries with Rapidly Growing Cities, Electric Power Consumption Lags Far Behind the World AverageElectric Power Consumption per Capita, 2010
0
500
1,000
1,500
2,000
2,500
3,000
3,500
WorldSudanCote d’IvoireCongo,Dem. Rep.
NigeriaAngolaKenyaTanzania
78 156 248 210 141
2,975
136 95
Kilo
wat
t-Hou
rs p
er C
apit
a
Source: World Bank Group, World Development Indicators, 2012.
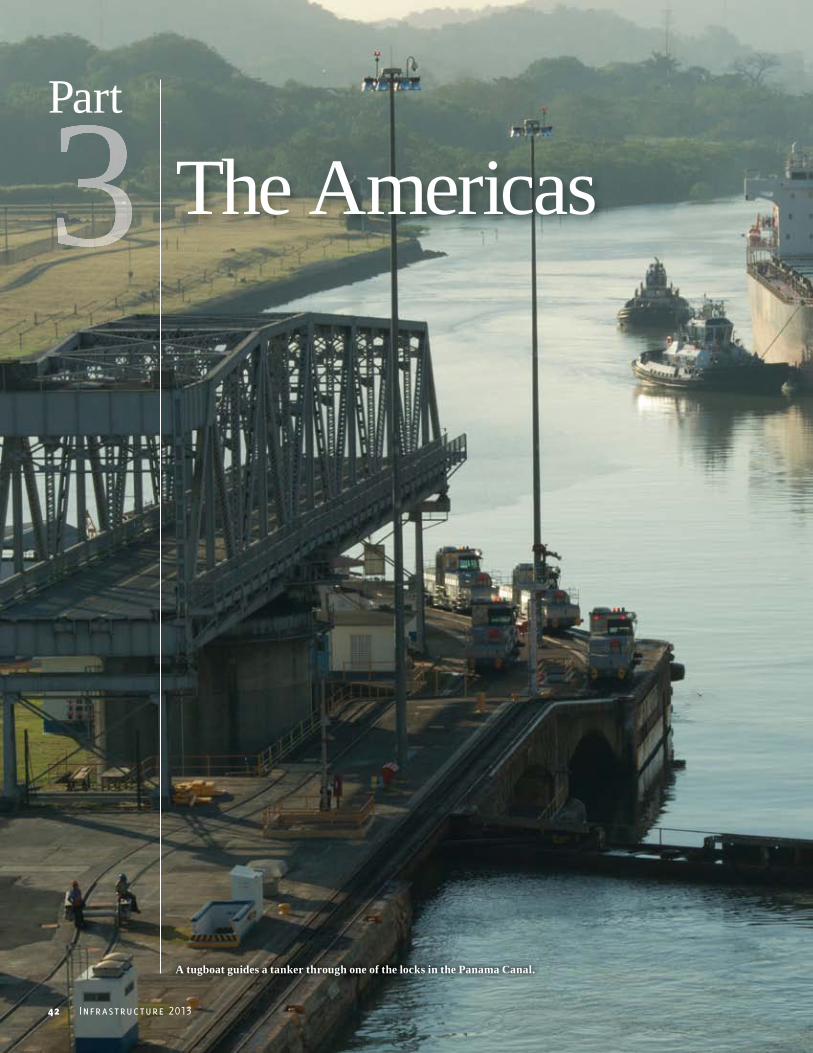
A tugboat guides a tanker through one of the locks in the Panama Canal.
42 Infrastructure 2013
Part
The Americas3
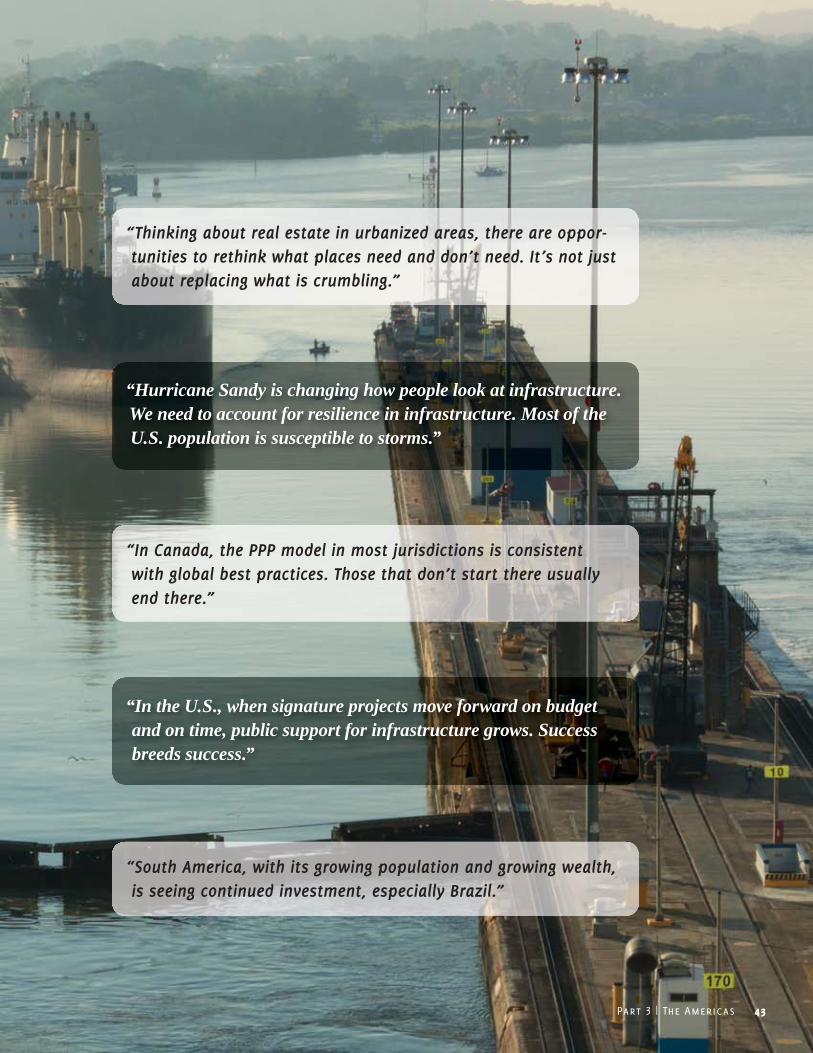
Part 3 | The Americas 43
“Thinking about real estate in urbanized areas, there are oppor-tunities to rethink what places need and don’t need. It’s not just about replacing what is crumbling.”
“South America, with its growing population and growing wealth, is seeing continued investment, especially Brazil.”
“In Canada, the PPP model in most jurisdictions is consistent with global best practices. Those that don’t start there usually end there.”
“Hurricane Sandy is changing how people look at infrastructure. We need to account for resilience in infrastructure. Most of the U.S. population is susceptible to storms.”
“In the U.S., when signature projects move forward on budget and on time, public support for infrastructure grows. Success breeds success.”
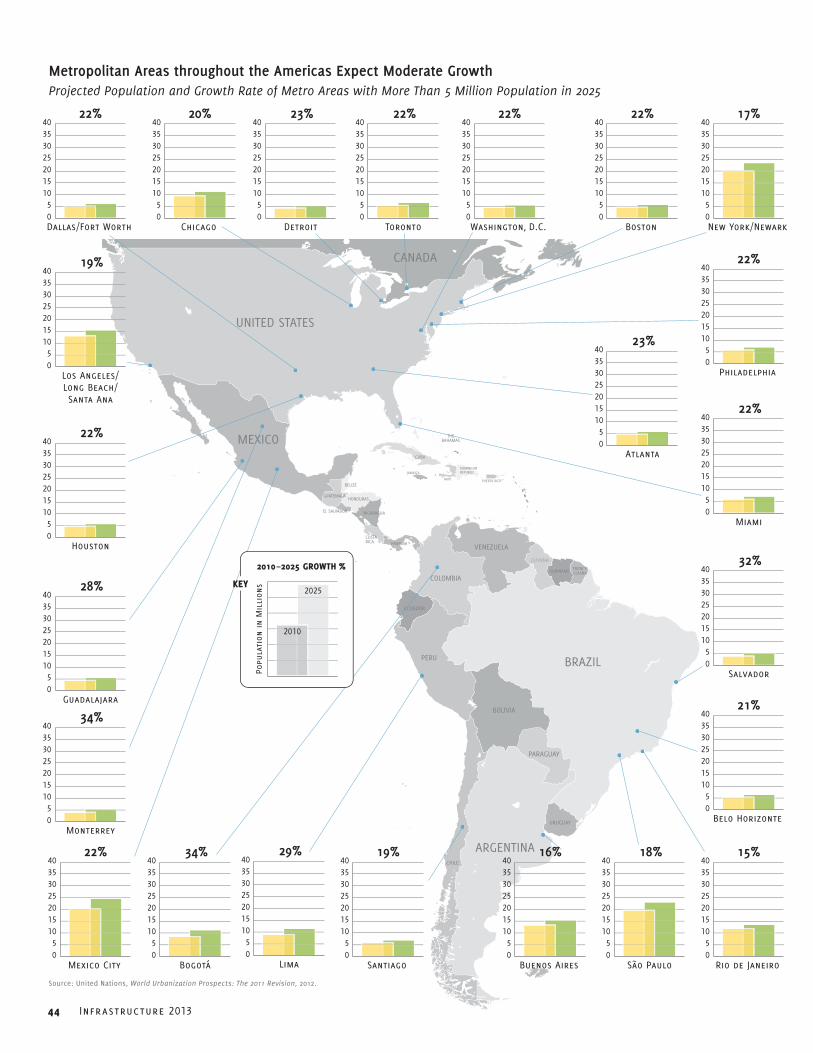
44 Infrastructure 2013
BRAZIL
BOLIVIA
PARAGUAY
URUGUAY
ECUADOR
CHILE
PERU
COLOMBIA
GUATEMALAHONDURAS
BELIZE
CUBA
THEBAHAMAS
JAMAICA
HAITI PUERTO RICO
DOMINICANREPUBLIC
GUYANA
SURINAME FRENCH GUIANA
EL SALVADOR NICARAGUA
PANAMACOSTARICA
VENEZUELA
UNITED STATES
CANADA
MEXICO
ARGENTINAMonterrey
05
10152025303540
34%
Bogotá05
10152025303540
34%
Salvador05
10152025303540
32%
Lima05
10152025303540
29%
Guadalajara05
10152025303540
28%
23%
Atlanta05
10152025303540
05
10152025303540
Detroit
23%
05
10152025303540
Houston
22%
05
10152025303540
Washington, D.C.
22%
05
10152025303540
Boston
22%
05
10152025303540
Dallas/Fort Worth
22%
05
10152025303540
22%
Mexico City
22%
Toronto05
10152025303540
22%
Miami05
10152025303540
22%
Philadelphia05
10152025303540
21%
Belo Horizonte05
10152025303540
20%
Chicago05
10152025303540
19%
Santiago05
10152025303540
05
10152025303540
19%
Los Angeles/Long Beach/Santa Ana
05
10152025303540
18%
São Paulo
05
10152025303540
17%
New York/Newark
05
10152025303540
16%
Buenos Aires05
10152025303540
15%
Rio de Janeiro
2025
2010
Popu
lati
on i
n M
illi
ons
2010 –2025 GROWTH %
KEY
Metropolitan Areas throughout the Americas Expect Moderate GrowthProjected Population and Growth Rate of Metro Areas with More Than 5 Million Population in 2025
Source: United Nations, World Urbanization Prospects: The 2011 Revision, 2012.
Part 3 | The Americas 45
from north to south, the Americas represent the full spectrum of national am-
bitions, struggles, strategies, and approaches for dealing with challenging and
expensive infrastructure requirements necessary to facilitate future economic
growth.
Canada is successfully deepening its use of
public/private partnerships to help finance and
build a range of transportation, water-sewage
treatment, and social infrastructure projects,
offering a body of experience that the United
States could adapt to its own financial, juris-
dictional, and political setting. Both Canada
and the United States need to retool aging road
networks and advance mass transit projects.
Mexico’s recent attention to connecting its
primary urban and industrial centers with new
expressways and expanding its ports is start-
ing to pay dividends in supporting a rapidly
enlarging manufacturing base. Brazil is seeking
to reignite heady economic expansion by mov-
ing forward with a much-anticipated Rio de
Janeiro–to–São Paulo high-speed rail project,
major intercity road building, airport modern-
izing, and power plant construction.
Whether rich, poor, emerging, or maturing,
all the region’s countries face funding short-
falls and a gap between what they can pay
and what they want or need to accomplish.
United StatesBudget constraints and a lack of consensus
regarding the federal role in key infrastructure
sectors “present an [ongoing] challenge” in try-
ing to plan for public investment. Some progress
came with the passing of a federal transporta-
tion reauthorization bill, but the legislation’s
two-year time horizon means that thinking
about the next one will need to start right away.
With federal infrastructure contributions
holding steady and with declines generally ex-
pected, especially as the sequester takes hold,
most state and local governments are moving
into a “a self-help” mode—they must rely more
heavily on alternative funding sources and
postpone some desired projects. “It’s hard to
scrape together new infrastructure money” at
a critical time when many systems are reach-
ing the end of their life cycles.
Infrastructure spending as a percentage
of GDP has shrunk to about 2.4 percent from
its peak of more than 3 percent during the
1960s. States and local governments account
for about 75 percent of all infrastructure spend-
ing, including capital and operations and main-
tenance, with the federal government contrib-
uting the remaining quarter of infrastructure
spending.
In 2012, Congress enacted new authoriz-
ing legislation for transportation. The new
bill, Moving Ahead for Progress in the 21st
Insights about the Americas from Infrastructure 2013 Interviewees In the united states, the funding picture is uncertain, and state, regional, and local governments are taking the lead.
As a two-year bill, new U.S. transportation legislation MAP-21 still doesn’t provide stable, long-term funding.
All revenue forecasts are more uncertain now. People are inherently more conservative.
We see strong state and local support in the U.S. for sales taxes dedicated to certain bundles of projects.
People are making hard decisions about where to prioritize invest-ment, and where NOT to rebuild.
Public/private partnerships in the united states remain chal-lenging, with approaches that vary across the country.
In the U.S., where the PPP model is developing in many jurisdic-tions, innovation will be required to adopt key principles of suc-cessful PPP projects into different procurement processes, legal frameworks, and regulatory and political environments. This will require sponsors to be more flexible in their approach.
In the U.S. market, most projects are carried out at the state and local levels. That means that the U.S. is really at least 50 countries, plus all of the cities and public authorities. Nonetheless, many of the states and localities have economies that are larger than [those of] most nations.
The risk to a business in the U.S. is trying to identify which of the many potential projects will be real and proceed, and ensuring that you pursue those projects, as opposed to wasting significant time and money pursuing projects that don’t materialize.
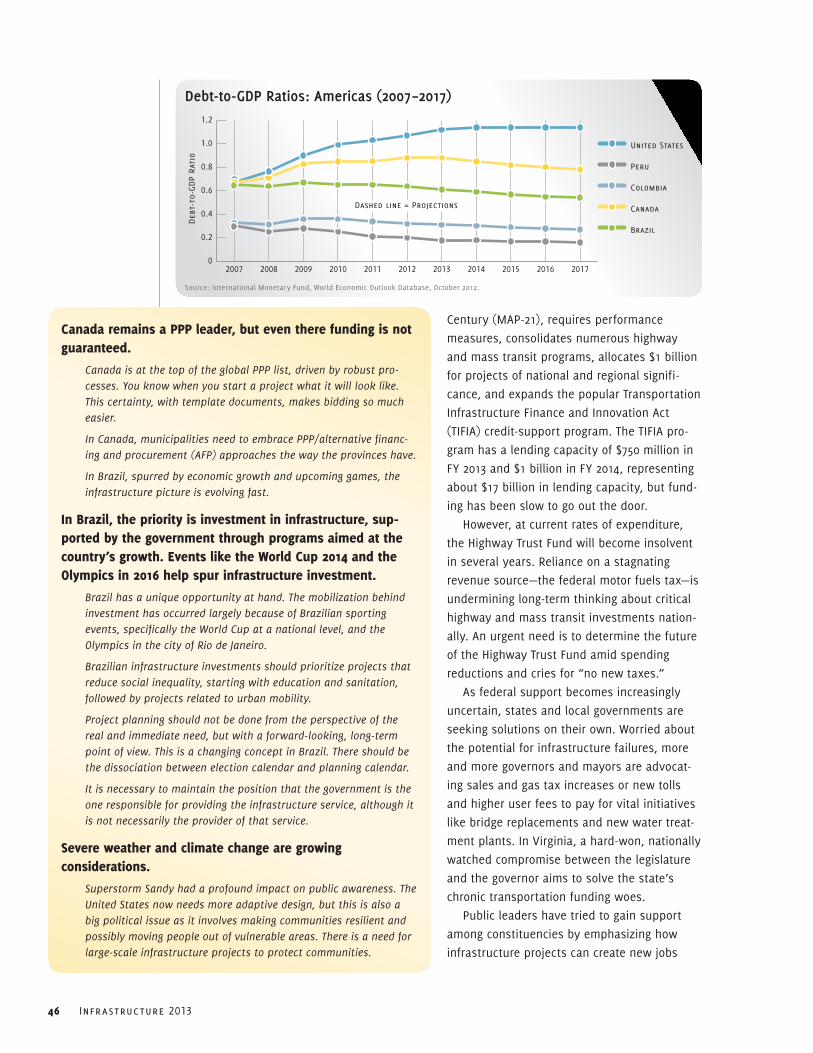
46 Infrastructure 2013
Century (MAP-21), requires performance
measures, consolidates numerous highway
and mass transit programs, allocates $1 billion
for projects of national and regional signifi-
cance, and expands the popular Transportation
Infrastructure Finance and Innovation Act
(TIFIA) credit-support program. The TIFIA pro-
gram has a lending capacity of $750 million in
FY 2013 and $1 billion in FY 2014, representing
about $17 billion in lending capacity, but fund-
ing has been slow to go out the door.
However, at current rates of expenditure,
the Highway Trust Fund will become insolvent
in several years. Reliance on a stagnating
revenue source—the federal motor fuels tax—is
undermining long-term thinking about critical
highway and mass transit investments nation-
ally. An urgent need is to determine the future
of the Highway Trust Fund amid spending
reductions and cries for “no new taxes.”
As federal support becomes increasingly
uncertain, states and local governments are
seeking solutions on their own. Worried about
the potential for infrastructure failures, more
and more governors and mayors are advocat-
ing sales and gas tax increases or new tolls
and higher user fees to pay for vital initiatives
like bridge replacements and new water treat-
ment plants. In Virginia, a hard-won, nationally
watched compromise between the legislature
and the governor aims to solve the state’s
chronic transportation funding woes.
Public leaders have tried to gain support
among constituencies by emphasizing how
infrastructure projects can create new jobs
canada remains a PPP leader, but even there funding is not guaranteed.
Canada is at the top of the global PPP list, driven by robust pro-cesses. You know when you start a project what it will look like. This certainty, with template documents, makes bidding so much easier.
In Canada, municipalities need to embrace PPP/alternative financ-ing and procurement (AFP) approaches the way the provinces have.
In Brazil, spurred by economic growth and upcoming games, the infrastructure picture is evolving fast.
In Brazil, the priority is investment in infrastructure, sup-ported by the government through programs aimed at the country’s growth. events like the World cup 2014 and the olympics in 2016 help spur infrastructure investment.
Brazil has a unique opportunity at hand. The mobilization behind investment has occurred largely because of Brazilian sporting events, specifically the World Cup at a national level, and the Olympics in the city of Rio de Janeiro.
Brazilian infrastructure investments should prioritize projects that reduce social inequality, starting with education and sanitation, followed by projects related to urban mobility.
Project planning should not be done from the perspective of the real and immediate need, but with a forward-looking, long-term point of view. This is a changing concept in Brazil. There should be the dissociation between election calendar and planning calendar.
It is necessary to maintain the position that the government is the one responsible for providing the infrastructure service, although it is not necessarily the provider of that service.
severe weather and climate change are growing considerations.
Superstorm Sandy had a profound impact on public awareness. The United States now needs more adaptive design, but this is also a big political issue as it involves making communities resilient and possibly moving people out of vulnerable areas. There is a need for large-scale infrastructure projects to protect communities.
Debt-to-GDP Ratios: Americas (2007–2017)
Deb
t-to
-GDP
Rati
o
0
0.2
0.4
0.6
0.8
1.0
1.2
United States
Peru
Colombia
Canada
Brazil
20172016201520142013201220112010200920082007
Dashed line = Projections
Source: International Monetary Fund, World Economic Outlook Database, October 2012.
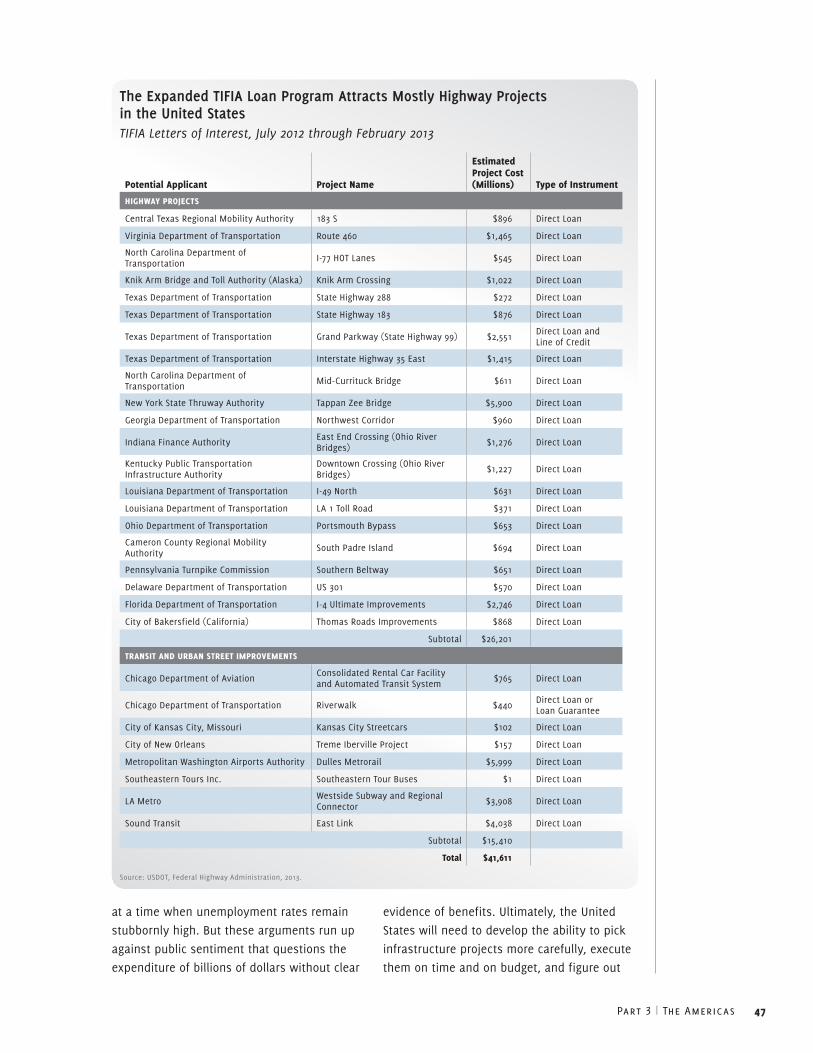
Part 3 | The Americas 47
at a time when unemployment rates remain
stubbornly high. But these arguments run up
against public sentiment that questions the
expenditure of billions of dollars without clear
evidence of benefits. Ultimately, the United
States will need to develop the ability to pick
infrastructure projects more carefully, execute
them on time and on budget, and figure out
The Expanded TIFIA Loan Program Attracts Mostly Highway Projects in the United StatesTIFIA Letters of Interest, July 2012 through February 2013
Potential Applicant Project name
estimated Project cost (Millions) type of Instrument
hIghWAY ProJects
Central Texas Regional Mobility Authority 183 S $896 Direct Loan
Virginia Department of Transportation Route 460 $1,465 Direct Loan
North Carolina Department of Transportation I-77 HOT Lanes $545 Direct Loan
Knik Arm Bridge and Toll Authority (Alaska) Knik Arm Crossing $1,022 Direct Loan
Texas Department of Transportation State Highway 288 $272 Direct Loan
Texas Department of Transportation State Highway 183 $876 Direct Loan
Texas Department of Transportation Grand Parkway (State Highway 99) $2,551 Direct Loan and Line of Credit
Texas Department of Transportation Interstate Highway 35 East $1,415 Direct Loan
North Carolina Department of Transportation Mid-Currituck Bridge $611 Direct Loan
New York State Thruway Authority Tappan Zee Bridge $5,900 Direct Loan
Georgia Department of Transportation Northwest Corridor $960 Direct Loan
Indiana Finance Authority East End Crossing (Ohio River Bridges) $1,276 Direct Loan
Kentucky Public Transportation Infrastructure Authority
Downtown Crossing (Ohio River Bridges) $1,227 Direct Loan
Louisiana Department of Transportation I-49 North $631 Direct Loan
Louisiana Department of Transportation LA 1 Toll Road $371 Direct Loan
Ohio Department of Transportation Portsmouth Bypass $653 Direct Loan
Cameron County Regional Mobility Authority South Padre Island $694 Direct Loan
Pennsylvania Turnpike Commission Southern Beltway $651 Direct Loan
Delaware Department of Transportation US 301 $570 Direct Loan
Florida Department of Transportation I-4 Ultimate Improvements $2,746 Direct Loan
City of Bakersfield (California) Thomas Roads Improvements $868 Direct Loan
Subtotal $26,201
trAnsIt And urBAn street IMProveMents
Chicago Department of AviationConsolidated Rental Car Facility and Automated Transit System $765 Direct Loan
Chicago Department of Transportation Riverwalk $440 Direct Loan or Loan Guarantee
City of Kansas City, Missouri Kansas City Streetcars $102 Direct Loan
City of New Orleans Treme Iberville Project $157 Direct Loan
Metropolitan Washington Airports Authority Dulles Metrorail $5,999 Direct Loan
Southeastern Tours Inc. Southeastern Tour Buses $1 Direct Loan
LA Metro Westside Subway and Regional Connector $3,908 Direct Loan
Sound Transit East Link $4,038 Direct Loan
Subtotal $15,410
total $41,611
Source: USDOT, Federal Highway Administration, 2013.
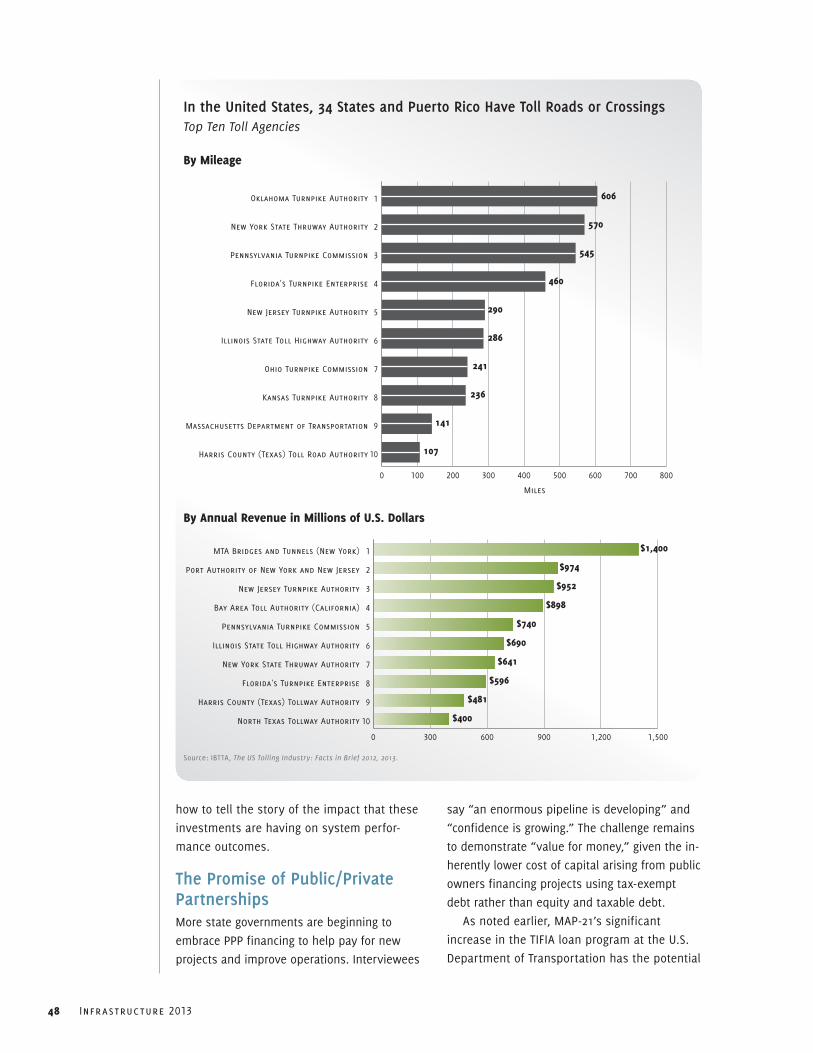
48 Infrastructure 2013
how to tell the story of the impact that these
investments are having on system perfor-
mance outcomes.
The Promise of Public/Private Partnerships More state governments are beginning to
embrace PPP financing to help pay for new
projects and improve operations. Interviewees
say “an enormous pipeline is developing” and
“confidence is growing.” The challenge remains
to demonstrate “value for money,” given the in-
herently lower cost of capital arising from public
owners financing projects using tax-exempt
debt rather than equity and taxable debt.
As noted earlier, MAP-21’s significant
increase in the TIFIA loan program at the U.S.
Department of Transportation has the potential
In the United States, 34 States and Puerto Rico Have Toll Roads or CrossingsTop Ten Toll Agencies
By Mileage
Miles
0 100 200 300 400 500 600 700 800
Harris County (Texas) Toll Road Authority
Massachusetts Department of Transportation
Kansas Turnpike Authority
Ohio Turnpike Commission
Illinois State Toll Highway Authority
New Jersey Turnpike Authority
Florida's Turnpike Enterprise
Pennsylvania Turnpike Commission
New York State Thruway Authority
Oklahoma Turnpike Authority 1
2
3
4
5
6
7
8
9
10
606
570
545
460
290
286
241
236
141
107
By Annual revenue in Millions of u.s. dollars
1
2
3
4
5
6
7
8
9
10
0 300 600 900 1,200 1,500
North Texas Tollway Authority
Harris County (Texas) Tollway Authority
Florida's Turnpike Enterprise
New York State Thruway Authority
Illinois State Toll Highway Authority
Pennsylvania Turnpike Commission
Bay Area Toll Authority (California)
New Jersey Turnpike Authority
Port Authority of New York and New Jersey
MTA Bridges and Tunnels (New York) $1,400
$974
$952
$898
$740
$690
$641
$596
$481
$400
Source: IBTTA, The US Tolling Industry: Facts in Brief 2012, 2013.
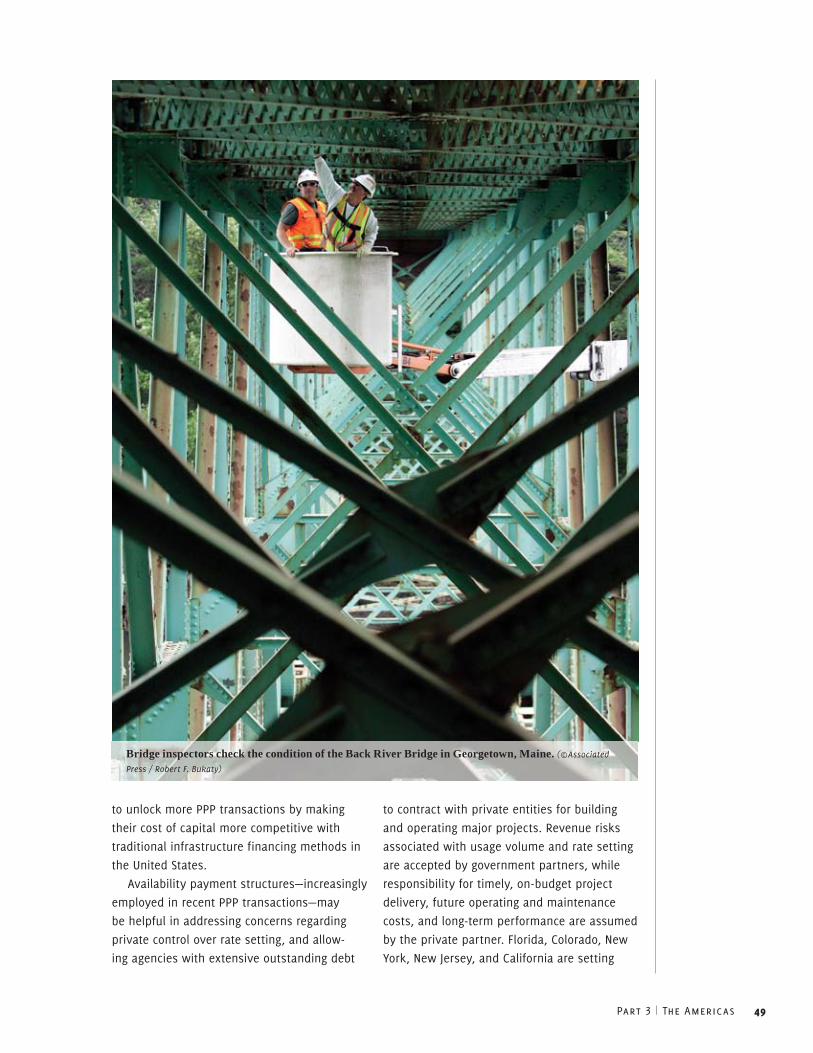
Part 3 | The Americas 49
to unlock more PPP transactions by making
their cost of capital more competitive with
traditional infrastructure financing methods in
the United States.
Availability payment structures—increasingly
employed in recent PPP transactions—may
be helpful in addressing concerns regarding
private control over rate setting, and allow-
ing agencies with extensive outstanding debt
to contract with private entities for building
and operating major projects. Revenue risks
associated with usage volume and rate setting
are accepted by government partners, while
responsibility for timely, on-budget project
delivery, future operating and maintenance
costs, and long-term performance are assumed
by the private partner. Florida, Colorado, New
York, New Jersey, and California are setting
Bridge inspectors check the condition of the Back River Bridge in Georgetown, Maine. (©Associated
Press / Robert F. Bukaty)
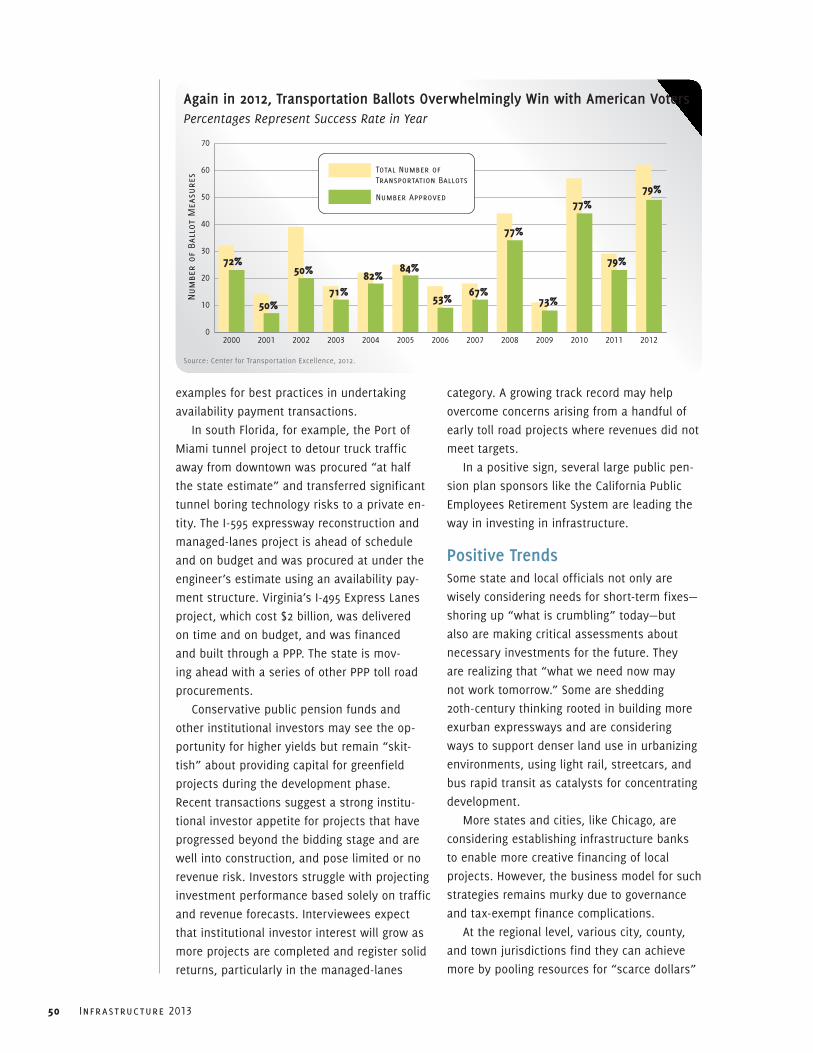
50 Infrastructure 2013
examples for best practices in undertaking
availability payment transactions.
In south Florida, for example, the Port of
Miami tunnel project to detour truck traffic
away from downtown was procured “at half
the state estimate” and transferred significant
tunnel boring technology risks to a private en-
tity. The I-595 expressway reconstruction and
managed-lanes project is ahead of schedule
and on budget and was procured at under the
engineer’s estimate using an availability pay-
ment structure. Virginia’s I-495 Express Lanes
project, which cost $2 billion, was delivered
on time and on budget, and was financed
and built through a PPP. The state is mov-
ing ahead with a series of other PPP toll road
procurements.
Conservative public pension funds and
other institutional investors may see the op-
portunity for higher yields but remain “skit-
tish” about providing capital for greenfield
projects during the development phase.
Recent transactions suggest a strong institu-
tional investor appetite for projects that have
progressed beyond the bidding stage and are
well into construction, and pose limited or no
revenue risk. Investors struggle with projecting
investment performance based solely on traffic
and revenue forecasts. Interviewees expect
that institutional investor interest will grow as
more projects are completed and register solid
returns, particularly in the managed-lanes
category. A growing track record may help
overcome concerns arising from a handful of
early toll road projects where revenues did not
meet targets.
In a positive sign, several large public pen-
sion plan sponsors like the California Public
Employees Retirement System are leading the
way in investing in infrastructure.
Positive TrendsSome state and local officials not only are
wisely considering needs for short-term fixes—
shoring up “what is crumbling” today—but
also are making critical assessments about
necessary investments for the future. They
are realizing that “what we need now may
not work tomorrow.” Some are shedding
20th-century thinking rooted in building more
exurban expressways and are considering
ways to support denser land use in urbanizing
environments, using light rail, streetcars, and
bus rapid transit as catalysts for concentrating
development.
More states and cities, like Chicago, are
considering establishing infrastructure banks
to enable more creative financing of local
projects. However, the business model for such
strategies remains murky due to governance
and tax-exempt finance complications.
At the regional level, various city, county,
and town jurisdictions find they can achieve
more by pooling resources for “scarce dollars”
Again in 2012, Transportation Ballots Overwhelmingly Win with American VotersPercentages Represent Success Rate in Year
0
10
20
30
40
50
60
70
Number Approved
Total Number ofTransportation Ballots
2012201120102009200820072006200520042003200220012000
Num
ber
of B
allo
t M
easu
res
72%
50%
50%
71%82%
84%
53%67%
77%
73%
77%
79%
79%
Source: Center for Transportation Excellence, 2012.
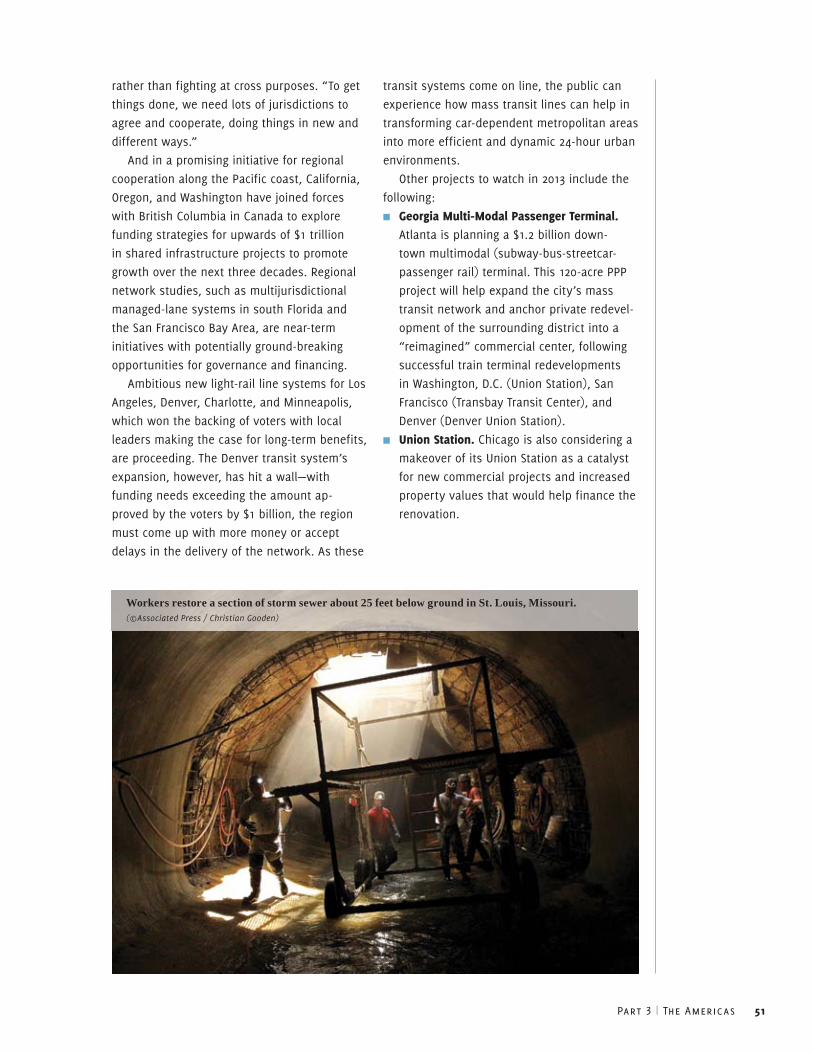
Part 3 | The Americas 51
rather than fighting at cross purposes. “To get
things done, we need lots of jurisdictions to
agree and cooperate, doing things in new and
different ways.”
And in a promising initiative for regional
cooperation along the Pacific coast, California,
Oregon, and Washington have joined forces
with British Columbia in Canada to explore
funding strategies for upwards of $1 trillion
in shared infrastructure projects to promote
growth over the next three decades. Regional
network studies, such as multijurisdictional
managed-lane systems in south Florida and
the San Francisco Bay Area, are near-term
initiatives with potentially ground-breaking
opportunities for governance and financing.
Ambitious new light-rail line systems for Los
Angeles, Denver, Charlotte, and Minneapolis,
which won the backing of voters with local
leaders making the case for long-term benefits,
are proceeding. The Denver transit system’s
expansion, however, has hit a wall—with
funding needs exceeding the amount ap-
proved by the voters by $1 billion, the region
must come up with more money or accept
delays in the delivery of the network. As these
transit systems come on line, the public can
experience how mass transit lines can help in
transforming car-dependent metropolitan areas
into more efficient and dynamic 24-hour urban
environments.
Other projects to watch in 2013 include the
following:
■■ georgia Multi-Modal Passenger terminal. Atlanta is planning a $1.2 billion down-
town multimodal (subway-bus-streetcar-
passenger rail) terminal. This 120-acre PPP
project will help expand the city’s mass
transit network and anchor private redevel-
opment of the surrounding district into a
“reimagined” commercial center, following
successful train terminal redevelopments
in Washington, D.C. (Union Station), San
Francisco (Transbay Transit Center), and
Denver (Denver Union Station).
■■ union station. Chicago is also considering a
makeover of its Union Station as a catalyst
for new commercial projects and increased
property values that would help finance the
renovation.
Workers restore a section of storm sewer about 25 feet below ground in St. Louis, Missouri. (©Associated Press / Christian Gooden)
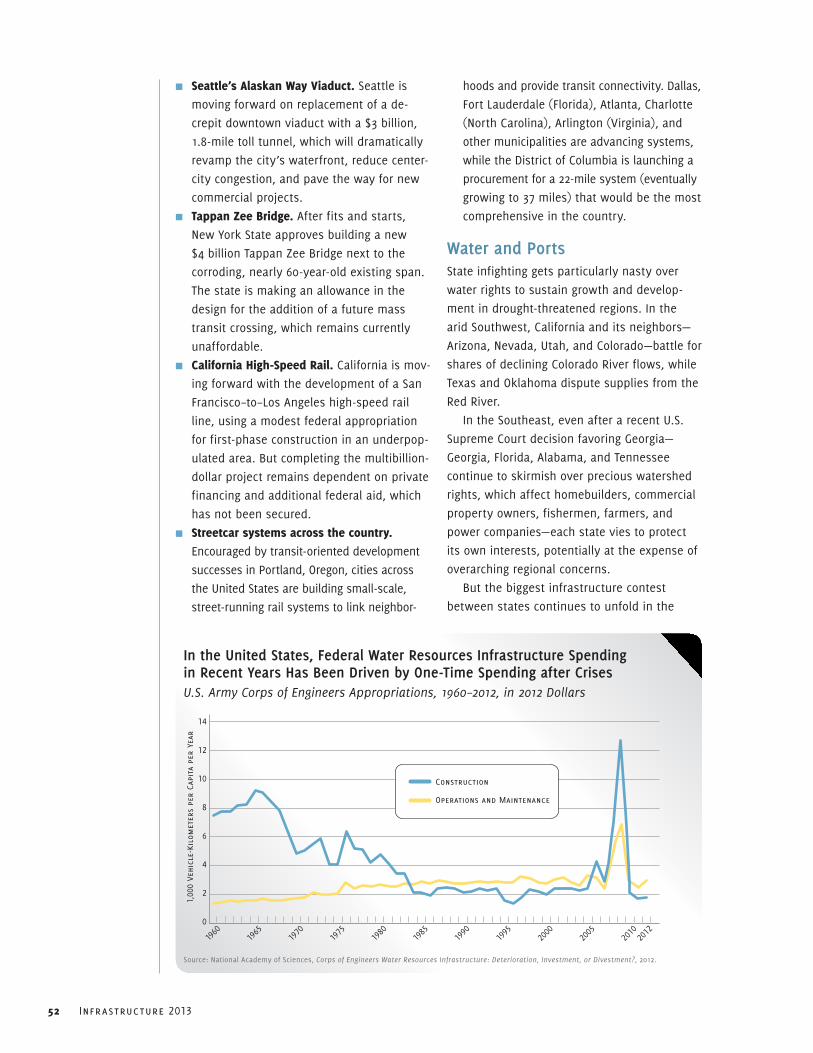
52 Infrastructure 2013
■■ seattle’s Alaskan Way viaduct. Seattle is
moving forward on replacement of a de-
crepit downtown viaduct with a $3 billion,
1.8-mile toll tunnel, which will dramatically
revamp the city’s waterfront, reduce center-
city congestion, and pave the way for new
commercial projects.
■■ tappan Zee Bridge. After fits and starts,
New York State approves building a new
$4 billion Tappan Zee Bridge next to the
corroding, nearly 60-year-old existing span.
The state is making an allowance in the
design for the addition of a future mass
transit crossing, which remains currently
unaffordable.
■■ california high-speed rail. California is mov-
ing forward with the development of a San
Francisco–to–Los Angeles high-speed rail
line, using a modest federal appropriation
for first-phase construction in an underpop-
ulated area. But completing the multibillion-
dollar project remains dependent on private
financing and additional federal aid, which
has not been secured.
■■ streetcar systems across the country. Encouraged by transit-oriented development
successes in Portland, Oregon, cities across
the United States are building small-scale,
street-running rail systems to link neighbor-
hoods and provide transit connectivity. Dallas,
Fort Lauderdale (Florida), Atlanta, Charlotte
(North Carolina), Arlington (Virginia), and
other municipalities are advancing systems,
while the District of Columbia is launching a
procurement for a 22-mile system (eventually
growing to 37 miles) that would be the most
comprehensive in the country.
Water and PortsState infighting gets particularly nasty over
water rights to sustain growth and develop-
ment in drought-threatened regions. In the
arid Southwest, California and its neighbors—
Arizona, Nevada, Utah, and Colorado—battle for
shares of declining Colorado River flows, while
Texas and Oklahoma dispute supplies from the
Red River.
In the Southeast, even after a recent U.S.
Supreme Court decision favoring Georgia—
Georgia, Florida, Alabama, and Tennessee
continue to skirmish over precious watershed
rights, which affect homebuilders, commercial
property owners, fishermen, farmers, and
power companies—each state vies to protect
its own interests, potentially at the expense of
overarching regional concerns.
But the biggest infrastructure contest
between states continues to unfold in the
In the United States, Federal Water Resources Infrastructure Spending in Recent Years Has Been Driven by One-Time Spending after CrisesU.S. Army Corps of Engineers Appropriations, 1960–2012, in 2012 Dollars
1960
1965
1970
1975
1980
1985
1990
1995
2000
2005
2012
2010
14
12
10
8
6
4
2
0
1,00
0 Ve
hicl
e-Ki
lom
eter
s pe
r Ca
pita
per
Yea
r
Construction
Operations and Maintenance
Source: National Academy of Sciences, Corps of Engineers Water Resources Infrastructure: Deterioration, Investment, or Divestment?, 2012.
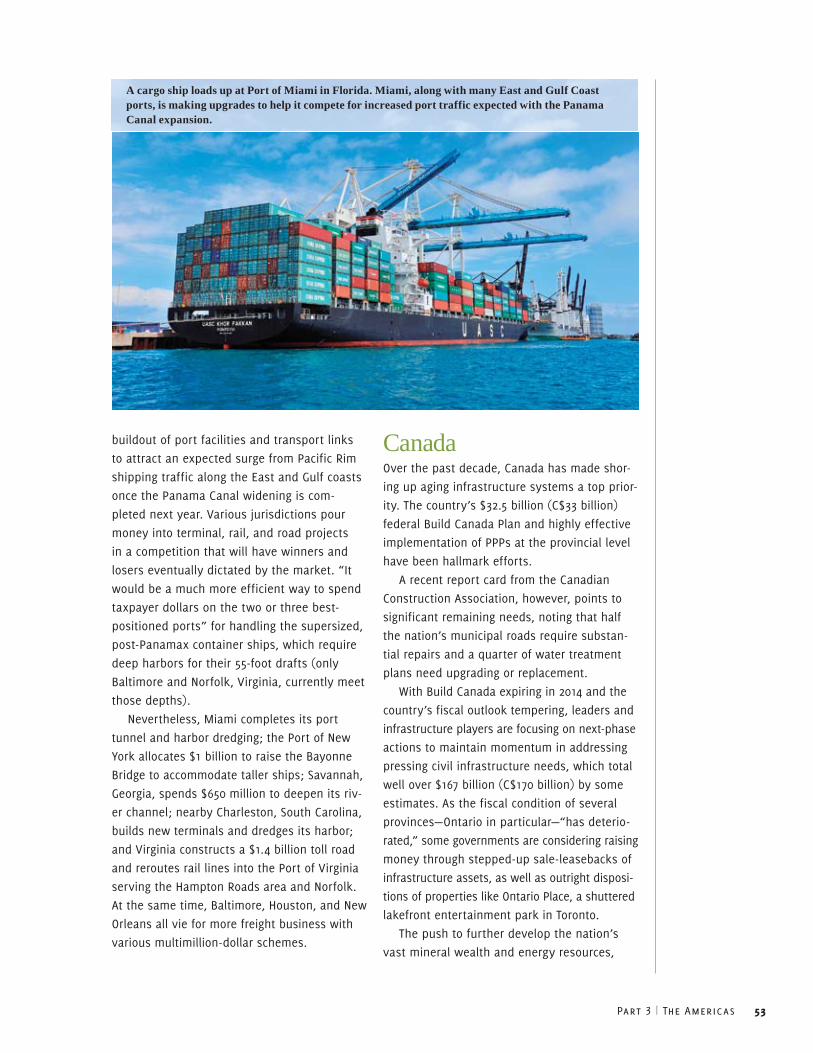
Part 3 | The Americas 53
buildout of port facilities and transport links
to attract an expected surge from Pacific Rim
shipping traffic along the East and Gulf coasts
once the Panama Canal widening is com-
pleted next year. Various jurisdictions pour
money into terminal, rail, and road projects
in a competition that will have winners and
losers eventually dictated by the market. “It
would be a much more efficient way to spend
taxpayer dollars on the two or three best-
positioned ports” for handling the supersized,
post-Panamax container ships, which require
deep harbors for their 55-foot drafts (only
Baltimore and Norfolk, Virginia, currently meet
those depths).
Nevertheless, Miami completes its port
tunnel and harbor dredging; the Port of New
York allocates $1 billion to raise the Bayonne
Bridge to accommodate taller ships; Savannah,
Georgia, spends $650 million to deepen its riv-
er channel; nearby Charleston, South Carolina,
builds new terminals and dredges its harbor;
and Virginia constructs a $1.4 billion toll road
and reroutes rail lines into the Port of Virginia
serving the Hampton Roads area and Norfolk.
At the same time, Baltimore, Houston, and New
Orleans all vie for more freight business with
various multimillion-dollar schemes.
CanadaOver the past decade, Canada has made shor-
ing up aging infrastructure systems a top prior-
ity. The country’s $32.5 billion (C$33 billion)
federal Build Canada Plan and highly effective
implementation of PPPs at the provincial level
have been hallmark efforts.
A recent report card from the Canadian
Construction Association, however, points to
significant remaining needs, noting that half
the nation’s municipal roads require substan-
tial repairs and a quarter of water treatment
plans need upgrading or replacement.
With Build Canada expiring in 2014 and the
country’s fiscal outlook tempering, leaders and
infrastructure players are focusing on next-phase
actions to maintain momentum in addressing
pressing civil infrastructure needs, which total
well over $167 billion (C$170 billion) by some
estimates. As the fiscal condition of several
provinces—Ontario in particular—“has deterio-
rated,” some governments are considering raising
money through stepped-up sale-leasebacks of
infrastructure assets, as well as outright disposi-
tions of properties like Ontario Place, a shuttered
lakefront entertainment park in Toronto.
The push to further develop the nation’s
vast mineral wealth and energy resources,
A cargo ship loads up at Port of Miami in Florida. Miami, along with many East and Gulf Coast ports, is making upgrades to help it compete for increased port traffic expected with the Panama Canal expansion.
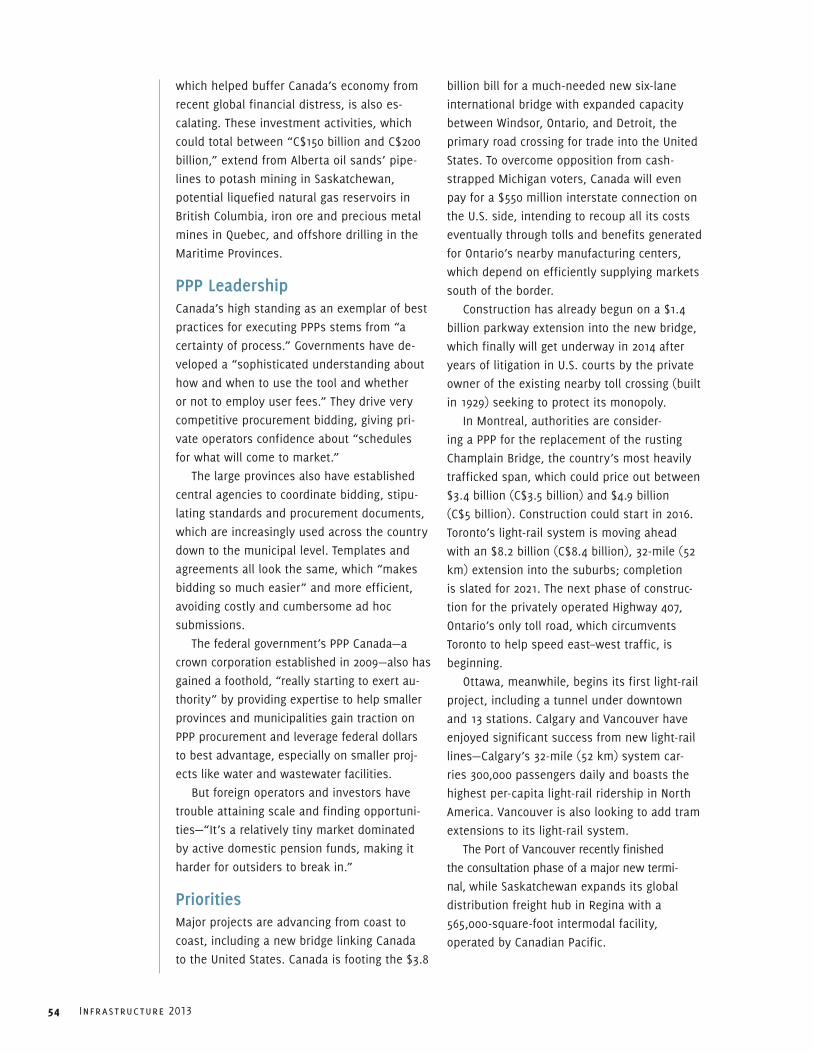
54 Infrastructure 2013
which helped buffer Canada’s economy from
recent global financial distress, is also es-
calating. These investment activities, which
could total between “C$150 billion and C$200
billion,” extend from Alberta oil sands’ pipe-
lines to potash mining in Saskatchewan,
potential liquefied natural gas reservoirs in
British Columbia, iron ore and precious metal
mines in Quebec, and offshore drilling in the
Maritime Provinces.
PPP LeadershipCanada’s high standing as an exemplar of best
practices for executing PPPs stems from “a
certainty of process.” Governments have de-
veloped a “sophisticated understanding about
how and when to use the tool and whether
or not to employ user fees.” They drive very
competitive procurement bidding, giving pri-
vate operators confidence about “schedules
for what will come to market.”
The large provinces also have established
central agencies to coordinate bidding, stipu-
lating standards and procurement documents,
which are increasingly used across the country
down to the municipal level. Templates and
agreements all look the same, which “makes
bidding so much easier” and more efficient,
avoiding costly and cumbersome ad hoc
submissions.
The federal government’s PPP Canada—a
crown corporation established in 2009—also has
gained a foothold, “really starting to exert au-
thority” by providing expertise to help smaller
provinces and municipalities gain traction on
PPP procurement and leverage federal dollars
to best advantage, especially on smaller proj-
ects like water and wastewater facilities.
But foreign operators and investors have
trouble attaining scale and finding opportuni-
ties—“It’s a relatively tiny market dominated
by active domestic pension funds, making it
harder for outsiders to break in.”
PrioritiesMajor projects are advancing from coast to
coast, including a new bridge linking Canada
to the United States. Canada is footing the $3.8
billion bill for a much-needed new six-lane
international bridge with expanded capacity
between Windsor, Ontario, and Detroit, the
primary road crossing for trade into the United
States. To overcome opposition from cash-
strapped Michigan voters, Canada will even
pay for a $550 million interstate connection on
the U.S. side, intending to recoup all its costs
eventually through tolls and benefits generated
for Ontario’s nearby manufacturing centers,
which depend on efficiently supplying markets
south of the border.
Construction has already begun on a $1.4
billion parkway extension into the new bridge,
which finally will get underway in 2014 after
years of litigation in U.S. courts by the private
owner of the existing nearby toll crossing (built
in 1929) seeking to protect its monopoly.
In Montreal, authorities are consider-
ing a PPP for the replacement of the rusting
Champlain Bridge, the country’s most heavily
trafficked span, which could price out between
$3.4 billion (C$3.5 billion) and $4.9 billion
(C$5 billion). Construction could start in 2016.
Toronto’s light-rail system is moving ahead
with an $8.2 billion (C$8.4 billion), 32-mile (52
km) extension into the suburbs; completion
is slated for 2021. The next phase of construc-
tion for the privately operated Highway 407,
Ontario’s only toll road, which circumvents
Toronto to help speed east–west traffic, is
beginning.
Ottawa, meanwhile, begins its first light-rail
project, including a tunnel under downtown
and 13 stations. Calgary and Vancouver have
enjoyed significant success from new light-rail
lines—Calgary’s 32-mile (52 km) system car-
ries 300,000 passengers daily and boasts the
highest per-capita light-rail ridership in North
America. Vancouver is also looking to add tram
extensions to its light-rail system.
The Port of Vancouver recently finished
the consultation phase of a major new termi-
nal, while Saskatchewan expands its global
distribution freight hub in Regina with a
565,000-square-foot intermodal facility,
operated by Canadian Pacific.
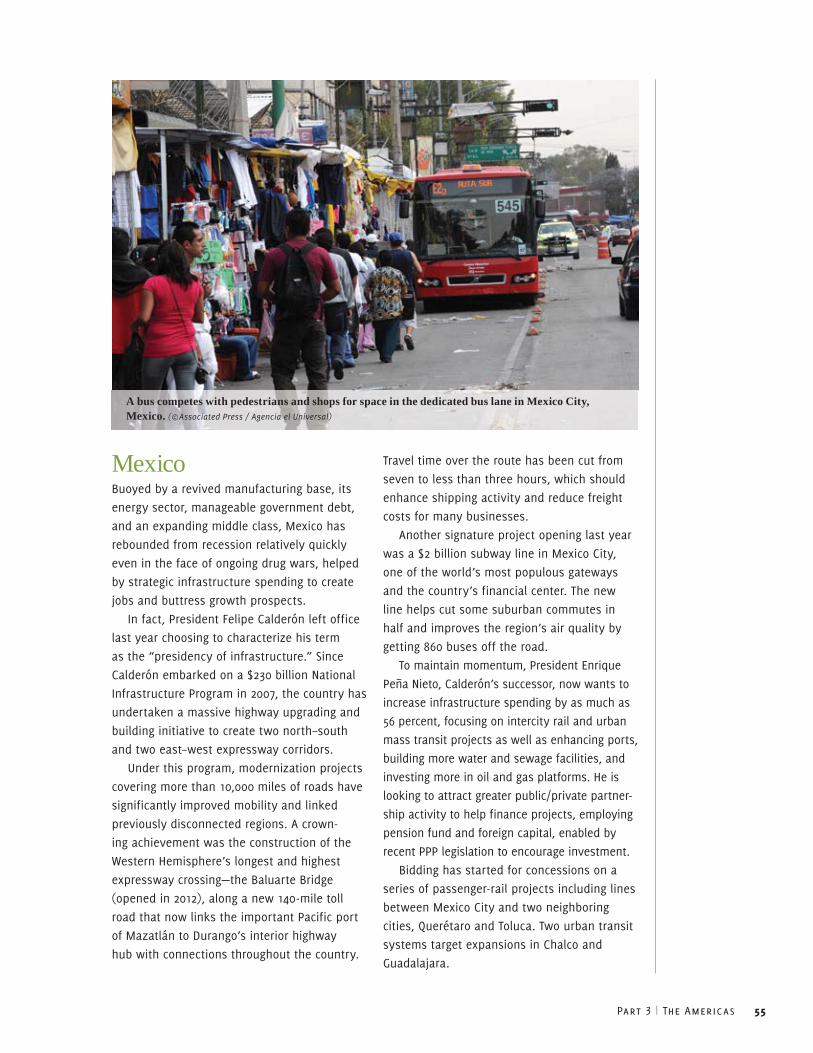
Part 3 | The Americas 55
MexicoBuoyed by a revived manufacturing base, its
energy sector, manageable government debt,
and an expanding middle class, Mexico has
rebounded from recession relatively quickly
even in the face of ongoing drug wars, helped
by strategic infrastructure spending to create
jobs and buttress growth prospects.
In fact, President Felipe Calderón left office
last year choosing to characterize his term
as the “presidency of infrastructure.” Since
Calderón embarked on a $230 billion National
Infrastructure Program in 2007, the country has
undertaken a massive highway upgrading and
building initiative to create two north–south
and two east–west expressway corridors.
Under this program, modernization projects
covering more than 10,000 miles of roads have
significantly improved mobility and linked
previously disconnected regions. A crown-
ing achievement was the construction of the
Western Hemisphere’s longest and highest
expressway crossing—the Baluarte Bridge
(opened in 2012), along a new 140-mile toll
road that now links the important Pacific port
of Mazatlán to Durango’s interior highway
hub with connections throughout the country.
Travel time over the route has been cut from
seven to less than three hours, which should
enhance shipping activity and reduce freight
costs for many businesses.
Another signature project opening last year
was a $2 billion subway line in Mexico City,
one of the world’s most populous gateways
and the country’s financial center. The new
line helps cut some suburban commutes in
half and improves the region’s air quality by
getting 860 buses off the road.
To maintain momentum, President Enrique
Peña Nieto, Calderón’s successor, now wants to
increase infrastructure spending by as much as
56 percent, focusing on intercity rail and urban
mass transit projects as well as enhancing ports,
building more water and sewage facilities, and
investing more in oil and gas platforms. He is
looking to attract greater public/private partner-
ship activity to help finance projects, employing
pension fund and foreign capital, enabled by
recent PPP legislation to encourage investment.
Bidding has started for concessions on a
series of passenger-rail projects including lines
between Mexico City and two neighboring
cities, Querétaro and Toluca. Two urban transit
systems target expansions in Chalco and
Guadalajara.
A bus competes with pedestrians and shops for space in the dedicated bus lane in Mexico City, Mexico. (©Associated Press / Agencia el Universal)
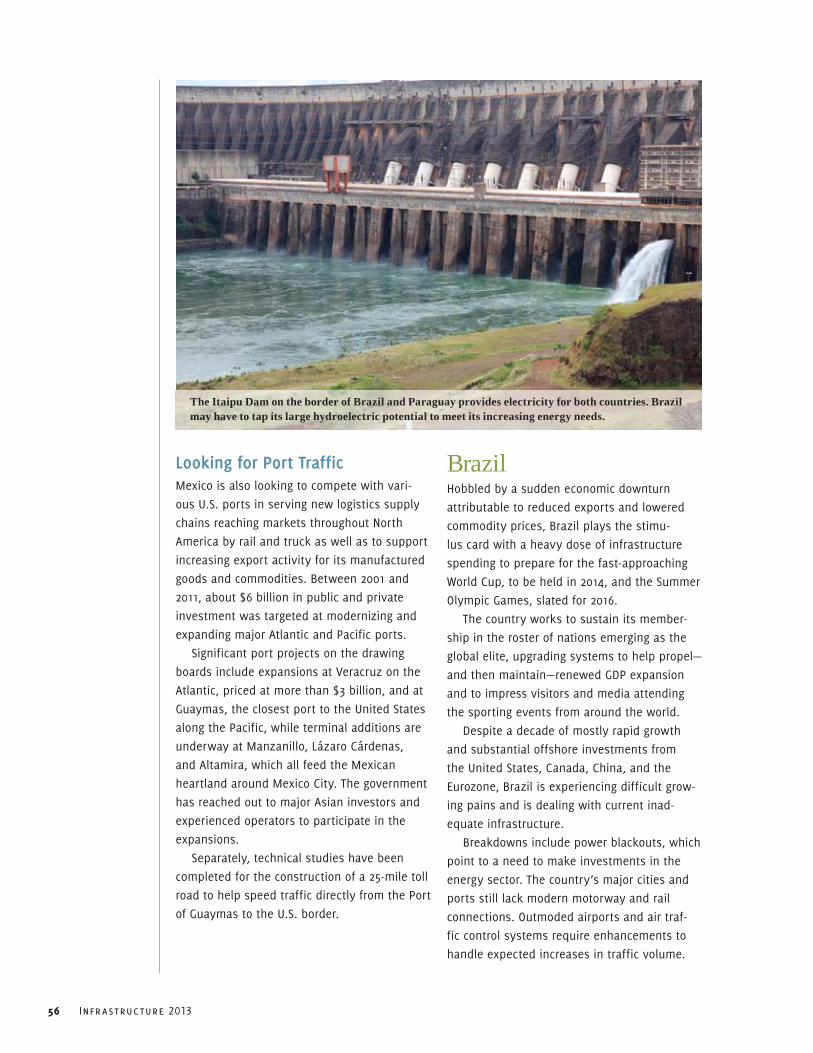
56 Infrastructure 2013
Looking for Port TrafficMexico is also looking to compete with vari-
ous U.S. ports in serving new logistics supply
chains reaching markets throughout North
America by rail and truck as well as to support
increasing export activity for its manufactured
goods and commodities. Between 2001 and
2011, about $6 billion in public and private
investment was targeted at modernizing and
expanding major Atlantic and Pacific ports.
Significant port projects on the drawing
boards include expansions at Veracruz on the
Atlantic, priced at more than $3 billion, and at
Guaymas, the closest port to the United States
along the Pacific, while terminal additions are
underway at Manzanillo, Lázaro Cárdenas,
and Altamira, which all feed the Mexican
heartland around Mexico City. The government
has reached out to major Asian investors and
experienced operators to participate in the
expansions.
Separately, technical studies have been
completed for the construction of a 25-mile toll
road to help speed traffic directly from the Port
of Guaymas to the U.S. border.
BrazilHobbled by a sudden economic downturn
attributable to reduced exports and lowered
commodity prices, Brazil plays the stimu-
lus card with a heavy dose of infrastructure
spending to prepare for the fast-approaching
World Cup, to be held in 2014, and the Summer
Olympic Games, slated for 2016.
The country works to sustain its member-
ship in the roster of nations emerging as the
global elite, upgrading systems to help propel—
and then maintain—renewed GDP expansion
and to impress visitors and media attending
the sporting events from around the world.
Despite a decade of mostly rapid growth
and substantial offshore investments from
the United States, Canada, China, and the
Eurozone, Brazil is experiencing difficult grow-
ing pains and is dealing with current inad-
equate infrastructure.
Breakdowns include power blackouts, which
point to a need to make investments in the
energy sector. The country’s major cities and
ports still lack modern motorway and rail
connections. Outmoded airports and air traf-
fic control systems require enhancements to
handle expected increases in traffic volume.
The Itaipu Dam on the border of Brazil and Paraguay provides electricity for both countries. Brazil may have to tap its large hydroelectric potential to meet its increasing energy needs.

Part 3 | The Americas 57
To address these issues, the government
is pursuing an ambitious $66 billion plan to
double the nation’s highway and railway net-
works, supported by education initiatives to
train more homegrown engineers. Selling con-
cessions and offering tax breaks on PPPs could
help speed improvements—the airports in São
Paulo, Brasilia, and Campinas are being turned
over to private operators, and concessions are
planned for 6,000 miles of new railways and
4,600 miles of toll roads.
A $3.5 billion regional airport infrastructure
investment plan covers 270 airfields with a
goal of providing service for 96 percent of the
population living within 60 miles of a facility.
Another $26 billion targets alleviating bottle-
necks at 20 sea and river ports.
After some false starts, bids are expected
later in the year for the nation’s first high-
speed rail line, linking São Paulo, Rio de
Janeiro, and Campinas over a 300-mile route,
including 120 miles of bridge and tunnel con-
struction. The project could price out at $17 bil-
lion or more and would not be completed until
late in the decade under the most optimistic
scenarios.
Bureaucratic snafus, coupled with shoddy
construction and a lack of skilled labor, have
compromised some schedules and construc-
tion outcomes on recent projects. But a 105-
mile beltway around São Paulo is slated for
completion next year to help connect major
roads more directly to the airport and deal
with mounting traffic congestion. In 2014, Porto
Alegre should also open Phase I of its $1.1 bil-
lion metro rail. And around the country, 12 sta-
dium projects rush toward completion in time
for the World Cup as local governments clear
slums to make way for new roads and urban
rail lines to move fans between hotel districts
and sports/entertainment venues.
Meeting the energy needs of Brazil may
ultimately involve tapping “the world’s largest
hydroelectric potential” from its vast interior
river systems, including the Amazon. But dam-
ming waterways creates its own controversial
environmental consequences, and federal
officials are wrestling with sorting out regula-
tory complications for various small and large
power projects.
Passengers come and go in a metro station in Rio de Janeiro, Brazil. The country is spending heavily on upgrading infrastructure and urban transit in preparation for the World Cup in 2014 and the summer Olympics in 2016.
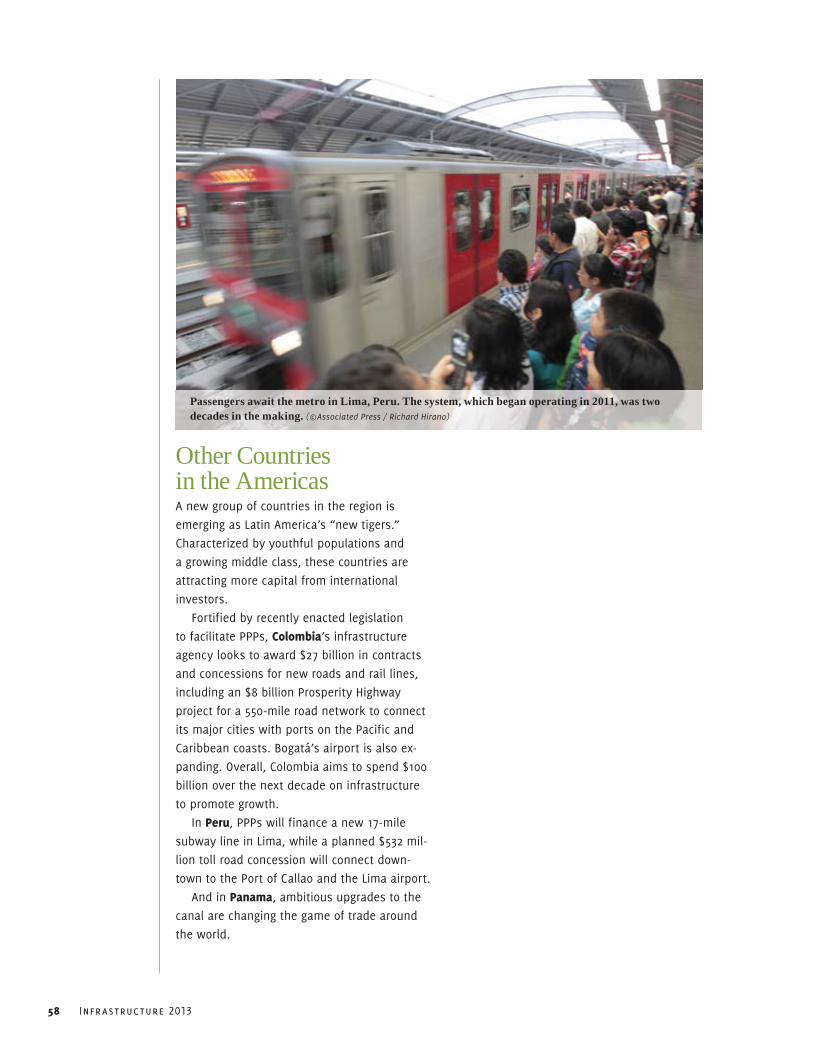
58 Infrastructure 2013
Other Countries in the AmericasA new group of countries in the region is
emerging as Latin America’s “new tigers.”
Characterized by youthful populations and
a growing middle class, these countries are
attracting more capital from international
investors.
Fortified by recently enacted legislation
to facilitate PPPs, colombia’s infrastructure
agency looks to award $27 billion in contracts
and concessions for new roads and rail lines,
including an $8 billion Prosperity Highway
project for a 550-mile road network to connect
its major cities with ports on the Pacific and
Caribbean coasts. Bogatá’s airport is also ex-
panding. Overall, Colombia aims to spend $100
billion over the next decade on infrastructure
to promote growth.
In Peru, PPPs will finance a new 17-mile
subway line in Lima, while a planned $532 mil-
lion toll road concession will connect down-
town to the Port of Callao and the Lima airport.
And in Panama, ambitious upgrades to the
canal are changing the game of trade around
the world.
Passengers await the metro in Lima, Peru. The system, which began operating in 2011, was two decades in the making. (©Associated Press / Richard Hirano)

59
60 Infrastructure 2013
currencYAll currency is in U.S. dollars, unless otherwise noted.
QuotesULI and Ernst & Young conducted interviews and dis-cussion groups with industry experts from around the world for this report. All unattributed quotes are from these conversations.
AcKnoWLedgMentsThe Urban Land Institute and Ernst & Young gratefully acknowledge the contributions of the interviewees and discussion group participants. The views, opinions, and recommendations expressed in this report do not necessarily reflect those of the interviewees, discus-sion group participants, or individual ULI members.
IntervIeWees And dIscussIon grouP PArtIcIPAnts Joe AielloChief Executive Officer, North AmericaMeridiam
Malcolm BairstowGlobal and EMEIA Infrastructure and Construction LeaderErnst & Young
Bill BanksGlobal Infrastructure Leader, Transactions Advisory and Government, and Asia-Pacific LeaderErnst & Young
Gabriella BazzanoConsulting Director ICF GHK
Ian BirchTransport Economist, Strategy and Policy DepartmentTransport for London
Rory Brennan Executive Director, Infrastructure InvestmentInfrastructure Australia
Jim CahillSenior Vice President, Transaction Finance and Transaction LegalInfrastructure Ontario
B.K. Chaturvedi MemberPlanning Commission of India
Sinclair CooperCo-President of Public-Private Ventures (PPV) Hunt Companies, Inc.
James CurtisManaging PartnerBristol Group
Chetan DaveManaging Partner and CEO of Real Estate Group (formerly)Infrastructure Development Finance Corporation (IDFC, India)
Jim DeFranciaPrincipalLowe Enterprises Community Development
Karl-Heinz DietrichInternational Airport Manager Frankfurt Airport
Robert DoveManaging Director, InfrastructureCarlyle Group
Paul DunstanPresidentPlenary Group
Gerhard L. Dunstheimer Managing Director for Development, Deputy Chief Executive OfficerECE
Derek FryerBoard Director Mott McDonald
Gerard H.W. Groener Chief Executive OfficerCorio
William (Bill) HanwayExecutive Vice PresidentAECOM
Stan HazelrothExecutive Director (retired)California Infrastructure and Economic Development Bank
Zhengpin Jin Assistant Vice PresidentChina Hydropower International Co., Ltd.
Simon KirbyManaging Director, Infrastructure ProjectsNetwork Rail
Nirmal KotechaDirector of Capital Programme and ProcurementU.K. Power Network
Uwe KruegerChief Executive OfficerAtkins
Jay LindgrenAttorney and Partner Dorsey & Whitney LLP
Richard LittleProfessor (retired)University of Southern California
James MaguireRegional Managing Director, AsiaAon Risk Solutions
Notes
61
Neil Martin Chief Operating Officer Lend Lease
Carlos Martinez García-LoygorriStructured Finance DirectorCyopsa
Jim MillerExecutive Director, Head of Infrastructure, Utilities, and Renewables (Australia and New Zealand)Macquarie Capital
Charles MottChief Executive OfficerBilfinger Berger Project Investments
João Martins NetoStructured Business DirectorAndrade Gutierrez Construction
Kai NieVice General ManagerChina Energy Engineering Group Co. Ltd.
Michael ParkerSenior Managing Director and U.S. Infrastructure Advisory Leader Ernst & Young Infrastructure Advisors, LLC
Stuart PatrickChief ExecutiveGlasgow Chamber of Commerce
Tim PhilpottsSenior Vice PresidentErnst & Young LLP Orenda Corporate Finance
Mark PisanoProfessorUniversity of Southern California
Alex RoseSenior Vice PresidentContinental Development Corporation
Borja Rubio de la RochaHead of ConcessionsIndra
Juan Ruiz de VelascoConcessions Division ManagerCopasa
Steve SmallVice President of Business Development, Canadian RegionFlatiron Corporation
G. SureshChief General Manager (Finance)National Highway Authority of India
Marilyn TaylorDean and Paley ProfessorUniversity of Pennsylvania
Richard ThomasVice President, Advocacy and External AffairsDesign-Build Institute of America
Jose ValenteHead of Research and StrategyJP Morgan
David WabosoDirector of Capital ProgrammesLondon Underground Ltd.
Carl WeisbrodClinical Professor and Academic Chair, Global Real EstateNew York University Schack Institute of Real Estate
Mark WeisdorfManaging Director and CEO, Infrastructure Investments GroupJP Morgan Asset Management
Peter WhittleGroup Strategy DirectorWates
David WinsteadAttorney at LawBallard Spahr
Ruth WoerenmaPresidentNeighborhood Capital Institute
62 Infrastructure 2013
The Urban Land Institute is a nonprofit research and education organization whose mission is to provide leadership in the responsible use of land and in creating and sustaining thriving communities worldwide.
The Institute maintains a membership representing a broad spectrum of interests and sponsors a wide variety of educational programs and forums to encourage an open exchange of ideas and sharing of experi-ence. ULI initiates research that anticipates emerging land use trends and issues and provides advisory services; and publishes a wide variety of materials to disseminate information on land use development.
Established in 1936, the Institute today has nearly 30,000 members and associates from some 92 countries, representing the entire spectrum of the land use and development disciplines. Professionals represented include developers, builders, property owners, investors, architects, public officials, planners, real estate brokers, appraisers, attorneys, engineers, financiers, academics, students, and librarians.
ULI relies heavily on the experience of its members. It is through member involvement and information resources that ULI has been able to set standards of excellence in development practice. The Institute is recognized internationally as one of America’s most respected and widely quoted sources of objective information on urban planning, growth, and development.
uLI senIor eXecutIvesPatrick PhillipsChief Executive Officer
Cheryl CumminsExecutive Officer
Michael TerseckChief Financial Officer/Chief Administrative Officer
Richard M. RosanPresident, ULI Foundation
Lela AgnewExecutive Vice President, Communications
Kathleen B. CareyExecutive Vice President/Chief Content Officer
David HowardExecutive Vice President, Development and ULI Foundation
Joe MontgomeryChief Executive, Europe
Marilee UtterExecutive Vice President, District Councils
John FitzgeraldSenior Vice President and Executive Director, Asia Pacific
urBAn LAnd InstItute1025 Thomas Jefferson Street, NWSuite 500 WestWashington, DC 20007-5201
Phone: 202-624-7000www.uli.org
Sponsoring Organizations
63
Ernst & Young is a global leader in assurance, tax, transaction, and advisory services. Worldwide, our 167,000 people are united by our shared values and an unwavering commitment to quality. We make a dif-ference by helping our people, our clients, and our wider communities achieve their potential.
Ernst & Young refers to the global organization of member firms of Ernst & Young Global Limited, each of which is a separate legal entity. Ernst & Young Global Limited, a U.K. company limited by guarantee, does not provide services to clients. For more information, please visit www.ey.com.
ABout the ernst & Young gLoBAL reAL estAte center Today’s real estate, infrastructure, and construction industries must adopt new approaches to address regulatory requirements and financial risks—while meeting the challenges of expanding globally and achieving sustainable growth.
The Ernst & Young Global Real Estate Center, which encompasses infrastructure and construction, brings together a worldwide team of professionals to help you achieve your potential—a team with deep technical experience in providing assurance, tax, transaction, and advisory services.
The Center works to anticipate market trends, identify the implications, and develop points of view on rel-evant industry issues. Ultimately, it enables us to help you meet your goals and compete more effectively. It’s how Ernst & Young makes a difference.
ernst & Young gLoBAL InfrAstructure contActs Howard Roth Global Real Estate LeaderUnited States 212 773 4910 [email protected]
Malcolm BairstowGlobal and EMEIA Infrastructure and Construction LeaderUnited Kingdom+44 20 7951 [email protected]
Rick SinkulerGlobal Real Estate Markets LeaderUnited States312 879 [email protected]
Michael ParkerSenior Managing Director and U.S. Infrastructure Advisory Leader United StatesErnst & Young Infrastructure Advisors, LLC215 448 3391 [email protected]
Bill BanksGlobal Infrastructure Leader, Transactions Advisory and Government, and Asia-Pacific Leader Australia+61 292 484 522 [email protected]
Ad BuismanEMEIA Real Estate LeaderThe Netherlands +31 88 407 [email protected]
Abraham AkkawiMiddle East InfrastructureUnited Arab Emirates+966 127 [email protected]
Kentaro NakamichiJapan Infrastructure Japan+81 3 4582 [email protected]
Tim PhilpottsSenior Vice PresidentCanadaErnst & Young LLP Orenda Corporate Finance+1 604 891 8255 [email protected]
Sponsoring Organizations


URBAN LAND INSTITUTE1025 Thomas Jefferson Street, NWSuite 500 WestWashington, DC 20007-5201
ISBN: 978-0-87420-264-9
Infrastructure 2013: Global Priorities, Global Insights is the
seventh in a series of global annual reports assessing the state
of infrastructure globally and connecting strong infrastructure
investment decisions to national and metropolitan prosperity.
Infrastructure 2013 includes:
■■ Up-to-date information on the latest infrastructure
investment trends, challenges, and innovations;
■■ Coverage of the Asia Pacific region, Europe/Middle East/
Africa, and the Americas;
■■ Informative charts and graphs;
■■ Highlights of transformative infrastructure investments from
around the world; and
■■ Quotes and other insights from the infrastructure field’s
leading experts and thinkers.
Produced by the Urban Land Institute and Ernst & Young,
Infrastructure 2013 pinpoints the trends, policies, and issues
shaping infrastructure in 2013 and beyond.
Based on interviews with infrastructure experts, up-to-date
research and analysis, and other sources, the report is full of
essential information and insights for any infrastructure or land
use professional.
I S B N 978-0-87420-264-9
9 7 8 0 8 7 4 2 0 2 6 4 9
5 0 9 9 5